Abstract
Marine glaciers play a significant role in shaping landforms due to their erosive nature coupled with their surrounding environment. During this process, they pose a natural hazard threat to man-made infrastructure. The dynamic nature of these glaciers poses a particular threat, especially to railway infrastructure constructed in remote areas with glacial activity. Substantial research has been undertaken on the role of threats posed by marine glaciers to railway infrastructure. However, a detailed study of favorable glacier landforms prior to railway construction has yet to be explored. In this study, we propose a geospatial analysis-based method to determine the favorable most landforms shaped by marine glaciers for railway network route selection. This study provides a novel approach by first analyzing the availability of four major favorable landforms shaped by marine glaciers (glacier canyons, valley shoulders, moraine terraces, and ancient dammed lake basins), then proposes a railway route selection method for marine glacier distribution areas involving three steps. First, it is necessary to understand the basic situation of regional glaciers; then, to determine a feasible location for the railway based on judgment of the direct and indirect action areas of glaciers; and finally, through a thematic study of glacial geomorphology, to devise corresponding strategies for using glacial landforms to optimize the railway route. In order to verify the feasibility of the proposed method, it was implemented in the Palong Zangbo watershed of the Sichuan–Tibet railway network. Utilizing the power function method, the glacier basin areas of 22 glacier canyons along the Sichuan–Tibet railway line were identified and the maximum annual average velocity of 75 glaciers over the past ten years was calculated by offset tracking technology. The results indicate that the proposed optimization strategies utilizing glacier canyons for a short and straight route scheme and leveraging moraine terraces for a high-line scheme can provide comprehensive guidance for railway route selection in marine glacial areas.
1. Introduction
1.1. Background
Based on their physical properties, glaciers can be divided into continental and marine glaciers [1]. Continental glaciers are the product of a continental climate with low temperature and low humidity, and are relatively stable. However, because most of these glaciers are distributed at extremely high altitudes, they are generally inaccessible to construction activities. On the other hand, marine-type glaciers are the product of an oceanic climate with high temperatures and high humidity. They are characterized by strong ablation, fast movement, and strong geomorphological and geological effects. The end of the ice tongue may reach approximately 3000 m, which is within the scope of human habitation and engineering activities. The boundary between marine and continental glaciers can be roughly divided according to an annual average precipitation of 1000 mm [1]. Areas with average yearly precipitation greater than 1000 mm are marine glacier areas, whereas those with less than 1000 mm are continental glacier areas.
With the continuous economic and social development, engineering construction may pass through the distribution areas of marine glaciers. For example, China plans to build the Sichuan–Tibet Railway and the China–Nepal Railway along the southern margin of the Tibetan Plateau, where marine glaciers are widely distributed, over the next 5–10 years. These proposed railways have large sections that need to pass through the distribution areas of marine glaciers (as shown in Figure 1). However, only a few studies have been conducted on the impact of glaciers on railway engineering. This is because of the strict construction standards for railways, especially high-speed railways; in the past, few railway construction projects have needed to consider the problem of passing through an area with dense glaciers. As a result, research on the impact of glaciers on engineering construction began only within the last 40 years.
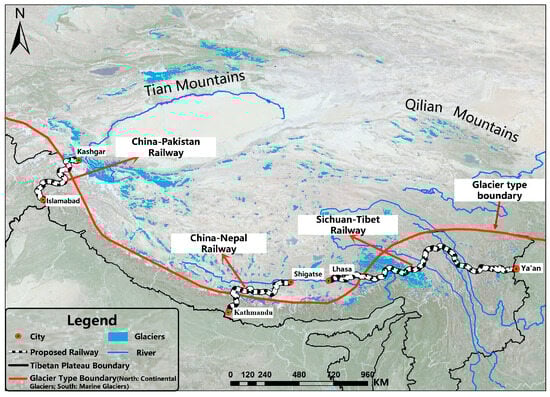
Figure 1.
Schematic diagram of proposed railway and distribution of glaciers.
1.2. Previous Studies
The studies to date have focused on the adverse effects of glaciers on engineering construction. The adverse impact of glaciers on engineering construction can be divided into three categories: glacier movements and retreat [2], glacial lake outburst floods (GLOFs) [3], and glacier meltwater [4]. Byers [5] presented recent examples of glacier flood mechanisms in high mountains and compared flood mechanisms in different countries. GLOF events have been reported in many countries with glaciated mountain ranges; the affected areas include the Nepal Himalaya [6], the Himalayas of India, the Tibet Autonomous Region of China, Bhutan [7,8], the Peru, Bolivia [9], the Swiss Alps [10], and the Juneau and Kenai Peninsula regions of Alaska [11]. First, the movement of glaciers can cause soil instability, leading to landslides, rock falls, and erosion, which can pose a risk to engineering structures built nearby. Furthermore, as glaciers retreat, they can form glacial lakes. Song [12] presented a comprehensive study of glacial lake evolution in the southeastern Tibetan Plateau. Furthermore, the cause of the rapid expansion of proglacial lakes linked to glacial–hydrogeomorphic processes has been studied. Similarly, a rockfall-induced glacial lake outburst flood in Upper Barun Valley, Nepal, has been reported [13]. If the dam holding back the lake fails, a GLOF can occur, which can have devastating impacts on infrastructure, settlements, and human life. In 2009, Osti and Egashira [13] simulated a GLOF event in the Tam Pokhari Glacier Lake along the China–Nepal Highway. They calculated that an outburst flood would have a maximum flood peak of approximately 10,000 m3/s. In 2012, Cheng et al. [14] studied the distribution and changes of glacial lakes in the Palong Zangbo watershed, where the Sichuan–Tibet Highway is located. Their findings suggest that the possibility of a large-scale GLOF in this area is low, while that of sporadic GLOF is very high. In 2021, Ahmed et al. [3] counted GLOFs in the central Himalayas, reporting mainly on two glacial lake outbursts in the Jilong Zangbo and Boqu watersheds. These two glacial lake outburst incidents caused severe damage to residents along the China–Nepal Highway [9,10,11,15,16,17]. In 1975, through two years of on-site monitoring, Shi [18] predicted the development trend of the Batura Glacier in Pakistan, providing technological support for the later successful restoration of the China–Pakistan Highway in 1978. Sharafat [19] and Zhu [20] combined data analysis and remote sensing interpretation work for utility tunnels with glacier disaster types, distribution, and characteristics along the Pakistan National Highway. Finally, melting glaciers release large amounts of water that can cause flash floods, severely damaging infrastructure and buildings in downstream areas [5]. In 2007, Liang [21] performed a statistical analysis of the risk of glacier debris flow from Tongmai to Bomi on the Sichuan–Tibet Highway in China, and proposed recommendations for highway reconstruction. In 2022, Lin [22] presented a damage model to estimate the engineering damage grade due to Glacial Debris Flow in the Parlung River Basin. In 2017, Zhang [23] assessed the danger levels of debris flows along the Sichuan–Tibet Railway and classified 91 glacial debris flows as high risk, medium risk, or low risk. Moreover, they recommended using tunnels when the railway passes through high-risk glacier debris flow areas. However, appropriate risk assessment is required in order to mitigate the construction risk [24,25,26]. Furthermore, Lu [27] presented a study summarizing the challenges and countermeasures involved in construction safety during the Sichuan–Tibet Railway project. However, the above studies all focused on the adverse effects of glaciers; very little research has been conducted on advantages of glaciers that can be useful for engineering construction.
1.3. Geomorphic Features Shaped by Marine Glaciers
The movement of glaciers includes scraping, acquisition, transportation, and accumulation of large amounts of sediment. Based on erosion and deposition, landforms created by glaciers can be divided into two types: glacial erosion landforms and glacial accumulation landforms [28]. The formation of glacial erosion landforms is due to the repeated freeze–thaw cycles and movements of glaciers cause plucking and abrasion of the bedrock underneath. In this way, glacial erosion landforms are shaped. The main types of glacial erosion landforms are horn peaks, knife-edge crests, cirques, valley shoulders, glacier canyons, fjords, and Roche moutonnée [29]. However, based on the location and stability of these landforms, the glacier erosion landforms available for railway and road construction include only two main types, namely, glacier canyons and valley shoulders. The formation processes for glacier accumulation landforms are as follows. First, in the glacial period, when glaciers advance to and develop in lower-altitude areas, the ice tongue wraps the internal and bottom detrital rock, moving them and pushing them together. Glaciers below the snow line begin to melt and eventually disappear when the glacial period ends and the interglacial period begins. Meanwhile, the rock and soil that the glacier carries begin to be deposited without panning. Finally, as time passes, glacier accumulation landforms are formed [30]. The main types of glacial accumulation landforms are lateral moraines, medial moraines, terminal moraines, hillock moraines, and moraine mesas [29]. Ancient dammed lake basins formed by ancient glaciers blocking the river represent a particular type of glacial accumulation landform. Similarly, based on the location and stability of the landforms, the glacier accumulation landforms available for railway and road construction include only two main types, namely, moraine mesas and ancient dammed lake basins formed by ancient glaciers.
1.4. Problem Statement and Research Scope
Railway construction is generally a complex and challenging process, especially for a railway line crossing glaciers in high-altitude areas, which poses several unique hazards and challenges due to glaciers’ dynamic and unpredictable nature. Selection of a railway route in marine glacier areas requires careful consideration of several factors, including glacier dynamics, fluctuating topography, complex geology, and potential hazards. Considering this problem, a novel geospatial analysis-based method is presented in this paper to identify favorable landforms shaped by marine glaciers for selecting railway routes. Four primary favorable landforms created by marine glaciers, namely, glacier canyons, valley shoulders, moraine terraces, and old dammed lake basins, are examined using the proposed methodology. A three-step railway route selection method is proposed for marine glacier distribution areas, which includes identifying areas of direct glacier action and indirect glacier action in order to determine feasible railway routes. Finally, the proposed strategies derived by analyzing glacial geomorphology are presented to optimize the railway route based on glacial landforms. To support the proposed methodology, the Along Zangbo watershed of the Sichuan–Tibet Railway, a complex and challenging region, is selected as a case study to investigate favorable landforms formed by glaciers for railway line route selection and optimization. Based on the results of the proposed methodology, glacier basin areas of 22 glacier canyons along the Sichuan–Tibet railway line are identified and a railway line selection method using favorable landforms developed by glaciers is presented, providing new guidance for railway route selection in marine glacial regions.
2. Materials and Methods
2.1. Favorable Glacial Landforms Available for Railway and Road Construction
As previously discussed, based on their location and stability, only four primary types of glacial landforms are suitable for railway and road construction. These include glacier canyons, valley shoulders, moraine mesas, and ancient dammed lake basins formed by prehistoric glaciers.
2.1.1. Glacier Canyon
The formation of a glacial canyon is due to the downward movement of glaciers during the glacial period, further widening, deepening, and straightening the “V”-shaped river valley and gradually changing it into a “U”-shaped glacier canyon, as shown in Figure 2a [31]. Thus, a glacier canyon tends to be broad and straight, making it a reasonably suitable landform for railway or road construction. Numerous studies have validated the ability of glacial erosion models to shape typical glacial landforms such as glacier canyons or hanging valleys, utilizing the theoretical hypothesis that the erosion rate is directly proportional to the ice sliding velocity [32,33,34]. In 2011, Herman et al. [35] incorporated subglacial hydrology into glacial erosion models, mechanistically validate the influence of subglacial hydrology on glacial erosion patterns to form large glacier canyons. In their study, Allred and Luo [36] demonstrated the potential of combining DEM-based GIS and data mining techniques based on geographic knowledge discovery (GKD) to identify the crucial morphometric parameters of glacier canyons.
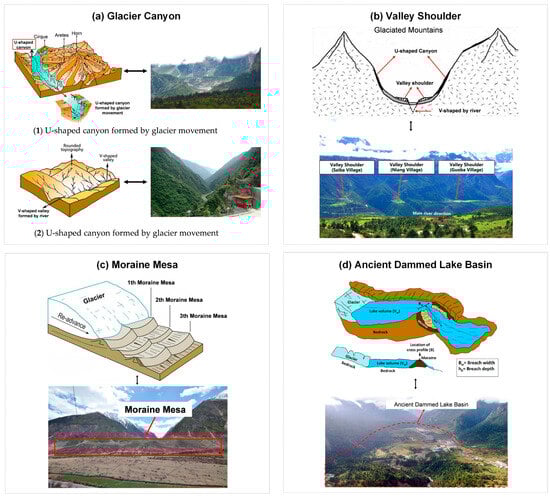
Figure 2.
Favorable glacial landforms available for railway and road construction.
2.1.2. Valley Shoulder
A valley shoulder is a unique landform created by the interaction between multi-period glacial movement and river erosion. The specific generation process is as follows. First, the glacial movement creates a “U”-shaped glacier canyon. Then, because of the uplift of the crust, the river erodes the bottom of the original canyon and forms a cut-down “V”-shaped valley at the bottom of the canyon [37]. The flat platform between the “U”-shaped canyon and the “V”-shaped valley, shown in Figure 2b, is referred to as the valley shoulder. In 2014, Leith et al. [38] used a finite difference model to study bedrock stresses in glacier canyons, confirming that subglacial extensional fracture development forms the valley shoulder, reflecting a localized fracturing zone, and determining that the valley shoulder typically extends 600 m laterally from the valley axis. In addition, since the Quaternary Era the world has experienced multiple glacial and interglacial climate cycles; therefore, there may be multi-step valley shoulders distributed at different heights in a single valley.
Two advantageous characteristics of a valley shoulder are that it is flat and stable. First, because the valley shoulder is partly formed by river erosion, it has flat topographical features distributed along the river, similar to those of river terraces. Second, because of the uplift of the crust during their formation, valley shoulders are generally much higher than the rivers at the valley bottom; thus, they are not threatened by flooding [38]. For these reasons, valley shoulders are considered to be safe and stable.
2.1.3. Moraine Mesa
A moraine mesa is formed by the accumulation of moraine distributed downstream of glaciers [39]. When glacier canyons are intermittently distributed along a main river valley, moraine transported by glaciers often accumulates at the junction of the outlet of the glacier canyons and the main river valley to form a series of moraine mesas distributed along the main river, as shown in Figure 2c. Depending on the specific needs of railway construction, parts of the moraine mesa can be selected and utilized. Regarding their stability, after being transported to their current location, the moraines that constitute a moraine mesa have to undergo natural deposition for hundreds to thousands of years. The degree of cementation and solidification between the moraines is very high; thus, moraine mesas have good mechanical properties and are stable and suitable for engineering construction. For example, in 2014, Hu et al. [39] used optically stimulated luminescence (OSL) combined with geological investigation and remote sensing techniques to analyze the moraine mesas in Laohugou Valley in the western Qilian Mountains, finding deposition during the glacial–interglacial transition and a stable engineering geological structure.
2.1.4. Ancient Dammed Lake Basin
An ancient dammed lake basin formed by ancient glaciers blocking a river is a special type of glacial accumulation landform [40], and is shown in Figure 2d. The formation process is as follows: First, the ancient glacier in the branch ditch advance and reach the main river valley; then, the ancient glacier blocks the main river, forming a dammed lake. Second, as the lake water rises, the water pressure increases to a critical point and the dam bursts. Finally, a flat landform is formed by the outflow of lake water from the original dammed lake basin. This landform is called an ancient dammed lake basin formed by ancient glaciers [41]. Such an ancient dammed lake basin is a lacustrine sedimentary landform with flat terrain and a wide area. Because glacier distribution areas are usually located in mountains lacking flat terrain, these ancient dammed lake basins become a rare favorable landform that can be used for engineering construction. The Qinghai–Tibet Plateau at the northern end of the Himalayan orogenic belt is considered to be one of the most geologically active regions since the Cenozoic era. Recent studies have discovered several ancient dammed lake basins in the area that were formed by ancient glaciers blocking river channels since the Late Pleistocene, including the Gegar [40], Lulang [42], and Dongjiu ancient dammed lake basins [41].
2.2. Railway Route Selection Process for Marine Glacier Distribution Area
Following an analysis of the favorable landforms formed by glaciers, a method is proposed for the selection of railway routes within the distribution zones of marine glaciers. On the one hand, the hydrogeological environment of these areas has become exceedingly complex due to the accelerated glacier melting brought about by global warming [43], which in turn significantly increases glacial disasters. Conversely, specific glacial landforms provide favorable terrain for railway infrastructure. In light of the coexistence of disasters and favorable landforms in glacial distribution areas, it is crucial for railway construction to maximize the advantages and minimize the risks as much as possible. Consequently, special consideration for glacier-related issues needs to be incorporated into the traditional railway route selection process. Thus, a refined railway route selection process for marine glacier distribution areas is proposed in this paper, as depicted in Figure 3.
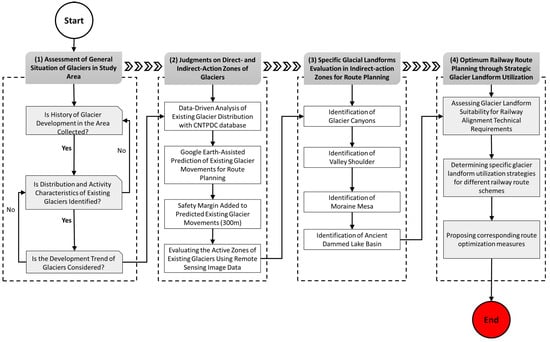
Figure 3.
Railway route selection process for marine glacier distribution area.
The railway route selection process for the marine glacier distribution area specifically includes the following steps.
(1) Assessment of the General Situation of Glaciers in the Study Area: this step involves a comprehensive assessment of the glaciers in the study area, including their distribution, types, activity status, and more.
(2) Judgments on the Direct-Action and Indirect-Action Zones of Glaciers: in this step, areas that may be directly or indirectly affected by glaciers are identified and assessed, including regions that could be directly influenced by glacier activity as well as areas that might be indirectly impacted due to glacial melting.
(3) Specific Glacial Landforms Evaluation for Railway Route Planning in Indirect-Action Zones: this step mainly studies and evaluates the characteristics of glacial landforms within the indirect-action zones with the goal of incorporating these landform characteristics into railway route planning for optimized design.
(4) Optimization of Railway Route Planning through Strategic Glacier Landform Utilization: this step proposes and implements strategies for optimally utilizing glacial landforms to enhance railway route planning for safer and more effective operations.
Specifically, the first step is used to grasp the general situation of glaciers in the study area, such as the history of glacier development, distribution and activity characteristics of existing glaciers, and the development trend of glaciers during the century-long service period of the railway. In other words, in this step the past, present, and future of glaciers are all examined.
2.2.1. Determining Direct-Action and Indirect-Action Zones of Existing Glaciers
The second step is to make judgments about the direct-action and indirect-action zones of existing glaciers. Based on the different modes of influence of glaciers on railways, the glacial action area can be divided into a direct-action zone and an indirect-action zone. The former consists of the distribution area of existing glaciers and the areas that the glaciers may advance to and reach during the 100-year service period of the railway. If the glaciers and railway come into direct contact the railway will be destroyed, because current engineering technologies cannot resist a glacier’s force. Therefore, the direct-action zone of a glacier can only be completely circumvented by the railway. On the other hand, the indirect-action zone refers to the area that cannot be reached by glaciers but can be reached by indirect disasters caused by glacial meltwater, such as glacial debris flows. In these areas, the railroad can pass through with appropriate engineering measures. As mentioned in Section 2.2, the direct-action zone of existing glaciers includes two main parts: (1) the distribution area of existing glaciers and (2) the areas where existing glaciers may advance to and reach during the 100-year service period of the railway.
The China National Tibetan Plateau Data Center [44] provides specific data on the distribution area of existing glaciers. Meanwhile, to judge the areas where existing glaciers may advance and reach during the 100-year service period of the railway, Offset tracking technology [2] combined with ArcMap is utilized to analyze radar images of glaciers along the Sichuan–Tibet railway over the past decade. By extracting image intensity information to obtain the maximum annual average velocities of each glacier a 300-m safety margin is added to the existing glacier active range based on the region’s maximum annual average velocities of glaciers, which is a critical consideration for the safe operation of the Sichuan–Tibet railway.
Glacier velocity reveals the movement processes of glaciers, shedding light on how ice flows within glacier systems. Understanding these velocities allows for the quantification of differences in glacier changes, aiding in predicting the range of glacial advancement or retreat [45]. Moreover, studying glacier velocity offers insights into broader climatic conditions, as changes in velocity can be indicative of underlying changes in temperature and precipitation patterns. Thus, analyzing glacier velocity forms a critical aspect of climate research and risk assessment in regions affected by glacier activity [46]. Traditional methods such as field measurements and GPS tracking have been employed in previous studies to monitor glacier velocity [47]; however, the limitations of these methods, including limited spatial coverage, potential equipment errors, and high maintenance costs, may hinder precise assessment of glacier movement [2]. Most contemporary glacier velocity research utilizes remote sensing images [48], benefiting from extensive spatial reach, regular temporal monitoring, and access to otherwise unreachable areas to enhance the overall understanding of glacier behavior. The main techniques for monitoring glacier movement encompass interferometry technology [49] and offset tracking technology [50]. Interferometry technology uses electromagnetic waves to detect changes in glaciers. While it provides precise measurements and insights into glacier dynamics, it can be sensitive to atmospheric conditions and requires complex data processing. Offset tracking technology uses cross-correlation techniques to measure the displacement between images. This approach can make up for limitations in interferometry technology by offering robustness against atmospheric effects, simpler data processing, suitability for rapidly changing glaciers, and potential cost-effectiveness.
The primary idea is to determine the maximum activity range of glaciers along the Sichuan–Tibet railway utilizing both qualitative and quantitative analyses of glacier velocities from 2010 to 2020. The specific process is mainly as follows. (1) Based on qualitative analysis utilizing ArcMap’s raster clipping tool and visual interpretation, 75 glaciers with notably rapid movement were identified along the Sichuan–Tibet railway line from 2010 to 2020. These glaciers have been designated as G0, G1, G2, G3, to G75 (Table A1). (2) Glacier data provided by the China National Tibetan Plateau Data Center [44] were used to obtain specific attributes of these 75 glaciers. Among them, glacier G56 was found to have the largest area, reaching 206.7379 km2, with a relatively gentle slope of 18.2°. In general, a glacier’s area is directly related to its ice mass, and an expansion in ice mass often leads to quicker glacier movement. Mild slopes are conducive to glacier formation; thus, glacier G56 was chosen as a representative example. (3) Quantitative analyses were conducted using ArcMap to statistically assess the annual average velocities of these 75 glaciers from 2010 to 2020 (Table A1). The results in the Appendix A show that glacier G56 has a maximum annual average velocity of 2.923 m/year, while the annual average velocities of other glaciers are all less than this. Using the annual average velocity of glacier G56 as the maximum movement velocity, a maximum activity range of 300 m was calculated for the safe operation of the Sichuan–Tibet railway.
2.2.2. Identification and Utilization of Glacier Canyons
Identification of Glacier Canyons
The third step is to analyze the types and distribution characteristics of glacier landforms in the glacier indirect-action zone. In the indirect-action zone, there may be both indirect disasters caused by glaciers, such as glacial debris flows, and favorable landforms shaped by glaciers. Thus, this step involves thematic work toward utilizing these glacial landforms.
There are two methods [34] for determining whether a valley is a glacial canyon. The first is a qualitative method, which involves checking whether there are existing glaciers at the source and observing whether the cross-section of the valley is a “U”-shaped section. The second is a quantitative method, which uses mathematical methods to fit the cross-section of the valley and determine whether it conforms to the cross-section of a glacier canyon. Compared with the qualitative method, the quantitative method is more scientific and reasonable; thus, in this study we use a quantitative method to identify glacier canyons in the watershed.
Quantitative measurement methods include quadratic polynomial and power function methods [51]. Both methods need to measure whether the cross-section of the valley fulfills the characteristics corresponding to a glacial canyon. However, the quadratic polynomial method can perform well only when the cross-sectional shape is extremely close to a parabola, and cannot be used for mutual comparisons between valleys. Therefore, for this study we selected the power function method to quantitatively measure the valleys in the Palong Zangbo watershed.
When the power function model is used to identify glacier canyons, the “A” coefficient indicates the breadth of the valley floor, while the “b” exponent, commonly called the B-value, generally reflects the steepness of the canyon walls [52]. The smaller the B-value, the steeper the canyon wall. In this case, the cross-section of the canyon is closer to the “V”-shaped section formed by river erosion. Likewise, the inverse applies; the larger the B-value, the smoother the canyon wall; on the other hand, “A” is a coefficient, which is kept at 0.5 in Figure 4. In this case, the cross-section of the canyon, as shown in Figure 4, is closer to the “U”-shaped section formed by glacial erosion.
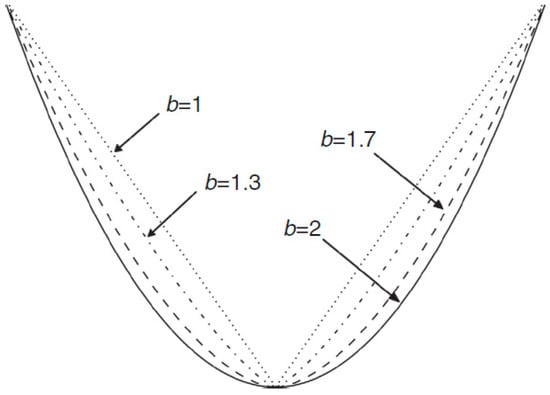
Figure 4.
Cross-section fitting curve characteristics of a canyon (a deep narrow valley form with an A coefficient of 0.5 and a b-value of 2).
The power function model is
In this equation, the independent variable X represents the absolute value of the horizontal distance from a point on the cross-section to the origin, whereas the dependent variable Y represents the absolute value of the vertical distance from a point on the cross-section to the origin, where the coordinate origin is the center point of the canyon bottom.
In the actual calculation process, we obtain the logarithm of the power function model and convert it into Equation (2):
For convenience of expression, based on , Equation (2) is transformed into Equation (3):
Then, based on the least squares method, the values of A and B in Equation (3) are obtained:
The fourth step is to determine specific glacier landform utilization strategies for different railway route schemes and propose corresponding route optimization measures.
The specific method is as follows.
First, ArcGIS software v10.8.1 was used to extract cross-sectional data on all branch valleys in the Palong Zangbo watershed.
Then, the extracted cross-sectional data were imported into MATLAB software v9.13 and the power function model was applied to fit the data.
Finally, the B-value of each valley in the Palong Zangbo watershed was obtained from the fitted curve.
Based on the B-value, it is possible to preliminarily determine whether or not the valley is a glacier canyon. According to research studies by Li and Liu [52], Yang and Shi [53], and Kassab and Harbor [54], in practical applications the B-value of a glacier canyon usually fluctuates between 1.5 and 2.5. If the B-value of the studied valley is ≥1.5, it is more likely to be a glacial canyon formed by glacial erosion, which can be further confirmed based on other geological evidence (e.g., whether there are glaciers at its source). If the B-value is <1.5, it is more likely to be a river valley formed by river erosion, which can be further confirmed by other geological evidence as well. For this study, referring to previous literature, we selected a B-value = 1.5 as the critical point with which to preliminarily judge whether a valley is a glacier canyon. If the B-value was ≥1.5, a valley was preliminarily judged as a glacier canyon. This inference was then combined with relevant geological evidence, such as whether there were existing glaciers in the upper reaches of the valley, to reach a final judgment.
3. Case Study
3.1. Study Area
The Sichuan–Tibet Railway connects Chengdu City in the west and Lhasa, the capital of the Tibet Autonomous Region, in the east, with Ya’an City, Kangding County, Qamdo, Nyingchi, and Shannan lying along the route. It was opened on 28 December 2018 between Chengdu and Ya’an, and is expected to be completed by 2021 between Lhasa and Nyingchi. The Chengdu–Ya’an section of the line has been completed, while the Lhasa–Nyingchi section is still under construction. Approximately 1008.45 km in length, the Ya’an–Nyingchi section has 24 new stations (excluding Ya’an and Nyingchi); a total of 965.74 km of bridges and tunnels are present in this section, and 95.8% of this section consists of bridges and tunnels. The new section includes 93 newly built bridges with an estimated length of 114.22 km, representing 11.33% of the line’s length, and 72 tunnels with an estimated length of 851.48 km. As shown in Figure 5, mountain glaciers can be seen along the railway (Figure 5). Around Nyingchi and Bomê they are particularly prevalent and dense. The interaction of temperature differences between day and night, as well as rain, earthquakes, strong winds, and other factors, result in a number of ice hazards, including ice quakes, glacier debris flows, and glacial lake outburst floods. Sichuan–Tibet railway construction and operation are vulnerable to these hidden risks.
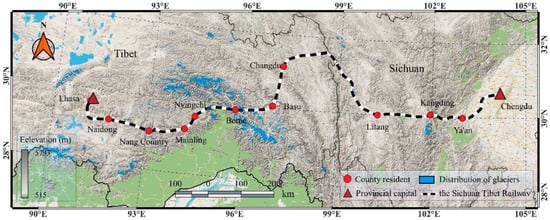
Figure 5.
Geographical location and topographical characteristics of the Sichuan–Tibet Railway and the mountain glaciers along the railway route [2].
The railway route selection process for marine glacier distribution areas is demonstrated here using the Palong Zangbo watershed in the Sichuan–Tibet Railway as an example. The Palong Zangbu watershed along the Sichuan–Tibet Railway has great geographical importance in the region for conducting trade between neighboring countries and providing access to the mainland. First, the research area is the Palong Zangbo watershed, located in the Nyingchi area of eastern Tibet of China. From west to east, it passes through Lulang, Tongmai, Guxiang, Bomi, and Songzong before finally reaching Basu County. Glaciers and glacial lakes are widely distributed throughout this area. The total area of marine glaciers is 1648.11 km2, and the total number of glacial lakes is 131 (shown in Figure 6) [44].
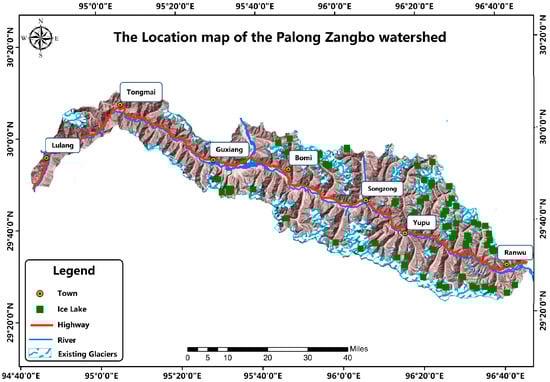
Figure 6.
Location map showing the Palong Zangbo watershed.
3.2. Assessment of the General Situation of Glaciers in Study Area
Since the Quaternary Era, the Palong Zangbo watershed has experienced four major glacial periods: the Penultimate glacial period, Last glacial period, Neoglacial period, and Little Ice Age, as shown in Figure 7. The scales of the glaciers exhibit a decreasing trend over time. According to other researchers, even in the penultimate glacial period, which involved the largest scale of glaciation in history, there has never been a glacier occupying the entire main valley of the Palong Zangbo Basin [55]. Currently, the world is in the interglacial period after the Little Ice Age, and the sizes of existing glaciers in the Palong Zangbo Basin have shrunk significantly compared to those in previous historical glacial periods. Regarding the future development trend for the 100-year service period of the railway in the glacier regions, the Tibetan Plateau has experienced a significant temperature increase of 0.3–0.4 °C per decade in recent decades due to global warming, a rate that is twice the global average during the same period [43]. As a result of this warming trend, the glaciers will be in a state of retreat during the coming decades [56]. Even taking into account fluctuations, they will not undergo large-scale development compared to the present situation.
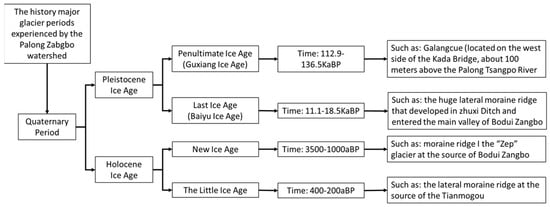
Figure 7.
Historical glacial period since the Quaternary Era in the Palong Zangbo watershed.
4. Result
4.1. Direct-Action and Indirect-Action Zones of Existing Glaciers in Palong Zangbo Watershed
By applying the method described in Section 2.2.1, the distribution area of existing glaciers and the area where the existing glaciers may advance to and reach were obtained. By combining the two, the direct-action zone of existing glaciers in the Palong Zangbo Watershed was identified, as shown in Figure 8. The area covered by the red mask in Figure 8 represents the direct-action zone of existing glaciers in the Palong Zangbo Watershed in which the railway would be directly affected by glaciers, thereby endangering its safety. Therefore, railway construction cannot proceed within this area. Meanwhile, after obtaining the direct-action zone of existing glaciers, the area excluding the direct-action zone was determined to be the glacier indirect-action zone, as shown in Figure 9. The area covered by the blue mask in Figure 9 represents the indirect-action zone of existing glaciers in the Palong Zangbo Watershed, in which the railway can be constructed safely using appropriate engineering methods.
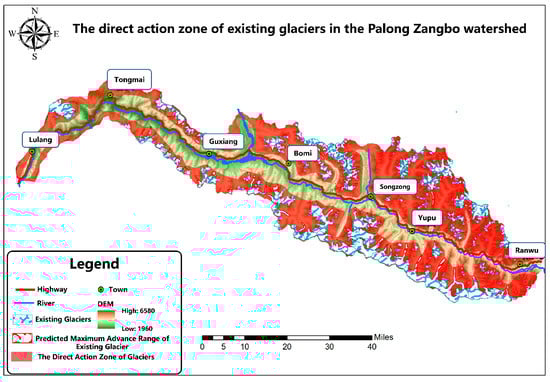
Figure 8.
Direct-action zone of existing glaciers in Palong Zangbo watershed.
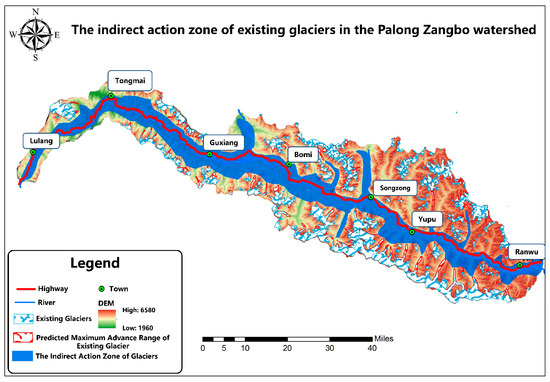
Figure 9.
Indirect-action zone of existing glaciers in Palong Zangbo watershed.
4.2. Glacier Canyons in Palong Zangbo Watershed
By applying the method described in Section 2.2.2, 22 Glacier Canyons in the Palong Zangbo Watershed were identified along the Sichuan–Tibet railway line. Their specific locations and detailed attributes are shown in Figure 10 and Table 1.
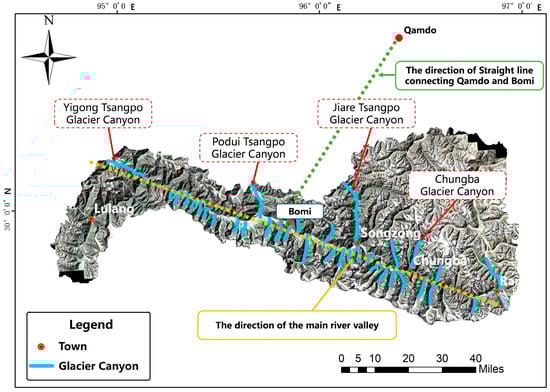
Figure 10.
Location of glacier canyons in Palong Zangbo Watershed.

Table 1.
Information about glacier canyons in Palong Zangbo watershed.
4.3. Moraine Mesa in Palong Zangbo Watershed
The identification method for moraine mesas was based mainly on the comparative analysis of high-precision remote sensing images and on-site investigation. Through the identification of all moraine mesas in the Palong Zangbo watershed, it was determined that the moraine mesas in the watershed are concentrated mainly in the Guxiang–Songzong segment, and that there are significantly more on the left bank of the river than on the right bank. The distribution of all moraine mesas in the watershed is shown in Figure 11.
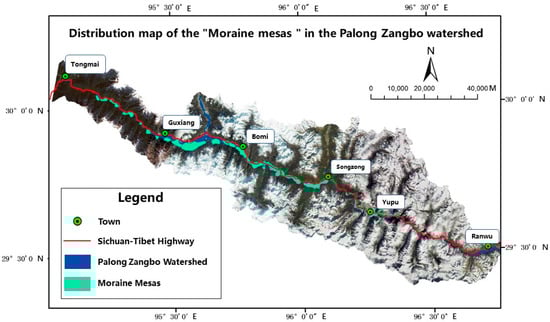
Figure 11.
Distribution map of moraine mesas in Palong Zangbo watershed.
5. Discussion
5.1. Analysis of Types and Distribution Characteristics of Glacier Landforms in Glacier Indirect-Action Zone
As shown in Figure 9, after identifying the indirect-action zone of the existing glaciers in the Palong Zangbo Watershed, in which the railway can be safely constructed using appropriate engineering methods, further analysis of the types, characteristics, and distribution locations of typical glacial landforms within this zone is required. This analysis can aid in the development of specific utilization strategies for different glacial landforms in railway construction. Table 2 outlines these glacial landforms and categorizes them by elevation from low to high. As can be seen from Table 2 and Figure 10, within the indirect-action zone of existing glaciers, the glacier canyons available for railway construction are mostly located in the first-level tributaries of the main river and are orthogonal to the main river. Among them, Chungba Glacier Canyon, Jiare Tsangpo Glacier Canyon, Podui Tsangpo Glacier Canyon, and Yigong Tsangpo Glacier Canyon are the largest and most renowned. According to Shi et al. [30], these four glacier valleys were formed during the Penultimate glacial period or the Last glacial period; their engineering geological conditions are stable, making them suitable for the layout of railway engineering. As can be seen from Table 2 and Figure 11, moraine mesas are mostly located at the junction of branch ditches and the main river valley; they are concentrated mainly on the north bank of the main river, particularly in the Guxiang–Songzong segment. Moraine mesas represent good materials for roadbed construction [57]. Considering construction costs, the railway line can cross the river at the Guxiang–Songzong segment and be built on the north bank of the main river, utilizing the moraine mesas to construct the railway roadbed and thereby reducing construction costs. Finally, the lateral and terminal moraines in the tributary here are unsuitable for engineering use due to their high altitude and sporadic distribution, and lack construction value.
Table 2.
Types and distribution characteristics of glacier landforms in Palong Zangbo watershed.
5.2. Utilization Strategies for Glacier Canyons in Palong Zangbo Watershed
According to the preliminary route design plan, the railway is required to pass through two major economic centers in the Palong Zangbo watershed, namely, Qamdo and Bomi. The straight-line direction between Qamdo and Bomi is close to the north–south direction. By contrast, as shown in Figure 10, the main river valley of the Palong Zangbo watershed runs in the east–west direction. Therefore, the railway cannot directly use the main river valley to connect Qamdo and Bomi. However, the three main glacier canyons in the Palong Zangbo watershed, i.e., Chungba Glacier Canyon, Jiare Tsangpo Glacier Canyon, and Podui Tsangpo Glacier Canyon, all run in the north–south direction. For the direct connection scheme between Qamdo and Bomi, it will be more economical to utilize the flat terrain of these glacial canyons to build the necessary railways.
Typical Glacier Canyons in Watersheds
Table 1 shows that there are 22 glacier canyons in the Palong Zangbo Basin. The four largest glacial canyons are distributed on the right bank of the river; these are the Chungba Glacier canyon, Jiare Tsangpo Glacier canyon, Podui Tsangpo Glacier canyon, and Yigong Tsangpo Glacier Canyon.
The Podui Tsangpo Glacier Canyon is a wide glacier canyon formed during the Penultimate glacial period [58] and Last glacial period, as shown in Figure 12a. It is located 14 km from Bomi County. The average width of the canyon is approximately 1 km and its widest part is 2.4 km. The average altitude of the bottom of the canyon is 2687 m, the average longitudinal slope is 12‰, the average transverse slope is 13‰, and the usable area is approximately 36 km2. The Yigong Tsangpo Glacier canyon was formed during the Penultimate glacial period and Last glacial period [58], as shown in Figure 12b. It is located 58 km from Guxiang County. The average width of the Yigong Tsangpo Glacier canyon is 0.93 km; the widest part is near Maya village, with a width of 2.2 km. The average altitude of the bottom of the canyon is 3106 m, the average longitudinal slope is 29‰, the average transverse slope is 15‰, and the usable area is approximately 27 km2.
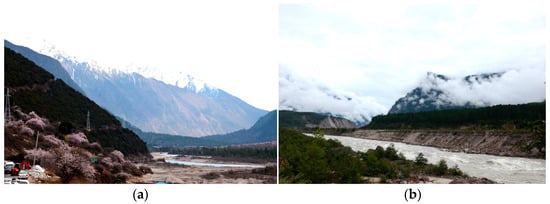
Figure 12.
(a) Bottom of Podui Tsangpo glacier canyon (photographed on site) and (b) bottom of Yigong Tsangpo glacier canyon (photographed on site).
5.3. Utilization Strategies for Moraine Mesas in Palong Zangbo Watershed
From top to bottom, the topography of the Palong Zangbo watershed consists of existing glaciers, denuded mountains, moraine mesas, river terraces (where the existing road is located), floodplains, and rivers (Figure 13). In the past few decades there have been many flood events in the Palong Zangbo watershed caused by glacial lake outbursts and glacier debris flow blocking the river [59]; therefore, the traditional approach of using river terraces for wiring cannot fulfill flood control requirements. In this situation, the moraine mesas are higher than the river terraces in terms of elevation, and are relatively continuous. Therefore, if the moraine mesas are used for wiring they can fulfill flood control requirements as well as reduce the bridge and tunnel ratio of the proposed railway, thereby reducing project costs. The moraine mesas provide favorable conditions for high-position wiring and can be utilized in railway construction.
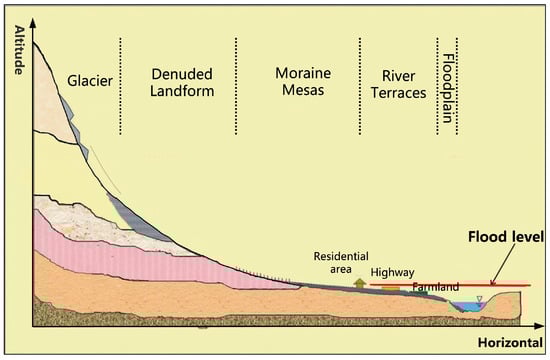
Figure 13.
Topography of Palong Zangbo watershed.
Typical Moraine Mesas in Watersheds
Moraine mesas in Chungba Glacier Canyon include three sets of large-scale moraine mesas at the canyon outlet, as shown in Figure 14. Among them, the first set of moraine mesas, denoted as A, is the largest. Its distribution ranges from the outlet of the Chungba Glacier canyon to the left bank of the main river valley, with a height of approximately 100 m. Compared with this, the other moraine mesas (denoted B and C) are much smaller; their distribution ranges are only approximately half that of moraine mesa A.
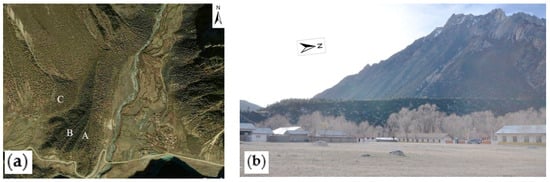
Figure 14.
(a) Moraine mesas at the mouth of Chungba Glacier canyon and (b) moraine mesa A (photography angle: west).
Suwa village is located on the left bank of the main river valley; there are four large moraine mesas near the village, as shown in Figure 15. Among these, moraine mesas A and B are the largest, and their distribution ranges from the outlet of the branch valley to the center of the main river valley. Moraine mesas C and D are positioned outside of mesas A and B. These two mesas were formed earlier, but due to fluvial erosion, they have become more convoluted in shape. Mesas C and D are smaller and more fragmented when compared to mesas A and B.
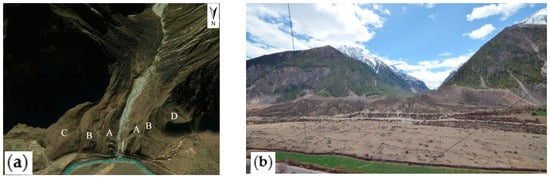
Figure 15.
(a) Moraine mesas near Suwa village and (b) moraine mesa B (photography angle: south).
6. Conclusions
Railways play a key role in the country’s development and progress in various aspects, including economic, social, and environmental. The construction and operation of railways often crosses diverse terrain, including deserts, mountains, and glaciers, that require careful route selection. Marine glaciers have a great contribution to shaping landforms, and can pose significant challenges and risks for railway route selection. This is the first study set out to evaluate a novel geospatial analysis-based railway route selection methodology utilizing favorable glacial landforms for railway infrastructure projects in marine glacial areas, and provides a new perspective on the utilization of favorable glacial landforms in railway construction.
In this study, we first analyzed the availability of various landforms shaped by marine glaciers, such as glacier canyons, valley shoulders, moraine mesa, and ancient dammed lake basins formed by ancient glaciers blocking rivers. Then, utilization strategies were proposed for different glacier landforms along with corresponding route optimization strategies for different railway route schemes through an understanding of the situation of the regional glaciers in terms of their direct-action and indirect-action zones. Finally, the Palong Zangbo watershed of the Sichuan–Tibet Railway was used as a case study to demonstrate the proposed railway route selection process for marine glacier distribution areas. Special utilization strategies involving the use of glacier canyons for wiring in order to save on investment in short straight-route schemes are discussed, and the use of moraine mesas for high-position wiring to avoid floods in the main river valley route scheme is recommended. Our results successfully identify the types and distribution characteristics of glacier landforms, providing a clear understanding for decision-making by designers in railway route selection in areas prone to natural hazards-.
Although the developed methodology has been successfully demonstrated, it has certain limitations that need to be acknowledged. The scope of the study was limited in terms of developing the quantitative criteria for only indirect-action zones of existing glaciers. The developed methodology is generic, and can be applied anywhere in the world; however, the case study was limited to a specific region in China. Future work will explore establishing quantitative criteria for judging the direct-action zone of existing glaciers and introducing more case studies from different parts of the world in order to apply the proposed railway route selection process to other marine glacier distribution areas.
Author Contributions
The authors have contributed as follows: conceptualization, T.D., K.H.L. and A.S.; methodology, T.D. and A.S.; software, T.D. and A.S.; validation, T.D., Y.M.W. and K.H.L.; formal analysis, T.D. and A.S.; investigation, A.S. and T.D.; resources, T.D. and K.G.L.; data curation T.D. and A.S.; writing—original draft preparation, K.H.L. and A.S.; writing—review and editing, A.S., E.L. and K.H.L.; visualization, T.D., K.H.L. and A.S.; supervision, A.S., Y.M.W. and K.H.L.; project administration, K.H.L.; funding acquisition, K.H.L. All authors have read and agreed to the published version of the manuscript.
Funding
This research was supported by the Basic Science Research Program through the National Research Foundation of Korea (NRF) funded by the Ministry of Education (2021R1I1A1A01041492).
Institutional Review Board Statement
Not applicable.
Informed Consent Statement
Not applicable.
Data Availability Statement
The specific glacier data in the Palong Zangbo watershed were extracted from the second glacier inventory dataset of China (version 1.0), which was provided by the China National Tibetan Plateau Data Center and can be downloaded at: http://data.tpdc.ac.cn/zh-hans/data/f92a4346-a33f-497d-9470-2b357ccb4246/ (accessed on1 June 2023).
Acknowledgments
We thank the Chinese National Tibetan Plateau Data Center and International Centre for Integrated Mountain Development (ICIMOD) for providing glacier data. Special thanks to the Institute of Mountain Hazards and Environment, CAS for their help in on-site investigations.
Conflicts of Interest
The authors declare no conflict of interest.
Appendix A
Table A1.
Maximum annual average velocity of 75 glaciers along the Sichuan–Tibet railway in the Palong Zangbo watershed.
Table A1.
Maximum annual average velocity of 75 glaciers along the Sichuan–Tibet railway in the Palong Zangbo watershed.
| Num | Longitude | Latitude | Average Elevation (m) | Area (km2) | Average Longitudinal Slope of Channel (‰) | Maximum Annual Average Velocity (m/Year) |
|---|---|---|---|---|---|---|
| 1 | 95.284073 | 30.096201 | 4848.4 | 23.2692 | 42.4 | 2.413557 |
| 2 | 95.286990 | 30.072298 | 4607.7 | 5.4809 | 37.7 | 2.911134 |
| 3 | 95.289738 | 30.103429 | 5020.3 | 5.8199 | 40.8 | 1.065454 |
| 4 | 95.301970 | 30.081541 | 4895.5 | 58.9255 | 29.6 | 1.33735 |
| 5 | 95.329965 | 30.073844 | 4705.4 | 26.5903 | 20.2 | 0.203122 |
| 6 | 95.342064 | 30.069246 | 4623.6 | 11.3877 | 22.4 | 2.407995 |
| 7 | 95.346781 | 30.086370 | 4612.5 | 2.4844 | 25.6 | 1.303416 |
| 8 | 95.348298 | 30.066409 | 4648.9 | 2.0011 | 29.0 | 2.915329 |
| 9 | 95.349526 | 30.076569 | 4589.0 | 41.0982 | 34.3 | 0.085633 |
| 10 | 95.350590 | 30.089774 | 4660.3 | 2.0560 | 31.6 | 1.242402 |
| 11 | 95.352854 | 30.040574 | 4747.4 | 4.9403 | 29.5 | 1.276091 |
| 12 | 95.352996 | 30.053494 | 4725.6 | 23.2429 | 29.1 | 2.804328 |
| 13 | 95.356222 | 30.059783 | 4742.6 | 4.4257 | 30.6 | 2.606029 |
| 14 | 95.373935 | 30.055716 | 4688.9 | 48.0394 | 26.2 | 0.416241 |
| 15 | 95.374934 | 30.033849 | 4796.2 | 54.4853 | 25.6 | 2.663411 |
| 16 | 95.379405 | 30.018039 | 4823.6 | 5.4145 | 40.7 | 2.670654 |
| 17 | 95.389789 | 30.039811 | 4919.2 | 3.4336 | 38.5 | 1.979752 |
| 18 | 95.393931 | 30.005868 | 4652.9 | 7.3928 | 20.9 | 1.784284 |
| 19 | 95.557754 | 29.779349 | 4215.3 | 7.0667 | 25.3 | 0.10527 |
| 20 | 95.591996 | 29.795142 | 4277.2 | 7.2871 | 28.6 | 1.387739 |
| 21 | 95.600672 | 29.790360 | 4513.4 | 3.0978 | 21.8 | 2.855208 |
| 22 | 95.609669 | 29.790928 | 4469.5 | 3.4018 | 26.8 | 0.378946 |
| 23 | 95.616739 | 29.824367 | 4448.7 | 3.2500 | 31.5 | 0.801321 |
| 24 | 95.622958 | 29.823840 | 4670.7 | 8.8303 | 33.4 | 1.892093 |
| 25 | 95.632589 | 29.824282 | 4422.8 | 8.8406 | 30.9 | 1.973964 |
| 26 | 95.639798 | 29.787401 | 4729.5 | 48.3505 | 26.6 | 2.041979 |
| 27 | 95.659655 | 29.800201 | 4936.4 | 3.5261 | 35.0 | 0.930059 |
| 28 | 95.668327 | 29.781601 | 4539.0 | 46.7083 | 25.6 | 0.193157 |
| 29 | 95.669538 | 29.810607 | 5023.6 | 12.1663 | 31.1 | 2.039853 |
| 30 | 95.671019 | 29.800941 | 5169.5 | 3.0766 | 28.8 | 1.974058 |
| 31 | 95.678182 | 29.828063 | 4591.2 | 0.9498 | 29.9 | 2.713688 |
| 32 | 95.680609 | 29.806841 | 4838.1 | 2.7429 | 36.5 | 1.314979 |
| 33 | 95.727180 | 29.725566 | 4980.4 | 33.3069 | 26.7 | 1.071893 |
| 34 | 95.730371 | 29.755582 | 4706.5 | 60.8256 | 31.9 | 0.92676 |
| 35 | 95.737528 | 29.664525 | 4800.8 | 36.0317 | 28.8 | 2.562716 |
| 36 | 95.740038 | 29.773499 | 4722.6 | 24.4568 | 30.0 | 1.389102 |
| 37 | 95.741864 | 29.713756 | 4312.9 | 51.9617 | 28.8 | 2.542675 |
| 38 | 95.742184 | 29.676272 | 4861.6 | 4.1665 | 31.1 | 0.864322 |
| 39 | 95.746570 | 29.740340 | 4942.6 | 27.9591 | 24.4 | 1.568109 |
| 40 | 95.750153 | 29.687916 | 4626.7 | 11.6295 | 40.2 | 0.827606 |
| 41 | 95.757995 | 29.772032 | 4556.6 | 24.8711 | 31.1 | 0.279302 |
| 42 | 95.762158 | 29.754353 | 4975.1 | 16.4861 | 24.4 | 2.466158 |
| 43 | 95.763649 | 29.741586 | 5040.5 | 9.1645 | 28.7 | 0.702743 |
| 44 | 95.770524 | 29.734573 | 4793.0 | 0.3985 | 29.8 | 2.391283 |
| 45 | 95.775943 | 29.735004 | 4846.4 | 1.2269 | 32.1 | 1.745905 |
| 46 | 95.778364 | 29.751224 | 4487.8 | 41.3721 | 34.2 | 2.58252 |
| 47 | 95.786473 | 29.740762 | 4861.1 | 17.9792 | 22.8 | 2.184233 |
| 48 | 96.131339 | 29.570754 | 4852.0 | 3.5016 | 20.0 | 0.638116 |
| 49 | 96.133998 | 29.554140 | 4893.7 | 116.6420 | 19.3 | 1.288635 |
| 50 | 96.138661 | 29.662152 | 4603.8 | 1.9179 | 34.1 | 2.756281 |
| 51 | 96.145016 | 29.659400 | 4336.4 | 0.9821 | 11.6 | 2.783246 |
| 52 | 96.167896 | 29.535407 | 4796.1 | 153.5633 | 20.4 | 1.517767 |
| 53 | 96.197237 | 29.544374 | 5116.7 | 2.6770 | 29.9 | 1.505184 |
| 54 | 96.202880 | 29.565596 | 4907.9 | 4.0733 | 30.3 | 1.740969 |
| 55 | 96.202920 | 29.551042 | 5111.1 | 2.8568 | 29.5 | 1.754286 |
| 56 | 96.343069 | 29.455380 | 4657.1 | 206.7379 | 18.2 | 2.923467 |
| 57 | 96.012106 | 29.574847 | 4898.9 | 170.3105 | 26.5 | 2.778631 |
| 58 | 96.015343 | 29.621585 | 5275.9 | 6.9486 | 26.3 | 0.806284 |
| 59 | 96.029292 | 29.607529 | 5324.7 | 0.2735 | 30.0 | 1.377133 |
| 60 | 96.032038 | 29.603079 | 5270.7 | 1.5175 | 32.9 | 1.809695 |
| 61 | 96.032302 | 29.613187 | 5323.3 | 19.9610 | 24.2 | 2.355766 |
| 62 | 96.035371 | 29.593456 | 5323.0 | 26.1572 | 36.2 | 2.034548 |
| 63 | 96.037331 | 29.656847 | 5764.8 | 3.7799 | 24.6 | 0.525738 |
| 64 | 96.037869 | 29.652486 | 5536.6 | 2.4257 | 36.6 | 1.665159 |
| 65 | 96.039469 | 29.630104 | 5370.1 | 100.4331 | 27.3 | 2.691794 |
| 66 | 96.061292 | 29.667231 | 4949.9 | 156.0992 | 28.7 | 0.946208 |
| 67 | 96.073148 | 29.702328 | 4581.3 | 1.2444 | 39.7 | 2.760761 |
| 68 | 96.077290 | 29.568875 | 4983.4 | 281.8942 | 18.7 | 0.53237 |
| 69 | 96.106870 | 29.597288 | 5303.2 | 10.3871 | 23.0 | 2.866037 |
| 70 | 96.112137 | 29.601066 | 5362.4 | 3.8040 | 26.6 | 2.382267 |
| 71 | 96.114074 | 29.662432 | 4937.3 | 46.3425 | 22.4 | 2.560311 |
| 72 | 96.114207 | 29.678538 | 5114.1 | 4.8475 | 16.5 | 1.69187 |
| 73 | 96.114572 | 29.685689 | 4927.0 | 1.1517 | 51.3 | 1.933324 |
| 74 | 96.115536 | 29.604541 | 5389.0 | 2.5162 | 19.9 | 2.581221 |
| 75 | 96.122348 | 29.650221 | 4783.1 | 10.2224 | 17.9 | 0.124409 |
References
- Williams, R.S., Jr.; Ferrigno, J.G. (Eds.) Satellite Image Atlas of Glaciers of the World; US Geological Survey: Reston, VA, USA, 1988.
- Zhang, Y.; Zhang, L.; He, Y.; Yao, S.; Yang, W.; Cao, S.; Sun, Q. Analysis of the Future Trends of Typical Mountain Glacier Movements along the Sichuan-Tibet Railway Based on ConvGRU Network. Int. J. Digit. Earth 2023, 16, 762–780. [Google Scholar] [CrossRef]
- Ahmed, R.; Wani, G.F.; Ahmad, S.T.; Sahana, M.; Singh, H.; Ahmed, P. A Review of Glacial Lake Expansion and Associated Glacial Lake Outburst Floods in the Himalayan Region. Earth Syst. Environ. 2021, 5, 695–708. [Google Scholar] [CrossRef]
- Brown, G.H. Glacier Meltwater Hydrochemistry. Appl. Geochem. 2002, 17, 855–883. [Google Scholar] [CrossRef]
- Byers, A.C.; Shugar, D.H.; Chand, M.B.; Portocarrero, C.; Shrestha, M.; Rounce, D.R.; Watanabe, T. Three Recent and Lesser-Known Glacier-Related Flood Mechanisms in High Mountain Environments. Mt. Res. Dev. 2022, 42, A12–A22. [Google Scholar] [CrossRef]
- Bajracharya, S.R.; Mool, P. Glaciers, Glacial Lakes and Glacial Lake Outburst Floods in the Mount Everest Region, Nepal. Ann. Glaciol. 2009, 50, 81–86. [Google Scholar] [CrossRef]
- Schmidt, S.; Nüsser, M.; Baghel, R.; Dame, J. Cryosphere Hazards in Ladakh: The 2014 Gya Glacial Lake Outburst Flood and Its Implications for Risk Assessment. Nat. Hazards 2020, 104, 2071–2095. [Google Scholar] [CrossRef]
- Richardson, S.D.; Reynolds, J.M. An Overview of Glacial Hazards in the Himalayas. Quat. Int. 2000, 65–66, 31–47. [Google Scholar] [CrossRef]
- Kougkoulos, I.; Cook, S.J.; Edwards, L.A.; Clarke, L.J.; Symeonakis, E.; Dortch, J.M.; Nesbitt, K. Modelling Glacial Lake Outburst Flood Impacts in the Bolivian Andes. Nat. Hazards 2018, 94, 1415–1438. [Google Scholar] [CrossRef]
- Huggel, C.; Kääb, A.; Haeberli, W.; Krummenacher, B. Regional-Scale GIS-Models for Assessment of Hazards from Glacier Lake Outbursts: Evaluation and Application in the Swiss Alps. Nat. Hazards Earth Syst. Sci. 2003, 3, 647–662. [Google Scholar] [CrossRef]
- Abdel-Fattah, D.; Trainor, S.; Hood, E.; Hock, R.; Kienholz, C. User Engagement in Developing Use-Inspired Glacial Lake Outburst Flood Decision Support Tools in Juneau and the Kenai Peninsula, Alaska. Front. Earth Sci. 2021, 9, 635163. [Google Scholar] [CrossRef]
- Song, C.; Sheng, Y.; Ke, L.; Nie, Y.; Wang, J. Glacial Lake Evolution in the Southeastern Tibetan Plateau and the Cause of Rapid Expansion of Proglacial Lakes Linked to Glacial-Hydrogeomorphic Processes. J. Hydrol. 2016, 540, 504–514. [Google Scholar] [CrossRef]
- Osti, R.; Egashira, S. Hydrodynamic Characteristics of the Tam Pokhari Glacial Lake Outburst Flood in the Mt. Everest Region, Nepal. Hydrol. Process. 2009, 23, 2943–2955. [Google Scholar] [CrossRef]
- Cheng, Z.; Shi, L.; Liu, J. Distribution and Change of Glacier Lakes in the Upper Palongzangbu River. Bull. Soil Water Conserv. 2012, 32, 8–12. [Google Scholar]
- Yamada, T. Glacier Lakes and Outburst Floods in the Nepal Himalaya. IAHS Pub. 1993, 218, 319–330. [Google Scholar]
- Kattelmann, R. Glacial Lake Outburst Floods in the Nepal Himalaya: A Manageable Hazard? Nat. Hazards 2003, 28, 145–154. [Google Scholar] [CrossRef]
- Yongbo, T.I.E.; Xianzheng, Z.; Lingfeng, G.; Yanchao, G.A.O.; Yongjian, B.A.I.; Wei, X.U.; Renji, B.A.; Zongliang, L.I.; Hua, G.E. Research on the Pattern of Typical Geohazard Chains in the Southwest Mountainous Region, China. J. Geomech. 2022, 28, 1071–1080. [Google Scholar] [CrossRef]
- Shi, Y.F. An Exploring Innovative Research Case: Recollection of the Batura Glacier Expedition and Research on Restoring Karakorum Highway Project. J. Glaciol. Geocryol. 2003, 25, 479–481. [Google Scholar]
- Sharafat, A.; Khan, M.S.; Latif, K.; Tanoli, W.A.; Park, W.; Seo, J. BIM-GIS-Based Integrated Framework for Underground Utility Management System for Earthwork Operations. Appl. Sci. 2021, 11, 5721. [Google Scholar] [CrossRef]
- Gao, Y.; Liu, S.; Qi, M.; Xie, F.; Wu, K.; Zhu, Y. Glacier-Related Hazards Along the International Karakoram Highway: Status and Future Perspectives. Front. Earth Sci. 2021, 9, 611501. [Google Scholar] [CrossRef]
- Sun, Y.; Ge, Y.; Chen, X.; Zeng, L.; Liang, X. Risk Assessment of Debris Flow along the Northern Line of the Sichuan-Tibet Highway. Geomat. Nat. Hazards Risk 2023, 14, 2195531. [Google Scholar] [CrossRef]
- Lin, M.; Gong, C.; Huang, H.; Yang, D. Damage Model and the Influence Factors of Mitigation Engineering against Glacial Debris Flow in the Parlung River Basin, SE Tibetan Plateau. Water 2023, 15, 1098. [Google Scholar] [CrossRef]
- Kitzberger, T. Ecotones as complex arenas of disturbance, climate, and human impacts: The trans-Andean forest-steppe ecotone of northern Patagonia. In Ecotones between Forest and Grassland; Springer: New York, NY, USA, 2012; pp. 59–88. [Google Scholar]
- Sharafat, A.; Latif, K.; Seo, J. Risk Analysis of TBM Tunneling Projects Based on Generic Bow-Tie Risk Analysis Approach in Difficult Ground Conditions. Tunn. Undergr. Sp. Technol. 2021, 111, 103860. [Google Scholar] [CrossRef]
- Sharafat, A.; Tanoli, W.A.; Raptis, G.; Seo, J.W. Controlled Blasting in Underground Construction: A Case Study of a Tunnel Plug Demolition in the Neelum Jhelum Hydroelectric Project. Tunn. Undergr. Sp. Technol. 2019, 93, 103098. [Google Scholar] [CrossRef]
- Sharafat, A.; Khan, M.S.; Latif, K.; Seo, J. BIM-Based Tunnel Information Modeling Framework for Visualization, Management, and Simulation of Drill-and-Blast Tunneling Projects. J. Comput. Civ. Eng. 2021, 35, 04020068. [Google Scholar] [CrossRef]
- Lu, C.; Cai, C. Challenges and Countermeasures for Construction Safety during the Sichuan–Tibet Railway Project. Engineering 2019, 5, 833–838. [Google Scholar] [CrossRef]
- Ding, Y.; Liu, S.; Li, J.; Shangguan, D. The Retreat of Glaciers in Response to Recent Climate Warming in Western China. Ann. Glaciol. 2006, 43, 97–105. [Google Scholar] [CrossRef]
- Quesada-Román, A.; Ballesteros-Cánovas, J.A.; Stoffel, M.; Zamorano-Orozco, J.J. Glacial Geomorphology of the Chirripó National Park, Costa Rica. J. Maps 2019, 15, 538–545. [Google Scholar] [CrossRef]
- Shi, Y.F.; Cui, Z.J.; Su, Z. The Quaternary Glaciations and Environmental Variations in China; Hebei Science and Technology Press: Shijiazhuang, China, 2006; pp. 173–179. [Google Scholar]
- Harbor, J.M.; Hallet, B.; Raymond, C.F. A Numerical Model of Landform Development by Glacial Erosion. Nature 1988, 333, 347–349. [Google Scholar] [CrossRef]
- Bolch, T.; Loibl, D. GIS for Glaciers and Glacial Landforms; Elsevier: Amsterdam, The Netherlands, 2017; Volume 3, ISBN 9780128046609. [Google Scholar]
- Spotila, J.A. 2.24—Glacially-Influenced Tectonic Geomorphology: The Impact of Glacial Erosion on Topography and Orogenic Systems, 2nd ed.; Shroder, J., Ed.; Academic Press: Oxford, UK, 2022; pp. 671–694. ISBN 978-0-12-818235-2. [Google Scholar]
- Anderson, R.S.; Molnar, P.; Kessler, M.A. Features of Glacial Valley Profiles Simply Explained. J. Geophys. Res 2006, 111, 1004. [Google Scholar] [CrossRef]
- Herman, F.; Beaud, F.; Champagnac, J.D.; Lemieux, J.M.; Sternai, P. Glacial Hydrology and Erosion Patterns: A Mechanism for Carving Glacial Valleys. Earth Planet. Sci. Lett. 2011, 310, 498–508. [Google Scholar] [CrossRef]
- Allred, K.J.; Luo, W. Quantifying and Predicting the Glacial Extent Using Valley Morphometry and Data-Mining Techniques. Ann. GIS 2016, 22, 203–214. [Google Scholar] [CrossRef]
- Meschede, M. Takonische Orogenese, f.,(Taconic Orogeny); Springer Spektrum: Berlin, Germany, 2021. [Google Scholar]
- Leith, K.; Moore, J.R.; Amann, F.; Loew, S. Subglacial Extensional Fracture Development and Implications for Alpine Valley Evolution. J. Geophys. Res. Earth Surf. 2014, 119, 62–81. [Google Scholar] [CrossRef]
- Hu, G.; Yi, C.L.; Zhang, J.F.; Liu, J.H.; Jiang, T.; Qin, X. Optically Stimulated Luminescence Dating of a Moraine and a Terrace in Laohugou Valley, Western Qilian Shan, Northeastern Tibet. Quat. Int. 2014, 321, 37–49. [Google Scholar] [CrossRef]
- Liu, W.; Lai, Z.; Hu, K.; Ge, Y.; Cui, P.; Zhang, X.; Liu, F. Age and Extent of a Giant Glacial-Dammed Lake at Yarlung Tsangpo Gorge in the Tibetan Plateau. Geomorphology 2015, 246, 370–376. [Google Scholar] [CrossRef]
- Wang, H.; Wang, P.; Hu, G.; Ge, Y.; Yuan, R. An Early Holocene River Blockage Event on the Western Boundary of the Namche Barwa Syntaxis, Southeastern Tibetan Plateau. Geomorphology 2021, 395, 107990. [Google Scholar] [CrossRef]
- Yuan, G.; Zeng, Q. Glacier-Dammed Lake in Southeastern Tibetan Plateau during the Last Glacial Maximum. J. Geol. Soc. India 2012, 79, 295–301. [Google Scholar] [CrossRef]
- Yao, T.; Xue, Y.; Chen, D.; Chen, F.; Thompson, L.; Cui, P.; Koike, T.; Lau, W.K.M.; Lettenmaier, D.; Mosbrugger, V.; et al. Recent Third Pole’s Rapid Warming Accompanies Cryospheric Melt and Water Cycle Intensification and Interactions between Monsoon and Environment: Multidisciplinary Approach with Observations, Modeling, and Analysis. Bull. Am. Meteorol. Soc. 2019, 100, 423–444. [Google Scholar] [CrossRef]
- Ye, Q.; Zong, J.; Tian, L.; Cogley, J.G.; Song, C.; Guo, W. Glacier Changes on the Tibetan Plateau Derived from Landsat Imagery: Mid-1970s–2000–13. J. Glaciol. 2017, 63, 273–287. [Google Scholar] [CrossRef]
- Van Wyk De Vries, M.; Wickert, A.D. Glacier Image Velocimetry: An Open-Source Toolbox for Easy and Rapid Calculation of High-Resolution Glacier Velocity Fields. Cryosphere 2021, 15, 2115–2132. [Google Scholar] [CrossRef]
- Kellerer-pirklbauer, A.; Kaufmann, V. About the Relationship between Rock Glacier Velocity and Climate Parameters in Central Austria. Austrian J. Earth Sci. 2012, 105. [Google Scholar]
- Benoit, L.; Dehecq, A.; Pham, H.T.; Vernier, F.; Trouvé, E.; Moreau, L.; Martin, O.; Thom, C.; Pierrot-Deseilligny, M.; Briole, P. Multi-Method Monitoring of Glacier d’Argentière Dynamics. Ann. Glaciol. 2015, 56, 118–128. [Google Scholar] [CrossRef]
- Tiwari, R.K.; Gupta, R.P.; Arora, M.K. Estimation of Surface Ice Velocity of Chhota-Shigri Glacier Using Sub-Pixel ASTER Image Correlation. Curr. Sci. 2014, 106, 853–859. [Google Scholar]
- Nela, B.R.; Singh, G.; Kulkarni, A.V.; Malik, K. Optimum Conditions for Differential SAR Interferometry Technique to Estimate Himalayan Glacier Velocity. ISPRS Ann. Photogramm. Remote Sens. Spat. Inf. Sci. 2018, 4, 137–140. [Google Scholar] [CrossRef]
- Liu, J.; Zhao, J.; Li, Z.; Yang, Z.; Yang, J.; Li, G. Three-Dimensional Flow Velocity Estimation of Mountain Glacier Based on SAR Interferometry and Offset-Tracking Technology: A Case of the Urumqi Glacier No.1. Water 2022, 14, 1779. [Google Scholar] [CrossRef]
- James, L.A. Earth Surface Processes and Landforms Polynomial and Power Functions for Glacial Valley Cross-Section Morphology. Earth Surf. Process. Landf. 1996, 21, 413–432. [Google Scholar] [CrossRef]
- LiYingkui, L. Discussion on the Crosssection Features of Glacial Valley. J. Glaciol. Geocryol. 2000, 22, r171–r177. [Google Scholar]
- Yang, S.; Shi, Y. Three-Dimensional Numerical Simulation of Glacial Trough Forming Process. Sci. China Earth Sci. 2015, 58, 1656–1668. [Google Scholar] [CrossRef]
- Kassab, C.; Harbor, J. Alternative Coordinate Systems for Analyzing Cross-Section Shapes of Glaciated Valleys: A Case Study from the Dalijia Mountains, China. Phys. Geogr. 2013, 34, 108–123. [Google Scholar] [CrossRef]
- Al-Gurairy, A.S.Y. The Evidences of Neotectonics Activations by Using Geomorphological Characteristics and Remote Sensing, and Use That in Exploration of Oil and Gas: A Case Study in Al-Amghr Valley–Southern Desert of Iraq. Al-Qadisiyah J. Humanit. Sci. 2023, 26, 37–56. [Google Scholar]
- Cauvy-Fraunié, S.; Dangles, O. A Global Synthesis of Biodiversity Responses to Glacier Retreat. Nat. Ecol. Evol. 2019, 3, 1675–1685. [Google Scholar] [CrossRef]
- Lekstutyte, I.; Gadeikis, S.; Skuodis, S. Some Mechanical Properties of Medininkai Glacial Period Overconsolidated Moraine Clay. In Proceedings of the 26th European Young Geotechnical Engineers Conference, Graz, Austria, 11–14 September 2018. [Google Scholar]
- Bolch, T.; Yao, T.; Kang, S.; Buchroithner, M.F.; Scherer, D.; Maussion, F.; Huintjes, E.; Schneider, C. A Glacier Inventory for the Western Nyainqentanglha Range and the Nam Co Basin, Tibet, and Glacier Changes 1976–2009. Cryosph 2010, 4, 419–433. [Google Scholar] [CrossRef]
- Mehta, S.R.; Cannon, C.P.; Fox, K.A.A.; Wallentin, L.; Boden, W.E.; Spacek, R.; Widimsky, P.; McCullough, P.A.; Hunt, D.; Braunwald, E. Routine vs Selective Invasive Strategies in Patients with Acute Coronary Syndromes: A Collaborative Meta-Analysis of Randomized Trials. JAMA 2005, 293, 2908–2917. [Google Scholar] [CrossRef] [PubMed]
Disclaimer/Publisher’s Note: The statements, opinions and data contained in all publications are solely those of the individual author(s) and contributor(s) and not of MDPI and/or the editor(s). MDPI and/or the editor(s) disclaim responsibility for any injury to people or property resulting from any ideas, methods, instructions or products referred to in the content. |
© 2023 by the authors. Licensee MDPI, Basel, Switzerland. This article is an open access article distributed under the terms and conditions of the Creative Commons Attribution (CC BY) license (https://creativecommons.org/licenses/by/4.0/).