Article

How Do the Start Date, End Date, and Frequency of Precipitation Change across China under Warming?

1
State Key Laboratory of Resources and Environmental Information System, Institute of Geographic Sciences and Natural Resources Research, Chinese Academy of Sciences, Beijing 100101, China
2
College of Resources and Environment, University of Chinese Academy of Sciences, Beijing 100101, China
3
Jiangsu Center for Collaborative Innovation in Geographic Information Resource Development and Application, Nanjing 210023, China
4
First Institute of Oceanography, Ministry of Natural Resources, Qingdao 266061, China
*
Author to whom correspondence should be addressed.
Remote Sens. 2023, 15(16), 4057; https://doi.org/10.3390/rs15164057
Submission received: 31 May 2023 / Revised: 9 August 2023 / Accepted: 14 August 2023 / Published: 16 August 2023

Abstract

:
Variations in precipitation have a great influence on human society and the natural environment. Existing studies have provided substantial information regarding variations in the magnitude, frequency, and intensity of precipitation. However, little is known about how the start and end dates of precipitation change, which could offer crucial insights for related studies in agriculture, hydrology, and other related disciplines. Here, we present an analysis of variations in the start date, end date, and frequency of different precipitation intensities, using a widely used gauge-satellite-reanalysis-based merging product, during the latest period, 1980–2022, across China. The results show that the spatial–temporal variations in the start date, end date, and frequency of different precipitation intensities were complex among regions. For example, in northeast and northwest China, light precipitation (LP) started earlier and increased in frequency during the study period. In the Tibetan Plateau, precipitation at different intensities levels started earlier, heavy precipitation (HP) and violent precipitation ended earlier, and the frequency of LP and moderate precipitation increased significantly. The start date of HP shifted earlier in Southeast China (−0.28 days/year). Our findings could be helpful in providing a comprehensive understanding of precipitation changes under global warming and highlight the need to pay close attention to these precipitation changes in the future.

1. Introduction

Precipitation is essential for the hydrologic cycle and is a crucial indicator in climate change research, with significant impacts on agriculture, ecosystems, and hydrology [1,2,3]. The Intergovernmental Panel on Climate Change (IPCC) Sixth Assessment Report [4] indicates that we are now warming at an unprecedented rate, around 2.0 °F (1.1 °C) higher than in 1850–1900. This warming, caused by increasing atmospheric radiation and alterations in energy partitioning, is expected to affect precipitation and evaporation in the hydrological cycle [5]. According to the Clausius–Clapeyron equation, for every 1 °C rise in temperature, there could be an approximate 7% rise in precipitation, due to increased humidity-holding capacity in the atmosphere [6]. Changes in precipitation show clear regional characteristics [7,8], resulting in distinct disasters in different climatic regions and posing major challenges to socio-economic systems, but these have not yet been fully understood.
Precipitation changes encompass various aspects including extent, intensity, frequency, and duration beyond the total amount. Variations in any of these aspects may have impacts on both natural ecosystems and human societies. For example, precipitation timing alterations could have a substantial effect on water partitioning into evapotranspiration and runoff, and consequent stream discharge and eco-environment responses, even if the annual total precipitation remains unchanged [9]. Certain studies have demonstrated that later or earlier temporal trends in precipitation change can play a crucial role in phenology [10]. Previous research has extensively investigated alterations in precipitation totals, frequency, and intensity at various time scales [9,11,12,13], looking at the global hemispheres [14,15], different continents [15,16,17], and particular regions [18,19,20]. However, relevant records of the start and end dates of precipitation, and the temporal characteristics over a long time period are lacking at present. These factors have a great influence on regional water supplies and natural ecosystems, but they have not received sufficient attention to date.
The use of remote sensing technology presents an unparalleled opportunity to analyze precipitation patterns over particular regions at a variety of spatial scales [21,22,23,24]. A range of satellite-based precipitation datasets have been developed since the 1980s [21,24,25]. However, the imprecise resolution and uncertainties caused by sensors, weather conditions, and retrieval algorithms make it difficult to reflect the variability in precipitation especially at local or regional scales. Reanalysis datasets, generally based on fully coupled ocean–land–atmosphere models, can also provide continuous precipitation fields to further assess their spatial–temporal variations but still suffer from large uncertainties mainly due to the natural variability, limitations of model resolution and representation, external forcing, initial conditions, and parameterizations [17,26,27,28,29]. To overcome these limitations, the Multi-Source Weighted-Ensemble Precipitation (MSWEP) merges gauge-based, satellite-based, and reanalysis-based data, including GPCC, ERA-Interim, GPCC FDR, GSMaO, JRA-55, TMPA3B42RT, WorldClim, GridSat, and daily gauge data, ensuring reliable global precipitation estimates [30]. By selecting the high-quality precipitation data sources available according to timescale and location, the performance of MSWEP is overall superior [31], as demonstrated by extensive evaluations of precipitation products [30,31,32]. This study uses the latest version of MSWEP (MSWEP_V2), with a 0.1° spatial resolution. Uninterrupted precipitation products from 1980 until the present can be utilized to evaluate trends.
In this study, we present the first investigation of the variations in the start date, end date, and frequency of daily precipitation at different intensity levels based on MSWEP precipitation products across China. According to the National Meteorological Information Center of the China Meteorological Administration (CMA), precipitation intensity was classified as light precipitation (LP, 1 ≤ daily precipitation < 10 mm), moderate precipitation (MP, 10 mm ≤ daily precipitation < 25 mm), heavy precipitation (HP, 25 mm ≤ daily precipitation < 50 mm), and violent precipitation (VP, daily precipitation ≥ 50). The later or earlier trends in start date and end date and the change trends in the frequency of daily precipitation under different precipitation intensity levels were explored using the Mann–Kendall statistical test and Sen’s slope, together with the spatial analysis tools in ArcGIS software 10.6. The findings of our study could facilitate agricultural management and water resources’ management, as well as related adaptation strategies.

2. Materials and Methods

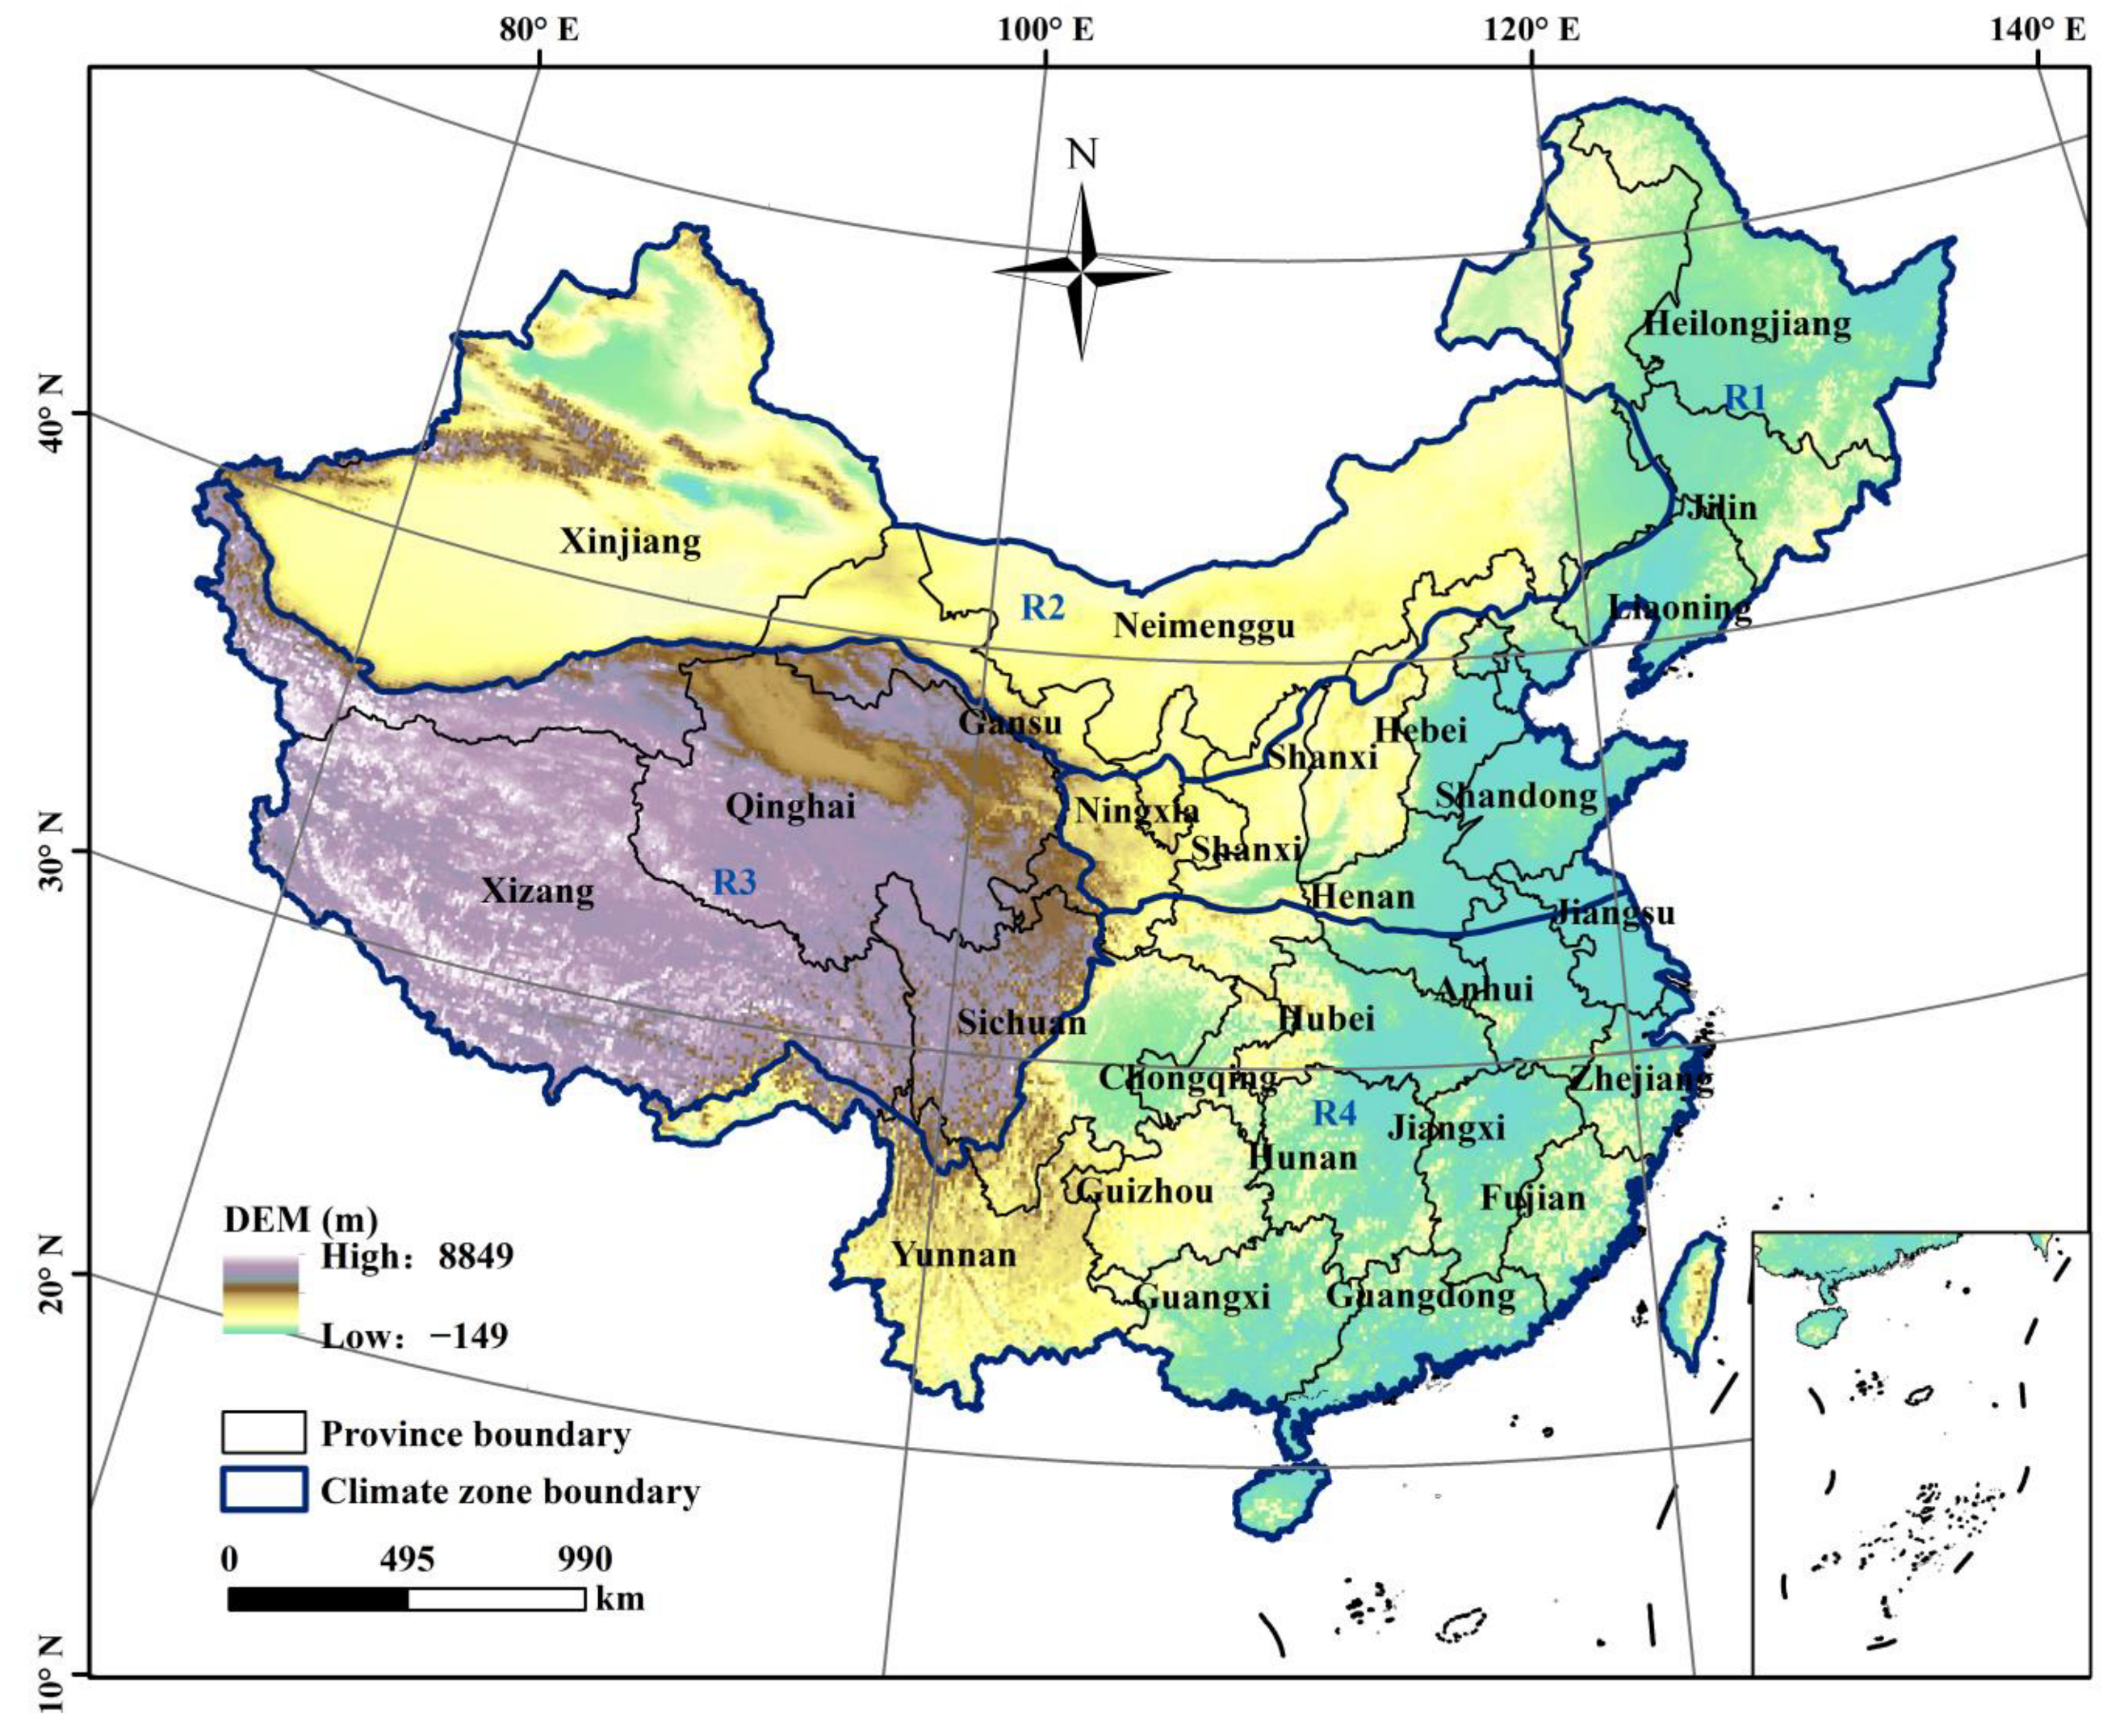
2.1. Study Area and Data

The scope of our study was centered on mainland China (3°51′–53°33′N, 73°33′–135°05′E). Located in East Asia, China covers complex terrains and a diverse geographical landscape. It spans approximately 9.6 million square kilometers and has a coastline stretching over 18,000 km. The elevation of China ranges from less than −100 m to more than 8000 m. The country’s geographic position and topography contribute to significant differences between land and sea areas, as well as the presence of three major topographic steps: the Tibetan Plateau, the Loess Plateau, and the Eastern Plains. The eastern and southern regions are characterized by a relatively flat and low-lying terrain near the coast, rising gradually towards the interior. The eastern plains, including the North China Plain, Yangtze River Delta, and Pearl River Delta, are major agricultural and industrial areas with abundant precipitation. These areas receive substantial precipitation due to the influence of monsoons and proximity to the ocean. In contrast, the western and northern parts of China consist of high plateaus, mountains, and deserts. The most prominent feature is the Tibetan Plateau, located in southwestern China. The Tibetan Plateau significantly affects the climate and precipitation patterns in China. The three major topographic steps in China also contribute to the heterogeneity of precipitation distribution. The Tibetan Plateau acts as a barrier blocking the moisture-laden winds from the Indian Ocean, resulting in arid and semi-arid conditions in northwestern and northern China. The Loess Plateau, located in north–central China, experiences significant erosion and soil depostion, creating a unique landscape and affecting local weather patterns. The Eastern Plains, with their proximity to the coast, receive more moisture and have a more temperate climate compared to other regions. Overall, being strongly affected by the monsoon and topography of China, the precipitation shows high spatial–temporal heterogeneity and clear seasonality. The climate is generally influenced by the eastern monsoon system, with high precipitation in the southeast, and lower precipitation in northwestern China. According to quantitative analysis, in China, precipitation and extreme precipitation have increased by approximately 10% and 23%, respectively, for each increase of 1 °C in surface temperature [33]. Although precipitation changes such as a decreased frequency, increased intensity, and greater occurrence of extreme precipitation have been observed [8,34,35], some gaps remain in our understanding of how precipitation changes under global warming. To obtain a more complete picture of how precipitation changes in China, examining other precipitation characteristics is crucial as it enables us to detect any alteration in precipitation patterns and obtain additional information about precipitation variations in China.
To facilitate data summarization, mainland China has been divided into four climate subregions (Figure 1) that exhibit relatively consistent weather patterns. These regions, namely the Northeast Monsoon Region (R1), Northwest Arid Region (R2), Tibetan Plateau (R3), and Southeast Monsoon Region (R4), have been identified based on climate characteristics observed by various researchers [36,37]. In addition, Figure 1 also shows the province boundary to clearly assess the start date, end date and frequency of daily precipitation at the provincial level across China. Such comparisons can highlight the spatial variability of precipitation patterns across the country, providing valuable information for regional climate change studies, eco-environmental research and agricultural production.
MSWEP is a recently launched precipitation dataset that spans the period from 1979 to the present with a temporal resolution of 3 h and 0.1° spatial resolution [30]. This dataset integrates the strengths of gauge, satellite, and reanalysis data, including two gauge observation datasets, two reanalysis datasets and three satellite products, to provide reliable precipitation estimates worldwide. A detailed description of the steps involved in the production of MSWEP V2.1 can be found in Beck et al. [38]. The process consists of the following main steps: (1) quality control of gauge data, (2) inference of gauge reporing times, (3) rainfall estimation using infrared data from the GridSat B1 archive [39] to supplement the reanalysis and gauge data in the pre-TRMM era, (4) assessment of satellite and reanalysis precipitation datasets based on gauge data, (5) determination of weights and wet-day biases for each of the non-gauge-based satellite and reanalysis precipitation datasets, (6) estimation of long-term mean precipitation using the WorldClim dataset [40], (7) correction of the precipitation frequency of the two reanalysis datasets and harmonization of the six non-gauge-based precipitation datasets incorporated in MSWEP V2.1, (8) calculation of the 3 h reference precipitation distribution; (9) merging of satellite and reanalysis precipitation datasets through weighted averaging using the interpolated weight maps, and (10) correction of the merged 3 h satellite and reanalysis-based precipitation data using gauge precipitation observations. Compared to the MSWEP version 1, the improvements in MSWEP version 2 mainly include: (i) the introduction of cumulative distribution function (CDF) and P frequency corrections to account for the spurious drizzle, attenuated peaks, and temporal discontinuities evident in version 1 [41,42]; (ii) an increase in the spatial resolution from 0.25° to 0.1° to enhance the local relevance of the P estimates (especially important for high-water-yield mountainous regions); (iii) the inclusion of ocean areas to enable oceanic studies and terrestrial hydrology studies for coastal areas and small islands; (iv) the addition of P estimates derived from Gridded Satellite (GridSat) thermal infrared (IR) imagery [39] for the pre-TRMM era to supplement the reanalysis and gauge data; (v) the adoption of a daily gauge correction scheme that accounts for regional differences in reporting times to minimize timing mismatches when applying the daily gauge corrections; (vi) the utilization of a large database of daily gauge observations compiled from several sources to replace the 0.5° Climate Prediction Center (CPC) unified dataset [43,44]; and (vii) an extension of the data record to 2017, as MSWEP V1 concluded in 2015. Since its initial release in 2016, MSWEP had been successfully employed at both global and regional levels for various purposes, such as examining rainfall diurnal variations, exploring lake dynamics, modeling soil moisture and evaporation, estimating plant rooting depth, and reanalyzing water resources [45,46,47,48,49].

2.2. Method

In this study, the trends of the start date and end date of daily precipitation at different levels are investigated using the Mann–Kendall (MK) statistical test and Sen’s slope [50]. Before using MK, the possible existing serial correlations were examined and removed from the original data series using a pre-whitening method [51]. Given observations x 1 , x 2 , x n , the statistic index of the MK test can be calculated as follows:
S = i = 1 n 1 j = i + 1 n sgn ( x j x i ) ,   sgn ( x j x i ) = { 1 , x j x i > 0 0 , x j x i = 0 1 , x j x i < 0
where x j and x i are the j th and i th period values. If the sample size exceeds ten, the MK test can be determined using a normal distribution with E ( S ) = 0 and var ( S ) = ( n ( n 1 ) ( 2 n + 5 ) i = 1 m t i ( t i 1 ) ( 2 t i + 5 ) ) 18 , where m is the tied group number, t i is the observation number in the i th group. The stand normal variable is derived as:
Z = { S 1 var ( S ) i f S > 0 0 i f S = 0 S + 1 var ( S ) i f S < 0
Positive values of Z indicate increasing trends, while negative Z values show decreasing trends. When | Z | > z 1 α 2 , the null hypothesis will be rejected at α level of significance, and α = 0.05 in this study.
The equation for calculating slope is defined as:
S l o p e = M e d i a n [ ( X j X i ) / ( j i ) ]

3. Results

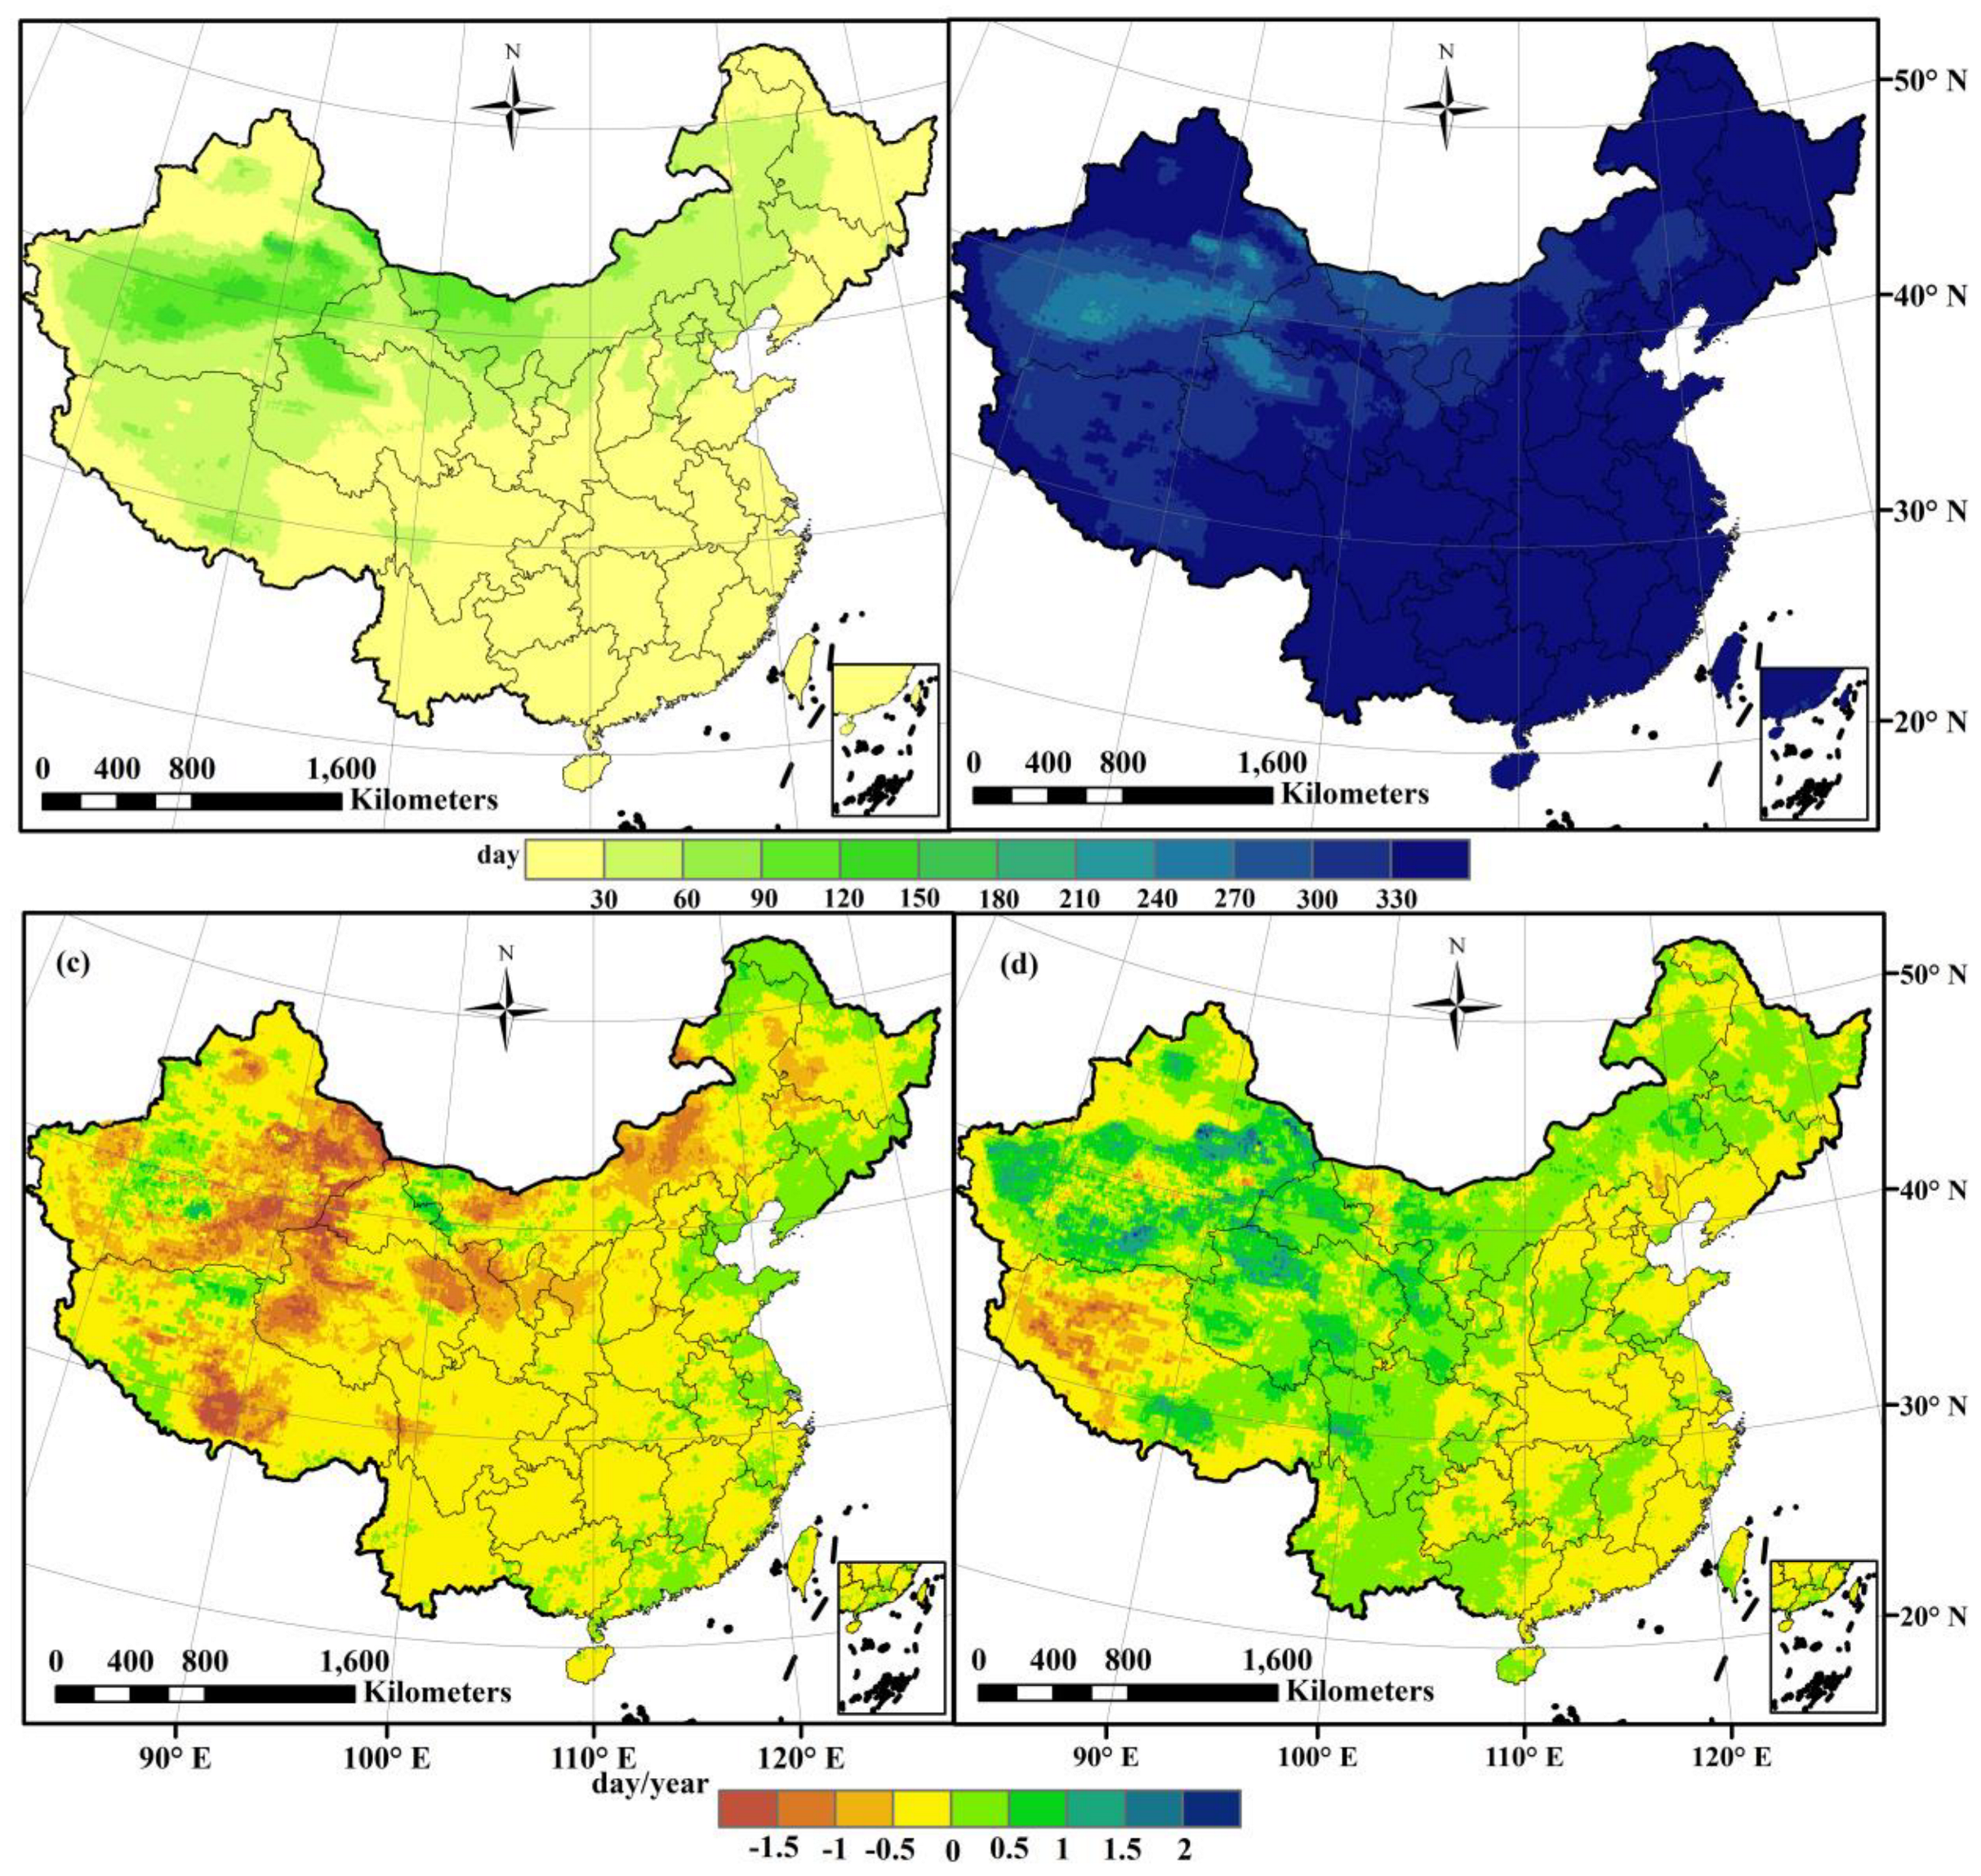
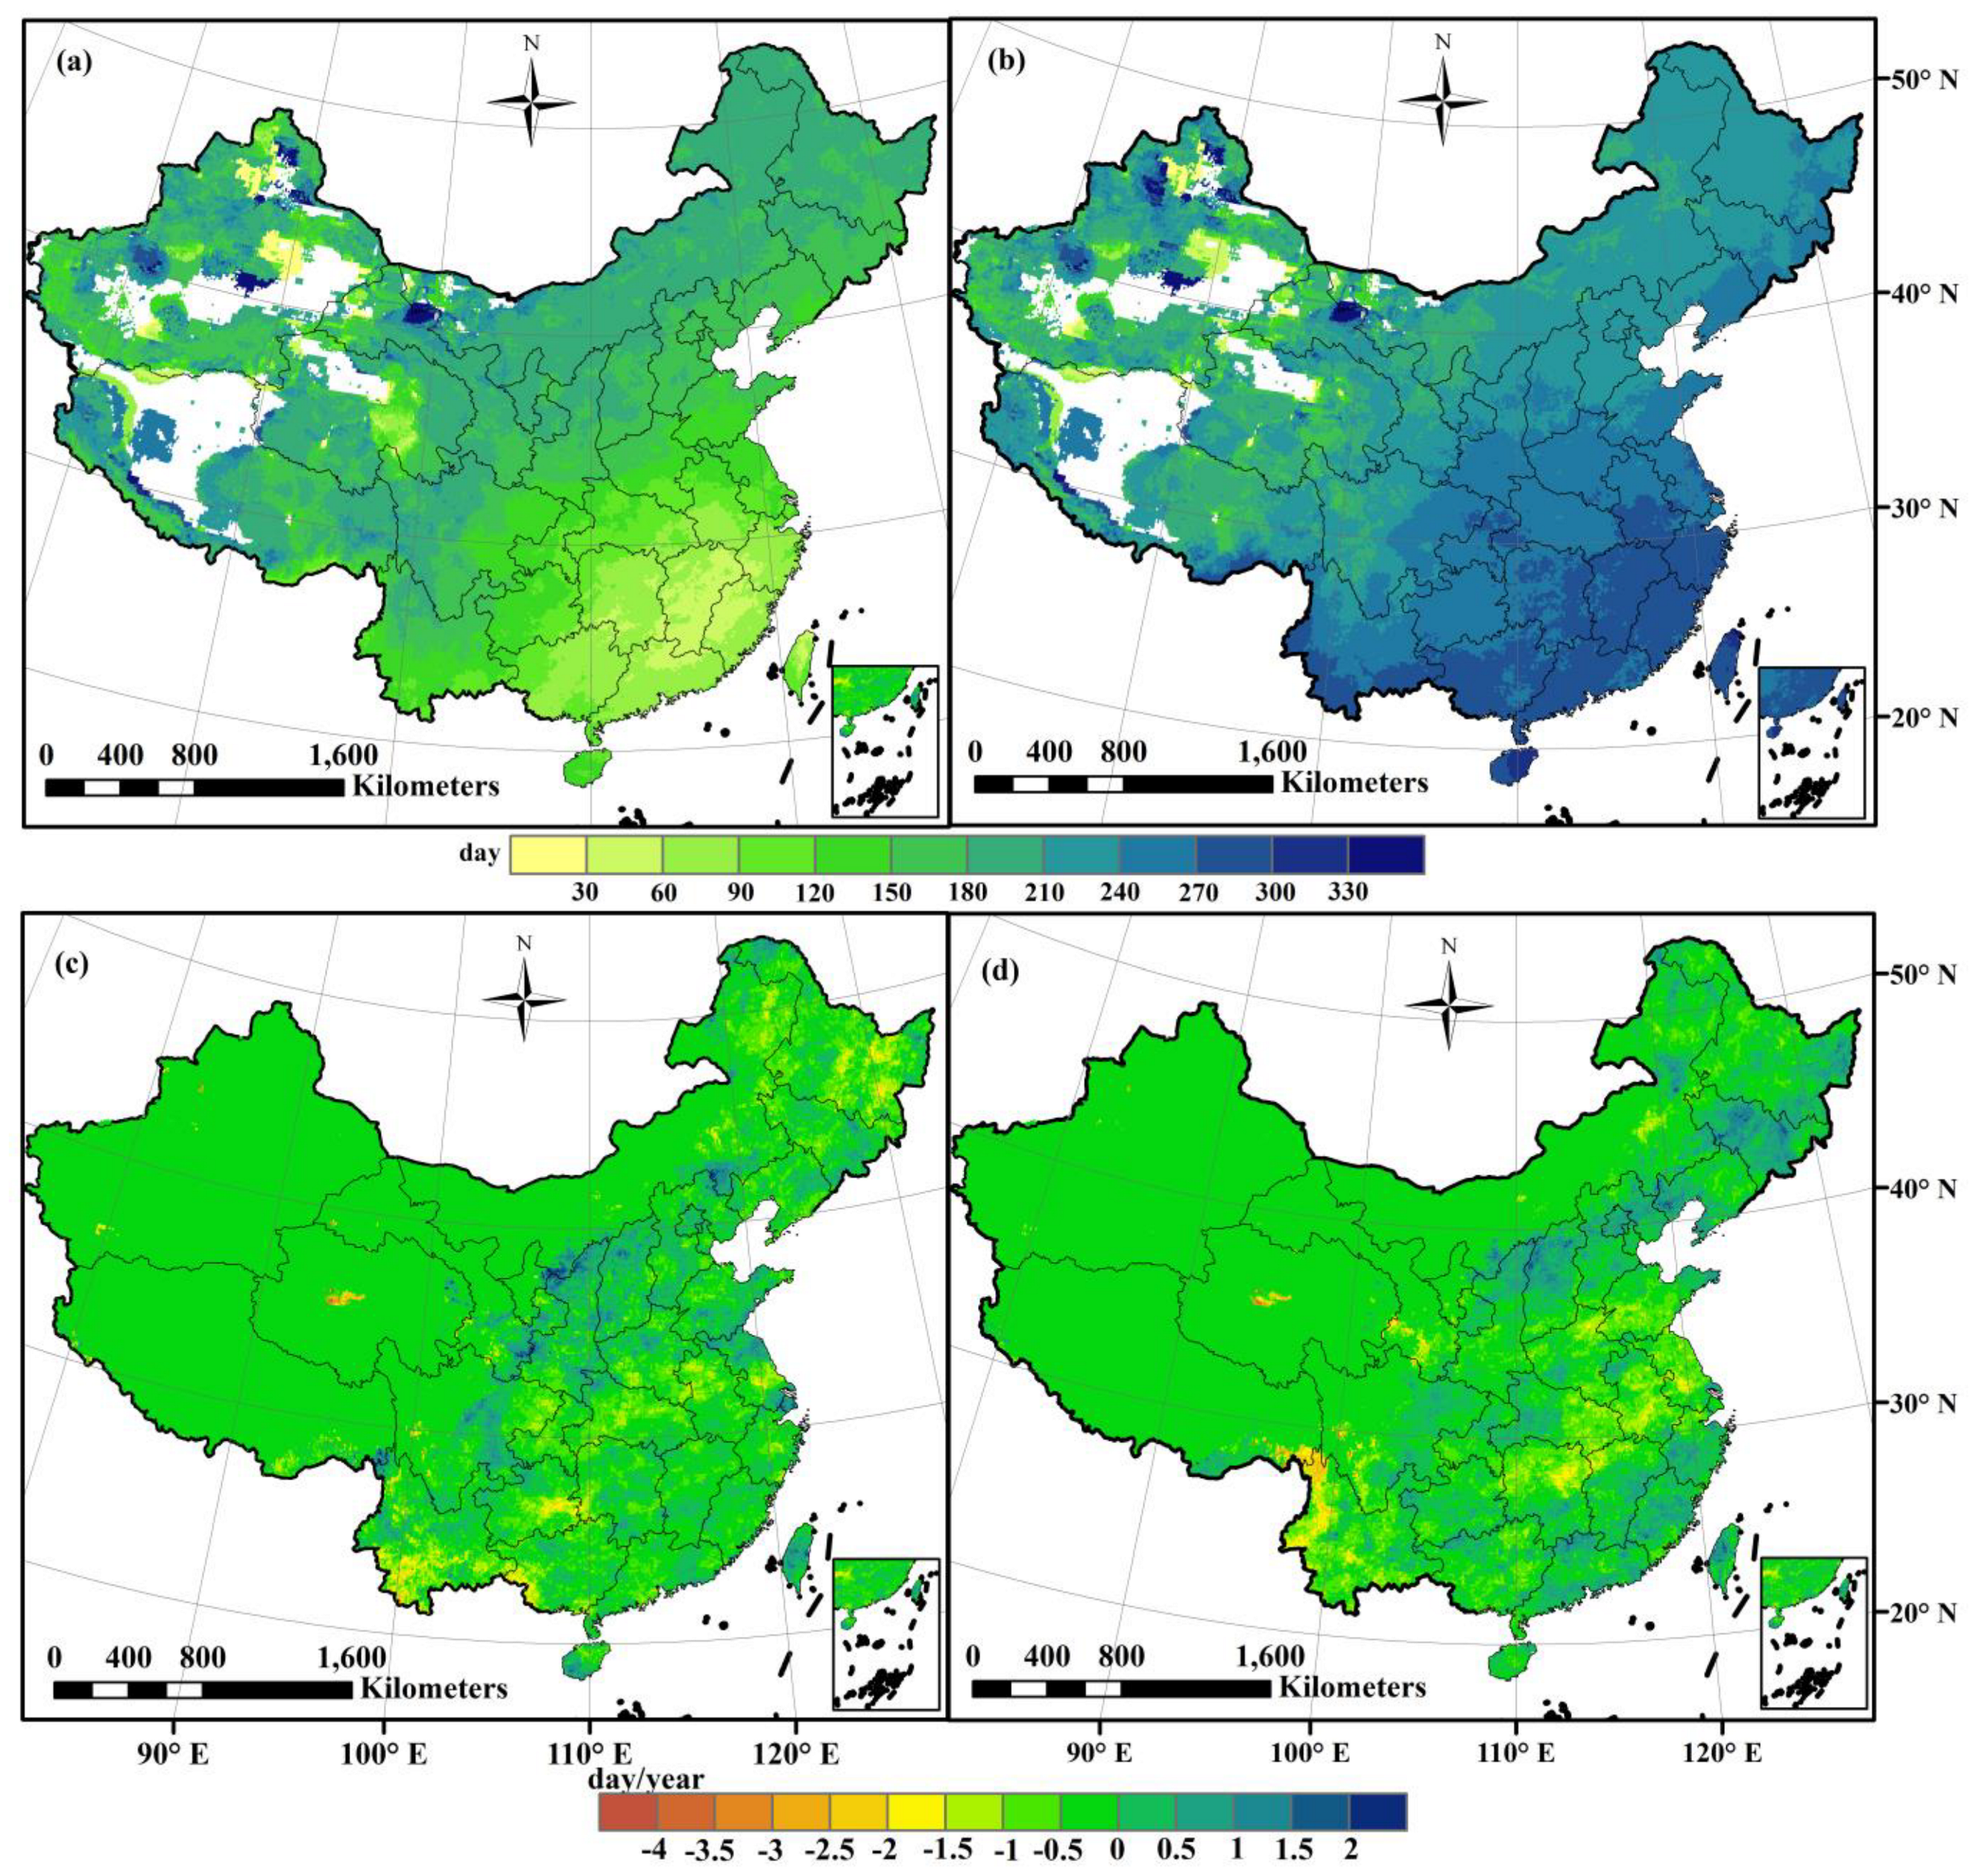
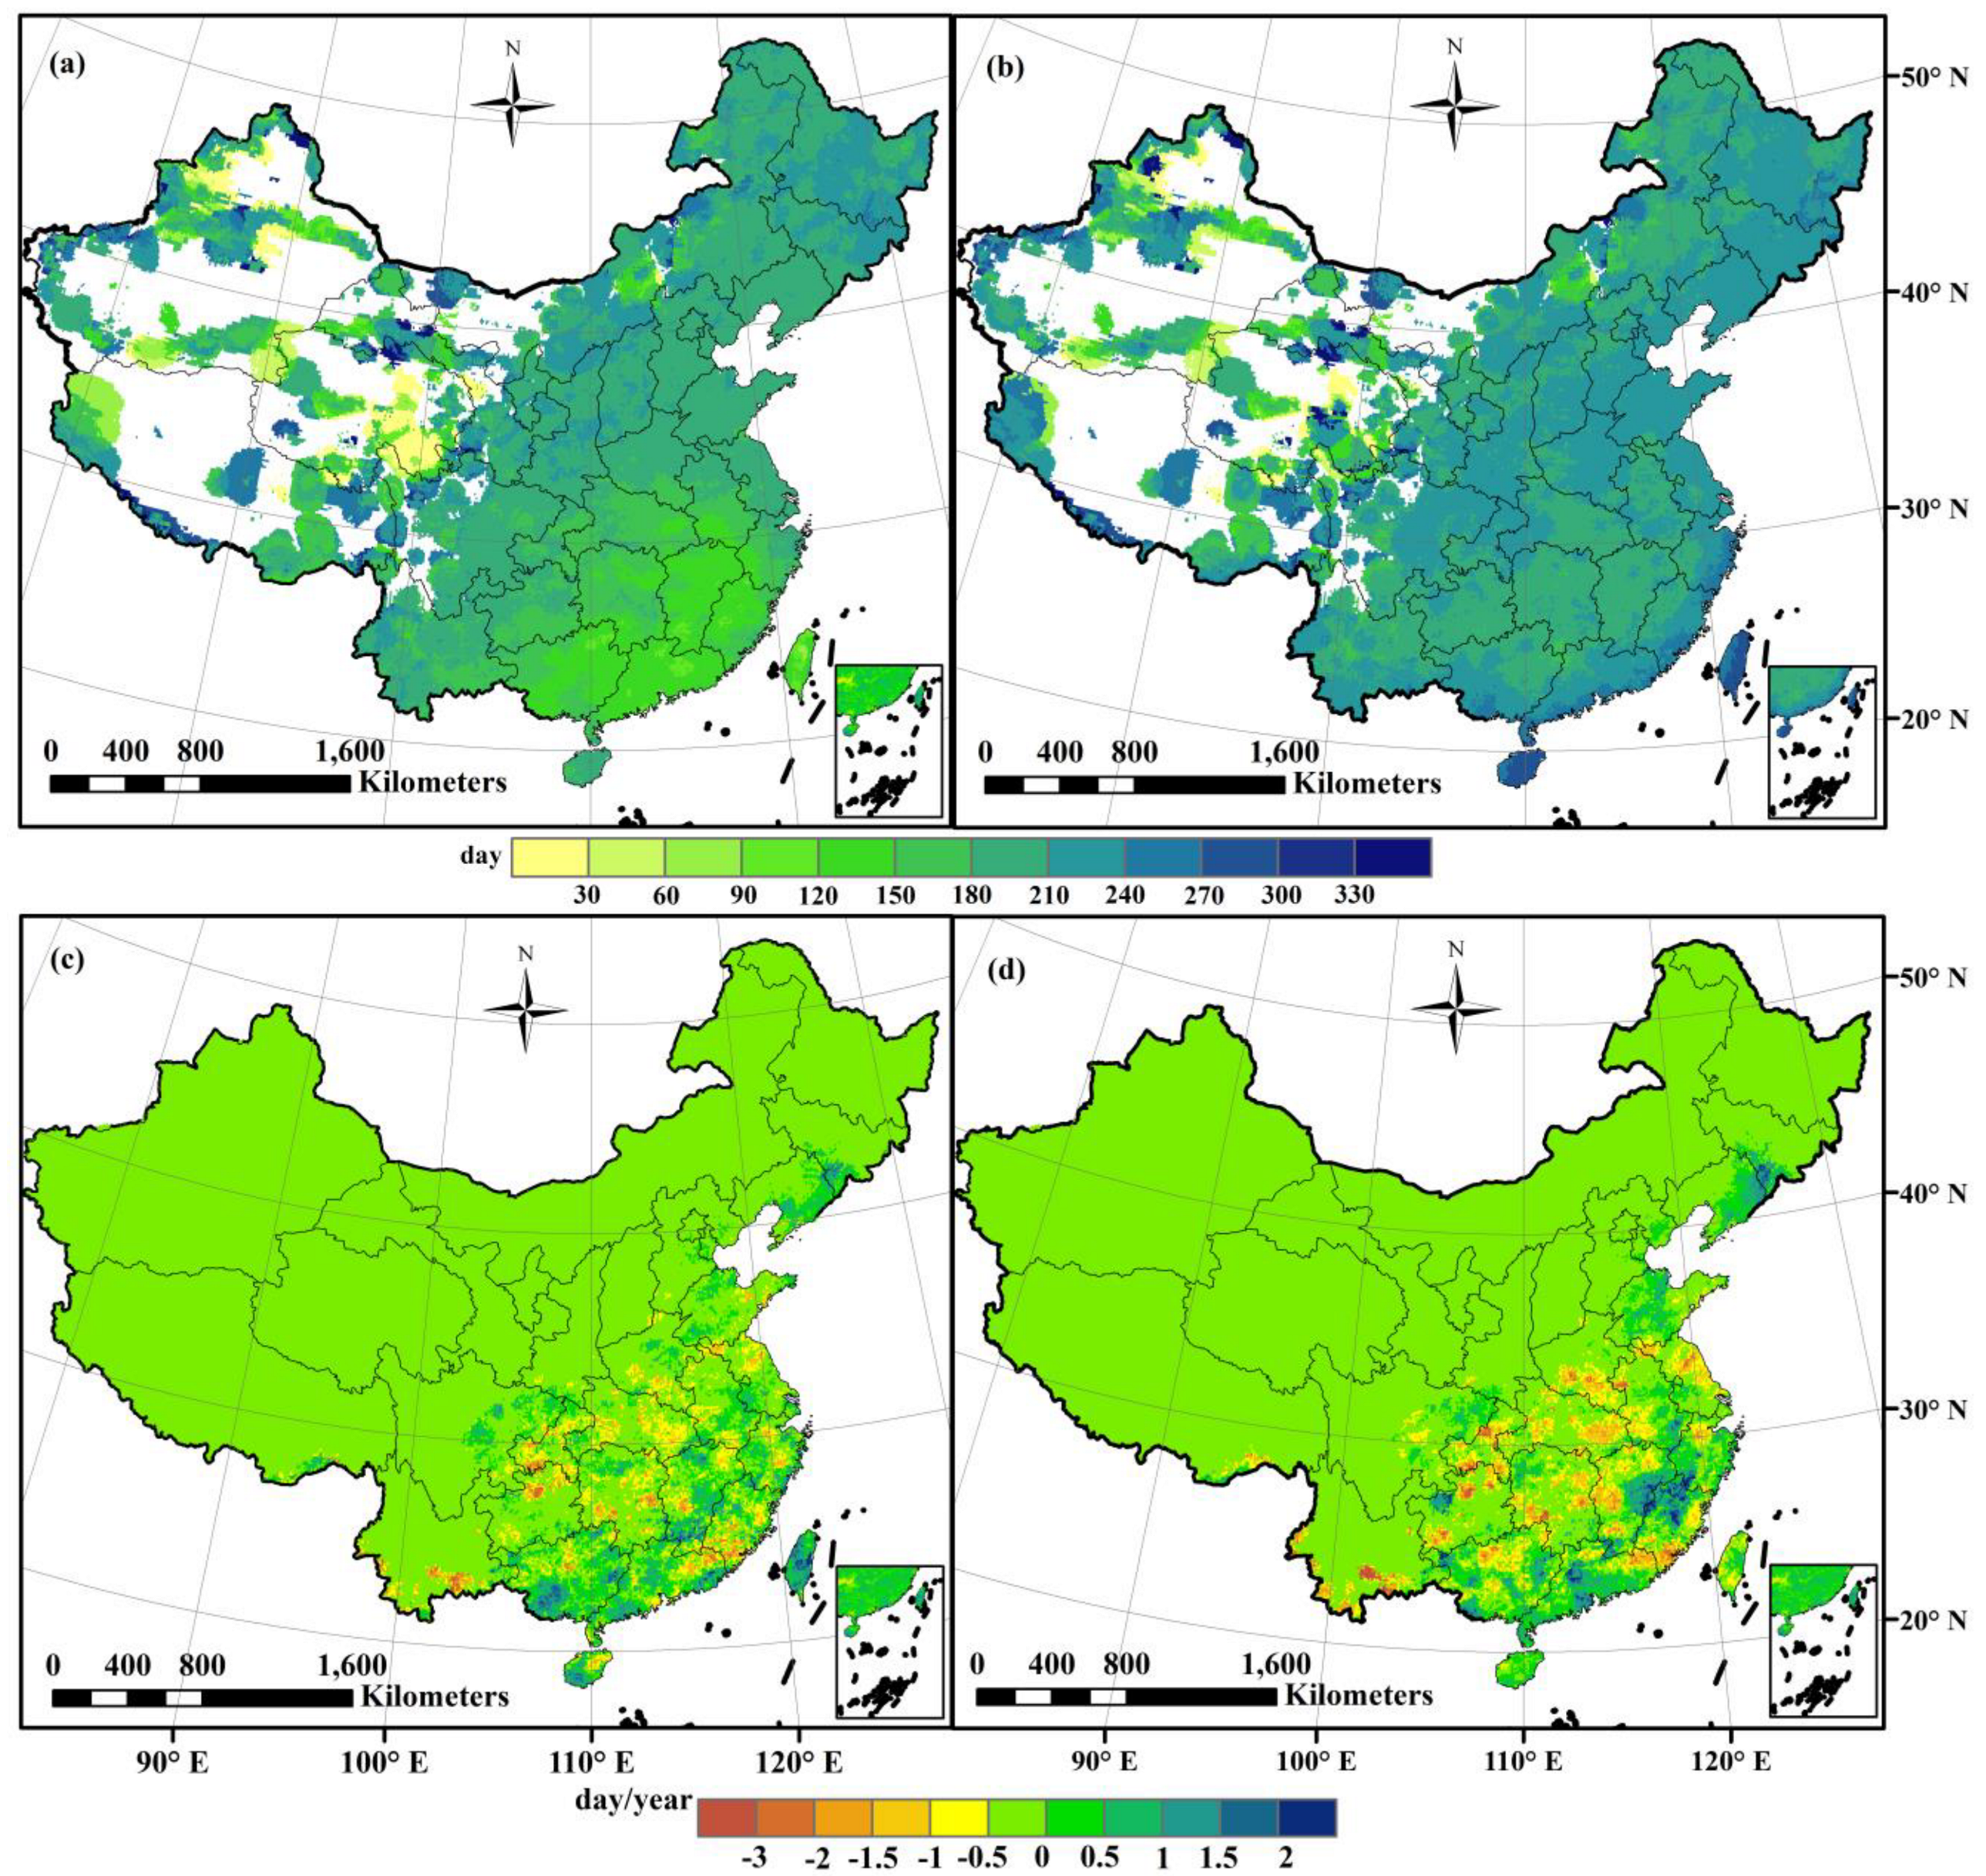
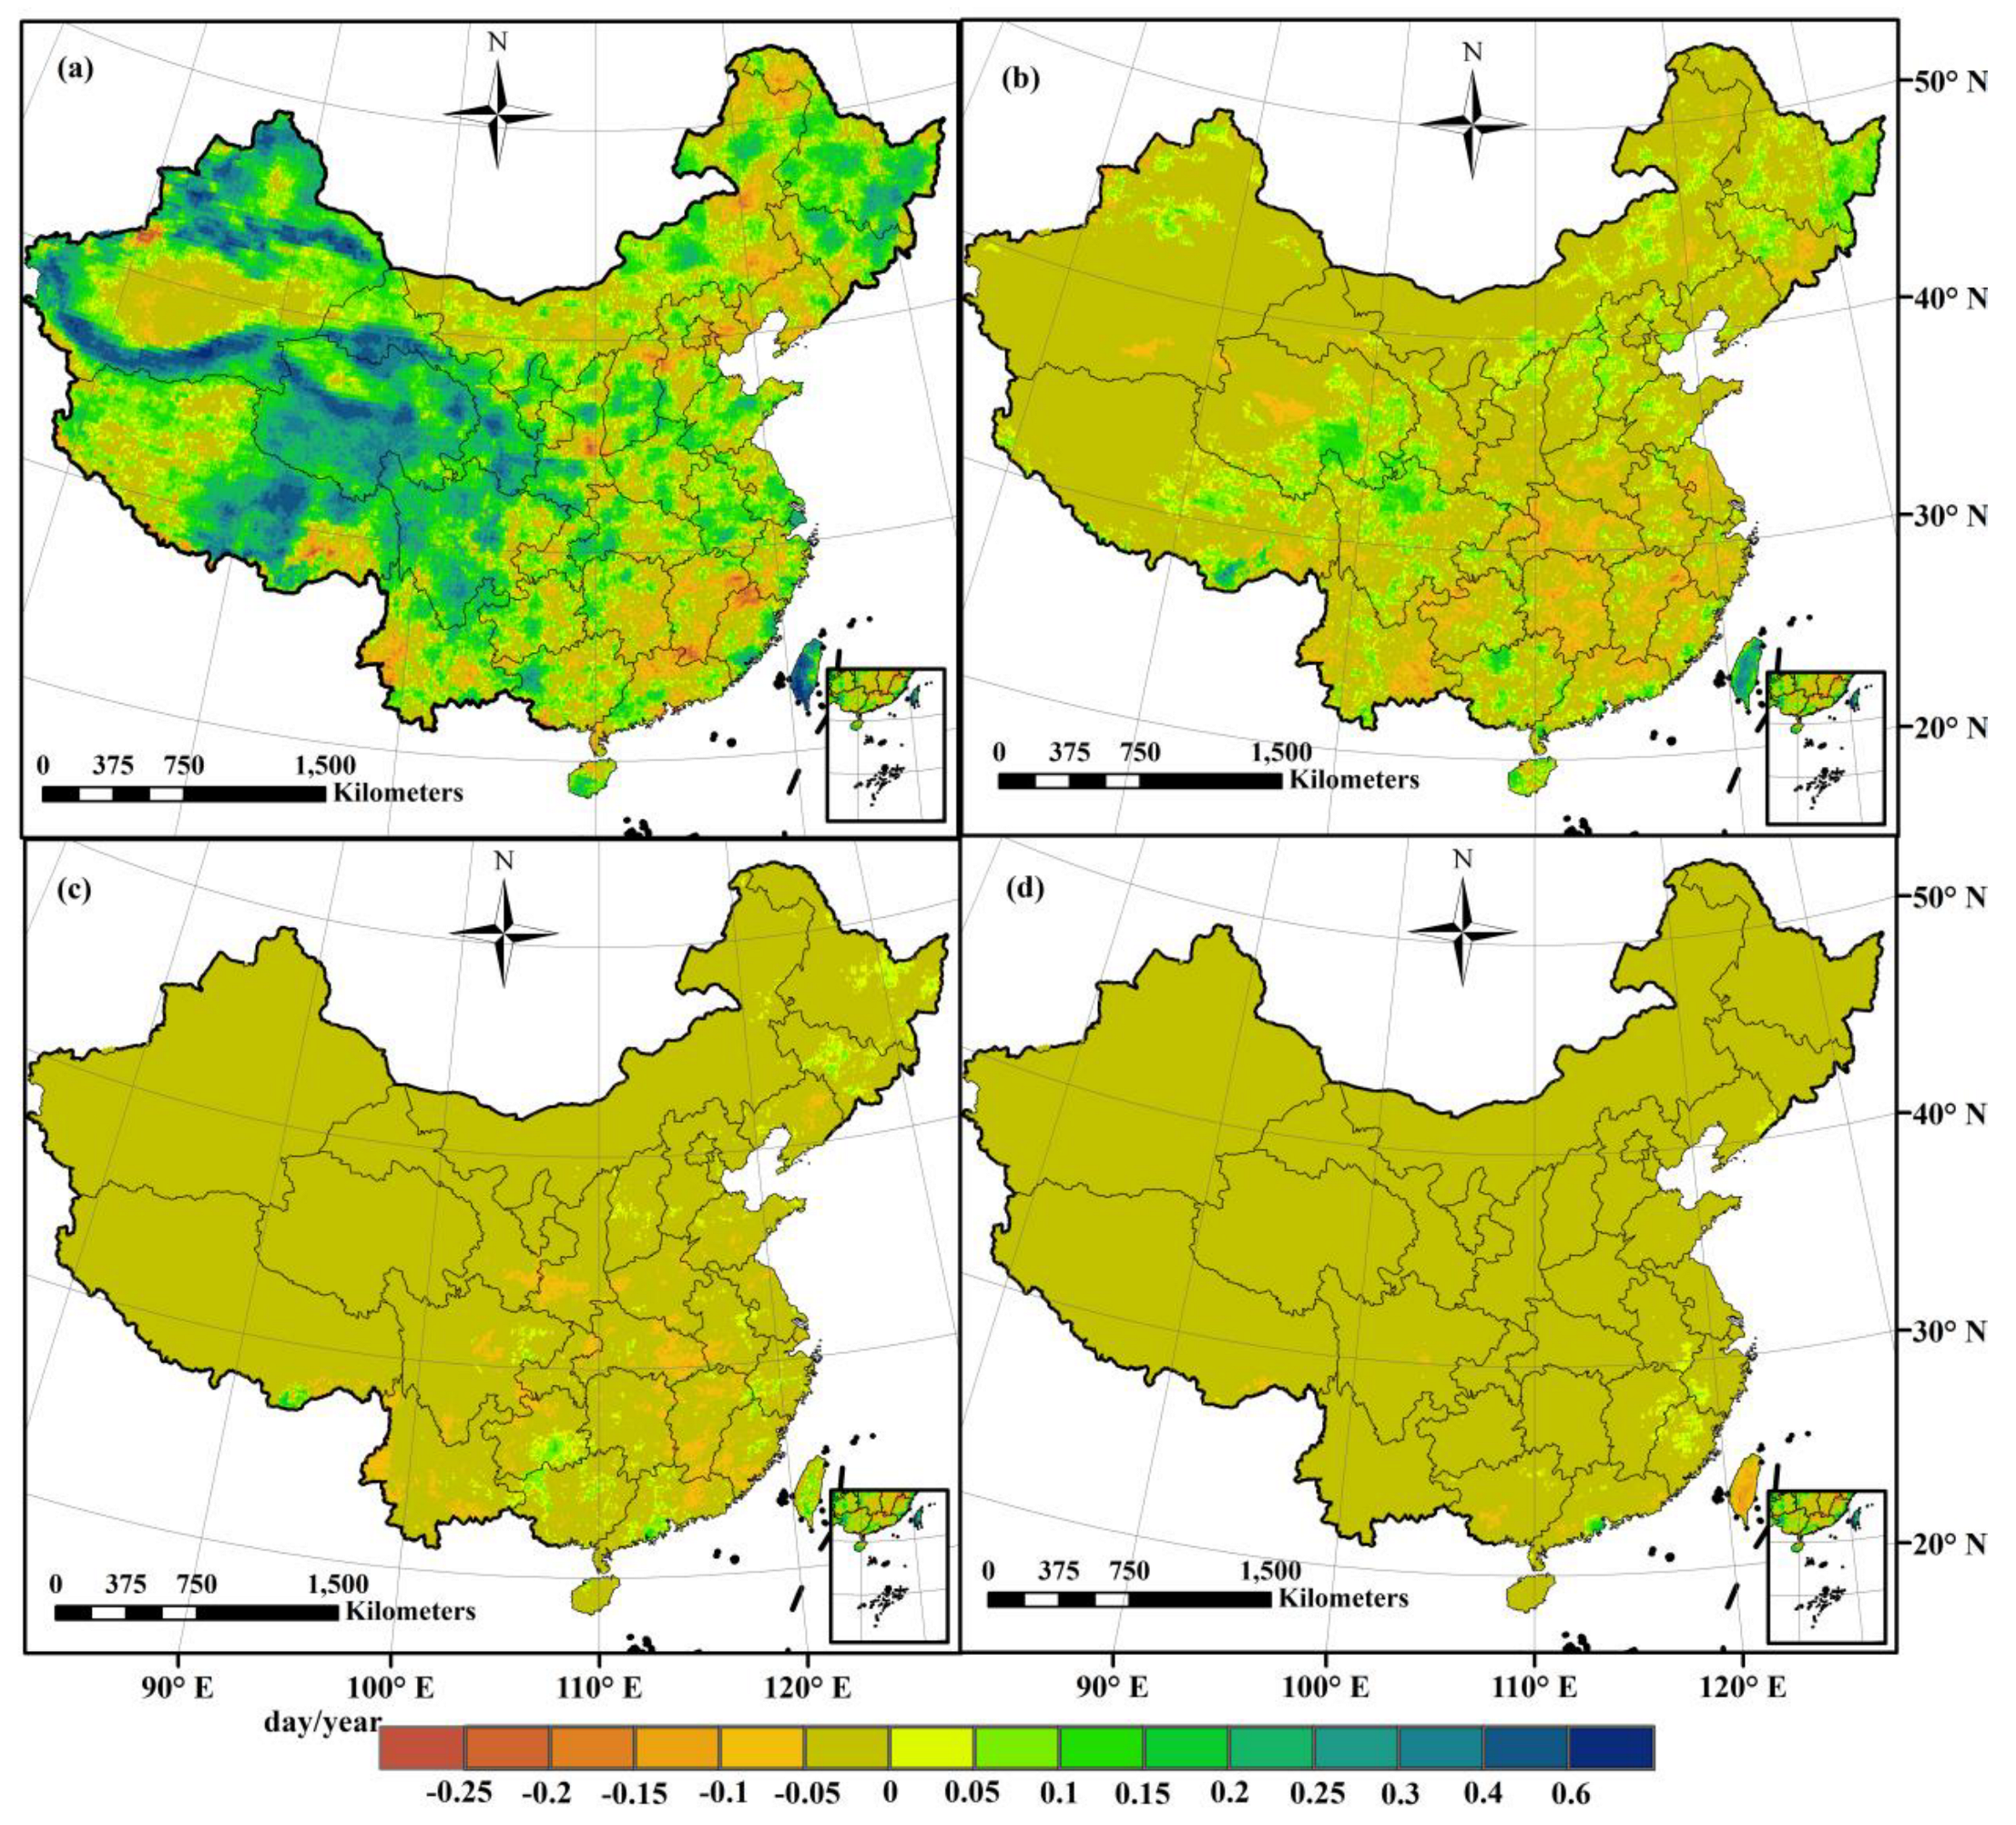
3.1. Spatial Patterns of the Precipitation Change during 1980–2022

Although there has been an increasing amount of research dedicated to precipitation changes, none of the research endeavored to pinpoint the traits of the start date and end date of precipitation. Moreover, while numerous prior lectures have evaluated the occurrence rate of rainfall in China, their primary emphasis has been on alterations in overall precipitation prior to 2015 [20,34,52,53]. Under intensive human activities and continuing global warming, changes in frequency, particularly at different levels of precipitation intensity, were necessary to revisit and update in recent years.
The start date and end date of precipitation at different intensity levels were investigated for the first time across China in this study. Figure 2a,b shows the spatial patterns of the mean annual value of start date and end date of daily precipitation at a low precipitation intensity and Figure 2c,d presents the change slope of the start date and end date of LP. A change slope below zero means the start date and end date occurred earlier, while a change slope above zero means the dates occurred later. During the period 1980–2022, the start date of LP mainly occurred between the 1st and 167th day of the year, while its end date typically fell between the 221st and 365th day. In the northwest region, the start date of LP tends to occur later, with most occurrences falling between the 60th and 150th day and ending after 240 days. The start date occurred increasingly earlier in most parts of China, and the start date advanced significantly faster in several regions of northwest China, with a rate of −2.9~0 days/year (p < 0.05). Areas with a later start date are mainly located in the coastal areas throughout China and in northwest China, with a change rate of 0~0.5 days/year. Areas with an increasingly earlier end date of low precipitation are mainly located in eastern China, while areas with a later end date are mainly concentrated in western China. A significantly larger trend of advanced end dates was observed in the Tibetan Plateau, with a maximum change rate of 2.3 days/year.
The start date of moderate precipitation became gradually later from the southeast to northwest, with the latest start time occurring in the Xizang Autonomous Region, while the end date became progressively earlier from the southeast to northwest. Furthermore, the interval between the end and beginning of MP decreased in the same southeastern to northwestern direction (Figure 3a,b). Moderate precipitation started increasingly earlier in most parts of China (Figure 3c,d). The advanced start date of moderate precipitation was most pronounced in Yunnan, Guizhou, Sichuan, Anhui, Tibetan Plateau, and northwest and northeast China, with a rate of −4.5~0 days/year. A significantly increasing later start date of moderate precipitation mainly occurred in Gansu, Ningxia, Shanxi, and Hunan provinces, with a mean change rate of 0.5 days/year. Areas with an increasingly early end date of moderate precipitation were mainly located in northwest and southwest China, and the change rate of most of them ranged from −1 to 0 days/year, with significant changes occurring in southern Xinjiang, the Tibetan plateau, and parts of Qinghai, Yunnan, and Guizhou provinces. Significant delayed end dates of moderate precipitation were observed in northern Xinjiang, Qinghai, Neimeng, Hebei, Jilin, and Heilongjiang provinces, and the change rate of most of these regions is below 1.5 days/year.
In parts of southeast and northwest China, heavy precipitation commenced earlier and persisted for a longer duration in the southeast. Notably, certain areas in northwest China experienced no heavy precipitation, while the time span between the beginning and termination of heavy precipitation varied significantly throughout the year in other regions (Figure 4a,b). an increasingly later start date of heavy precipitation, at a rate of 0~2.8 days/year, was found in most of southeast China. Areas with a significantly increasing later start date trend were mainly concentrated in Loess Plateau, North China Plain and parts of Sichuan Basin, with the change rate of the start date at 1.5~2.8 days/year. Large precipitation started increasingly earlier, at a rate of −4.5~0 days/year, in Qinghai, Yunnan, Guizhou, Hubei, Jiangsu, and Heilongjiang provinces. The end date of heavy precipitation was significantly delayed, at a mean value of 1.35 days/year in most regions of southeast China, and the delayed end date of HP was most pronounced in Shanxi, Liaoning, and Jilin provinces, with a change rate of up to 2.3 days/year. A significantly advancing end date of large precipitation can mainly be seen in Yunnan, Qinghai, Hunan, Anhui, and Jiangsu provinces, and most of these areas had a changing rate of −0.5~−2 days/year.
The start and end dates of violent precipitation exhibit a wide range of fluctuations across China (Figure 5). Most of the northwest regions did not experience violent precipitation. In the northeast, VP started and ended around the same time. In the northern, southern, and coastal regions, the interval between the start and end of VP was greater, and there were significant regional differences. An increasingly later start date, at a rate of 0~2.5 days/year, was observed in northeastern China for heavy precipitation, while a significantly decreasing advancing start date was observed in the southern Yunnan, Chongqing, Guizhou, Hunan, Hubei, Jiangsu, Guangdong, and Fujian provinces, with a mean change rate of −2.8 days/year. In addition, areas that experienced a significant increasingly later start date of heavy precipitation were mainly concentrated in Guangxi, Guangdong and Jiangxi provinces. For the end date of heavy precipitation, a significantly advancing end date of heavy precipitation was observed in Chongqing, Guizhou, Henan, Hubei, Hunan, Jiangxi, Anhui and Yunnan provinces, with a change rate of −4.5~0 days/year. Areas that experienced a significant, increasingly later end date were mainly located in Jiangxi, Fujian, and Guangdong, and the junction of Liaoning and Jilin provinces, with a rate of 0~3.5 days/year. A significant upward trend of heavy precipitation frequency during 1980–2022 was observed in Fujian and Guangdong provinces, with a maximum change rate of 0.2 days/year. Areas with significant downward trends of heavy precipitation frequency were primarily located in parts of Sichuan, Tibetan Plateau, Yunnan, Guangxi, Guangdong, Fujian, and Hunan provinces.
Considering the large number of studies on the spatial pattern of daily precipitation frequency, only the changing slope of the frequency of different precipitation intensities over China during 1980–2022 is shown in Figure 6. The results show that significant upward trends of LP frequency were observed in the Tibetan plateau, northwest and northeast China, with a change rate of 0.3~0.8 times/year. Areas with significant downward trends of LP frequency were mainly located in some local areas of Xinjiang, Tibetan Plateau, middle Shanxi, northern Fujian, southern Jiangxi, and southern Yunnan provinces, with a change rate of −0.31~−0.15 times/year (Figure 3a). The change rate of MP frequency ranges between −0.22 times/year and 0.44 times/year, and most areas have a change rate of −0.05~0 times/year (Figure 3b). The MP frequency significantly increased in some regions of Xinjiang, Qinghai, Sichuan, Xizang, Guangxi and Heilongjiang provinces (0~0.4 times/year). The frequency of MP showed a significant negative trend in local areas of Xinjiang, Qinghai, Xizang, Yunnan, Guizhou, Hubei, Jiangxi, and Jilin provinces, and most of them had a change rate of −0.1~−0.05 times/year (Figure 3b). Heavy precipitation intensity showed a small decreasing trend in most parts of China (−0.05~0 times/year), with significant regional differences, especially in northwest China (Figure 3c). Significant downward trends were most pronounced in the junction area of Gansu and Shanxi provinces, the junction area of Jiangxi, Fujian and Guangdong provinces, and some areas of Hubei, Liaoning, Yunnan and Sichuan provinces, with a change rate of from −0.15 to −0.05 times/year (Figure 3c). Significant increasing trends of LP frequency were observed in Heilongjiang, Jilin, Xizang, Guizhou, Guangxi, and Guangdong provinces (0.05~0.2 times/year). A small decreasing trend was observed regarding the frequency of heavy precipitation intensity across China (Figure 3d), with significant regional differences. Areas with significant increasing trends of HP frequency were mainly located in Guangdong, Fujian, Anhui, and Zhejiang provinces. Significant decreasing trends of HP frequency were observed in local areas of Xizang, Sichuan, Guangxi, and Guangdong provinces, with a change rate of −0.2~−0.05 times/year.

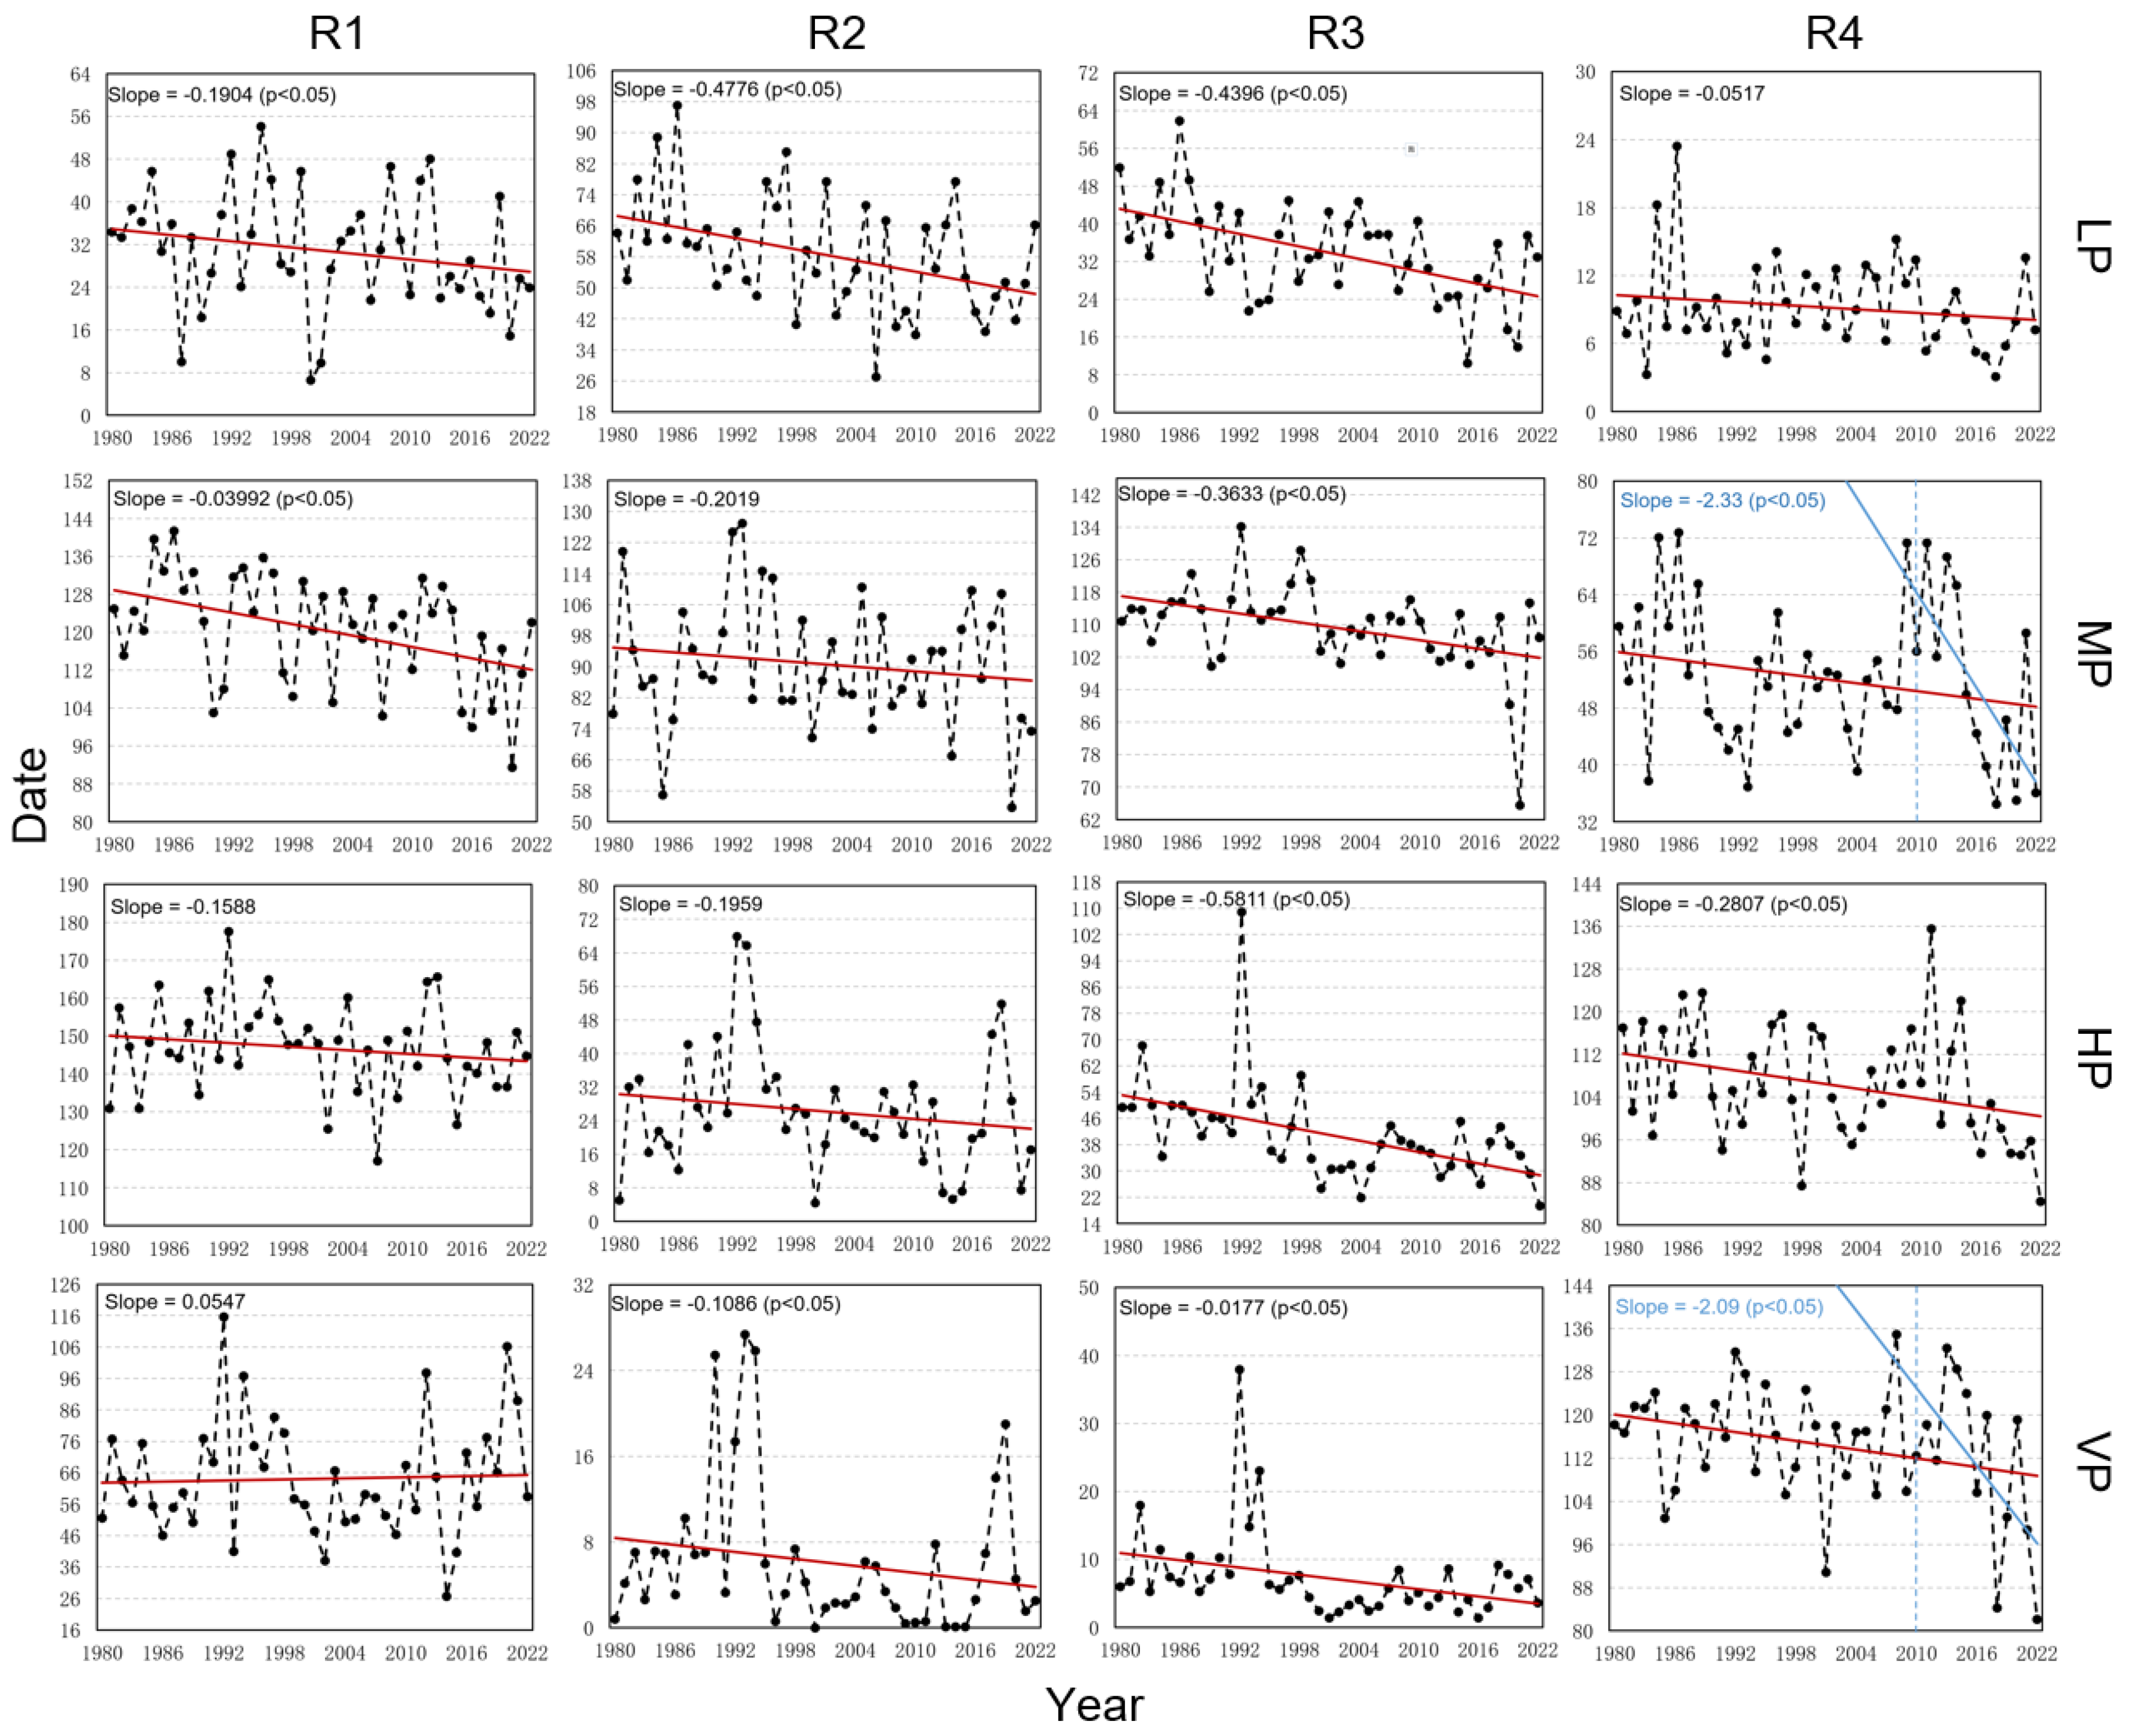
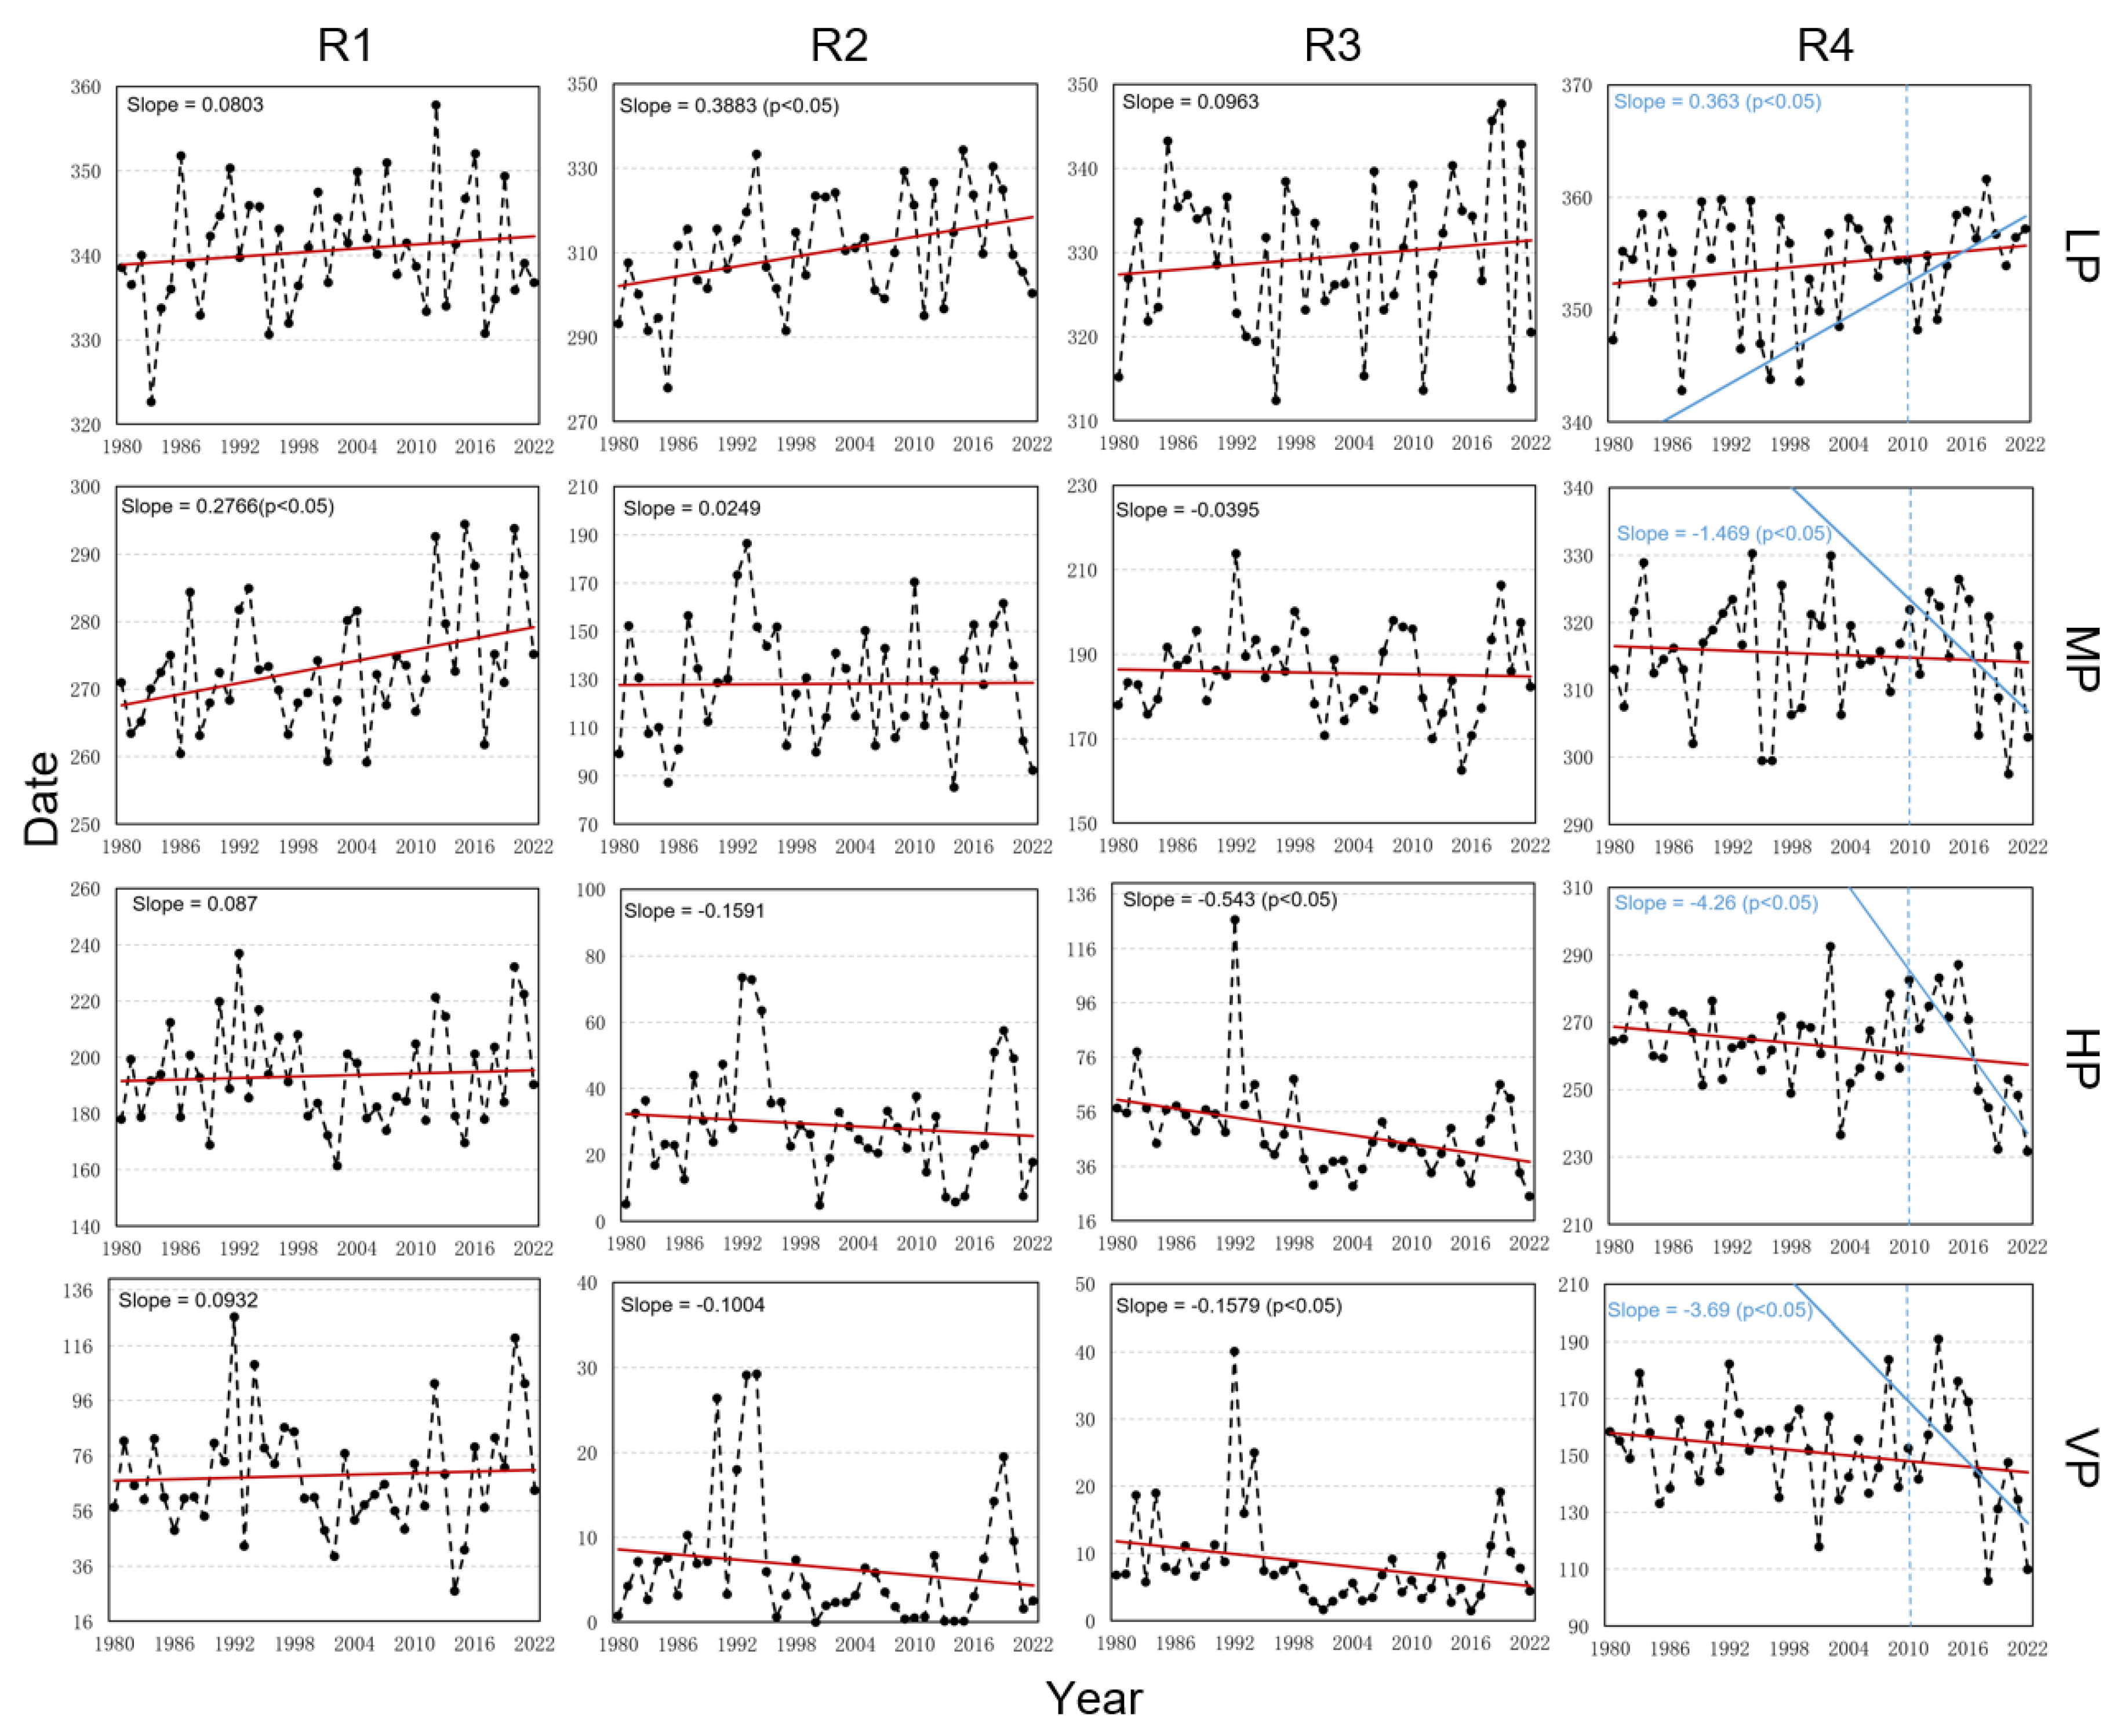
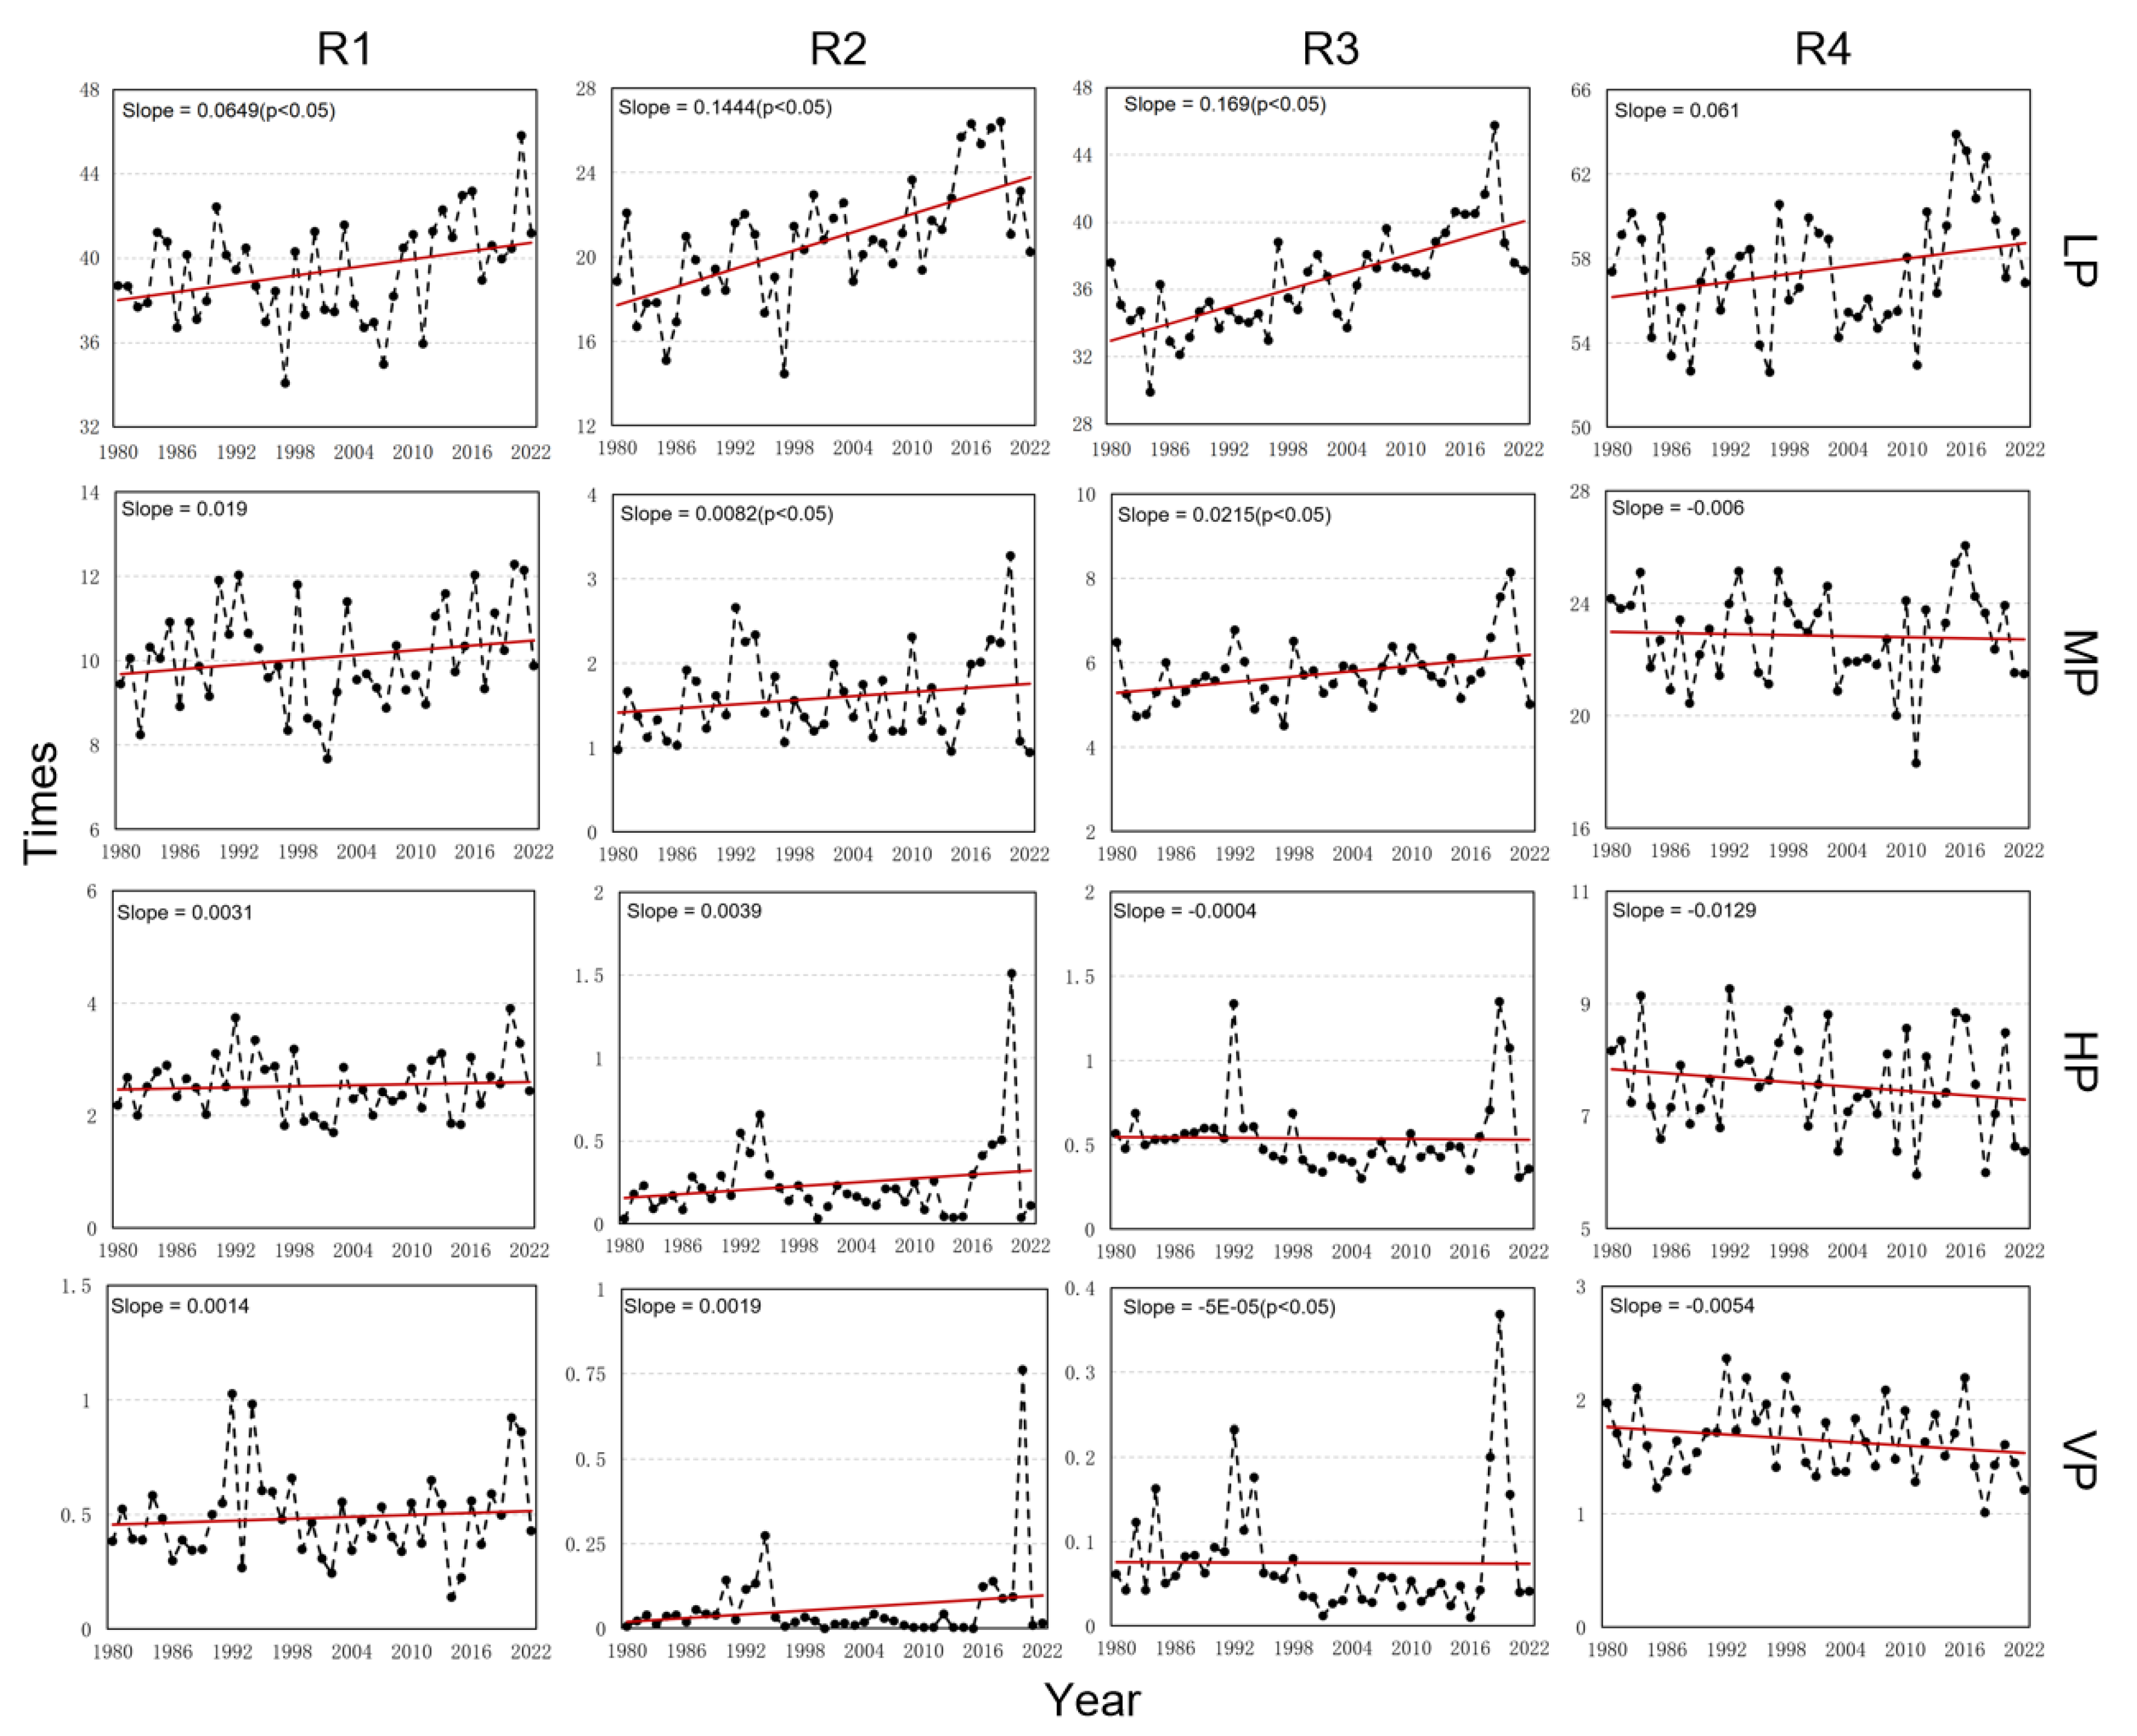
3.2. Temporal Variations in Precipitation Change during 1980–2022

Changes in the start date, end date, and frequency of different precipitation intensities showed significant regional differences across China. Figure 7, Figure 8 and Figure 9 show the regional average change trend of the start date, end date, and frequency of different precipitation intensities.
Figure 7 showed that the start date generally occurred earlier in the four regions for different precipitation intensities during the past four decades. A significantly increasing earlier (−0.28 days/year) start date was detected for heavy precipitation in southeastern China (R4). Significantly advancing start dates were also found for LP and MP in northeast China (R1), with rates of −0.2 days/year and −0.04 days/year, respectively. In addition, significantly earlier start dates were observed for LP (−0.48 days/year), VP (−0.11 days/year) in northwest China (R2) and for LP (−0.44 days/year), MP (−0.36 days/year), HP (−0.58 days/year), VP (−0.18 days/year) in southwest China (R3). The increasingly earlier start dates of MP, HP, and VP were more intense in R4 over the past decade, at a rate of −2.33 days/year, −2.15 days/year, and −2.09 days/year, respectively.
Both increased earlier and later trends for end date were observed for the four regions during 1980–2022 (Figure 8). Significantly increasing later end dates were observed for moderate precipitation in northeast China at a rate of 0.28 days/year. In northwest China, a significantly delayed end date was detected for LP, with a change rate of 0.39 days/year, and an earlier end date was found for heavy and violent precipitation, but not significantly. A rapidly advancing end date for heavy and violent precipitation can be seen in the Tibetan plateau, with an annual change rate of −0.54 days and −0.16 days, respectively. In southeastern China, no significant trend was detected for the end date of different precipitation intensities. During the period 2010–2022, significantly earlier end dates were observed for MP (−1.47 days/year, p < 0.05), HP (−4.26 days/year, p < 0.05), and VP (−3.69 days/year, p < 0.05), while a significant increasingly later end date was detected for LP (0.36 days/year, p < 0.05) in southeastern China (R4).
The frequency of different precipitation intensities showed different patterns compared to the start date and end date (Figure 9). The frequency increased in most cases across different subregions. The frequency of light precipitation showed a significant rising trend, with an annual change rate of 0.06 times/year and 0.14 times/year, respectively, in northeast and northwest China, during 1980–2022. In the Tibetan Plateau, significant increasing frequency trends were detected for LP (0.17 times/year) and MP (0.02 times/year), and the frequency of HP and VP exhibited slightly decreasing trends in this region. In southeastern China, the frequency of LP increased with a change rate of 0.06 times/year during 1980–2022, and the frequency of other precipitation intensity decreased but not significantly.

4. Discussion

This study presents the first analysis of the latest long-term (1980–2022) spatio-temporal changes in the start date, end date, and frequency of different daily precipitation intensities in China. The distribution of daily precipitation information in China was obtained using the global precipitation dataset, MSWEP V2, with a spatial resolution of 0.1°. This dataset was created by optimally merging the most reliable precipitation sources available from gauge, satellite, and reanalysis estimates. The MSWEP V2 has found extensive use in both global and regional applications, such as hydrology, ecosystems, and agricultural fields, and has been demonstrated to provide more accurate spatial patterns in the mean, intensity, and frequency of precipitation when compared to other remote sensing and reanalysis datasets [31,54,55,56,57].
Temporal variations in precipitation have an important effect on crop production and plant growth. Prior research primarily concentrated on the amount of annual and seasonal precipitation frequency [20,52], while this study focused on the frequency of different precipitation intensities, depicting different trends in the four regions during 1980–2022. Since different research periods, different precipitation intensities, and different data have been used, there are many discrepancies in the quantitative analysis. The results show that the frequency of different precipitation intensities varies with region. In most of China, upward trends were observed for LP, while downward trends were observed for MP, HP, and VP, with a change rate of −0.05~0 days/year. In addition, for MP, some regions exhibited upward trends with a change rate of 0.05~0.15 days/year. Despite several lectures on precipitation changes, we still lack an assessment of the changes in the start and end date of precipitation at present. Our results provide the spatial patterns of the start date and end date of daily precipitation at different intensity levels, and show that, with the exception of VP, the beginning of daily precipitation is generally early in the southeast and late in the northwest, with the opposite end date. The start and end dates of violent precipitation exhibit a wide range of fluctuations across China. For light and moderate precipitation intensity levels, the start date occurred increasingly earlier in most parts of China, while LP and MP ended earlier in the Tibetan Plateau, and mainly ended later in western and northeastern China. Heavy precipitation started later and ended later in most of China, especially in the southeast region. For violent precipitation, the change was most pronounced in southeast China, and the change characteristics of the start date and end date exhibited higher heterogeneity compared to the heavy precipitation that occurred across this region. These characteristics of the variability in the start date and end date of different daily precipitation levels varied across regions in China, possibly due to the combined effects of diverse land surface types, large topographic variations, land and sea location differences, and regional differences in human activities.
The data used are one of the main sources of uncertainty in analysis. Both the satellite precipitation products and the reanalysis dataset suffer from some uncertainties for a number of reasons, such as retrieval algorithms, sensors, model representation, and parameterizations. The observation-based interpolation method also has some uncertainties due to the distribution and number of stations. Therefore, MSWEP V2 was applied in this study to minimize uncertainties, due to its good performance and the wide applications. In addition, different partitioning methods used to classify precipitation intensity levels may lead to uncertainties when describing regional precipitation characteristics. In this study, precipitation intensity was divided into four levels according to the CMA using the absolute threshold value; using the relative threshold value to classify different levels of precipitation intensity based on different regions may produce different results, which will be further investigated.
This research has the potential to enhance our comprehension of the broader precipitation patterns in China, which could have an impact on hydrological systems, plant growth, drought, and crop production. China is a very large country with a variety of climates and environments and a distinct continental monsoon climate characterized by a cold winter and hot summer. The diverse climate ranges from arid regions in the northwest to alpine regions in the Tibetan Plateau and monsoon regions in the east and south. As many countries around the globe share comparable climate types and environments with China, such as the climate types represented by R1 (temperature monsoon climate), R2 (temperate continental climate), R3 (alpine cold climate), and R4 (tropical and subtropical monsoon climate) in Figure 1, this research offers a fresh outlook for a better understanding of precipitation changes under continuous global warming. It also provides valuable insights regarding agricultural and water resource management, as well as relevant adaptation tactics for those nations.

5. Conclusions

The present study examined the fluctuations in various precipitation intensities with regard to their start date, end date, and frequency across China. The main findings of this study are as follows:
(1)
During the period 1980–2022, the start date of light precipitation shifted to significantly (p < 0.05) earlier in the northeast, northwest, and Tibetan Plateau, with mean annual change rates of −0.19 days, −0.48 days, and −0.44 days, respectively, while the end date for LP was significantly delayed in the northwest by 0.39 days/year. The frequency of LP exhibited a significant upward trend in northeast China (0.06 times/year), northwest China (0.14 times/year), and Tibetan Plateau (0.02 times/year) of China. In addition, there was an increasing trend in southeast China (0.06 times/year), although it was not statistically significant.
(2)
Moderate precipitation started significantly earlier in northeast China (−0.04 days/year) and Tibetan Plateau (−0.36 days/year), and ended later in northeast China (0.28 days/year). The frequency of MP showed a slight significant upward trend in Tibetan Plateau (0.02 times/year) and northwest China (0.01 times/year). There was a non-significant increasing trend (0.02 times/year) and a decreasing trend (−0.01 times/year) in the northeast and southeast China, respectively.
(3)
For heavy precipitation, the start date occurred increasingly significant earlier in the Tibetan plateau and southeast China, with mean change rates of −0.58 days/year and −0.28 days/year, respectively, while the end date started significant earlier the Tibetan plateau during the last four decades, with a change rate of −0.54 times/year. In addition, the end date of HP in southeast China shifted to earlier in the last 10 decades (2010–2022), with a change rate of −4.26 times/year (p < 0.05). There was no significant change in the frequency of HP. The frequency of HP showed slightly increasing trends in northeast and northwest China, while showing slightly decreasing trends in the Tibetan Plateau and southeast China.
(4)
The violent precipitation started significantly slightly earlier in the Tibetan Plateau (−0.02 days/year) and northwest China (−0.11 days/year) during the period of 1980–2022, and started significantly earlier in southeast China from 2010 to 2022, with a change rate of −2.1 times/year. VP ended significantly earlier (−0.16 days/year) in the Tibetan Plateau during the past four decades and ended significantly earlier in southeast China over the latest ten years (−3.7 times/year). No significant changes in the frequency of VP were observed, except for a possible slight downward trend on the Tibetan Plateau.
These findings show the changing characteristics of the start date, end date, and frequency of different precipitation intensities, highlighting the need for further attention to these characteristics of precipitation change due to widespread timing changes.

Author Contributions

Conceptualization, N.Z.; methodology, N.Z. and K.C.; software, K.C.; validation, N.Z. and K.C.; formal analysis, N.Z.; investigation, N.Z. and K.C.; resources, K.C.; data curation, K.C.; writing—original draft preparation, N.Z.; writing—review and editing, K.C.; visualization, K.C.; supervision, N.Z.; project administration, N.Z.; funding acquisition, N.Z. All authors have read and agreed to the published version of the manuscript.

Funding

This study was supported by the Major Program of National Natural Science Foundation of China (No. 42293270), the National Program of National Natural Science Foundation of China (No. 42071374), and the Key Project of Innovation LREIS (KPI001).

Data Availability Statement

Data and additional information can be provided by directly contacting the authors.

Conflicts of Interest

The authors declare no conflict of interest.

References

  1. Fuglie, K. Climate change upsets agriculture. Nat. Clim. Chang. 2021, 11, 294–295. [Google Scholar] [CrossRef]
  2. Ma, Z.; Bork, E.W.; Attaeian, B.; Cahill, J.F.; Chang, S.X. Altered precipitation rather than warming and defoliation regulate short-term soil carbon and nitrogen fluxes in a northern temperate grassland. Agric. Forest Meteorol. 2022, 327, 109217. [Google Scholar] [CrossRef]
  3. Schroeder, R.; McDonald, K.C.; Azarderakhsh, M.; Zimmermann, R. ASCAT MetOp-A diurnal backscatter observations of recent vegetation drought patterns over the contiguous US: An assessment of spatial extent and relationship with precipitation and crop yield. Remote Sens. Environ. 2016, 177, 153–159. [Google Scholar] [CrossRef]
  4. IPCC. Climate Change 2021: The Physical Science Basis. Available online: https://www.ipcc.ch/report/ar6/wg1/ (accessed on 9 August 2021).
  5. Potter, N.J.; Zhang, L.; Milly, P.C.D.; McMahon, T.A.; Jakeman, A.J. Effects of rainfall seasonality and soil moisture capacity on mean annual water balance for Australian catchments. Water Resour. Res. 2005, 41, W06007. [Google Scholar] [CrossRef]
  6. Wentz, F.J.; Ricciardulli, L.; Hilburn, K.; Mears, C. How much more rain will global warming bring? Science 2007, 317, 233–235. [Google Scholar] [CrossRef]
  7. Pfahl, S.; O’Gorman, P.A.; Fischer, E.M. Understanding the regional pattern of projected future changes in extreme precipitation. Nat. Clim. Chang. 2017, 7, 423–427. [Google Scholar] [CrossRef]
  8. Lei, M.; Li, J.; Zhang, L.; Deng, C.; Li, Y.; He, J. Inconsistent Frequency Trends Between Hourly and Daily Precipitation during Warm Season in Mainland of China. Geophys. Res. Lett. 2022, 49, e2022GL100277. [Google Scholar] [CrossRef]
  9. Tan, X.; Wu, Y.; Liu, B.; Chen, S. Inconsistent changes in global precipitation seasonality in seven precipitation datasets. Clim. Dyn. 2020, 54, 3091–3108. [Google Scholar] [CrossRef]
  10. Currier, C.M.; Sala, O.E. Precipitation versus temperature as phenology controls in drylands. Ecology 2022, 103, e3793. [Google Scholar] [CrossRef]
  11. Pendergrass, A.G.; Hartmann, D.L. Changes in the Distribution of Rain Frequency and Intensity in Response to Global Warming. J. Clim. 2014, 27, 8372–8383. [Google Scholar] [CrossRef]
  12. Chadwick, R.; Pendergrass, A.G.; Alves, L.M.; Moise, A. How Do Regional Distributions of Daily Precipitation Change under Warming? J. Clim. 2022, 35, 3243–3260. [Google Scholar] [CrossRef]
  13. Pendergrass, A.G.; Knutti, R. The Uneven Nature of Daily Precipitation and Its Change. Geophys. Res. Lett. 2018, 45, 11980–11988. [Google Scholar] [CrossRef]
  14. Groisman, P.Y.; Knight, R.W.; Easterling, D.R.; Karl, T.R.; Hegerl, G.C.; Razuvaev, V.A.N. Trends in intense precipitation in the climate record. J. Clim. 2005, 18, 1326–1350. [Google Scholar] [CrossRef]
  15. Min, S.-K.; Zhang, X.; Zwiers, F.W.; Hegerl, G.C. Human contribution to more-intense precipitation extremes (vol 470, pg 378, 2011). Nature 2013, 498, 526. [Google Scholar] [CrossRef]
  16. Donat, M.G.; Alexander, L.V.; Yang, H.; Durre, I.; Vose, R.; Dunn, R.J.H.; Willett, K.M.; Aguilar, E.; Brunet, M.; Caesar, J.; et al. Updated analyses of temperature and precipitation extreme indices since the beginning of the twentieth century: The HadEX2 dataset. J. Geophys. Res. Atmos. 2013, 118, 2098–2118. [Google Scholar] [CrossRef]
  17. Jiang, Y.; Yang, K.; Shao, C.; Zhou, X.; Zhao, L.; Chen, Y.; Wu, H. A downscaling approach for constructing high-resolution precipitation dataset over the Tibetan Plateau from ERA5 reanalysis. Atmos. Res. 2021, 256, 105574. [Google Scholar] [CrossRef]
  18. Harp, R.D.; Horton, D.E. Observed Changes in Daily Precipitation Intensity in the United States. Geophys. Res. Lett. 2022, 49, e2022GL099955. [Google Scholar] [CrossRef]
  19. Lader, R.; Walsh, J.E.; Bhatt, U.S.; Bieniek, P.A. Projections of Twenty-First-Century Climate Extremes for Alaska via Dynamical Downscaling and Quantile Mapping. J. Appl. Meteor. Climatol. 2017, 56, 2393–2409. [Google Scholar] [CrossRef]
  20. Guo, B.; Zhang, J.; Meng, X.; Xu, T.; Song, Y. Long-term spatio-temporal precipitation variations in China with precipitation surface interpolated by ANUSPLIN. Sci. Rep. 2020, 10, 81. [Google Scholar] [CrossRef] [PubMed]
  21. Huffman, G.J.; Bolvin, D.T.; Braithwaite, D.; Hsu, K.; Joyce, R.; Kidd, C.; Nelkin, E.J.; Sorooshian, S.; Tan, J.; Xie, P. NASA Global Precipitation Measurement (GPM) Integrated Multi-Satellite Retrievals for GPM (IMERG); NASA Algorithm Theoretical Basis Doc., Version 06; National Aeronautics and Space Administration (NASA): Greenbelt, MD, USA, 2019; 38p. Available online: https://pmm.nasa.gov/sites/default/files/document_files/IMERG_ATBD_V06.pdf (accessed on 1 January 2022).
  22. Tang, G.; Clark, M.P.; Papalexiou, S.M.; Ma, Z.; Hong, Y. Have satellite precipitation products improved over last two decades? A comprehensive comparison of GPM IMERG with nine satellite and reanalysis datasets. Remote Sens. Environ. 2020, 240, 111697. [Google Scholar] [CrossRef]
  23. Joyce, R.J.; Janowiak, J.E.; Arkin, P.A.; Xie, P.P. CMORPH: A method that produces global precipitation estimates from passive microwave and infrared data at high spatial and temporal resolution. J. Hydrometeorol. 2004, 5, 487–503. [Google Scholar] [CrossRef]
  24. Huffman, G.J.; Bolvin, D.T.; Nelkin, E.J.; Wolff, D.B.; Adler, R.F.; Gu, G.; Hong, Y.; Bowman, K.P.; Stocker, E.F. The TRMM Multisatellite Precipitation Analysis (TMPA): Quasi-global, multiyear, combined-sensor precipitation estimates at fine scales. J. Hydrometeorol. 2007, 8, 38–55. [Google Scholar] [CrossRef]
  25. Okamoto, K.; Ushio, T.; Iguchi, T.; Takahashi, N.; Iwanami, K. The global satellite mapping of precipitation (GSMaP) project. In Proceedings of the IGARSS 2005: IEEE International Geoscience and Remote Sensing Symposium, Seoul, Republic of Korea, 29 July 2005; Volume 1–8, pp. 3414–3416. [Google Scholar]
  26. Hegerl, G.C.; Zwiers, F.W.; Braconnot, P.; Gillett, N.P.; Luo, Y.; Osini, J.A.M.; Nicholls, N.; Penner, J.E.; Stott, P.A.; Allen, M. Understanding and Attributing Climate Change. In Climate Change 2007: The Physical Science Basis. Contribution of Working Group I to the Fourth Assessment Report of the Intergovernmental Panel on Climate Change; Cambridge University Press: Cambridge, UK; New York, NY, USA, 2007. [Google Scholar]
  27. Knutti, R.; Sedláček, J. Robustness and uncertainties in the new CMIP5 climate model projections. Nat. Clim. Change 2012, 3, 369–373. [Google Scholar] [CrossRef]
  28. Harrington, L.J.; Schleussner, C.-F.; Otto, F.E.L. Quantifying uncertainty in aggregated climate change risk assessments. Nat. Commun. 2021, 12, 7140. [Google Scholar] [CrossRef] [PubMed]
  29. IPCC. Climate Change 2013: The Physical Science Basis. Contribution of Working Group I to the Fifth Assessment Report of the Intergovernmental Panel on Climate Change; Cambridge University Press: Cambridge, UK; New York, NY, USA, 2013. [Google Scholar]
  30. Beck, H.E.; van Dijk, A.I.J.M.; Levizzani, V.; Schellekens, J.; Miralles, D.G.; Martens, B.; de Roo, A. MSWEP: 3-hourly 0.25 degrees global gridded precipitation (1979–2015) by merging gauge, satellite, and reanalysis data. Hydrol. Earth Syst. Sci. 2017, 21, 589–615. [Google Scholar] [CrossRef]
  31. Beck, H.E.; Wood, E.F.; Pan, M.; Fisher, C.K.; Miralles, D.G.; van Dijk, A.I.J.M.; McVicar, T.R.; Adler, R.F. MSWEP V2 Global 3-Hourly 0.1 degrees Precipitation: Methodology and Quantitative Assessment. Bull. Am. Meteorol. Soc. 2019, 100, 473–502. [Google Scholar] [CrossRef]
  32. Prakash, S. Performance assessment of CHIRPS, MSWEP, SM2RAIN-CCI, and TMPA precipitation products across India. J. Hydrol. 2019, 571, 50–59. [Google Scholar] [CrossRef]
  33. Sun, J.; Ao, J. Changes in precipitation and extreme precipitation in a warming environment in China. Chin. Sci. Bull. 2013, 58, 1395–1401. [Google Scholar] [CrossRef]
  34. Zhai, P.M.; Zhang, X.B.; Wan, H.; Pan, X.H. Trends in total precipitation and frequency of daily precipitation extremes over China. J. Clim. 2005, 18, 1096–1108. [Google Scholar] [CrossRef]
  35. Kundzewicz, Z.W.; Huang, J.; Pinskwar, I.; Su, B.; Szwed, M.; Jiang, T. Climate variability and floods in China—A review. Earth-Sci. Rev. 2020, 211, 103434. [Google Scholar] [CrossRef]
  36. Ding, Y.H. China Climate; Science Press: Beijing, China, 2013. [Google Scholar]
  37. Wu, S.-Y.; Wu, Y.; Wen, J. Future changes in precipitation characteristics in China. Int. J. Climatol. 2019, 39, 3558–3573. [Google Scholar] [CrossRef]
  38. Beck, H.E.; van Dijk, A.I.J.M.; de Roo, A. Global maps of streamflow characteristics based on observations from several thousand catchments. J. Hydrometeorol. 2015, 16, 1478–1501. [Google Scholar] [CrossRef]
  39. Knapp, K.R.; Ansari, S.; Bain, C.L.; Bourassa, M.A.; Dickinson, M.J.; Funk, C.; Helms, C.N.; Hennon, C.C.; Holmes, C.D.; Huffman, G.J.; et al. Globally gridded satellite observations for climate studies. Bull. Amer. Meteor. Soc. 2011, 92, 893–907. [Google Scholar] [CrossRef]
  40. Fick, S.E.; Hijmans, R.J. WorldClim 2: New 1-km spatial resolution climate surfaces for global land areas. Int. J. Climatol. 2017, 37, 4302–4315. [Google Scholar] [CrossRef]
  41. Nair, A.S.; Indu, J. Performance assessment of Multi-Source Weighted-Ensemble Precipitation (MSWEP) product over India. Climate 2017, 5, 2. [Google Scholar] [CrossRef]
  42. Zhang, W.; Brandt, M.; Guichard, F.; Tian, Q.; Fensholt, R. Using Long-Term Daily Satellite Based Rainfall Data (1983–2015) to Analyze Spatio-Temporal Changes in the Sahelian Rainfall Regime. J. Hydrol. 2017, 550, 427–440. [Google Scholar] [CrossRef]
  43. Xie, P.; Chen, M.; Yang, S.; Yatagai, A.; Hayasaka, T.; Fukushima, Y.; Liu, C. A Gauge-Based Analysis of Daily Precipitation over East Asia. J. Hydrometeorol. 2007, 8, 607–626. [Google Scholar] [CrossRef]
  44. Chen, M.; Shi, W.; Xie, P.; Silva, V.B.S.; Kousky, V.E.; Higgins, R.W.; Janowiak, J.E. Assessing Objective Techniques for Gauge-Based Analyses of Global Daily Precipitation. J. Geophys. Res. 2008, 113, D04110. [Google Scholar] [CrossRef]
  45. Chen, L.; Dirmeyer, P.A. Impacts of Land-Use/Land-Cover Change on Afternoon Precipitation over North America. J. Clim. 2017, 30, 2121–2140. [Google Scholar] [CrossRef]
  46. Satge, F.; Espinoza, R.; Pillco Zola, R.; Roig, H.; Timouk, F.; Molina, J.; Garnier, J.; Calmant, S.; Seyler, F.; Bonnet, M.-P. Role of Climate Variability and Human Activity on Poopo Lake Droughts between 1990 and 2015 Assessed Using Remote Sensing Data. Remote Sens. 2017, 9, 218. [Google Scholar] [CrossRef]
  47. Martens, B.; Miralles, D.G.; Lievens, H.; van der Schalie, R.; de Jeu, R.A.M.; Fernandez-Prieto, D.; Beck, H.E.; Dorigo, W.A.; Verhoest, N.E.C. GLEAM v3: Satellite-based land evaporation and root-zone soil moisture. Geosci. Model Dev. 2017, 10, 1903–1925. [Google Scholar] [CrossRef]
  48. Yang, Y.; Donohue, R.J.; McVicar, T.R. Global estimation of effective plant rooting depth: Implications for hydrological modeling. Water Resour. Res. 2016, 52, 8260–8276. [Google Scholar] [CrossRef]
  49. Schellekens, J.; Dutra, E.; Martinez-de la Torre, A.; Balsamo, G.; van Dijk, A.; Weiland, F.S.; Minvielle, M.; Calvet, J.-C.; Decharme, B.; Eisner, S.; et al. A global water resources ensemble of hydrological models: The eartH2Observe Tier-1 dataset. Earth Syst. Sci. Data 2017, 9, 389–413. [Google Scholar] [CrossRef]
  50. Lupikasza, E.B.; Haensel, S.; Matschullat, J. Regional and seasonal variability of extreme precipitation trends in southern Poland and central-eastern Germany 1951–2006. Int. J. Climatol. 2011, 31, 2249–2271. [Google Scholar] [CrossRef]
  51. Zhao, N.; Yue, T.; Li, H.; Zhang, L.; Yin, X.; Liu, Y. Spatio-temporal changes in precipitation over Beijing-Tianjin-Hebei region, China. Atmos. Res. 2018, 202, 156–168. [Google Scholar] [CrossRef]
  52. Zhang, X.; Cong, Z. Trends of precipitation intensity and frequency in hydrological regions of China from 1956 to 2005. Glob. Planet. Chang. 2014, 117, 40–51. [Google Scholar] [CrossRef]
  53. Liu, B. Observed trends of precipitation amount, frequency, and intensity in China, 1960–2000. J. Geophys. Res. 2005, 110, D08103. [Google Scholar] [CrossRef]
  54. Xu, Z.G.; Wu, Z.Y.; He, H.; Wu, X.; Zhou, J.; Zhang, Y.; Guo, X. Evaluating the accuracy of MSWEP V2.1 and its performance for drought monitoring over mainland China. Atmos. Res. 2019, 226, 17–31. [Google Scholar] [CrossRef]
  55. Zohaib, M.; Kim, H.; Choi, M. Evaluating the patterns of spatiotemporal trends of root zone soil moisture in major climate regions in East Asia. J. Geophys. Res. Atmos. 2017, 122, 7705–7722. [Google Scholar] [CrossRef]
  56. Wu, Z.; Xu, Z.; Wang, F.; He, H.; Zhou, J.; Wu, X.; Liu, Z. Hydrologic evaluation of multi-source satellite precipitation products for the Upper Huaihe River Basin, China. Remote Sens. 2018, 10, 840. [Google Scholar] [CrossRef]
  57. Liu, Q.; McVicar, T.R.; Yang, Z.; Donohue, R.J.; Liang, L.; Yang, Y. The hydrological effects of varying vegetation characteristics in a temperate water-limited basin: Development of the dynamic Budyko-Choudhury-Porporato (dBCP) model. J. Hydrol. 2016, 543, 595–611. [Google Scholar] [CrossRef]
Figure 1. Study area and elevation in China.
Remotesensing 15 04057 g001
Figure 2. The spatial pattern and change slope of the observed start date (a,c) and end date (b,d) of low precipitation intensity during 1980–2022.
Remotesensing 15 04057 g002
Figure 3. The spatial pattern and change slope of the observed start date (a,c) and end date (b,d) of moderate precipitation intensity during 1980–2022.
Remotesensing 15 04057 g003
Figure 4. The spatial pattern and change slope of the observed start date (a,c) and end date (b,d) of heavy precipitation intensity during 1980–2022.
Remotesensing 15 04057 g004
Figure 5. The spatial pattern and change slope of the observed start date (a,c) and end date (b,d) of violent precipitation intensity during 1980–2022.
Remotesensing 15 04057 g005
Figure 6. The change slope for the observed frequency of different precipitation intensities during 1980–2022: (a) LP; (b) MP; (c) HP; (d) VP.
Remotesensing 15 04057 g006
Figure 7. Temporal changes in start date under different precipitation intensities during 1980–2022.
Remotesensing 15 04057 g007
Figure 8. Temporal changes in end date under different precipitation intensities during 1980–2022.
Remotesensing 15 04057 g008
Figure 9. Temporal changes in frequency under different precipitation intensities during 1980–2022.
Remotesensing 15 04057 g009
Disclaimer/Publisher’s Note: The statements, opinions and data contained in all publications are solely those of the individual author(s) and contributor(s) and not of MDPI and/or the editor(s). MDPI and/or the editor(s) disclaim responsibility for any injury to people or property resulting from any ideas, methods, instructions or products referred to in the content.

