Article

A Machine Learning Algorithm to Detect and Analyze Meteor Echoes Observed by the Jicamarca Radar

1
Department of Electrical Engineering, Pennsylvania State University, University Park, PA 16801, USA
2
Department of Electrical and Computer Engineering, Miami University, Oxford, OH 45056, USA
3
Department of Physics, Pennsylvania State University Lehigh Valley, Center Valley, PA 18034, USA
*
Author to whom correspondence should be addressed.
Remote Sens. 2023, 15(16), 4051; https://doi.org/10.3390/rs15164051
Submission received: 30 June 2023 / Revised: 4 August 2023 / Accepted: 11 August 2023 / Published: 16 August 2023
(This article belongs to the Special Issue Atmospheric Dynamics with Radar Observations)

Abstract

:
We present a machine-learning approach to detect and analyze meteor echoes (MADAME), which is a radar data processing workflow featuring advanced machine-learning techniques using both supervised and unsupervised learning. Our results demonstrate that YOLOv4, a convolutional neural network (CNN)-based one-stage object detection model, performs remarkably well in detecting and identifying meteor head and trail echoes within processed radar signals. The detector can identify more than 80 echoes per minute in the testing data obtained from the Jicamarca high power large aperture (HPLA) radar. MADAME is also capable of autonomously processing data in an interferometer mode, as well as determining the target’s radiant source and vector velocity. In the testing data, the Eta Aquarids meteor shower could be clearly identified from the meteor radiant source distribution analyzed automatically by MADAME, thereby demonstrating the proposed algorithm’s functionality. In addition, MADAME found that about 50 percent of the meteors were traveling in inclined and near-inclined circular orbits. Furthermore, meteor head echoes with a trail are more likely to originate from shower meteor sources. Our results highlight the capability of advanced machine-learning techniques in radar signal processing, providing an efficient and powerful tool to facilitate future and new meteor research.

1. Introduction

Millions of interplanetary and interstellar particles constantly hit the Earth’s upper atmosphere. Interplanetary objects ranging in mass from 10 14 kg to several kilograms [1,2] are commonly referred to as meteoroids. Active ground-based radar systems can sense these meteoroids as meteors when they ablate in the Earth’s atmosphere. These meteors are typically detected between 80 km and 120 km in altitude using radar observations [3,4]. Extreme cases with apparent high altitudes up to 180 km have also been reported by [5]. Meteors generally fall under two main categories: shower meteors and sporadic meteors. Shower meteors typically originate from interplanetary particle streams ejected from a ‘parent body’, thereby entering the Earth’s atmosphere with similar radiant directions and velocities [6]. In contrast, sporadic meteors are particles that are not directly associated with a ‘parent body’ in the inner solar system. The vast majority of meteors observed by high-power large aperture (HPLA) radars are sporadic meteors. For example, during major meteor showers, [7] found that at least 97 percent of the meteors observed with the Jicamarca incoherent scatter radar (ISR), a major HPLA facility (11°57′05″S, 76°52′28″W), were sporadic meteors.
Overdense specular echoes, underdense specular echoes, nonspecular echoes, and head echoes are commonly observed in radar observation. Overdense specular echoes are detected when the geometric condition between the radar k vector and the trail orientation satisfies the requirements of specular reflection, i.e., the mirror reflection [8]. Underdense specular echoes are meteor echoes in similar geometric conditions as overdense specular echoes, but they are much weaker by several orders of magnitude. In observations carried out by monostatic systems, specular reflections can be very rare when the radar k vector is pointed to the zenith. The majority of the nonspecular echoes are located by virtue of B-field aligned irregularities and are usually detected when the radar k vector is pointing perpendicular to the Earth’s magnetic field [8,9,10,11]. Nonspecular reflection may also correspond to a high Schmidt number or to dirty plasma surrounding the meteoroid [12,13]. Yet another type of meteor radar echo is the meteor head echo, which is the radio reflection of the ionization close to the meteoroid itself [14]. They are typically detected by an HPLA radar operating in either very-high frequency (VHF) or ultra-high frequency (UHF) ranges [15,16,17,18,19,20].
The physical characteristics of meteoroids, such as speed, height, flux, and radiant distribution, can be derived by analyzing meteor head echoes [4]. Wind and other atmospheric properties may be derived from specular or nonspecular meteor echoes. Furthermore, Chau et al. [21] presented the sporadic meteor sources inferred from the 3D vector velocities of the head echoes by the Jicamarca HPLA radar. In addition, sporadic meteor sources from the MU radar located in Kyoto, Japan, were also reported in a study by [16]. Other physical characteristics of the meteoroids that cannot be directly measured, most notably mass, can also be inferred using various assumptions. Granted that estimating the mass of the meteoroids can be subject to errors due to the complexities of many factors [20], there are three major approaches. The first method is measuring the deceleration of the meteor head echoes. The method was first mentioned by [22]. The work in [18] proposed the ballistic parameter based on observations from the Arecibo observatory (AO), which is essentially the same as the method discovered in 1966. The second method is to use the mass-and-flux-rate relationship [4,14]. Alternatively, the meteoroid’s mass has also been estimated from its radar cross-section (RCS) using the meteor head plasma distribution model [11].
In this paper, we report a complete radar meteor processing package named the machine-learning approach to detect and analyze meteor echoes, hereafter referred to as MADAME. MADAME is a complete process that interprets radar data for meteor studies. MADAME is a highly effective and efficient tool in radar meteor research, which massively reduces manual effort within the various steps employed for interpreting meteor data. MADAME provides a comprehensive compact solution that facilitates meteor research. As a fully automatic tool, MADAME will facilitate and may open new fronts in meteor research.
Figure 1 shows the workflow of MADAME, which consists of several stages. In brief, the analysis begins with raw radar complex (I & Q) voltage data, which are marched through a variety of processing algorithms. It concludes by revealing the physical characteristics inferred from the detected meteors. In Figure 1, the blue squares indicate the results of the intermediate steps that can be presented as plots, processing algorithms, and techniques are represented in green circles, and the red hexagons are the final outputs.
This paper is organized as follows. Section 2 discusses the training and testing data. Section 3 elaborates on the steps and intermediate results of MADAME. In Section 4, the performance analysis of the machine-learning algorithms based on the testing data results is presented. Additionally, the velocity and radiant sources of the meteors are discussed. Finally, Section 5 provides a brief summary of the present work, outlines possible future improvements, and offers a short discussion of potential applications.

2. Data

The data used in this paper were obtained from the Jicamarca HPLA radar from 26–27 February 2006 and 5–6 May 2007. The data of the former period were used as the training data for training the neural networks, and the data of the latter period served as the testing set to evaluate the performance of the detectors and the overall operation of MADAME. The testing data used in the present paper are the same as those in [7], which have a clear view of the North Apex sporadic meteor source, the South Apex sporadic meteor source, and the Eta Aquarids meteor shower. In this paper, the results were all derived from the testing data.
The training data comprised about 10,000 meteors of different classes from the Jicamarca HPLA radar observation campaigns on 26–27 February 2006. More details of the data and the corresponding radar configuration are discussed in [21]. In the training set, a portion of the total region of interest (ROI) was manually labeled for meteor head echoes, meteor trail echoes, and the equatorial electrojet (EEJ). The ROI that was used for inference was a truncated section of the radar range–time–intensity (RTI). The manually labeled set consisted of about 1100 ROIs, which contained about 6000 meteor instances, i.e., the meteor head and trail echoes.
The detector was trained in two steps. First, a mask-region-based convolutional neural network (mask R-CNN) [23] with an inception ResNet V2 backbone [24] was trained by the manually labeled 1100 ROIs on the Google TensorFlow Object Detection API [25]. The mask R-CNN is a popular machine-learning model for object detection, and inception ResNet v2 is one of the many configurations of the mask R-CNN. TensorFlow is an open-source software library developed by Google for machine-learning applications. Then, we trained another detector, namely, the fourth iteration of You Only Look Once (YOLOv4), by the manually selected ‘good’ results from the previous step. The training set in the second step comprised about 10,000 ROIs with about 50,000 meteor instances. The primary reason for training the two different detectors was the interplatform compatibility between MATLAB and Tensorflow. MATLAB 2022a could not use the mask R-CNN detector trained in Tensorflow, which was found to perform slightly better under insufficient training data. We intended to contain the whole detection and processing package in the MATLAB environment. Thus, only MATLAB-supported detectors were implemented in the final product. In the use and possible further training of MADAME, only MATLAB is needed. More details are discussed in Section 3.2 and Section 3.3.

3. Method

3.1. Preprocessing and Radar Decoding

In this paper, the complex voltage data was initially processed using matched filtering, a standard technique to enhance the signal-to-noise ratio (SNR) by applying a coded pulse. The decoding is a relatively straightforward correlation between the transmitted binary phase code (TX) and the received complex voltage signal (RX). The radar data used in this work was carried out with a comparably short 13us Barker code. Given the short radar code length used in our experiment, the Doppler aliasing caused by fast-moving meteor head echoes for the Jicamarca HPLA radar was not substantial enough to be a notable concern. The Nyquist Doppler speed, i.e., the maximum Doppler speed without aliasing, is given by the following:
v = λ Δ Θ 4 π Δ t .
In our experiment configuration, where λ = 6 m, Δ t = 1 × 10 6 S, and Δ Θ = π , the Nyquiest Doppler speed was 1500 km/s, which is vastly higher than the maximum possible speed of an interplanetary meteoroid at 72 km/s. The phase shift caused by the fastest possible interplanetary meteoroid, when combining the pulse length of 13 μs, is still less than the Nyquist limit. The power deficit caused by the meteor’s Doppler effect in our experimental setups is up to −0.7 dB in optimal conditions. The actual power deficit is lower, as the practical TX pulse is imperfect. In radar decoding, the Doppler aliasing of the head echoes is usually treated by the following two methods:
  • A filter bank [15], which essentially repeats the matched filter with different Doppler shifts on TX code and finds the best candidate.
  • Multiplying the complex conjugate of the TX code to the Fast Fourier Transform (FFT) of a truncated section of the RX that equals the length of the TX code and repeats on all altitudes [26].
The outcomes of both decoding approaches are generally identical, despite the fact that there could be some differences depending on the specific implementation. Method 2 could be faster in processing, especially when the required total number of filters or frequency resolution is high because the FFT calculation is highly optimized in modern programming languages. Method 1 may achieve additional performance gains when combined with sidelobe-free decoding [27]. Sidelobe-free decoding is a theoretically optimal technique that generates no side lobes, as its name suggests. However, optimal decoding only performs under ideal conditions where the actual TX pulse is precisely known. In reality, the recorded TX pulse in the Jicamarca Radio Observatory (JRO) is usually somewhat distorted due to sampler saturation.
In this paper, MADAME used the FFT decoding or method 2 as described above for radar pulse decoding. The step-by-step description of the FFT decoding is detailed in Section 2-2, Decoding technique—FFT Decoding, of [28]. In the setup presented in this paper, the RTI was constructed using the first point, or the zero frequency of the FFT spectrum. Because the Doppler resolution of the 13-baud Barker code was 115.4 km/s (1500/13), which is nearly twice the fastest possible meteoroid, all the meteors were included in the first point of the spectrum, while zero padding the FFT can enhance the Doppler resolution, there is a limit to the level of detail that can be retrieved, which is typically around twice the original resolution. Beyond the limit, zero padding the FFT spectrum behaves as smoothing. In our case, the frequency resolution was insufficient to be useful. On the occasion of using a longer TX code where the Doppler shift of the meteors can be resolved, a threshold must be chosen for the FFT spectrum. The RTI should be constructed by the power at the respective spectrum location for those with power higher than the threshold. Additional transfer learning with the data using an experiment-specific radar pulse configuration may be necessary for ideal performance.
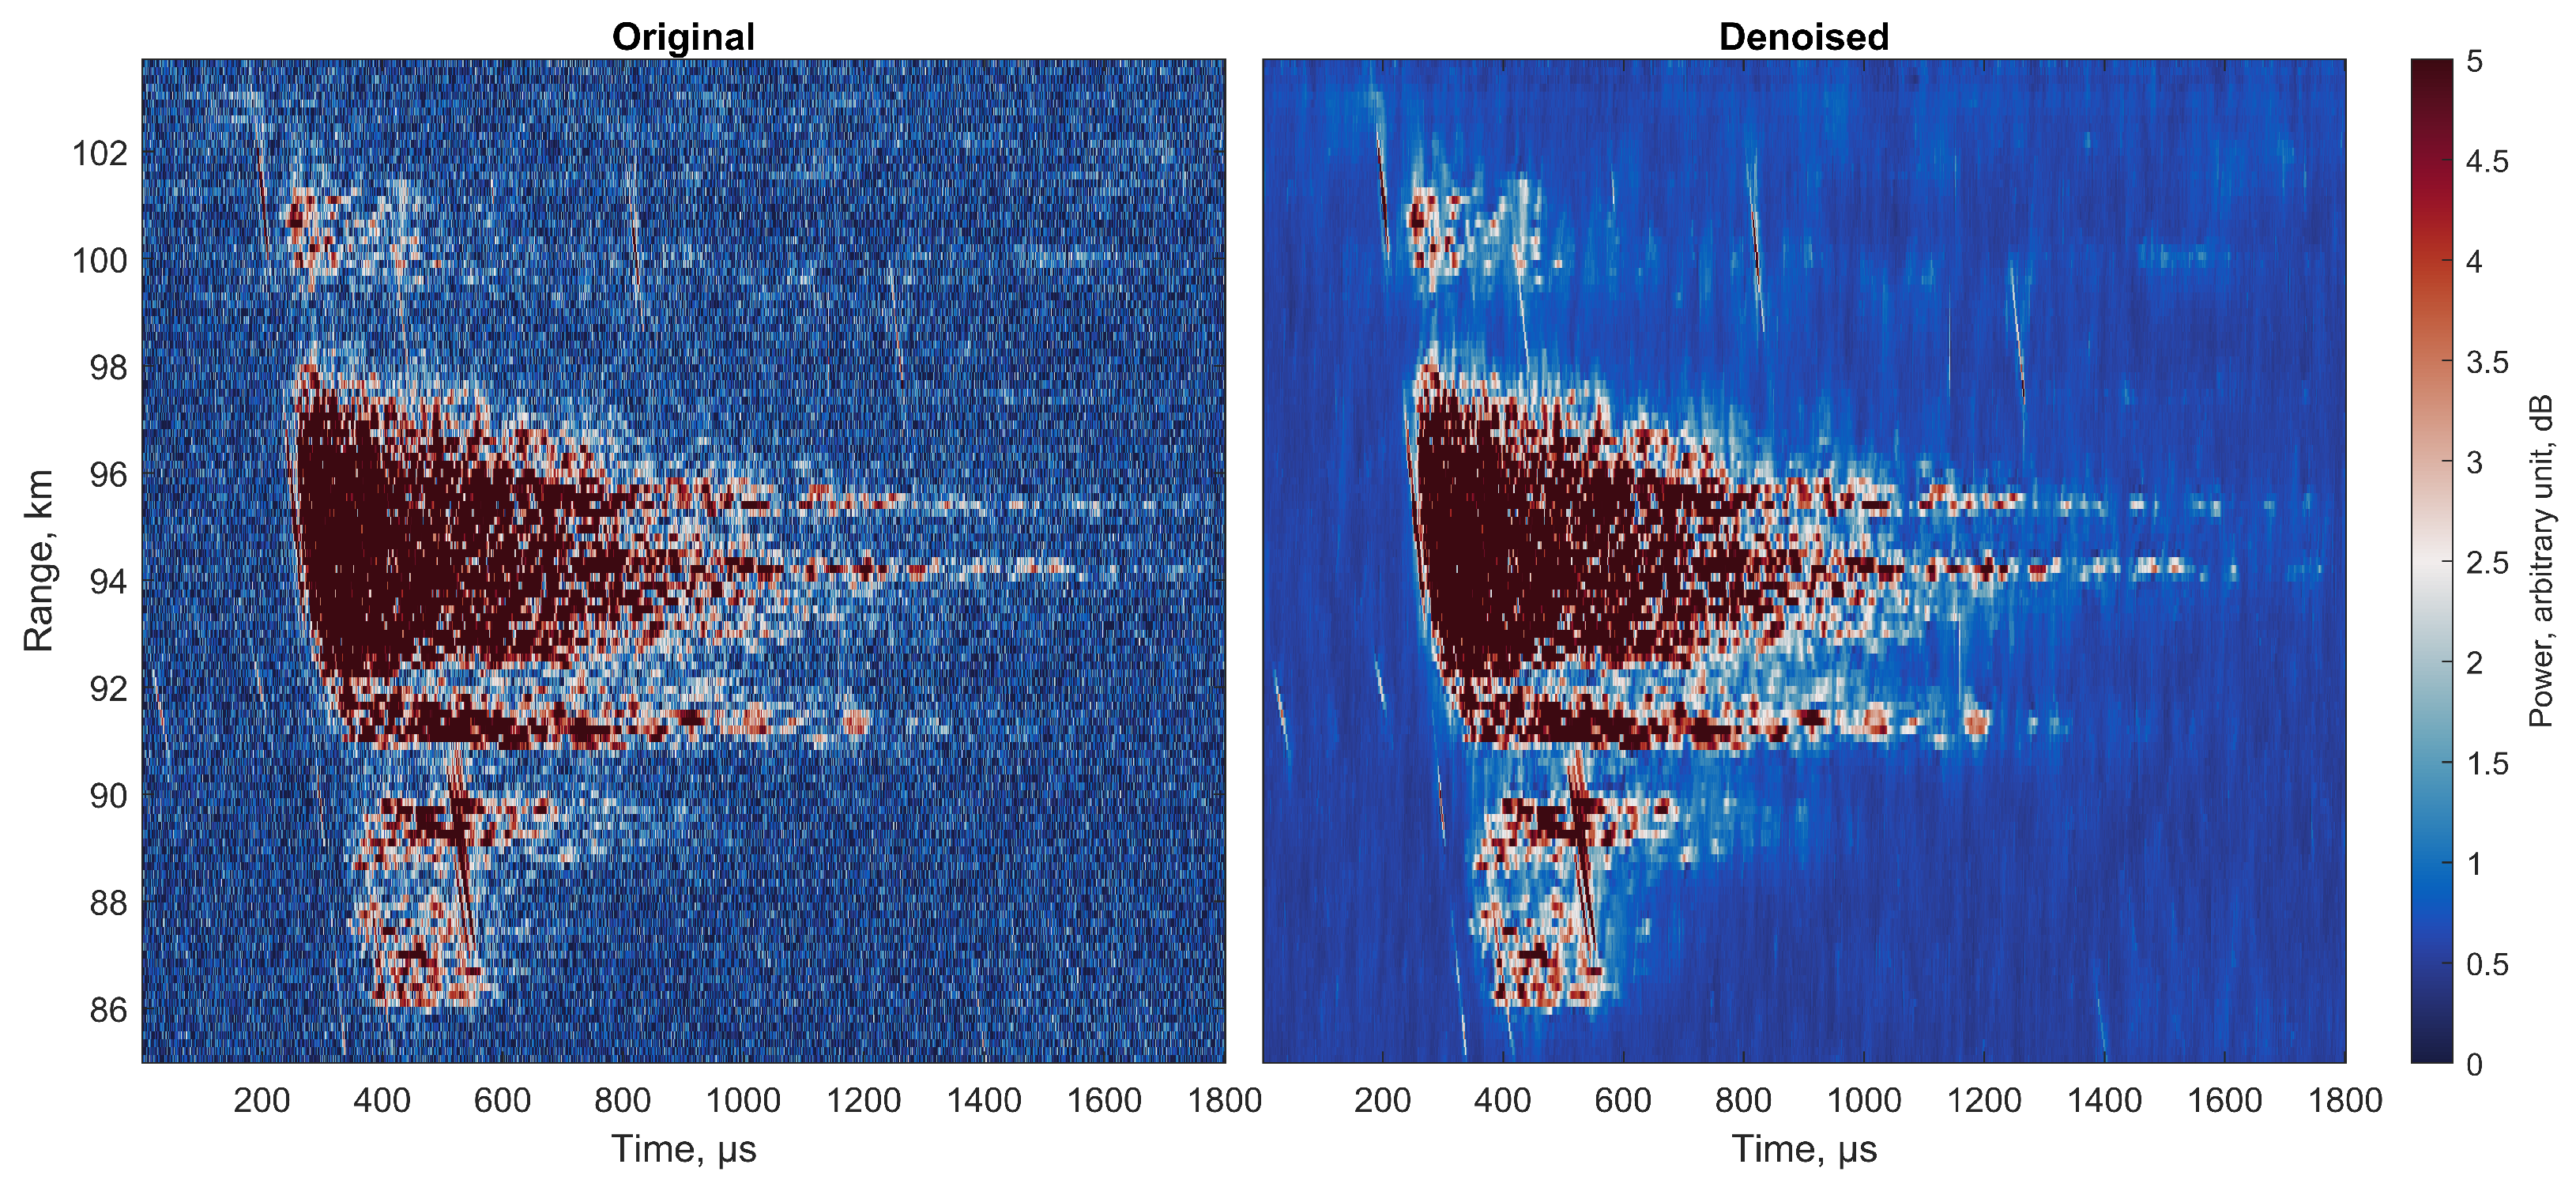
The RTI was constructed by horizontally placing the adjacent decoded radar RXs in the fashion of an image. The RTI was first adjusted by linear contrast that saturated the top and the lower 10% of all the pixels. Doing so made the weaker meteor echoes more prominent and prevented the strong echoes from saturating the dynamic range of the RTI. Then, the RTI was treated by the DnCNN, which is a feed-forward denoising convolutional neural network [29]. As the training set has to be manually labeled, the main purpose of the Gaussian denoising is to prepare the dataset for manual labeling, as it was easier to find meteors on the denoised image. Since the training set was treated by the Gaussian denoising, the testing set was treated the same. Figure 2 shows a comparison between the before and after Gaussian denoising. The denoiser retained nearly all the features of the meteor trail while significantly reducing the noise.

3.2. Meteor Detection

The meteor echoes are usually detected by variants of thresholding-based algorithms or feature extraction functions., e.g., Hough transform [30], which extracts straight line-like shapes from the background via a voting process. In recent years, more capable sensitivity-oriented detection algorithms, such as the detecting meteor head echo with a probabilistic model [4] and the algorithm of head echo automatic detection (AHEAD) [31], have been able to detect between 2 to 10 times more meteors compared to previous algorithmic or manual approaches. However, both algorithms are massively computationally intensive. The processing time is considerably longer than real-time when running on a single computer. For real-time processing, the detection algorithm needs to run faster than in real–time. To achieve this, we tested several deep-learning detectors provided by Google’s TensorFlow. While the performance of these tested detectors was rather satisfactory, most of our other working modules that handle the radar data were written in MATLAB. The intraplatform incompatibility between MATLAB and Python/TensorFlow created some major complications that prevented a seamless workflow at the time of writing this paper. In March 2022, MathWorks released MATLAB 2022a. The new version supports several deep-learning image detectors, most notably YOLOv4 (You Only Look Once Version 4), which is a relatively new and capable detector in computer vision. With the support of YOLOv4 [32], the whole processing workflow could now be completed in MATLAB.

3.3. Detector

YOLOv4, the fourth major variant of the YOLO detector [32], was used as the meteor detector in the present work. It is a one-shot detector, as opposed to multi-stage detectors such as R-CNN [33] and its variants, e.g., fast R-CNN [34], faster R-CNN [35], mask R-CNN [23], etc. Generally speaking, one-shot detectors infer vastly faster than multi-stage detectors, albeit with slightly inferior sensitivity in some applications and implementations. Furthermore, YOLOv4 is relatively less demanding on memory. In MATLAB, due to insufficient memory, our machine (RTX 3090, 24 GB) was unable to train the mask R-CNN detector with an inception ResNet V2 backbone, even with a minimum batch size. The input image must be in a reasonably high resolution, as one of the major objectives, meteor head echoes, are delicate structures. Note that the same network can be successfully trained in the TensorFlow Object detection API, because TensorFlow is apparently better at memory management than MATLAB. However, due to the aforementioned intraplatform compatibility issue between MATLAB and TensorFlow, we were unable to integrate the mask R-CNN seamlessly into the processing workflow. Nevertheless, the final product and possibly additional training could only be achieved using MATLAB.
A default ROI contains 10,000 pulses or 4 s of data with 0.4 ms inter–pulse periods (IPP). In the processing workflow, as shown in Figure 1, YOLOv4 was used to inspect the tentative ROI to decide its ending or cutoff location. If any object is detected near the end of each tentative ROI, the tentative ROI expands until no object is detected within the last 200 pulses in each ROI. Once an ROI is obtained from the RTI, the YOLOv4 detector is used again to perform the actual detection. Using the YOLOv4 detector multiple times does not impede the processing speed, as the inference of the YOLOv4 takes a negligible amount of time. Real-time processing could be achieved by MADAME, which was configured, as shown in Figure 1, in our machine (Intel i9-12900k, RTX 3090) by MATLAB.
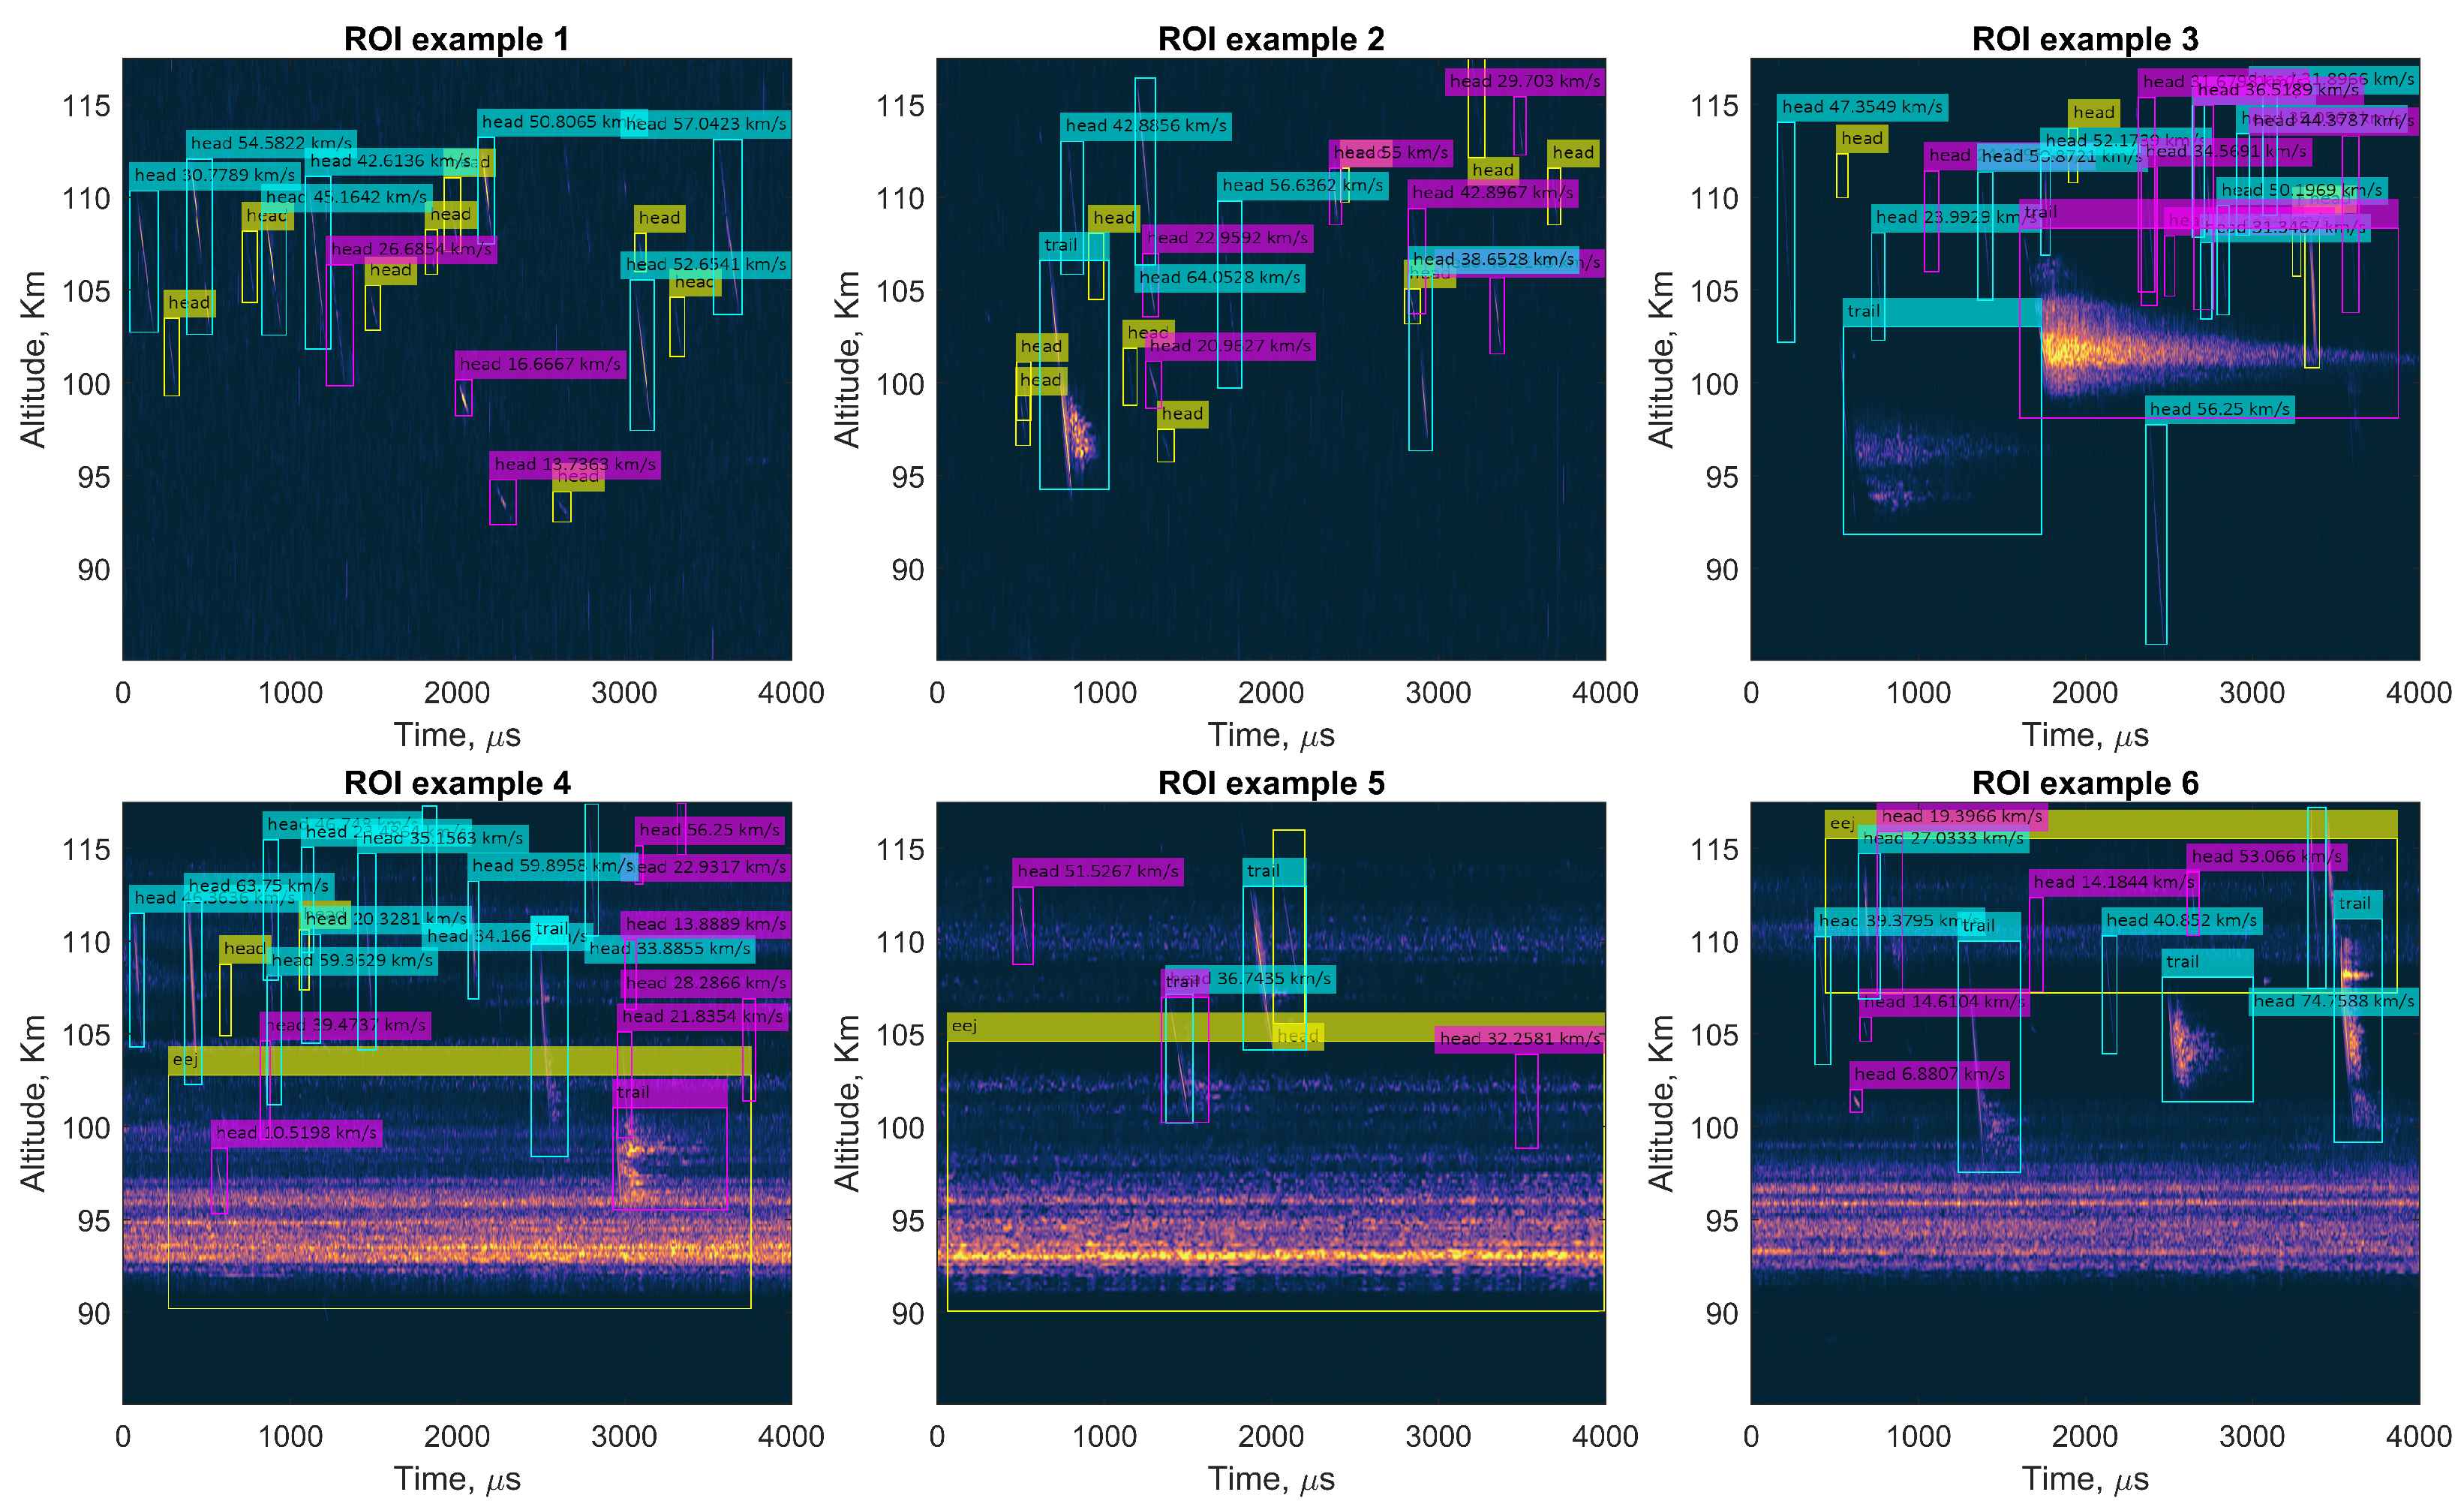
Figure 3 shows three examples of the ROI overlaid with detection bounding boxes. The detections were separated into three types, with each represented by bounding boxes of different colors. The instances labeled with blue bounding boxes represent those that could return vector velocity, i.e., a clear trajectory could be resolved by interferometry, whereas bounding boxes of other colors enclose the instances without good-quality interferometry. The purple boxes indicate that the interpreter that processes the meteor instance could recognize the instance but was unable to extract a clear trajectory. This is most likely owing to a combination of the following two reasons. The first is 2 π aliasing of the interferometry [36], and the other is unable to separate a clean trajectory via clustering. The instances with yellow bounding boxes were either too short or too weak for analysis.
In the current version of MADAME, the detector only detected three classes: meteor head echo, meteor trail echo, and equatorial electrojet (EEJ). They are labeled as ‘head’, ‘trail’, and ‘EEJ’ in the inferred results, respectively, as shown in Figure 3.
As a quick introduction to the evaluation metrics, precision is the fraction of detected objects that are not false detection; recall is the percentage of correct detections out of all labeled objects in the testing set; the F1 score is a weighted metric that combines precision and recall; the average precision (AP) is the area below the precision–recall curve. Higher values are better for all four metrics. More details and applications of these evaluation metrics are discussed extensively in [37]. The quantitative measurements of the detection accuracy of the YOLOv4 detector on the testing set are shown in Table 1. The testing set consisted of 500 ROIs, with 3828 head echoes, 338 trail echoes, and 142 EEJs. The classification threshold or decision threshold was set to 0.5. It should be noted that the manually labeled or manually selected ‘ground-truth’ training data could be far from the truth. Compared to more traditional computer vision applications, the meteor echoes in radar RTIs or ROIs are not as clear and easy to find as ordinary daily objects such as cars, trees, etc. The feature-based meteor head echoes detection algorithm, as discussed in [31], was able to detect far more meteor head echoes than manual selection. Therefore, missing some meteor echoes in manual selection is almost inevitable. Although, as discussed in Section 2, the original manually labeled data of about 1100 ROIs were treated with extra caution and assisted by a full set of image preprocessing techniques, the manually-labeled training data may still miss a decent amount of meteor echoes. That being said, as shown in Table 1, the precision values of all three classes were very high, thus indicating that the detector did not detect many objects that were not in the training set, i.e., they were not surpassing manual performance, which is also justifiable. It is unlikely that the detector could outperform the training set.
The recalls of the three classes were lower than the corresponding accuracies. The numbers indicate that the detector was unable to identify 6 percent of the head echoes correctly and 11.8 percent of the trail echoes compared to manually labeled results. The worse performance regarding the trail echoes may owe to the following two reasons. First, the trail echoes may be extremely similar to the EEJ background, which could lead to low prediction scores that do not surpass the classification threshold. Second, the correctness of each detection is determined by the intersection over union (IoU), which is a number between 0 and 1 that measures the overlap percentage between the ground truth (manually labeled testing set) and the predicted bounding boxes. The limited number of anchor boxes of the YOLO detector may not be able to accommodate all possible sizes of the meteor trail echoes and EEJs. Albeit the fact that the detection performance regarding EEJs was not as good as in the other classes, it is not a problem, as detecting EEJs was not one of the objectives. The EEJ was labeled as a separate class in the training set to facilitate the detector to differentiate meteor trail echoes from the backgrounds, including EEJs.

3.4. Meteor Samples

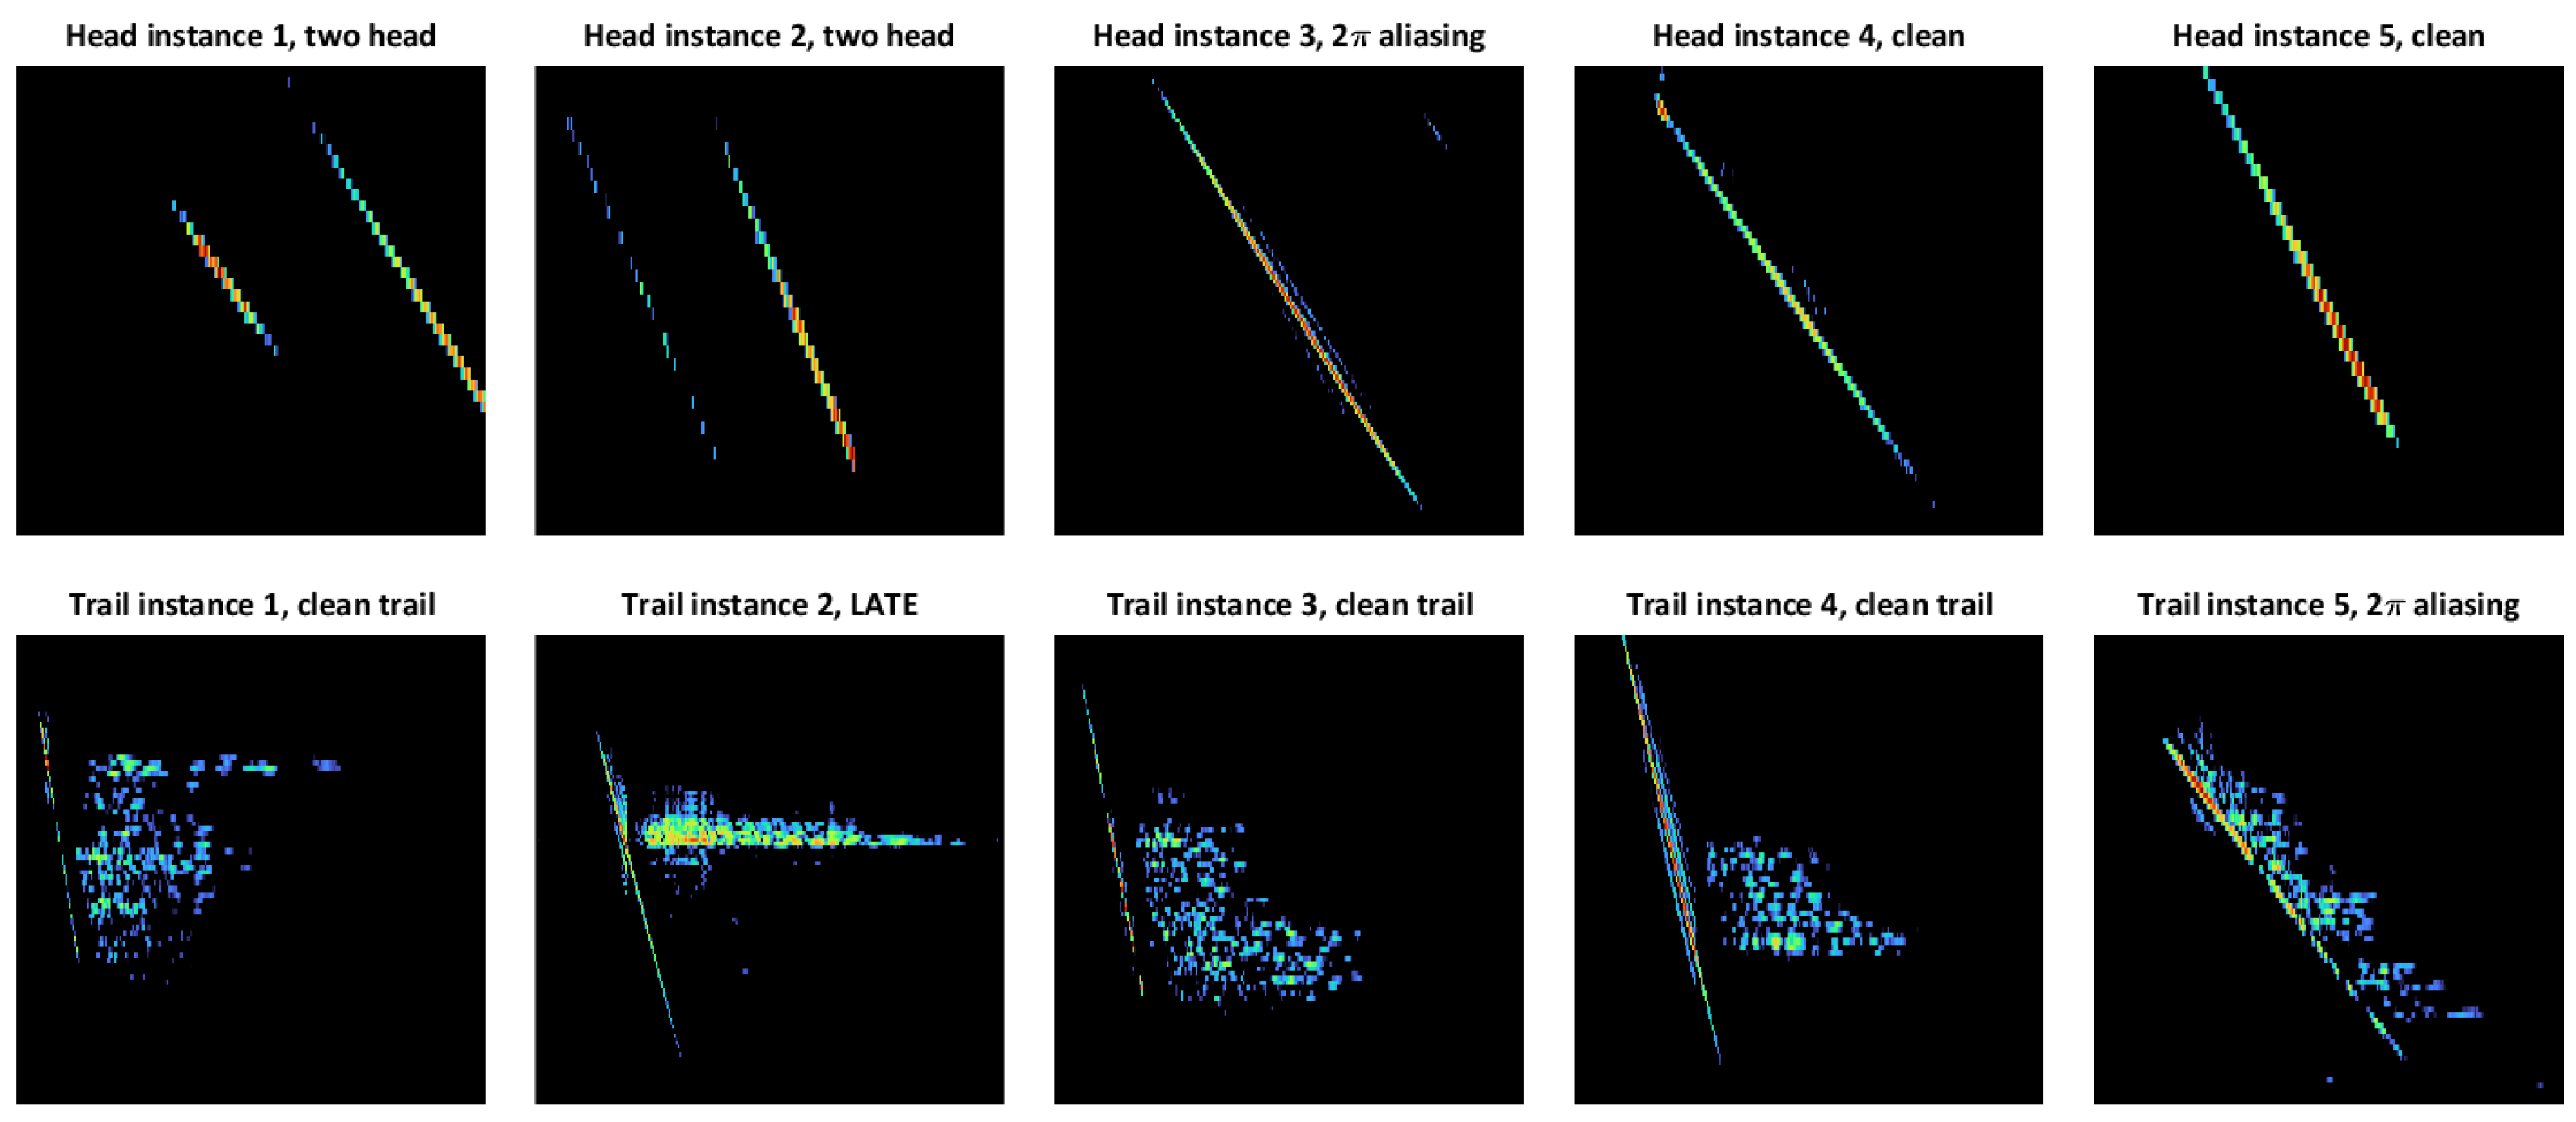
This section discusses the ‘meteor samples’ of the processing workflow in Figure 1. In essence, the meteor samples were extracted from radar raw complex voltages that preferably comprised only one meteor. A set of meteor samples are shown in Figure 4. Note that the images in Figure 4 are the references that assisted in locating the corresponding radar raw complex voltage data. Ideally, each identified meteor image should contain only one meteor. However, meteor echoes that were too close to each other were occasionally selected in one set of meteor samples when a major portion of their bounding boxes overlapped.
The following steps were taken to obtain the clean set of meteor samples, i.e., the data points corresponding to meteor echoes only. First, the data points were retrieved by their bounding boxes returned by the detector. Then, the pixels with a power lower than a percentile threshold were set to 0. The thresholds were the top two percent for head echoes and the top five percent for trail echoes, respectively. Next, the remaining image was processed by a set of morphological filters through closing/opening [38] to remove noise while retaining the main structure. The images shown in Figure 4 demonstrate a few sample results after morphological filtering. Lastly, the remaining pixels served as the reference to locate the corresponding raw radar complex voltage data for further interpretation.

3.5. 3D Scatter Cloud

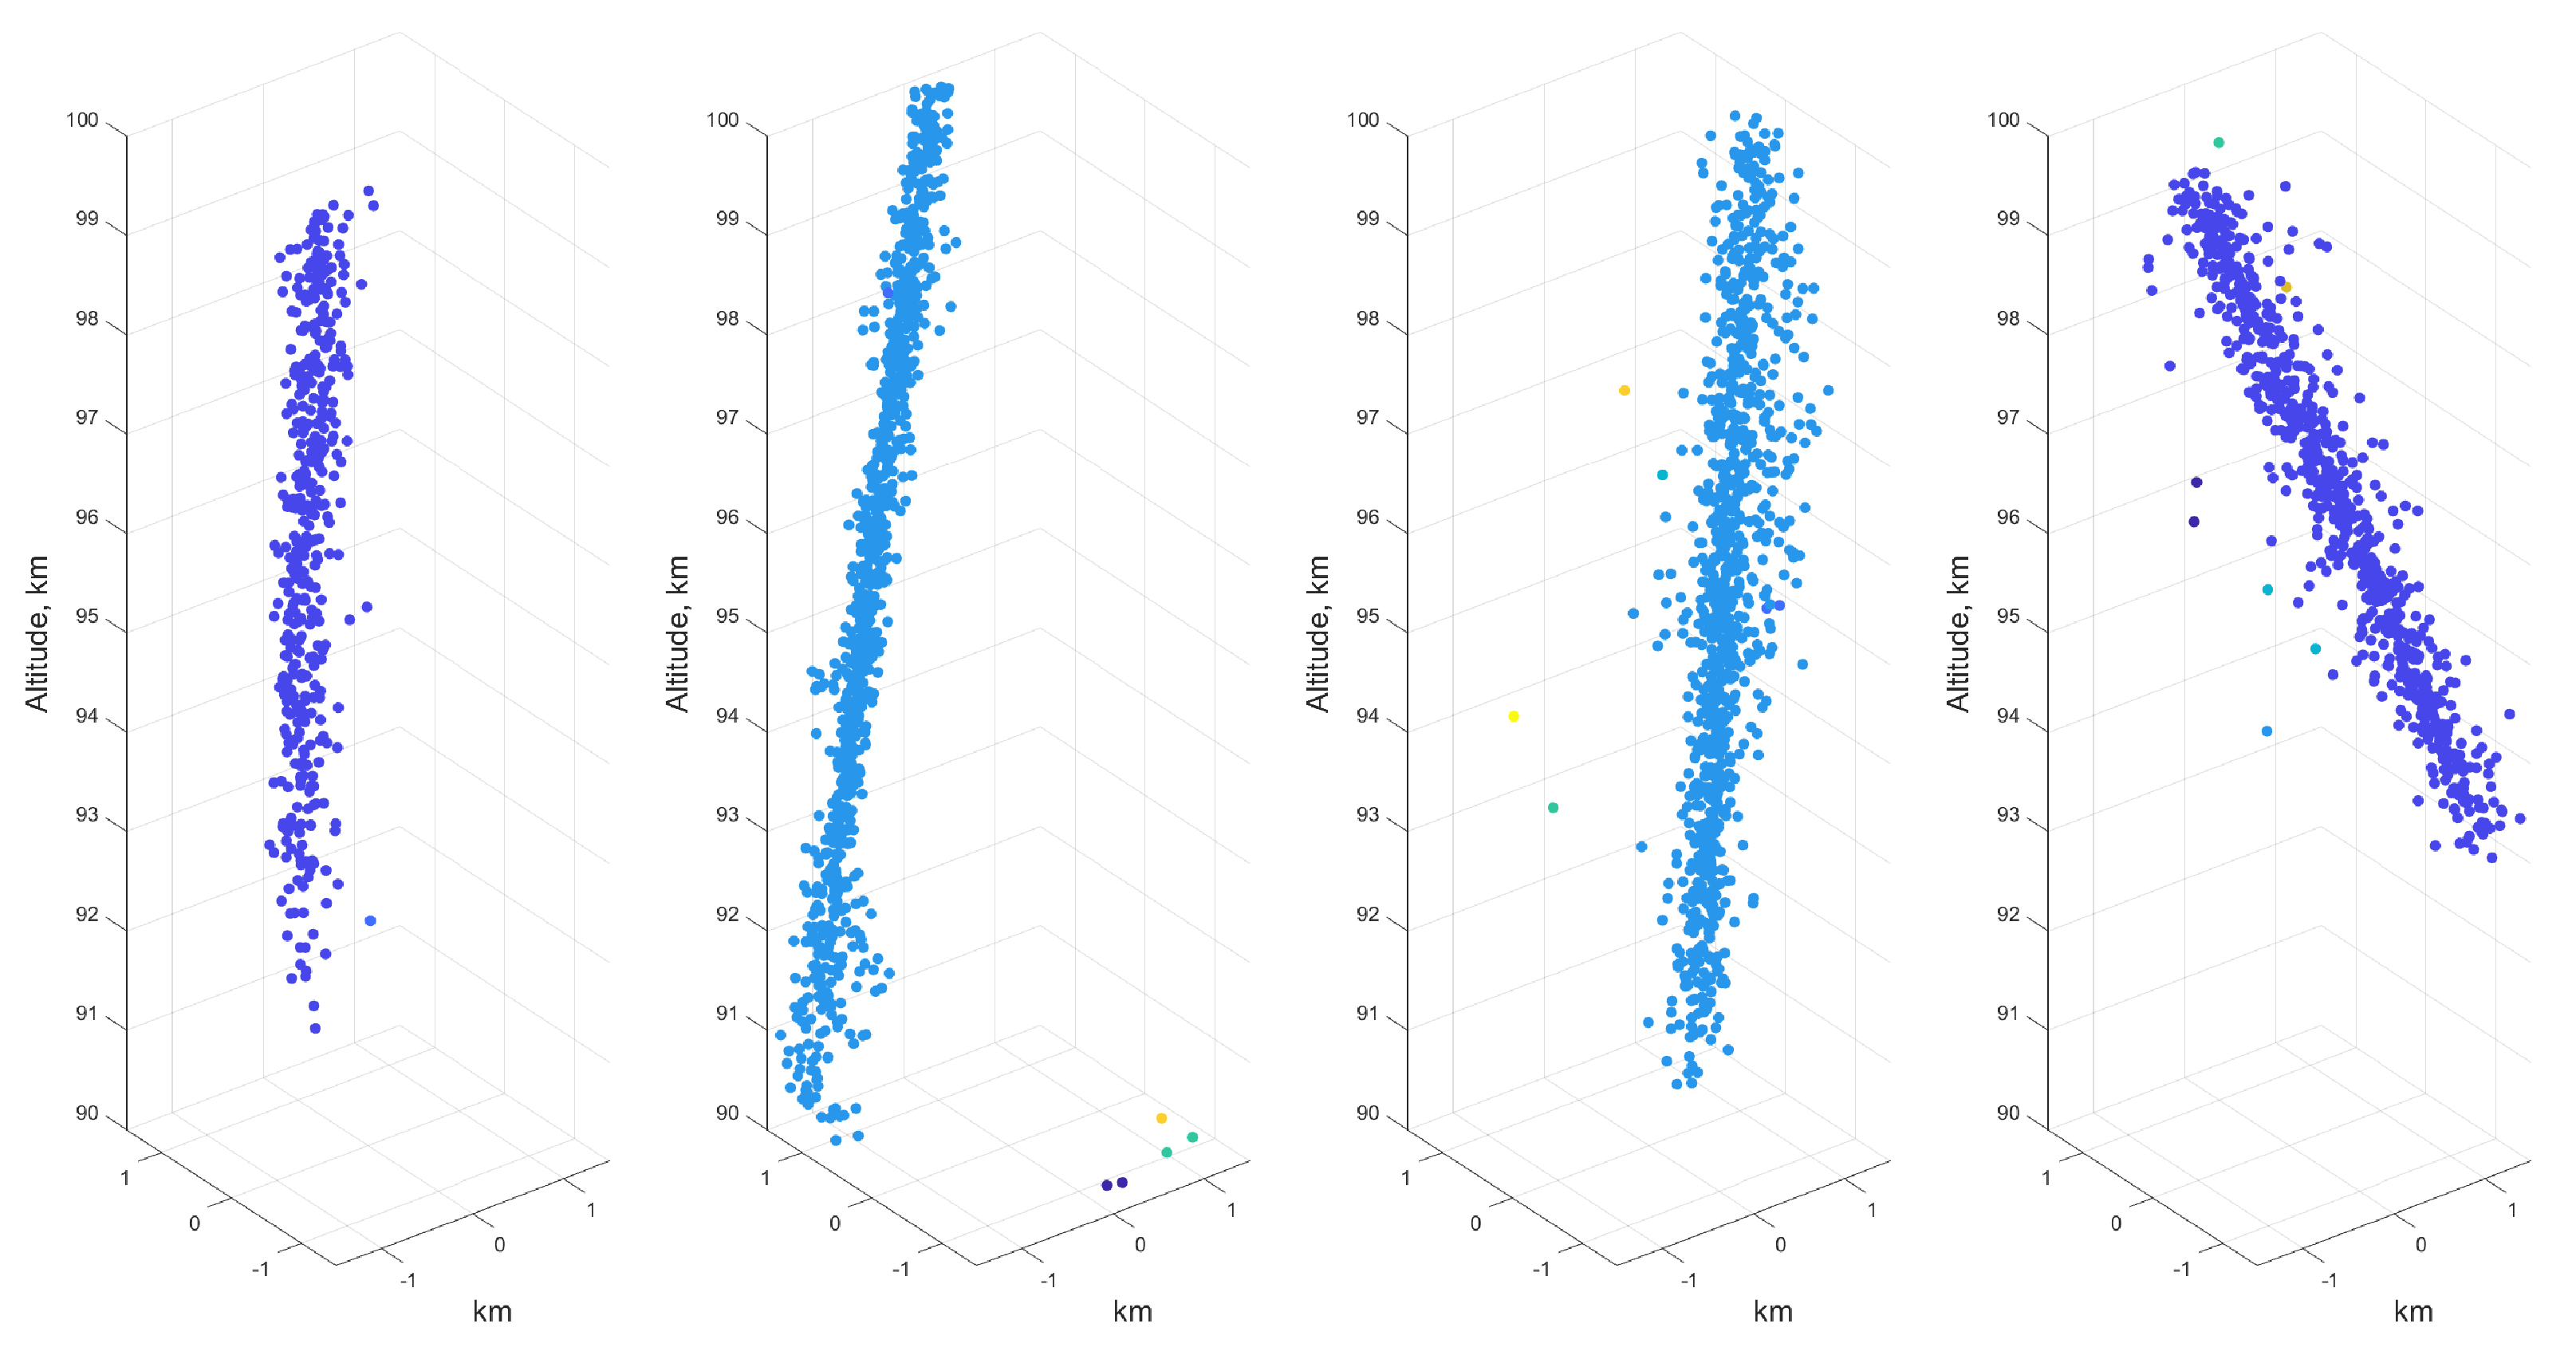
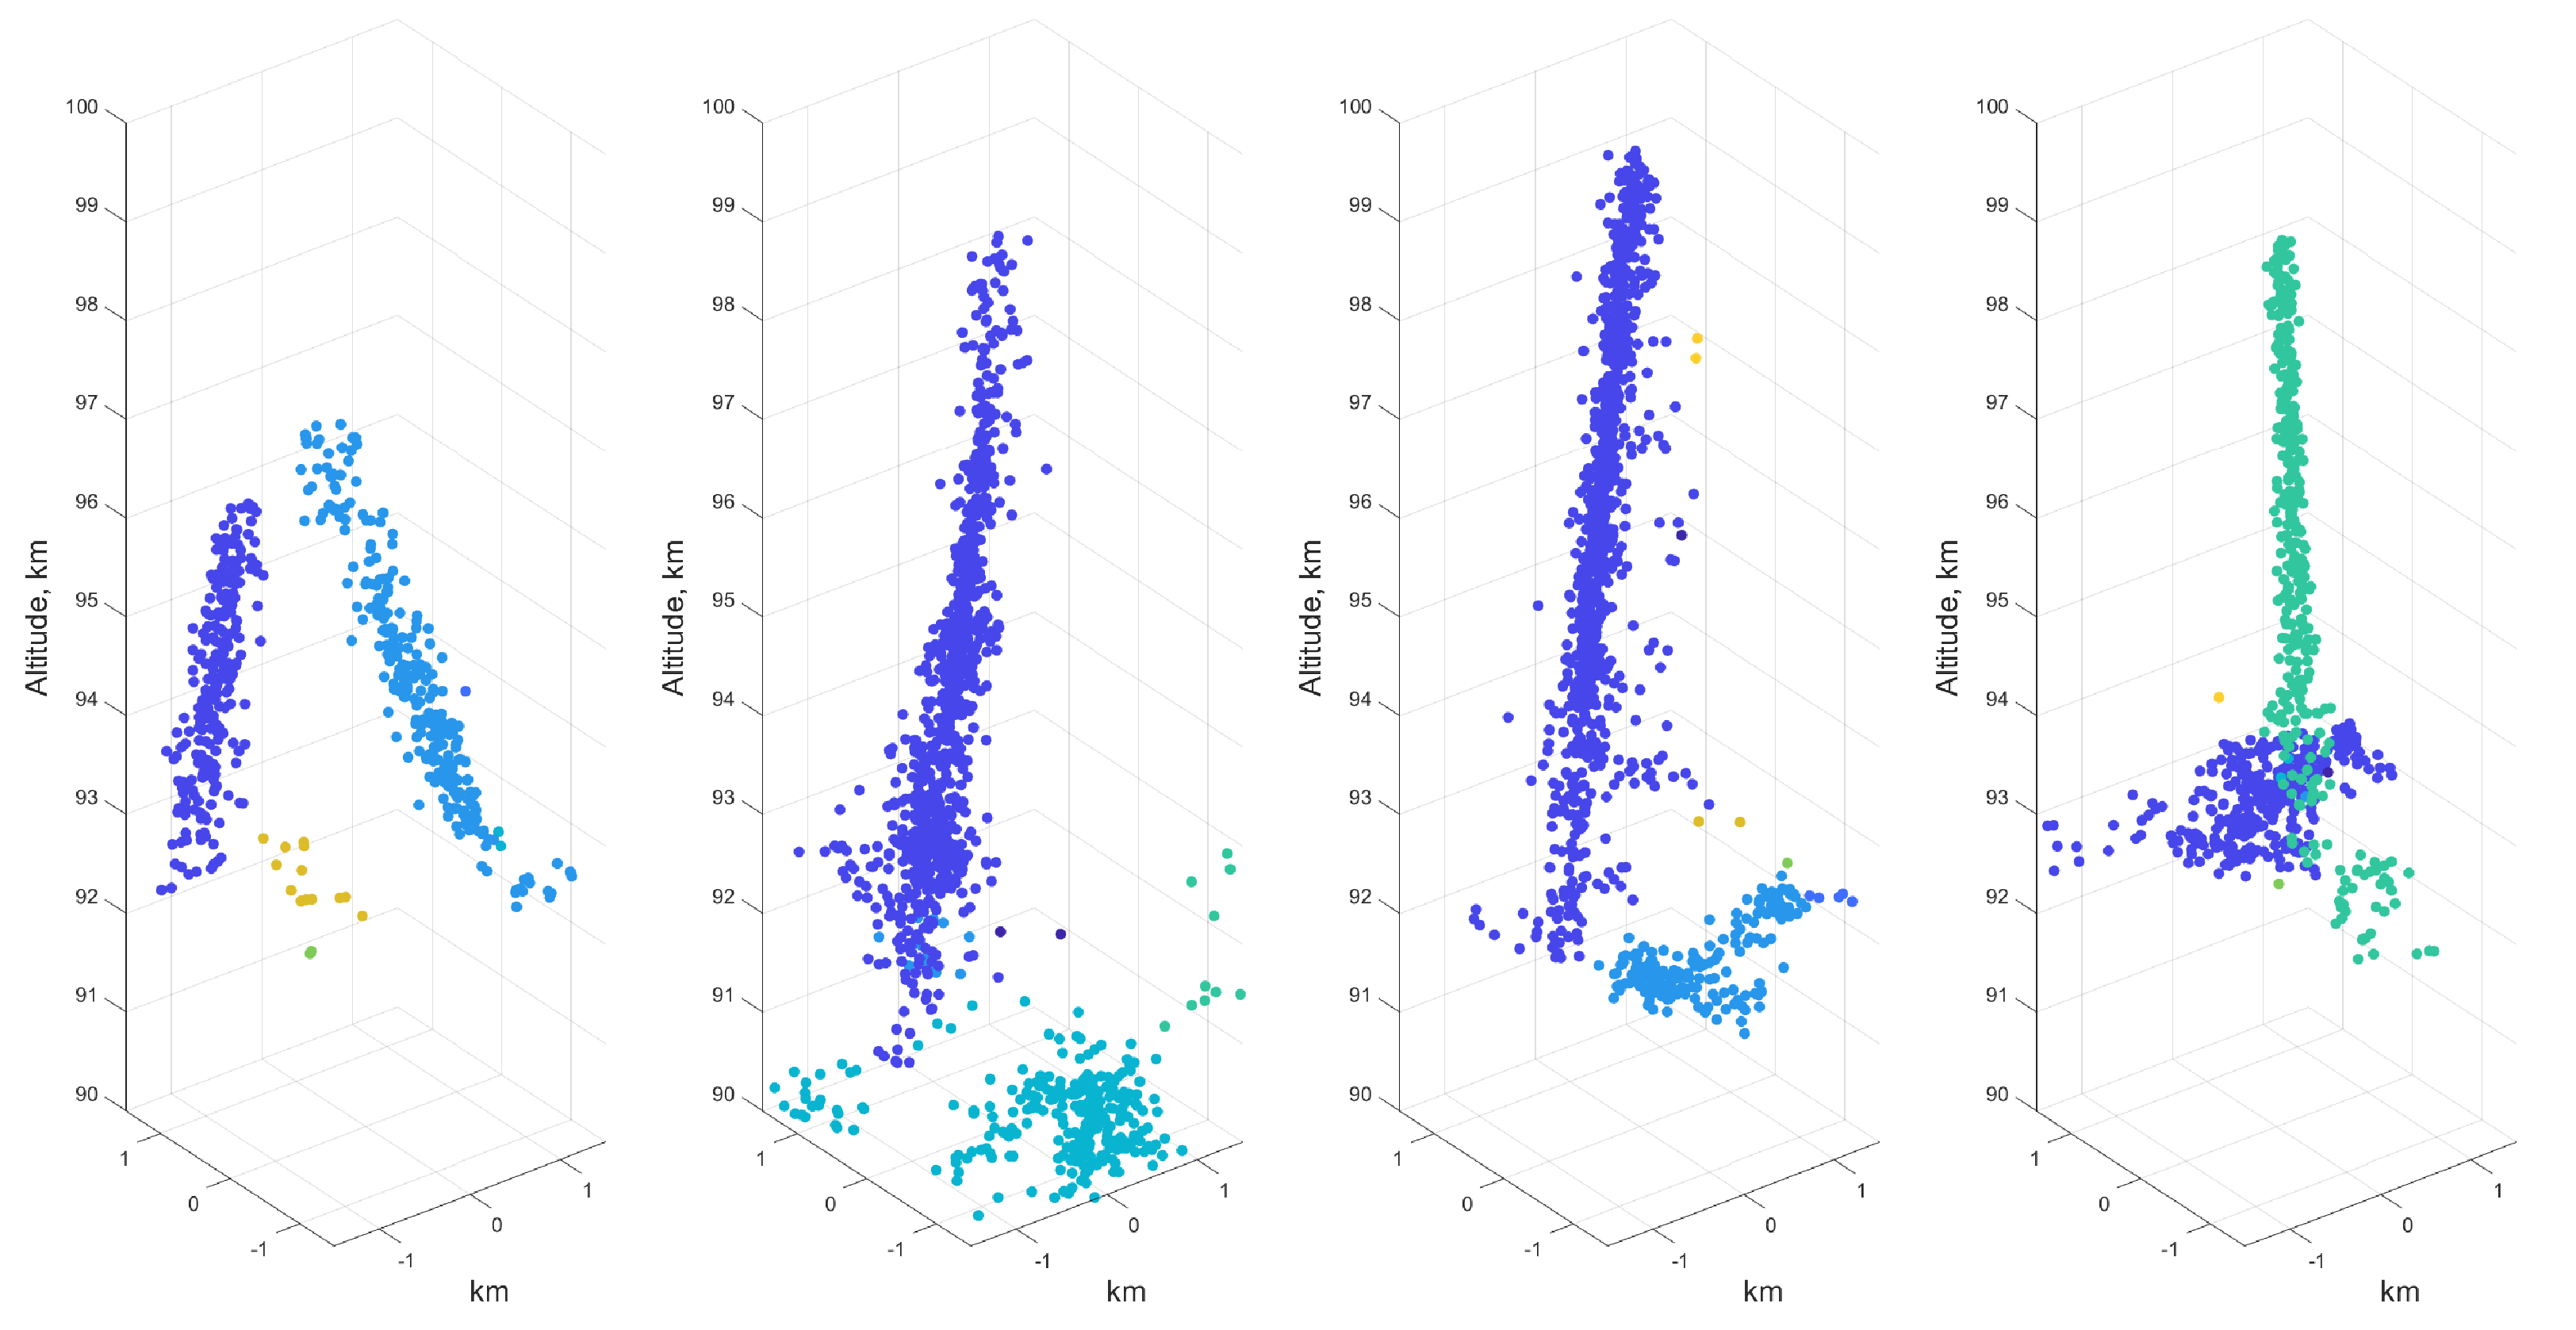
The antennas of the Jicamarca HPLA radar can be arranged into four or more independent receiver units, thus allowing for interferometric detection. Details regarding the interferometry implementation of the Jicamarca HPLA radar are discussed in [15]. Each nonzero pixel in the processed meteor sample, as shown in Figure 4, returns a 3D location above the Jicamarca HPLA radar by interferometry. The results shown in Figure 5 and Figure 6 were obtained by plotting all the 3D locations as separate scatter points. The 3D locations were relative, and the workflow has yet to incorporate phase calibration. The results shown in Figure 5 are the clean paths that contained echoes of one meteor and no aliasing. The examples with two or more separatable events are shown in Figure 6.
As seen by the examples in Figure 6, there could be multiple objects in the 3D scatter clouds derived from one set of meteor samples. To separate these objects, each 3D scatter cloud was processed by single-linkage clustering [39] to identify the individual events. Single-linkage clustering is one of the many approaches used in hierarchical clustering analysis. It is an unsupervised learning technique that seeks to build a hierarchy of clusters, i.e., it allocates scatters into groups. The single linkage connects the nearest scatter to the closest parent scatter group, which is suitable for separating scattering clusters that have some distance between each other. The scatter groups are represented in different colors in Figure 5 and Figure 6.
The clean paths inferred by the interferometer, as shown in Figure 5, are rather self-explanatory. These examples are essentially the path that the meteor traversed. The 3D scatters of the head echoes and trail echoes were usually similar. The sample on the left panel of Figure 5 was a trail echo, which had more points than head echoes and appeared to be ‘thicker’ than the head echoes. Also, this particular meteor trail showed no obvious trace of dynamics.
In Figure 5, a few discrete scatters are represented in different colors. These were the ones with the furthest distance to the nearest scatter that belonged to the main scatter group. The single-linkage clustering allocated scatters into a predetermined number of groups. Thus, scatters that were far from the main group were assigned to different groups, which may as well have only contained themselves.
The samples that contained multiple echoes were where the single-linkage clustering was most effective. In Figure 6, we present three examples containing multiple events: head echoes, trail echoes, or EEJs. The 3D scatter plot of the trail echoes appears to be denser and more spread out, as it contains substantially more points. Nevertheless, the clustering technique will likely fail in the following two scenarios:
  • Interferometry aliasing, i.e., the meteor trajectory is broken into two or more segments due to the interferometer 2 π aliasing. This problem can be addressed by merging the aliased components. The aliased segments can be distinguished from the normal ones by examining the vector direction of the separate segments and the corresponding pixel’s locations on the meteor sample (as shown in Figure 4).
  • The single linkage would likely be unable to separate overlapping meteor echoes and meteor echoes into the EEJ, but these cases rarely occur and do not constitute a notable portion of the total number of meteors.

3.6. Direction Vector

The direction vector can be inferred by fitting a straight line onto the 3D cluster trace of the meteor echoes. There are many approaches to doing this. In this paper, we used singular value decomposition (SVD). The practical SVD was proposed by [40], which remains in use today. The formulation is commonly expressed as follows:
A = U Σ V H .
The SVD is a powerful tool that is widely used in signal processing, statistics, and machine learning. It is conveniently offered as an executable function in major programming languages. In our application, the input of the SVD function, the left side of Equation (2), involved the Cartesian coordinates of the scatters, as shown in Figure 5 and Figure 6, which are arranged into a 3 × N matrix, where N is the number of the scatters in one set of meteor sample. The input Cartesian coordinates were centered by subtracting the mean of the scatter cloud from each scatter point. The fitted 3D slope, i.e., the velocity vector, can be found in the first column of U. The terms Σ and V H on the right side of Equation (2) were not used in our application and, hence, will not be discussed.

4. Results

In this section, we present a variety of the relevant parameters returned by MADAME processing workflow and conduct a comparison with prior findings from [21]. Additionally, we contextualize these results within the broader understanding of meteor echoes, showcasing the algorithm’s effectiveness and accuracy.
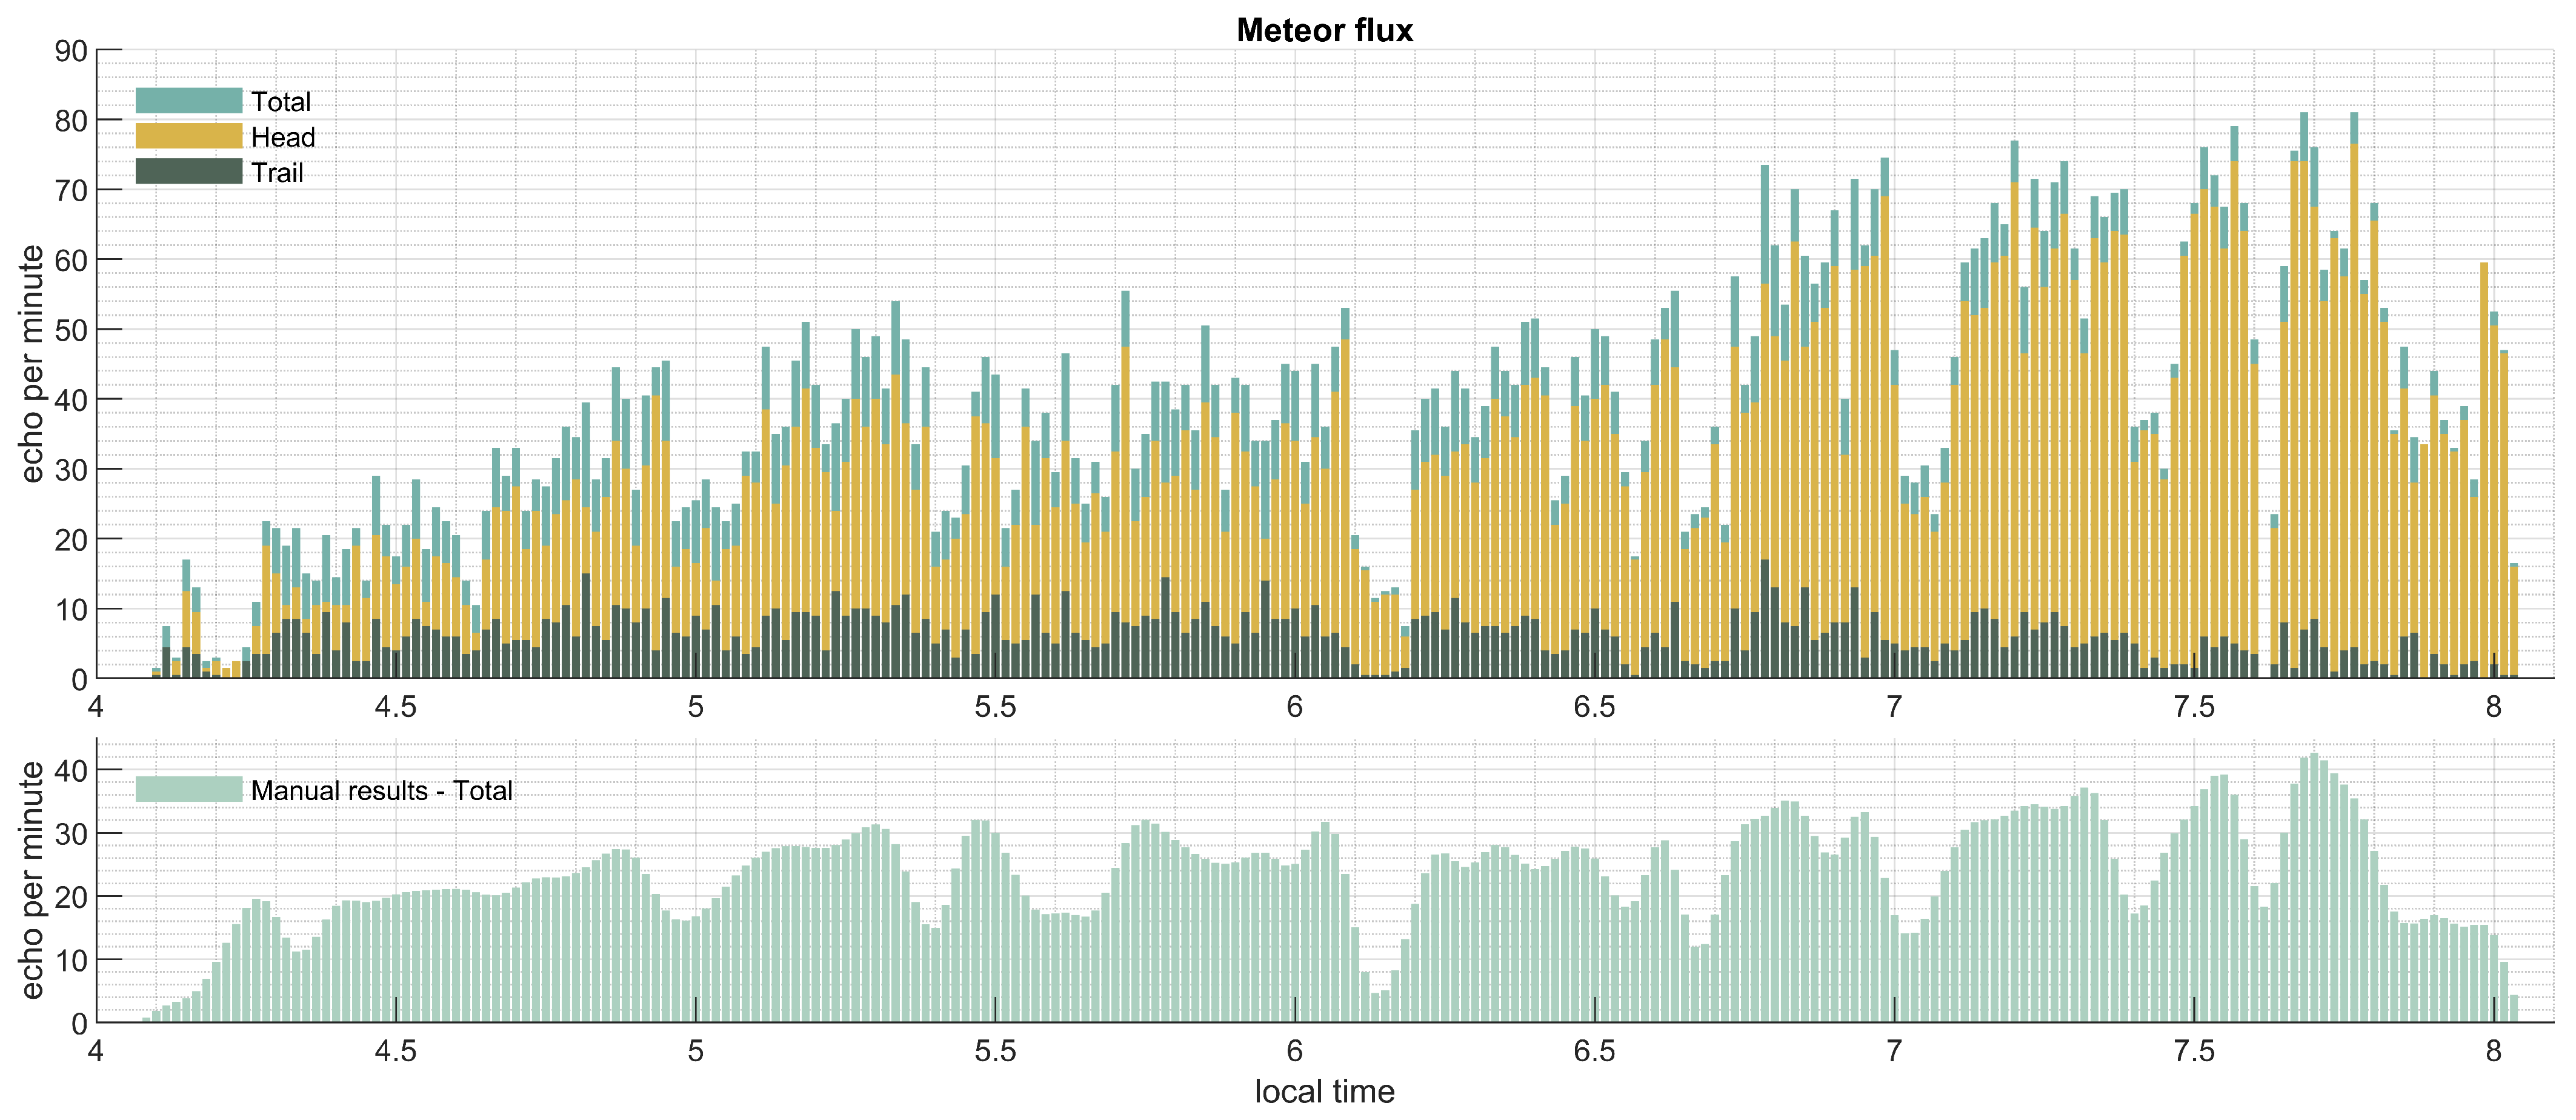
Figure 7 illustrates the meteor flux, i.e., the number of meteors detected as a function of local time. The number of detected meteors was severely affected by the EEJ activities above the Jicamarca site, so the meteor flux presented here may not be an accurate representation of the actual diurnal variation. In our dataset, the YOLOv4 detector detected up to about 80 meteors per minute, which was less than the number detected by the recently developed sensitivity-oriented meteor detection algorithms [19,31], which can detect up to 200 meteors per minute. The YOLOv4 detector’s detection capability was roughly on par with the manual selection, wherein it detected significantly more meteors than the conventional adaptive thresholding technique, which detected about 20 meteors per minute based on our own testing. The flux curve of the meteor head echoes varied between 10 to 80 per minute, whereas the trail echoes’ flux showed less variation. The lower panel of Figure 7 illustrates the results obtained by manually selecting meteors from the same dataset, thereby serving as a ground truth reference. It is important to note that, in principle, the deep learning detector utilizing supervised learning is unlikely to surpass the sensitivity of its training set. Nevertheless, the ‘sensitivity’, as in the manual selection, is influenced by multiple factors, such as the degree of focus, data visualization, and other variables.
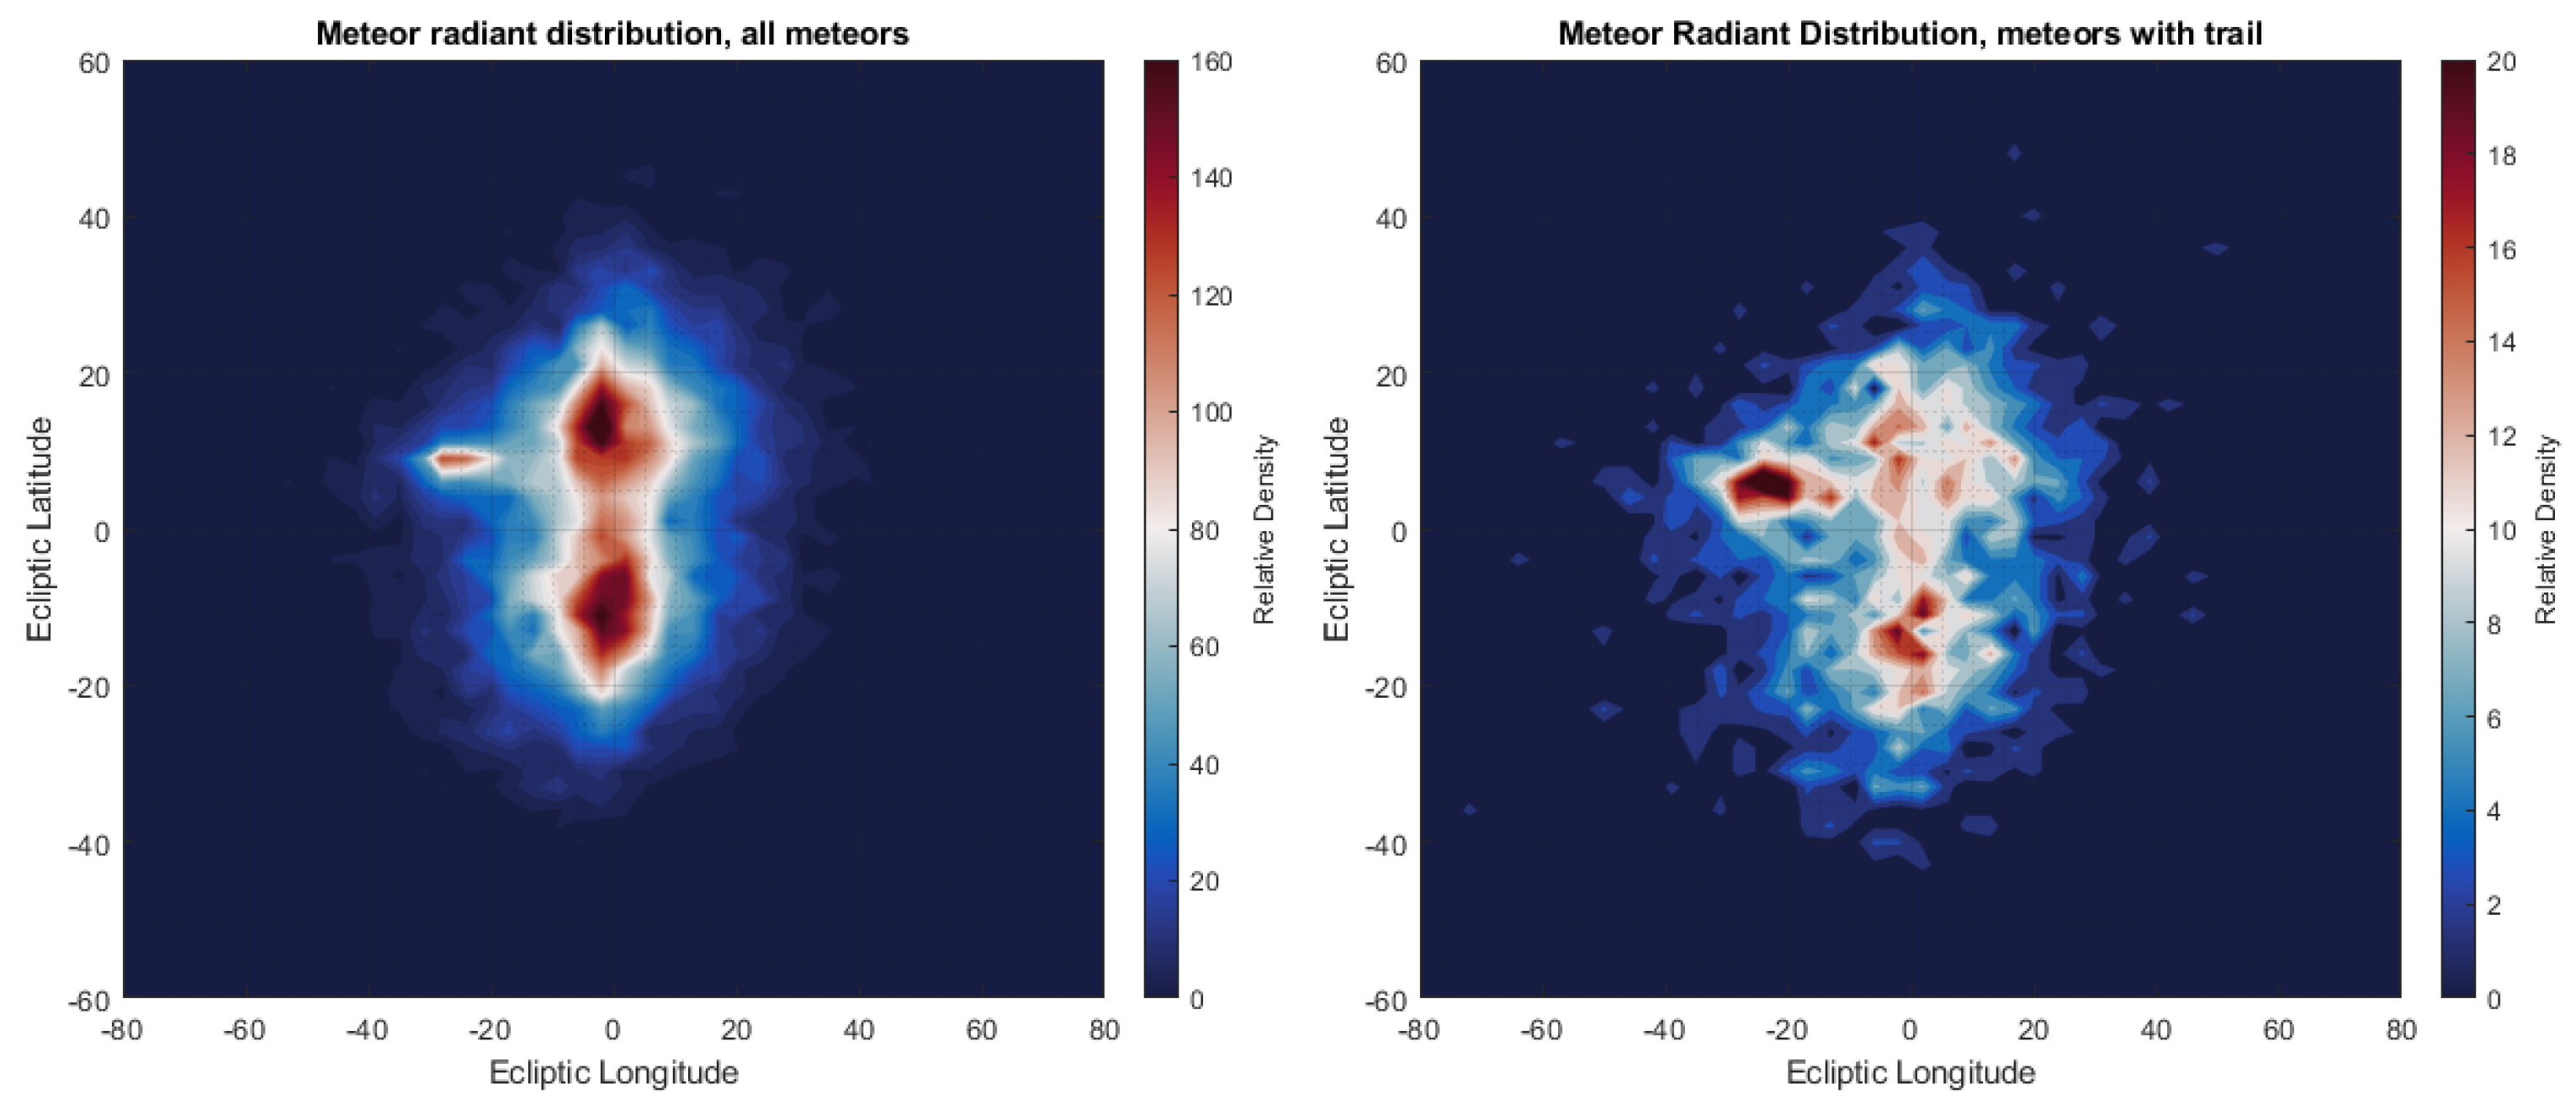
Figure 8 shows the radiant distributions for both the head and trails. The radiant distribution of all the meteors, as shown in the left panel of Figure 8, which was inferred from the dataset by MADAME, was essentially identical to the results, as shown in Figure 3 of [21]. The North and South Apex sporadic meteor sources are clearly visible. In addition, the Eta Aquarids meteor shower was also clearly identified. Upon examining the difference between the two panels of Figure 8, the shower meteors had a much stronger presence in the radiant distribution of the trails than the head echoes. This behavior is consistent with the signal-to-noise effect, as shower meteors are generally believed to be larger in size and mass than sporadic meteors. Therefore, they are more easily detected.
The quantitative analysis of the difference between the shower meteor and the sporadic meteor is an area of active research. The shower meteor is generally believed to be more massive than its sporadic counterpart. Sporadic meteors undergo a mass-correlated evolution process, whereas shower meteors do not [1,41]. The Poynting–Robertson drag force [42] has a more substantial effect on the orbital evolution of lower-mass particles. Our results show that shower meteors were more likely to be observed with a nonspecular trail in the Jicamarca HPLA radar observational data, thereby implying a correlation between the meteor trail and meteor mass. However, despite more massive meteoroids generating more nonspecular trails, the direct cause may not be the size, but rather the ability to deposit more small particles [12].
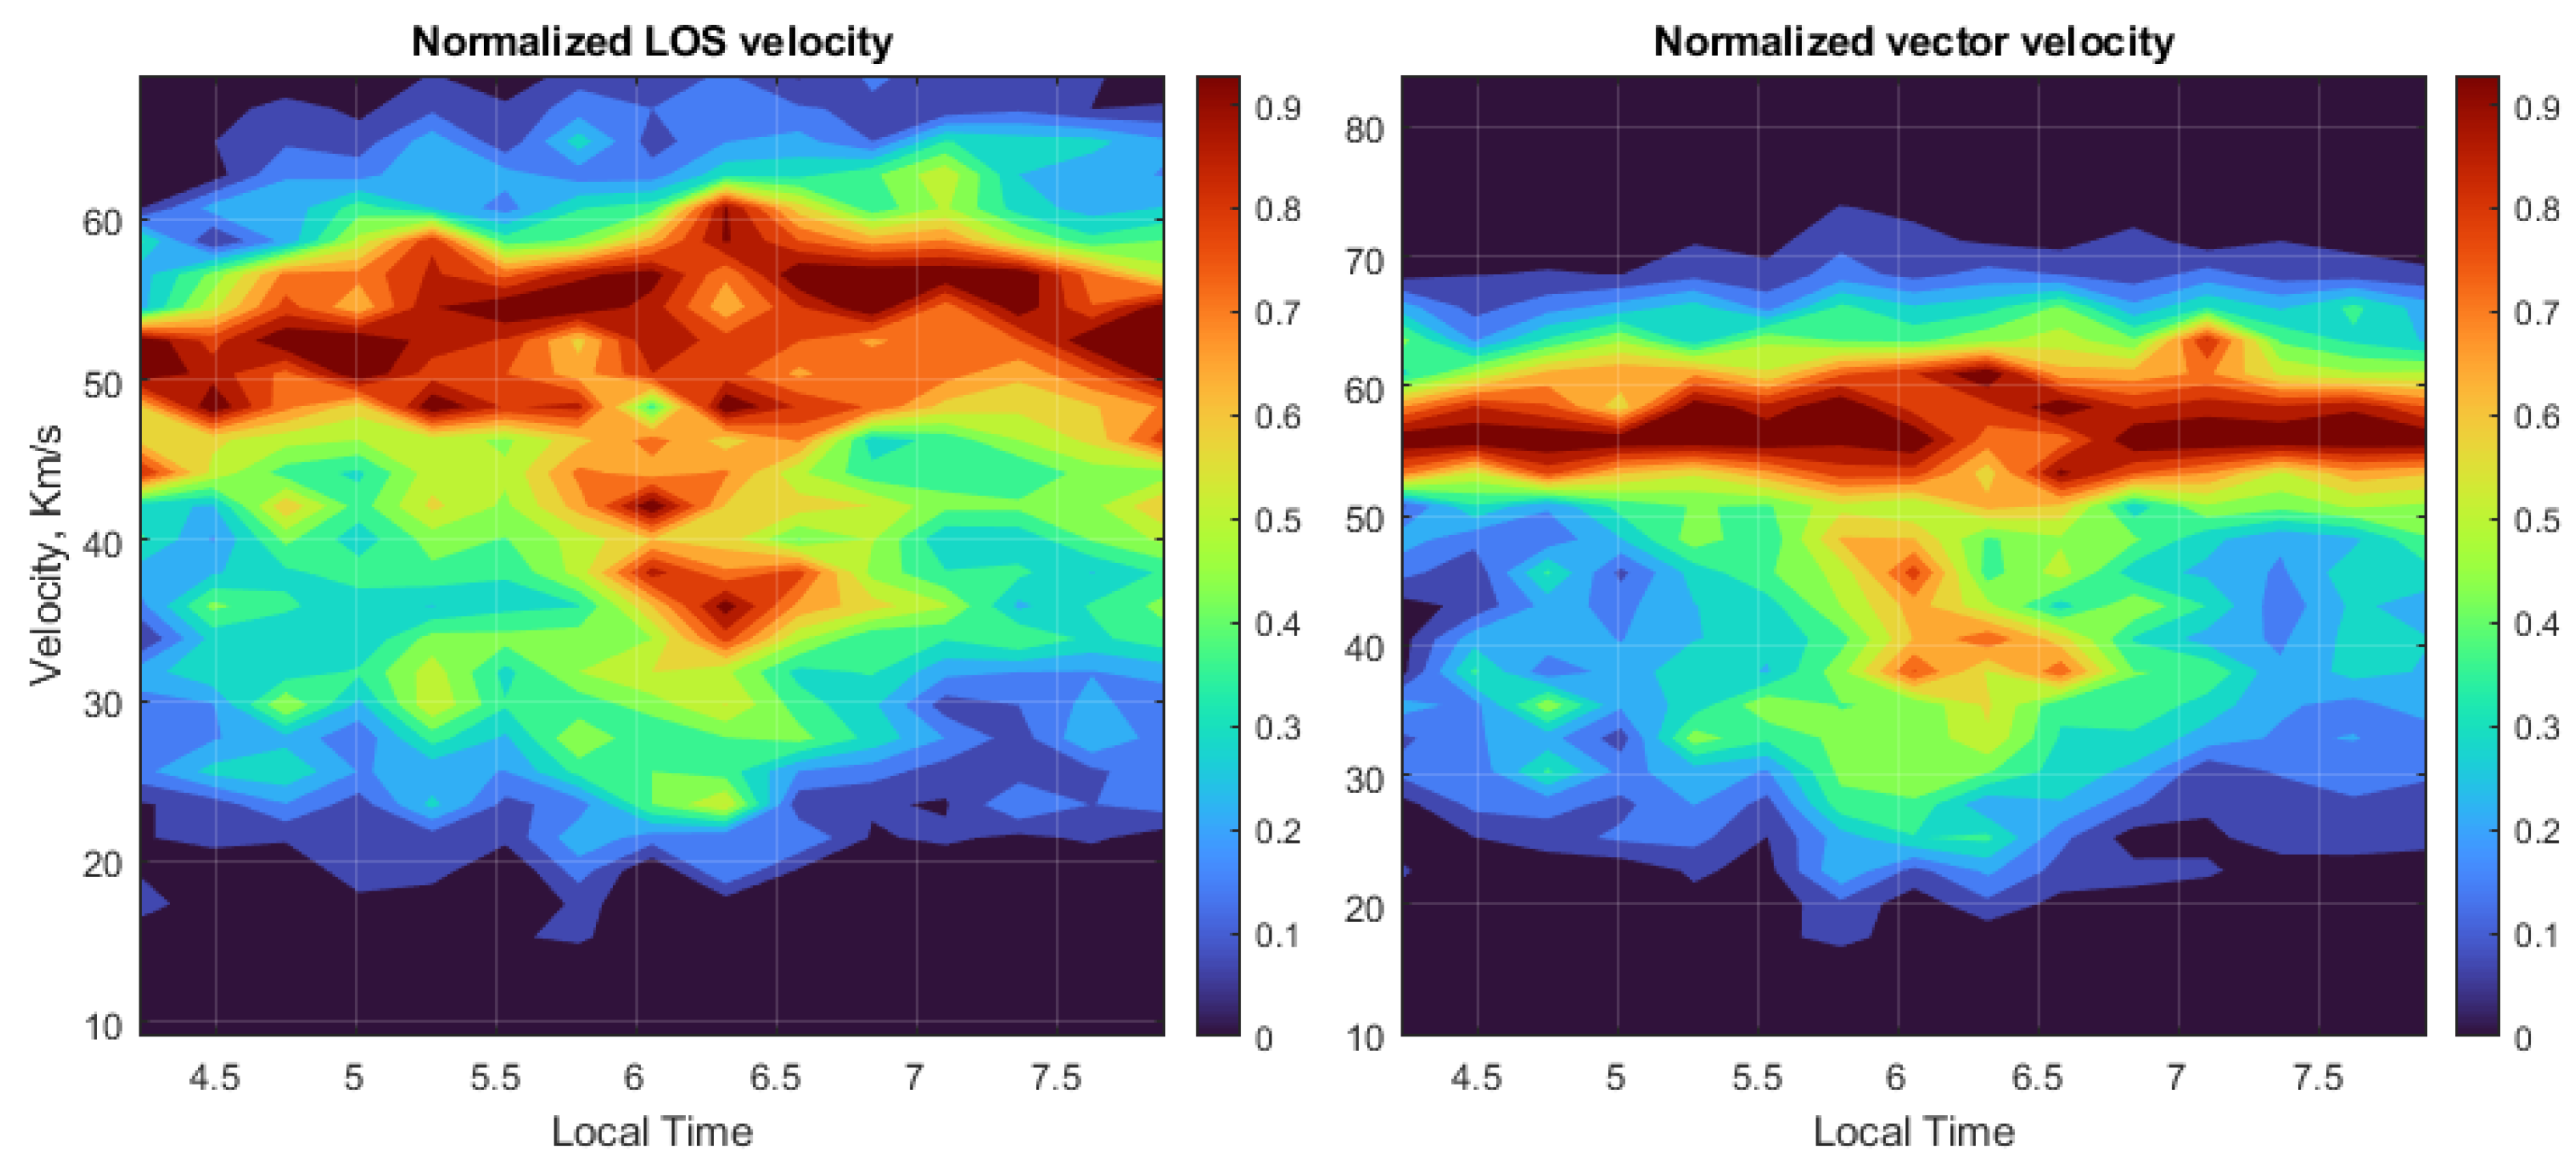
The normalized line of sight (LOS) velocity and the vector velocity distribution of the dataset are shown in Figure 9. The normalized LOS velocity distribution manifested a clear arc-like shape centered around 6 am local time (LT). Considering that most of the sporadic meteors in the present dataset originated from either the North Apex or the South Apex source, the LOS speed of the meteors of the Apex sources should exhibit a sinusoidal pattern due to the Earth’s rotation. The sinusoidal pattern is more visible in the normalized plot. As discussed extensively in [4,16,20,43], a major portion of the meteors of Apex sources are interplanetary particles traveling in low eccentricity retrograde orbit. When combined with the Earth’s moving velocity in the solar system, 30 km/s, the resultant vector speed of these retrograde meteors should be close to 60 km/s. Thus, meteors of Apex sources should encounter the Earth with similar vector velocities, regardless of when they were observed. In other words, a considerable portion of the meteors in the present dataset should possess similar vector velocities. As shown in the right panel of Figure 9, the meteor vector velocity distribution, derived by dividing the LOS speed by the corresponding zenith angle, shows a strong concentration centered around 56 km/s across the whole dataset, irrespective of the local time. The same has also been reported in [21]. The measured vector velocity concentration was marginally slower than the AO measurements, which were centered around 60 km/s. There are several possibilities for the cause of such a velocity discrepancy. First, the JRO data discussed in this work was obtained during the Eta meteor shower, whereas the AO data was not. Second, the difference could be due to the mass difference between the AO and the Jicamarca meteors, with the former being about 2 to 3 orders of magnitude smaller than the latter [19]. Third, the AO and JRO operate at different frequencies, and the AO is technically less sensitive to meteors with slower speeds and higher altitudes than the JRO. Another possibility is that, albeit with calibration in place, the automatic algorithm still tends to overestimate the range coverage of the meteor, thereby leading to a lower range vs. time velocity. However, the algorithmic error is unlikely to cause such a difference.

5. Conclusions

By employing a combination of techniques and algorithms, the testing results suggest that the new automatic algorithm, MADAME, was able to detect and identify meteor head echoes with a sensitivity rivaling manual detection, all while retrieving the various physical parameters of the meteors. In a nutshell, MADAME is able to process the radar data completely autonomously and in real–time, thus detecting and analyzing both head and trail echoes.
The LOS velocity and vector velocity distribution of the meteor head echoes obtained by MADAME shows that about 51.6 percent of meteors were traveling between 53 km/s and 66 km/s, thus indicating that the majority of the detected meteors were in near-circular orbits, which agrees with the previous knowledge of the sporadic meteors. The radiant distribution and velocity distribution returned by the automatic algorithm also agreed with the previous results, as discussed in [21], which clearly recognized the North and South Apex sources, together with the Eta Aquarids meteor shower. Regarding nonspecular trails, the radiant distribution of the nonspecular trails hints that larger meteoroids may generate more nonspecular trails.
Overall, MADAME performed as intended when applied to the data obtained by the Jicamarca HPLA radar, thus showing the viability of applying state-of-the-art computer vision and machine-learning techniques to radar meteor signal processing. The detection sensitivity and accuracy can be further increased with more diverse training data from different experiments and pulse schemes. Moreover, the detection and segmentation performance can be further improved by switching the YOLOv4 detector used in the present work to a more advanced detector if the hardware permits. In conclusion, MADAME takes radar complex voltage signals and outputs the various meaningful physical parameters of meteors, thereby providing a comprehensive solution for radar meteor signal processing that will facilitate future meteor research.

Author Contributions

Conceptualization, Y.L., F.G., J.U. and Q.Z.; methodology, Y.L.; software, Y.L.; validation, Y.L., F.G., J.U., Q.Z. and T.-Y.H.; formal analysis, Y.L., F.G. and J.U.; investigation, Y.L., F.G. and J.U.; resources, F.G. and J.U.; data curation, Y.L.; writing—original draft preparation, Y.L.; writing—review and editing, Y.L., F.G., J.U., Q.Z. and T.-Y.H.; visualization, Y.L.; supervision, J.U. and T.-Y.H.; project administration, J.U. and T.-Y.H.; funding acquisition, J.U. and T.-Y.H. All authors have read and agreed to the published version of the manuscript.

Funding

The study is partially supported by the NSF grants AGS-1744033, AGS-2152109, and AGS-1903346.

Data Availability Statement

The code of MADAME meteor detection algorithm and the sample raw data for testing purposes can be accessed at the ScholarShpere of Pennsylvania State University [44].

Acknowledgments

T.-Y. Huang acknowledges that her work is supported by (while serving at) the National Science Foundation. Any opinion, findings, and conclusions or recommendations expressed in this material are those of the authors and do not necessarily reflect the views of the National Science Foundation.

Conflicts of Interest

The authors declare no conflict of interest.

References

  1. Koschny, D.; Soja, R.H.; Engrand, C.; Flynn, G.J.; Lasue, J.; Levasseur-Regourd, A.C.; Malaspina, D.; Nakamura, T.; Poppe, A.R.; Sterken, V.J.; et al. Interplanetary dust, meteoroids, meteors and meteorites. Space Sci. Rev. 2019, 215, 34. [Google Scholar] [CrossRef]
  2. Bradley, J. Interplanetary dust particles. Treatise Geochem. 2003, 1, 711. [Google Scholar]
  3. Hedges, T.; Lee, N.; Elschot, S. Meteor Head Echo Analyses From Concurrent Radar Observations at AMISR Resolute Bay, Jicamarca, and Millstone Hill. J. Geophys. Res. Space Phys. 2022, 127, e2022JA030709. [Google Scholar] [CrossRef]
  4. Li, Y.; Zhou, Q. Velocity and orbital characteristics of micrometeors observed by the Arecibo 430 MHz incoherent scatter radar. Mon. Not. R. Astron. Soc. 2019, 486, 3517–3523. [Google Scholar] [CrossRef]
  5. Gao, B.; Mathews, J. High-altitude meteors and meteoroid fragmentation observed at the Jicamarca Radio Observatory. Mon. Not. R. Astron. Soc. 2015, 446, 3404–3415. [Google Scholar] [CrossRef]
  6. Reach, W.T.; Kelley, M.S.; Sykes, M.V. A survey of debris trails from short-period comets. Icarus 2007, 191, 298–322. [Google Scholar] [CrossRef]
  7. Chau, J.L.; Galindo, F. First definitive observations of meteor shower particles using a high-power large-aperture radar. Icarus 2008, 194, 23–29. [Google Scholar] [CrossRef]
  8. Galindo, F.; Urbina, J.; Dyrud, L. Effect of neutral winds on the creation of non-specular meteor trail echoes. In Annales Geophysicae; Copernicus GmbH: Göttingen, Germany, 2021; Volume 39, pp. 709–719. [Google Scholar]
  9. Zhou, Q.H.; Mathews, J.D.; Nakamura, T. Implications of meteor observations by the MU radar. Geophys. Res. Lett. 2001, 28, 1399–1402. [Google Scholar] [CrossRef]
  10. Dyrud, L.P.; Ray, L.; Oppenheim, M.; Close, S.; Denney, K. Modelling high-power large-aperture radar meteor trails. J. Atmos. Sol. Terr. Phys. 2005, 67, 1171–1177. [Google Scholar] [CrossRef]
  11. Sugar, G.; Marshall, R.; Oppenheim, M.; Dimant, Y.; Close, S. Simulation-Derived Radar Cross Sections of a New Meteor Head Plasma Distribution Model. J. Geophys. Res. Space Phys. 2021, 126, e2021JA029171. [Google Scholar] [CrossRef]
  12. Close, S.; Kelley, M.; Vertatschitsch, L.; Colestock, P.; Oppenheim, M.; Yee, J. Polarization and scattering of a long-duration meteor trail. J. Geophys. Res. Space Phys. 2011, 116, A1. [Google Scholar] [CrossRef]
  13. Chau, J.; Strelnikova, I.; Schult, C.; Oppenheim, M.; Kelley, M.; Stober, G.; Singer, W. Nonspecular meteor trails from non-field-aligned irregularities: Can they be explained by presence of charged meteor dust? Geophys. Res. Lett. 2014, 41, 3336–3343. [Google Scholar] [CrossRef]
  14. Zhou, Q.; Tepley, C.A.; Sulzer, M.P. Meteor observations by the Arecibo 430 MHz incoherent scatter radar—I. Results from time-integrated observations. J. Atmos. Terr. Phys. 1995, 57, 421–431. [Google Scholar] [CrossRef]
  15. Chau, J.; Woodman, R. Observations of meteor-head echoes using the Jicamarca 50 MHz radar in interferometer mode. Atmos. Chem. Phys. 2004, 4, 511–521. [Google Scholar] [CrossRef]
  16. Kero, J.; Szasz, C.; Nakamura, T.; Meisel, D.; Ueda, M.; Fujiwara, Y.; Terasawa, T.; Nishimura, K.; Watanabe, J. The 2009–2010 MU radar head echo observation programme for sporadic and shower meteors: Radiant densities and diurnal rates. Mon. Not. R. Astron. Soc. 2012, 425, 135–146. [Google Scholar] [CrossRef]
  17. Close, S.; Oppenheim, M.; Durand, D.; Dyrud, L. A new method for determining meteoroid mass from head echo data. J. Geophys. Res. Space Phys. 2005, 110, A9. [Google Scholar] [CrossRef]
  18. Janches, D.; Mathews, J.; Meisel, D.; Zhou, Q.H. Micrometeor observations using the Arecibo 430 MHz radar: I. Determination of the ballistic parameter from measured Doppler velocity and deceleration results. Icarus 2000, 145, 53–63. [Google Scholar] [CrossRef]
  19. Li, Y.; Zhou, Q.; Scott, M.; Milla, M. A study on meteor head echo using a probabilistic detection model at Jicamarca. J. Geophys. Res. Space Phys. 2020, 125, e2019JA027459. [Google Scholar] [CrossRef]
  20. Li, Y.; Zhou, Q.; Urbina, J.; Huang, T.Y. Sporadic micro-meteoroid source radiant distribution inferred from the Arecibo 430 MHz radar observations. Mon. Not. R. Astron. Soc. 2022, 515, 2088–2098. [Google Scholar] [CrossRef]
  21. Chau, J.L.; Woodman, R.F.; Galindo, F. Sporadic meteor sources as observed by the Jicamarca high-power large-aperture VHF radar. Icarus 2007, 188, 162–174. [Google Scholar] [CrossRef]
  22. Evans, J. Radar observations of meteor deceleration. J. Geophys. Res. 1966, 71, 171–188. [Google Scholar] [CrossRef]
  23. He, K.; Gkioxari, G.; Dollár, P.; Girshick, R. Mask r-cnn. In Proceedings of the IEEE International Conference on Computer Vision, Venice, Italy, 22–29 October 2017; pp. 2961–2969. [Google Scholar]
  24. Szegedy, C.; Ioffe, S.; Vanhoucke, V.; Alemi, A.A. Inception-v4, inception-resnet and the impact of residual connections on learning. In Proceedings of the Thirty-First AAAI Conference on Artificial Intelligence, San Francisco, CA, USA, 4–9 February 2017. [Google Scholar]
  25. Abadi, M.; Agarwal, A.; Barham, P.; Brevdo, E.; Chen, Z.; Citro, C.; Corrado, G.S.; Davis, A.; Dean, J.; Devin, M.; et al. TensorFlow: Large-Scale Machine Learning on Heterogeneous Systems. arXiv 2015, arXiv:1603.04467. [Google Scholar]
  26. Sulzer, M. Meteoroid velocity distribution derived from head echo data collected at Arecibo during regular world day observations. Atmos. Chem. Phys. 2004, 4, 947–954. [Google Scholar] [CrossRef]
  27. Lehtinen, M.; Damtie, B.; Nygrén, T. Optimal binary phase codes and sidelobe-free decoding filters with application to incoherent scatter radar. In Annales Geophysicae; Copernicus Publications: Göttingen, Germany, 2004; Volume 22, pp. 1623–1632. [Google Scholar]
  28. Li, Y. A Study on Meteor Echoes Using the Arecibo and Jicamarca High Power Large Aperture Radars. Master’s Thesis, Miami University, Oxford, OH, USA, 2019. [Google Scholar]
  29. Zhang, K.; Zuo, W.; Chen, Y.; Meng, D.; Zhang, L. Beyond a gaussian denoiser: Residual learning of deep cnn for image denoising. IEEE Trans. Image Process. 2017, 26, 3142–3155. [Google Scholar] [CrossRef]
  30. Ballard, D.H. Generalizing the Hough transform to detect arbitrary shapes. Pattern Recognit. 1981, 13, 111–122. [Google Scholar] [CrossRef]
  31. Li, Y.; Galindo, F.; Urbina, J.; Zhou, Q.; Huang, T.Y. Meteor detection with a new computer vision approach. Radio Sci. 2022, 57, e2022RS007515. [Google Scholar] [CrossRef]
  32. Bochkovskiy, A.; Wang, C.Y.; Liao, H.Y.M. Yolov4: Optimal Speed and Accuracy of Object Detection. arXiv 2020, arXiv:2004.10934. [Google Scholar]
  33. Girshick, R.; Donahue, J.; Darrell, T.; Malik, J. Rich feature hierarchies for accurate object detection and semantic segmentation. In Proceedings of the IEEE Conference on Computer Vision and Pattern Recognition, Columbus, OH, USA, 24–27 June 2014; pp. 580–587. [Google Scholar]
  34. Girshick, R. Fast r-cnn. In Proceedings of the IEEE International Conference on Computer Vision, Santiago, Chile, 7–13 December 2015; pp. 1440–1448. [Google Scholar]
  35. Ren, S.; He, K.; Girshick, R.; Sun, J. Faster r-cnn: Towards real-time object detection with region proposal networks. In NeurIPS Proceedings: Advances in Neural Information Processing Systems 28 (NIPS 2015); Curran Associates, Inc.: Red Hook, NY, USA, 2015. [Google Scholar]
  36. Zhu, Q.; Dinsmore, R.; Gao, B.; Mathews, J.D. High-resolution radar observations of meteoroid fragmentation and flaring at the Jicamarca Radio Observatory. Mon. Not. R. Astron. Soc. 2016, 457, 1759–1769. [Google Scholar] [CrossRef]
  37. Powers, D.M. Evaluation: From precision, recall and F-measure to ROC, informedness, markedness and correlation. arXiv 2020, arXiv:2010.16061. [Google Scholar]
  38. Serra, J.; Vincent, L. An overview of morphological filtering. Circuits Syst. Signal Process. 1992, 11, 47–108. [Google Scholar] [CrossRef]
  39. Everitt, B.S.; Landau, S.; Leese, M.; Stahl, D. Cluster Analysis, 5th ed.; John Wiley & Sons: Hoboken, NJ, USA, 2011. [Google Scholar]
  40. Golub, G.; Kahan, W. Calculating the singular values and pseudo-inverse of a matrix. J. Soc. Ind. Appl. Math. Ser. Numer. Anal. 1965, 2, 205–224. [Google Scholar] [CrossRef]
  41. Nesvornỳ, D.; Jenniskens, P.; Levison, H.F.; Bottke, W.F.; Vokrouhlickỳ, D.; Gounelle, M. Cometary origin of the zodiacal cloud and carbonaceous micrometeorites. Implications for hot debris disks. Astrophys. J. 2010, 713, 816. [Google Scholar] [CrossRef]
  42. Robertson, H. Dynamical effects of radiation in the solar system. Mon. Not. R. Astron. Soc. 1937, 97, 423. [Google Scholar] [CrossRef]
  43. Nesvornỳ, D.; Vokrouhlickỳ, D.; Pokornỳ, P.; Janches, D. Dynamics of dust particles released from Oort cloud comets and their contribution to radar meteors. Astrophys. J. 2011, 743, 37. [Google Scholar] [CrossRef]
  44. Scholarsphere, P.S.U. Machine-Learning Approach to Detecting and Analyzing Meteor Echoes (MADAME). 2023. Available online: https://scholarsphere.psu.edu/resources/d3ae6356-4c9b-48b0-9159-4a1361026d37 (accessed on 23 March 2023).
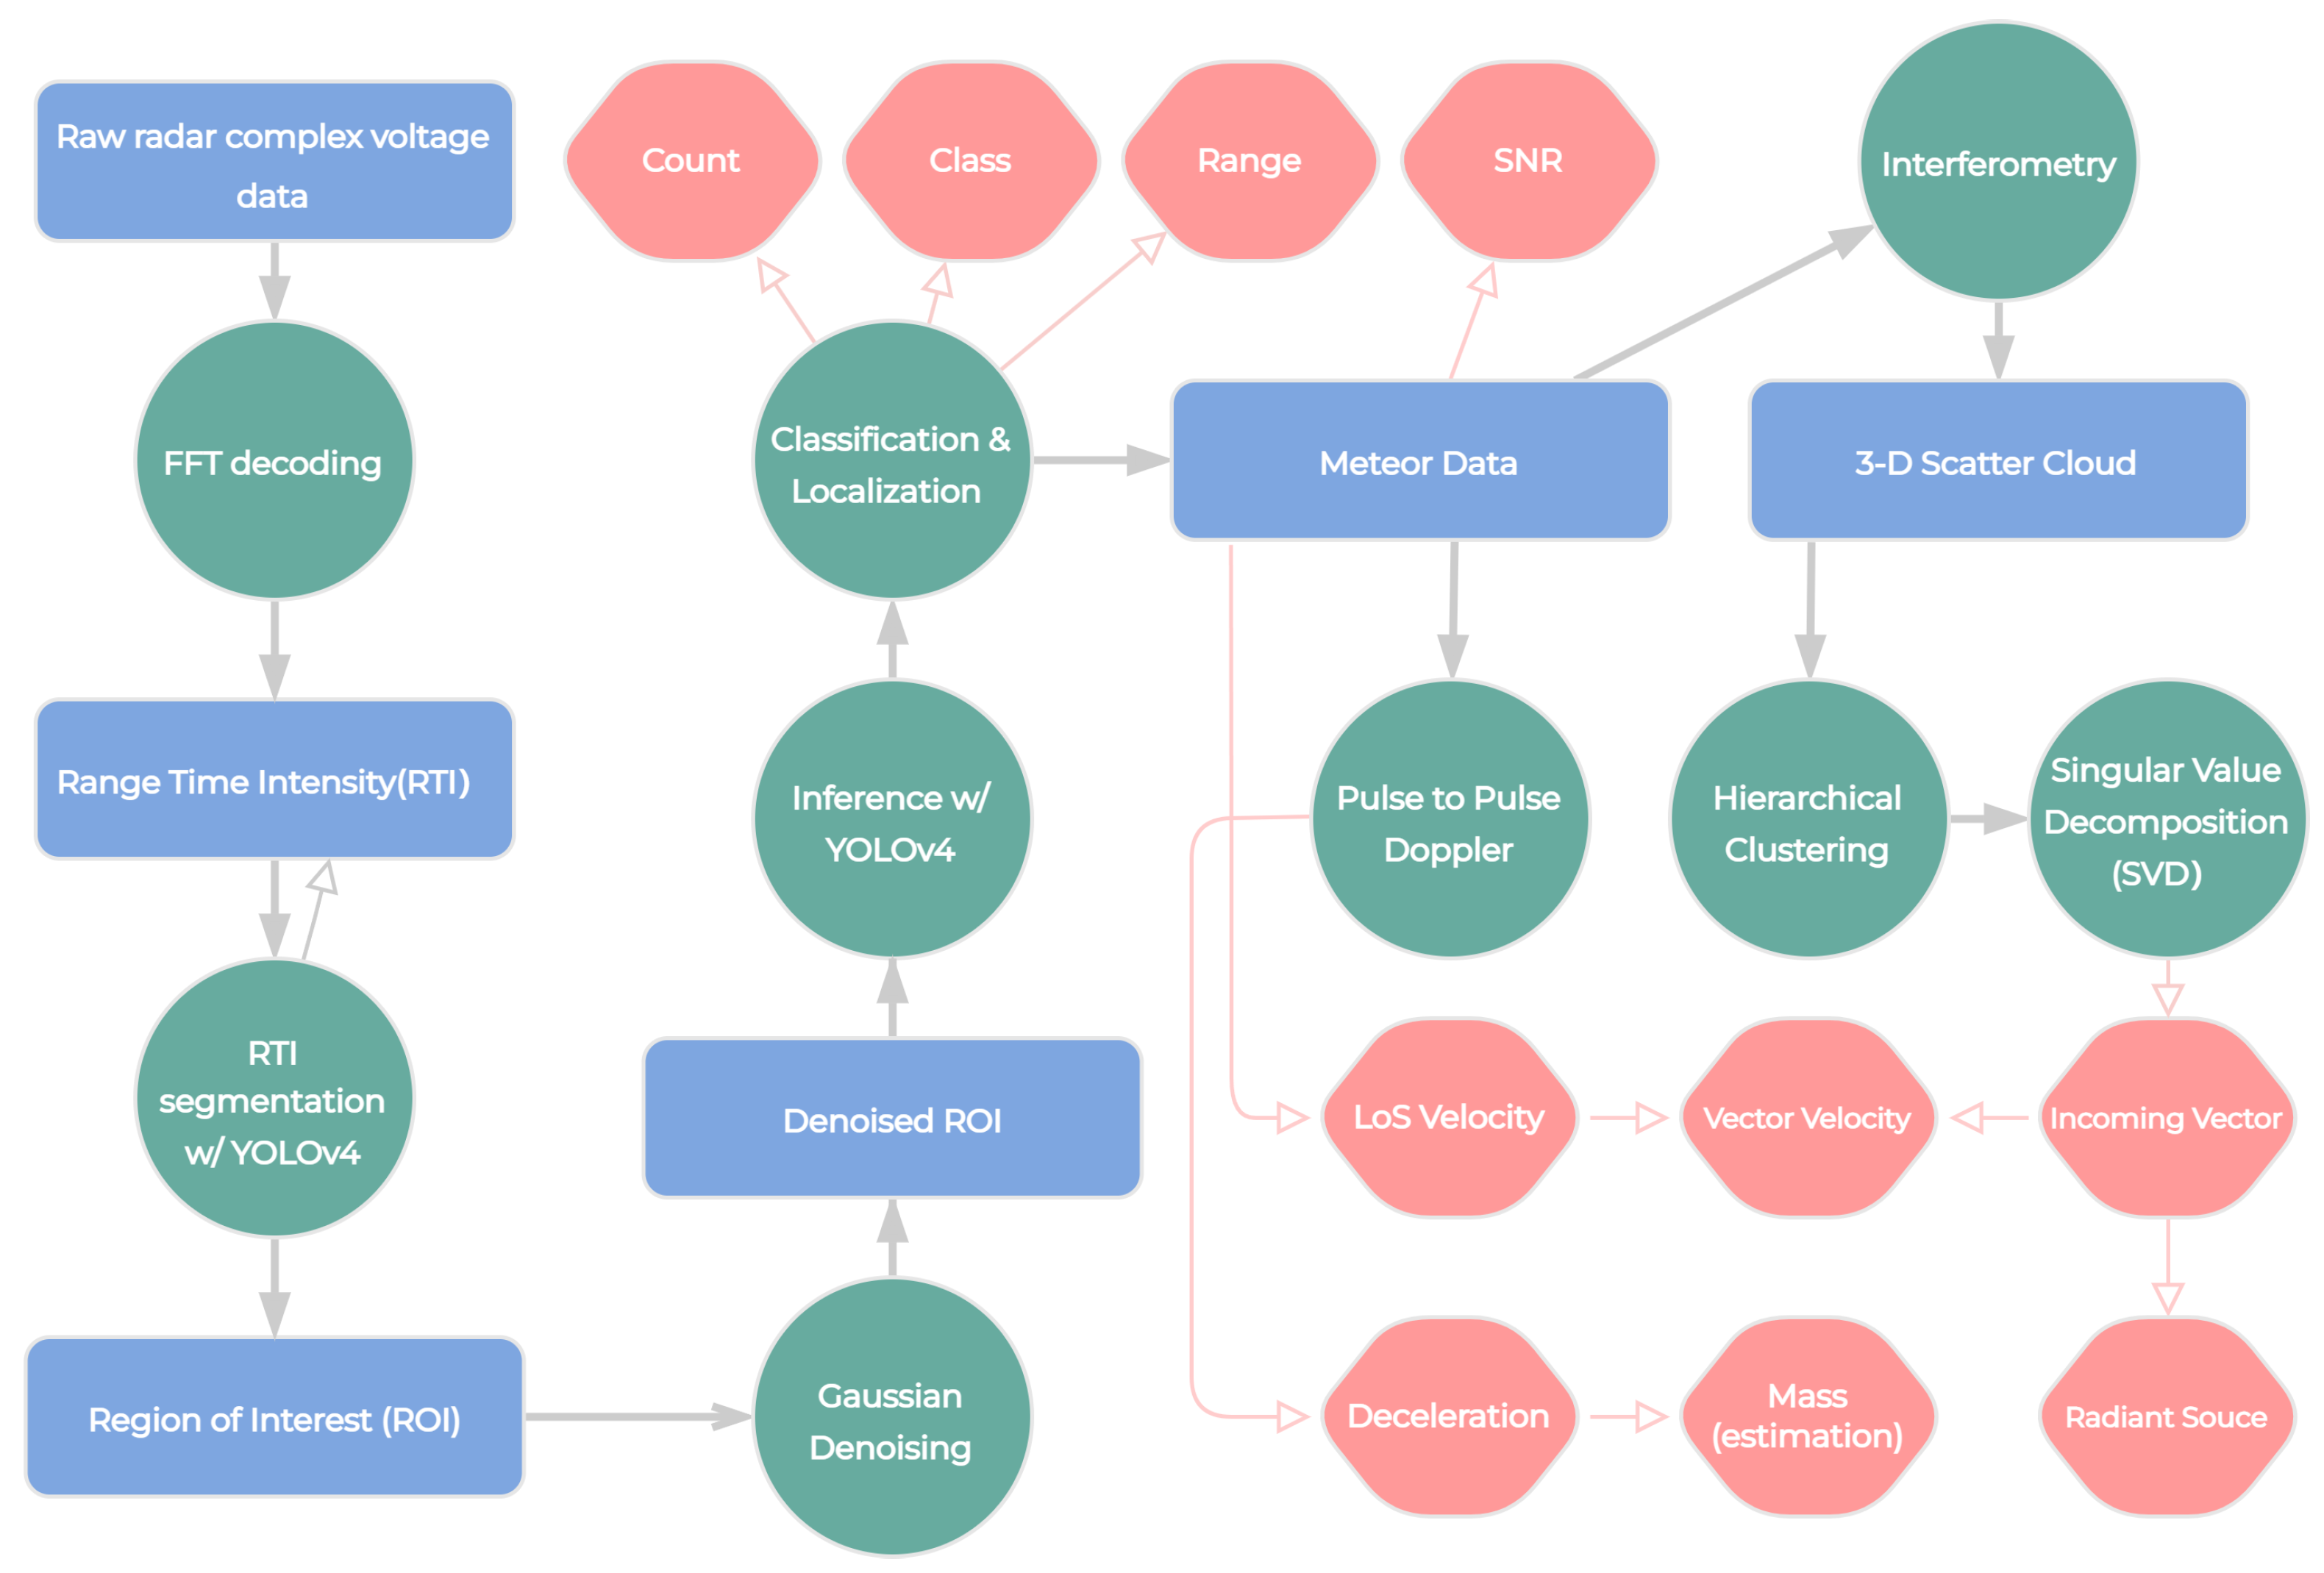
Figure 1. The workflow of MADAME from raw radar complex voltage samples to results. In the flowchart, the blue squares are data or results that can be presented in some form; the green circles represent various processing operations, and the results, which are the outputs returned by the algorithm, are shown in red hexagons.
Remotesensing 15 04051 g001
Figure 2. A comparison of original and Gaussian denoised meteor trail. The original image on the left was treated by DnCNN, a Gaussian denoiser using deep learning, and the denoised result is shown on the right.
Remotesensing 15 04051 g002
Figure 3. Examples of the Region of Interest (ROI) and the inferred results from the YOLOv4 detector are depicted in this figure, with the x and y axes representing time and altitude, respectively. In this figure, we showcase six ROI examples, which demonstrate how the detector was able to perform effectively in challenging scenarios. The current version of the detector distinguishes three classes: head, trail, and EEJ, which represent meteor head echo, meteor trail echo, and equatorial electrojet (EEJ), respectively. The instances which could retrieve velocity vectors are labeled in blue bounding boxes. The instances that could return line of sight (LOS) velocity are labeled in purple bounding boxes, and the instances in which the algorithm could not resolve any information other than detection are labeled in yellow bounding boxes. It is difficult to separate the meteor head from its trail with the radar pulse scheme used in the current work. Consequently, the LOS or vector velocity could not be obtained from the trail echoes. It might be possible to resolve meteor head velocity with a longer radar pulse, which provides a higher resolution in the power spectrum.
Remotesensing 15 04051 g003
Figure 4. Displayed here are examples of the cleaned-up ‘meteor samples’ in the processing workflow. The upper row exhibits samples of meteor head echoes, while the lower row showcases trail echoes. Ideally, each panel, representing a set of meteor samples, should include only one meteor echo. However, instances such as Head instance 1 and Head instance 2 demonstrate that multiple echoes may appear within a single collection of meteor samples due to insufficient separation between adjacent echoes. This issue can largely be addressed by employing the clustering technique discussed in Section 3.6.
Remotesensing 15 04051 g004
Figure 5. 3D scatter clouds of the meteor echoes. The 3D scatter cloud plot exhibits distinct, unaliased meteor head and trail echoes in each example. Either head or trail echoes can exhibit as a clear path in the 3D scatter cloud plot.
Remotesensing 15 04051 g005
Figure 6. Examples of 3D scatter clouds that contained multiple objects. Different objects are separated and identified by a single linkage and represented in different colors. The first panel from the left shows traces of two distinct meteor head echoes, and the middle and right panels contain meteor head echoes and EEJs, respectively.
Remotesensing 15 04051 g006
Figure 7. Meteor fluxes from the May 2006 Jicamarca ISR meteor campaign are presented. In the upper panel, the “Total” bars in blue represent the overall number of meteors, irrespective of their class. Meteor head echoes and trail echoes are distinguished by yellow and dark green, respectively. The lower panel displays the meteor flux by manually selecting meteors. The time resolution was interpolated from 200 s to 60 s.
Remotesensing 15 04051 g007
Figure 8. Meteor radiant distribution of all meteors (left panel—18,611 events) and of meteors with trails (right panel—2886 events). As depicted in the right panel, the radiant distribution of the trail meteors showed a relatively stronger concentration at the shower meteor source (Eta Aquarids meteor shower, 20 Lon., 10 Lat.).
Remotesensing 15 04051 g008
Figure 9. The normalized LOS velocity (left panel) and vector velocity or absolute velocity (right panel) distribution of the meteor head echoes. The distributions were normalized by their respective local time, i.e., by the vertical columns of the image.
Remotesensing 15 04051 g009
Table 1. Evaluations of the YOLOv4 detector accuracy on the radar data.
PrecisionRecallF1 ScoreAP
Head0.990.940.960.94
Trail0.980.890.930.88
EEJ10.630.7730.64
Disclaimer/Publisher’s Note: The statements, opinions and data contained in all publications are solely those of the individual author(s) and contributor(s) and not of MDPI and/or the editor(s). MDPI and/or the editor(s) disclaim responsibility for any injury to people or property resulting from any ideas, methods, instructions or products referred to in the content.