Communication

Scale Analysis of Typhoon In-Fa (2021) Based on FY-4A Geostationary Interferometric Infrared Sounder (GIIRS) Observed and All-Sky-Simulated Brightness Temperature

1
Key Laboratory of Numerical Modeling for Tropical Cyclone of the China Meteorological Administration, Shanghai Typhoon Institute, Shanghai 200030, China
2
Department of Atmospheric and Oceanic Sciences, Institute of Atmospheric Sciences, Fudan University, Shanghai 200438, China
3
Guangdong Provincial Key Laboratory of Regional Numerical Weather Prediction, Guangzhou Institute of Tropical and Marine Meteorology, CMA, Guangzhou 510640, China
4
Atmospheric and Oceanic Sciences Group, Space Applications Centre, ISRO, Ahmedabad 380015, India
*
Author to whom correspondence should be addressed.
Remote Sens. 2023, 15(16), 4035; https://doi.org/10.3390/rs15164035
Submission received: 4 July 2023 / Revised: 10 August 2023 / Accepted: 11 August 2023 / Published: 15 August 2023

Abstract

:
Based on the Final Operational Global Analysis (FNL) data from the National Centers for Environmental Prediction and the ERA5 reanalysis data from the European Centre for Medium-Range Weather Forecasts, the all-sky brightness temperatures of the Geostationary Interferometric Infrared Sounder (GIIRS) onboard the Fengyun-4A satellite (FY-4A) are simulated, which are then used to investigate Typhoon In-Fa (2021). The results show that the all-sky simulations based on ERA5 and FNL for FY-4A GIIRS channels 27 (716.25 cm−1), 90 (755.625 cm−1), and 417 (960 cm−1) can reproduce well the structure and intensity of Typhoon In-Fa. But the FNL simulations overestimate the typhoon intensity with more high ice clouds around the typhoon center. Fourier analysis of Typhoon In-Fa at severe tropical storm (STS) and typhoon (TY) stages is conducted. The results reveal that the dominant features of Typhoon In-Fa are primarily large-scale, with a relatively small proportion of observations and simulations dedicated to small-scale features at the STS stage. However, the proportion of large-scale features decreases while the amount of small-scale information increases during the TY stage. The purpose of this study is to assess the performance of FY-4A GIIRS all-sky simulations based on the ERA5 and FNL data, as well as to prepare for future all-sky data assimilations.

1. Introduction

Satellite observations played an important role in the improvement of the numerical weather prediction (NWP) model in the past 40 years. They are now the dominant source of observational information determining the forecasting skills of global NWP systems and are also an important information source for regional and convective-scale NWP [1]. In the previous two decades, satellite observations have been widely used for data assimilation under clear-sky conditions, especially observations from infrared sensors [2]. This is because a lot of observations have been discarded due to cloud contamination and precise cloud detection became one of the major components of clear-sky IR radiance assimilation [3]. The cloud- and precipitation-affected MW and IR radiances have been assimilated in most NWP centers with the proposed symmetric observation error model, cloudy bias correction predictors, and improvements in all-sky simulations accounting for complex hydrometeors using the Radiative Transfer Model (RTM) [4,5,6]. For microwave radiances, the all-sky technique has been proven beneficial to the Integrated Forecast System (IFS) of the European Centre for Medium-Range Weather Forecasts (ECMWF). In addition, the National Centers for Environmental Prediction (NCEP) started the all-sky data assimilation of the microwave temperature sensor operationally, such as the Advanced Microwave Sounding Unit-A (AMSU-A), and achieved some benefits including a reduction in cloud-related biases [5]. Several studies have demonstrated the benefits of assimilating the infrared (IR) radiance data from a geostationary imager for severe weather events, such as tropical cyclones and heavy rainfall [7,8,9,10,11,12]. For example, Minamide and Zhang developed an adaptive observation error inflation method to assimilate all-sky IR radiances from the Advanced Baseline Imager (ABI) and the Advanced Himawari Imager (AHI), which improves the typhoon intensity prediction. To better assimilate all-sky IR radiances, all-sky simulation is a key point. Further, Kumar et al. (2022) [13] suggested that the inclusion of individual hydrometeors as control variables in data assimilation are also a requisite for all-sky IR radiance assimilation. The One-Dimensional Variational (1D-Var) framework is applied to retrieve liquid water content, ice water content, and cloud fraction to better simulate cloud-affected radiance from the Infrared Atmospheric Sounding Interferometer (IASI) [14]. To evaluate the all-sky simulations of convection-permitting ensemble forecasting, different microphysics parameterization schemes and planetary boundary layer schemes have also been studied [15].
Geostationary Interferometric Infrared Sounder (GIIRS) is the first hyperspectral IR sounder onboard Fengyun 4Asatellite (FY-4A), which significantly improves the vertical resolution of temperature and humidity profiles [16]. The GIIRS has 1650 spectral channels with 689 longwave (LW) IR channels and 961 mediumwave (MW) IR channels [17]. The FY-4A GIIRS scans China and its surrounding areas (15°N–55°N; 70°E–140°E) with a spatial resolution of 16 km and a temporal resolution of 2 h. Several studies have demonstrated that assimilating the observations of geostationary hyperspectral IR sounders could improve severe weather forecasting skills [18,19]. Yin et al. [20] assimilated clear-sky GIIRS longwave radiances to study Typhoon Maria (2018) and demonstrated that assimilating higher-resolution data could improve the intensity forecasting of Typhoon Maria. However, FY4A GIIRS’s all-sky data assimilation has not yet been carried out to our knowledge, losing most of the information at the typhoon region. Before all-sky data assimilation, it is important to examine the accuracy of the all-sky simulations from the RTM. Due to poor cloudy simulations, we cannot make effective use of data in the cloudy region due to large differences between observations and simulations.
The motivation of this study is to examine the accuracy of the all-sky simulations from the RTM based on different backgrounds. Therefore, this study simulates the brightness temperatures in the process of Typhoon In-Fa (2021) by using the Radiative Transfer for TIROS Operational Vertical Sounder (RTTOV) based on the Final Operational Global Analysis (FNL) data from the National Centers for Environmental Prediction (NCEP) and the ERA5 reanalysis data from the European Centre for Medium-Range Weather Forecasts (ECMWF). The accurate simulation of the brightness temperature using the fast radiative transfer model is one of the most important steps towards all-sky IR radiance assimilation. The remainder of this paper is organized as follows. Section 2 introduces Typhoon In-Fa (2021), the satellite observations, and RTTOV simulation designs. In Section 3, the simulation and scale analysis for Typhoon In-Fa are analyzed. The conclusions and discussions are provided in Section 4.

2. Case Overview, Data, and Model Setting

2.1. Overview of Typhoon In-Fa (2021)

Typhoon In-Fa brought record-breaking rainfall to China in July 2021 and is the second-wettest tropical cyclone ever recorded in China. It was in the east of Philippines on 14 July, and the Joint Typhoon Warning Center (JTWC) first noted it as an area of low pressure. It became a tropical depression and then a tropical storm on 17 July. During 18–20 July, it was in a weak steering environment with dry air and moderate wind shear. Then, it continued to move mostly westward, strengthened into a typhoon, and deepened quickly. On 21 July, its wind speed reached 45 m s−1 and its minimum pressure reached 950 hPa three days later. Since the system moved to the East China Sea, Typhoon In-Fa weakened steadily and slowly. Then, it made its consecutive landfalls as a tropical storm over Putuo District of Zhoushan and Pinghu on 25 and 26 July, respectively. In the next couple of days, it moved inland slowly and weakened gradually, before turning northward on 29 July. Figure 1 shows the best track and minimum sea level pressure of Typhoon In-Fa from JTWC.

2.2. Satellite Observations

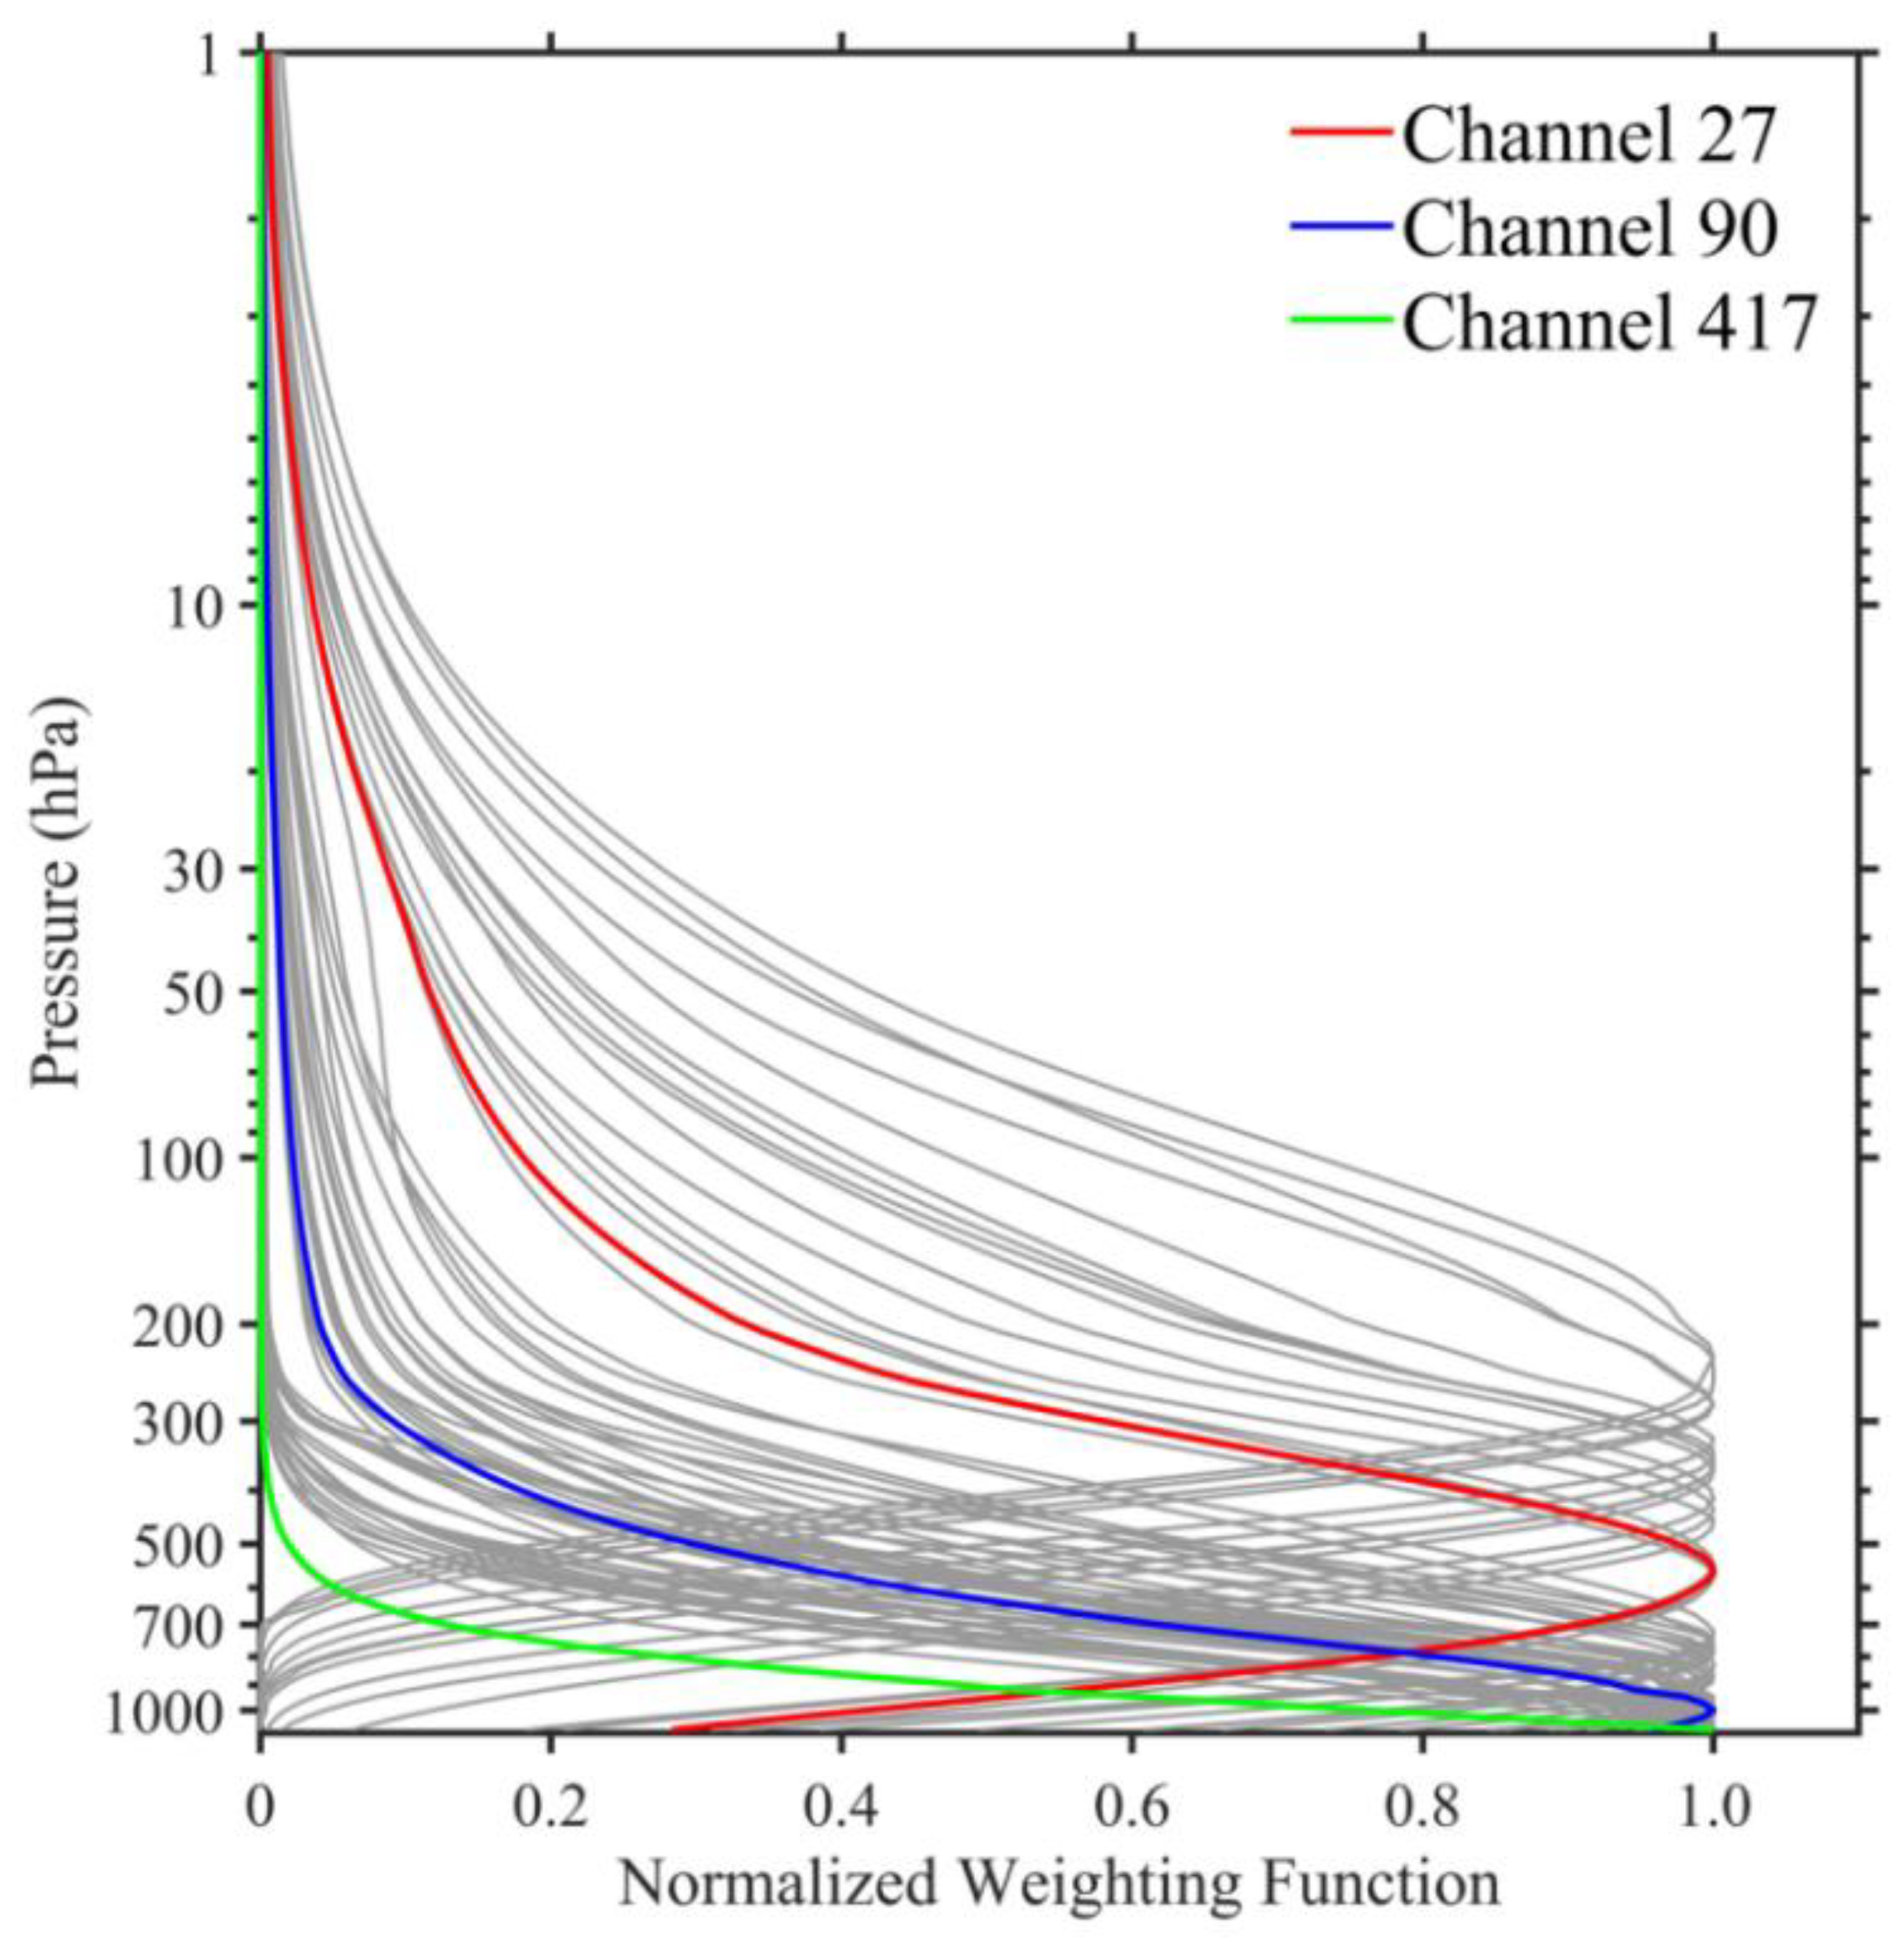
The GIIRS is a Michelson interferometer, which provides accurate atmospheric temperature and humidity profiles with high spatio-temporal resolutions. It measures the atmosphere with 1650 spectral channels, namely 689 longwave IR channels (700–1130 cm−1) and 961 mediumwave IR channels (1650–2250 cm−1). In this study, we focus on channel 27 (716.25 cm−1), channel 90 (755.625 cm−1), and channel 417 (960 cm−1), which are in the middle troposphere, lower troposphere, and the surface, respectively. Channel 27 and channel 90 are selected based on the sixty assimilation channels [21] in Table 1, and channel 417 is the window channel which is appropriate for examining the cloud effect. The normalized weighting function of the selected 60 assimilated channels are shown in Figure 2.

2.3. RTTOV Simulation Settings

RTTOV is a very fast radiative transfer model for passive visible, IR, and microwave downward-viewing satellite radiometers, spectrometers, and interferometers, and is widely used in satellite retrieval and data assimilation [22]. In this work, RTTOV version 13.1 is utilized to simulate FY-4A GIIRS LWIR radiances based on ERA5 and FNL reanalysis. The horizontal resolution of ERA5 and FNL are both 0.25° × 0.25° (~31 km), and the model tops are 1 hPa and 0.01 hPa, with 37 and 41 atmospheric levels, respectively. The bulk mass flux convection scheme and modified Tiedtke microphysics scheme are utilized by ERA5, whereas the scale-aware Simplified Arakawa–Schubert (SAS) convection scheme and the Geophysical Fluid Dynamics Laboratory (GFDL) microphysics scheme are used by FNL. Different simulated IR radiances derive from the different convection and microphysics schemes. Furthermore, using Lagrangian interpolation, the variables of the re-analyzed field are interpolated to the satellite data points. Three-dimensional (3D) temperature, specific humidity, pressure, ozone mixing ratio, cloud fraction, cloud liquid mixing ratio, ice water mixing ratio, rain mixing ratio, snow water content, and graupel mixing ratio are used as input for all-sky BT simulations, as are two-dimensional skin temperature, surface pressure, 2 m temperature, and 10 m wind vector. In terms of the cloud liquid water scheme, the size distribution is consistent with that assumed for the Mie cloud liquid water optical properties available with the libRadtran software [23]. In RTTOV v13.1, these properties are recalculated by using the liquid water refractive index dataset [24], which is also used for the libRadtran Mie properties. The cloud ice water scheme takes into account several parameters and variables related to the cloud ice water content, particle size distribution, and effective radius in RTTOV. It utilizes a combination of parameterizations and models to simulate the scattering and absorption properties of the ice particles. In this study, the Baran database has been used without explicit dependence on particle size. The input cloud fraction is between 0 and 1, and all cloud types are assumed to be mixed within the fraction for each layer of the atmospheric profile.

3. Simulation Results

Figure 3 shows the horizontal distribution of observed and simulated brightness temperatures with ERA5 and FNL for three different channels at 1200 UTC (Universal Time Coordinated) on 24 July 2021. For channel 27 (weighting function peak (WFP) ~560 hPa), the simulated brightness temperature (BT) with FNL (Figure 3c) is smaller than the observation (Figure 3a), which indicates that the simulated intensity of Typhoon In-Fa is stronger above the middle troposphere. Conversely, the simulated BT with ERA5 is closer to the observation, but the rainband around the typhoon eye is slightly stronger than the observation. For channel 90 and channel 417 with WFP of 1000 hPa, the structure and intensity of Typhoon In-Fa simulated with ERA5 are close to the observations, but the fine structure and characteristics simulation from ERA5 is not as detailed as the FNL simulation. The simulated BT using FNL data (Figure 3c,f,i) is apparently lower than that using ERA5 (Figure 3b,e,h) and the observation (Figure 3a,d,g) around the typhoon region. The observed lower BT in the west of Hunan Province is underestimated by the FNL compared with ERA5. However, in the north of the Philippines, the FNL-simulated BT is close to the observation. Compared with channel 90 in the CO2 absorption band, the BT values of channel 417 in the window band are larger and the surface characteristics are more apparent.
The convection areas of Typhoon In-Fa are explored and defined by the BT of channel 417 less than 260 K [17], and the areas inside a 20° × 10° window centered at the typhoon eye are calculated from 21 July to 25 July 2021. The probability density function (PDF) of the observed and simulated BTs of channel 27, channel 90, and channel 417 are displayed in Figure 4. Overall, the simulated PDF values are larger than those of the observation when the BT is below about 225 K, and vice versa when BT is above 225 K. It indicates that the simulated BT in the deep convection area is smaller than the observed BT, which means the intensity of deep convection is stronger than the observation. Specifically, the observed BT of channel 27 is mainly in the range of 200 K to 250 K, and the BT distribution of channel 27 simulated by ERA5 data is close to the observation. However, the BT of channel 27 simulated by FNL data is smaller than the observed BT. For channel 90 and channel 417 with WFP altitude around the surface, the PDF distributions are similar. Even though the number of ERA5-simulated BTs below ~225 K is larger than that of the observation, the PDF is closer to the observation than that of the BTs simulated with FNL.
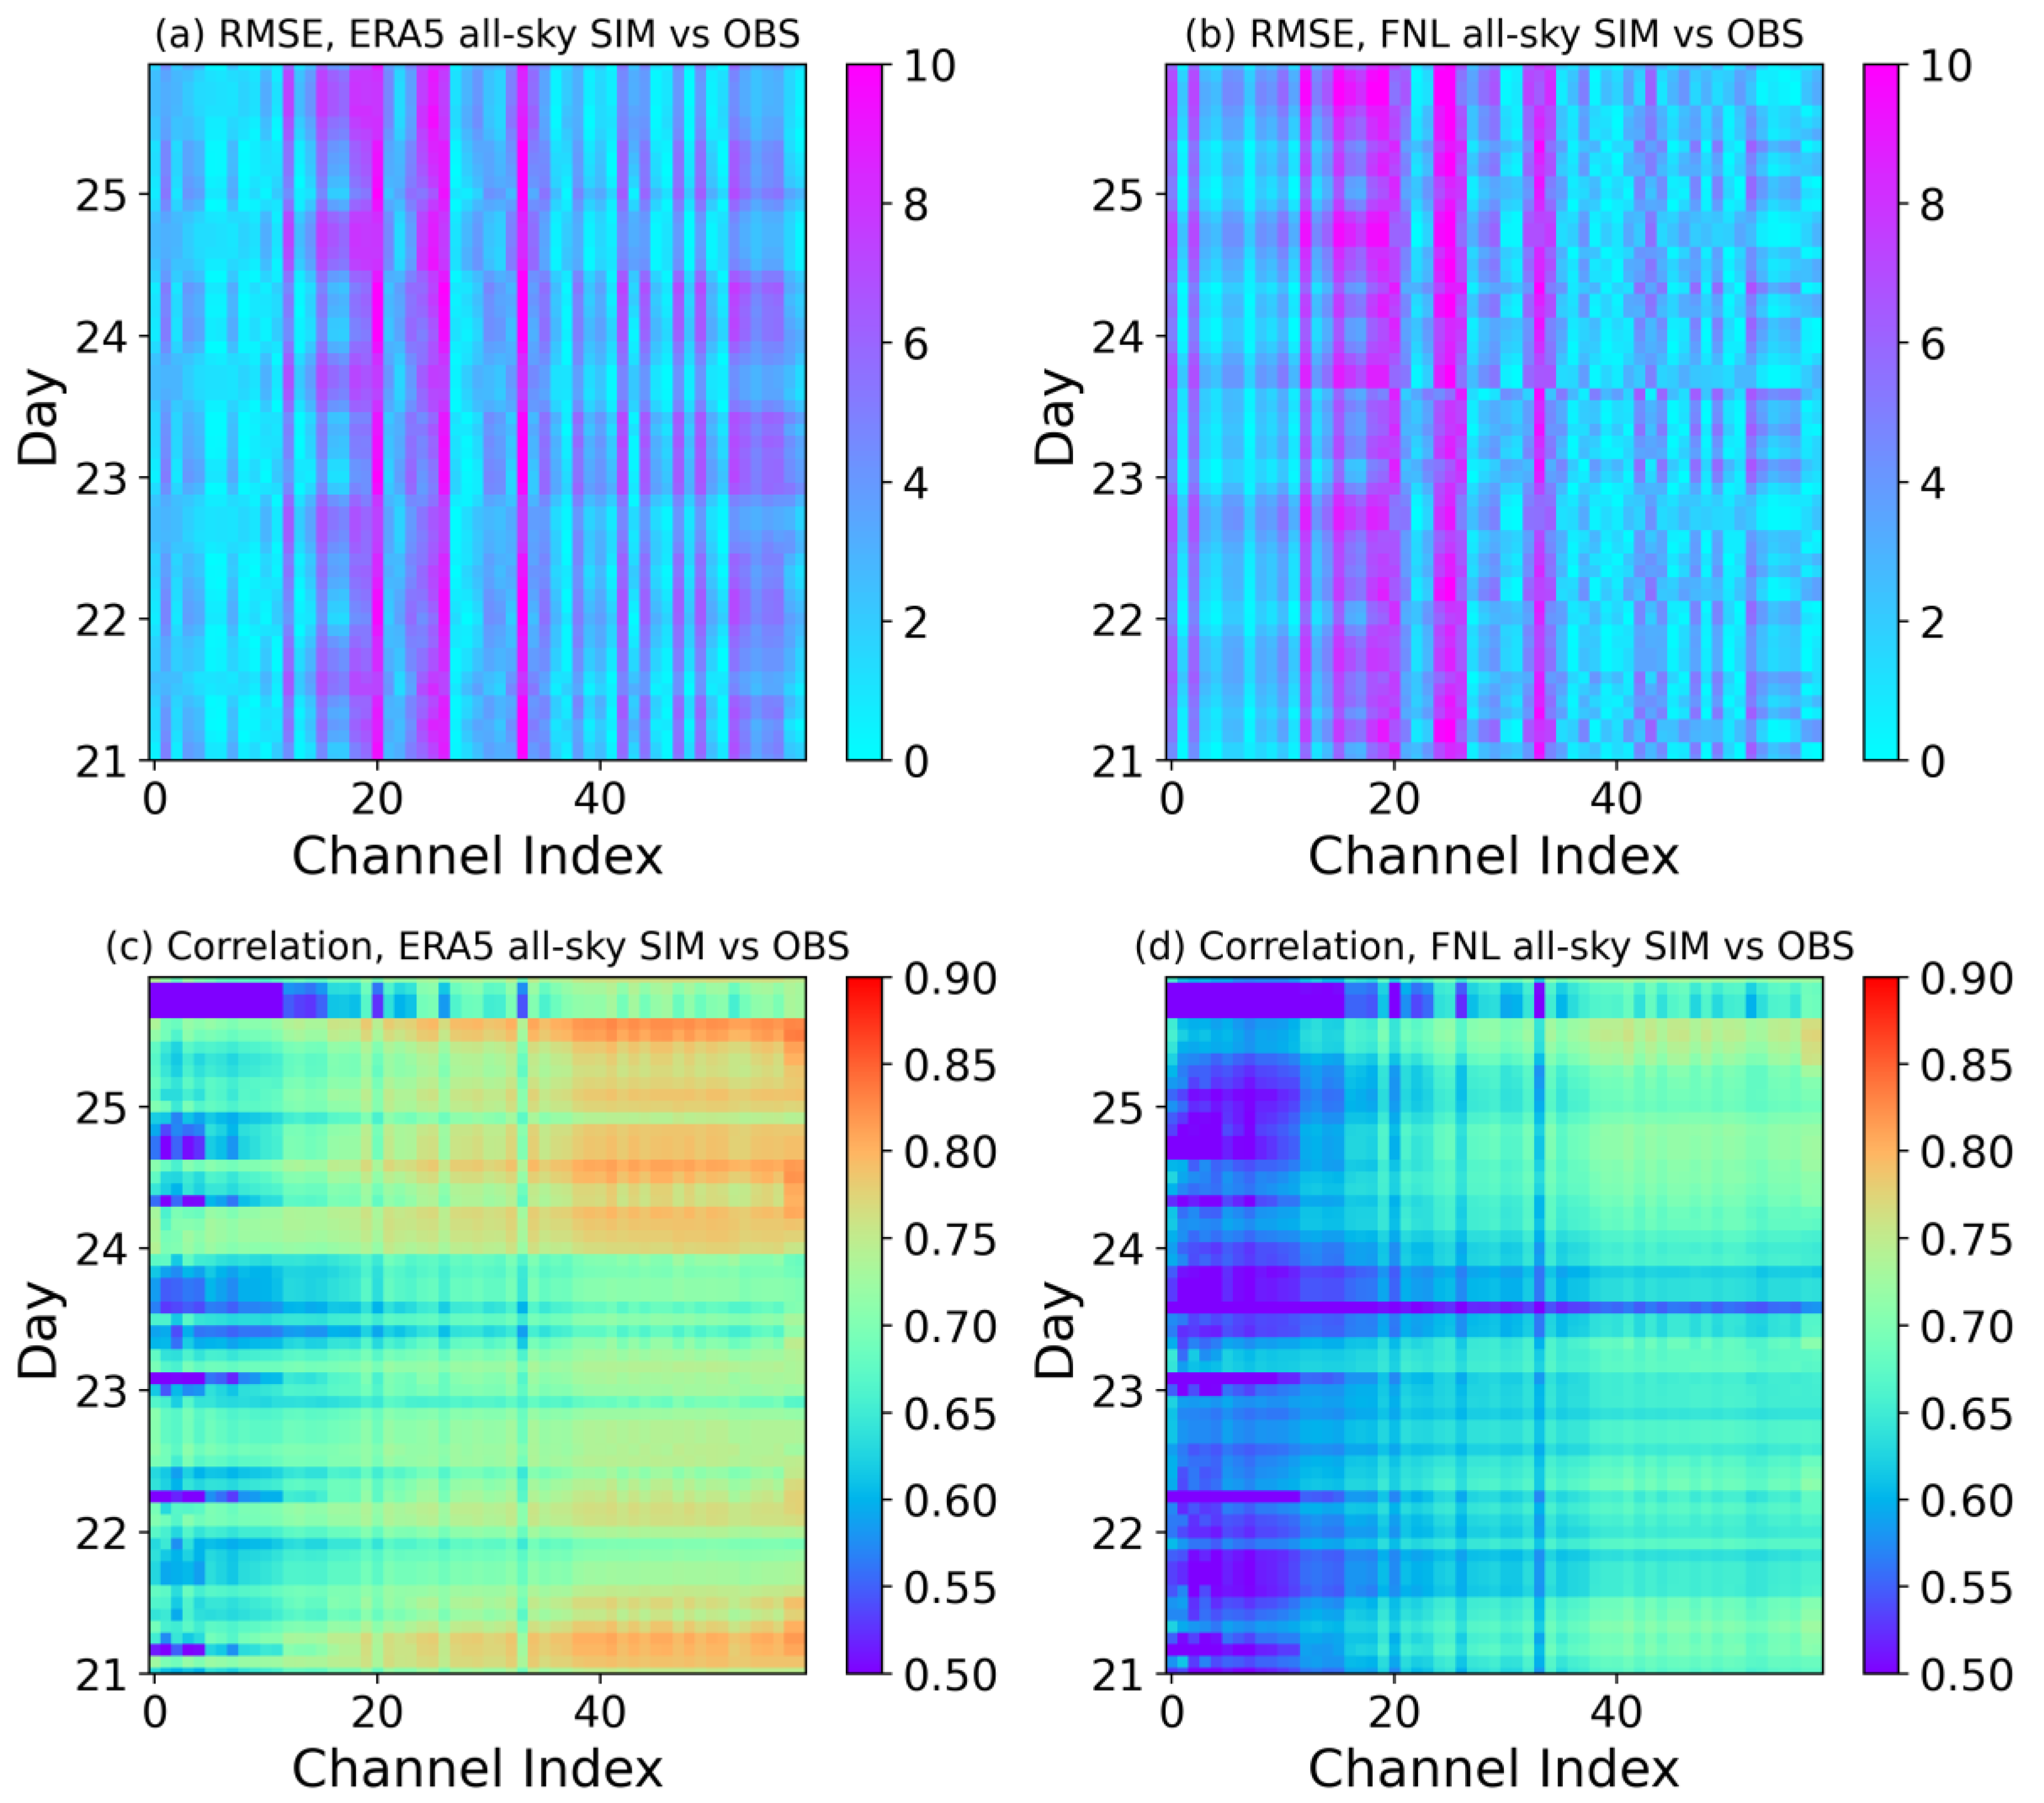
To further examine the simulated BTs of GIIRS from ERA5 and FNL under all-sky conditions during the process of Typhoon In-Fa, the root mean square error (RMSE; Figure 5a,b) and correlation coefficient (Figure 5c,d) between the simulation and observation are calculated. The large RMSE values (large than 4 K) of the ERA5 and FNL simulations are mainly in the longwave channels 12–38, and there exists a diurnal variation in RMSE values. The RMSE of the FNL simulation is comparable with that of the ERA5 simulation. However, the correlation coefficient of the FNL simulation (below 0.70) is mostly smaller than that of the ERA5 simulation (above 0.85). Overall, the ERA5 simulation performs better than the FNL simulation.
Figure 6 shows the snapshots of observed and simulated BT of FY-4A GIIRS channel 417 of Typhoon In-Fa on 0000 UTC 20 (Figure 6a–c) and 1200 UTC 22 (Figure 6d–f) July, corresponding to the times when the TC was at the severe tropical storm (STS) and typhoon (TY) stages, respectively. To focus on Typhoon In-Fa and its surrounding environment, we center our data around the storm and set a cutoff radius of about 900 km. The pattern of simulated BT from ERA5 is closer to the observed BT compared with the simulated BT from FNL on 0000 UTC 20 and 1200 UTC 22, while there is an overstimulation of BT from FNL data. To simplify the data analysis process, we select BT data along the meridian passing through the center of the storm (hereinafter referred to as the storm center line) for analysis. Figure 7 shows the BT values along the storm center lines corresponding to the storm in Figure 6. The structures of Typhoon In-Fa at different scales are displayed during the STS and TY stages. The variation in the simulated BT from ERA5 and FNL is similar to that of the observed BT during the storm stages. On 1200 UTC 22, the structure of the TC at maximum strength is apparent in Figure 7b with warmer BT inside the eyewall.
In order to investigate the scale-dependent characteristics of Typhoon In-Fa at different stages, a Fourier analysis is used to conduct BT observations and all-sky simulations to compute the percentage of variance for specified wavelengths and distributions on the selected times (Figure 8). The maximum percentage of variance corresponds to the time when Typhoon In-Fa reached its maximum intensity. To better understand the large-scale and small-scale features during the Typhoon at different stages, the wavelength above 500 km is defined as large scale while the wavelengths less than 500 km are defined as medium and small scales [25]. During the STS stage, the dominant features of the TC are primarily at a large scale, with a relatively small proportion of observations and simulations dedicated to medium- and small-scale features. As the TC progresses to the TY stage, the proportion of large-scale features decreases while the amount of medium- and small-scale information increases, particularly within a radius of 336 km. In the STS stage, the ERA5 simulations are similar to observations in terms of large-scale features, whereas the FNL simulations tend to overestimate BT. In the TY stage, the FNL simulations align more closely with observations for large-scale features, while ERA5 still exhibits better performance in simulating medium- and small-scale features smaller than 187 km. This conclusion implies that before the TY stage, the large-scale environment is critical for typhoon development, However, once in the TY stage, medium- and small-scale information, such as convection, is significant. As a result, it provides data-thinning guidance for satellite all-sky data assimilation in the typhoon region, where outside observations may be significant before the typhoon is generated and inside observations are vital after the typhoon has grown.

4. Conclusions

In this study, the simulated BTs calculated with hydrometers, temperature, and water vapor profiles, and surface parameters based on the ERA5 and NCEP FNL data during the process of Typhoon In-Fa (2021), were compared with the FY-4A GIIRS observations. The results show that the evolution of the intensity and structure of Typhoon In-Fa can be simulated well. However, the simulated BTs of the rainband surrounding the typhoon eye are lower than the observations, and the FNL-simulated BTs are lower than the ERA5-simulated BTs. Moreover, the RMSE of the FNL simulation is greater than that of the ERA5 simulation, especially after 24 July. The correlation coefficient between simulation and observation is roughly greater than 0.5 from 0000 UTC to 1800 UTC on 21 July, and the correlation coefficient of the FNL simulation is smaller than that of the ERA5 simulation. The RMSE and correlation coefficient indicate that the ERA5 simulation performs better than the FNL simulation. Overall, the structure and intensity of Typhoon In-Fa in the ERA5 all-sky simulation are closer to the observations than the FNL simulation, as the FNL simulation tends to overestimate ice clouds and results in lower BTs.
The scale analysis of Typhoon In-Fa (2021) based on observations and simulations was studied. The results show that the dominant features of the TC are primarily at a large scale, with a relatively small proportion of observations and simulations were dedicated to small-scale features during the STS stage. The simulations from ERA5 are similar to observations in terms of large-scale features, whereas the FNL simulations tend to overestimate BT. On the other hand, as the TC progresses to the TY stage, the proportion of large-scale features decreases while the amount of small-scale information increases, particularly within a radius of 336 km. The FNL simulations align more closely with observations for large-scale features, while ERA5 still exhibits better performance in simulating small-scale features. As a result, it provides data-thinning guidance for satellite all-sky data assimilation in the typhoon region, where the typhoon environmental observations may be significant before the typhoon is generated, and typhoon inner-core observations are vital after the typhoon has grown. The result indicates that the scale-dependent BT variances can be related to the time that each stage of the typhoon occurs, and then observation thinning can be conducted on the mid–lower channel data. However, this scale relation is not robust for typhoon studies as a single typhoon case over the ocean is investigated in this study and there is no evidence that this conclusion holds true for typhoons after landfall.
This study is a preliminary scale analysis based on the observations and simulations from GIIRS. However, the selected reanalysis datasets are available at a very coarse resolution (~25 km) to precisely estimate the structure of Typhoon In-Fa. The regional model simulated finer resolution analysis can be used in the future to assess the impact of spatial resolution on Typhoon In-Fa simulations.

Author Contributions

Conceptualization, Z.N. and L.W.; software, Z.N. and L.W.; validation, Z.N. and L.W.; writing—original draft preparation, Z.N. and L.W.; writing—review and editing, Z.N., L.W. and P.K. All authors have read and agreed to the published version of the manuscript.

Funding

This research was funded by National Key R&D Program of China (Grant No. 2021YFC3000902); the Guangdong Basic and Applied Basic Research Foundation (Grant No. 2020A1515110040); the Shanghai Sailing Program (Grant No. 21YF1456800).

Data Availability Statement

The data presented in this study are available on request from the corresponding author.

Conflicts of Interest

The authors declare no conflict of interest.

References

  1. Eyre, J.R.; English, S.J.; Forsythe, M. Assimilation of satellite data in numerical weather prediction. Part I: The early years. Q. J. R. Meteorol. Soc. 2020, 146, 49–68. [Google Scholar] [CrossRef]
  2. Simmons, A.J.; Hollingsworth, A. Some aspects of the improvement in skill of numerical weather prediction. Q. J. R. Meteorol. Soc. 2002, 128, 647–677. [Google Scholar] [CrossRef]
  3. McNally, A.P.; Watts, P.D. A cloud detection algorithm for high-spectral-resolution infrared sounders. Q. J. R. Meteorol. Soc. 2003, 129, 3411–3423. [Google Scholar] [CrossRef]
  4. Bauer, P.; Geer, A.; Lopez, P.; Salmond, D. Direct 4D-Var assimilation of all-sky radiances. Part I: Implementation. Q. J. R. Meteorol. Soc. 2010, 136, 1868–1885. [Google Scholar] [CrossRef]
  5. Zhu, Y.; Liu, E.; Mahajan, R.; Thomas, C.; Groff, D.; Van Delst, P.; Collard, A.; Kleist, D.; Treadon, R.; Derber, J.C. All-sky microwave radiance assimilation in NCEP’s GSI analysis system. Mon. Weather Rev. 2016, 144, 4709–4735. [Google Scholar] [CrossRef]
  6. Geer, A.; Lonitz, K.; Weston, P.; Kazumori, M.; Okamoto, K.; Zhu, Y.; Liu, E.H.; Collard, A.; Bell, W.; Migliorini, S.; et al. All-sky satellite data assimilation at operational weather forecasting centres. Q. J. R. Meteorol. Soc. 2018, 144, 1191–1217. [Google Scholar] [CrossRef]
  7. Minamide, M.; Zhang, F. Adaptive observation error inflation for assimilating all-sky satellite radiance. Mon. Weather Rev. 2017, 145, 1063–1081. [Google Scholar] [CrossRef] [Green Version]
  8. Minamide, M.; Zhang, F. Assimilation of all-sky infrared radiances from Himawari-8 and impacts of moisture and hydrometer initialization on convection-permitting tropical cyclone prediction. Mon. Weather Rev. 2018, 146, 3241–3258. [Google Scholar] [CrossRef]
  9. Zhang, F.; Minamide, M.; Clothiaux, E.E. Potential impacts of assimilating all-sky infrared satellite radiances from GOES-R on convection-permitting analysis and prediction of tropical cyclones. Geophys. Res. Lett. 2016, 43, 2954–2963. [Google Scholar] [CrossRef] [Green Version]
  10. Honda, T.; Kotsuki, S.; Lien, G.Y.; Maejima, Y.; Okamoto, K.; Miyoshi, T. Assimilation of Himawari-8 all-sky radiances every 10 minutes: Impact on precipitation and flood risk prediction. J. Geophys. Res. Atmos. 2018, 123, 965–976. [Google Scholar] [CrossRef] [Green Version]
  11. Sawada, Y.; Okamoto, K.; Kunii, M.; Miyoshi, T. Assimilating every-10-minute Himawari-8 infrared radiances to improve convective predictability. J. Geophys. Res. Atmos. 2019, 124, 2546–2561. [Google Scholar] [CrossRef]
  12. Okamoto, K.; Hayashi, M.; Hashino, T.; Nakagawa, M.; Okuyama, A. Examination of all-sky infrared radiance simulation of Himawari-8 for global data assimilation and model verification. Q. J. R. Meteorol. Soc. 2021, 147, 3611–3627. [Google Scholar] [CrossRef]
  13. Kumar, P.; Shukla, M.V.; Varma, A.K. Impact of all-sky water vapour channel radiance from INSAT-3D/3DR satellite over South Asia region using WRF model. Q. J. R. Meteorol. Soc. 2022, 148, 2532–2545. [Google Scholar] [CrossRef]
  14. Martinet, P.; Fourrié, N.; Guidard, V.; Rabier, F.; Montmerle, T.; Brunel, P. Towards the use of microphysical variables for the assimilation of cloud-affected infrared radiances. Q. J. R. Meteorol. Soc. 2013, 139, 1402–1416. [Google Scholar] [CrossRef]
  15. Cintineo, R.; Otkin, J.A.; Xue, M.; Kong, F. Evaluating the performance of planetary boundary layer and cloud microphysical parameterization schemes in convection-permitting ensemble forecasts using synthetic GOES-13 satellite observations. Mon. Weather Rev. 2014, 142, 163–182. [Google Scholar] [CrossRef] [Green Version]
  16. Li, Z.; Li, J.; Wang, P.; Lim, A.; Li, J.; Schmit, T.J.; Atlas, R.; Boukabara, S.A.; Hoffman, R.N. Value-added impact of geostationary hyperspectral infrared sounders on local severe storm forecasts—Via a quick regional OSSE. Adv. Atmos. Sci. 2018, 35, 1217–1230. [Google Scholar] [CrossRef]
  17. Niu, Z.; Zhang, L.; Han, Y.; Dong, P.; Huang, W. Performances between the FY-4A/GIIRS and FY-4B/GIIRS Long-Wave Infrared (LWIR) channels under Clear-sky and All-sky Conditions. Q. J. R. Meteorol. Soc. 2023, 149, 1612–1628. [Google Scholar] [CrossRef]
  18. Li, J.; Li, Z.; Wang, P.; Schmit, T.J.; Bai, W.; Atlas, R. An efficient radiative transfer model for hyperspectral IR radiance simulation and applications under cloudy-sky conditions. J. Geophys. Res. Atmos. 2017, 122, 7600–7613. [Google Scholar] [CrossRef]
  19. Okamoto, K.; Owada, H.; Fujita, T.; Kazumori, M.; Otsuka, M.; Seko, H.; Ota, Y.; Uekiyo, N.; Ishimoto, H.; Hayashi, M.; et al. Assessment of the potential impact of a hyperspectral infrared sounder on the Himawari follow-on geostationary satellite. SOLA 2020, 16, 162–168. [Google Scholar] [CrossRef]
  20. Yin, R.; Han, W.; Gao, Z.; Li, J. Impact of High Temporal Resolution FY-4A Geostationary Interferometric Infrared Sounder (GIIRS) Radiance Measurements on Typhoon Forecasts: Maria (2018) case with GRAPES Global 4D-Var Assimilation system. Geophys. Res. Lett. 2021, 48, e2021GL093672. [Google Scholar] [CrossRef]
  21. Zhang, L.; Niu, Z.; Weng, F.; Dong, P.; Huang, W.; Zhu, J. Impacts of Direct Assimilation of the FY-4A/GIIRS Long-Wave Temperature Sounding Channel Data on Forecasting Typhoon In-Fa (2021). Remote Sens. 2023, 15, 355. [Google Scholar] [CrossRef]
  22. Saunders, R.; Hocking, J.; Turner, E.; Rayer, P.; Rundle, D.; Brunel, P.; Vidot, J.; Roquet, P.; Matricardi, M.; Geer, A.; et al. An update on the RTTOV fast radiative transfer model (currently at version 12). Geosci. Model Dev. 2018, 11, 2717–2737. [Google Scholar] [CrossRef] [Green Version]
  23. Emde, C.; Buras-Schnell, R.; Kylling, A.; Mayer, B.; Gasteiger, J.; Hamann, U.; Kylling, J.; Richter, B.; Pause, C.; Dowling, T.; et al. The libRadtran software package for radiative transfer calculations (version 2.0.1). Geosci. Model Dev. 2016, 9, 1647–1672. [Google Scholar] [CrossRef] [Green Version]
  24. Segelstein, D.J. The Complex Refractive Index of Water; University of Missouri: Kansas City, MI, USA, 1981. [Google Scholar]
  25. Zhao, Q.; Baker, N.L.; Jin, Y.; Nystrom, R. Scale analysis of infrared water vapor brightness temperatures for tropical cyclone all-sky radiance assimilation. Geophys. Res. Lett. 2021, 48, e2021GL095458. [Google Scholar] [CrossRef]
Figure 1. (a) Best tracks and (b) minimum sea level pressure (MSLP) of Typhoon In-Fa (2021). The colors light blue, green, yellow, and orange represent tropical depression (TD), tropical storm (TS), severe tropical storm (STS), and typhoon (TY), respectively. The numbers in (a) stand for the date.
Remotesensing 15 04035 g001
Figure 2. Normalized weighting functions of the 60 selected FY-4A GIIRS channels (gray lines). The red, blue, and green represent channel 27, channel 90, and channel 417, respectively.
Remotesensing 15 04035 g002
Figure 3. Spatial distributions of observations (a,d,g), ERA5 (b,e,h) all-sky simulations, and FNL (c,f,i) all-sky simulations of FY-4A GIIRS channel 27 (top), channel 90 (middle), and channel 417 (bottom) at 1200 UTC on 24 July in 2021. The typhoon center is represented by the symbol of black “×”.
Remotesensing 15 04035 g003
Figure 4. Probability density function (zoomed) of observations (black), ERA5 all-sky simulations (blue), and FNL all-sky simulations (red) of FY-4A GIIRS (a) channel 27, (b) channel 90, and (c) channel 417 during 21–25 July in 2021.
Remotesensing 15 04035 g004
Figure 5. (a,b) RMSEs and (c,d) correlation coefficients between observations and ERA5 (left) and FNL (right) all-sky simulations of FY-4A GIIRS selected channels during 21–25 July in 2021 (time interval: 2 h).
Remotesensing 15 04035 g005
Figure 6. Horizontal distribution of FY-4A GIIRS channel 417 BT(K) of Typhoon In-Fa in 2021 on 0000 UTC 20 (ac) and 1200 UTC 22 (df) July. The left, middle, and right columns represent observed, simulated BT from ERA5, and simulated from FNL, respectively. The labels along the axes are distanced (km) from the typhoon center. The storm center line is along the meridian passing through the center of the storm.
Remotesensing 15 04035 g006
Figure 7. Variations in observed and simulated brightness temperature along the storm center line corresponding to Figure 6 at (a) 0000 UTC 20 and (b) 1200 UTC 22.
Remotesensing 15 04035 g007
Figure 8. Percentage of variance calculated via Fourier analysis using the BT values in Figure 7 for the selected wavelengths at two selected times.
Remotesensing 15 04035 g008
Table 1. The details (channel number, wavenumber, and weighting function (WF) peak) of the 60 selected FY-4A (Fengyun 4A satellite) GIIRS (Geostationary Interferometric Infrared Sounder) channels. The channel indexes corresponding to the longwave spectrum are shown in brackets.
Channel NumberWavenumber
(cm−1)
WF Peak (hPa)Channel NumberWavenumber
(cm−1)
WF Peak (hPa)
1(3)701.2525431(79)748.75945
2(4)701.87522932(80)749.3751000
3(5)702.528033(84)751.875945
4(6)703.12528034(85)752.5945
5(9)70532135(86)753.125972
6(10)705.62535136(87)753.75866
7(11)706.2536737(88)754.375790
8(12)706.87536738(89)755945
9(13)707.536739(90)755.6251000
10(16)709.37541640(91)756.251028
11(19)711.2543341(92)756.8751085
12(22)713.12545142(109)767.51085
13(24)714.37554543(112)769.3751085
14(26)715.62556544(113)7701057
15(27)716.2556545(121)7751085
16(29)717.556546(122)775.6251028
17(32)719.37515647(123)776.251057
18(33)7205448(124)776.8751000
19(34)720.6253149(125)777.501085
20(38)723.12584050(135)783.751085
21(63)738.7579051(136)784.375945
22(65)74071852(137)7851028
23(70)743.12594553(154)795.625945
24(71)743.7579054(155)796.251000
25(72)744.37576655(158)798.125945
26(73)74574256(159)798.75790
27(74)745.62586657(166)803.125972
28(75)746.25100058(184)814.3751028
29(77)747.5100059(225)8401085
30(78)748.12586660(245)852.5972
Disclaimer/Publisher’s Note: The statements, opinions and data contained in all publications are solely those of the individual author(s) and contributor(s) and not of MDPI and/or the editor(s). MDPI and/or the editor(s) disclaim responsibility for any injury to people or property resulting from any ideas, methods, instructions or products referred to in the content.