Abstract
Physically based hydrologic models require significant effort and extensive information for development, calibration, and validation. The study explored the use of the random forest regression (RFR), a supervised machine learning (ML) model, as an alternative to the physically based Soil and Water Assessment Tool (SWAT) for predicting streamflow in the Rio Grande Headwaters near Del Norte, a snowmelt-dominated mountainous watershed of the Upper Rio Grande Basin. Remotely sensed data were used for the random forest machine learning analysis (RFML) and RStudio for data processing and synthesizing. The RFML model outperformed the SWAT model in accuracy and demonstrated its capability in predicting streamflow in this region. We implemented a customized approach to the RFR model to assess the model’s performance for three training periods, across 1991–2010, 1996–2010, and 2001–2010; the results indicated that the model’s accuracy improved with longer training periods, implying that the model trained on a more extended period is better able to capture the parameters’ variability and reproduce streamflow data more accurately. The variable importance (i.e., IncNodePurity) measure of the RFML model revealed that the snow depth and the minimum temperature were consistently the top two predictors across all training periods. The paper also evaluated how well the SWAT model performs in reproducing streamflow data of the watershed with a conventional approach. The SWAT model needed more time and data to set up and calibrate, delivering acceptable performance in annual mean streamflow simulation, with satisfactory index of agreement (d), coefficient of determination (R2), and percent bias (PBIAS) values, but monthly simulation warrants further exploration and model adjustments. The study recommends exploring snowmelt runoff hydrologic processes, dust-driven sublimation effects, and more detailed topographic input parameters to update the SWAT snowmelt routine for better monthly flow estimation. The results provide a critical analysis for enhancing streamflow prediction, which is valuable for further research and water resource management, including snowmelt-driven semi-arid regions.
1. Introduction
Various modeling tools have been developed and widely used worldwide to predict hydrologic responses [,] and are deemed essential for water resource management [,], particularly in areas where the hydrologic data or information is limited [,,]. Monitoring is more reliable but is constrained by limited time and resources to collect sufficient data for adequate systems analysis [,,]. In contrast, hydrologic modeling can interpolate between the data gaps and improve understanding of the processes and the parameters [,,]. Furthermore, it is cost-effective and time-saving to help estimate flows to support monitoring, especially when high accuracy is not urgent at the primary stage [].
However, hydrological processes are sometimes difficult to explain due to the non-linear climatic and hydrologic factors and the complex parameter relationships [,]. Many hydrologic models need improved methods for simulating streamflow across watersheds [,]. Although the overall performances of these models have been improved in recent times, the models still warrant further exploration in delineating spatially distributed hydrologic processes [,], and researchers should explore the various approaches in simulating hydrologic responses for different watersheds [,]. Much past and current research has focused on determining which model among differing model types provides improved predictions that are well matched with observed data [,,].
Selecting an appropriate model for a specific application is critical, as different models have different characteristics and methods and are compatible with varying areas of study [,]. For example, Devia et al. (2015) evaluated five hydrologic models: VIC, TOPMODEL, HBV, MIKE SHE, and SWAT. The VIC model was suitable for agricultural water management in moist areas, whereas the MIKE SHE model was unsuitable for smaller watersheds due to the extensive data and physical parameters required. Besides, the SWAT model needed little calibration to achieve acceptable results, whereas the HBV model performed satisfactorily, and the TOPMODEL was successful in catchments with shallow soil and moderate topography []. Thus, finding a suitable tool for hydrographic (i.e., streamflow) prediction is challenging due to the unique dynamics of each basin, and there is no single model that is perfect for all basins [,]. Moreover, hydrologic factors influencing hydrography vary spatially and temporally [,]. Therefore, decision-makers in watershed management should adopt a suitable approach for acquiring reliable monitoring, modeling, and system characterization information, emphasizing the model’s ability to capture spatiotemporal variability, suitability for specific time scales, and flexibility in accommodating different climatic conditions.
Various types of models exist, from physically based distributed models to empirical ones [,]. Physically based models simulate flow in a river basin based on climatic and hydrologic variables, providing insights into river basin processes []. However, the physically-based models require considerable effort and extensive information for development, whereas semi-distributed models divide the watershed into units and capture spatial heterogeneity [], providing flexibility in data requirements and making them more suitable for practical applications in data-limited regions []; a well-calibrated semi-distributed model can adequately represent hydrological processes with balance accuracy and computational efficiency and provide reliable predictions with fewer computational resources than a fully distributed model [,,]. However, calibrating the numerous parameters makes the process complex and time-consuming but may sometimes produce different results from observed data due to model structure and parameter uncertainty [,]. Empirical models, on the other hand, can be appropriate when the data are limited or the physical processes are highly complex and uncertain [,]. Past studies also indicated that complex models were only sometimes the most accurate, whereas simple empirical models were more effective in reproducing observed flow [,]. Hence, we intend to identify simplicity that retains high accuracy.
Machine learning (ML) has emerged as an efficient alternative to physical process-based models due to its simplicity and ability to model complex non-linear systems and estimate variables such as streamflow from the other input variables [,]. The study aims to assess the capability of an ML approach in predicting streamflow as an alternative to a semi-distributed model. This study compared the random forest machine learning (RFML) model with the Soil and Water Assessment Tool (SWAT) for estimating long-term streamflow in a snowmelt-led mountainous watershed.
Although both SWAT and RFML have been examined separately in hydrographic prediction in the past [,], limited research has compared them [,]. Recent studies have shown improved results with ML methods, including random forest (RF) [,]. Snowmelt runoff modeling (SRM) has been previously studied and used in this study area [,], and a water operations model—URGWOM (Upper Rio Grande Water Operations Model) has also been developed [,]. However, the suitability of SWAT, a widely used semi-distributed model, is still unexplored for the study area. SWAT represents the complexity of hydrological processes by combining physical understanding and empirical calibration []. Although initially designed for large agricultural basins, not for modeling the heterogeneous mountain basins [,], SWAT often performed poorly in mountainous locations and required additional routines to be efficient; many published approaches used integrated features within SWAT [,,].
Nonetheless, evaluating SWAT’s performance for such regions could be valuable for further research, providing information on water balance and related parameters []. However, rather than developing techniques or routines for model enhancement, the study’s secondary objective is to evaluate how well the SWAT model performs in reproducing the streamflow of the study watershed with a conventional approach and to document this effort for future research. The RFML approach in predicting streamflow for this study area is novel, and the comparison with SWAT is also novel. Additionally, the study identified critical parameters and drivers affecting surface water supplies, which are critical for effectively modeling and monitoring water resource systems, particularly in semi-arid snowmelt-driven watersheds. The research outcomes have significant implications for water resource management and ecosystem services.
2. Materials and Methods
2.1. Study Watershed
The study watershed is Rio Grande Headwaters (RGH) near Del Norte (Figure 1) of the Upper Rio Grande (URG) basin of southwestern Colorado and northern New Mexico in the United States (US). The RGH is located at the upper reaches of the San Juan Mountains, in the upper part of the URG basin []. A snow-dominated hydrologic regime characterizes the watershed’s hydrology. The watershed covers an area of approximately 3380 square kilometers and includes high-elevation alpine terrain, forested mountain slopes, and some lower-elevation agricultural regions. The elevation of the watershed ranges from 2434 to 4215 m above sea level, with an average of 3230.68 m. Most of the annual streamflow occurs during the spring and early summer as the snowpack melts, which can contribute significant flow to the RG downstream [,]. The URG basin exhibits variability in temperature and precipitation based on latitude and elevation. The watershed’s annual average temperatures are −6 to −1 °C, ranging from −6 to 7 °C, and it receives an average annual precipitation of approximately 630 mm, with much of this falling as snow in the winter months [,]. A series of steep-sided valleys and ridges characterize the topography of the watershed. Overall, the complex landscape and topography of the watershed can pose challenges in accurately simulating flow [].
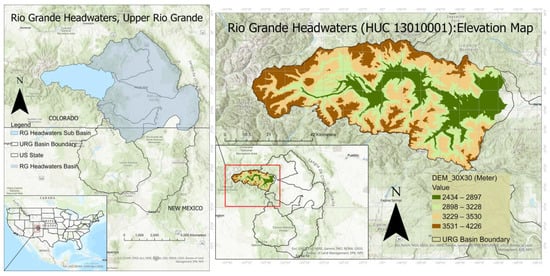
Figure 1.
The study watershed (Rio Grande Headwaters) at the Upper Rio Grande.
Efficient management of water resources in the semi-arid Southwest is critical due to recurring droughts, which are expected to worsen with climate change [,,]. Projected climate change and related impacts on water resources in the diverse US Southwest are expected to vary as a function of local elevation and even by hillslope orientation [,,]. The runoff ratio reduction suggests a potential future decline in streamflow due to rising temperatures [,]. Climate change may significantly affect various hydro-geo-climatic factors of the RGH watershed, leading to a compounded decline in runoff, which serves as a vital upstream source and water supply for the entire URG basin. The URG basin’s declining snowpack affects streamflow dynamics, potentially impacting agriculture, ecosystems, and socio-technical systems [,,]. Long-term simulations through robust models are needed to efficiently predict streamflow and manage water resources in the region []. Temperature rise and precipitation variability are consistently projected across various models [,], whereas other crucial variables specific to local contexts are often overlooked. The study’s underlying interest is exploring critical components/factors to the watershed’s streamflow dynamics by analyzing the parameter sensitivity of SWAT and variable importance measures of RFML.
2.2. Prediction Methods and Predictor Variables
Different research groups use different variables and empirical techniques for runoff estimation. For example, the NRCS employed multiple linear regression models that establish a mathematical relationship between predictor and response variables expressed through equations []. However, linear methods are appropriate for only some limited cases []; conversely, ensemble decision tree-based algorithms are suitable for diverse data, can ignore irrelevant predictors, and handle both linear and non-linear mechanisms being interpretable []. RF is a unique ensemble method with inherent accuracy estimation and predictor importance measures [,]. We selected RF for its ability to identify and rank important predictors through variable importance measures. Furthermore, the RF algorithm can efficiently use data from diverse sources with different scales, effectively deals with multicollinearity, and does not require normal data distribution []. It can capture non-linear relationships despite some collinearity [,] since it does not depend on the linearity assumption between predictor and response variables, making it relatively robust to collinearity compared to other regression methods, such as linear regression [].
Various predictor variables, including snow water equivalent (SWE), snow depth, precipitation, antecedent streamflow, soil moisture, sublimation, temperature, etc., have been used in various studies in predicting the streamflow of the region [,,]. The Natural Resources Conservation Service (NRCS) uses several predictor variables, including snow water equivalent (SWE), precipitation, antecedent streamflow, temperature, groundwater levels, and soil water content, to forecast seasonal streamflow volume [,]. Studies indicated that minimum temperature is often significantly connected to snowmelt timing and rate, affecting snow cover’s persistence and the snowmelt initiation time [,]. Elevated minimum temperatures accelerate snowmelt, leading to earlier peak snowmelt and lower overall snow water equivalent [,]. However, the minimum temperature and snowmelt relationship depends on many factors, such as snowpack characteristics, elevation, and regional climate patterns [,]. The increasing temperatures can also increase sublimation by enabling greater latent heat absorption into the snowpack, causing a reduction in snowpack and earlier runoff and reducing water supplies after runoff [,].
Snowpack properties and distribution are vital for water supplies in snowmelt-dominated river systems, acting as a reservoir and contributing significantly to runoff patterns [,]. Runoff can also be influenced by soil moisture, an essential factor in providing water from snowmelt runoff and precipitation [,]. Based on the literature review [,,,,,], we selected five non-mutually exclusive predictor variables—minimum temperature, snow depth, precipitation, soil moisture, and sublimation for streamflow prediction using the RFML model, as these variables can interact in complex ways and may co-occur to influence streamflow.
Several studies emphasized understanding the dynamics of variables’ influence on estimating runoff [,,] and discussed the potential applications of remote sensing techniques in monitoring variables’ variability for improving prediction [,]. The advent of novel techniques in remote sensing has enhanced its capability to address the spatial and temporal variability of snow factors [,]. Many researchers, therefore, utilized remote sensing data and techniques such as synthetic aperture radar (SAR) and optical remote sensing (ORS) to monitor these variables’ variability [,,].
2.3. Random Forest Machine Learning (RFML)
RFML is a supervised ML method that creates multiple decision trees for the prediction model, where each tree is trained on a randomly selected subset of the available training data []. During prediction, the algorithm combines the predictions from each decision tree to generate a final prediction [,,]. In addition, the RFML can handle missing data and non-linear relationships between the predictors and the target variable [,].
RFML: Random Forest Regression (RFR)
RFR is a specific type of RFML that is effective for predicting continuous values []; it generates many decision trees on different data subsets, and the final prediction is made by averaging the results of all the individual trees. RFR has been widely used for hydrologic prediction utilizing meteorological and hydrological parameters; its feature of identifying the most critical predictor variables helps comprehend underlying hydrological processes [,,]. Studies have demonstrated the superiority of RFR over other ML algorithms and traditional statistical methods in streamflow prediction [], especially in regions with intricate hydrological processes and limited data availability [,]. Cho et al. (2019) successfully applied RFML predicting hydrographs in snowmelt-driven mountainous watersheds []. RFML has become popular in the remote sensing and hydrology communities due to its higher accuracy in streamflow predictions and flood risk management, which have traditionally been challenging with traditional approaches [].
2.4. Data Description
The study used a 30 m × 30 m resolution digital elevation model (DEM) obtained from the Shuttle Radar Topography Mission (SRTM) of the United States Geological Survey (USGS) EarthExplorer and extracted it using QGIS 3.16 []. The watershed was delineated using the DEM and the operational USGS gauging station (Lat 37°41′19.0″, Lon 106°27′35.5″, NAD83) at Del Norte (08220000) (Appendix A). Monthly time-step data for selected predictors (i.e., minimum temperature, snow depth, precipitation, soil moisture, and sublimation) and response (i.e., streamflow) variables were gathered from January 1991 to December 2016 from various sources summarized in Table 1.

Table 1.
Variables used in the study and their respective data format and sources.
To prepare the remote sensing data for analysis, we first disaggregated the original monthly raster cells to a resolution of 30 m × 30 m. Then, we clipped the resulting cells to the sub-watershed border. Subsequently, the sub-watershed responses were derived as the average of the disaggregated pixels, determining the monthly mean values of the variables of interest. All data processing and analysis were conducted using RStudio []. We use the raster packages’ disaggregate () function that employs bilinear interpolation in raster resampling [].
We extracted the randomForest package [] to develop the RFR model. The target variable and input features are defined in the training set. The general process primarily splits the data into training and validation sets through bootstrapping and out-of-bag (OOB) sampling. The train () function is used for ML tasks, i.e., bootstrapping and out-of-bag (OOB) for cross-validation, reducing bias and overfitting. For optimizing the performance on the validation set, a grid or random search is performed over a range of values for the hyperparameters ntree (trees), mtry (variables randomly selected at each split), and maxnodes (maximum terminal nodes in each tree). We set the root mean square error (RMSE) as the training control object for a 10-fold cross-validation (method = “cv”, number = 10); the model adjusts its parameters during training to minimize the RMSE, leading to more accurate predictions of the validation set. The 10-fold cross-validation process involves dividing the data into 10 subsets, training the model on nine subsets, and evaluating its performance on the remaining subset. The process is repeated 10 times, using a different subset as the validation set. The caret package used automatically selects the best combination of the hyperparameters based on the minimum RMSE value. We applied ridge regularization during model training to address overfitting concerns and ensure the model’s robustness. Ridge regularization adds a penalty term to the loss function, which helps control model complexity and prevents overfitting []. The model returned by the train () function is trained on the entire dataset and, based on the average performance of the model on all the resampled data, provides a more robust estimate of the model’s performance []. Finally, the trained model makes predictions on a separate validation set, and we evaluated its capacity to reproduce flow data on the validation set. Figure 2 presents a flowchart for this RF model connecting predictor and target variables.

Figure 2.
Flow chart for RF model connecting predictors and target variable.
RFML addresses prediction uncertainty through bootstrapping to generate an ensemble of decision trees, which involves randomly sampling the dataset, allowing each decision tree to be trained on a different subset of the original data and estimating the variance of predictions across the trees. The OOB error estimate further evaluates the model’s performance on the test data set, addressing prediction uncertainty. The default OOB sample size is one-third of the original dataset proposed by Bradley Efron []. However, the optimal proportion may vary depending on the dataset size and complexity. Therefore, experimenting with different proportions is crucial to determine the best fit for each situation.
2.5. Analytical Procedure
We implemented a customized approach to the RFR model for long-term streamflow prediction, assessing the model’s performance for three training periods. Adapting the customized approach involves manually splitting the dataset into different periods for the training dataset and holding out a validation dataset not used in the model training. The predict () function in the code utilizes the trained model and the input variables’ data to predict streamflow on the validation dataset. We evaluated the trained model’s performance on a separate validation dataset not used during training or cross-validation. Three different training/validation data ratios were considered: (1) a 62.5–37.5% split (i.e., 2001–2010 for training and 2011–2016 for validation), (2) a 71–29% split (i.e., 1996–2010 for training and 2011–2016 for validation), and (3) a 77–23% split (i.e., 1991–2010 for training and 2011–2016 for validation), where the same validation data period (2011–2016) was used for evaluating the model’s prediction accuracy for each ratio. We assessed the impact of the length of the training data on the model’s prediction accuracy by varying the training and validation data ratio and evaluating their performance using performance metrics. Using segregated data splits allows the model’s ability to generalize for unseen future data to be investigated, which is crucial for hydrologic predictions. It also provides valuable insights into the model’s adaptability to different climatic conditions and land use patterns, affecting streamflow. In other words, significant for model development and validation, we identified the impact of the training period’s length on the hydrologic prediction using RFR. To the authors’ knowledge, this analytical approach for exploring RFR in hydrographic prediction has yet to be documented in the literature.
2.6. Variable Importance
RF determines predictor variable importance by measuring the decrease in the impurity of the target variable when a particular predictor variable is included in the model. The IncNodePurity represents the total decrease in node impurity, weighted by the probability of reaching that node, averaged over all decision trees in the ensemble. A higher value of IncNodePurity indicates that the variable is more important for the model. The importance () function in the randomForest package computes the importance scores. The algorithm calculates the importance score for each predictor variable and averages these values over all trees to measure variable importance [,,].
2.7. SWAT Hydrologic Model
SWAT is a well-known process-based hydrological model for simulating hydrologic cycles, sediment yield, water quality, and quantity in watersheds, developed by Texas A&M AgriLife Research and the United States Department of Agriculture—Agricultural Research Service (USDA-ARS) [,]. The SWAT model incorporates both physically based and empirical elements, such as the curve number (CN) method for estimating runoff and requiring calibration for parameter adjustment [,]. The classification of SWAT varies among experts, with some considering it a physically based model with empirical components and others categorizing it as semi-physically based []. Primarily developed for large agricultural watersheds, SWAT is suitable for assessing the impact of long-term land use, management practices, and climate change on ungagged study basins [,]. SWAT requires input variables such as DEM, LULC, soil map, and weather data [] and is a suitable hydrologic model for long-term simulations [,].
SWAT divides watersheds into sub-basins and hydrological response units (HRUs) based on land use, lithology, and slope. This creates a more accurate model, with different HRUs for each sub-basin. The hydrological cycle is simulated using the general water balance equation [,]. The SWAT water balance equation calculates the final water content (SWt) of a watershed based on the initial water content (SW0), precipitation (Rd), surface runoff (Qsur), evapotranspiration (Ea), unsaturated zone water accumulation (Wseed), and return flow (Qqw). The water balance equation is as follows:
SWt = SW0 + Σ(Rd − Qsur − Ea − Wseed − Qqw)
It represents the balance between water cycle components in a watershed or catchment. The SWAT water balance equation helps understand the hydrological processes in a watershed and is useful for evaluating the impacts of land use and climate change on water resources [,,].
The study implemented the general process of SWAT 2012 hydrologic modeling, including data collection, hydrologic model setup, output data calibration, sensitivity analysis, and validation []. First, input data were collected, including climatic and hydrologic parameters; a hydrologic model was then set up to convert the input parameters (rainfall, temperature, relative humidity, wind speed, and solar radiation) into runoff or flow. Next, the simulated flow was calibrated with observed flow through selected parameters. Finally, a sensitivity analysis was conducted to rank the parameters’ sensitivity, and the model was validated in the end. The study calibrated monthly and annual mean simulated flow (a warming period in 2001) with observed flow data from 2002 to 2010 and validated it from 2011 to 2015.
2.7.1. Input Data
The input data—topography, land use, soil, meteorology, and hydrography data—were collected from various sources/agencies; the data and the corresponding sources are given in Table 2.

Table 2.
Data type, data description/scale, and data sources used for the initial setup of the SWAT model.
The observed flow was converted to cubic meters per second to match the SWAT model’s flow output unit []. Similarly, the raster DEM, soil, and land use map were converted into a common NAD 1983 UTM Zone 13N coordinate system and resampled land use and soil raster to a 30 m × 30 m resolution to prepare for analysis in QSWAT. QSWAT, a QGIS plugin, is used to delineate the watershed (Appendix A), calculate hydrologic responses, and visualize SWAT outputs []. Table 3 summarizes the land use and soil information extracted for the watershed using land use land cover and soil data layers.

Table 3.
Land use land cover (Lulc) and soil information for the RGH.
Precipitation and temperature data were downloaded from the CFSR Global Weather database for the study watershed and re-formatted for the SWAT model. Other variables, such as wind speed, evapotranspiration, relative humidity, and solar radiation, were generated through the SWAT weather generator [,].
2.7.2. Calculation of Runoff Volume
The model used the SCS-CN (Soil Conservation Service–Curve Number) method, commonly used for estimating the runoff generated from a rainfall event in a particular area, preferably in suburban or rural areas []. The method is designed for a single storm event but can be scaled to find average annual runoff values. The curve number is based on the area’s hydrologic soil group, land use, treatment, and hydrologic condition for a particular watershed, where hydrologic characteristics of soil and rainfall volume are known. The entire runoff hydrography can be produced as an outcome. When specific information on antecedent conditions is unavailable, the SCS-CN method is widely used to estimate precipitation []. Typically, the SCS model computes direct runoff with the help of the following relationship:
where CN = weighted curve number, CN = curve number from 30 to 100, and N. A = area with curve number CNi.
S = (24,500/CN) − 254
Q = ((P − 0.3 S) 2)/(P + 0.7 S) CN = (Σ (CN ∗ Ai))/A
A is the total area of the watershed. At the same time, CN is the runoff curve based on hydrologic soil cover, a function of soil type, land cover, and antecedent moisture condition (AMC). Q is an actual runoff in mm, P is total rainfall in mm, and S is the potential maximum water retention by the soil in mm []. Based on the capacity of the soil for infiltration, soils are divided into four categories: A, B, C, and D, representing a strong infiltration capacity, a fairly high infiltration capacity, a moderate infiltration capacity, and a low infiltration capacity, respectively [].
2.7.3. Model Calibration, Validation, and Performance Evaluation
The SUFI-2 algorithm provided by SWAT-CUP automatically calibrates the model parameters []. The simulation period is divided into warming-up (2001), calibration (2002–2010), and validation periods (2011–2016). In this study, the index of agreement d, Nash–Sutcliffe efficiency coefficient (NSE), coefficient of determination (R2), ratio of the standard deviation of observations to root mean square error (RSR), and percent bias (PBIAS) were used to evaluate model performances. The equations are aggregated in Table 4.

Table 4.
Objective functions and their corresponding equations.
Where Qobs is the observed streamflow, and Qsim is the simulated streamflow. The index of agreement (d) is a metric used to measure the agreement between observed and simulated values, ranging from 0 (no agreement) to 1 (perfect agreement) []. Although R-squared (coefficient of determination) is commonly used for performance evaluation in hydrological modeling, it has limitations, such as oversensitivity to high extreme values and insensitivity to additive and proportional differences between simulated and observed data []. The Nash–Sutcliffe efficiency (NSE) is a normalized statistic that estimates the relative magnitude of residual variance and measures how well the observed versus simulated plot fits on the 1:1 line [,]. Finally, the PBIAS measures the central tendency of the simulated data and indicates whether the model’s performance is poor by identifying the inclination to be greater or smaller than the observed data []. Table 5 presents the objective function results, their statistical ranges, and optimal values.

Table 5.
The objective functions, range, and optimal and satisfactory values.
The SWAT model outputs were calibrated using a multi-objective approach for the selected parameters to achieve goodness-of-fit between observed and simulated flows; The sensitivity of parameters was determined to assess their impact on streamflow by regressing them against the average of the objective function values.
2.8. Sensitivity Analysis
Sensitivity analysis aims to determine the optimal range of parameters and rank their sensitivity []. The study performed a global sensitivity analysis using Latin hypercube sampling to determine the optimal parameter range and rank sensitivity. It is usually used in Monte Carlo simulation; it significantly reduces the number of runs necessary to achieve a reasonable outcome []. The t-stat provides a measure of sensitivity identifying relative significance, and the p-value determines the significance of the analysis (a value close to zero is more significant). A larger absolute value of the t-stat and a smaller p-value indicates a more sensitive parameter [].
3. Results
3.1. SWAT Model Performance Assessment
The study evaluated the performance of SWAT by comparing simulated monthly and yearly average flows with observed data using the selected objective functions. The results show that the monthly flow simulation needed more adjustments for better prediction accuracy, whereas the annual simulation was fairly acceptable.
We selected 22 parameters for streamflow calibration based on relevant literature of comparable study areas [,,]. The original ranges and fitted values of these parameters are provided in Table 6.

Table 6.
Fitted values with primary ranges of the selected streamflow calibration parameters.
The primary ranges of parameters for monthly and annual simulations were the same; we also listed the fitted values in Table 6 and depicted the flow hydrographs in Figure 3 and Figure 4. Once the calibrated parameters were validated, the simulated and observed flows were illustrated and compared for both the calibration and the validation periods, as shown in Figure 3.
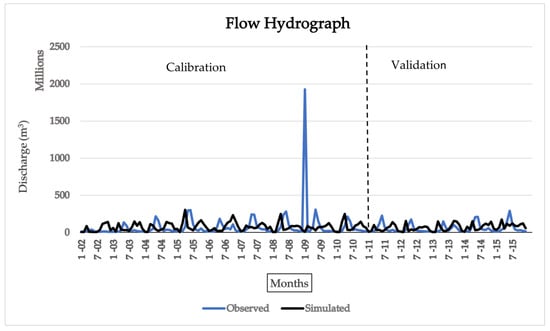
Figure 3.
Comparison of monthly simulated and observed streamflow during calibration and validation.
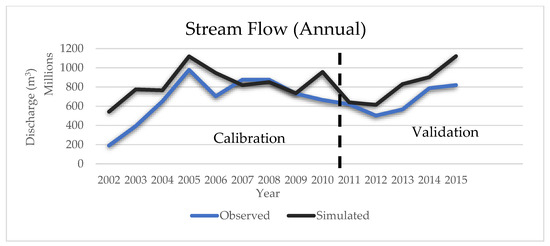
Figure 4.
Comparison of yearly simulated and observed streamflow during calibration and validation period.
The simulation results showed a slight left shift in most flow peaks compared to the observed ones, implying that the simulated peak flows occurred a month or two earlier than the observed peak. This discrepancy suggests a timing issue or error between the observed and simulated flow [,], indicating that the simulated flow peak occurred slightly earlier, ranging from one month to two earlier than the observed flow peak. Figure 4 presents a comparison between simulated yearly mean discharge and observed discharge.
The SWAT model’s annual simulation results provided better accuracy (Table 7) with observed flows; however, a model overestimation (Figure 4) still appeared during calibration and validation periods. The goodness-of-fit metrics, presented in Table 7, provide a means of evaluating model performance and comparing the accuracy of yearly and monthly flow simulations.

Table 7.
Performance of SWAT model for simulating monthly and yearly flow during calibration and validation stage.
Table 7 shows the goodness-of-fit metrics for the observed vs. simulated streamflow during the calibration and validation periods. The yearly simulation approach performed better, with higher R2, NS, and d values and a lower RSR value than the monthly simulation. On the other hand, the performance of the monthly simulation, with R2, NS, and d, was below satisfactory levels. The annual simulation was acceptable, with satisfactory R2 and d at both the calibration and validation stages. However, monthly and yearly simulations overestimated the observed flow during calibration and validation but within acceptable limits (±25) of PBIAS%. Despite being within the acceptable limit of ±25, this implies that there might be some uncertainties in the input data or the model structure, which need to be further investigated and addressed to enhance the model’s performance.
Therefore, during calibration, the sensitive parameters were identified through global sensitivity analysis. The analysis revealed that HRU SLP.hru (average slope steepness) was the most sensitive for monthly streamflow, followed by EPCO.bsn, Alpha_BF.gw, SMFMX.bsn, and CH_K2, in that order of sensitivity (Appendix B), and these parameters significantly impacted the model output. Therefore, improving these parameters’ measurement or estimation accuracy could enhance the model performance and the overall understanding of the watershed hydrological response.
3.2. RFML Model Performance Assessment
The study implemented the 10-fold cross-validation approach, applied ridge regularization, and presented metrics for the cross-validation and validation datasets to comprehensively evaluate the model’s performance and its potential for overfitting. The RFML model was developed for three training periods to predict and validate 2011–2016 data. The models’ performances were assessed based on the same evaluation metrics—d, R2, PBIAS%, NSE, and RSR—as shown in Table 8.

Table 8.
RFML model performance on different training periods for streamflow prediction/validation.
The results indicate that the model performed well on the validation dataset, and consistency between cross-validated metrics and validation metrics suggests that the model generalized reasonably well to new, unseen data. The RFML model performed well in predicting the validation set in all three training periods, with a good R2 (0.79–0.81) and NSE (0.791–0.846), indicating a good fit between observed and predicted values. The PBIAS% values ranged from 1.079% to 4.982%, indicating a slight underestimation of the flow. The ranges (0.918–0.956) of d values suggest that the model’s predictions agreed with the observed data. The RSR values were low (0.487–0.394), implying that the model’s predictions had low uncertainty. The overall results suggest that the RFML models performed well during the cross-validation and testing/validation stages and accurately predicted streamflow. The results also indicate that increasing the training period length improved the RFML model’s performance. Although the improvement was not significant, the significant part was the improving nature, consistent with the increased training period, which indicates that the model became more capable of capturing variability and delivering better results with a more extended training period. The model trained in the most extended period (1991–2010) had the highest values of d, R2, and NSE and the lowest value of RSR among all three training periods, indicating that the model trained on the longest period was better able to capture the variability in streamflow data and produce more accurate predictions.
3.3. Variable Importance Assessment
This relative importance (IncNodePurity) ranking was significant to the study; it allowed for prioritizing critical predictors and understanding their relative contributions to the model’s predictions. We analyzed the variable importance measure to identify key predictors that became significant during specific training periods, which allowed us to understand how the predictor rankings evolved and adapted to changing hydrological conditions, providing valuable insights into influential variables under different climatic and environmental settings. Incorporating the variable importance measure enhanced the interpretability of the models, making it valuable for decision-making in hydrological applications.
The IncNodePurity (Figure 5) suggested that mean_snowDepth was the most influential predictor of the streamflow of the watershed; however, it was not correlated (Appendix C) with streamflow. The IncNodePurity importance measure also revealed that mean_snowDepth and Tmean were consistently the top predictors across all training periods, whereas Tmean also had a good correlation with streamflow. Figure 5 shows each training period’s RF variable importance (i.e., IncNodePurity).

Figure 5.
Random forest variable importance (i.e., IncNodePurity) for training period 1991–2010, 1996–2010, and 2001–2010 consecutively from left to right.
Mean_ppt was weakly but interestingly negatively correlated with streamflow in the correlation table (Appendix C), which may require further investigation. The correlation between precipitation and streamflow can be negative in watersheds with high evapotranspiration rates or soils with high infiltration capacity. More rain can lead to less water in rivers and streams, negatively correlating precipitation and streamflow. In addition, a negative correlation can occur if precipitation falls as rain, causing early snowmelt or not accumulating as much. The relationship in mountainous basins dominated by snowmelt is complex and depends on temperature, snow accumulation, and snowmelt timing. Mean_soilMoisture and mean_ppt importance varied for different training periods and mean_sublimation was consistently the least important, according to IncNodePurity. Soil moisture and snow depth were also strongly correlated, whereas snow depth was the most important predictor variable. Therefore, we plotted the snow depth with the predicted and observed streamflow in Figure 6.
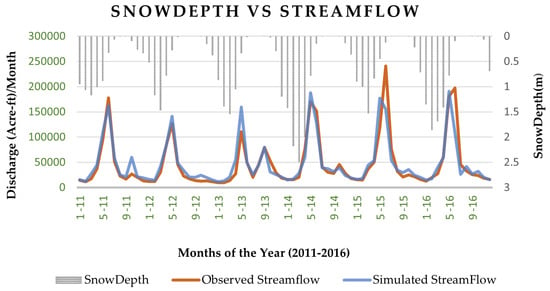
Figure 6.
Snow depth versus simulated and predicted streamflow in the watershed.
Figure 6 shows the relationship between snow depth and the observed/predicted streamflow. The peak flow occurred when the snow depth was diminishing, indicating that snowmelt is a significant factor in determining the timing and magnitude of the peak flow. This relationship is essential to the hydrological cycle in snow-dominated regions and can inform water resource management decisions. It is important to note that the peak snow depth/diminishing varied by a couple of months and did not consistently occur at the same time each year, influencing the streamflow and the peak flow timing in the basin.
4. Discussion
The SWAT monthly simulation exhibited a leftward shift in the flow peak compared to the observed data, indicating a timing error. Snowmelt timing likely played a crucial role in this case. The degree–day approach in the SWAT model assumes uniform snowmelt across the watershed [,], which may not be the case in some areas of this large mountainous watershed for topographic and meteorological factors. This approach defines snowmelt as happening when the temperature on a given day is higher than the melting temperature of snow []. However, this approach only takes the daily average temperature and does not consider the total amount of heat accumulating over time []. SWAT considers 0 °C a linear function of the difference between the average snowpack–maximum air temperature and the base or threshold temperature for snowmelt [], but the dust in snow of the watershed can also change the mechanism, which can allow more solar radiation into the snowpack [,]. Absorbing more solar energy can enhance sublimation and affect snowmelt timing by accelerating the snowmelt rate [,]. The accurate data or prediction of these snowmelt characteristics is critical for the model prediction for this area (Figure A7). Many researchers, therefore, use remote sensing data or develop particular routines (i.e., a temperature index-based approach within SWAT) to capture spatial variability in snow accumulation and melting [,,,,]. For example, Debele et al. (2009) compared two methods for simulating snowmelt processes—a physically based energy budget model and a simpler temperature index model within SWAT, and they found that the simpler temperature index model was sufficient for most practical applications and that the inclusion of ground surface slope and aspect could improve results []; this approach can be adopted to improve monthly simulation, as accurately representing slope steepness is also crucial in this watershed in simulating hydrologic response due to the sensitivity of the SLP.hru parameter.
The HRU SLP.hru parameter is the most sensitive parameter for the watershed, and accurately representing slope steepness is crucial for capturing hydrological behavior. Incorporating more detailed topographic information for calibrating the SLP.hru parameter in a large watershed like the RGH may be challenging but necessary to improve model performance. Improving accuracy in estimating slope steepness using DEMs or remote sensing techniques can be utilized. Accurate data or prediction of these factors is critical for model accuracy, as slight changes can significantly change the model prediction.
The SWAT model warrants more time and data to set up and calibrate; still, a viable model delivering acceptable performance in simulating annual streamflow simulation with satisfactory d, R2 (Appendix D), and PBIAS% values but monthly simulation warrants further exploration and model adjustments. In contrast, the RFML model showed good performance with a simplified procedure in predicting monthly flow using remotely sensed data and some predictor variables, as indicated by the high values of R2 and NSE, which measure the model’s accuracy in capturing the observed streamflow variability. Although the model tended to underestimate streamflow values (positive PBIAS%), it still predicted streamflow well during the validation period with different training lengths. A more extended training period enhanced the RFML model’s performance, allowing it to capture more complex relationships between input and output variables, resulting in better predictions.
IncNodePurity of RFML determined the importance of snow depth as a predictor, which is intriguing despite not correlating with streamflow. The feature importance of RFR is typically calculated based on how much a particular feature contributes to reducing the impurity in the nodes of the decision trees. The RFML model can capture complex non-linear relationships between snow depth and streamflow, which traditional correlation analysis may not reveal. The peak flow observed after a month or two of diminishing snow depth, as shown in Figure 5, indicates that the variability in snowmelt rate posed challenges in establishing a direct correlation. Other factors like climate change and dust may contribute to this complexity, affecting the snowmelt rate. Here, the snowmelt (Figure A8) rate would be more likely to correlate with streamflow rather than snow depth. Although the IncNodePurity and global sensitivity analysis employ different methodologies, they both indicate the importance of snow parameters, with the sensitivity analysis identifying the SMFMX.bsn (melt factor) as one of the top sensitive parameters.
Scope of Future Study
We evaluated the sensitive parameter ranking of the SWAT model, which highlighted mountain slope (HRU SLP.hru, average slope steepness) and snowmelt factor (SMFMX.bsn) as essential parameters for model sensitivity. On the other hand, snow depth and min temperature consistently emerged as the top predictor variables from RFML variable importance analysis across different periods. Interestingly, altitude, min temperature, snow depth, and snowmelt rate are interconnected and mutually inclusive, influencing the streamflow dynamics, which provides a significant insight into the watershed response. The relative importance ranking, combined with the sensitive parameter analysis from SWAT, enhances understanding of the watershed’s behavior, shedding light on the contribution of identifying critical parameters. Enhancing these parameters’ estimation accuracy could significantly improve model performance and deepen understanding of watershed hydrological response, laying a solid foundation for future research.
The study focused on a watershed with specific characteristics critical for the entire basin; future studies can incorporate a broader dataset with multiple heterogeneous watersheds, allowing for a more comprehensive analysis of watershed behavior. Such an approach can enable a deeper understanding of the relative influence of parameters, enhancing its analysis by quantifying the impact of predictors on the model’s error and incorporating lag effects in the analysis, which would provide a better understanding of temporal relationships between variables, such as the influence of winter soil moisture on summer flow.
5. Conclusions
The study assessed SWAT performance in a semi-arid snowmelt-driven region of the RGH, calibrating monthly and annual average streamflow from 2002 to 2010 with a one-year (2001) warm-up period and validating from 2011 to 2015. The SWAT model produced acceptable results for the annual average streamflow simulation; however, more exploration and adjustments were required for the monthly simulation. The study recommends exploring snowmelt runoff hydrologic processes, dust-driven sublimation effects, and more detailed topographic input parameters to enhance the model for better flow estimation. This study serves as a reference, documenting a primary study with SWAT for the study area and identifying challenges that require the development of additional routines for model enhancement, foundational for future modeling efforts.
The RFML models’ performances were assessed during three training periods, across 1991–2010, 1996–2010, and 2001–2010. Model validation was conducted on the data from 2011 to 2016. The results showed that the RFML model performed well in all three training periods. Furthermore, they indicated that the model’s performance increased as the training period increased, with the highest d, R2, and NSE values and the lowest PBIAS% and RSR values found for the most extended training period (1991–2010).
A critical aspect of the study was the utilization of remotely sensed datasets, such as SRTM, PRISM, and GES DISC, to generate derived datasets, which played a significant role in the investigation and provided valuable inputs for modeling efforts. The remote sensing data used in this study were explicitly derived for monthly response and subsequently utilized in RFML to explore reproducing streamflow data. As a result, the research presented an exclusive approach for deriving remote sensing data and using it in RFML, demonstrating the usefulness of the process for watershed modeling and monitoring.
Every hydrological model has specific applications and distinct limitations associated with uncertainties [,]. These uncertainties can be addressed by comparing different models for a given geographic region [,,]. The study compared the effectiveness of the SWAT and the RFML models and provided insights into the strengths and limitations of their simulating streamflow in a snowmelt-dominated watershed. For example, SWAT can simulate flow in watersheds with no streamflow data and can be valuable for understanding underlying hydrologic processes. However, it takes large input data, including land use, soil type, topography, weather data, and other parameters influencing the hydrologic process; consequently, the model requires substantial time and effort. Therefore, it was crucial to pursue a more efficient alternative to reproduce streamflow closest to reality with as simple an approach as possible (i.e., the principle of parsimony). The RFML model demonstrated higher prediction accuracy than the SWAT model, utilizing a simplified procedure, even without requiring parameter tuning or predictor reduction.
Process-based hydrologic models can provide valuable insight into hydrologic processes and model parameters; however, simulating the process warrants much more information and time. A simpler machine learning model may be more suitable when the main goal is to predict or reproduce streamflow to support watershed management with limited information. Based on validation data metrics, RFML appears to be a desirable alternative or a complementary tool to process-based models. The RFML model outperformed the SWAT model in accuracy by utilizing remote sensing data of the hydroclimatic predictor variables of the snowmelt-driven watershed, where snowmelt runoff modeling is particularly challenging. This also opens up new scopes for research in hydrographic predictions.
Simulating hydrologic responses is crucial for operational hydrology and water resource management, especially in data-scarce regions. Although both models are useful, their performance can be improved by reducing uncertainty and enhancing the estimation accuracy of the critical parameters. Furthermore, integrating semi-distributed (i.e., SWAT) and ML approaches in predicting hydrologic responses can enhance monitoring and management efforts. The results provide a critical analysis for enhancing the streamflow prediction needed for monitoring and managing water resources, including snowmelt-led semi-arid regions. In addition, the findings can aid in modeling hydrologic events such as climate change, land use change, floods, and droughts, leading to improved water security, ecosystem health, and sustainability.
Author Contributions
Conceptualization, K.I.I. and E.E.; Methodology, K.I.I.; Software, K.I.I.; Validation, K.I.I., E.E. and K.C.C.; Formal analysis, K.I.I.; Investigation, K.I.I.; Resources, K.I.I., E.E. and K.C.C.; Writing—original draft, K.I.I.; Writing—review & editing, E.E., K.C.C. and C.B.; Project administration, C.B.; Funding acquisition, E.E. All authors have read and agreed to the published version of the manuscript.
Funding
The authors acknowledge the support (Grant No. 58-3050-9-012) of the U.S. Department of Agriculture—Agricultural Research Service and National Science Foundation (NSF), award number (FAIN) 2142686. The Article Processing Charge (APC) was funded by USDA-ARS grant number 58-3050-9-012.
Data Availability Statement
The data presented in this study are available on request from the corresponding author.
Conflicts of Interest
The authors declare no conflict of interest.
Appendix A. SWAT Subbasins, Streamflow Network, and Flow Distribution
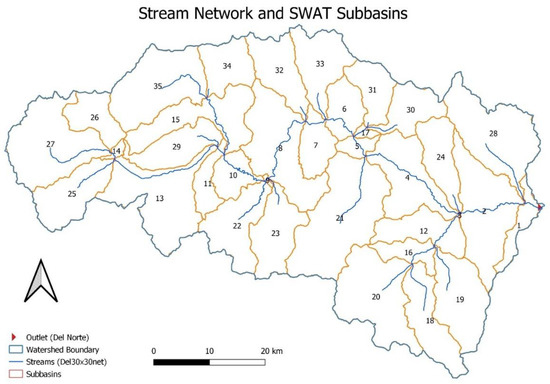
Figure A1.
Generated SWAT subbasins and stream network.
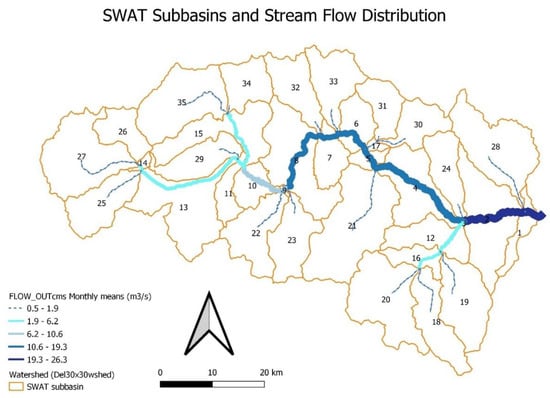
Figure A2.
SWAT subbasins and streamflow distribution.
Appendix B. Results of Global Sensitivity Analysis
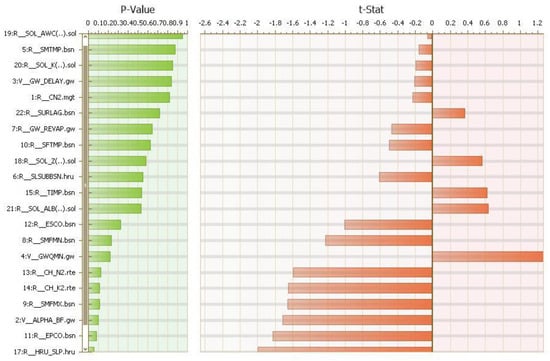
Figure A3.
p-value and t-stat for the watershed parameters.
Appendix C. Correlation Matrices of the Predictor and Response Variables Used in RFML
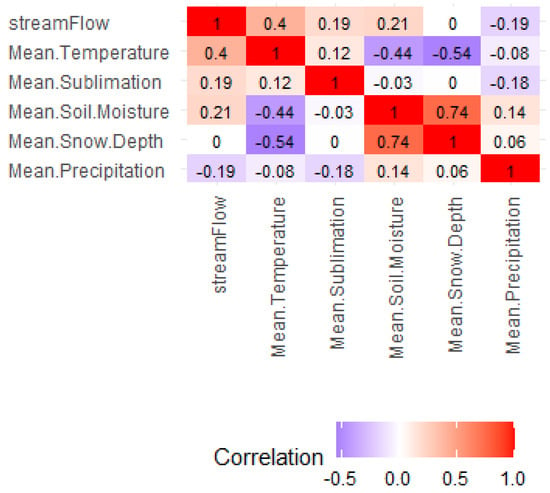
Figure A4.
Correlation matrices of the input variables.
Appendix D. Scatter Plot and Regression Line for RFML and SWAT Simulations
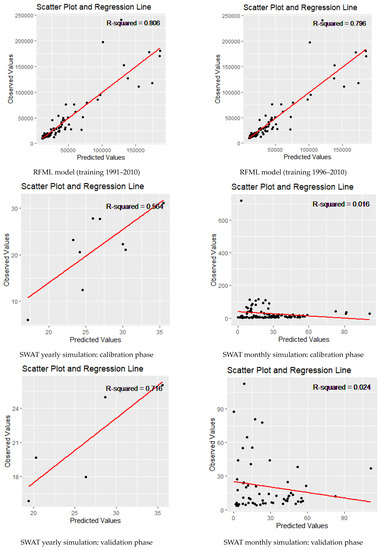
Figure A5.
Scatter Plots for the predictions through RFML and SWAT.
Appendix E. Simulated Flow vs. Precipitation Inputs vs. Snowmelt
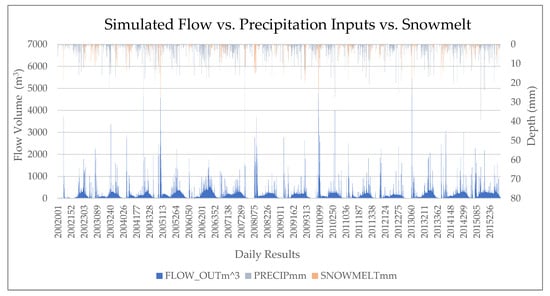
Figure A6.
FLOW_OUTm^3 vs. PRECIP mm vs. SNOWMELT mm.
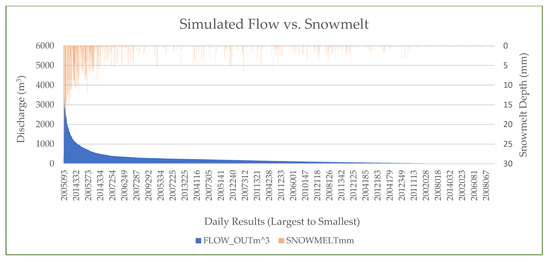
Figure A7.
FLOW_OUTm^3 vs. SNOWMELTmm inputs from largest to smallest.
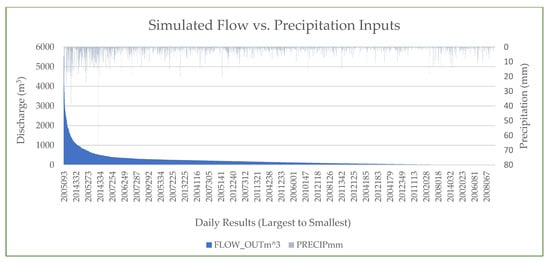
Figure A8.
FLOW_OUTm^3 vs. PRECIPmm from largest to smallest.
References
- Jimeno-Sáez, P.; Martínez-España, R.; Casalí, J.; Pérez-Sánchez, J.; Senent-Aparicio, J. A Comparison of Performance of SWAT and Machine Learning Models for Predicting Sediment Load in a Forested Basin, Northern Spain. Catena 2022, 212, 105953. [Google Scholar] [CrossRef]
- Tegegne, G.; Park, D.K.; Kim, Y.-O. Comparison of Hydrological Models for the Assessment of Water Resources in a Data-Scarce Region, the Upper Blue Nile River Basin. J. Hydrol. Reg. Stud. 2017, 14, 49–66. [Google Scholar] [CrossRef]
- Dutta, P.; Sarma, A.K. Hydrological Modeling as a Tool for Water Resources Management of the Data-Scarce Brahmaputra Basin. J. Water Clim. Chang. 2020, 12, 152–165. [Google Scholar] [CrossRef]
- Hussainzada, W.; Lee, H.S. Hydrological Modelling for Water Resource Management in a Semi-Arid Mountainous Region Using the Soil and Water Assessment Tool: A Case Study in Northern Afghanistan. Hydrology 2021, 8, 16. [Google Scholar] [CrossRef]
- Leta, O.; El-Kadi, A.; Dulai, H.; Ghazal, K. Assessment of SWAT Model Performance in Simulating Daily Streamflow under Rainfall Data Scarcity in Pacific Island Watersheds. Water 2018, 10, 1533. [Google Scholar] [CrossRef]
- Senent-Aparicio, J.; Jimeno-Sáez, P.; López-Ballesteros, A.; Giménez, J.G.; Pérez-Sánchez, J.; Cecilia, J.M.; Srinivasan, R. Impacts of Swat Weather Generator Statistics from High-Resolution Datasets on Monthly Streamflow Simulation over Peninsular Spain. J. Hydrol. Reg. Stud. 2021, 35, 100826. [Google Scholar] [CrossRef]
- Singh, A.; Imtiyaz, M.; Isaac, R.K.; Denis, D.M. Assessing the Performance and Uncertainty Analysis of the SWAT and RBNN Models for Simulation of Sediment Yield in the Nagwa Watershed, India. Hydrol. Sci. J. 2014, 59, 351–364. [Google Scholar] [CrossRef]
- Cecílio, R.A.; Campanharo, W.A.; Zanetti, S.S.; Lehr, A.T.; Lopes, A.C. Hydrological Modelling of Tropical Watersheds under Low Data Availability. Res. Soc. Dev. 2020, 9, e100953262. [Google Scholar] [CrossRef]
- Herrera, P.A.; Marazuela, M.A.; Hofmann, T. Parameter Estimation and Uncertainty Analysis in Hydrological Modeling. Wiley Interdiscip. Rev. Water 2022, 9, e1569. [Google Scholar] [CrossRef]
- Islam, K.I. A Model of Indicators and GIS Maps for the Assessment of Water Resources. J. Water Resour. Prot. 2015, 7, 973. [Google Scholar] [CrossRef][Green Version]
- Musie, M.; Sen, S.; Srivastava, P. Comparison and Evaluation of Gridded Precipitation Datasets for Streamflow Simulation in Data Scarce Watersheds of Ethiopia. J. Hydrol. 2019, 579, 124168. [Google Scholar] [CrossRef]
- Mills, W.B.; Porcella, D.B.; Ungs, M.J.; Gherini, S.A.; Summers, K.V.; Mok, L.; Rupp, G.L.; Haith, D.A. Water Quality Assessment 1985; United States Environmental Protection Agency: Washington, DC, USA, 1985.
- Krysanova, V.; Hattermann, F.F.; Kundzewicz, Z.W. How Evaluation of Hydrological Models Influences Results of Climate Impact Assessment—An Editorial. Clim. Chang. 2020, 163, 1121–1141. [Google Scholar] [CrossRef]
- Devia, G.K.; Ganasri, B.P.; Dwarakish, G.S. A Review on Hydrological Models. Aquat. Procedia 2015, 4, 1001–1007. [Google Scholar] [CrossRef]
- Segura-Beltrán, F.; Sanchis-Ibor, C.; Morales-Hernández, M.; González-Sanchis, M.; Bussi, G.; Ortiz, E. Using Post-Flood Surveys and Geomorphologic Mapping to Evaluate Hydrological and Hydraulic Models: The Flash Flood of the Girona River (Spain) in 2007. J. Hydrol. 2016, 541, 310–329. [Google Scholar] [CrossRef]
- Kastridis, A.; Theodosiou, G.; Fotiadis, G. Investigation of Flood Management and Mitigation Measures in Ungauged NATURA Protected Watersheds. Hydrology 2021, 8, 170. [Google Scholar] [CrossRef]
- Te Linde, A.H.; Aerts, J.; Dolman, H.; Hurkmans, R. Comparing Model Performance of the HBV and VIC Models in the Rhine Basin. In Proceedings of the International Symposium: Quantification and Reduction of Predictive Uncertainty for Sustainable Water Resources Management-24th General Assembly of the International Union of Geodesy and Geophysics (IUGG), Perugia, Italy, 2–13 July 2007; IAHS-AISH Publication: Perugia, Italy, 2007; pp. 278–285. [Google Scholar]
- Fleming, S.W.; Vesselinov, V.V.; Goodbody, A.G. Augmenting Geophysical Interpretation of Data-Driven Operational Water Supply Forecast Modeling for a Western US River Using a Hybrid Machine Learning Approach. J. Hydrol. 2021, 597, 126327. [Google Scholar] [CrossRef]
- Hossain, S.; Hewa, G.A.; Wella-Hewage, S. A Comparison of Continuous and Event-Based Rainfall–Runoff (RR) Modelling Using EPA-SWMM. Water 2019, 11, 611. [Google Scholar] [CrossRef]
- Horton, P.; Schaefli, B.; Kauzlaric, M. Why Do We Have So Many Different Hydrological Models? A Review Based on the Case of Switzerland. Wiley Interdiscip. Rev. Water 2022, 9, e1574. [Google Scholar] [CrossRef]
- Uwamahoro, S.; Liu, T.; Nzabarinda, V.; Habumugisha, J.M.; Habumugisha, T.; Harerimana, B.; Bao, A. Modifications to Snow-Melting and Flooding Processes in the Hydrological Model—A Case Study in Issyk-Kul, Kyrgyzstan. Atmosphere 2021, 12, 1580. [Google Scholar] [CrossRef]
- Jimeno-Sáez, P.; Senent-Aparicio, J.; Pérez-Sánchez, J.; Pulido-Velazquez, D. A Comparison of SWAT and ANN Models for Daily Runoff Simulation in Different Climatic Zones of Peninsular Spain. Water 2018, 10, 192. [Google Scholar] [CrossRef]
- Hauswirth, S.M.; Bierkens, M.F.P.; Beijk, V.; Wanders, N. The Potential of Data Driven Approaches for Quantifying Hydrological Extremes. Adv. Water Resour. 2021, 155, 104017. [Google Scholar] [CrossRef]
- Jougla, R.; Leconte, R. Short-Term Hydrological Forecast Using Artificial Neural Network Models with Different Combinations and Spatial Representations of Hydrometeorological Inputs. Water 2022, 14, 552. [Google Scholar] [CrossRef]
- Kumar, S.; Zwiers, F.; Dirmeyer, P.A.; Lawrence, D.M.; Shrestha, R.; Werner, A.T. Terrestrial Contribution to the Heterogeneity in Hydrological Changes under Global Warming. Water Resour. Res. 2016, 52, 3127–3142. [Google Scholar] [CrossRef]
- Wang, J.; Wang, K.; Qin, T.; Lv, Z.; Li, X.; Nie, H.; Liu, F.; He, S. Influence of Subsoiling on the Effective Precipitation of Farmland Based on a Distributed Hydrological Model. Water 2020, 12, 1912. [Google Scholar] [CrossRef]
- Clark, M.P.; Nijssen, B.; Lundquist, J.D.; Kavetski, D.; Rupp, D.E.; Woods, R.A.; Freer, J.E.; Gutmann, E.D.; Wood, A.W.; Brekke, L.D. A Unified Approach for Process-Based Hydrologic Modeling: 1. Modeling Concept. Water Resour. Res. 2015, 51, 2498–2514. [Google Scholar] [CrossRef]
- Kim, C.; Kim, C.-S. Comparison of the Performance of a Hydrologic Model and a Deep Learning Technique for Rainfall—Runoff Analysis. Trop. Cyclone Res. Rev. 2021, 10, 215–222. [Google Scholar] [CrossRef]
- Elias, E.; James, D.; Heimel, S.; Steele, C.; Steltzer, H.; Dott, C. Implications of Observed Changes in High Mountain Snow Water Storage, Snowmelt Timing and Melt Window. J. Hydrol. Reg. Stud. 2021, 35, 100799. [Google Scholar] [CrossRef]
- Elias, E.H.; Rango, A.; Steele, C.M.; Mejia, J.F.; Smith, R. Assessing Climate Change Impacts on Water Availability of Snowmelt-Dominated Basins of the Upper Rio Grande Basin. J. Hydrol. Reg. Stud. 2015, 3, 525–546. [Google Scholar] [CrossRef]
- Finch, D.M. Rio Grande Ecosystems: Linking Land, Water, and People: Toward a Sustainable Future for the Middle Rio Grande Basin: June 2–5, 1998, Albuquerque, New Mexico; Rocky Mountain Research Station: Fort Collins, CO, USA, 1999. [Google Scholar]
- Stockton, G.; Roark, D.M. Upper Rio Grande Water Operations Model: A Tool for Enhanced System Management. In Rio Grande Ecosystems: Linking Land, Water, and People: Toward a Sustainable Future for the Middle Rio Grande Basin. 1998 June 2–5; Albuquerque, NM; Finch Deborah, M., Whitney Jeffrey, C., Kelly Jeffrey, F., Loftin Samuel, R., Eds.; Proc. RMRS-P-7; U.S. Department of Agriculture, Forest Service: Ogden, UT, USA; Rocky Mountain Research Station: Fort Collins, CO, USA, 1999; Volume 7, pp. 61–67. [Google Scholar]
- Arnold, J.G.; Moriasi, D.N.; Gassman, P.W.; Abbaspour, K.C.; White, M.J.; Srinivasan, R.; Santhi, C.; Harmel, R.D.; Van Griensven, A.; Van Liew, M.W. SWAT: Model Use, Calibration, and Validation. Trans. ASABE 2012, 55, 1491–1508. [Google Scholar] [CrossRef]
- Yuan, Y.; Nie, W.; Sanders, E. Problems and Prospects of SWAT Model Application on an Arid/Semi-Arid Watershed in Arizona. In Proceedings of the 2015 SEDHYD Conference, Reno, NV, USA, 22 April 2015; pp. 19–23. [Google Scholar]
- Debele, B.; Srinivasan, R.; Gosain, A.K. Comparison of Process-Based and Temperature-Index Snowmelt Modeling in SWAT. Water Resour. Manag. 2010, 24, 1065–1088. [Google Scholar] [CrossRef]
- Fontaine, T.A.; Cruickshank, T.S.; Arnold, J.G.; Hotchkiss, R.H. Development of a Snowfall–Snowmelt Routine for Mountainous Terrain for the Soil Water Assessment Tool (SWAT). J. Hydrol. 2002, 262, 209–223. [Google Scholar] [CrossRef]
- Zhao, H.; Li, H.; Xuan, Y.; Li, C.; Ni, H. Improvement of the SWAT Model for Snowmelt Runoff Simulation in Seasonal Snowmelt Area Using Remote Sensing Data. Remote Sens. 2022, 14, 5823. [Google Scholar] [CrossRef]
- Chavarria, S.B.; Gutzler, D.S. Observed Changes in Climate and Streamflow in the Upper Rio Grande Basin. J. Am. Water Resour. Assoc. 2018, 54, 644–659. [Google Scholar] [CrossRef]
- Islam, K.I.; Elias, E.; Brown, C.; James, D.; Heimel, S. A Statistical Approach to Using Remote Sensing Data to Discern Streamflow Variable Influence in the Snow Melt Dominated Upper Rio Grande Basin. Remote Sens. 2022, 14, 6076. [Google Scholar] [CrossRef]
- Llewellyn, D.; Vaddey, S. Upper Rio Grande Impact Assessment. 2013. Available online: https://digitalrepository.unm.edu/cgi/viewcontent.cgi?article=1078&context=uc_rio_chama (accessed on 15 January 2021).
- Lehner, F.; Wahl, E.R.; Wood, A.W.; Blatchford, D.B.; Llewellyn, D. Assessing Recent Declines in Upper Rio Grande Runoff Efficiency from a Paleoclimate Perspective. Geophys. Res. Lett. 2017, 44, 4124–4133. [Google Scholar] [CrossRef]
- Lehner, F.; Wood, A.W.; Llewellyn, D.; Blatchford, D.B.; Goodbody, A.G.; Pappenberger, F. Mitigating the Impacts of Climate Nonstationarity on Seasonal Streamflow Predictability in the U.S. Southwest. Geophys. Res. Lett. 2017, 44, 12208–12217. [Google Scholar] [CrossRef]
- Bales, R.C.; Molotch, N.P.; Painter, T.H.; Dettinger, M.D.; Rice, R.; Dozier, J. Mountain Hydrology of the Western United States. Water Resour. Res. 2006, 42. [Google Scholar] [CrossRef]
- Hammouri, N.; Adamowski, J.; Freiwan, M.; Prasher, S. Climate Change Impacts on Surface Water Resources in Arid and Semi-Arid Regions: A Case Study in Northern Jordan. Acta Geod. Geophys. 2017, 52, 141–156. [Google Scholar] [CrossRef]
- Lapp, S.; Byrne, J.; Townshend, I.; Kienzle, S. Climate Warming Impacts on Snowpack Accumulation in an Alpine Watershed. Int. J. Climatol. 2005, 25, 521–536. [Google Scholar] [CrossRef]
- Islam, K.I.; Khan, A.; Islam, T. Correlation between Atmospheric Temperature and Soil Temperature: A Case Study for Dhaka, Bangladesh. Atmos. Clim. Sci. 2015, 5, 200. [Google Scholar] [CrossRef]
- Svetnik, V.; Liaw, A.; Tong, C.; Culberson, J.C.; Sheridan, R.P.; Feuston, B.P. Random Forest: A Classification and Regression Tool for Compound Classification and QSAR Modeling. J. Chem. Inf. Comput. Sci. 2003, 43, 1947–1958. [Google Scholar] [CrossRef] [PubMed]
- Breiman, L. Random Forests. Mach. Learn. 2001, 45, 5–32. [Google Scholar] [CrossRef]
- Gounaridis, D.; Chorianopoulos, I.; Symeonakis, E.; Koukoulas, S. A Random Forest-Cellular Automata Modelling Approach to Explore Future Land Use/Cover Change in Attica (Greece), under Different Socio-Economic Realities and Scales. Sci. Total Environ. 2019, 646, 320–335. [Google Scholar] [CrossRef] [PubMed]
- Liaw, A.; Wiener, M. Classification and Regression by RandomForest. R News 2002, 2, 18–22. [Google Scholar]
- Ma, J.; Cheng, J.C.P. Identifying the Influential Features on the Regional Energy Use Intensity of Residential Buildings Based on Random Forests. Appl. Energy 2016, 183, 193–201. [Google Scholar] [CrossRef]
- Li, M.; Zhang, Y.; Wallace, J.; Campbell, E. Estimating Annual Runoff in Response to Forest Change: A Statistical Method Based on Random Forest. J. Hydrol. 2020, 589, 125168. [Google Scholar] [CrossRef]
- Garen, D.; Perkins, T.; Abramovich, R.; Julander, R.; Kaiser, R.; Lea, J.; McClure, R.; Tama, R. Snow Survey and Water Supply Forecasting. In Water Supply Forecasting; VI-NEH, Amend. 41; Natural Resources Conservation Service, USDA: Washington, DC, USA, 2011; p. 210. [Google Scholar]
- Zhang, Y.; Touzi, R.; Feng, W.; Hong, G.; Lantz, T.C.; Kokelj, S.V. Landscape-Scale Variations in near-Surface Soil Temperature and Active-Layer Thickness: Implications for High-Resolution Permafrost Mapping. Permafr. Periglac. Process. 2021, 32, 627–640. [Google Scholar] [CrossRef]
- Milly, P.C.D.; Dunne, K.A. Colorado River Flow Dwindles as Warming-Driven Loss of Reflective Snow Energizes Evaporation. Science 2020, 367, 1252–1255. [Google Scholar] [CrossRef]
- Sexstone, G.A.; Driscoll, J.M.; Hay, L.E.; Hammond, J.C.; Barnhart, T.B. Runoff Sensitivity to Snow Depletion Curve Representation within a Continental Scale Hydrologic Model. Hydrol. Process. 2020, 34, 2365–2380. [Google Scholar] [CrossRef]
- Cooley, E.; Frame, D.; Wunderlin, A. Soil Moisture and Potential for Runoff. 2010, p. 6. Available online: https://uwdiscoveryfarms.org/UWDiscoveryFarms/media/sitecontent/PublicationFiles/farmpagel/Soil-Moisture-and-Potential-for-Runoff-factsheet.pdf?ext=.pdf (accessed on 7 February 2023).
- Oubeidillah, A.; Tootle, G.; Piechota, T. Incorporating Antecedent Soil Moisture into Streamflow Forecasting. Hydrology 2019, 6, 50. [Google Scholar] [CrossRef]
- Gascoin, S.; Grizonnet, M.; Bouchet, M.; Salgues, G.; Hagolle, O. Theia Snow Collection: High-Resolution Operational Snow Cover Maps from Sentinel-2 and Landsat-8 Data. Earth Syst. Sci. Data 2019, 11, 493–514. [Google Scholar] [CrossRef]
- Park, S.-E. Variations of Microwave Scattering Properties by Seasonal Freeze/Thaw Transition in the Permafrost Active Layer Observed by ALOS PALSAR Polarimetric Data. Remote Sens. 2015, 7, 17135–17148. [Google Scholar] [CrossRef]
- Muhuri, A.; Manickam, S.; Bhattacharya, A. Snow Cover Mapping Using Polarization Fraction Variation with Temporal RADARSAT-2 C-Band Full-Polarimetric SAR Data over the Indian Himalayas. IEEE J. Sel. Top. Appl. Earth Obs. Remote Sens. 2018, 11, 2192–2209. [Google Scholar] [CrossRef]
- Qiao, D.; Li, Z.; Zhang, P.; Zhou, J.; Liang, S. Prediction of Snow Depth Based on Multi-Source Data and Machine Learning Algorithms. In Proceedings of the 2021 IEEE International Geoscience and Remote Sensing Symposium IGARSS, Brussels, Belgium, 11–16 July 2021; pp. 5578–5581. [Google Scholar]
- Schoppa, L.; Disse, M.; Bachmair, S. Evaluating the Performance of Random Forest for Large-Scale Flood Discharge Simulation. J. Hydrol. 2020, 590, 125531. [Google Scholar] [CrossRef]
- Liu, D.; Fan, Z.; Fu, Q.; Li, M.; Faiz, M.A.; Ali, S.; Li, T.; Zhang, L.; Khan, M.I. Random Forest Regression Evaluation Model of Regional Flood Disaster Resilience Based on the Whale Optimization Algorithm. J. Clean. Prod. 2020, 250, 119468. [Google Scholar] [CrossRef]
- Liu, J.; Xiong, J.; Chen, Y.; Sun, H.; Zhao, X.; Tu, F.; Gu, Y. A New Avenue to Improve the Performance of Integrated Modeling for Flash Flood Susceptibility Assessment: Applying Cluster Algorithms. Ecol. Indic. 2023, 146, 109785. [Google Scholar] [CrossRef]
- Archer, K.J.; Kimes, R.V. Empirical Characterization of Random Forest Variable Importance Measures. Comput. Stat. Data Anal. 2008, 52, 2249–2260. [Google Scholar] [CrossRef]
- Jiang, W.; Pokharel, B.; Lin, L.; Cao, H.; Carroll, K.C.; Zhang, Y.; Galdeano, C.; Musale, D.A.; Ghurye, G.L.; Xu, P. Analysis and Prediction of Produced Water Quantity and Quality in the Permian Basin Using Machine Learning Techniques. Sci. Total Environ. 2021, 801, 149693. [Google Scholar] [CrossRef]
- Virro, H.; Kmoch, A.; Vainu, M.; Uuemaa, E. Random Forest-Based Modeling of Stream Nutrients at National Level in a Data-Scarce Region. Sci. Total Environ. 2022, 840, 156613. [Google Scholar] [CrossRef]
- Cho, E.; Jacobs, J.M.; Jia, X.; Kraatz, S. Identifying Subsurface Drainage Using Satellite Big Data and Machine Learning via Google Earth Engine. Water Resour. Res. 2019, 55, 8028–8045. [Google Scholar] [CrossRef]
- QGIS.Org 2020.QGIS Geogrpahic Information System. QGIS Association. Available online: http://www.qgis.org (accessed on 7 August 2023).
- PRISM Climate Group. Oregon State U. Available online: http://www.prism.oregonstate.edu/historical/ (accessed on 5 June 2020).
- Daly, C.; Bryant, K. The PRISM Climate and Weather System—An Introduction; Northwest Alliance for Computational Science and Engineering, Oregon State University: Corvallis, OR, USA, 2013; Volume 2. [Google Scholar]
- Hooper, R.; Clark, J.; Richter, D.; Harmon, M. Chris Daly (Precipitation). PRISM Climate Group: Corvallis, OR, USA.
- Xia, Y.; Mitchell, K.; Ek, M.; Sheffield, J.; Cosgrove, B.; Wood, E.; Luo, L.; Alonge, C.; Wei, H.; Meng, J. NLDAS NOAH Land Surface Model L4 Hourly 0.125 × 0.125 Degree V002; NASA: Greenbelt, MD, USA, 2012; p. 1025. Available online: https://disc.gsfc.nasa.gov/datasets/NLDAS_NOAH0125_H_2.0/summary (accessed on 2 July 2020).
- Data Access—Smerge Version 2.0. Available online: https://www.tamiu.edu/cees/smerge/data.shtml (accessed on 5 June 2020).
- Goodbody, A. Hydrologist, Natural Resources Conservation Service (NRCS). Personal communication, 24 June 2020.
- Allaire, J. RStudio: Integrated Development Environment for R; RPubs: Boston, MA, USA, 2012; Volume 770, pp. 165–171. [Google Scholar]
- Hijmans, R.J.; van Etten, J.; Sumner, M.; Cheng, J.; Baston, D.; Bevan, A.; Bivand, R.; Busetto, L.; Canty, M.; Fasoli, B.; et al. Raster: Geographic Data Analysis and Modeling. 2023. Available online: https://cran.r-project.org/web/packages/raster/raster.pdf (accessed on 3 February 2023).
- RColor Brewer, S.; Liaw, M.A. Package ‘Randomforest’; University of California, Berkeley: Berkeley, CA, USA, 2018. [Google Scholar]
- Hoerl, A.E.; Kennard, R.W. Ridge Regression: Biased Estimation for Nonorthogonal Problems. Technometrics 1970, 12, 55–67. [Google Scholar] [CrossRef]
- Efron, B. Jackknife-after-Bootstrap Standard Errors and Influence Functions. J. R. Stat. Soc. Ser. B Stat. Methodol. 1992, 54, 83–111. [Google Scholar] [CrossRef]
- Dewi, C.; Chen, R.-C. Random Forest and Support Vector Machine on Features Selection for Regression Analysis 2019. Int. J. Innov. Comput. Inf. Control 2019, 15, 2027–2037. [Google Scholar]
- Abbaspour, K.C. SWATCalibration and Uncertainty Programs. 2015, p. 100. Available online: https://swat.tamu.edu/media/114860/usermanual_swatcup.pdf (accessed on 12 January 2023).
- Baskaran, L.; Jager, H.I.; Schweizer, P.E.; Srinivasan, R. Progress toward Evaluating the Sustainability of Switchgrass as a Bioenergy Crop Using the SWAT Model. Trans. ASABE 2010, 53, 1547–1556. [Google Scholar] [CrossRef]
- Martínez-Salvador, A.; Conesa-García, C. Suitability of the SWAT Model for Simulating Water Discharge and Sediment Load in a Karst Watershed of the Semiarid Mediterranean Basin. Water Resour. Manag. 2020, 34, 785–802. [Google Scholar] [CrossRef]
- Moges, E.; Demissie, Y.; Larsen, L.; Yassin, F. Review: Sources of Hydrological Model Uncertainties and Advances in Their Analysis. Water 2020, 13, 28. [Google Scholar] [CrossRef]
- Tran, Q.Q.; Niel, J.D.; Willems, P. Spatially Distributed Conceptual Hydrological Model Building: A Generic Top-Down Approach Starting from Lumped Models. Water Resour. Res. 2018, 54, 8064–8085. [Google Scholar] [CrossRef]
- Neitsch, S.L.; Arnold, J.G.; Kiniry, J.R.; Williams, J.R. Soil and Water Assessment Tool Theoretical Documentation Version 2009; Texas Water Resources Institute: College Station, TX, USA, 2011. [Google Scholar]
- Arnold, J.G.; Kiniry, J.R.; Srinivasan, R.; Williams, J.R.; Haney, E.B.; Neitsch, S.L. Soil and Water Assessment Tool Input/Output File Documentation Version 2009; Texas Water Resources Institute: College Station, TX, USA, 2011. [Google Scholar]
- de Almeida Bressiani, D.; Srinivasan, R.; Jones, C.A.; Mendiondo, E.M. Effects of Spatial and Temporal Weather Data Resolutions on Streamflow Modeling of a Semi-Arid Basin, Northeast Brazil. Int. J. Agric. Biol. Eng. 2015, 8, 125–139. [Google Scholar]
- Acharya, A. Modeled hydrologic response under climate change impacts over the bankhead national forest in northern alabama. Eur. Sci. J. 2015, 15, 140–154. [Google Scholar]
- Fuka, D.R.; Walter, M.T.; MacAlister, C.; Degaetano, A.T.; Steenhuis, T.S.; Easton, Z.M. Using the Climate Forecast System Reanalysis as Weather Input Data for Watershed Models. Hydrol. Process. 2014, 28, 5613–5623. [Google Scholar] [CrossRef]
- Auerbach, D.A.; Easton, Z.M.; Walter, M.T.; Flecker, A.S.; Fuka, D.R. Evaluating Weather Observations and the Climate Forecast System Reanalysis as Inputs for Hydrologic Modelling in the Tropics. Hydrol. Process. 2016, 30, 3466–3477. [Google Scholar] [CrossRef]
- Salami, A.W.; Bilewu, S.O.; Ibitoye, B.A.; Ayanshola, M.A. Runoff Hydrographs Using Snyder and SCS Synthetic Unit Hydrograph Methods: A Case Study of Selected Rivers in South West Nigeria. J. Ecol. Eng. 2017, 18, 25–34. [Google Scholar] [CrossRef]
- Sapountzis, M.; Kastridis, A.; Kazamias, A.P.; Karagiannidis, A.; Nikopoulos, P.; Lagouvardos, K. Utilization and Uncertainties of Satellite Precipitation Data in Flash Flood Hydrological Analysis in Ungauged Watersheds. Glob. Nest J. 2021, 23, 388–399. [Google Scholar]
- Mockus, V. National Engineering Handbook; US Soil Conservation Service: Washington, DC, USA, 1964; Volume 4.
- Askar, M.K. Rainfall-Runoff Model Using the SCS-CN Method and Geographic Information Systems: A Case Study of Gomal River Watershed. WIT Trans. Ecol. Environ. 2013, 178, 159–170. [Google Scholar]
- Willmott, C.J.; Robeson, S.M.; Matsuura, K. A Refined Index of Model Performance. Int. J. Climatol. 2012, 32, 2088–2094. [Google Scholar] [CrossRef]
- Sao, D.; Kato, T.; Tu, L.H.; Thouk, P.; Fitriyah, A.; Oeurng, C. Evaluation of Different Objective Functions Used in the SUFI-2 Calibration Process of SWAT-CUP on Water Balance Analysis: A Case Study of the Pursat River Basin, Cambodia. Water 2020, 12, 2901. [Google Scholar] [CrossRef]
- Singh, V.P. Hydrologic Modeling: Progress and Future Directions. Geosci. Lett. 2018, 5, 15. [Google Scholar] [CrossRef]
- Nash, J.E.; Sutcliffe, J.V. River Flow Forecasting through Conceptual Models Part I—A Discussion of Principles. J. Hydrol. 1970, 10, 282–290. [Google Scholar] [CrossRef]
- Stephanie Latin Hypercube Sampling: Simple Definition. Available online: https://www.statisticshowto.com/latin-hypercube-sampling/ (accessed on 14 April 2021).
- Abbaspour, K.C.; Vaghefi, S.A.; Srinivasan, R. A Guideline for Successful Calibration and Uncertainty Analysis for Soil and Water Assessment: A Review of Papers from the 2016 International SWAT Conference. Water 2017, 10, 6. [Google Scholar] [CrossRef]
- Goldstein, H.L.; Reynolds, R.L.; Landry, C.; Derry, J.E.; Kokaly, R.F.; Breit, G.N. The Effects of Dust on Colorado Mountain Snow Cover Albedo and Compositional Links to Dust-Source Areas. In AGU Fall Meeting Abstracts; American Geophysical Union: Washington, DC, USA, 2016; Volume 21. [Google Scholar]
- Landry, C.; Buck, K. Dust-on-Snow Effects on Colorado Hydrographs. 2014, p. 6. Available online: https://westernsnowconference.org/sites/westernsnowconference.org/PDFs/2014Landry.pdf (accessed on 12 August 2019).
- Painter, T.H.; Skiles, S.M.; Deems, J.S.; Bryant, A.C.; Landry, C.C. Dust Radiative Forcing in Snow of the Upper Colorado River Basin: 1. A 6 Year Record of Energy Balance, Radiation, and Dust Concentrations. Water Resour. Res. 2012, 48, 7521. [Google Scholar] [CrossRef]
Disclaimer/Publisher’s Note: The statements, opinions and data contained in all publications are solely those of the individual author(s) and contributor(s) and not of MDPI and/or the editor(s). MDPI and/or the editor(s) disclaim responsibility for any injury to people or property resulting from any ideas, methods, instructions or products referred to in the content. |
© 2023 by the authors. Licensee MDPI, Basel, Switzerland. This article is an open access article distributed under the terms and conditions of the Creative Commons Attribution (CC BY) license (https://creativecommons.org/licenses/by/4.0/).