Article

Spatial Distributions of Cloud Occurrences in Terms of Volume Fraction as Inferred from CloudSat and CALIPSO

School of Earth and Space Sciences, University of Science and Technology of China, Hefei 230026, China
*
Author to whom correspondence should be addressed.
Remote Sens. 2023, 15(16), 3978; https://doi.org/10.3390/rs15163978
Submission received: 30 June 2023 / Revised: 7 August 2023 / Accepted: 9 August 2023 / Published: 10 August 2023
(This article belongs to the Section Atmospheric Remote Sensing)

Abstract

:
The cloud amount, referred to as the frequency of cloud occurrences, is of great importance for the Earth–atmosphere system. It was conventionally quantified as the area fraction of clouds in a given region, discarding the three-dimensional nature of both cloud entities and their spatial distribution. Although the area fraction is explicit, it is the volume fraction that fully depicts cloud occurrences, and the area fraction is just related to a projection of the volume fraction. In this study, by using spaceborne radar measurements, the spatial distribution of cloud volume fraction throughout the troposphere was investigated, and the contributions of various cloud types at each location were clarified. Overall, the volume fraction of total clouds in the whole troposphere is 15.9%, while the corresponding area fraction relative to the global surface is 73.6%. The peak volume fraction occurs at 1 km altitude, mainly contributed by stratocumulus and cumulus. For a single cloud type, the maximum fraction is 48.8%, which is from stratocumulus and occurs at 1 km altitude above the Greenland Sea. Half of the eight cloud types, altostratus, cirrus, nimbostratus, and deep convective clouds, reach the nominal tropopause. In particular, the vertical distribution difference among multiple cloud types in each category (low-level, middle-level, and vertically extending) was clarified, and it was found that the dominant cloud type in a category varies notably with the location in the atmosphere.

1. Introduction

Clouds, the aggregate of massive water droplets and/or ice particles, greatly impact the energy budget of the Earth–atmosphere system via reflecting and absorbing shortwave radiations and via emitting and absorbing longwave radiations. The so-called radiative effects, imposing feedback on atmospheric motions at the cloud scale, synoptic scale, and even climatological scale, are determined on the microscale by cloud microphysical properties that are essentially related to the cloud droplet/particle size spectrum [1,2,3,4]. On the macroscale, it is the spatial distribution of clouds that plays a key role in regulating the radiative transfer processes within the atmospheric medium [5,6,7,8]. The spatial distribution of clouds, as a general notion, denotes the geographical pattern of cloud occurrences, which are termed as the cloud amount and were traditionally interpreted as the horizontal coverage of clouds, i.e., cloud cover or cloud fraction. Such a macrophysical property of clouds is among the elementary parameters that are routinely recorded in both ground-based weather observations and meteorological satellite remote sensing. In ground-based weather observations, the cloud cover at the moment is defined as the percentage of local sky that is perceived to be covered by one or multiple cloud entities [9,10,11], while in satellite-based observations, it is derived as the percentage of cloudy pixels to total pixels in a certain domain, indicating the area fraction of clouds [12,13,14].
Due to the notable distinctions in microphysical properties such as thermodynamic phase and size of hydrometeors inside clouds, as well as in macroscopic features such as cloud morphology and volume, clouds were usually categorized into several groups. The classification of clouds has been conducted for a long time in traditional weather observations [15,16,17]. The two main features that are readily perceived and used as common criteria to classify clouds are cloud morphology and altitude. The former helps to distinguish between three cloud regimes, stratiform, cumuliform, and cirriform clouds, while the latter is useful for distinguishing between low-level, middle-level, and high-level clouds. The official cloud classification scheme proposed by WMO contains 10 cloud types [18], i.e., cumulus (Cu), stratus (St), stratocumulus (Sc), nimbostratus (Ns), altocumulus (Ac), altostratus (As), cirrus (Ci), cirrocumulus (Cc), cirrostratus (Cs), and cumulonimbus (Cb).
Hence a complete record of cloud occurrences in practice contains the specific cloud cover of each genus, in addition to the total cloud cover that accumulates the occurrences of all these genera. By using routine cloud observations from ground weather stations and occasionally from vessels that collect data over oceanic regions, the characteristics of cloud cover on a regional or even global scale have been extensively investigated. It has now been convinced that as a climatological average, about 60% of the Earth’s surface is covered by massive clouds, and there is an evident contrast in the cloud amount between over ocean (68%) and over land (54%) [9,11]. Additionally, long-term trends and diurnal variations in cloud cover for individual cloud types were also examined by using appropriate observations [10].
In ground-based cloud observations, various instruments, such as sky imagers, infrared radiometers, and millimeter-wave radar, were employed to objectively detect clouds and then help to quantify the cloud occurrences or the cloud cover as an equivalent [19]. Nevertheless, the representative domains of these measurements are rather small, and accordingly, the cloud cover data are just available to very limited areas around the world. Global-scale cloud observations became feasible since meteorological satellites arose in the 1960s. With such a top-down perspective, the statistics of cloud occurrences on a global scale could be derived readily, resulting in cloud climatology knowledge expanding from specific regions to the whole world [20]. Based on the common infrared and visible upward radiances that are collected by spaceborne radiometers, cloud top pressure and cloud optical thickness can be retrieved. These two parameters were used as the basis for the cloud classification scheme of the International Satellite Cloud Climate Program (ISCCP), which distinguished nine cloud categories by using simple thresholds [21,22,23,24,25,26,27,28,29]. In particular, Ding et al. [30] obtained the global distribution characteristics of high-level, middle-level, and low-level clouds by using the ISCCP D2 cloud climate data set and analyzed the changing trends of different cloud types in the past 20 years by using the trend analysis method. Liu et al. [31] compared the geographical pattern between the high-level, middle-level, and low-level cloud cover from ISCCP with the wind field and water vapor flux from the reanalysis of the National Centers for Environmental Prediction to explore the correlation between cloud occurrences and large-scale circulation.
Nevertheless, due to the very limited information from the pixel-level cloud top pressure and cloud optical thickness, the cloud genera derived from such a cloud classification cannot concert perfectly with those of the ground observations, though they have nearly the same nomenclature. In principle, an ideal scheme of cloud classification is expected to take the cloud entity as an integral. It is the cloud entity that was classified as a single cloud type rather than its components somewhere, and thus pixel-level property-based cloud classification has an inherent deficiency. In addition, even in the pixel-level atmospheric column, the vertical structure of a cloudy situation cannot be resolved by these passive radiometers. For instance, given a single-layer cloudy situation, only the cloud top height is retrievable, whereas the location of the cloud base is unknowable. Given a multi-layer cloud field, in most cases, it is only the cloud top height of the topmost cloud layer that is retrievable. Note that the cloud thickness and the multi-layer cloudy situation are implicitly excluded from the 2-D expression of cloud occurrences. Therefore, although cloud cover is a useful index to describe cloud occurrences, it is not a perfect one. Since a cloud entity is not a slab, it has a unique volume and occupies such a definite volume in the atmosphere. In contrast, the horizontal area of a cloud entity, as a projection along vertical orientation, is not always unique and suffers from many factors. Compared with cloud horizontal area fraction, cloud volume fraction, as a three-dimensional expression, is the essential parameter that exactly quantifies the cloud occurrences.
The aforementioned advantages of volume-based cloud amounts cannot be derived from satellite remote sensing unless vertical-resolving capability is available, which has been achieved by spaceborne millimeter radar, such as the cloud profiling radar (CPR) aboard CloudSat. The along-track consecutive measurements of CPR actually provide a vertical section, which facilitates locating each cloud entity. Both microscopic and macroscopic properties were used in the fuzzy logic algorithm to classify each cloud entity into a definite cloud type. By comparing cloud-type products from CloudSat-CALIPSO and ISCCP, Mace et al. [32] revealed discrepancies between these two datasets. Many cloud types classified by ISCCP are actually a combination of a major CloudSat-CALIPSO cloud type and some other types. With such a new dataset of cloud types, the geometric features of any cloud type could be characterized in a more comprehensive way. For instance, Ac was found, for the first time, to have a horizontal size of 40.2 ± 52.3 km on the global scale, and its mixed-phase part has a vertical depth of 1.96 ± 1.10 km [12].
Moreover, many facts about multi-layer clouds have been revealed [13,14,33,34,35]. Ding et al. [36] found that multi-layer clouds account for about 30% of the total cloud cover over the global ocean, with double-layer clouds dominating the multi-layer cloudy situation. Li et al. [37] further analyzed double-layer clouds and found that the globally averaged cloud cover varies between 25% and 28% in different seasons. Multi-layer clouds arise most frequently in equatorial central South America, western Africa, Indonesia, and the west-central Pacific Ocean warm pool. By using CPR measurements, Huang et al. [38] examined the vertical distribution of cloud fraction for individual types and found that the vertical patterns are different among cloud types. In addition, it was found that the peak altitude of cloud fraction does not always overlap with that of cloud water content, suggesting the weak correlation between cloud occurrences and its inner microphysical properties. Actually, the vertical pattern of cloud occurrences has been investigated heavily through spaceborne radar data [39,40,41,42,43,44,45,46,47], but all these studies focused on a regional scale or took the globe as a whole. In our opinion, the fine-scale analysis of the spatial pattern of cloud occurrences throughout the troposphere is so far absent. This necessarily requires the inspection of the cloud volume fraction on each rather small cube, which could be readily derived from cloud classification data. Hence in this study, by using such an advanced cloud dataset, the newly defined cloud amount, as the cloud occurrences in terms of cloud volume fraction, is targeted in particular. For both total clouds and individual cloud types, their spatial distribution on a global scale was examined.

2. Data and Methodology

The 2B-CLDCLASS-LIDAR product issued by the CloudSat mission team was used as the primary dataset in this study, which is based on the joint measurements from CloudSat/CPR and CALIPSO/CALIOP (Cloud-Aerosol Lidar with Orthogonal Polarization) [48]. This dataset includes the vertical profile that represents a column of the atmosphere. Each profile contains one or more cloud layers with respective bases and tops. Every cloud layer is assigned a single cloud type (Sc, St, Cu, As, Ac, Ci, Ns, or Dc). Some parameters in the 2B-GEOPROF product were also used to provide auxiliary information. The time range of the satellite data used in this study is from 2007 to 2010, during which the measurements were kept stable, and the resulting products were of high quality.

2.1. CloudSat and CALIPSO

The A-train constellation (Aqua, CloudSat, CALIPSO, etc.) operates in a solar-synchronous orbit, collecting observations at a fixed local time (1:30 a.m. and 1:30 p.m.), with a time lag between CloudSat and CALIPSO around 15 s. This enables nearly simultaneous observations from the two active sensors in the A-train system, i.e., the CPR aboard CloudSat and CALIOP aboard CALIPSO. CloudSat and CALIPSO, launched together in April 2006, were highly complementary. They have been designed to jointly obtain measurements of global clouds, particularly their vertical structures, which were operationally measured from space for the first time.
The CPR is the first spaceborne millimeter wavelength radar, operating at 3.2 mm wavelength (94 GHz) [48,49,50]. Compared to common weather radars that typically operate at centimeter bands to detect large-size precipitation particles, CPR addresses small-size cloud particles. This detection capability is further enhanced by its high signal sensitivity of about −30 dBZ. Each CPR profile represents an effective horizontal field of view of approximately 1.7 km along-track and 1.4 km cross-track, with a vertical resolution of 240 m. This forms the basic unit in the CPR profile data, which is referred to as the bin for convenience. CALIOP is a two-wavelength (0.532 and 1.06 μm) polarization-sensitive lidar that provides high-resolution vertical profiles of aerosols and clouds. Such a spaceborne lidar is very suitable for profiling the upper and middle clouds [51].
Compared with lidar, millimeter cloud radar has obvious advantages in cloud detection, especially for detecting multi-layer cloud systems. However, its long wavelength limits its ability to detect clouds that have low concentrations of small-size water droplets and/or ice crystals. CALIOP has better vertical resolution than CPR, which is important for detecting geometrically thin layers such as altocumulus clouds. The combination of lidar and radar measurements can provide better cloud detection and characterization due to their unique complementary functions [52]. It is also important to note that CPR is severely affected by ground backscatter, which may affect cloud type classification of clouds within 1 km altitude [53].
The 2B-CLDCLASS-LIDAR cloud classification algorithm is a combination of rule-based and fuzzy logic [54]. First, the cloud mask from radar and lidar are combined to look for a cloud cluster based on spatial continuity in both horizontal and vertical directions. Once a cloud cluster is found, the height, temperature, and maximum radar reflectivity of the cloud can be determined. The average properties of the cluster, as well as the spatial inhomogeneity of the cloud-top height, lidar signal, and radar maximum signal, are then sent to the fuzzy classifier to divide the cluster into cloud types with the specified confidence. The 2B-CLDCLASS-LIDAR combines the advantages of CPR being more sensitive to ice particles in mixed-phase clouds with the advantages of CALIOP being more sensitive to droplets in mixed-phase clouds. The height of the cloud top and cloud base varies continuously, which is not convenient for statistical analysis of vertical structure. A convenient way to solve this problem is to grid in vertical dimensions. When meshing clouds in the vertical dimension, 240 m was used as the vertical thickness of the grid, referring to the vertical resolution of the CPR.

2.2. Cloud Area Fraction and Volume Fraction

Cloud area fraction refers to the proportion of cloud-covered area in the horizontal plane. In previous cloud fraction studies, due to limitations of observation instruments, the vertical information of clouds was not available, and clouds were treated as 2-D planes. Typically, the cloud area fraction is defined as the ratio of the cloud-covered area on a specific horizontal plane to the total area of the region. In the statistical calculation of horizontal grid points, the number of grid points with clouds is divided by the total number of grid points to obtain the cloud area fraction of the horizontal region. Figure 1 shows the spatial distribution of the cloud area fraction calculated using 2B-CLDCLASS-LIDAR profile data. The average total cloud area fraction is 73.6%, among which the three most numerous cloud types are Sc, Ci, and As. The maximum total cloud area fraction is 96.9% over the 60°S ocean surface, and the minimum is 13.7% in the desert region of North Africa. The maximum cloud fraction of Ci in the warm pool region is 75.8%, which is the highest in a single cloud type.
Volume fraction refers to the ratio of volume in both the horizontal and vertical directions. Unlike the cloud area fraction, the cloud volume fraction considers the vertical distribution and thickness of clouds, providing more comprehensive cloud information. When defining the cloud volume fraction, the atmospheric column is typically divided into multiple volume elements (or cubic grid points), and the total volume of the volume elements with clouds is then compared to the total volume of the domain, yielding the cloud volume fraction for that domain. When calculating the cloud volume fraction using profile data, the profiles are first divided into cloud segments (with each cloud segment corresponding to one or more cubic grid points), and the cloud fraction for each cubic grid point is obtained by dividing the number of cloud segments by the corresponding number of profiles. Clouds are limited by the tropopause when they develop vertically, so this study set the study space as a full tropospheric column below the mean tropopause. Based on Kishore [55] and Liu’s [56] research on tropopause and the preliminary understanding of the data set itself, the average tropopause height (HT) of low latitude (30°S–30°N) is set to 18 km, that of high latitude (60°–90°N/S) is set to 9 km, and average tropopause height linear variation over mid-latitudes (30°–60°N/S). Figure 2 shows the spatial distribution of the cloud volume fraction; the cloud volume fraction in the figure is averaged vertically. The average total cloud volume fraction of the atmospheric column is 15.9%. Different from the cloud area fraction, As, Ns, and Ci are the three most numerous cloud types. The maximum total cloud volume fraction of the atmospheric column occurs over the 60°S ocean surface (38.2%), and the minimum, like the total cloud area fraction, occurs over the desert region of North Africa (1.1%). The maximum Ns cloud fraction over the 60°S ocean surface is 18.7%, the highest in a single cloud type.

3. Results

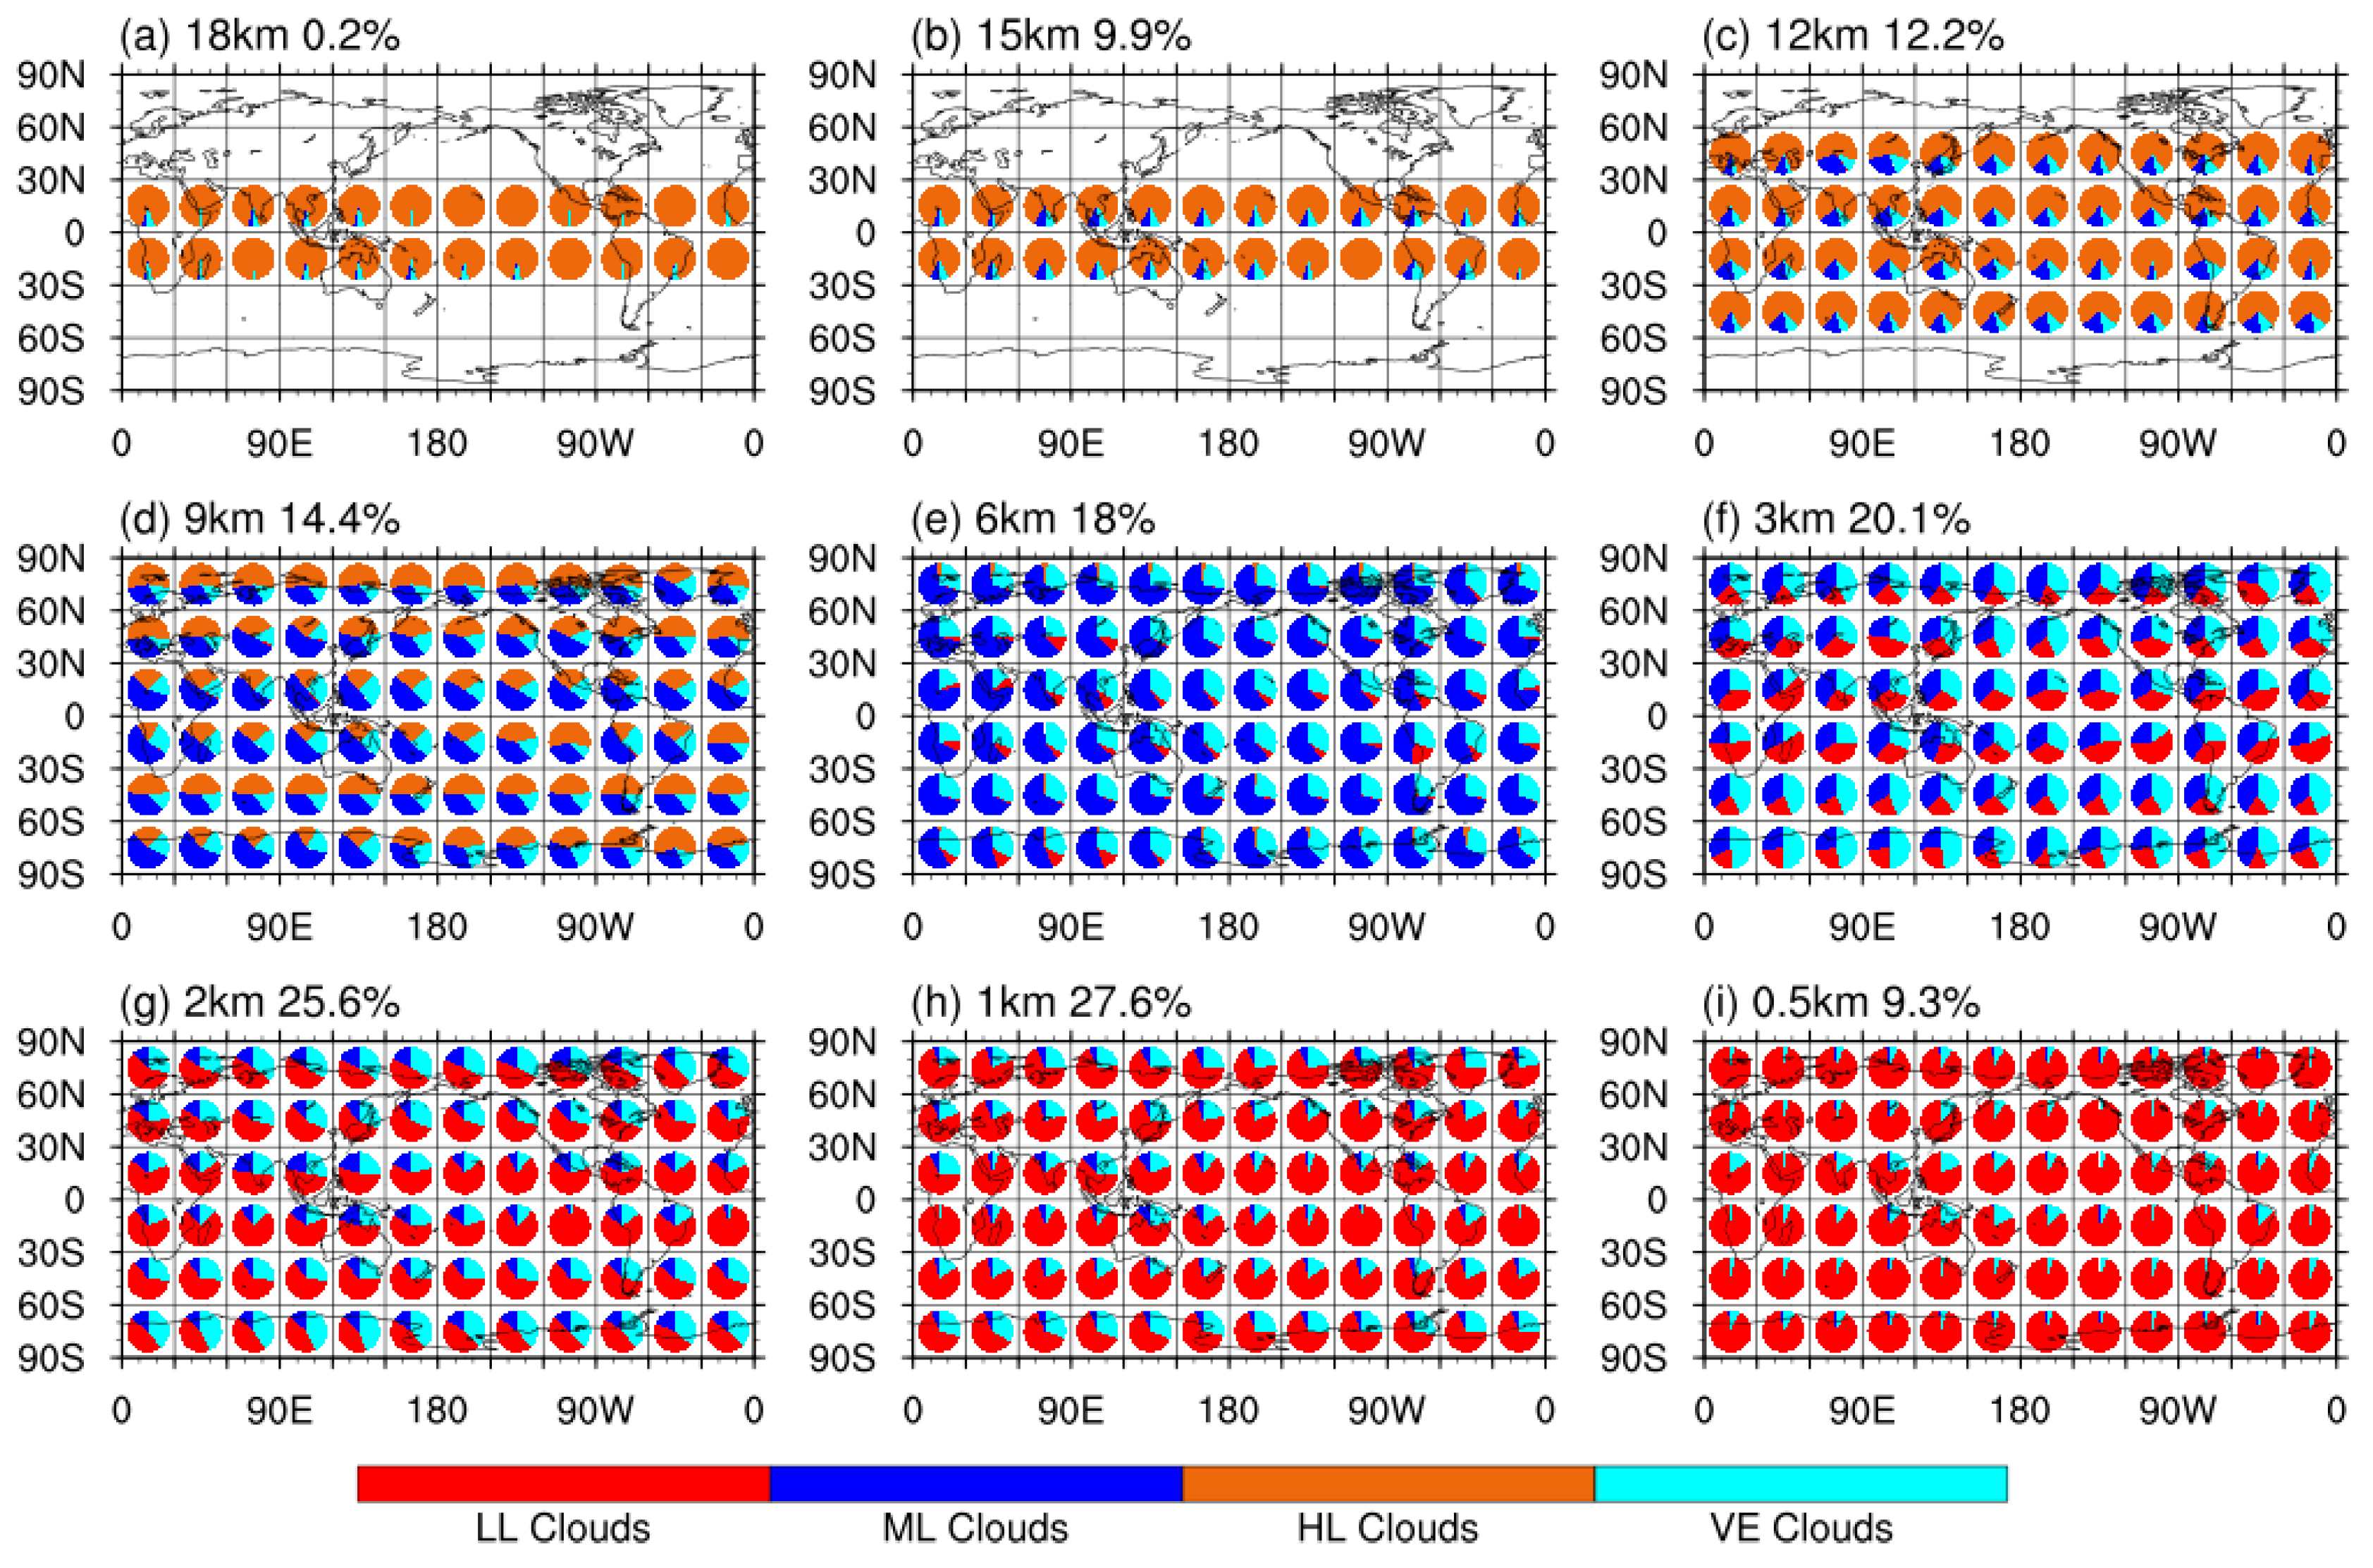
All eight cloud types, St, Sc, Cu, As, Ac, Ci, Ns, and Dc, were considered in this study. They were grouped into four cloud groups: low-level clouds (St, Sc, Cu), middle-level clouds (As, Ac), high-level clouds (Ci), and vertically extending clouds (Ns, Dc), to facilitate comparisons among cloud types that occur in the same vertical layer. The four cloud groups are abbreviated as LL clouds, ML clouds, HL clouds, and VE clouds in the subsequent figures.

3.1. Spatial Distribution of Cloud Volume Fraction

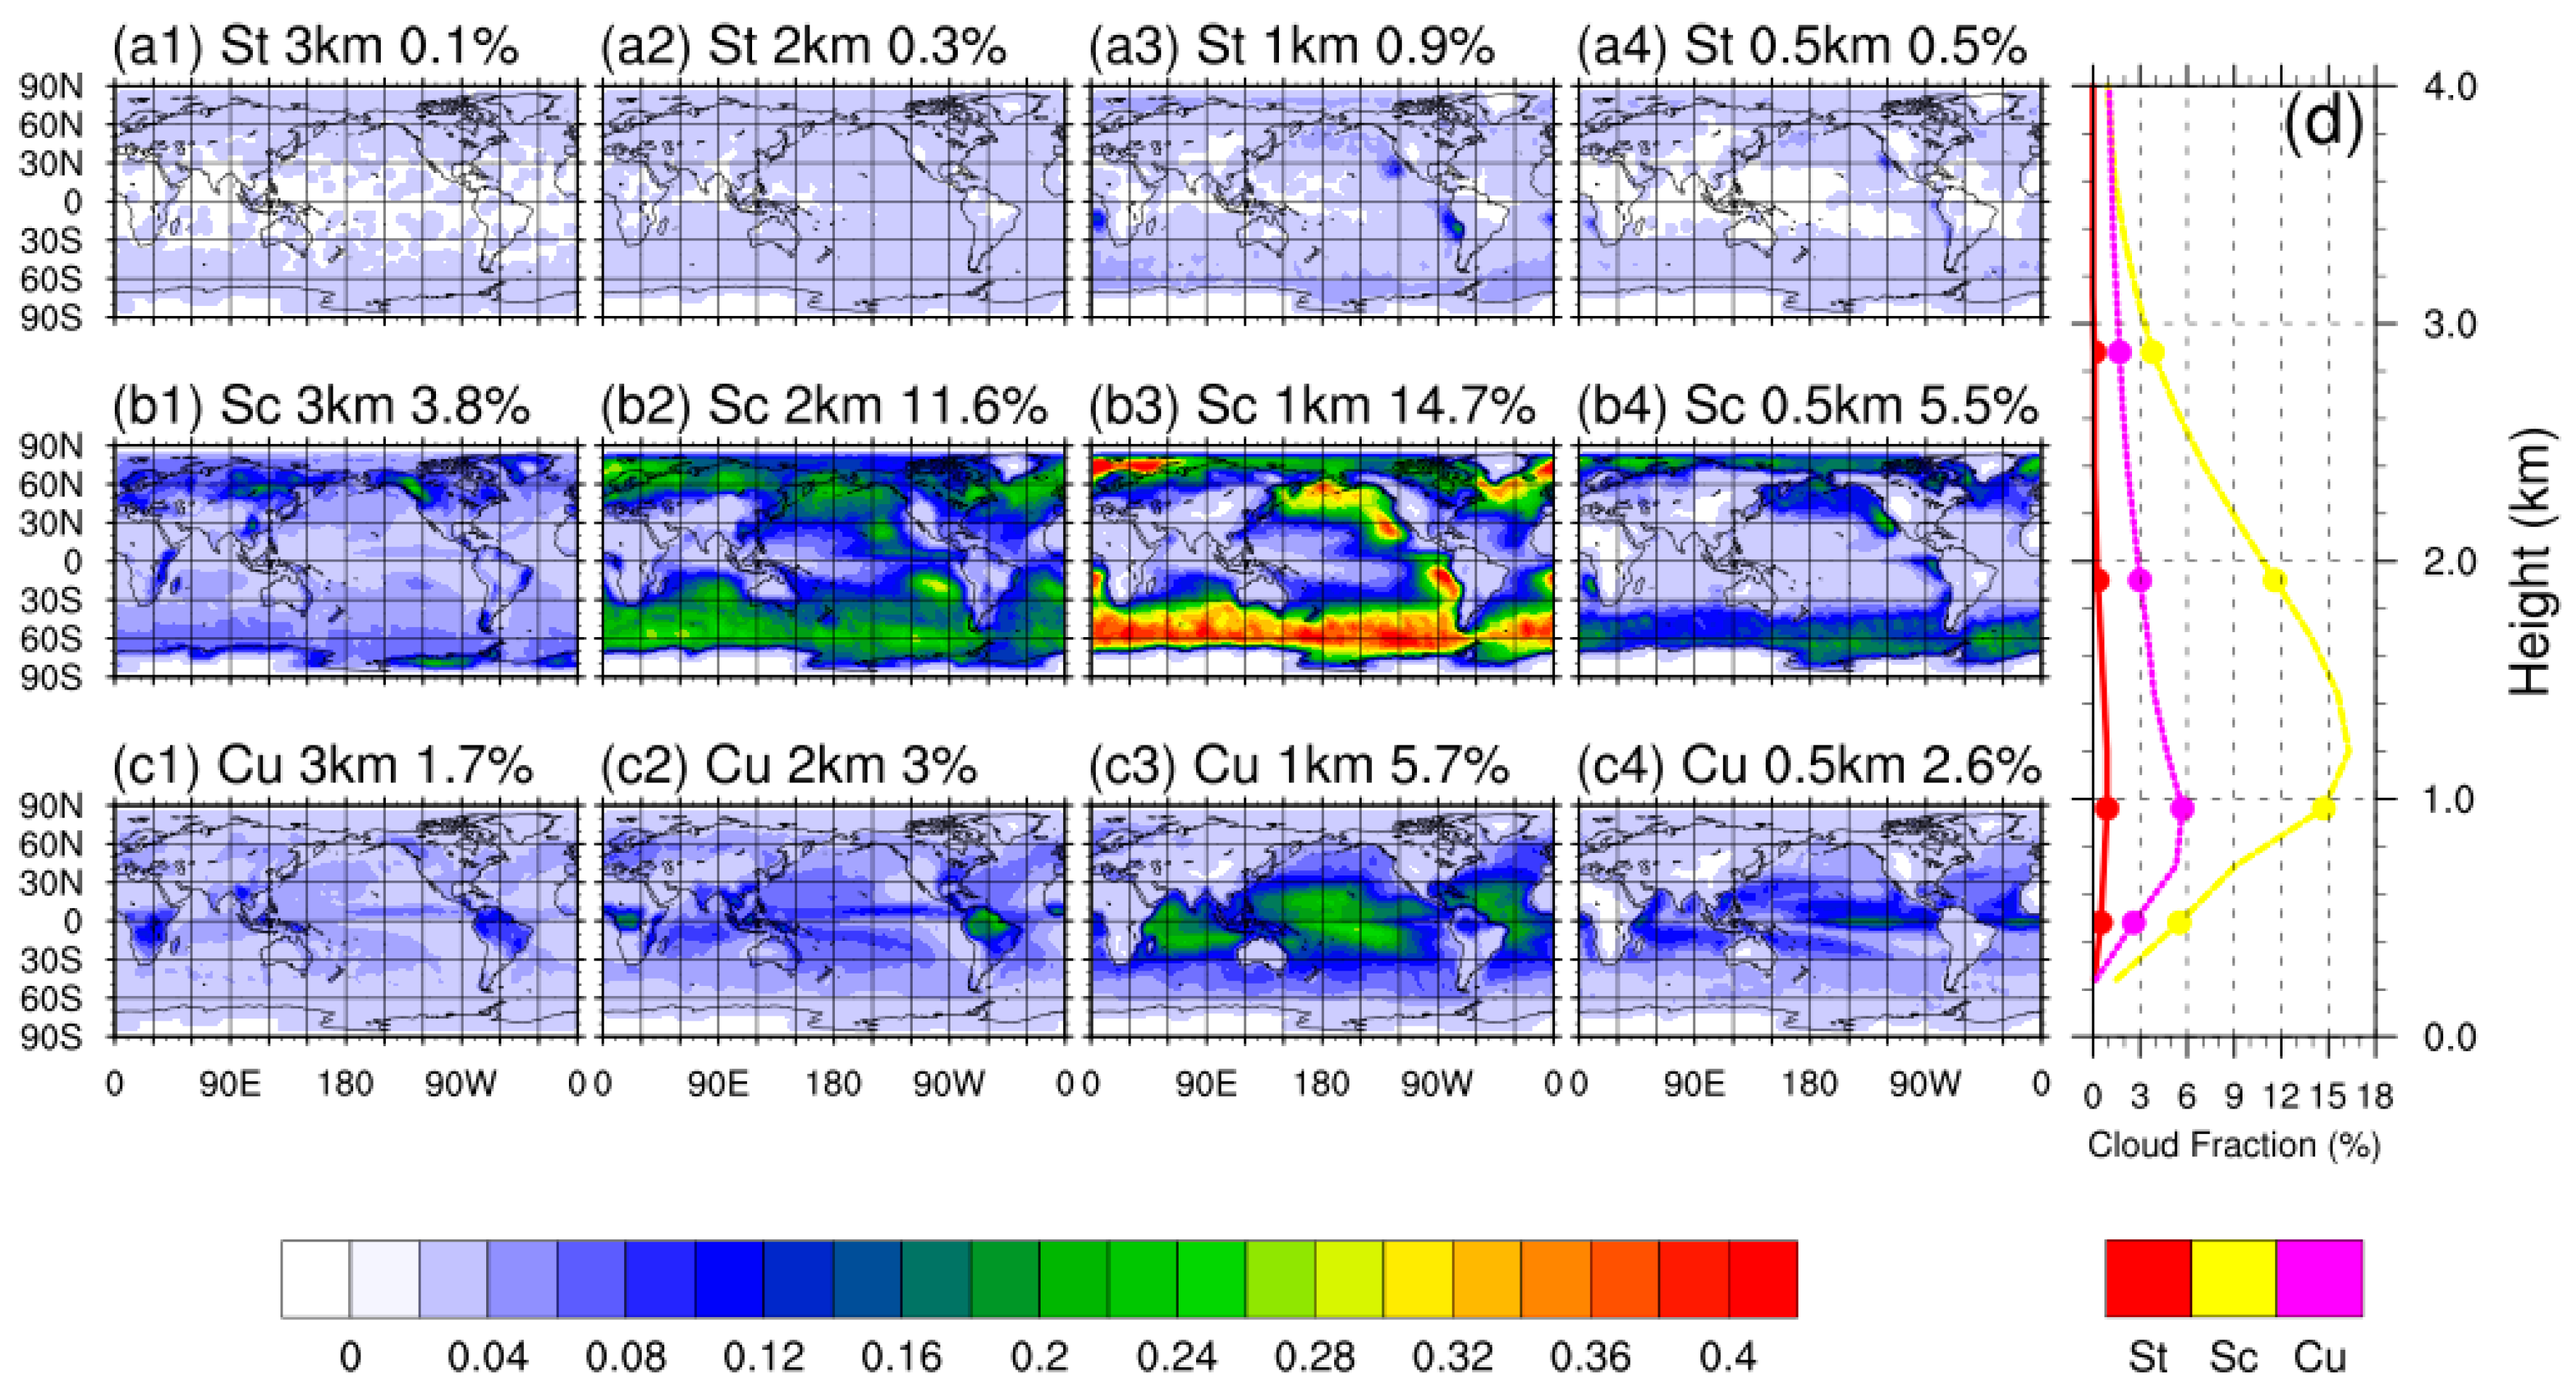
Figure 3 presents the horizontal distribution of cloud volume fraction at selected levels and the profile of the global average for St, Sc, and Cu. The low-level clouds exhibit noticeable differences in cloud fraction (Sc > Cu > St), but they share remarkably similar vertical distribution patterns, primarily concentrated below 3 km, and the maximum average cloud fraction for all three types occurs around 1 km. Sc reaches a maximum average cloud fraction at around 1.2 km, while St and Cu have slightly lower values at 0.96 km. The horizontal distribution of low-level clouds exhibits distinct differences. St shows a prominent aggregation domain, primarily distributed near the western coasts of South America, North America, and Africa. The maximum cloud fraction within the aggregation area can reach 19.8%. In addition to the overlapping aggregation area with St, Sc is widely distributed in the oceanic domains of middle and high latitudes. The maximum cloud fraction for Sc is 48.8%, approximately 1 km above the Greenland Sea, which is the highest value among the eight cloud types. Cu is mainly distributed in low-latitude domains, with variations in the height of Cu generated over different underlying surfaces. Terrestrial Cu is mainly found above 1 km, while oceanic Cu is primarily distributed around 1 km. Oceanic Cu exhibits significantly higher cloud fractions compared to terrestrial Cu. Cu still maintains a certain amount of cloud fraction within the height interval of 3–6 km. This may be a cloud developing upward from a Cu to a cumulonimbus, identified as Cu by the CPR-CALIOP fuzzy logic cloud classification algorithm.
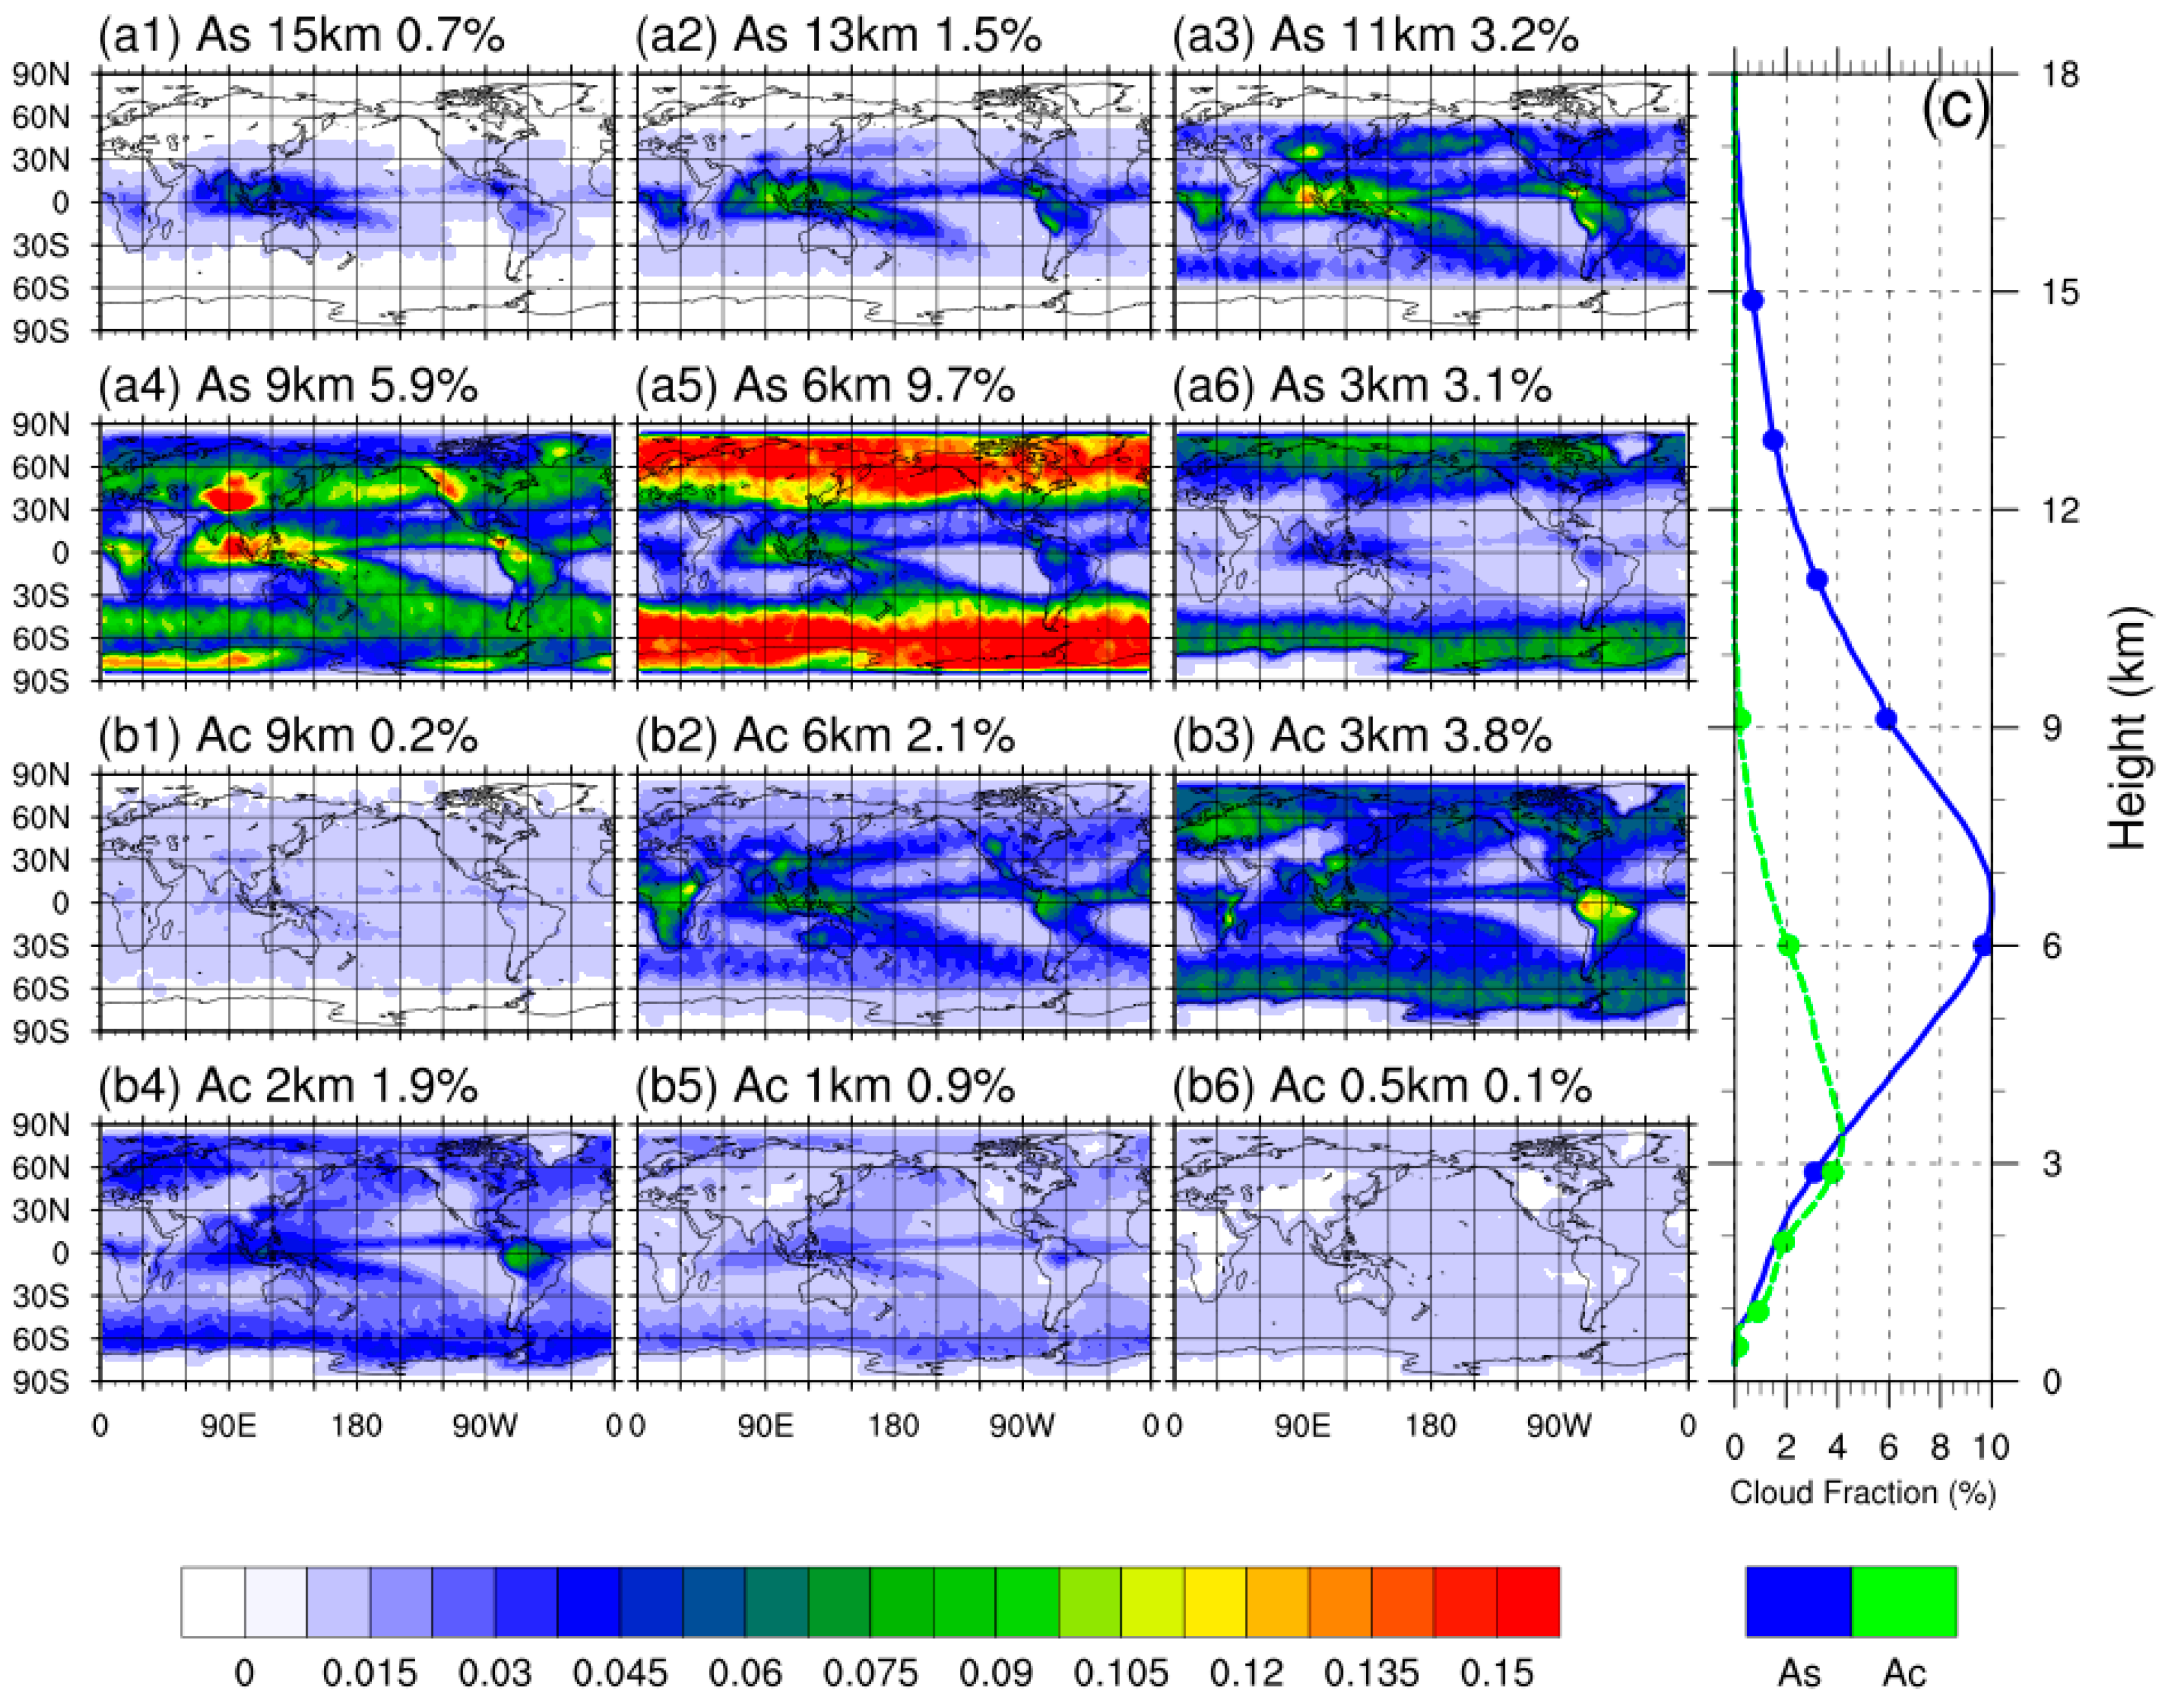
Figure 4 illustrates the cloud volume fraction distribution and the profile of the global average for the middle-level clouds. From the profiles of average cloud fraction, it is evident that As has a higher cloud fraction and distribution height compared to Ac. The maximum average cloud fraction of As occurs at approximately 6.72 km, reaching 10.0%, while for Ac, it is around 3.36 km with a value of 4.2%. However, the average cloud fraction of both types is relatively similar below 3 km. As and Ac both exhibit some clustering in the warm pool domain, with a minor variation in cloud fraction with height. Additionally, As is predominantly distributed in the mid-to-high latitude domains, where the cloud fraction of As varies significantly with height, peaking at approximately 8.4 km with a value of 26.6%. On the other hand, Ac is primarily present over the low-latitude land areas in central-southern Africa and northern South America, with a maximum cloud fraction of 15.8%.
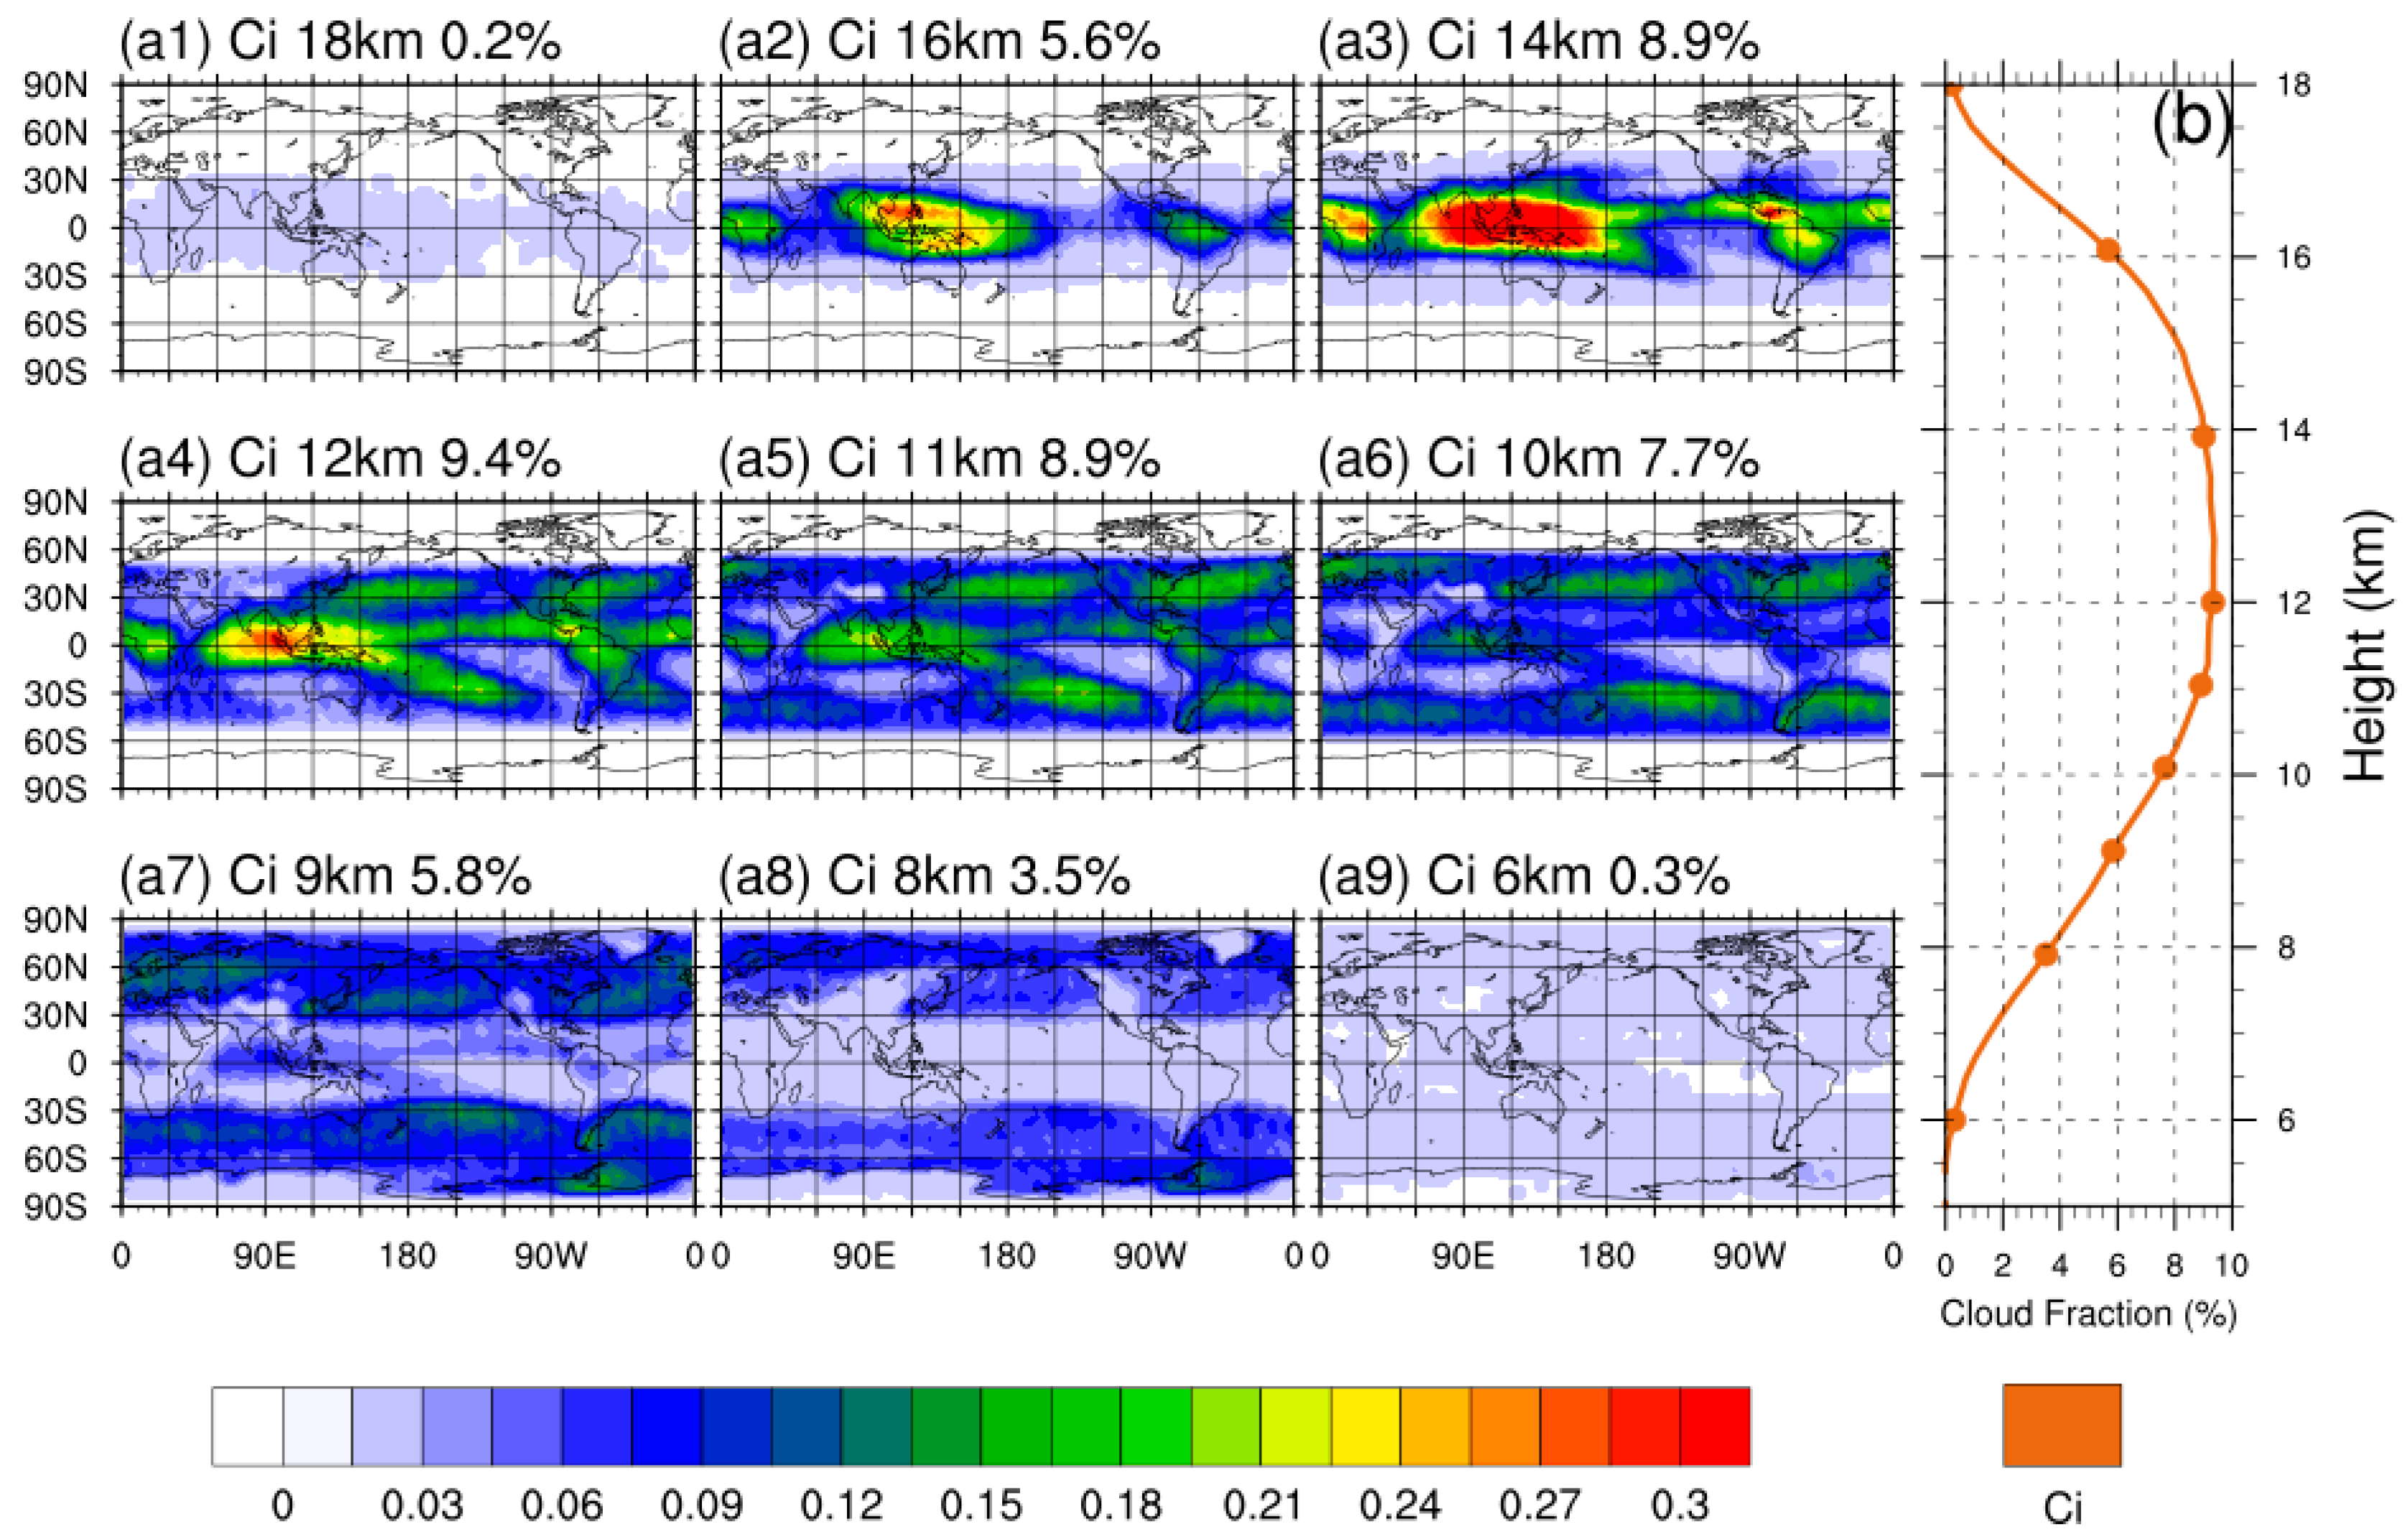
Figure 5 displays the cloud volume fraction distribution and the profile of the global average for high-level clouds. Ci is primarily distributed within the vertical range of 6–18 km, with the maximum average cloud fraction occurring at 12.72 km (9.5%). Ci is concentrated in two main domains: near the equator and in the mid-latitude zones. These domains have slightly different vertical distributions. Ci near the equator is distributed at heights between 10 and 16 km and is primarily present in the warm pool domain. Cloud fraction shows significant variation with height in this area, and the maximum cloud fraction of Ci is observed here, reaching as high as 46.2%. Additionally, Ci near the equator also partially extends over Central Africa and Central America. In the mid-latitude zones, Ci exhibits two belt-shaped aggregation domains near 45°N/S, distributed at heights of 8–12 km, with a relatively stable cloud fraction across different heights. The aggregation domains in the mid-latitude zones show clear north-south symmetry and are located within the longitudinal ranges of 150°E–120°W and 90°W–90°E, respectively.
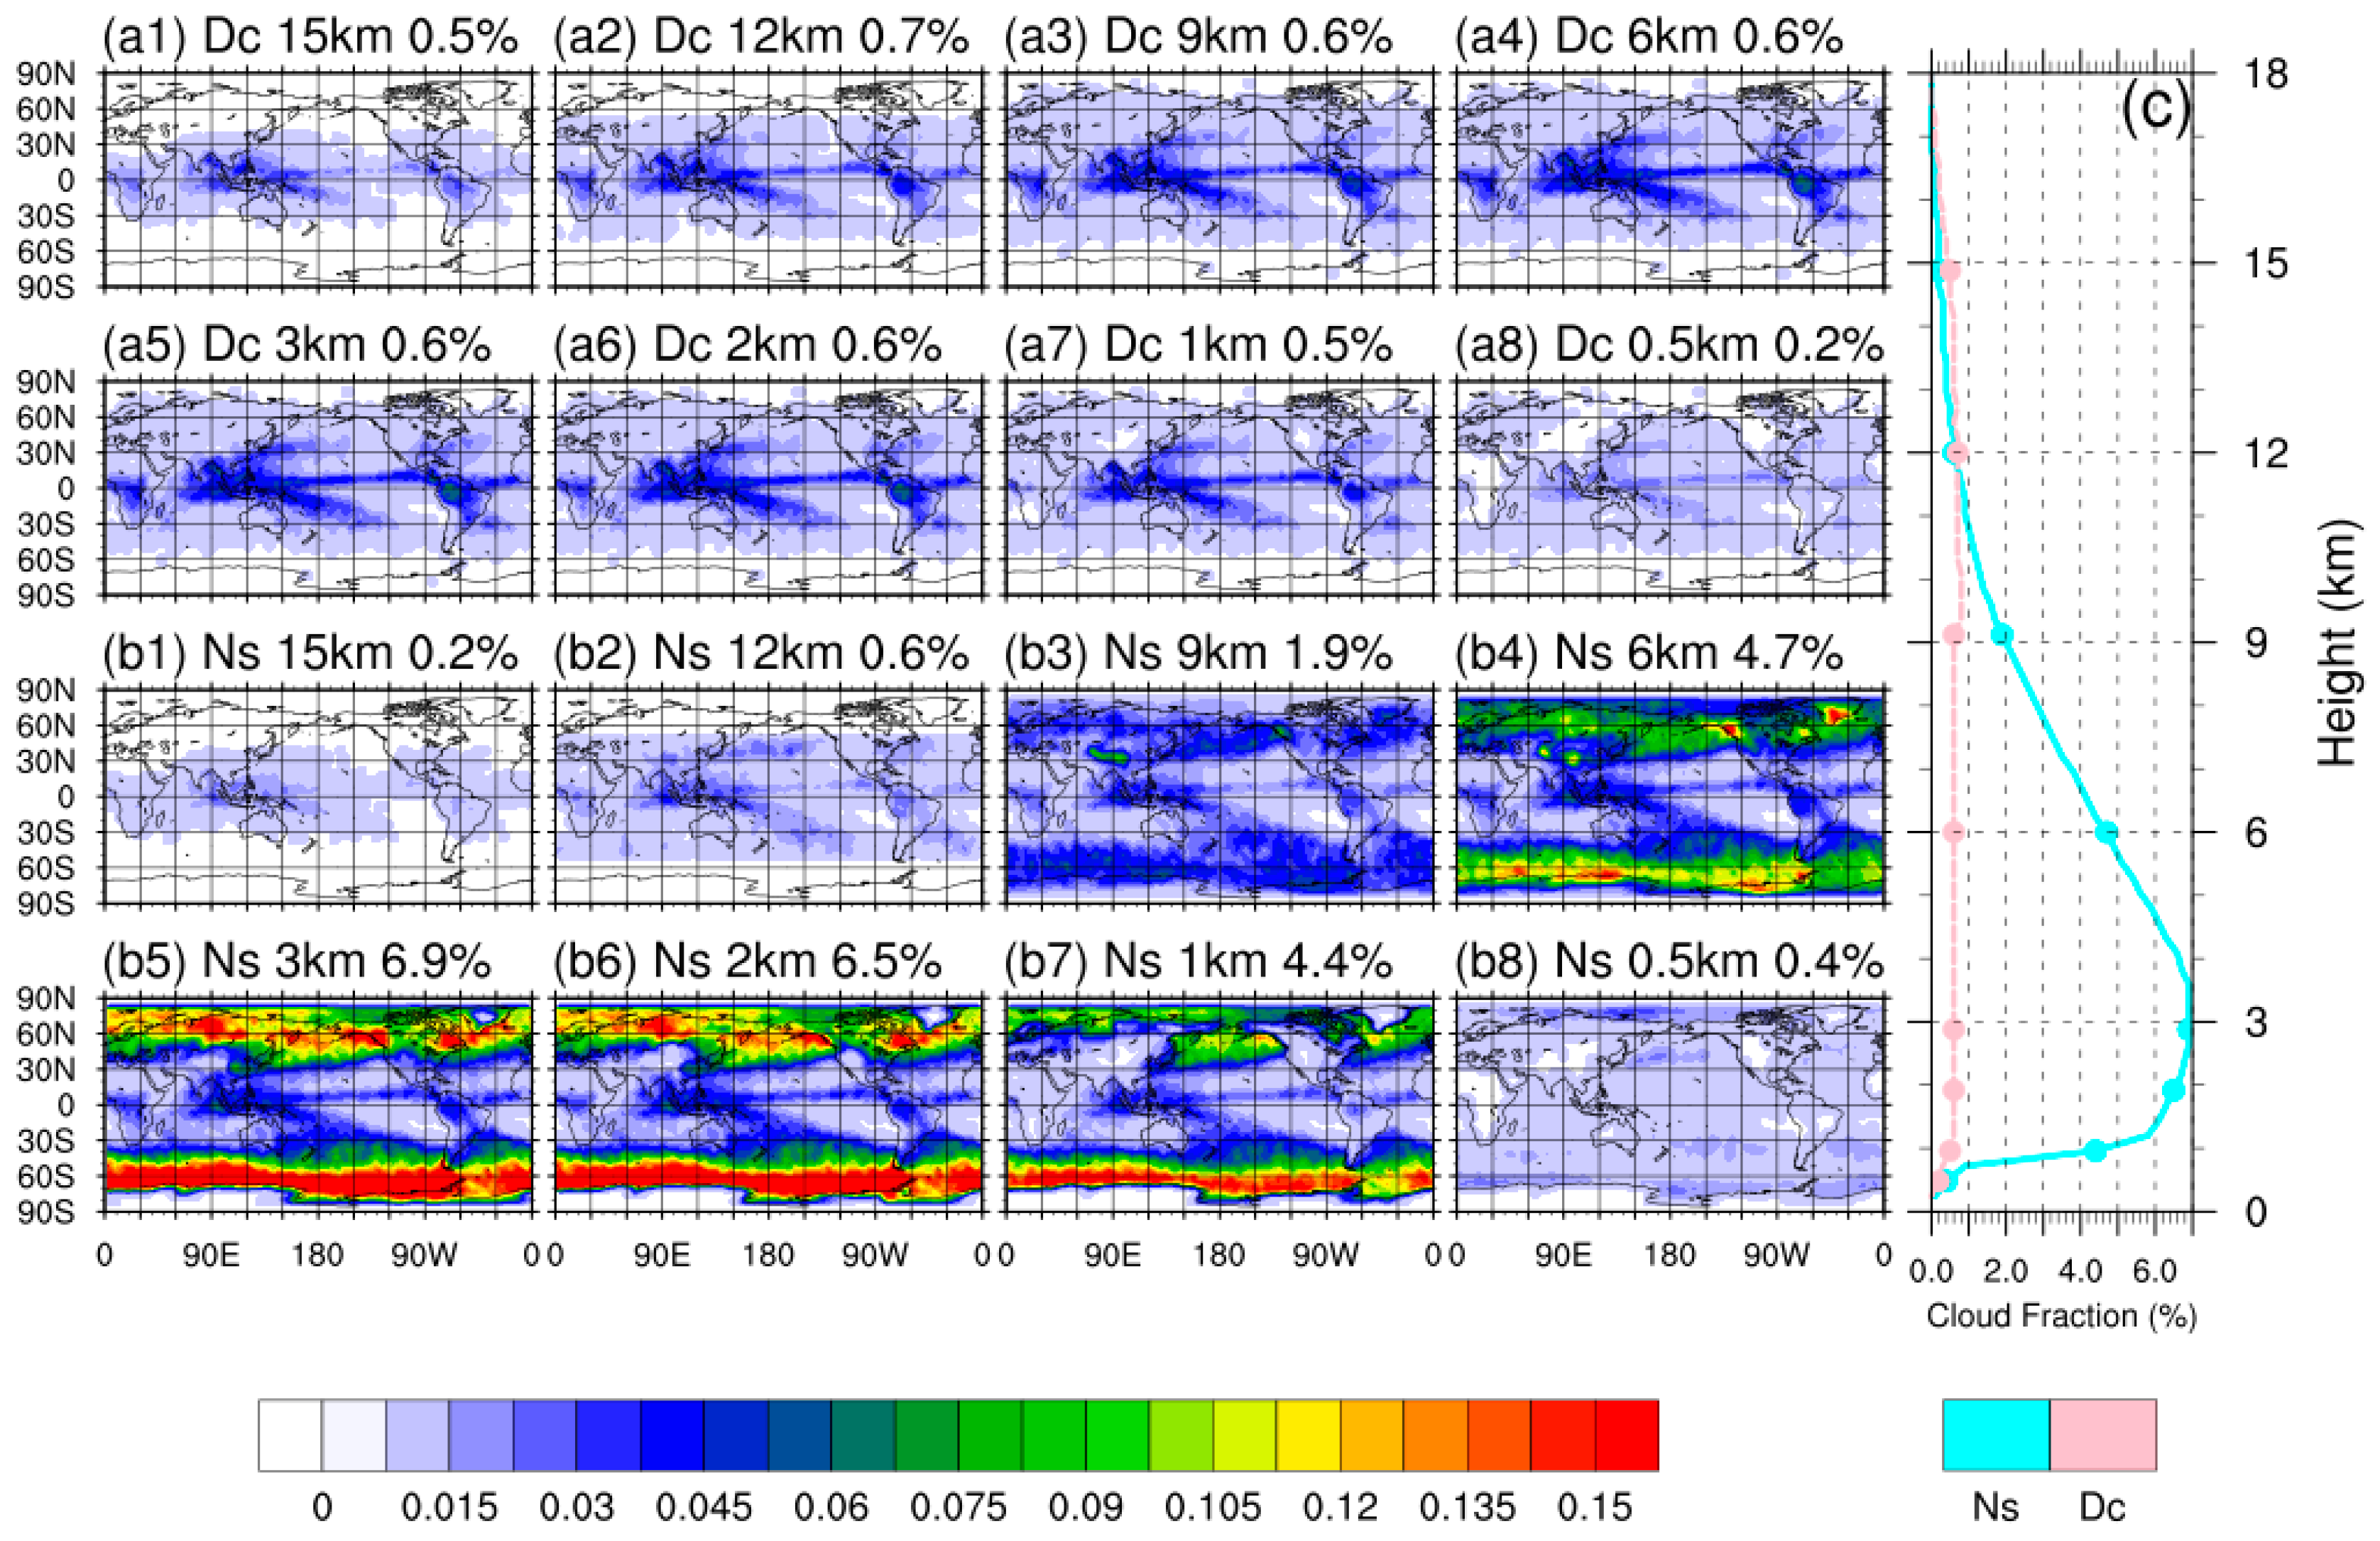
Figure 6 shows the cloud volume fraction distribution and profile of the global average for vertically extending clouds. Ns has a much larger volume fraction than Dc. The average cloud fraction of Ns exhibits significant variation below 9 km and reaches its maximum at around 3.12 km, with a maximum value of 7.0%. On the other hand, Dc has minimal variations in average cloud fraction across all heights, consistently below 0.8%. Ns is mainly distributed over the ocean in the mid–high latitude domain, within the height range of 1–6 km. The cloud fraction of Ns shows relatively large variations with height, with the maximum value occurring around 2.64 km at 26.3%. Dc, on the other hand, primarily occurs in the warm pool domain, Central Africa, and Central America below 15 km in the entire space. The cloud fraction of Dc in this domain shows minimal variations with height, typically around 6.5%. The distribution of Ns in the low-latitude domain is similar to that of Dc, and the vertical variation in cloud fraction is also similar. The only difference is that Ns has slightly higher cloud base heights than Dc, which may be caused by the fact that vertically extending clouds in the low latitude domain will be classified as Ns or Dc at different stages of life history. Specific reasons need follow-up research on the full life history of a single vertically extending cloud.
Mean profiles of cloud volume fraction for cloud types over the globe, land, and ocean, as well as in different latitudes, are shown in Figure 7. The peak values of each profile in Figure 7 and their corresponding heights are presented in Table 1. In general, due to different tropopause heights, the higher the latitude, the greater the total volume cloud fraction. The average cloud volume fraction of low latitude areas in different underlying surfaces is basically unchanged, and the rest have obvious differences between land and sea. For a single cloud type, no matter in which region and underlying surface combination, the average cloud fraction profile generally presents a unimodal trend of first increasing and then decreasing with the height. The dominant cloud types in different regions and underlying surface combinations are basically similar, and the order of change from high to low is Ci, As, Ns, Sc. The dominant cloud types in low latitudes are different, and the order of change for the land surface is Ci, As, Ac, Cu, and the order of change for the ocean surface is Ci, As, Ac, SC, Cu. The overall change sequence of dominant cloud types in low latitudes is consistent with the ocean surface. The land surface at high latitudes is restricted by the tropopause, and the dominant cloud types change from high to low in the order of As, Ns, and Sc. The total cloud fraction of the combination of different regions and the underlying surface has a peak value of about 1–2 km, but the peak value of the high latitude land surface is higher, about 4 km, which is mainly caused by the fewer Sc of the high latitude land surface. The low and middle latitudes have another peak at around 13 km and 8 km, respectively. The peak value around 1 km is mainly contributed by Sc and Cu, the peak value at 13 km in low latitudes is mainly contributed by Ci, and the peak value at 8 km in middle latitudes is the combined effect of Ci and As. Due to the more vigorous development of Ac on the low-latitude land surface compared to other areas, there is another small peak in the total land surface cloud fraction around 6 km at low latitudes.

3.2. Contribution of Cloud Types in Different Domains

Although clouds are divided into four cloud groups, the distribution of these four cloud groups is not completely independent. The global distribution of the proportions of the four cloud groups is shown in Figure 8. The selection of height slices mainly considers the maximum value position for each cloud type and the change in the dominant cloud type. At 18 km, high-level clouds are dominant with sporadic middle-level and vertically extending clouds, and clouds mainly appear in low latitudes. Most areas at 15 km are still dominated by high-level clouds, with sporadic middle-level and vertically extending clouds, but in the eastern Antarctic domain, middle-level clouds occupy more than half of the volume. The distribution at 12 km is similar to that at 15 km, except that middle-level clouds also become the dominant cloud type in the Qinghai–Tibet Plateau domain. Compared with 12 km, the proportions of middle-level and vertically extending clouds generally increases at 9 km, and middle-level clouds become the dominant cloud type in most tropical domains, with the proportion of vertically extending clouds reaching 15% or more in most areas. High-level clouds basically disappear at 6 km, and all domains are dominated by middle-level clouds, with low-level clouds beginning to appear and having a high proportion in the eastern Antarctic domain, the Qinghai–Tibet Plateau domain, and the west coast of South America, and the proportion of vertically developed clouds in most areas exceeds 25%. At 3 km, there are domains where middle-level clouds, low-level clouds, and vertically extending clouds become the dominant cloud types, and the proportions of these three types of clouds are very similar in most areas. At 2 km, middle-level clouds sharply decrease, and all domains are dominated by low-level clouds, with high proportions of vertically extending clouds in high latitudes. At 1 km, compared with 2 km, there is only a certain proportion of middle-level clouds in the warm pool area and the Amazon plain, and the proportion of vertically extending clouds in each domain also decreases to some extent. At 0.5 km, low-level clouds are basically dominant, and vertically extending clouds are dominant in the Central African domain, while middle-level clouds basically disappear. The dominant cloud type in different domains changes in different ways and with varying frequencies, mainly influenced by latitude, underlying surface type, and underlying surface altitude.
The proportions of each cloud type in the low-level clouds are shown in Figure 9. The proportion of St is extremely low, only existing in high-latitude domains and the continental west coast areas below 1 km. In the altitude range of 3–4 km, Cu is the main low-level cloud type over low- and mid-latitude oceanic areas, while Sc is the main low-level cloud over high-latitude and mid-latitude land areas. In the altitude range of 1–2.5 km, Cu is the main low-level cloud only over the warm pool area, the Amazon plain, and central Africa, while Sc is the main low-level cloud over other domains. Below 1 km, low-level clouds in low-latitude domains are mainly Cu, while those in middle and high-latitude domains are mainly Sc.
The proportions of each cloud type in the middle-level clouds are shown in Figure 10. Since Ac only exists below 9 km, As is the only middle-level cloud above 9 km. At 6 km, Ac is evenly distributed with As in low latitudes, but its proportion is very small in high latitudes. Compared to 6 km, Ac becomes the main middle-level cloud in low and middle latitudes at 3 km, and its proportion also increases significantly in high latitudes. The difference between 2 km and 1 km and 3 km is not significant. Compared to 1 km, As disappears in low latitudes at 0.5 km.
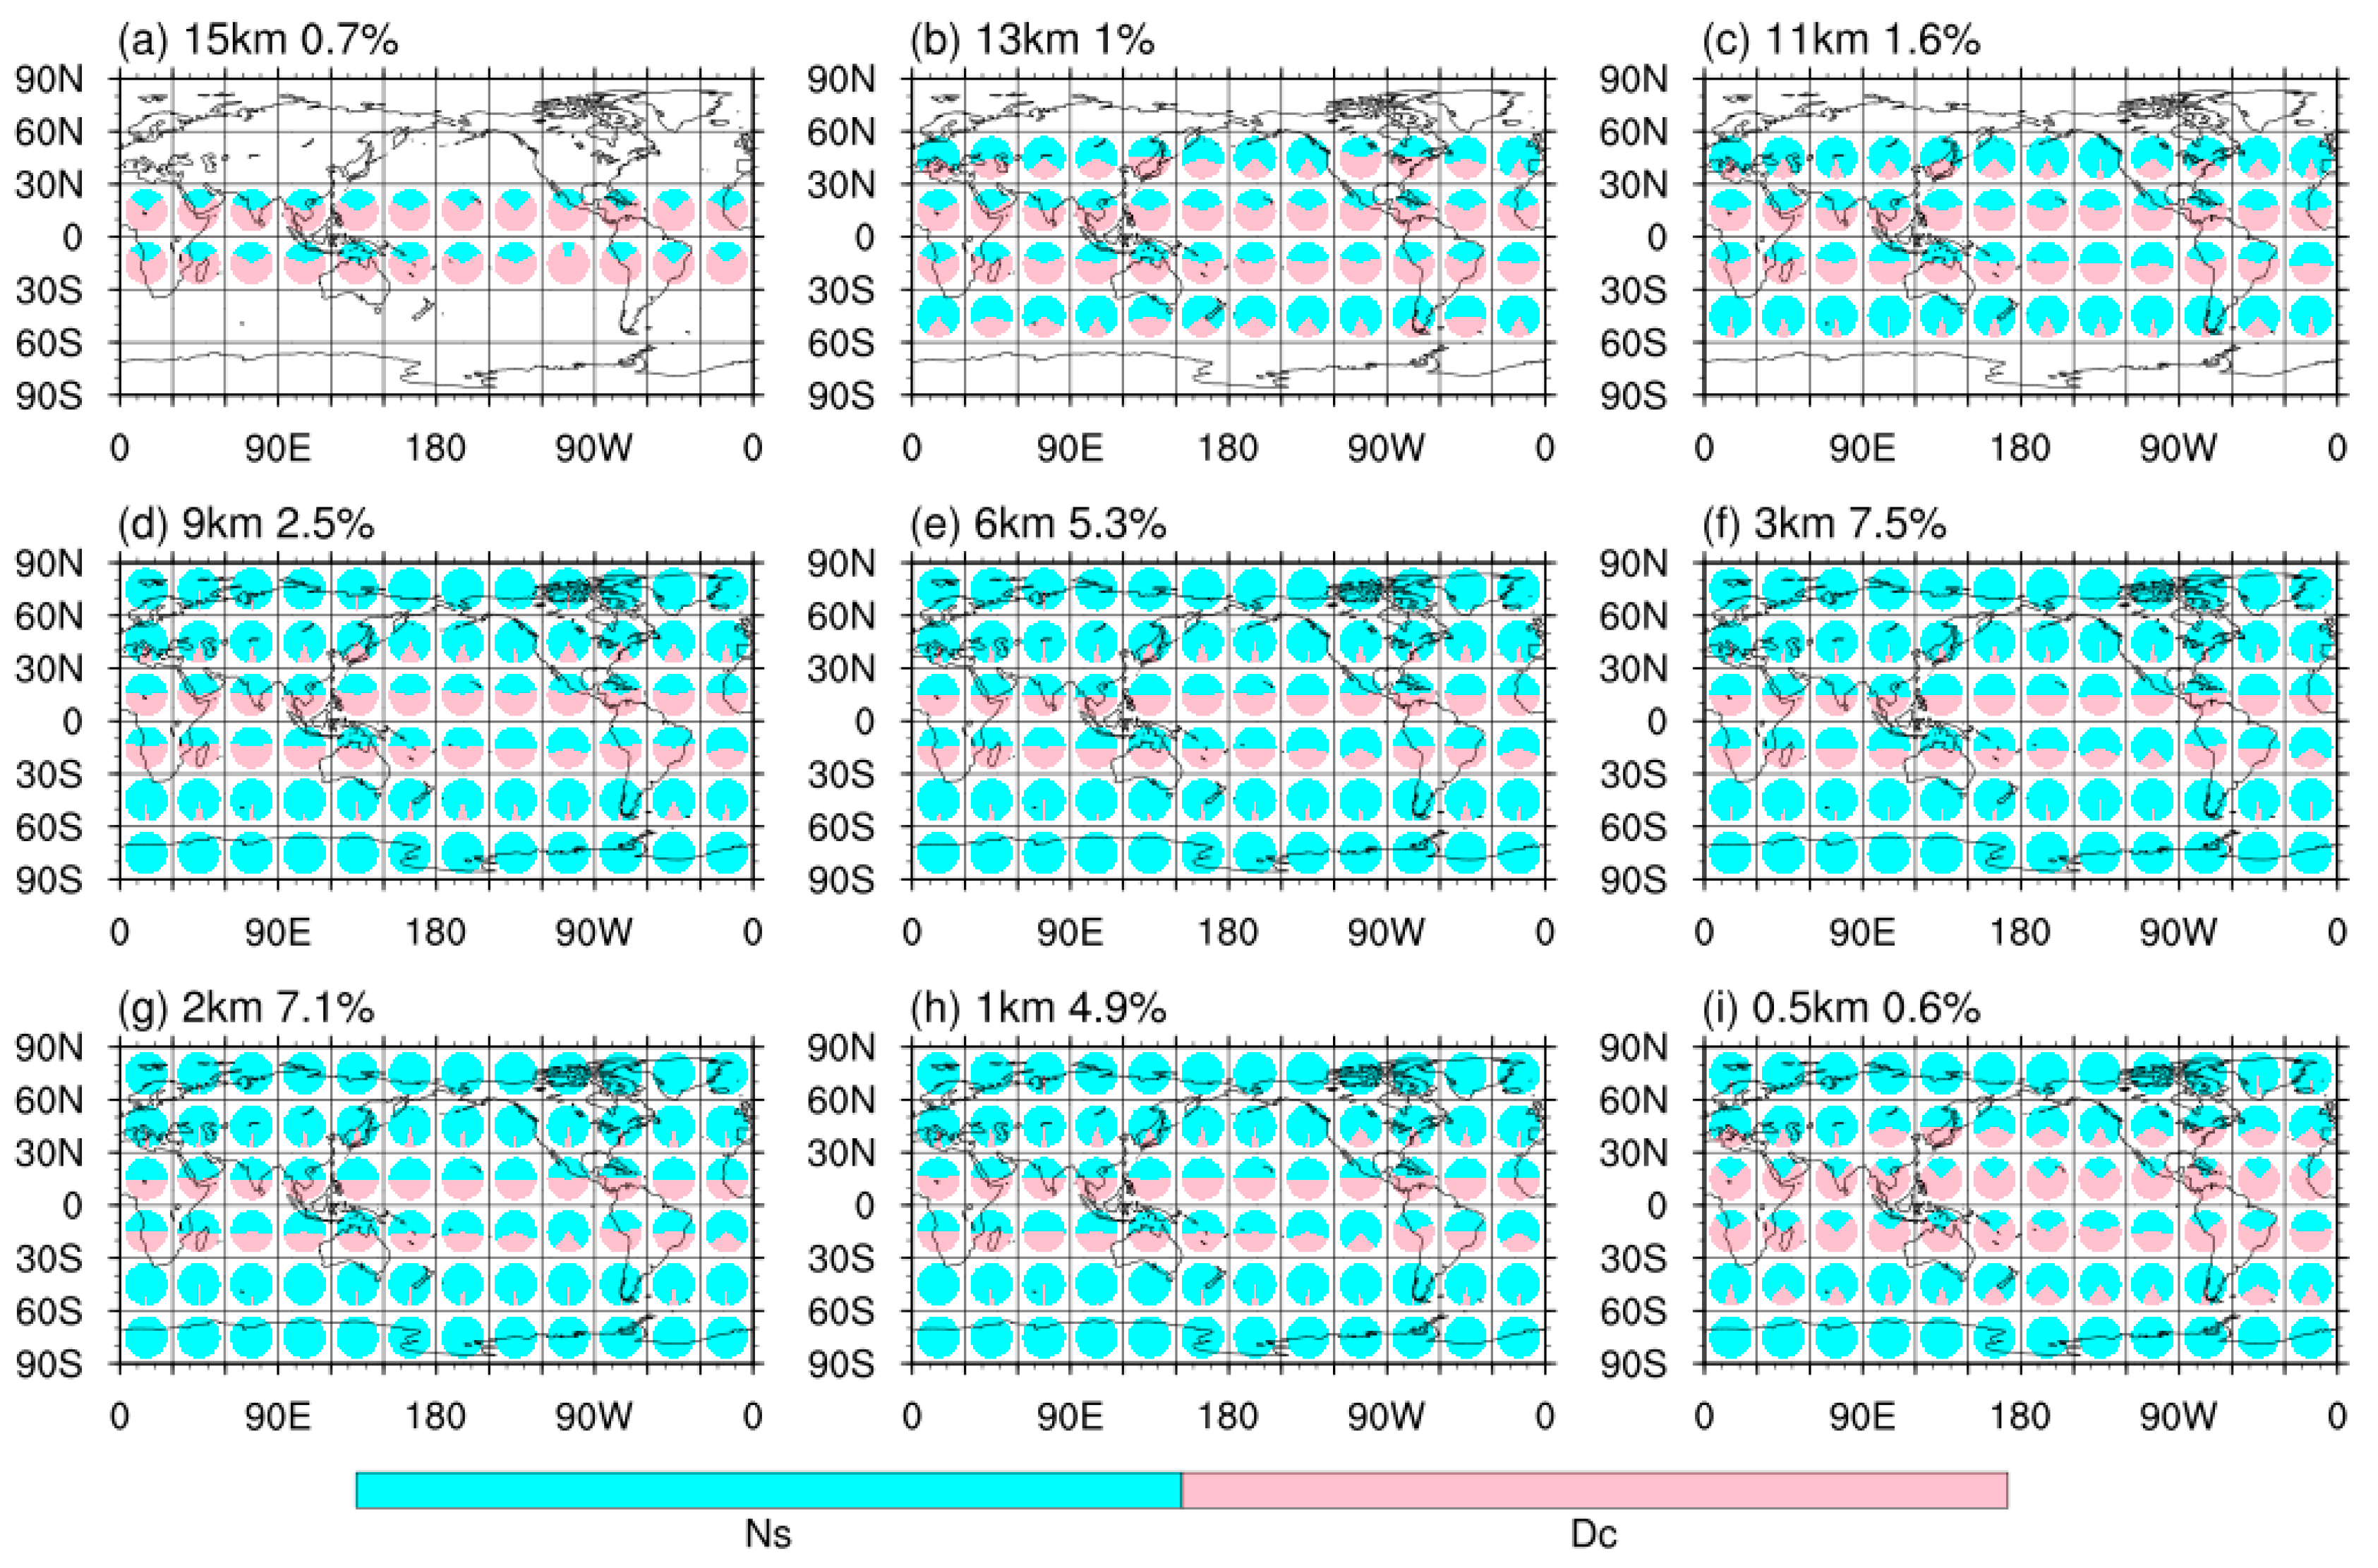
The proportions of each cloud type in the vertically extending clouds is shown in Figure 11. Since Dc only occurs in low latitudes, the vertically extending clouds in the middle–high latitudes are all Ns. In low latitudes, due to the influence of convective activity, Dc can exist at higher and lower altitudes compared to Ns; hence, it has a higher proportion at 15 km and 0.5 km. However, at other altitudes, Dc and Ns have roughly equal proportions.
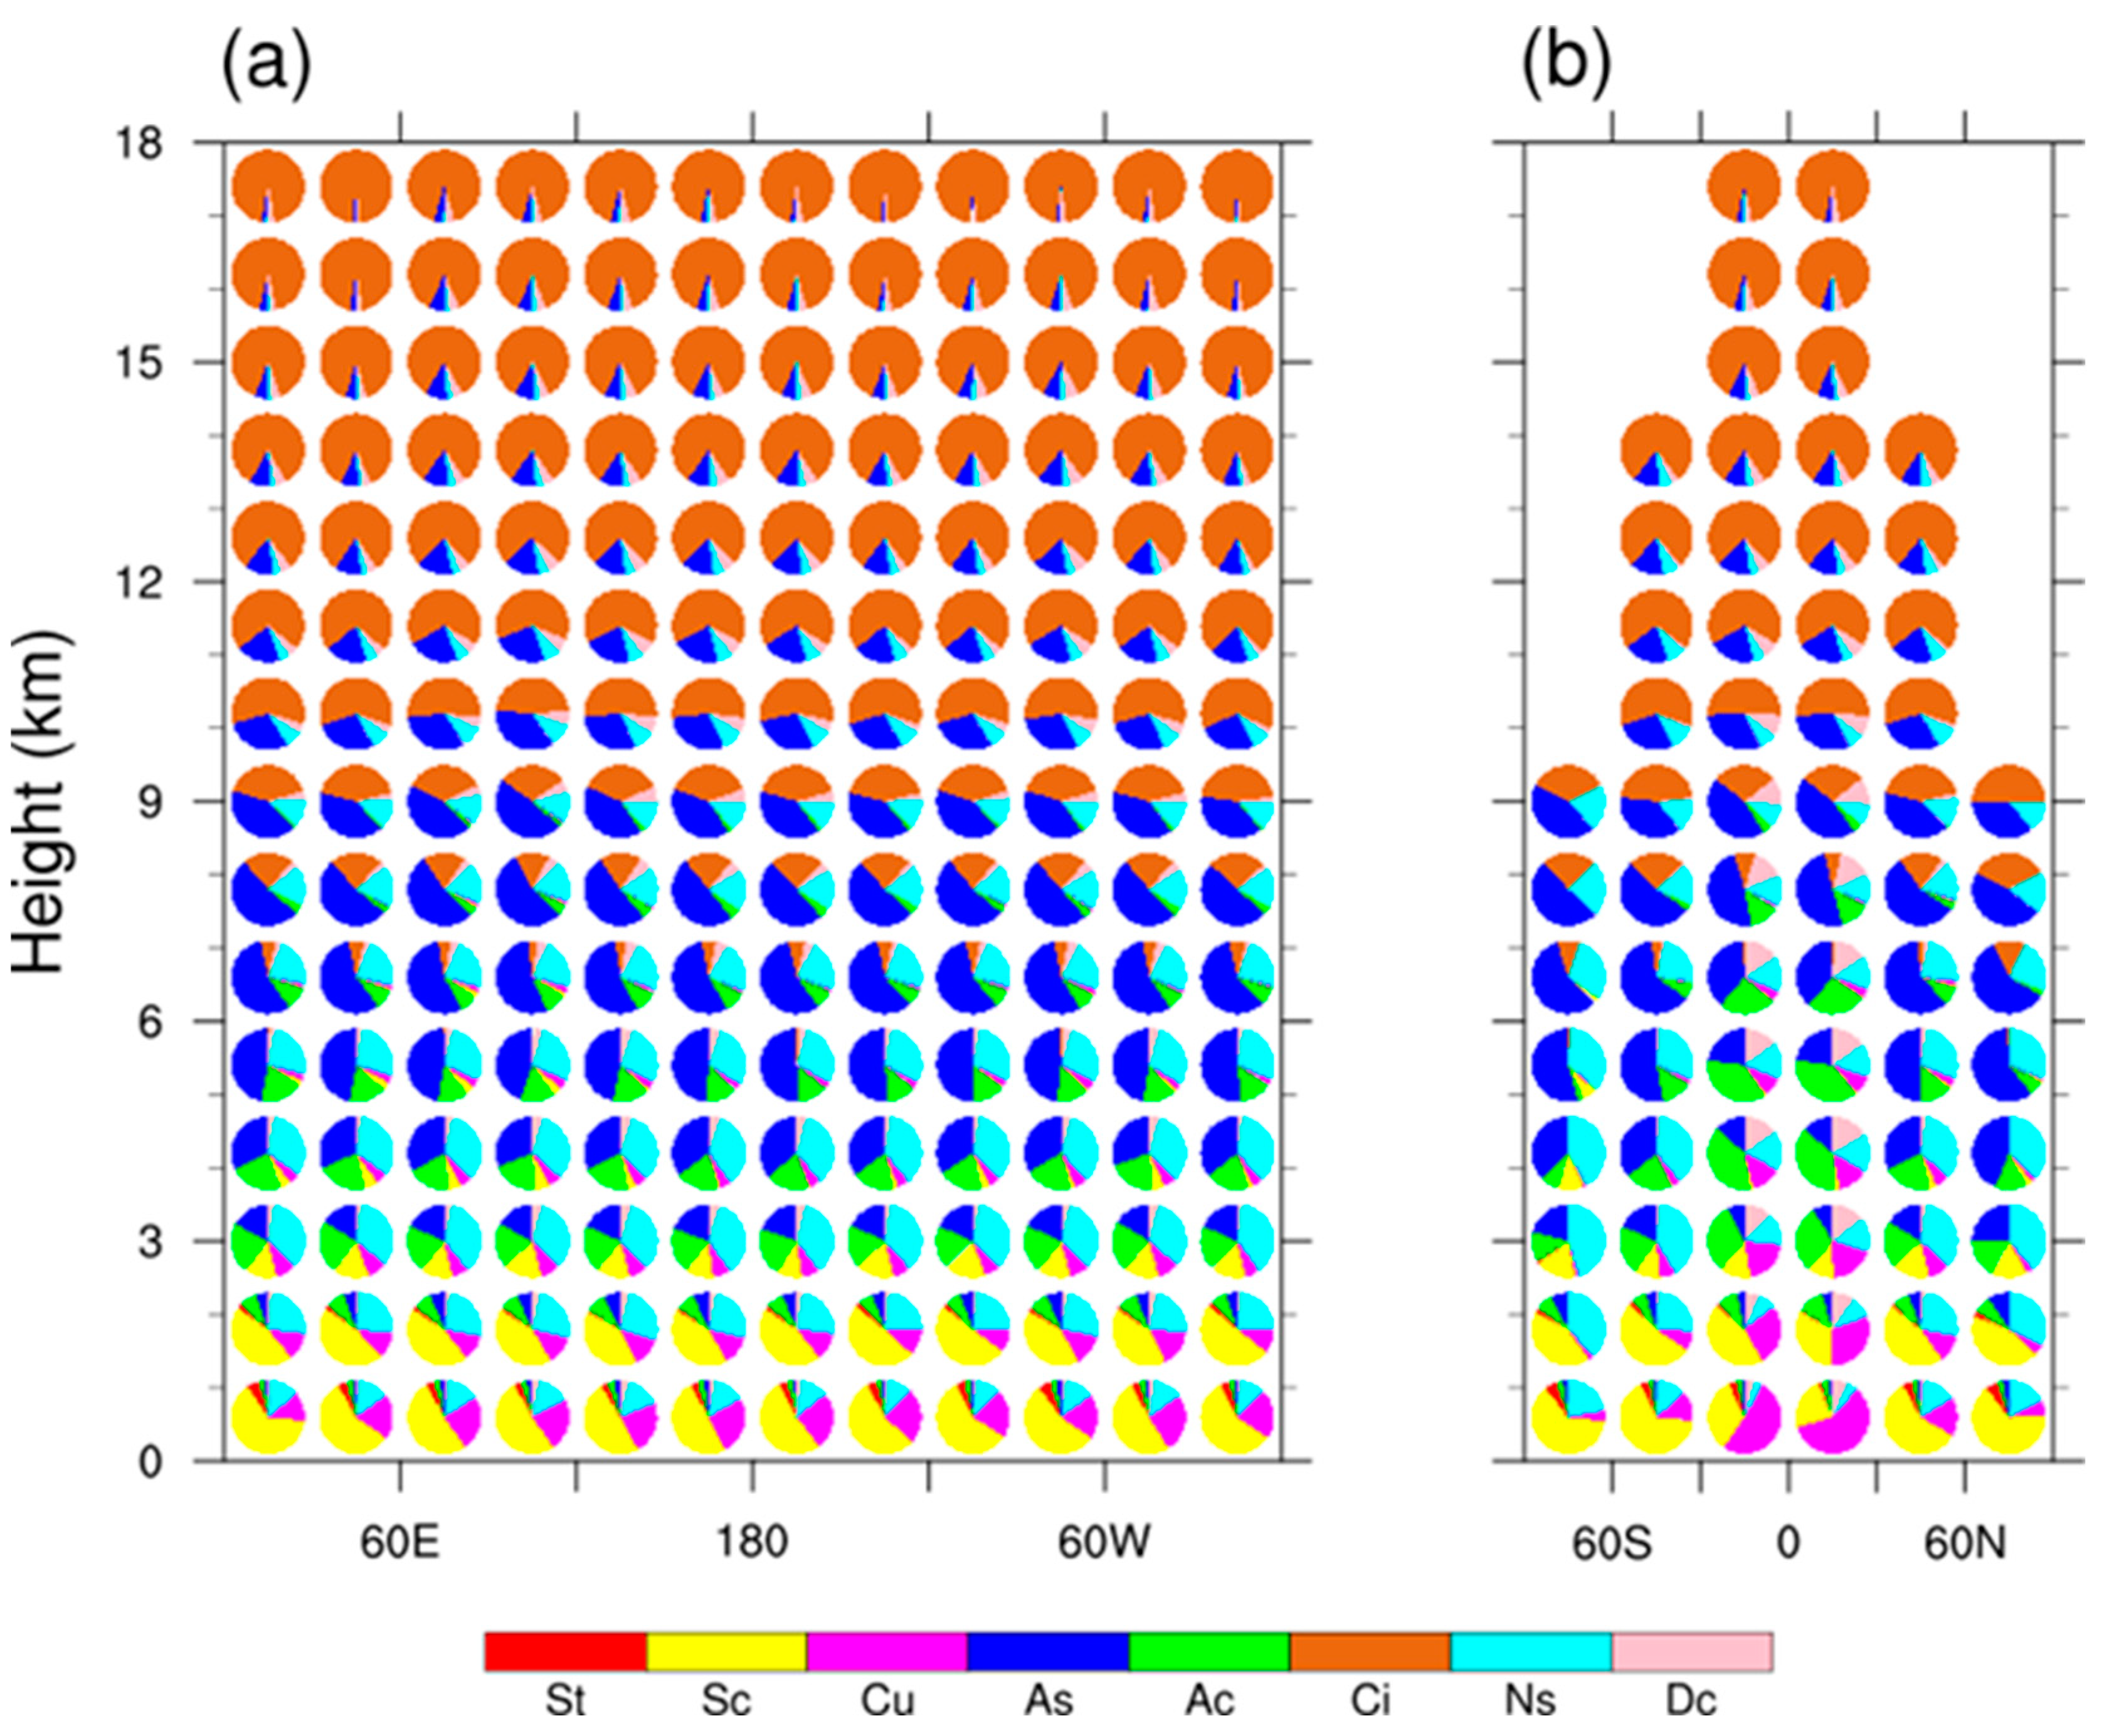
The meridional means and zonal means of the proportions of the eight cloud types are shown in Figure 12. The main cloud types in the meridional means change consistently with increasing height, which are Sc, Ns, As, and Ci in order. Although the main cloud types in the zonal mean vary with height, they are symmetrical in the Northern and Southern Hemispheres. In the middle and high latitudes, the order of change is Sc, Ns, As, Ci, while in the low latitudes, the order of change is Cu, Sc, Ac, As, Ci, consistent with the findings in Figure 7. Furthermore, in the altitude range of 2–8 km in low latitudes, except for high clouds Ci and the sparsely sampled St, the other six cloud types have significant percentages.

4. Conclusions

Based on multi-year cloud classification data of CloudSat and CALIPSO ranging from 2007 to 2010, the cloud occurrences on the global scale were examined, especially in terms of the volume fraction, which is much more comprehensive than the traditional way of the area fraction. Besides the overall spatial pattern of total clouds, specific contributions from eight cloud types were clarified individually. The main conclusions are as follows:
(1)
The overall volume fraction of total clouds throughout the troposphere is 15.9%, compared to the global area cloud fraction of 73.6%. As for the volume fraction in each atmospheric column, the maximum arises at middle latitudes over the Southern Ocean (38.2%), and the minimum arises over North Africa (1.1%). The elementary ones, i.e., the volume fraction at each cube (the volume unit concerned), were compared throughout the troposphere. It was found that a common peak arises consistently around 1 km regardless of the geographic positions, and there is another peak occurring at 13 km and 8 km in low-latitude and mid-latitude regions, respectively. The 1 km peak mainly comprised Sc and Cu, while the other peaks are mainly contributed by Ci and As. The averaged vertical pattern of volume fraction for any single cloud type tends to be unimodal. The dominant cloud types are nearly region independent. From high-level to low-level, they are Ci, As, Ac, Sc, and Cu in low latitudes and Ci, As, Ns, and Sc in other latitudes.
(2)
Low-level clouds are predominant below 3 km, mainly concentrated around 1 km, and the fractions show evident differences among cloud types (Sc > Cu > St). Sc has a maximum of 48.8% at 1 km above the Greenland Sea, which is the highest among all cloud types globally. At high latitudes, Sc is the dominant type, accounting for at least 75%, while at low and middle latitudes, it is Cu or Sc, depending on the specific height.
(3)
Middle-level clouds mainly occur below 15 km, in which As has higher volume fractions and is at higher altitudes compared with Ac. Both As and Ac have similar average fractions below 3 km. Between 3 and 6 km, As is the dominant middle-level cloud in high latitudes, while Ac is the dominant middle-level cloud in low latitudes, and their proportions are roughly equal in middle latitudes.
(4)
The only high-level cloud type Ci is mostly in the range of 6–18 km and frequently over the equator and the middle latitudes. Near the equator, Ci is concentrated in the warm pool, and the fraction varies notably with height. In contrast, the fraction is nearly invariable vertically for Ci in the middle latitudes.
(5)
Vertically extending clouds emerge throughout the troposphere. The fraction of Ns is much larger than that of Dc. There is a notable vertical variation in the fraction of Ns below 9 km, while that of Dc varies weakly in the entire vertical range. Ns dominates in middle–high latitudes, and in low latitudes, the proportions of Dc and Ns are roughly equal.
(6)
From the perspective of cloud volume fraction, the occurrences of high-level, middle-level, low-level, and vertically extending clouds are not completely confined to specific height ranges defined by traditional ground-based observations of low-, middle-, and high-level clouds.

Author Contributions

Conceptualization, Q.L.; data curation, Y.D.; formal analysis, Y.D.; funding acquisition, Q.L.; software, Y.D.; supervision, Q.L.; visualization, Y.D.; writing—original draft preparation, Y.D.; writing—review and editing, Q.L., P.L., M.L., Y.L., Q.Z. and Y.P. All authors have read and agreed to the published version of the manuscript.

Funding

This work was funded by the National Natural Science Foundation of China (42075075 and 41875030).

Data Availability Statement

Data is available from the CloudSat Data Processing Center https://www.cloudsat.cira.colostate.edu/ (accessed on 1 May 2023).

Acknowledgments

We would like to thank the NASA CloudSat team for sharing CPR and CALIOP product data.

Conflicts of Interest

The authors declare no conflict of interest.

References

  1. Matus, A.V.; L’Ecuyer, T.S. The role of cloud phase in Earth’s radiation budget. J. Geophys. Res. Atmos. 2017, 122, 2559–2578. [Google Scholar] [CrossRef]
  2. Zhou, C.; Zelinka, M.D.; Klein, S.A. Impact of decadal cloud variations on the Earth’s energy budget. Nat. Geosci. 2016, 9, 871–874. [Google Scholar] [CrossRef]
  3. Norris, J.R.; Allen, R.J.; Evan, A.T.; Zelinka, M.D.; O’Dell, C.W.; Klein, S.A. Evidence for climate change in the satellite cloud record. Nature 2016, 536, 72–75. [Google Scholar] [CrossRef] [PubMed] [Green Version]
  4. Ramanathan, V.; Cess, R.D.; Harrison, E.F.; Minnis, P.; Barkstrom, B.R.; Ahmad, E.; Hartmann, D. Cloud-Radiative Forcing and Climate—Results from the Earth Radiation Budget Experiment. Science 1989, 243, 57–63. [Google Scholar] [CrossRef] [PubMed] [Green Version]
  5. Hartmann, D.L.; Short, D.A. On the Use of Earth Radiation Budget Statistics for Studies of Clouds and Climate. J. Atmos. Sci. 1980, 37, 1233–1250. [Google Scholar] [CrossRef]
  6. Slingo, A.; Slingo, J.M. The Response of a General-Circulation Model to Cloud Longwave Radiative Forcing. 1. Introduction and Initial Experiments. Q. J. R. Meteorol. Soc. 1988, 114, 1027–1062. [Google Scholar] [CrossRef]
  7. Webb, M.J.; Senior, C.A.; Sexton, D.M.H.; Ingram, W.J.; Williams, K.D.; Ringer, M.A.; McAvaney, B.J.; Colman, R.; Soden, B.J.; Gudgel, R.; et al. On the contribution of local feedback mechanisms to the range of climate sensitivity in two GCM ensembles. Clim. Dyn. 2006, 27, 17–38. [Google Scholar] [CrossRef]
  8. de Szoeke, S.P.; Fairall, C.W.; Pezoa, S. Ship Observations of the Tropical Pacific Ocean along the Coast of South America. J. Clim. 2009, 22, 458–464. [Google Scholar] [CrossRef] [Green Version]
  9. Eastman, R.; Warren, S.G. A 39-Yr Survey of Cloud Changes from Land Stations Worldwide 1971–2009: Long-Term Trends, Relation to Aerosols, and Expansion of the Tropical Belt. J. Clim. 2013, 26, 1286–1303. [Google Scholar] [CrossRef]
  10. Eastman, R.; Warren, S.G. Diurnal Cycles of Cumulus, Cumulonimbus, Stratus, Stratocumulus, and Fog from Surface Observations over Land and Ocean. J. Clim. 2014, 27, 2386–2404. [Google Scholar] [CrossRef] [Green Version]
  11. Eastman, R.; Warren, S.G.; Hahn, C.J. Variations in Cloud Cover and Cloud Types over the Ocean from Surface Observations, 1954–2008. J. Clim. 2011, 24, 5914–5934. [Google Scholar] [CrossRef]
  12. Zhang, D.M.; Luo, T.; Liu, D.; Wang, Z. Spatial scales of altocumulus clouds observed with collocated CALIPSO and CloudSat measurements. Atmos. Res. 2014, 149, 58–69. [Google Scholar] [CrossRef]
  13. Hang, Y.; L’Ecuyer, T.S.; Henderson, D.S.; Matus, A.V.; Wang, Z. Reassessing the Effect of Cloud Type on Earth’s Energy Balance in the Age of Active Spaceborne Observations. Part II: Atmospheric Heating. J. Clim. 2019, 32, 6219–6236. [Google Scholar] [CrossRef]
  14. L’Ecuyer, T.S.; Hang, Y.; Matus, A.V.; Wang, Z. Reassessing the Effect of Cloud Type on Earth’s Energy Balance in the Age of Active Spaceborne Observations. Part I: Top of Atmosphere and Surface. J. Clim. 2019, 32, 6197–6217. [Google Scholar] [CrossRef] [Green Version]
  15. Williams, C.R.; Ecklund, W.L.; Gage, K.S. Classification of Precipitating Clouds in the Tropics Using 915-Mhz Wind Profilers. J. Atmos. Ocean. Technol. 1995, 12, 996–1012. [Google Scholar] [CrossRef]
  16. Luo, G.; Davis, P.A.; Stowe, L.L.; Mcclain, E.P. A Pixel-Scale Algorithm of Cloud Type, Layer, and Amount for Avhrr Data. 1. Nighttime. J. Atmos. Ocean. Technol. 1995, 12, 1013–1037. [Google Scholar] [CrossRef]
  17. Uddstrom, M.J.; Gray, W.R. Satellite cloud classification and rain-rate estimation using multispectral radiances and measures of spatial texture. J. Appl. Meteorol. 1996, 35, 839–858. [Google Scholar] [CrossRef]
  18. Barry, R.G. International Cloud Atlas, Volume I: Manual on the Observation of Clouds and Other Meteors. Arct. Alp. Res. 1977, 9, 323. [Google Scholar] [CrossRef]
  19. Duchon, C.E.; O’Malley, M.S. Estimating cloud type from pyranometer observations. J. Appl. Meteorol. 1999, 38, 132–141. [Google Scholar] [CrossRef]
  20. Stephens, G.L.; Kummerow, C.D. The remote sensing of clouds and precipitation from space: A review. J. Atmos. Sci. 2007, 64, 3742–3765. [Google Scholar] [CrossRef]
  21. Rabindra, P.; Sengupta, S.K.; Welch, R.M. An Interactive Hybrid Expert System for Polar Cloud and Surface Classification. Environmetrics 1992, 3, 121–147. [Google Scholar] [CrossRef]
  22. Tovinkere, V.R.; Penaloza, M.; Logar, A.; Lee, J.; Weger, R.C.; Berendes, T.A.; Welch, R.M. An Intercomparison of Artificial-Intelligence Approaches for Polar Scene Identification. J. Geophys. Res. Atmos. 1993, 98, 5001–5016. [Google Scholar] [CrossRef]
  23. Bankert, R.L. Cloud Pattern Identification as Part of an Automated Image Analysis. In Proceedings of the 7th American Meteorological Society Conference on Satellite Meteorology and Oceanography, Monterey, CA, USA, 6–10 June 1994; pp. 441–443. [Google Scholar]
  24. Liu, H.L.; Zhu, W.Q.; Yi, S.H.; Li, W.L.; Chen, L.X.; Bai, L.J. Climatic analysis of the cloud over China. Acta Meteorol. Sin. 2003, 61, 466–473+517–518. [Google Scholar]
  25. Yonghang, C.; Yan, C.; Jianping, H.; Zhihai, Z.; Jing, S.U.; He, H. Distribution and Variation Trend of Cloud over Northwestern China. Plateau Meteorol. 2007, 26, 741–748. [Google Scholar]
  26. Rossow, W.B.; Schiffer, R.A. Isccp Cloud Data Products. Bull. Am. Meteorol. Soc. 1991, 72, 2–20. [Google Scholar] [CrossRef]
  27. Rossow, W.B.; Knapp, K.R.; Young, A.H. International Satellite Cloud Climatology Project: Extending the Record. J. Clim. 2022, 35, 141–158. [Google Scholar] [CrossRef]
  28. Schiffer, R.A.; Rossow, W.B. The International-Satellite-Cloud-Climatology-Project (Isccp)—The 1st Project of the World-Climate-Research-Programme. Bull. Am. Meteorol. Soc. 1983, 64, 779–784. [Google Scholar] [CrossRef] [Green Version]
  29. Rossow, W.B.; Schiffer, R.A. Advances in understanding clouds from ISCCP. Bull. Am. Meteorol. Soc. 1999, 80, 2261–2287. [Google Scholar] [CrossRef]
  30. Ding, S.G.; Shi, G.Y.; Zhao, C.S. Analyzing global trends of different cloud types and their potential impacts on climate by using the ISCCP D2 dataset. Chin. Sci. Bull. 2004, 49, 1301–1306. [Google Scholar] [CrossRef]
  31. Liu, Q.; Fu, Y.; Feng, S. Geographical patterns of the cloud amount derived from the ISCCP and their correlation with the NCEP reanalysis datasets. Acta Meteorol. Sin. 2010, 68, 689–704. [Google Scholar]
  32. Mace, G.G.; Wrenn, F.J. Evaluation of the Hydrometeor Layers in the East and West Pacific within ISCCP Cloud-Top Pressure-Optical Depth Bins Using Merged CloudSat and CALIPSO Data. J. Clim. 2013, 26, 9429–9444. [Google Scholar] [CrossRef] [Green Version]
  33. Johansson, E.; Devasthale, A.; Ekman, A.M.L.; Tjernström, M.; L’Ecuyer, T. How Does Cloud Overlap Affect the Radiative Heating in the Tropical Upper Troposphere/Lower Stratosphere? Geophys. Res. Lett. 2019, 46, 5623–5631. [Google Scholar] [CrossRef] [Green Version]
  34. Nam, C.C.W.; Quaas, J. Geographically versus dynamically defined boundary layer cloud regimes and their use to evaluate general circulation model cloud parameterizations. Geophys. Res. Lett. 2013, 40, 4951–4956. [Google Scholar] [CrossRef] [Green Version]
  35. Yuan, T.; Oreopoulos, L. On the global character of overlap between low and high clouds. Geophys. Res. Lett. 2013, 40, 5320–5326. [Google Scholar] [CrossRef] [Green Version]
  36. Ding, Y.H.; Liu, Q.; Lao, P. Characteristics of Oceanic Warm Cloud Layers within Multilevel Cloud Systems Derived by Satellite Measurements. Atmosphere 2019, 10, 15. [Google Scholar] [CrossRef] [Green Version]
  37. Li, J.; Huang, J.; Stamnes, K.; Wang, T.; Lv, Q.; Jin, H. A global survey of cloud overlap based on CALIPSO and CloudSat measurements. Atmos. Chem. Phys. 2015, 15, 519–536. [Google Scholar] [CrossRef] [Green Version]
  38. Huang, L.; Jiang, J.H.; Wang, Z.; Su, H.; Deng, M.; Massie, S. Climatology of cloud water content associated with different cloud types observed by A-Train satellites. J. Geophys. Res. Atmos. 2015, 120, 4196–4212. [Google Scholar] [CrossRef]
  39. Kotarba, A.Z. Vertical profile of cloud amount over Poland: Variability and uncertainty based on CloudSat-CALIPSO observations. Int. J. Clim. 2018, 38, 4142–4154. [Google Scholar] [CrossRef]
  40. Stein, T.H.M.; Holloway, C.E.; Tobin, I.; Bony, S. Observed Relationships between Cloud Vertical Structure and Convective Aggregation over Tropical Ocean. J. Clim. 2017, 30, 2187–2207. [Google Scholar] [CrossRef]
  41. Yan, Y.; Liu, Y.; Lu, J. Cloud vertical structure, precipitation, and cloud radiative effects over Tibetan Plateau and its neighboring regions. J. Geophys. Res. Atmos. 2016, 121, 5864–5877. [Google Scholar] [CrossRef] [Green Version]
  42. Zhang, J.Q.; Li, Z.Q.; Chen, H.B.; Yoo, H.; Cribb, M. Cloud vertical distribution from radiosonde, remote sensing, and model simulations. Clim. Dyn. 2014, 43, 1129–1140. [Google Scholar] [CrossRef]
  43. Zhang, Y.; Chen, H.; Yu, R. Vertical Structures and Physical Properties of the Cold-Season Stratus Clouds Downstream of the Tibetan Plateau: Differences between Daytime and Nighttime. J. Clim. 2014, 27, 6857–6876. [Google Scholar] [CrossRef] [Green Version]
  44. Li, J.; Lv, Q.; Jian, B.; Zhang, M.; Zhao, C.; Fu, Q.; Kawamoto, K.; Zhang, H. The impact of atmospheric stability and wind shear on vertical cloud overlap over the Tibetan Plateau. Atmos. Chem. Phys. 2018, 18, 7329–7343. [Google Scholar] [CrossRef] [Green Version]
  45. Oreopoulos, L.; Cho, N.; Lee, D. New Insights about Cloud Vertical Structure from CloudSat and CALIPSO observations. J. Geophys. Res. Atmos. 2017, 122, 9280–9300. [Google Scholar] [CrossRef] [PubMed]
  46. Sarkar, T.; Dey, S.; Ganguly, D.; Di Girolamo, L.; Hong, Y.L. Comparative assessment of a near-global view of individual cloud types from space-borne active and passive sensors and ground-based observations. Int. J. Clim. 2022, 42, 8073–8088. [Google Scholar] [CrossRef]
  47. Sun, Y.; Yang, H.; Xiao, H.; Liang, F.; Cheng, W.; Zhou, L.; Shu, W.; Sun, J. The spatio-temporal distribution characteristics of cloud types and phases in the Arctic based on CloudSat and CALIPSO cloud classification products. Adv. Atmos. Sci. 2023. [Google Scholar] [CrossRef]
  48. Stephens, G.L.; Vane, D.G.; Tanelli, S.; Im, E.; Durden, S.; Rokey, M.; Reinke, D.; Partain, P.; Mace, G.G.; Austin, R.; et al. CloudSat mission: Performance and early science after the first year of operation. J. Geophys. Res. Atmos. 2008, 113. [Google Scholar] [CrossRef]
  49. Stephens, G.L.; Vane, D.G.; Boain, R.J.; Mace, G.G.; Sassen, K.; Wang, Z.E.; Illingworth, A.J.; O’Connor, E.J.; Rossow, W.B.; Durden, S.L.; et al. The cloudsat mission and the a-train—A new dimension of space-based observations of clouds and precipitation. Bull. Am. Meteorol. Soc. 2002, 83, 1771–1790. [Google Scholar] [CrossRef] [Green Version]
  50. Marchand, R.; Mace, G.G.; Ackerman, T.; Stephens, G. Hydrometeor detection using Cloudsat—An earth-orbiting 94-GHz cloud radar. J. Atmos. Ocean. Technol. 2008, 25, 519–533. [Google Scholar] [CrossRef]
  51. Cai, H.K.; Yang, Y.; Chen, Q.L. Distribution Characteristics of Cloud Types and Cloud Phases over China and Their Relationship with Cloud Temperature. Remote Sens. 2022, 14, 5601. [Google Scholar] [CrossRef]
  52. Stephens, G.; Winker, D.; Pelon, J.; Trepte, C.; Vane, D.; Yuhas, C.; L’Ecuyer, T.; Lebsock, M. CloudSat and CALIPSO within the A-Train: Ten Years of Actively Observing the Earth System. Bull. Am. Meteorol. Soc. 2018, 99, 569–581. [Google Scholar] [CrossRef] [Green Version]
  53. Liu, D.Y.; Liu, Q.; Zhou, L.L. Underestimation of Oceanic Warm Cloud Occurrences by the Cloud Profiling Radar Aboard CloudSat. J. Meteorol. Res. 2015, 29, 576–593. [Google Scholar] [CrossRef]
  54. Wang, Z. CloudSat 2B-CLDCLASS-LIDAR Product Process Description and Interface Control Document. Available online: https://www.cloudsat.cira.colostate.edu/cloudsat-static/info/dl/2b-cldclass-lidar/2B-CLDCLASS-LIDAR_PDICD.P1_R05.rev0_.pdf (accessed on 29 June 2023).
  55. Kishore, P.; Namboothiri, S.P.; Igarashi, K.; Jiang, J.H.; Ao, C.O.; Romans, L.J. Climatological characteristics of the tropopause parameters derived from GPS/CHAMP and GPS/SAC-C measurements. J. Geophys. Res. Atmos. 2006, 111. [Google Scholar] [CrossRef] [Green Version]
  56. Liu, Y.; Xu, T.L.; Liu, J. Characteristics of the seasonal variation of the global tropopause revealed by COSMIC/GPS data. Adv. Space Res. 2014, 54, 2274–2285. [Google Scholar] [CrossRef]
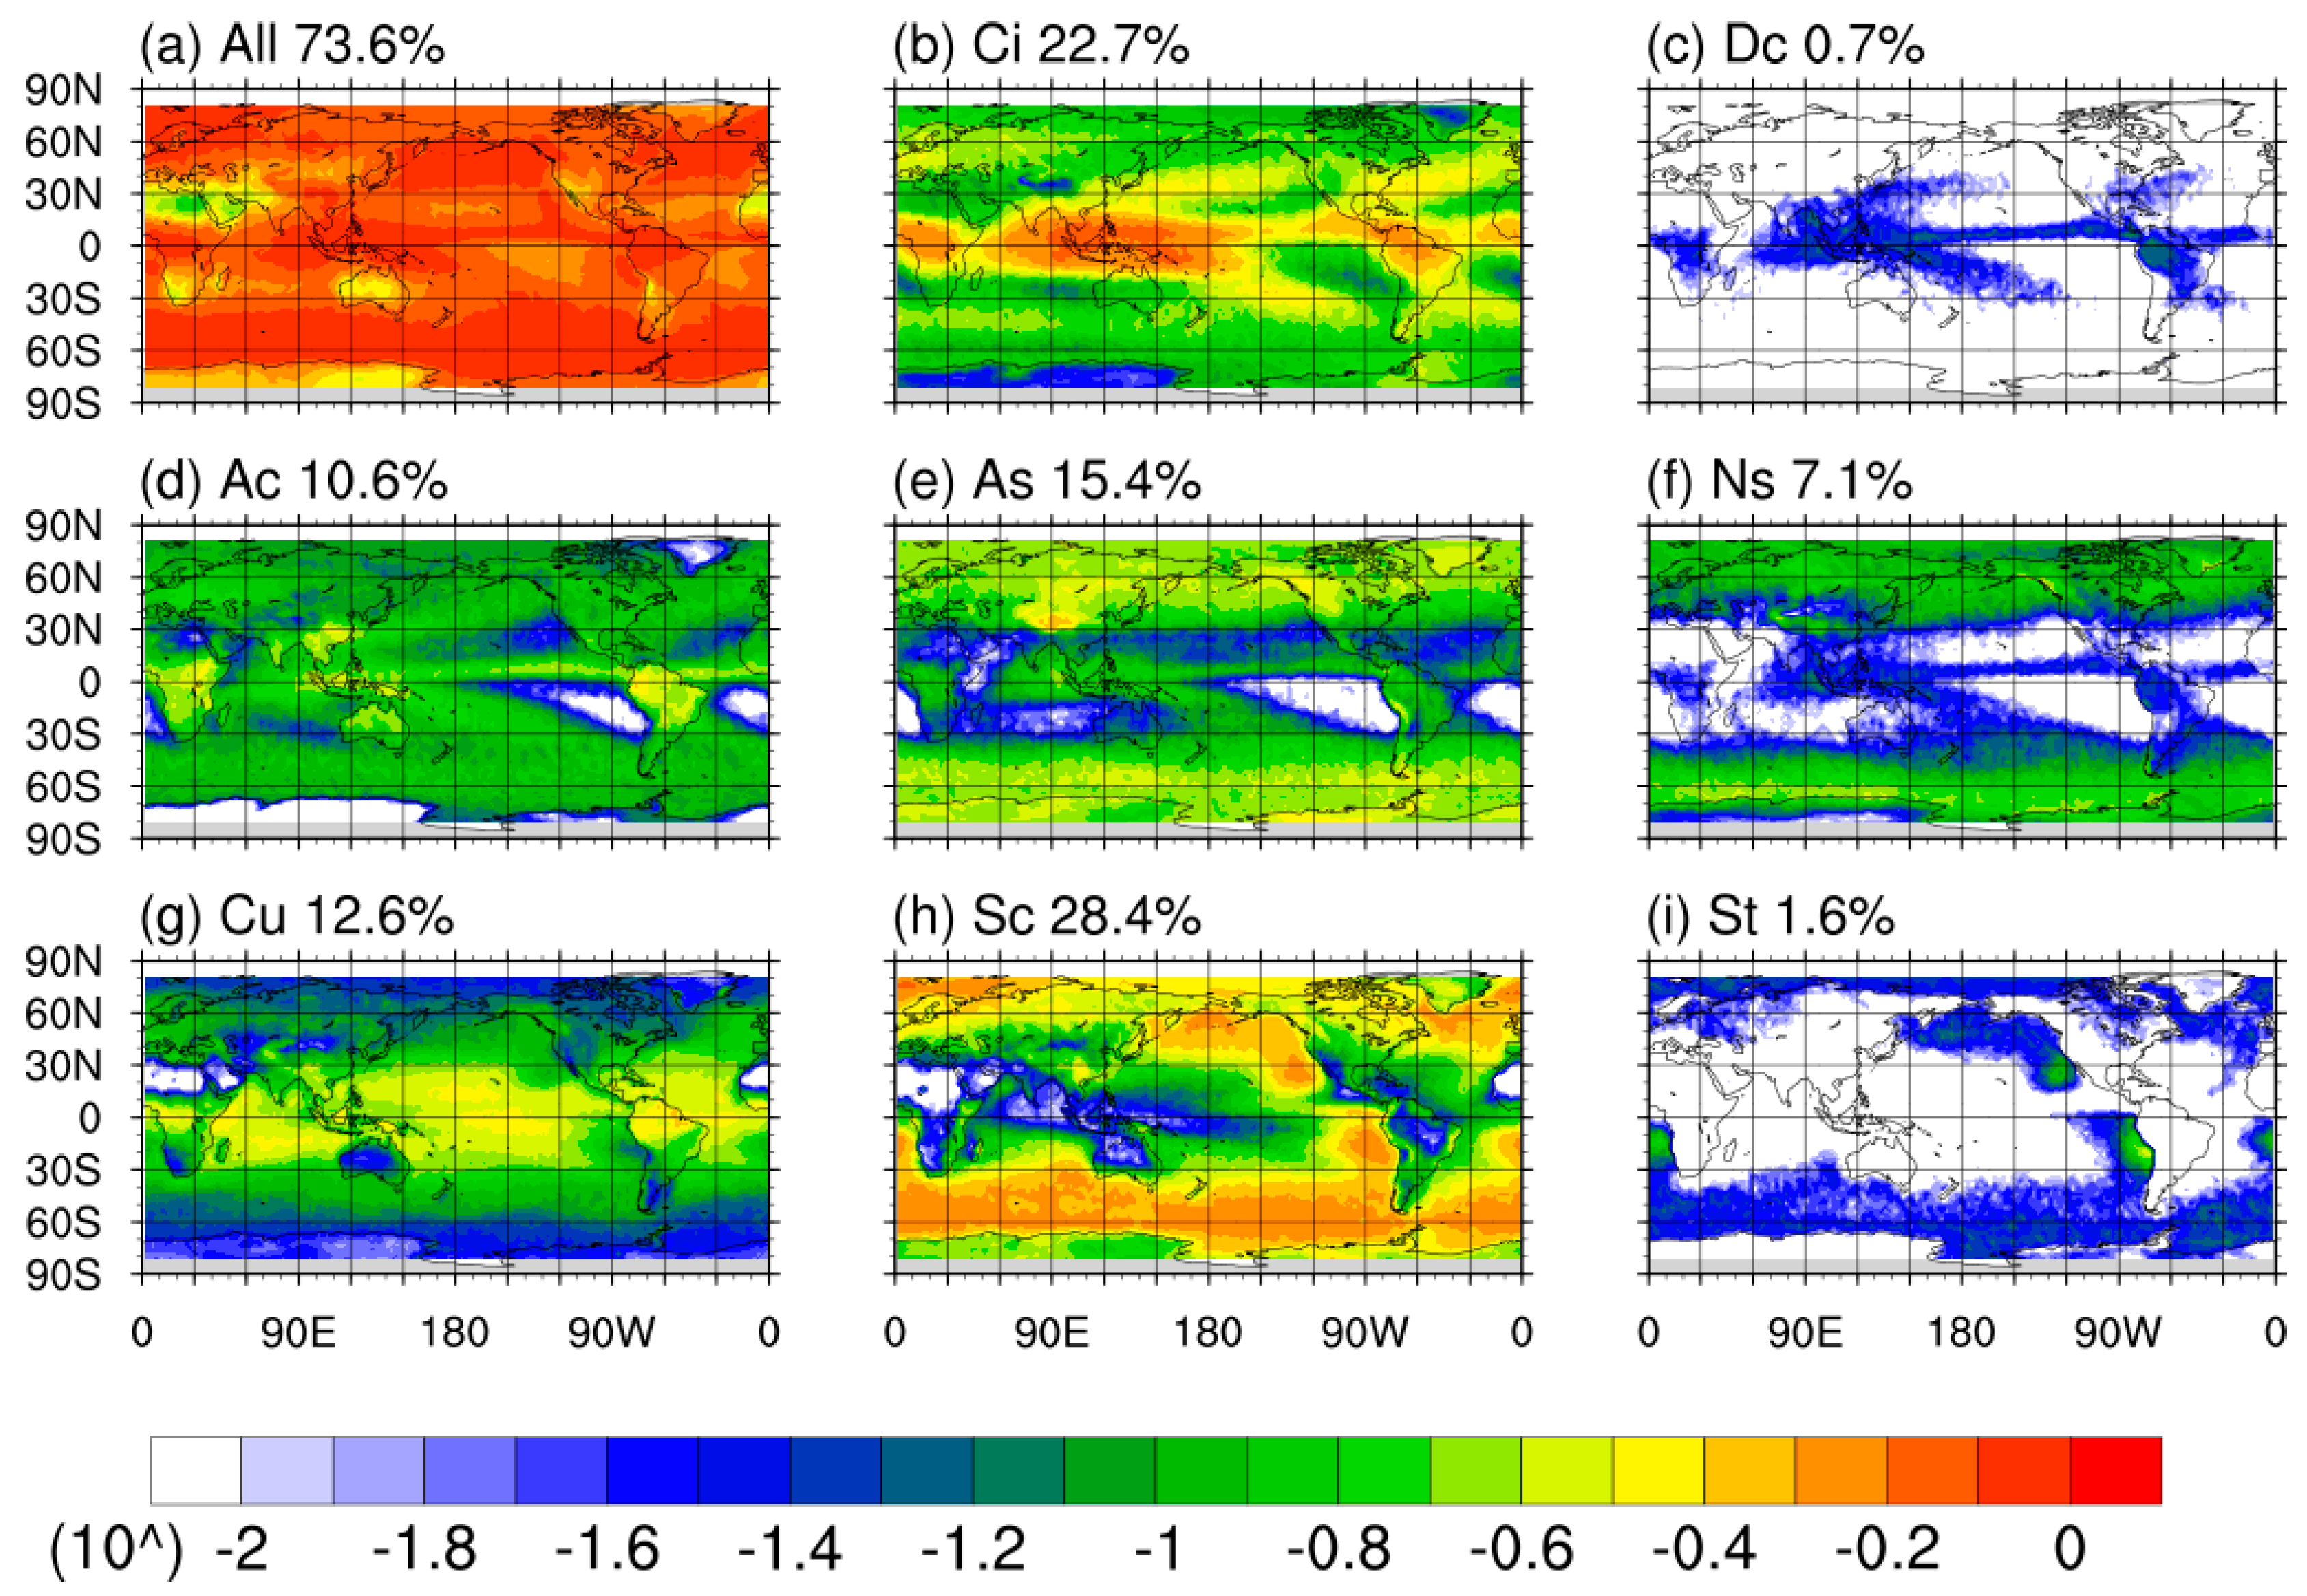
Figure 1. The spatial distribution of cloud area fraction in each horizontal grid (2.5°∗2.5°). The percentage marked for each cloud type is the global average. The logarithmic color scale is used for highlighting spatial contrasts.
Remotesensing 15 03978 g001
Figure 2. The spatial distribution of cloud volume fraction in each atmospheric column (2.5°∗2.5°∗HT). The percentage marked for each cloud type is the global average. The logarithmic color scale is used for highlighting spatial contrasts.
Remotesensing 15 03978 g002
Figure 3. The horizontal distribution of cloud volume fraction of low-level clouds at selected levels (a1c4) and the profile of global average (d).
Remotesensing 15 03978 g003
Figure 4. The horizontal distribution of cloud volume fraction of middle-level clouds at selected levels (a1b6) and the profile of global average (c).
Remotesensing 15 03978 g004
Figure 5. The horizontal distribution of cloud volume fraction of high-level clouds at selected levels (a1a9) and the profile of global average (b).
Remotesensing 15 03978 g005
Figure 6. The horizontal distribution of cloud volume fraction of vertically extending clouds at selected levels (a1b8) and the profile of global average (c).
Remotesensing 15 03978 g006
Figure 7. Mean profiles of cloud volume fraction for cloud types over globe (top row), land (middle row), and ocean (bottom row), as well as in different latitudes.
Remotesensing 15 03978 g007
Figure 8. The proportions of four cloud groups among all clouds at the selected levels. The percentages represent the cloud volume fraction of all clouds at each level.
Remotesensing 15 03978 g008
Figure 9. The proportions of St, Sc, and Cu among low-level clouds at the selected levels. The percentages represent the cloud volume fraction of the low-level clouds at each level.
Remotesensing 15 03978 g009
Figure 10. The proportions of As and Ac among middle-level clouds at the selected levels. The percentages represent the cloud volume fraction of the middle-level clouds at each level.
Remotesensing 15 03978 g010
Figure 11. The proportions of Ns and Dc among vertically extending clouds at the selected levels. The percentages represent the cloud volume fraction of the vertically extending clouds at each level.
Remotesensing 15 03978 g011
Figure 12. The meridional means (a) and zonal means (b) of the proportion of eight cloud types.
Remotesensing 15 03978 g012
Table 1. Peak values and corresponding heights of mean profiles of cloud volume fraction in Figure 7.
AllStScCuAsAcCiNsDc
FullGlobeCloud fraction (%)30.41.016.35.710.04.29.57.00.8
Peak height (km)1.200.961.200.966.723.3612.723.129.36
Low latitudeCloud fraction (%)21.50.58.911.65.13.913.11.61.5
Peak height (km)0.961.201.440.728.645.2813.443.124.56
Middle latitudeCloud fraction (%)37.21.022.64.313.04.79.88.00.4
Peak height (km)1.200.961.201.206.963.3610.562.884.80
High latitudeCloud fraction (%)32.71.418.01.315.14.36.311.70.0
Peak height (km)1.200.961.201.206.003.128.883.364.08
LandGlobeCloud fraction (%)20.90.27.53.311.04.19.16.50.9
Peak height (km)3.121.202.161.926.723.6014.163.849.36
Low latitudeCloud fraction (%)16.90.03.57.25.46.212.71.71.7
Peak height (km)2.401.202.401.928.885.2813.445.765.28
Middle latitudeCloud fraction (%)21.30.28.83.012.74.89.26.30.4
Peak height (km)2.641.201.921.927.203.8410.323.606.00
High latitudeCloud fraction (%)26.60.49.41.115.12.75.69.70.0
Peak height (km)4.321.201.921.926.243.369.123.844.08
OceanGlobeCloud fraction (%)38.21.721.07.79.64.29.87.40.7
Peak height (km)1.200.961.200.966.483.3612.722.409.36
Low latitudeCloud fraction (%)27.20.611.215.25.03.113.31.71.4
Peak height (km)0.960.961.440.728.405.2813.442.644.08
Middle latitudeCloud fraction (%)44.71.327.65.313.24.810.08.60.4
Peak height (km)1.200.961.200.966.723.3610.562.403.84
High latitudeCloud fraction (%)47.42.226.31.615.55.66.814.10.0
Peak height (km)1.200.960.960.965.763.128.642.403.84
Disclaimer/Publisher’s Note: The statements, opinions and data contained in all publications are solely those of the individual author(s) and contributor(s) and not of MDPI and/or the editor(s). MDPI and/or the editor(s) disclaim responsibility for any injury to people or property resulting from any ideas, methods, instructions or products referred to in the content.