


Self-Incremental Learning for Rapid Identification of Collapsed Buildings Triggered by Natural Disasters

Abstract
1. Introduction
2. Related Work
2.1. Building Damage Identification Methods
2.2. Transfer Learning Methods
2.3. Contributions of This Research
3. Data
3.1. Training Data: DREAM-B+
3.2. Test Data
4. Methodology
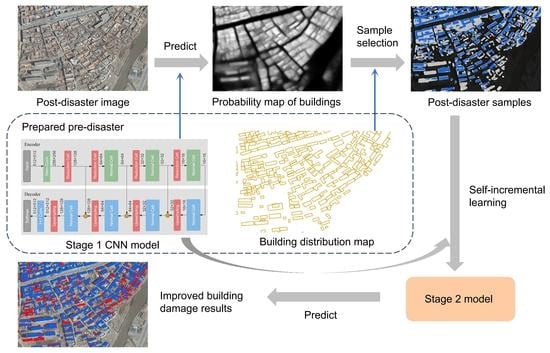
4.1. Overview
4.2. Knowledge-Guided Sample Selection Method
| Algorithm 1 The K-SS method for post-disaster sample selection. |
| Definition: , , …, . , , …, . (). , and the Sample selection: for to do: |
| As for : Building selection: and corresponds to the pre-disaster building category: Not collapsed. and corresponds to the pre-disaster background category: Background. (3) other regions: Ignored. Collapsed building selection: : (1) if : Collapsed. (2) other regions: Ignored. |
| end for. Background screening: As for the regions except : (1) if : Background. (2) other regions: Ignored (may be buildings). |
| Output: Positive samples: Not collapsed. Negative samples: Collapsed and background. Invalid samples: Ignored. |
4.3. Incremental Learning Using the EGB-A
| Algorithm 2 Training algorithm of EGB-A [4]. |
| Input: , and labels, Y ; base learner, ; learning rate of base learner, ; and softmax function, . 1: |
| 2: |
| 3: for to do |
| 4: |
| 5: |
| 6: end for |
| Output: , |
4.4. Experimental Settings and Evaluation Metrics
5. Experimental Results
5.1. Quantitative Evaluation
5.1.1. Post-Disaster Building Recognition
5.1.2. Building Damage Extraction
5.2. Qualitative Analysis
5.3. Failure Example Analysis
6. Discussion
6.1. Comparison of Building Damage Extraction Methods
6.2. Other Sample Selection Methods
6.2.1. Different Numbers of Selected Samples
6.2.2. Overfitting
6.3. Timeliness Analysis
6.4. Performance in Other Natural Disasters
7. Conclusions
- (1)
- The proposed SELF framework can rapidly enhance the building recognition ability of the pre-trained model through self-training by using automatically selected post-disaster samples. The experimental results on the Yushu earthquake and Turkey earthquake show that the Kappa accuracy of the building damage extracted by the optimized model is increased by 6.48% on average compared with the initial stage. In terms of efficiency, the framework can complete the entire process within 6 h and provide a more reliable building damage distribution map.
- (2)
- The K-SS sample selection method can automatically select high-quality post-disaster image samples with the assistance of pre-disaster building distribution map. The designed sample selection modules are based on the probability maps and the Otsu segmentation method, which realizes the targeted screening of collapsed buildings, not collapsed buildings, and other buildings. Compared with other similar sample selection methods, using the samples provided by K-SS can achieve a more significant improvement in accuracy.
- (3)
- The experimental results demonstrate that leveraging the difference in activation values between buildings and their surrounding backgrounds is an effective strategy for selecting key samples for self-training. The building location and shape information provided by the pre-disaster building distribution maps can realize more accurate judgment of the sample category from the object level.
Author Contributions
Funding
Data Availability Statement
Acknowledgments
Conflicts of Interest
References
- Motosaka, M.; Mitsuji, K. Building damage during the 2011 off the Pacific coast of Tohoku Earthquake. Soils Found. 2012, 52, 929–944. [Google Scholar] [CrossRef]
- Wang, X.; Li, P. Extraction of urban building damage using spectral, height and corner information from VHR satellite images and airborne LiDAR data. ISPRS J. Photogramm. Remote Sens. 2020, 159, 322–336. [Google Scholar] [CrossRef]
- Zheng, Z.; Zhong, Y.; Wang, J.; Ma, A.; Zhang, L. Building damage assessment for rapid disaster response with a deep object-based semantic change detection framework: From natural disasters to man-made disasters. Remote Sens. Environ. 2021, 265, 112636. [Google Scholar] [CrossRef]
- Dong, L.; Shan, J. A comprehensive review of earthquake-induced building damage detection with remote sensing techniques. ISPRS J. Photogramm. Remote Sens. 2013, 84, 85–99. [Google Scholar] [CrossRef]
- Brunner, D.; Lemoine, G.; Bruzzone, L. Earthquake damage assessment of buildings using vhr optical and sar imagery. IEEE Trans. Geosci. Remote Sens. 2010, 48, 2403–2420. [Google Scholar] [CrossRef]
- Ge, J.; Tang, H.; Yang, N.; Hu, Y. Rapid identification of damaged buildings using incremental learning with transferred data from historical natural disaster cases. ISPRS J. Photogramm. Remote Sens. 2022, 195, 105–128. [Google Scholar] [CrossRef]
- Bai, Y.; Hu, J.; Su, J.; Liu, X.; Liu, H.; He, X.; Meng, S.; Mas, E.; Koshimura, S. Pyramid pooling module-based semi-siamese network: A benchmark model for assessing building damage from xBD satellite imagery datasets. Remote Sens. 2020, 12, 4055. [Google Scholar] [CrossRef]
- Shen, Y.; Zhu, S.; Yang, T.; Chen, C.; Pan, D.; Chen, J.; Xiao, L.; Du, Q.F. BDANet: Multiscale convolutional neural network with cross-directional attention for building damage assessment from satellite images. IEEE Trans. Geosci. Remote Sens. 2021, 60, 1–14. [Google Scholar] [CrossRef]
- Yang, W.; Zhang, X.; Luo, P. Transferability of convolutional neural network models for identifying damaged buildings due to earthquake. Remote Sens. 2021, 13, 504. [Google Scholar] [CrossRef]
- Hu, Y.; Liu, C.; Li, Z.; Xu, J.; Han, Z.; Guo, J. Few-Shot Building Footprint Shape Classification with Relation Network. ISPRS Int. J. Geo-Inf. 2022, 11, 311. [Google Scholar] [CrossRef]
- Wang, C. Investigation and analysis of building structure damage in Yushu Earthquake. Build. Struct. 2010, 40, 106–109. [Google Scholar] [CrossRef]
- Goodfellow, I.; Pouget-Abadie, J.; Mirza, M.; Xu, B.; Warde-Farley, D.; Ozair, S.; Courville, A.; Bengio, Y. Generative adversarial networks. Adv. Neural Inf. Process. Syst. 2014, 3, 2672–2680. [Google Scholar] [CrossRef]
- Park, T.; Efros, A.; Zhang, R.; Zhu, J. Contrastive learning for unpaired image-to-image translation. In Proceedings of the Computer Vision–ECCV 2020: 16th European Conference, Glasgow, UK, 23–28 August 2020. Proceedings, Part IX 16. [Google Scholar] [CrossRef]
- Hu, Y.; Tang, H. On the generalization ability of a global model for rapid building mapping from heterogeneous satellite images of multiple natural disaster scenarios. Remote Sens. 2021, 13, 984. [Google Scholar] [CrossRef]
- Ring, M.B. Continual Learning in Reinforcement Environments. Ph.D. Thesis, University of Texas at Austin, Austin, TX, USA, 1994. Available online: https://www.researchgate.net/publication/2600799 (accessed on 10 April 2023).
- Yang, N.; Tang, H. GeoBoost: An incremental deep learning approach toward global mapping of buildings from VHR remote sensing images. Remote Sens. 2020, 12, 1794. [Google Scholar] [CrossRef]
- Weber, E.; Kan, H. Building disaster damage assessment in satellite imagery with multi-temporal fusion. arXiv 2020, arXiv:2004.05525. [Google Scholar] [CrossRef]
- Durnov, V. xview2 First Place Framework. 2020. Available online: https://github.com/DIUx-xView/xView2_first_place (accessed on 10 April 2023).
- Li, X.; Yang, W.; Ao, T.; Li, H.; Chen, W. An improved approach of information extraction for earthquake-damaged buildings using high-resolution imagery. J. Earthq. Tsunami 2011, 5, 389–399. [Google Scholar] [CrossRef]
- Miura, H.; Aridome, T.; Matsuoka, M. Deep learning-based identification of collapsed, non-collapsed and blue tarp-covered buildings from post-disaster aerial images. Remote Sens. 2020, 12, 1924. [Google Scholar] [CrossRef]
- Ma, J.; Qin, S. Automatic depicting algorithm of earthquake collapsed buildings with airborne high resolution image. In Proceedings of the 2012 IEEE International Geoscience and Remote Sensing Symposium, Munich, Germany, 22–27 July 2012; IEEE: Munich, Germany, 2012; pp. 939–942. [Google Scholar] [CrossRef]
- Munsif, M.; Afridi, H.; Ullah, M.; Khan, S.D.; Cheikh, F.A.; Sajjad, M. A lightweight convolution neural network for automatic disasters recognition. In Proceedings of the 2022 10th European Workshop on Visual Information Processing (EUVIP), Lisbon, Portugal, 11–14 September 2022. [Google Scholar] [CrossRef]
- Nia, K.R.; Mori, G. Building damage assessment using deep learning and ground-level image data. In Proceedings of the 2017 14th Conference on Computer and Robot Vision (CRV), Edmonton, AB, Canada, 16–19 May 2017. [Google Scholar] [CrossRef]
- Qing, Y.; Ming, D.; Wen, Q.; Weng, Q.; Xu, L.; Chen, Y.; Zhang, Y.; Zeng, B. Operational earthquake-induced building damage assessment using CNN-based direct remote sensing change detection on superpixel level. Int. J. Appl. Earth Obs. Geoinf. 2022, 112, 102899. [Google Scholar] [CrossRef]
- Tilon, S.; Nex, F.; Kerle, N.; Vosselman, G. Post-disaster building damage detection from earth observation imagery using unsupervised and transferable anomaly detecting generative adversarial networks. Remote Sens. 2020, 12, 4193. [Google Scholar] [CrossRef]
- Galanis, M.; Rao, K.; Yao, X.; Tsai, Y.; Ventura, J. Damagemap: A post-wildfire damaged buildings classifier. Int. J. Disaster Risk Reduct. 2021, 65, 102540. [Google Scholar] [CrossRef]
- Liu, X.; Liu, Z.; Wang, G.; Zhang, H. Ensemble transfer learning algorithm. IEEE Access 2017, 6, 2389–2396. [Google Scholar] [CrossRef]
- Gu, X.; Zhang, C.; Shen, Q.; Han, J.; Plamen, P.A.; Peter, M.A. A self-training hierarchical prototype-based ensemble framework for remote sensing scene classification. Inf. Fusion 2022, 80, 179–204. [Google Scholar] [CrossRef]
- Hoffman, J.; Tzeng, E.; Park, T.; Zhu, J. CyCADA: Cycle-consistent adversarial domain adaptation. In Proceedings of the 35th International Conference on Machine Learning, Stockholm, Sweden, 10–15 July 2018. [Google Scholar] [CrossRef]
- Tasar, O.; Giros, A.; Tarabalka, Y.; Alliez, P.; Clerc, S. Daugnet: Unsupervised, multisource, multitarget, and life-long domain adaptation for semantic segmentation of satellite images. IEEE Trans. Geosci. Remote Sens. 2020, 59, 1067–1081. [Google Scholar] [CrossRef]
- Na, J.; Jung, H.; Chang, H.; Hwang, W. Fixbi: Bridging domain spaces for unsupervised domain adaptation. In Proceedings of the IEEE/CVF Conference on Computer Vision and Pattern Recognition, Nashville, TN, USA, 20–25 June 2021. [Google Scholar] [CrossRef]
- Zhao, Z.; Chen, Y.; Liu, J.; Shen, Z.; Liu, M. Cross-people mobile-phone based activity recognition. In Proceedings of the Twenty-Second International Joint Conference on Artificial Intelligence, Barcelona, Spain, 16–22 July 2011. [Google Scholar] [CrossRef]
- Lin, Q.; Ci, T.; Wang, L.; Mondal, S.; Yin, H.; Wang, Y. Transfer learning for improving seismic building damage assessment. Remote Sens. 2022, 14, 201. [Google Scholar] [CrossRef]
- Antoniou, A.; Storkey, A.; Edwards, H. Data augmentation generative adversarial networks. arXiv 2017, arXiv:1711.04340. [Google Scholar] [CrossRef]
- Wang, J.; Xu, C.; Shen, W. The Coseismic Coulomb Stress Changes Induced by the 2010 Mw 6.9 Yushu Earthquake, China and Its Implication to Earthquake Hazards. Geomat. Inf. Sci. Wuhan Univ. 2012, 37, 1207–1211. (In Chinese) [Google Scholar] [CrossRef]
- Robinson, C.; Gupta, R.; Fobi Nsutezo, S.; Pound, E.; Ortiz, A.; Rosa, M.; White, K.; Dodhia, R.; Zolli, A.; Birge, C.; et al. Turkey Building Damage Assessment. 2023. Available online: https://www.microsoft.com/en-us/research/publication/turkey-earthquake-report/ (accessed on 10 April 2023).
- Otsu, N. A thresholding selection method from gray level histogram. IEEE Trans. Syst. Man Cybern. 1979, 9, 62–66. [Google Scholar] [CrossRef]
- Zoph, B.; Vasudevan, V.; Shlens, J.; Le, Q.V. Learning transferable architectures for scalable image recognition. In Proceedings of the IEEE Conference on Computer Vision and Pattern Recognition, Salt Lake City, UT, USA, 18–22 June 2018; pp. 8697–8710. Available online: https://arxiv.org/abs/1707.07012 (accessed on 10 April 2023).
- Ronneberger, O.; Fischer, P.; Brox, T. U-net: Convolutional networks for biomedical image segmentation. In International Conference on Medical Image Computing and Computer-Assisted Intervention; Springer: Berlin/Heidelberg, Germany, 2015; pp. 234–241. [Google Scholar] [CrossRef]
- Kingma, D.; Ba, J. Adam: A method for stochastic optimization. arXiv 2014, arXiv:1412.6980. Available online: https://arxiv.org/abs/1412.6980 (accessed on 10 April 2023).
- Loshchilov, I.; Hutter, F. SGDR: Stochastic gradient descent with warm restarts. arXiv 2016, arXiv:1608.03983. Available online: https://arxiv.org/abs/1608.03983 (accessed on 11 April 2023).
- Everingham, M.; Eslami, S.; Gool, L.V.; Williams, C.; Winn, J.; Zisserman, A. The pascal visual object classes challenge: A retrospective. Int. J. Comput. Vis. 2010, 88, 303–338. [Google Scholar] [CrossRef]
- Landis, J.R.; Koch, G.G. The measurement of observer agreement for categorical data. Biometrics 1977, 33, 159–174. [Google Scholar] [CrossRef] [PubMed]
- Guo, Y.; Ding, G.; Yue, G.; Wang, J. Semi-Supervised Active Learning with Cross-Class Sample Transfer; AAAI Press: Washington, DC, USA, 2016; pp. 1526–1532. Available online: https://dl.acm.org/doi/abs/10.5555/3060832.3060834 (accessed on 11 April 2023).
- Wang, H.; Sun, G.; Ouyang, C.; Liu, J. Phases of earthquake emergency response period. J. Catastrophology 2013, 28, 166–169. (In Chinese) [Google Scholar]
- Gupta, R.; Hosfelt, R.; Sajeev, S.; Patel, N.; Goodman, B.; Doshi, J.; Heim, E.; Choset, H.; Gaston, M. xBD: A dataset for assessing building damage from satellite imagery. arXiv 2019, arXiv:1911.09296. Available online: https://arxiv.org/abs/1911.09296 (accessed on 11 April 2023).


| Cases | Data | Source | Bands | Acquisition Time | Resolution |
|---|---|---|---|---|---|
| Yushu | Post-disaster image | Aerial platform | RGB | April 2010 | 0.5 m |
| Pre-disaster image | Quickbird | 6 November 2004 | 0.6 m | ||
| Pre-disaster building distribution map | Visual interpretation | / | 0.5 m | ||
| Turkey | Post-disaster image | Worldview-3 | RGB | February 2023 | 0.3 m |
| Pre-disaster building distribution map | Microsoft | / | 2023 |
| Data | Category | Class Label | Detailed Category |
|---|---|---|---|
| Pre-disaster | Building | Positive | / |
| Background | Negative | ||
| Post-disaster | Building | Positive | Not collapsed building |
| Other building | |||
| Background | Negative | Collapsed building | |
| Original background |
| Cases | Stages | IoU | F1 Score | Recall | Precision | OA |
|---|---|---|---|---|---|---|
| Yushu | Stage 1 | 0.4286 | 0.6001 | 0.4953 | 0.7609 | 0.9603 |
| Stage 2 | 0.5686 | 0.7249 | 0.7108 | 0.7397 | 0.9676 | |
| Turkey | Stage 1 | 0.4998 | 0.6665 | 0.5971 | 0.7542 | 0.9788 |
| Stage 2 | 0.5721 | 0.7278 | 0.6705 | 0.7957 | 0.9822 |
| Cases | Stages | Kappa | OA | PA | UA |
|---|---|---|---|---|---|
| Yushu | stage 1 | 0.7379 | 0.9303 | 0.9126 | 0.6931 |
| stage 2 | 0.8267 | 0.9676 | 0.9021 | 0.7998 | |
| Turkey | stage 1 | 0.7281 | 0.9788 | 0.8656 | 0.2741 |
| stage 2 | 0.7688 | 0.9880 | 0.8387 | 0.2852 |
| Cases | Methods | Kappa | OA | PA | UA |
|---|---|---|---|---|---|
| Yushu | SELF | 0.8267 | 0.9676 | 0.9021 | 0.7998 |
| Incre-Trans | 0.7521 | 0.9508 | 0.8468 | 0.7617 | |
| BDANet | 0.5819 | 0.9365 | 0.4752 | 0.4350 | |
| ChangeOS | 0.4672 | 0.8926 | 0.3487 | 0.4785 | |
| Turkey | SELF | 0.7688 | 0.9880 | 0.8387 | 0.2852 |
| Incre-Trans | 0.7582 | 0.9814 | 0.8694 | 0.2829 |
| Methods | Type | Incremental Learning | Required Images | Result Level |
|---|---|---|---|---|
| SELF | Post-classification comparison | Yes | Post-disaster | Pixel level |
| Incre-Trans | Pre- and post-disaster | |||
| BDANet | Change detection | No | Object level | |
| ChangeOS |
| Methods | Epoch | IoU | F1 Score | Recall | Precision | OA |
|---|---|---|---|---|---|---|
| Top 50% | 5 | 0.4698 | 0.6393 | 0.7853 | 0.5391 | 0.9467 |
| Top 70% | 5 | 0.4845 | 0.6528 | 0.8104 | 0.5465 | 0.9482 |
| Top 90% | 100 | 0.4877 | 0.6556 | 0.7807 | 0.5651 | 0.9507 |
| Top 99% | 80 | 0.4813 | 0.6499 | 0.5339 | 0.8301 | 0.9654 |
| Ours | 100 | 0.5686 | 0.7249 | 0.7108 | 0.7397 | 0.9676 |
| Methods | Epoch | Kappa | OA | PA | UA |
|---|---|---|---|---|---|
| Top 50% | 5 | 0.7431 | 0.9467 | 0.7923 | 0.8299 |
| Top 70% | 5 | 0.7509 | 0.9482 | 0.7860 | 0.8420 |
| Top 90% | 100 | 0.7585 | 0.9507 | 0.8044 | 0.8236 |
| Top 99% | 80 | 0.8051 | 0.9654 | 0.9548 | 0.7152 |
| Ours | 100 | 0.8267 | 0.9676 | 0.9021 | 0.7998 |
| Cases | Event Date | Country |
|---|---|---|
| Joplin, MO Tornado | 22 May 2011 | America |
| Santa Rosa Wildfires | 8–31 October 2017 | |
| Palu Tsunami | 18 September 2018 | Indonesia |
| Cases | Stages | Kappa | OA | PA | UA |
|---|---|---|---|---|---|
| Joplin, MO Tornado | Stage 1 | 0.7444 | 0.9559 | 0.8794 | 0.3915 |
| Stage 2 | 0.7922 | 0.9618 | 0.8290 | 0.5587 | |
| Santa Rosa Wildfires | Stage 1 | 0.7419 | 0.9706 | 0.8969 | 0.4008 |
| Stage 2 | 0.7617 | 0.9707 | 0.8910 | 0.5224 | |
| Palu Tsunami | Stage 1 | 0.6530 | 0.9151 | 0.8395 | 0.2325 |
| Stage 2 | 0.6936 | 0.9177 | 0.7969 | 0.3634 |
Disclaimer/Publisher’s Note: The statements, opinions and data contained in all publications are solely those of the individual author(s) and contributor(s) and not of MDPI and/or the editor(s). MDPI and/or the editor(s) disclaim responsibility for any injury to people or property resulting from any ideas, methods, instructions or products referred to in the content. |
© 2023 by the authors. Licensee MDPI, Basel, Switzerland. This article is an open access article distributed under the terms and conditions of the Creative Commons Attribution (CC BY) license (https://creativecommons.org/licenses/by/4.0/).
Share and Cite
Ge, J.; Tang, H.; Ji, C. Self-Incremental Learning for Rapid Identification of Collapsed Buildings Triggered by Natural Disasters. Remote Sens. 2023, 15, 3909. https://doi.org/10.3390/rs15153909
Ge J, Tang H, Ji C. Self-Incremental Learning for Rapid Identification of Collapsed Buildings Triggered by Natural Disasters. Remote Sensing. 2023; 15(15):3909. https://doi.org/10.3390/rs15153909
Chicago/Turabian StyleGe, Jiayi, Hong Tang, and Chao Ji. 2023. "Self-Incremental Learning for Rapid Identification of Collapsed Buildings Triggered by Natural Disasters" Remote Sensing 15, no. 15: 3909. https://doi.org/10.3390/rs15153909
APA StyleGe, J., Tang, H., & Ji, C. (2023). Self-Incremental Learning for Rapid Identification of Collapsed Buildings Triggered by Natural Disasters. Remote Sensing, 15(15), 3909. https://doi.org/10.3390/rs15153909