Article

Inshore Ship Detection Based on Multi-Modality Saliency for Synthetic Aperture Radar Images

1
Multisensor Intelligent Detection and Recognition Technologies R&D Center of CASC, Chengdu 610100, China
2
School of Information and Communication Engineering, University of Electronic Science and Technology of China, Chengdu 610097, China
*
Author to whom correspondence should be addressed.
Remote Sens. 2023, 15(15), 3868; https://doi.org/10.3390/rs15153868
Submission received: 19 June 2023 / Revised: 28 July 2023 / Accepted: 30 July 2023 / Published: 4 August 2023
(This article belongs to the Special Issue Applications of Synthetic Aperture Radar (SAR) in Target Detection)

Abstract

:
Synthetic aperture radar (SAR) ship detection is of significant importance in military and commercial applications. However, a high similarity in intensity and spatial distribution of scattering characteristics between the ship target and harbor facilities, along with a fuzzy sea-land boundary due to the strong speckle noise, result in a low detection accuracy and high false alarm rate for SAR ship detection with complex inshore scenes. In this paper, a new inshore ship detection method based on multi-modality saliency is proposed to overcome these challenges. Four saliency maps are established from different perspectives: an ocean-buffer saliency map (OBSM) outlining more accurate coastline under speckle noises; a local stability saliency map (LSSM) addressing pixel spatial distribution; a super-pixel saliency map (SPSM) extracting critical region-based features for inshore ship detection; and an intensity saliency map (ISM) to highlight target pixels with intensity distribution. By combining these saliency maps, ship targets in complex inshore scenes can be successfully detected. The method provides a novel interdisciplinary perspective (surface metrology) for SAR image segmentation, discovers the difference in spatial characteristics of SAR image elements, and proposes a novel robust CFAR procedure for background clutter fitting. Experiments on a public SAR ship detection dataset (SSDD) shows that our method achieves excellent detection performance, with a low false alarm rate, in offshore scenes, inshore scenes, inshore scenes with confusing metallic port facilities, and large-scale scenes. The results outperform several widely used methods, such as CFAR-based methods and super-pixel methods.

Graphical Abstract

1. Introduction

Ship detection in synthetic aperture radar (SAR) images has significant implications for various military and commercial domains, such as maritime surveillance and military reconnaissance [1]. Despite the considerable advances in ship detection techniques over the years, most existing methods are tailored to offshore ship detection, i.e., ships in a marine area, and have limited applicability to inshore ship detection [2]. Compared to offshore ship detection, inshore ship detection poses several challenges. First, the background consists of both ocean and harbor/land region, which complicates the estimation of background clutter. Second, ships and harbor facilities have similar scattering characteristics in terms of intensity and spatial distribution, resulting in high false alarms. Third, land/dock area and ships may be connected, leading to low detection accuracy. Last, the contour and edge features are difficult to extract accurately due to the intrinsic multiplicative speckle noise [3]. Therefore, SAR ship detection for inshore scenes still represents the most challenging scenario in SAR target detection.
The most fundamental feature in SAR target detection is the amplitude; as a result, the constant false alarm rate (CFAR) detection method, which lays a particular emphasis on the amplitude feature, has become the most widely used algorithm for SAR ship detection [4]. The CFAR detection methods model the statistical distribution of the background clutters to get an adaptive threshold, and then search for pixels that are unusually bright compared to the surrounding background clutters [5]. It typically achieves good performance in offshore scenes since ships tend to appear as small bright targets with discernible shape information [6]. However, for inshore scenes, the conditions are totally different, and several problems appear for the traditional CFAR detection. The CFAR methods focus on pixel level and cannot identify whether adjacent pixels belong to a target or clutter regions. Therefore, in most cases, it requires further morphological procedures to cluster pixels [7]. For inshore ship detection, this morphological clustering will connect ship pixels with strong land clutters, resulting in false negative detections. Another problem mainly arises in scenes with large targets or large parts of high intensity land clutters. The distribution weight of high intensities is so large that the statistical fitting for background clutters tends to exhibit excess kurtosis and a long tail. This inaccurate fitting usually gives a higher intensity threshold, resulting in the loss of detected ship structures such as holes and fractures [2,8,9,10].
Motivated by the target pixel clustering requirements, some researchers employ the super-pixel (SP) method to overcome the inshore ship detection challenge. The SP methods typically returns a set of locally coherent pixels, which benefits the extraction of region-based features [11,12]. The simple linear iterative clustering (SLIC) segmentation method [13] and the maximally stable extremal regions (MSER) method [14] are the two most widely used SP methods in SAR target detection. SLIC adopts k-means clustering to generate SPs, which cover the whole image region, whether it is the ship target or background clutter. Therefore, the extracted SP features have to be labeled by a CFAR detector or some prior knowledge. The main problem of SLIC is the inherent over-segmentation, leading to excessive computational resources allocated for quantities of background clutter SPs (BCSPs), while the ship target SPs (STSPs) are much fewer [8]. In addition, the number of total SPs is normally predetermined in SLIC, so when there exists strong noise, the target region cannot be outlined accurately, and the achieved SPs will include both true target region and the surrounding speckle noise [2,8].
The MSER method is another category of SP methods, which defines the feature blobs by the extremal property of the intensity function in the blob region and on its outer boundary. The MSER method can return a more accurate contour of the target region, even with strong speckle noise, and typically finds only the bright regions, which avoids the over-segmentation. However, a batch of nested MSER regions may be generated in a specific area since there are noise and numbers of local height extrema in real SAR images [15]. In addition, the extracted regions of harbor facilities and ship targets are quite similar, and the absence of background clutter patches makes it impossible to exclude false alarms by comparison. Therefore, such approaches often also require accurate and robust sea–land segmentation. However, current sea–land segmentation approaches are generally designed based on an amplitude segmentation method, such as the OTSU method, and are quite sensitive to dense speckle noise and strong sea clutter [2,16,17], resulting in inaccurate sea–land boundaries.
Motivated by the successful application of the human attention theory in optical remote sensing images [18], saliency analysis has been introduced to SAR target detection [19,20]. The commonly used saliency in SAR detection is considered as a perceptual feature that describes the prominence of an object or location compared to its contextual surroundings and easily attracts visual attention [21] for small and weak target detection. For inshore ship detection, the key challenge is the false alarm in harbor region and inaccurate sea–land segmentation instead of small and weak targets. As a result, the common saliency is not suitable for our problem. In this paper, a broader saliency is defined to alleviate the complexity caused by dense speckle noises, harbor facilities, and strong sea–land clutters for more accurate sea–land segmentation and a lower false alarm rate.
With the rapid development of deep learning, the convolution neural network (CNN) based methods are gradually used in SAR ship detection [22,23,24,25,26,27]. The data-driven deep learning approaches can build an end-to-end system to learn the hierarchical features automatically and detect ship targets simultaneously without human intervention and have realized state-of-the-art detection performance on widely used benchmark datasets. However, such performance usually requires a large amount of data, and the fundamental assumption that training and test data are identically and independently distributed (a.k.a. i.i.d. assumption) [28]. In most datasets, the inshore scenario is relatively scarce compared to the offshore scenario, making it harder to satisfy the i.i.d. assumption. Some studies found that the CNN based detectors tend to be weaker on inshore ship detection because the features extracted by convolution are easily affected by noise. In some extreme cases, changing one pixel can lead to totally different detection results [29]. Additional constraints are usually required to achieve reliable predictions under non i.i.d. assumption, but the prediction of most current deep models is short of a physical explanation. In consideration of the special physical characteristics underlying SAR images, it is promising to combine the data-driven CNN methods with traditional model-driven methods to enhance the interpretability and generalization in the future [30]. Therefore, a reliable model-driven method can still be a boost and supplement for the future development of CNN based models.
In this paper, we propose a multi-modality saliency (MMS) method for ship detection in SAR images of complex inshore scenes with similar port facilities. The method extracts four types of modality information from the images: the MSER feature, the scale feature, the spatial distribution feature, and the intensity distribution feature. Each type of feature is converted into a saliency map: the super-pixel saliency map (SPSM), the ocean-buffer saliency map (OBSM), the local stability saliency map (LSSM), and the intensity saliency map (ISM). The method combines these saliency maps to detect ships with accurate contours and exclude false alarms with low stability, weak intensity, or located in land regions. The main contributions of this paper are as follows:
  • This paper provides a novel interdisciplinary perspective of surface metrology for SAR image segmentation by addressing the scale difference of the main elements of SAR images with the suitable usage of a second-order Gaussian regression filter.
  • This paper defines the spatial characteristics of SAR image elements as the local stability calculated by the moving standard deviation. It discovers distinct differences in the local stability between ships, sea regions, land regions, and connections between the sea and other elements, which demonstrates the detection effectiveness of the proposed local stability.
  • This paper proposes a novel robust constant false alarm rate (CFAR) procedure that can eliminate noise and large ships’ effects on background clutters’ statistical fitting. This procedure can also be widely used for fitting other distributions.

2. Related Works

In the following, we review several bodies of literature that are relevant to the objective of our paper.

2.1. Constant False Alarm Rate (CFAR) Based Method

Some studies take CFAR detection as a preprocessing procedure, and adopt further refinement procedures to exclude false alarms, e.g., Ao and Xu used a Gamma distribution based CFAR detector to refine the land–sea segmentation from the global 250 m water mask database, then used the Eigen–ellipse to exclude non-ship objects [31]. Wang et al. applied a diagonal ship–island ratio enhance operator to the CFAR detected image to weaken the non-ship pixel clusters, and a morphological erosion can be further applied to eliminate the island elements [32]. Other studies focused on improving the fitting ability of CFAR, e.g., Leng et al. proposed a bilateral CFAR method to reduce the influence of SAR ambiguities and sea clutter, by means of a combination of the intensity distribution and the spatial distribution of SAR images [4]. Tao et al. employed a mixture of Gamma distribution with truncated statistics to fit inhomogeneous background clutters [9]. In our work, we propose a robust CFAR approach to lessen the influence of high intensity land clutters and large targets.

2.2. Super-Pixel (SP) Method

One crucial point for the SP method is how to locate the fewest ship target SPs (STSPs) among the numerous over-segmented results. Wang et al. proposed a density feature to locate STSPs [7]. Liu et al. proposed a weighted information entropy feature to discriminate STSPs [8]. Wang et al. proposed a fluctuation feature to discriminate STSPs [2]. Lin et al. designed a Fisher feature vector at the super-pixel level, which can better describe the feature differences between the STSPs and BCSPs [33]. However, these features address poor discriminative ability when the intensity and spatial distributions of ship and harbor facility pixels are similar. In addition, their results show that the SLIC method cannot accurately outline the target region when strong noise exists. In our work, we employ the MSER method to avoid over-segmentation and propose a nested feature removal method to reduce the consumption of computational resources.

2.3. Saliency

The method based on visual saliency simulates the visual information processing mechanism in nature and designs multiple filters to decompose SAR images to obtain features such as target grayscale, direction, and texture. This method first extracts the salient regions of the whole scene, then studies the spatial relationship of local features, selects some relatively optimized features to retain local salient pixels, and finally constructs the visual saliency map of the scene. Cui et al. designed a new saliency detector for polarized SAR ship detection through similarity testing [34], while Yang et al. designed a curvature-based saliency detector based on the microstructural characteristics of statistical manifolds [35]. There are also studies using saliency on inshore ship detection [3,36], but it seemed that methods based on singular saliency result in port facilities that are visually such as ships being difficult to distinguish, resulting in limited detection accuracy of complex scenes. The proposed multi-modality saliency method in this article is mainly inspired by the concept of saliency.

2.4. Convolutional Neural Network (CNN)

Although the learned features are more abstract and difficult for humans to understand, the CNN based methods have attracted more and more attention due to their significant advantages such as higher accuracy, faster speed, and simpler design processes. Qian et al. proposed a novel object detection method based on improved bounding box regression and multi-level features fusion to improve the precision of object localization [25]. An et al. proposed a DrBox-v2 detector, with a multi-layer prior box generation strategy for small scale targets, a modified encoding scheme for more precisely estimating the position and orientation of targets, and a focal loss (FL) combined with hard negative mining (HNM) technique to mitigate the issue of the imbalance between positive and negative samples [37]. Chen et al. designed a deep neural network based on an attention mechanism, using GloU loss to detect ships in multi-scale and complex scenes [38,39]. As we mentioned before, the CNN based detection methods are outside of the scope of this article, but the proposed MMS method can be a boost and supplement for the future CNN based methods.

3. Materials and Methods

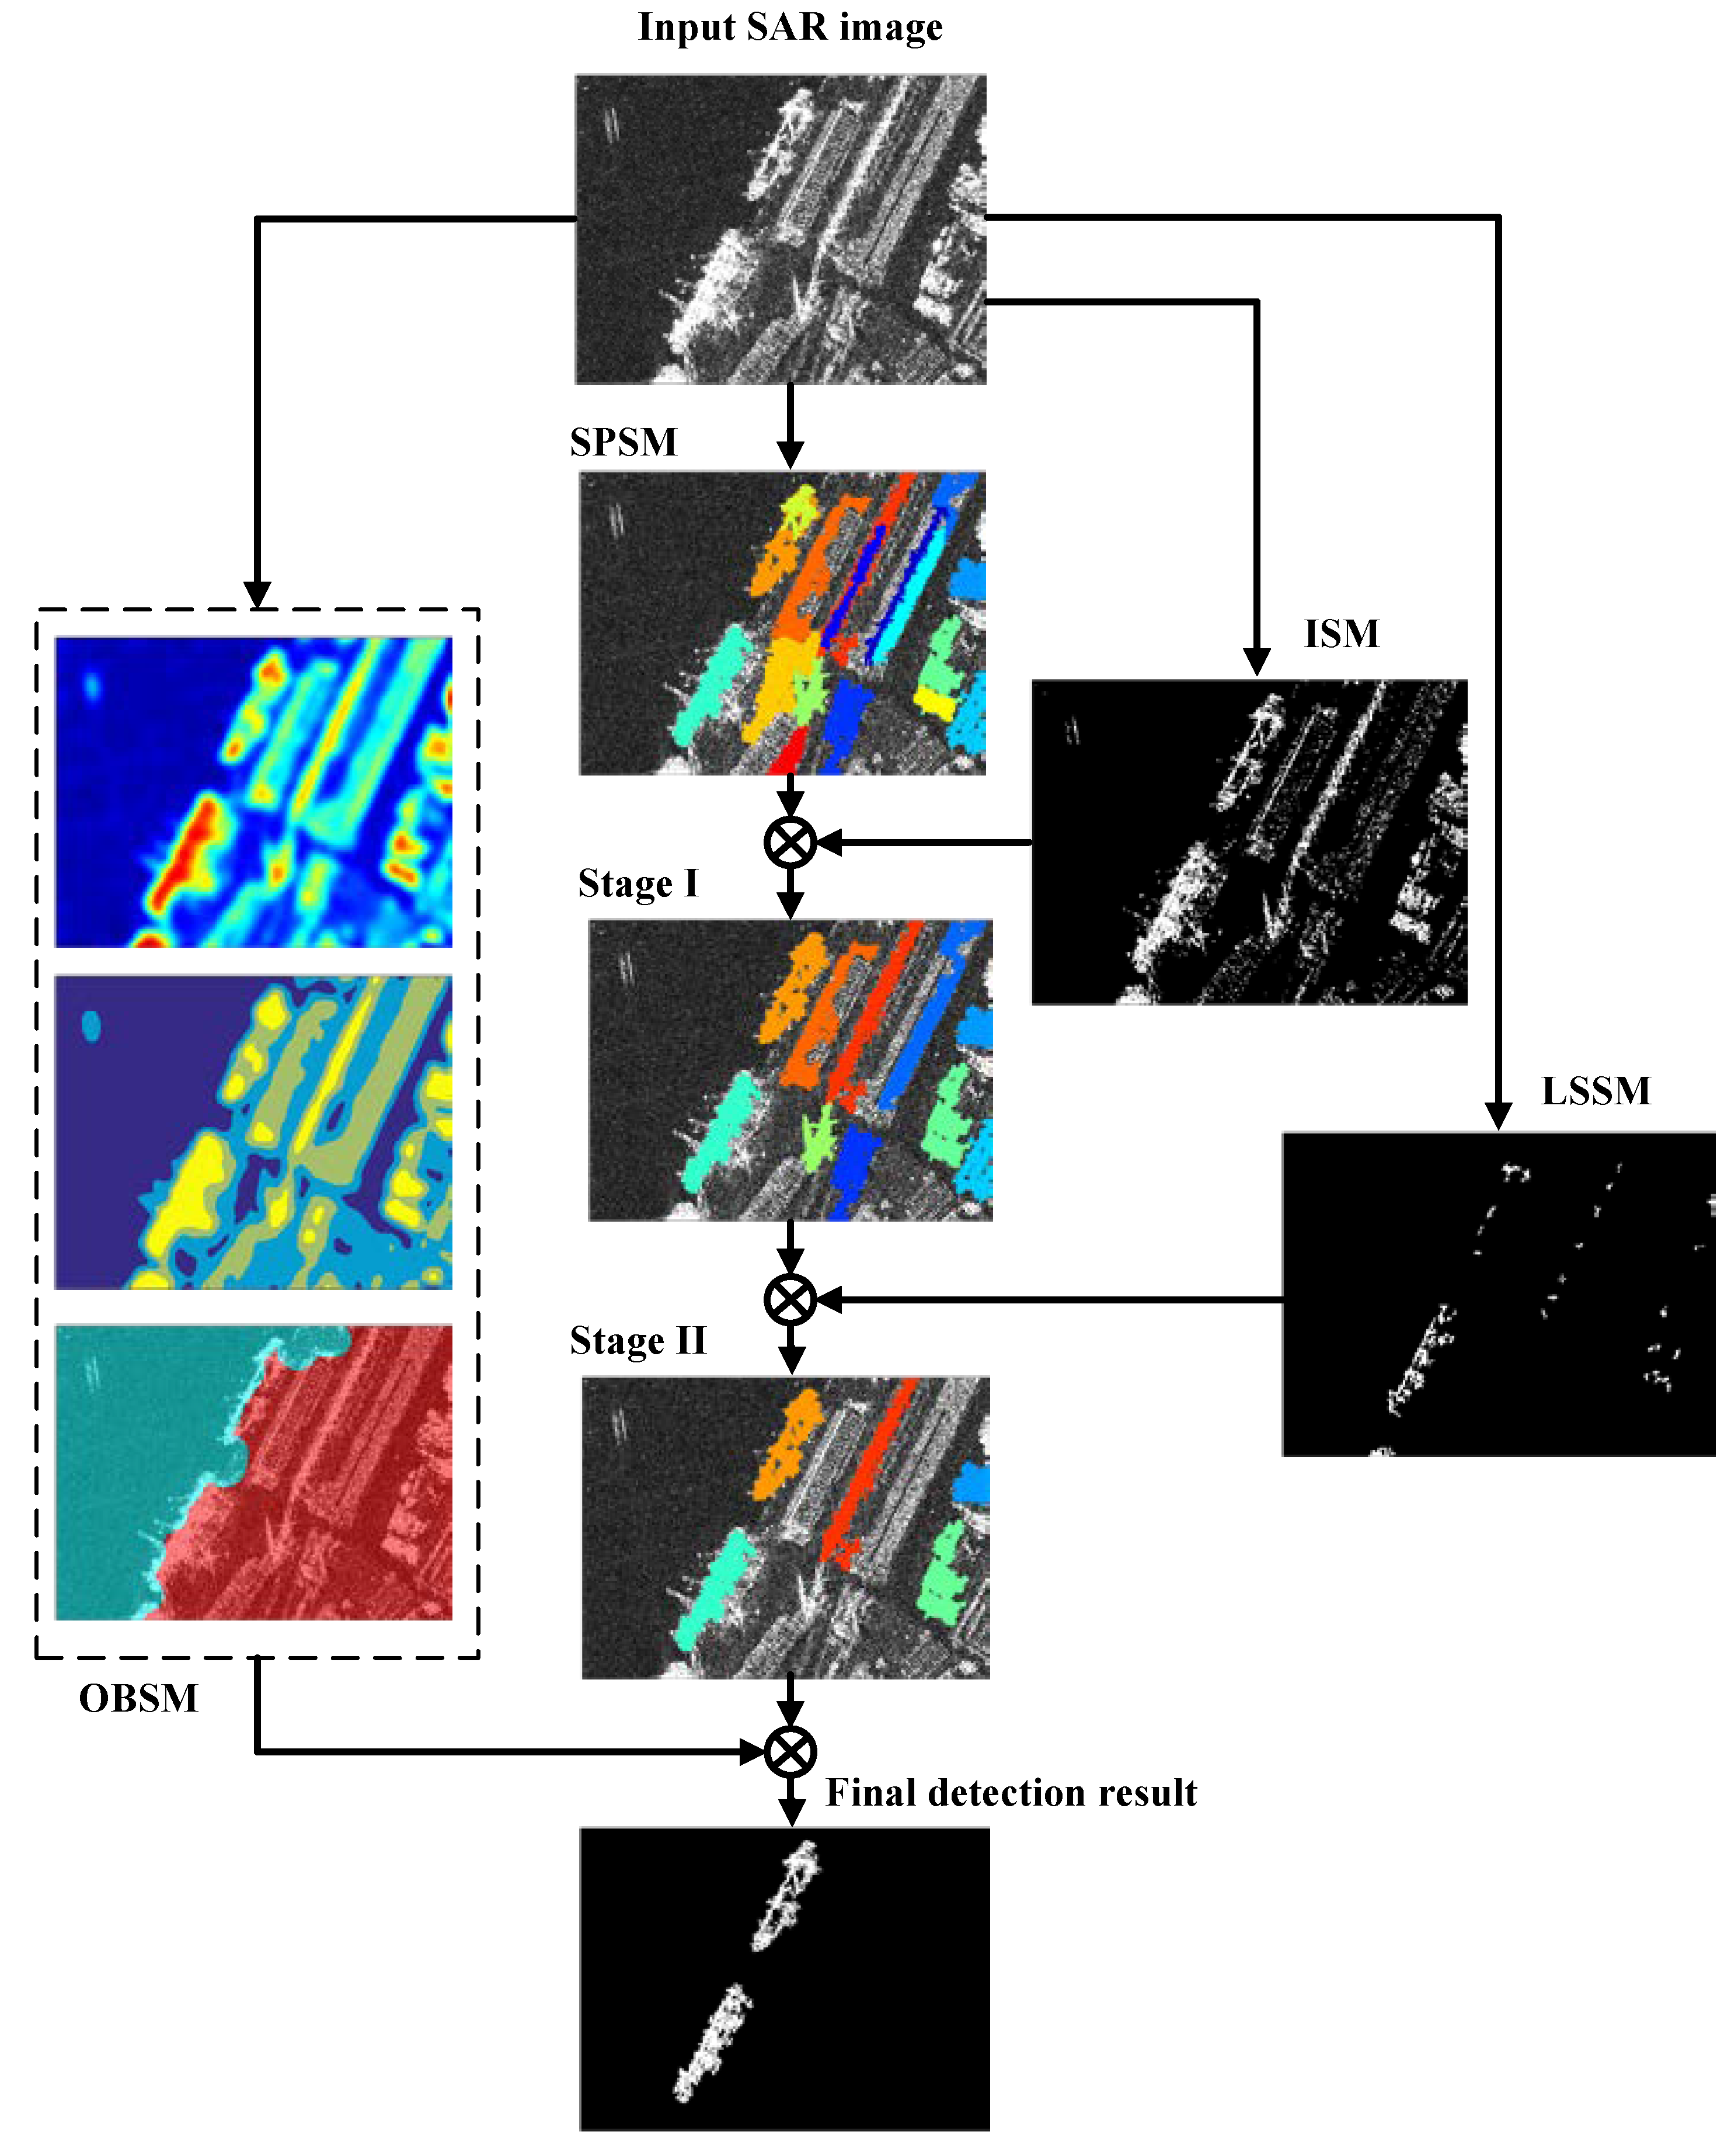
Figure 1 shows the workflow of our method. We use four modalities to detect ships in SAR images. First, we extract non-overlapping regions with a non-nested MSER procedure and form a super-pixel saliency map (SPSM), where the region features are not labeled and usually contain quantities of false alarms. Second, we apply an improved robust K-CFAR detector to obtain an intensity saliency map (ISM) and use it to filter out false alarms from SPSM. This gives us the stage I results. Third, we calculate the local stability of each region with a moving standard deviation (σ) and create a local stability saliency map (LSSM). We use LSSM to refine the stage I results to obtain the stage II results. Fourth, we filter out low frequency components with a second order Gaussian regression filter and segment the image with a four-level OTSU method. We then dilate the lowest level to get an ocean-buffer saliency map (OBSM), which excludes targets near the coast from the stage II results. This gives us the final ship detection results. In real time application, these four saliency processes can be implemented in parallel. We arranged the workflow in Figure 1 for a better illustration.
The proposed SPSM, OBSM, LSSM, and ISM are introduced in detail below.

3.1. Super-Pixel Saliency Map (SPSM)

To reduce the computational cost of over-segmentation by the SLIC method, we employ the MSER method for extracting super-pixel region features [14]. The MSER method scans the intensity range [0, 255] of the input SAR image incrementally and detects region features that have relatively stable areas across different intensity levels. The intensity level increases by a constant step size. The MSER method constructs a series of binary cross section images based on the increasing intensity level. For each intensity level, h , the image pixels are assigned ‘1’ if their intensity is lower than or equal to h , and ‘0’ otherwise. Each connected region of ‘1’ pixels is called an extremal region. As h increases, new extremal regions appear, and the existing ones expand and merge with each other. When h reaches the maximum intensity of 255, there is only one extremal region that covers the whole image. The MSER method tracks both the area and the area growth rate of the nested extremal regions. When two regions merge, the tracking of the smaller one terminates. For a given region, the MSER method measures the variation of its area size between adjacent intensity thresholds. If this variation is below a threshold value, then this region area is regarded as a maximally stable extremal region (MSER). In our application, the intensity step is set as 2, and the growth rate threshold is set as 0.2.
Real SAR images contain many local intensity peaks and valleys. Therefore, for a given region, the MSER detector will produce a set of nested MSER region features due to its intrinsic extremal property. Figure 2 illustrates the nested feature removal process. Figure 2a displays an original SAR image, and Figure 2b shows the MSER extraction result of Figure 2a. Figure 2c presents the non-nested MSER regions of Figure 2a, which are collectively regarded as our SPSM. The nested feature removal method is proposed as follows:
(a)
Get the gravity center, G C i , of each MSER region, M R i , where i 1 , 2 , , N , and N is the total number of the extracted MSER features.
(b)
For any two gravity centers, G C i and G C j , if G C i G C j < 20 pixels, the smaller one of M R i and M R j is eliminated.
(c)
Repeat the above procedures until all the remaining gravity centers are more than 20 pixels apart from each other.

3.2. Intensity Saliency Map (ISM)

Pixel intensity is the fundamental characteristics of SAR images, and CFAR detection methods model the statistical distribution of the background clutters to obtain an adaptive intensity threshold. However, the threshold relies heavily on the statistical fitting accuracy for the background clutters. In inhomogeneous scenes, the intensity histogram tends to exhibit excess kurtosis and a long tail [2], which require an asymmetric (or non-gaussian) distribution for optimal fitting. In the existing literature, some parametric models have been proposed to fit the long heavy tail feature of a heterogeneous clutter, such as the K distribution [40]. However, the modeling ability of a singular parametric model is doubtable for inshore scene probability density function (PDF), and the computational cost is too high for mixture parametric models [9]. As a result, here, we chose the nonparametric kernel density estimator (KDE) to model the PDF of inshore scene clutters. The KDE is given by [41]:
f h x = 1 n j = 1 n 1 h K ( x x j h )
where x 1 , x 2 , , x n are n identically and independently distributed samples forming an unknown PDF of inshore scene clutters. h is the bandwidth that indicates the width of kernel function. K is a kernel function satisfying + K x d x = 1 . In our work, a Gaussian kernel function is employed:
f h x = 1 n h 2 π exp ( x x j 2 2 h 2 )
where in our case, Gaussian basis functions are used to approximate univariate data, the optimal choice for bandwidth h , which is also the bandwidth that minimizes the mean integrated squared error [42]:
h = ( 4 σ ^ 5 3 n ) 1 5 1.06 σ ^ n 1 5
where σ ^ is the estimated standard deviation of x 1 , x 2 , , x n . Then, the corresponding CDF is given by:
F x = 1 n j = 1 n 1 h Φ ( x x j h )
where Φ is the CDF of standard normal distribution. Given the value of the global false alarm rate, Pfa, the threshold, T , can be calculated from:
P f a = 1 1 n j = 1 n 1 h Φ ( T x j h )
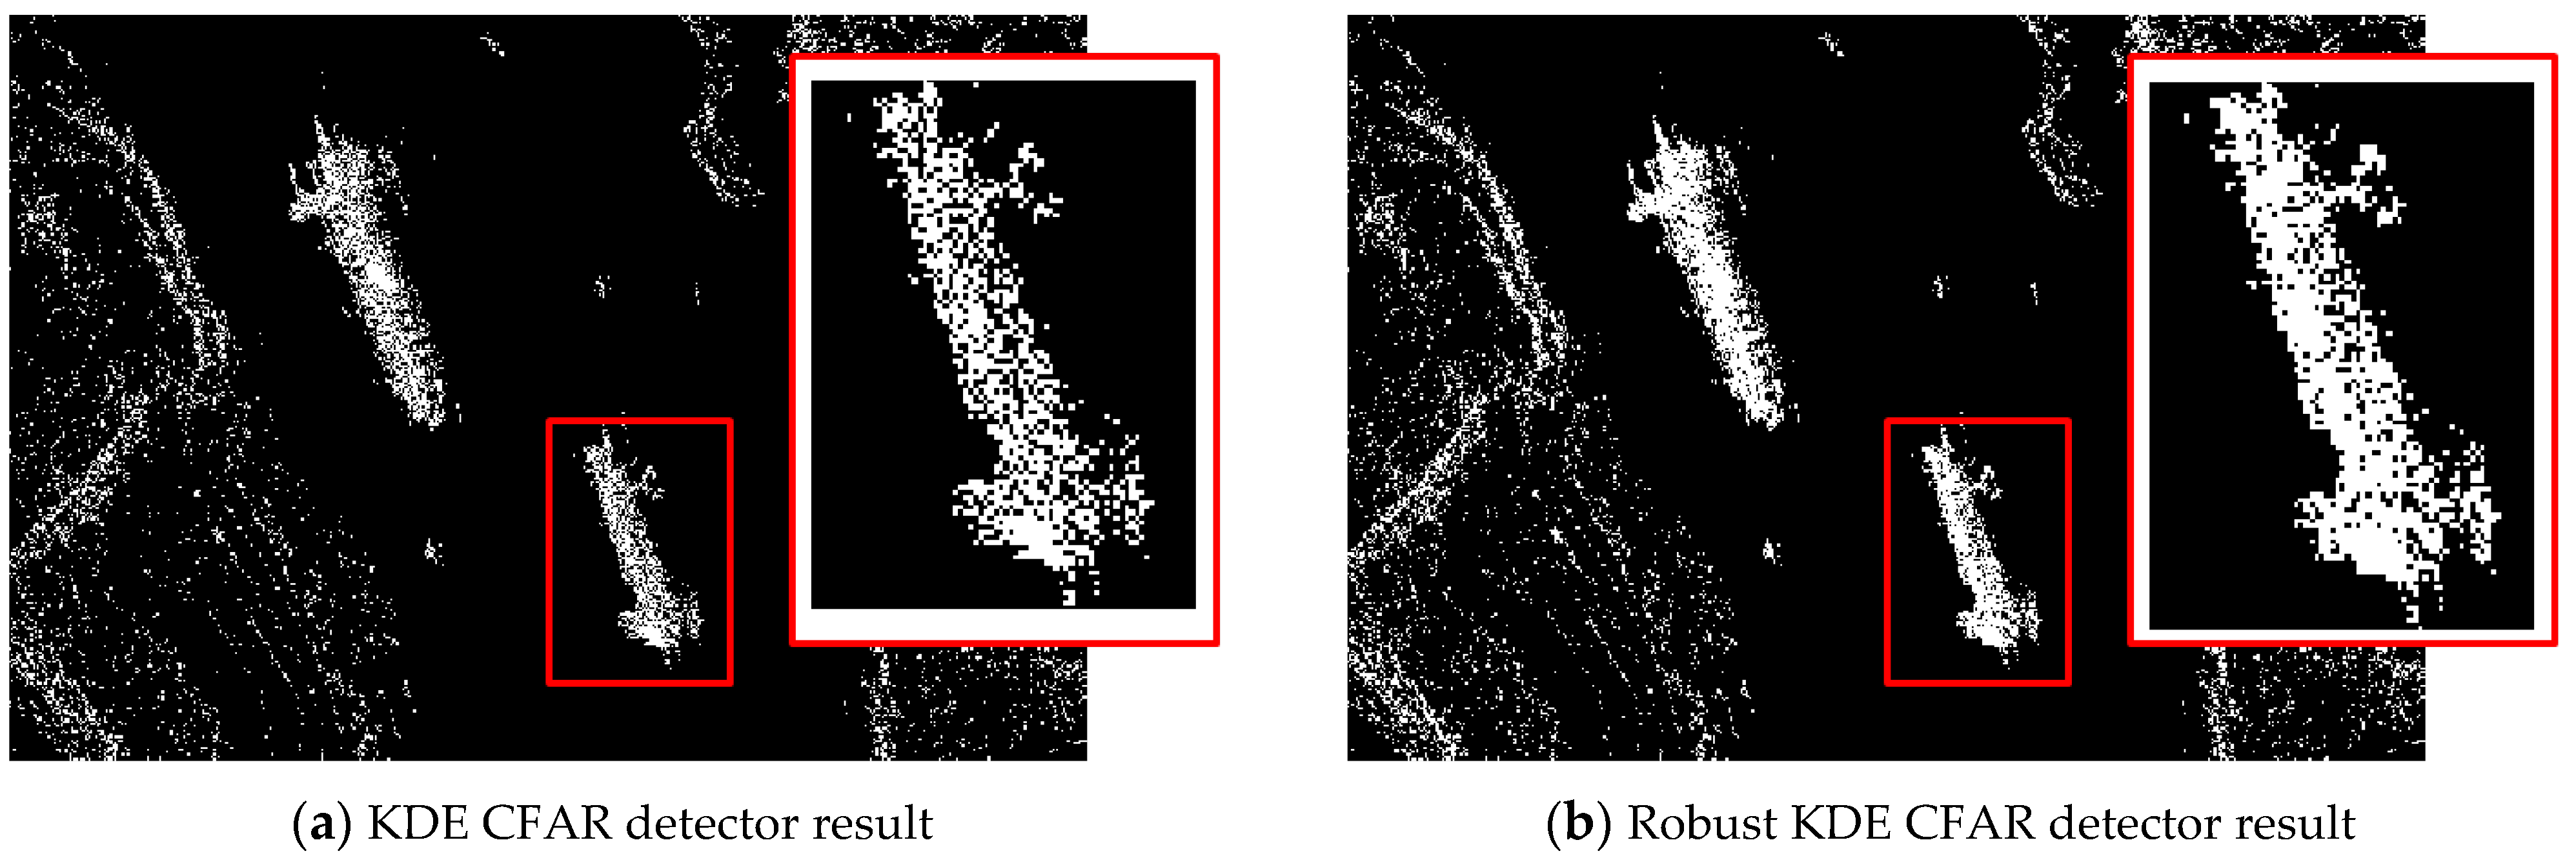
However, when applying the KDE to SAR images with big targets and large area land clutters, as shown in Figure 3a, the PDF generated by KDE (green line in Figure 3b) shows overfitting to outliers in the high intensity edge, resulting in a higher threshold T and increasing the risk of missed detections (as shown in Figure 4a) under the same global false alarm rate Pfa (in this case, we set Pfa at 0.005). We found in Figure 3b that, although KDE overfits the high intensity edge, the curve does not follow the histogram well; there are outliers in the residual between the fitting curve and the histogram (yellow line in Figure 3b). Inspired by this phenomenon, we added a weighting function, w , to the samples, x 1 , x 2 , , x n , to reduce the effect of large ships and land clutters. Considering both the convergence property and calculation speed, the Turkey estimator is introduced as the weighting function:
w r = c 2 6 1 1 r / c 2 2 i f   r c c 2 6 i f   r > c
where r = h x f x , h x is the histogram of x 1 , x 2 , , x n , and f x is the PDF of KDE. c i = 4.4478 × m e i d a n r i , where i is the current number of iterations. If c i c i 1 < c i 1 ε , and ε = 10 3 , the iteration ends, and f x is the robust PDF of KDE fitting. The red line in Figure 3b shows the robust KDE PDF; it is clear that there is no overfitting to ship targets and strong land clutters. Figure 4b shows the detection result by a robust KDE CFAR detector; as can be seen, more details of ship targets are retained in Figure 4b, and the result is termed as our ISM. No matter how well the model fits the background clutters, there are still false alarms detected in land regions, so simple intensity-based saliency may be not enough for inshore scene target detection.

3.3. Local Stability Saliency Map (LSSM)

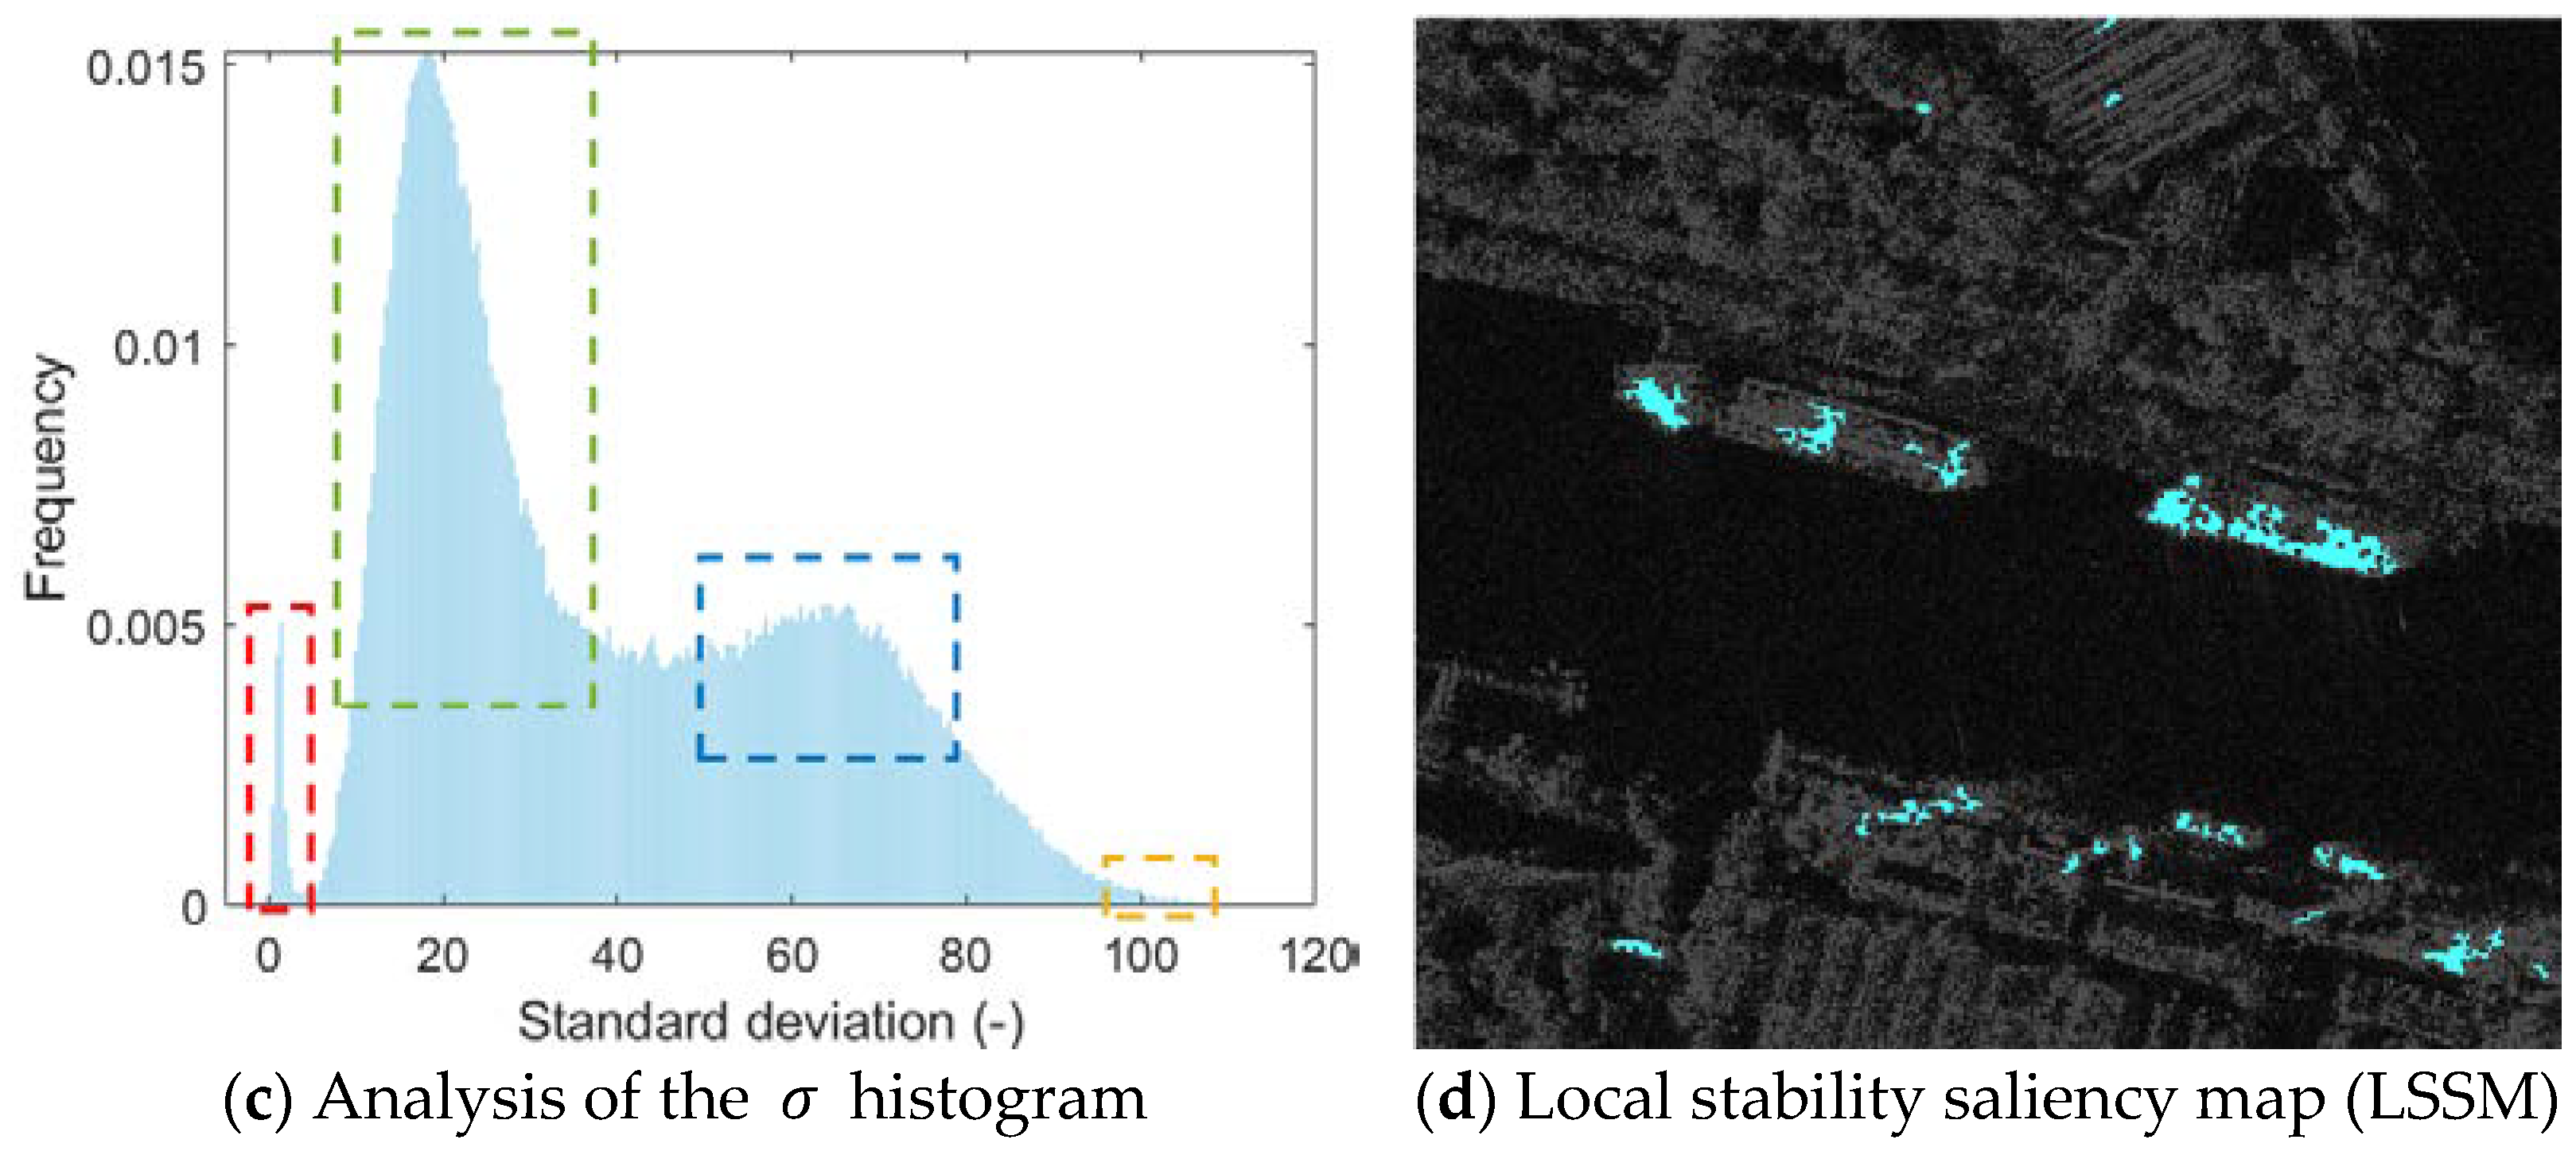
Ships are distinct from the ocean or land not only in the intensity domain, but also in the spatial domain. Bright pixels of ships are often contiguous and concentrated in a small area, while those of the background are relatively discrete and unstable. Elements of a SAR image typically exhibit the following difference in spatial characteristics: (a) ships appear as bright, concentrated pixels, with the highest local stability; (b) bright pixels are distributed uniformly in the marine region, whose local stability is slightly lower than ships; (c) due to the large-scale ridges and landscapes, the local stability of the land region is lower than the marine region; and (d) the connections between the sea and other elements have the lowest local stability. Local stability can be measured by the standard deviation of the pixel intensities in a local region. For a vector x with N dimensions, its standard deviation, σ , is defined as follows:
σ = i = 1 N x i 2 N ( i = 1 N x i N ) 2
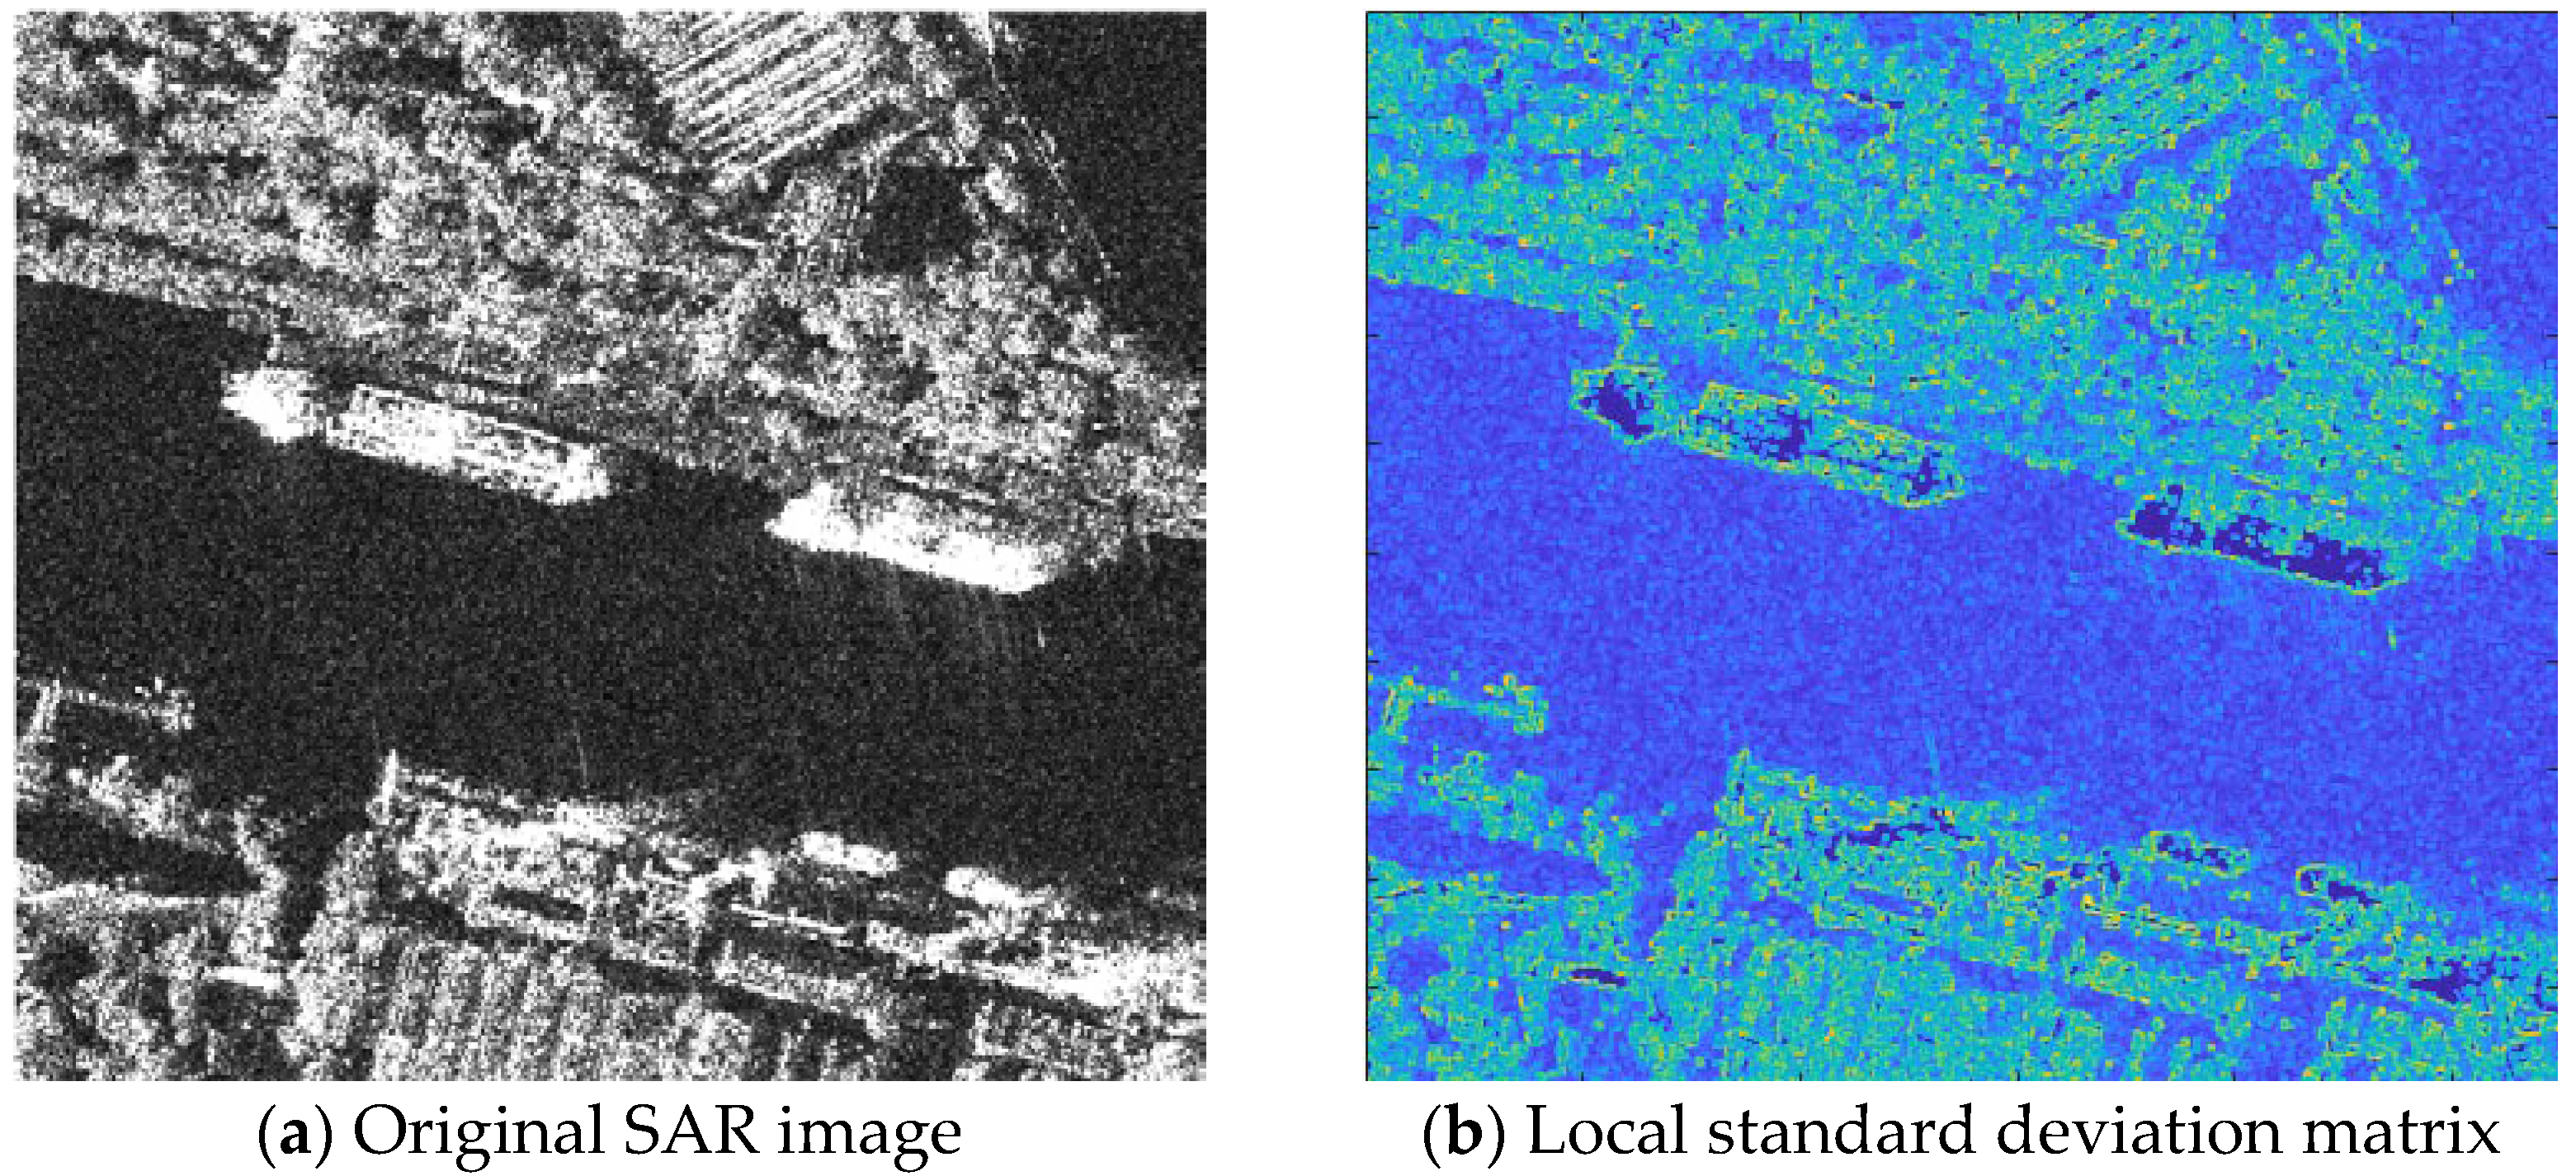
The calculation of the local standard deviation can be accelerated in the frequency domain: we construct a template image, S T , with the same size as the SAR image, S, and set all its values to ‘1’. We also create a convolution kernel, K . Then, we compute the local mean matrix of pixel intensity, S K ¯ , by S K ¯ = K S / K S T , and the local mean matrix of pixel intensity squared, S K 2 ¯ , by S K 2 ¯ = K S 2 / K S T , where denotes convolution. The local standard deviation matrix is then obtained by:
S σ = S K 2 ¯ ( S K ¯ ) 2
The process of local stability is illustrated in Figure 5. Figure 5a displays an original SAR image, and Figure 5b shows its corresponding local standard deviation matrix. Figure 5c presents the histogram of Figure 5b, where the σ value of the red rectangle indicates the central area of ships, the σ value of the green rectangle represents the sea region, the σ value of the blue rectangle signifies the land region, and the σ value of the yellow rectangle marks the boundaries between sea and other elements. We define an adaptive threshold by detecting the breaking point between the red and green rectangles, which is usually less than 10. It can be seen in Figure 5d that, not only ship targes, but metallic harbor facilities are identified by the LSSM as well, so simple LSSM is not enough for inshore scene detection.

3.4. Ocean-Buffer Saliency Map (OBSM)

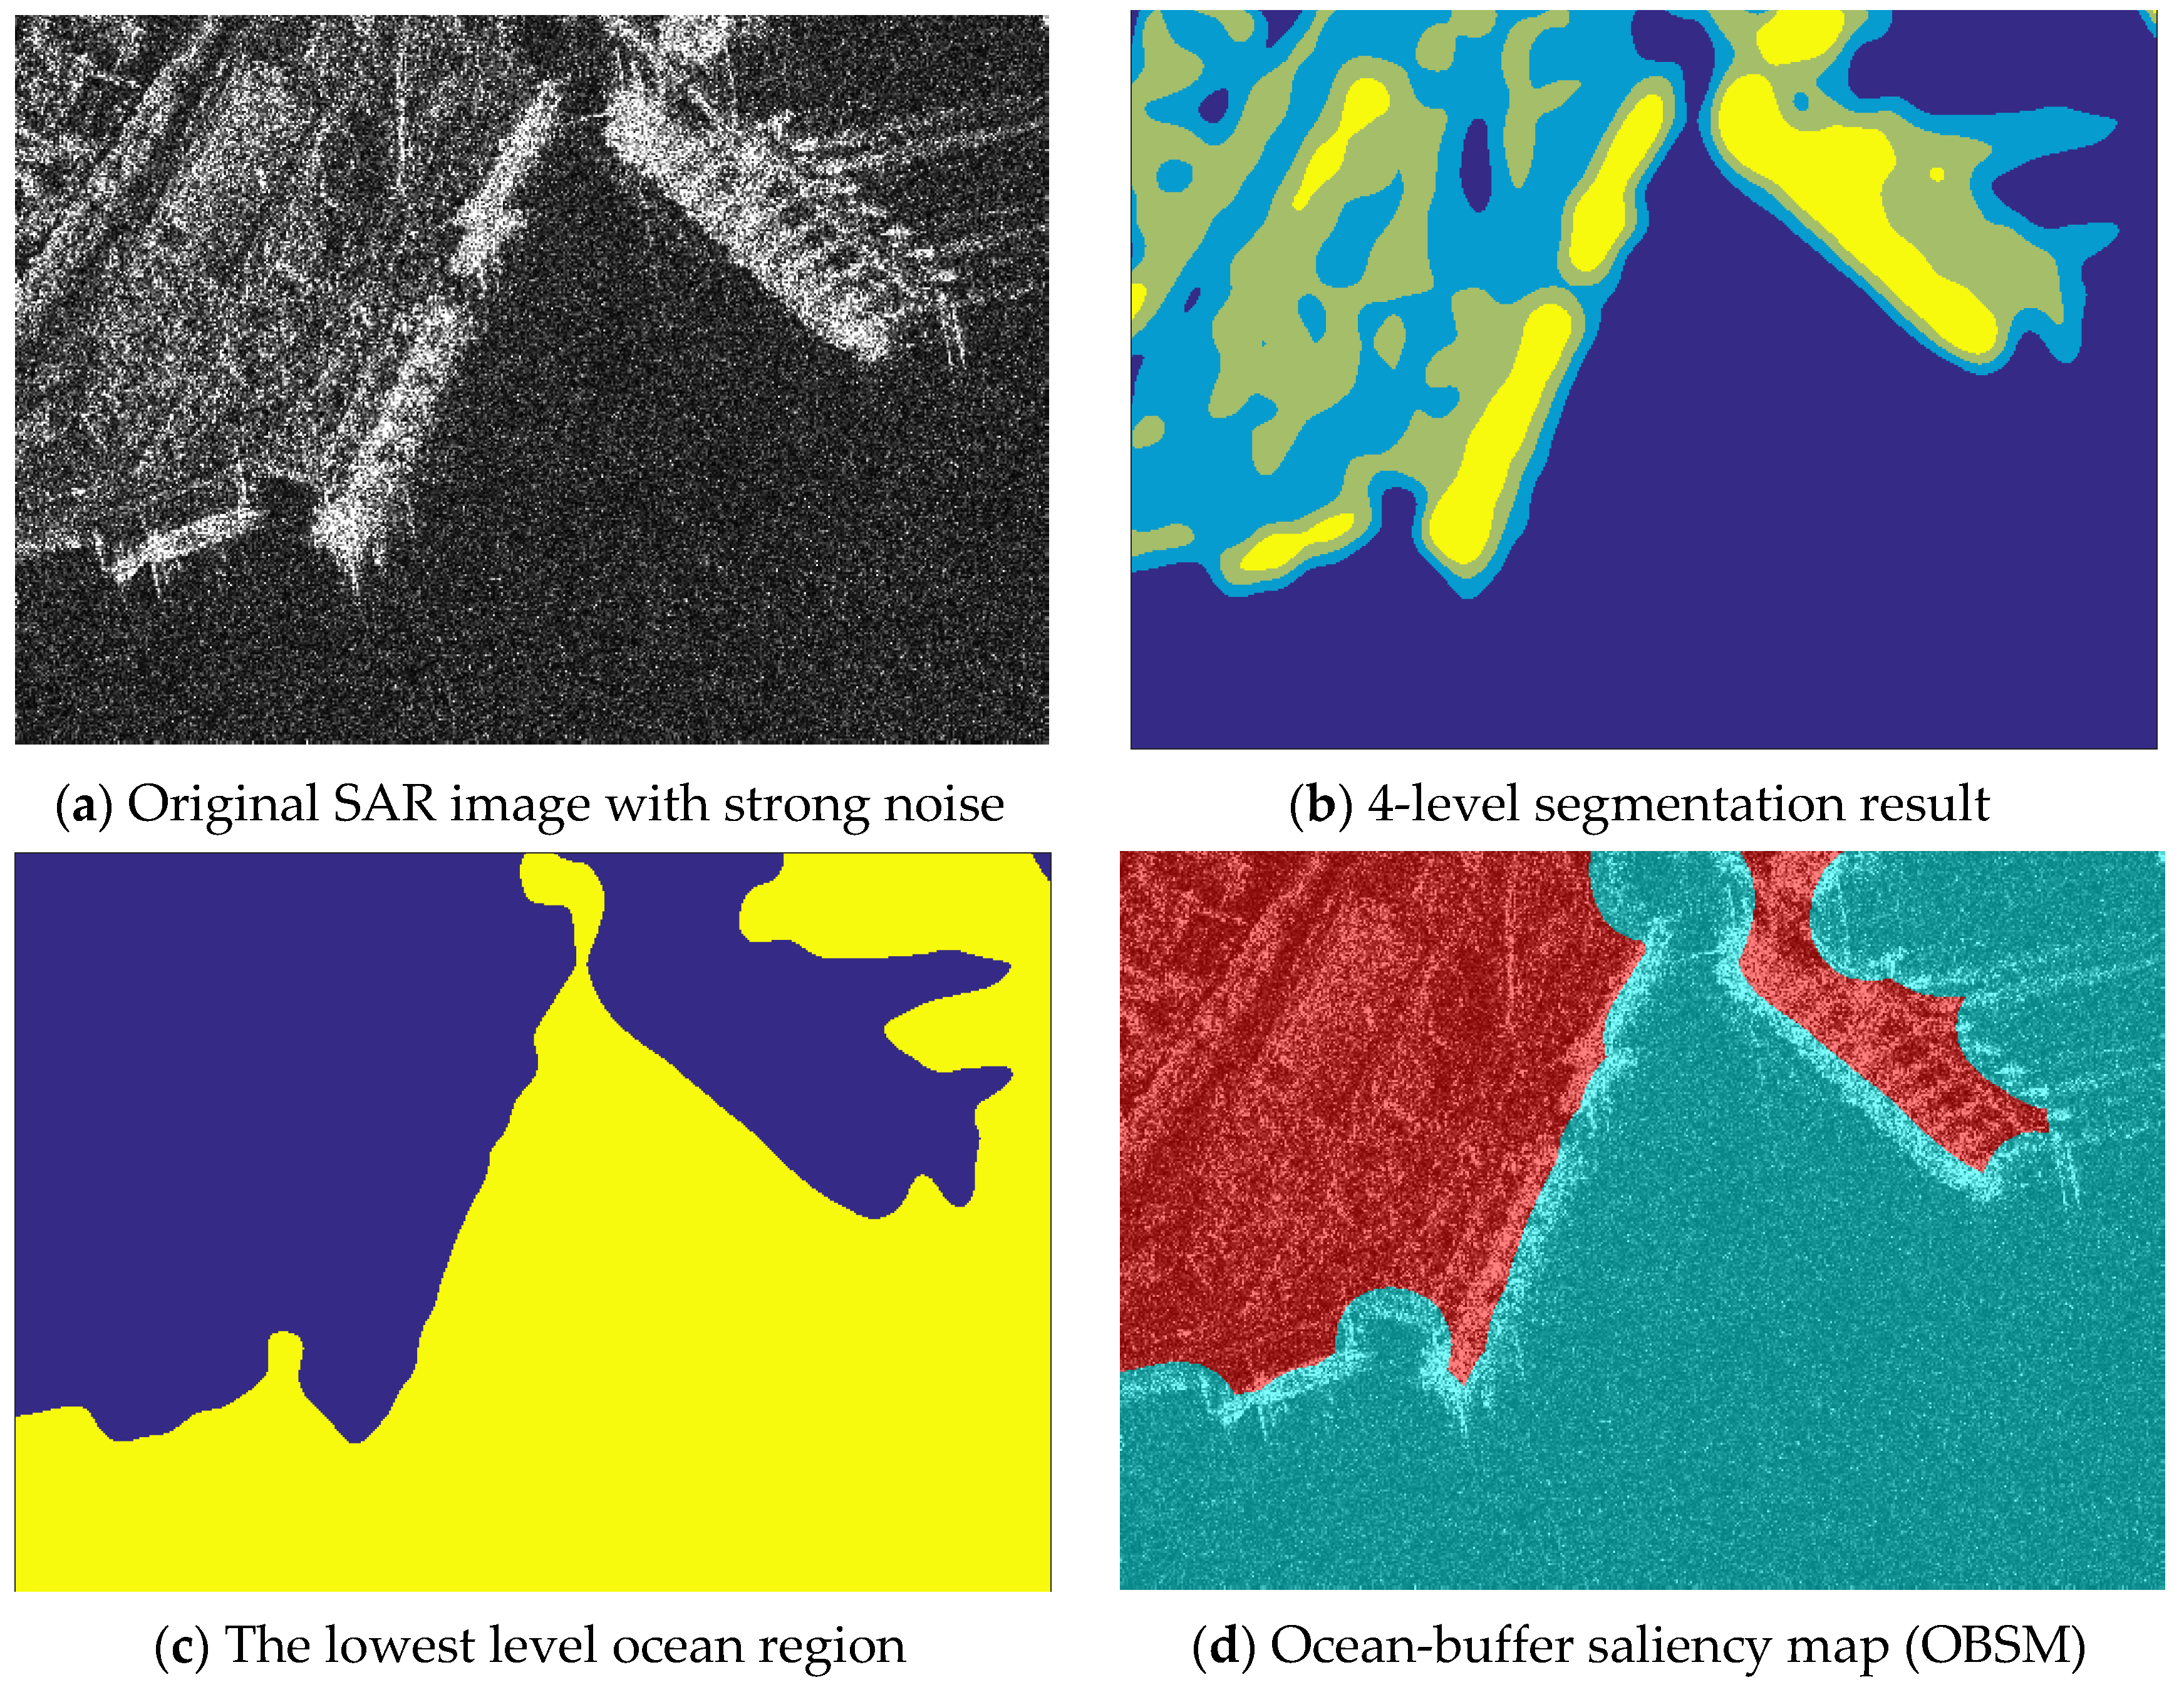
Ships can only appear in marine areas for ship detection in harbor regions. Therefore, we need to first segment the sea from the land. Previous studies often used intensity-based segmentation methods, such as Otsu’s method, with morphology operations to connect isolated land regions and eliminate small holes. However, these methods are sensitive to strong noise and sea clutter. We consider three main elements in SAR images: noise, ship targets, and landforms. These elements have different scales. We address this scale difference by using surface metrology methods [43]. We extract features with interested scales for further analysis by filtering them. We use the second order Gaussian regression filter [44] to avoid boundary effects and reduce noise, which can be defined by the following minimization problem:
0 l y 0 l x ρ z 0 ξ , η z f x , y β 10 x , y ξ x β 01 x , y η y β 20 x , y ξ x 2 β 02 x , y η y 2 β 11 x , y ξ x η y s ξ x , η y d ξ d η m i n z f x , y , β 10 x , y , β 01 x , y , β 20 x , y , β 02 x , y , β 11 x , y
We obtain the resulting filtration surface, z f , by zeroing the partial derivatives in the directions of z f , β 10 x , y , β 01 x , y , β 20 x , y , β 11 x , y , and β 02 x , y . We define these terms in Equation (9) as follows:
z f : the filtration result of the input SAR image z 0 ;
x and y : spatial coordinates in two orthogonal directions.
s x , y = 1 α 2 λ c x λ c y e x p π x α λ c x 2 π y α λ c y 2 : Gaussian weighting function, where α = l o g 2 / π .
λ c x and λ c y : the cutoff wavelengths in x and y directions;
β 10 x , y and β 01 x , y : first-order coefficients;
β 20 x , y , β 11 x , y , and β 02 x , y : second-order coefficients;
ρ r = r 2 / 2 : error metric function of the estimated residual.
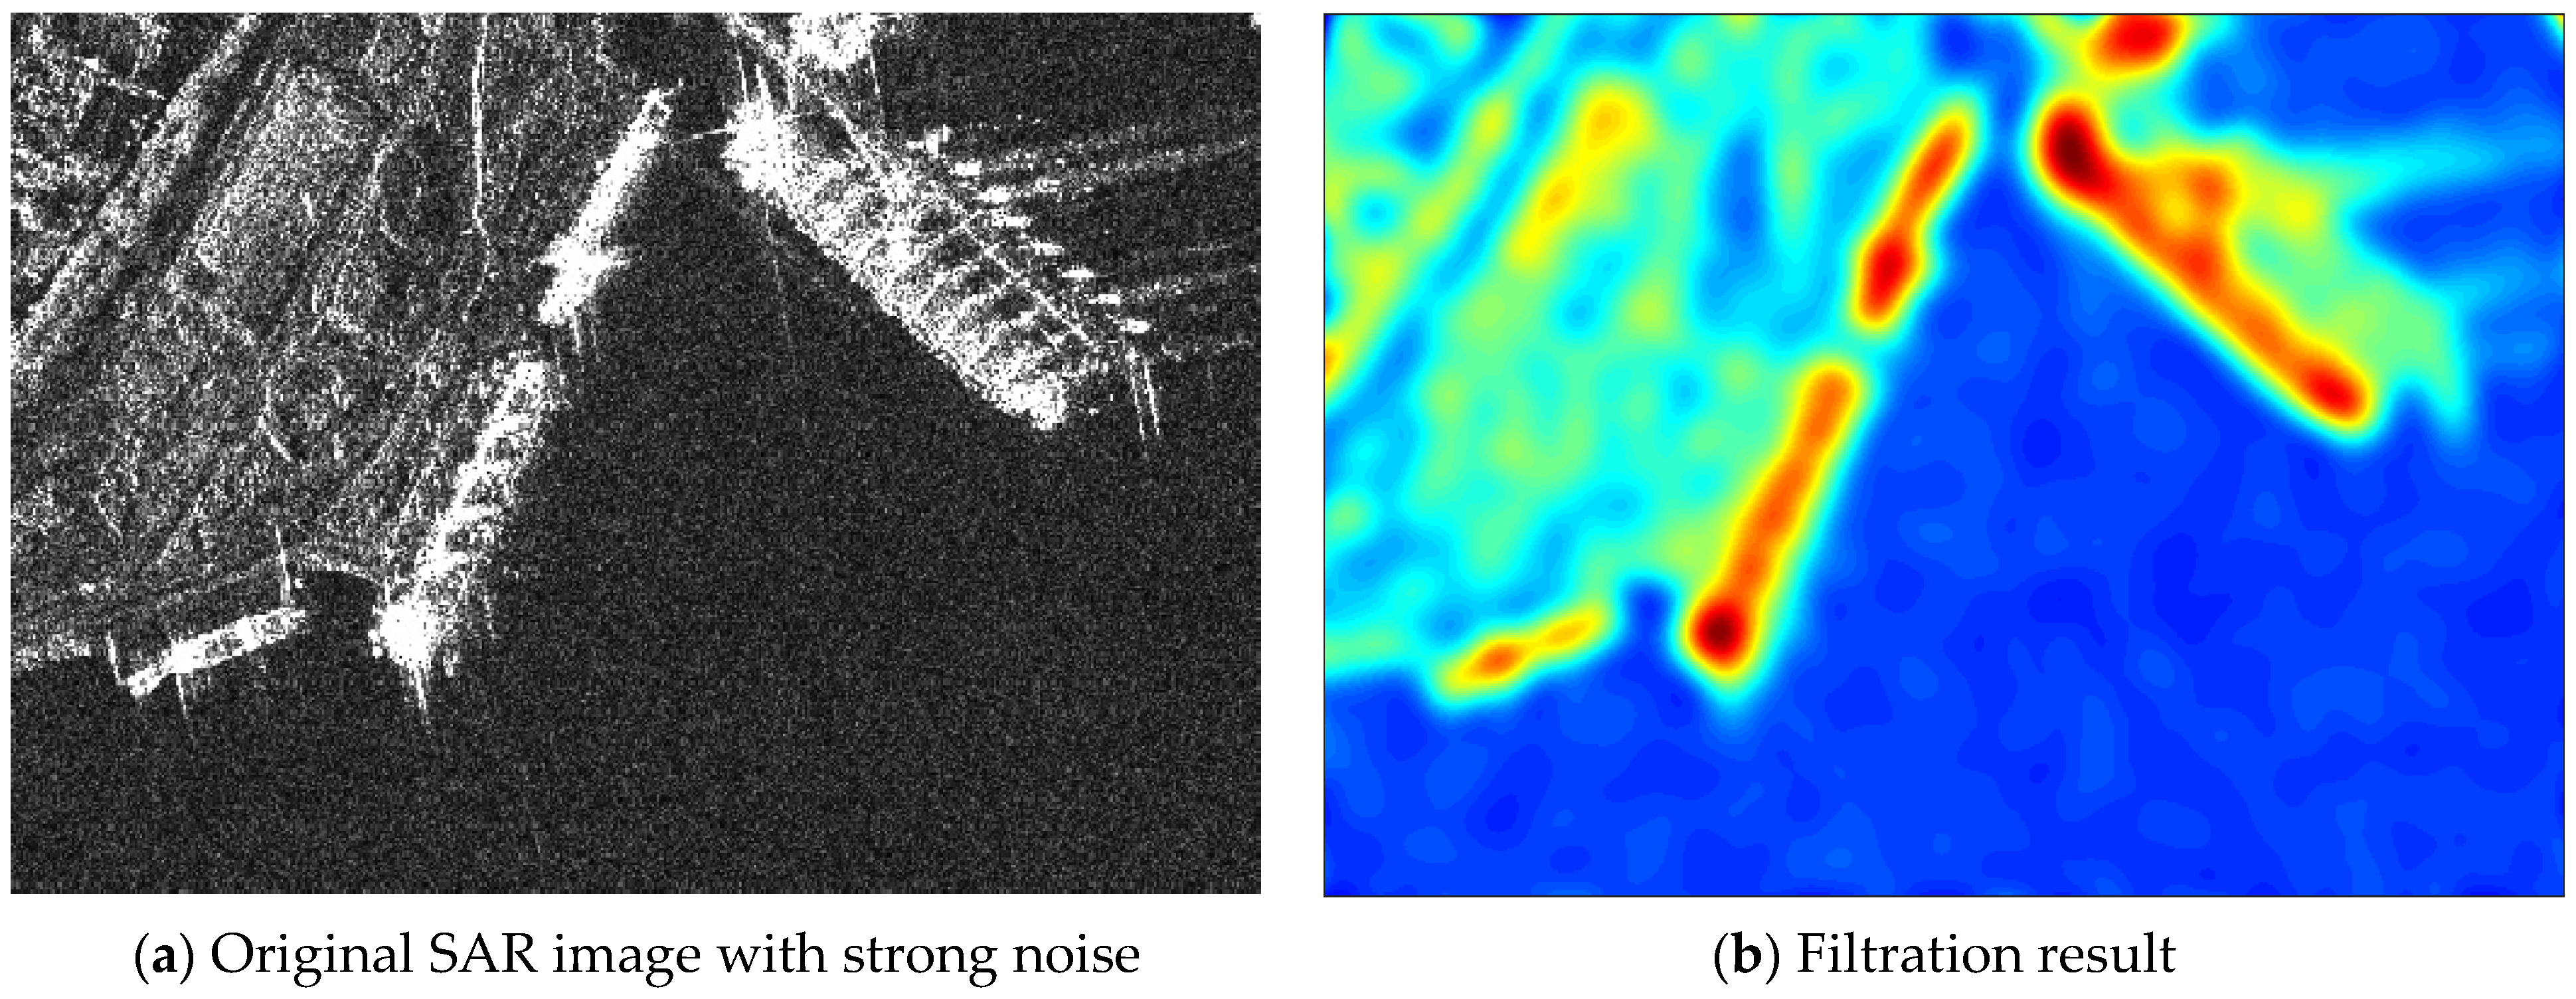
Figure 6 and Figure 7 show the filtration results of SAR images in an inshore scene with different levels of speckle noise. We use the structural similarity index [45] to assess their difference. The structural similarity index between Figure 6a and Figure 7a is 56.7%. The structural similarity index between their filtration results is 76.3%. The increase indicates that using a second order Gaussian regression filter can reduce noise sensitivity.
To further identify the marine area, the four-level Otsu’s method is employed for adaptive thresholding based on the maximization of inter-class variance [46]. The filtered image, z f , is first rescaled to the gray level range of 0~255 using the following formula:
z f min z f max ( z f ) min z f × 255
The intensity level of the filtered image is now [0, 255], and n i denotes the number of pixels with intensity, i , where i 0 , 1 , 2 , ,   255 . The probability of occurrence of a gray level i is p i = n i / i = 0 255 n i . For a four-level segmentation with three thresholds t 1 , t 2 , t 3 , the total inter-class variance, f , can be expressed as:
f = μ w t 1 μ t 1 2 w t 1 + + μ t j μ w t j + μ w t j 1 μ t j 1 2 w t j w t j 1 + + μ w t 3 μ t 3 2 1 w t 3
In this equation, w t j represents the cumulative probability of the occurrence of the gray level 0 ,   1 , , t j , and w t j = i = 0 t j p i . μ t j denotes the mean value at the gray level 0 , t j , and μ t j = i = 0 t j i · p i . The optimal thresholds t 1 , t 2 , t 3 that maximize Equation (11) can be obtained using the Nelder–Mead simplex method [47]. The lowest level segment with intensity values lower than t 1 corresponds to the marine area.
The process of sea–land segmentation is illustrated in Figure 8. Figure 8a displays the original SAR image, Figure 8b shows the segmentation result obtained by using the second order Gaussian regression filter and four-level Otsu’s method, and Figure 8c depicts the extracted marine area. Since ships only appear in or near the ocean, a buffer area is created by performing a morphological dilation operation with a disk-shaped structuring element whose radius is approximately equal to the width of ships. Figure 8d presents the resulting OBSM in blue where ships are located, while the red area indicates land.

4. Results

4.1. Implementation Details

Experiments were performed using SAR images with typical near-shore, inshore scenes from the SSDD dataset [48]. The hardware environment used was the Intel Core i7-6700HQ CPU at 2.60-GHZ and 16-GB RAM. The images were arranged into four groups: offshore heterogeneous scenes, inshore scenes without port facilities, inshore scenes with confusing port facilities, and large-scale scenes. The details of images in each group are listed in tables along with the detection result. The proposed MMS method is compared with the classic K-CFAR based method, Gamma-CFAR based method, and a SLIC-CFAR method. For K-CFAR and Gamma-CFAR based methods, the CFAR detectors are first applied to the input SAR image, then some prior knowledge, such as size and aspect ratio, are used to further eliminate non-ship objects. A morphological closing operation is also required since there are often holes remaining in the CFAR detection results. For the SLIC-CFAR method, SPs are first generated with the SLIC method, then a global detection is performed using weighted information entropy to extract interested SPs. These SPs are further selected by a local CFAR detection with neighboring SPs. A clustering operation is applied to the remaining foreground SPs, and finally, prior knowledge is used to further remove non-ship SPs.
The detection results are quantitatively evaluated by the F1 score. The F1 score is calculated by using three well established metrics in information retrieval, namely true positive (TP), false positive (FP), and false negative (FN). For inshore ship detection, shape distortion caused by adhesion between ships and land may affect the further identification process. Therefore, in this paper, a pixel-level F1 score such as the overlap rate between the detection result and ground truth is used, where TP denotes the number of pixels that belong to correctly detected ships, FP indicates the number of pixels that correspond to false alarms, and FN represents the number of pixels that are missed by the detection algorithm.
The recall measures the proportion of a correctly detected ship area in all ground truths, and is defined as:
r e c a l l = T P T P + F N
In addition, the precision evaluates the proportion of the correctly detected ship area in all detection results:
p r e c i s i o n = T P T P + F P
The F1 score is used to assess the overall detection performance:
F 1 = 2 × p r e c i s i o n × r e c a l l p r e c i s i o n + r e c a l l

4.2. Comparison with Other Methods

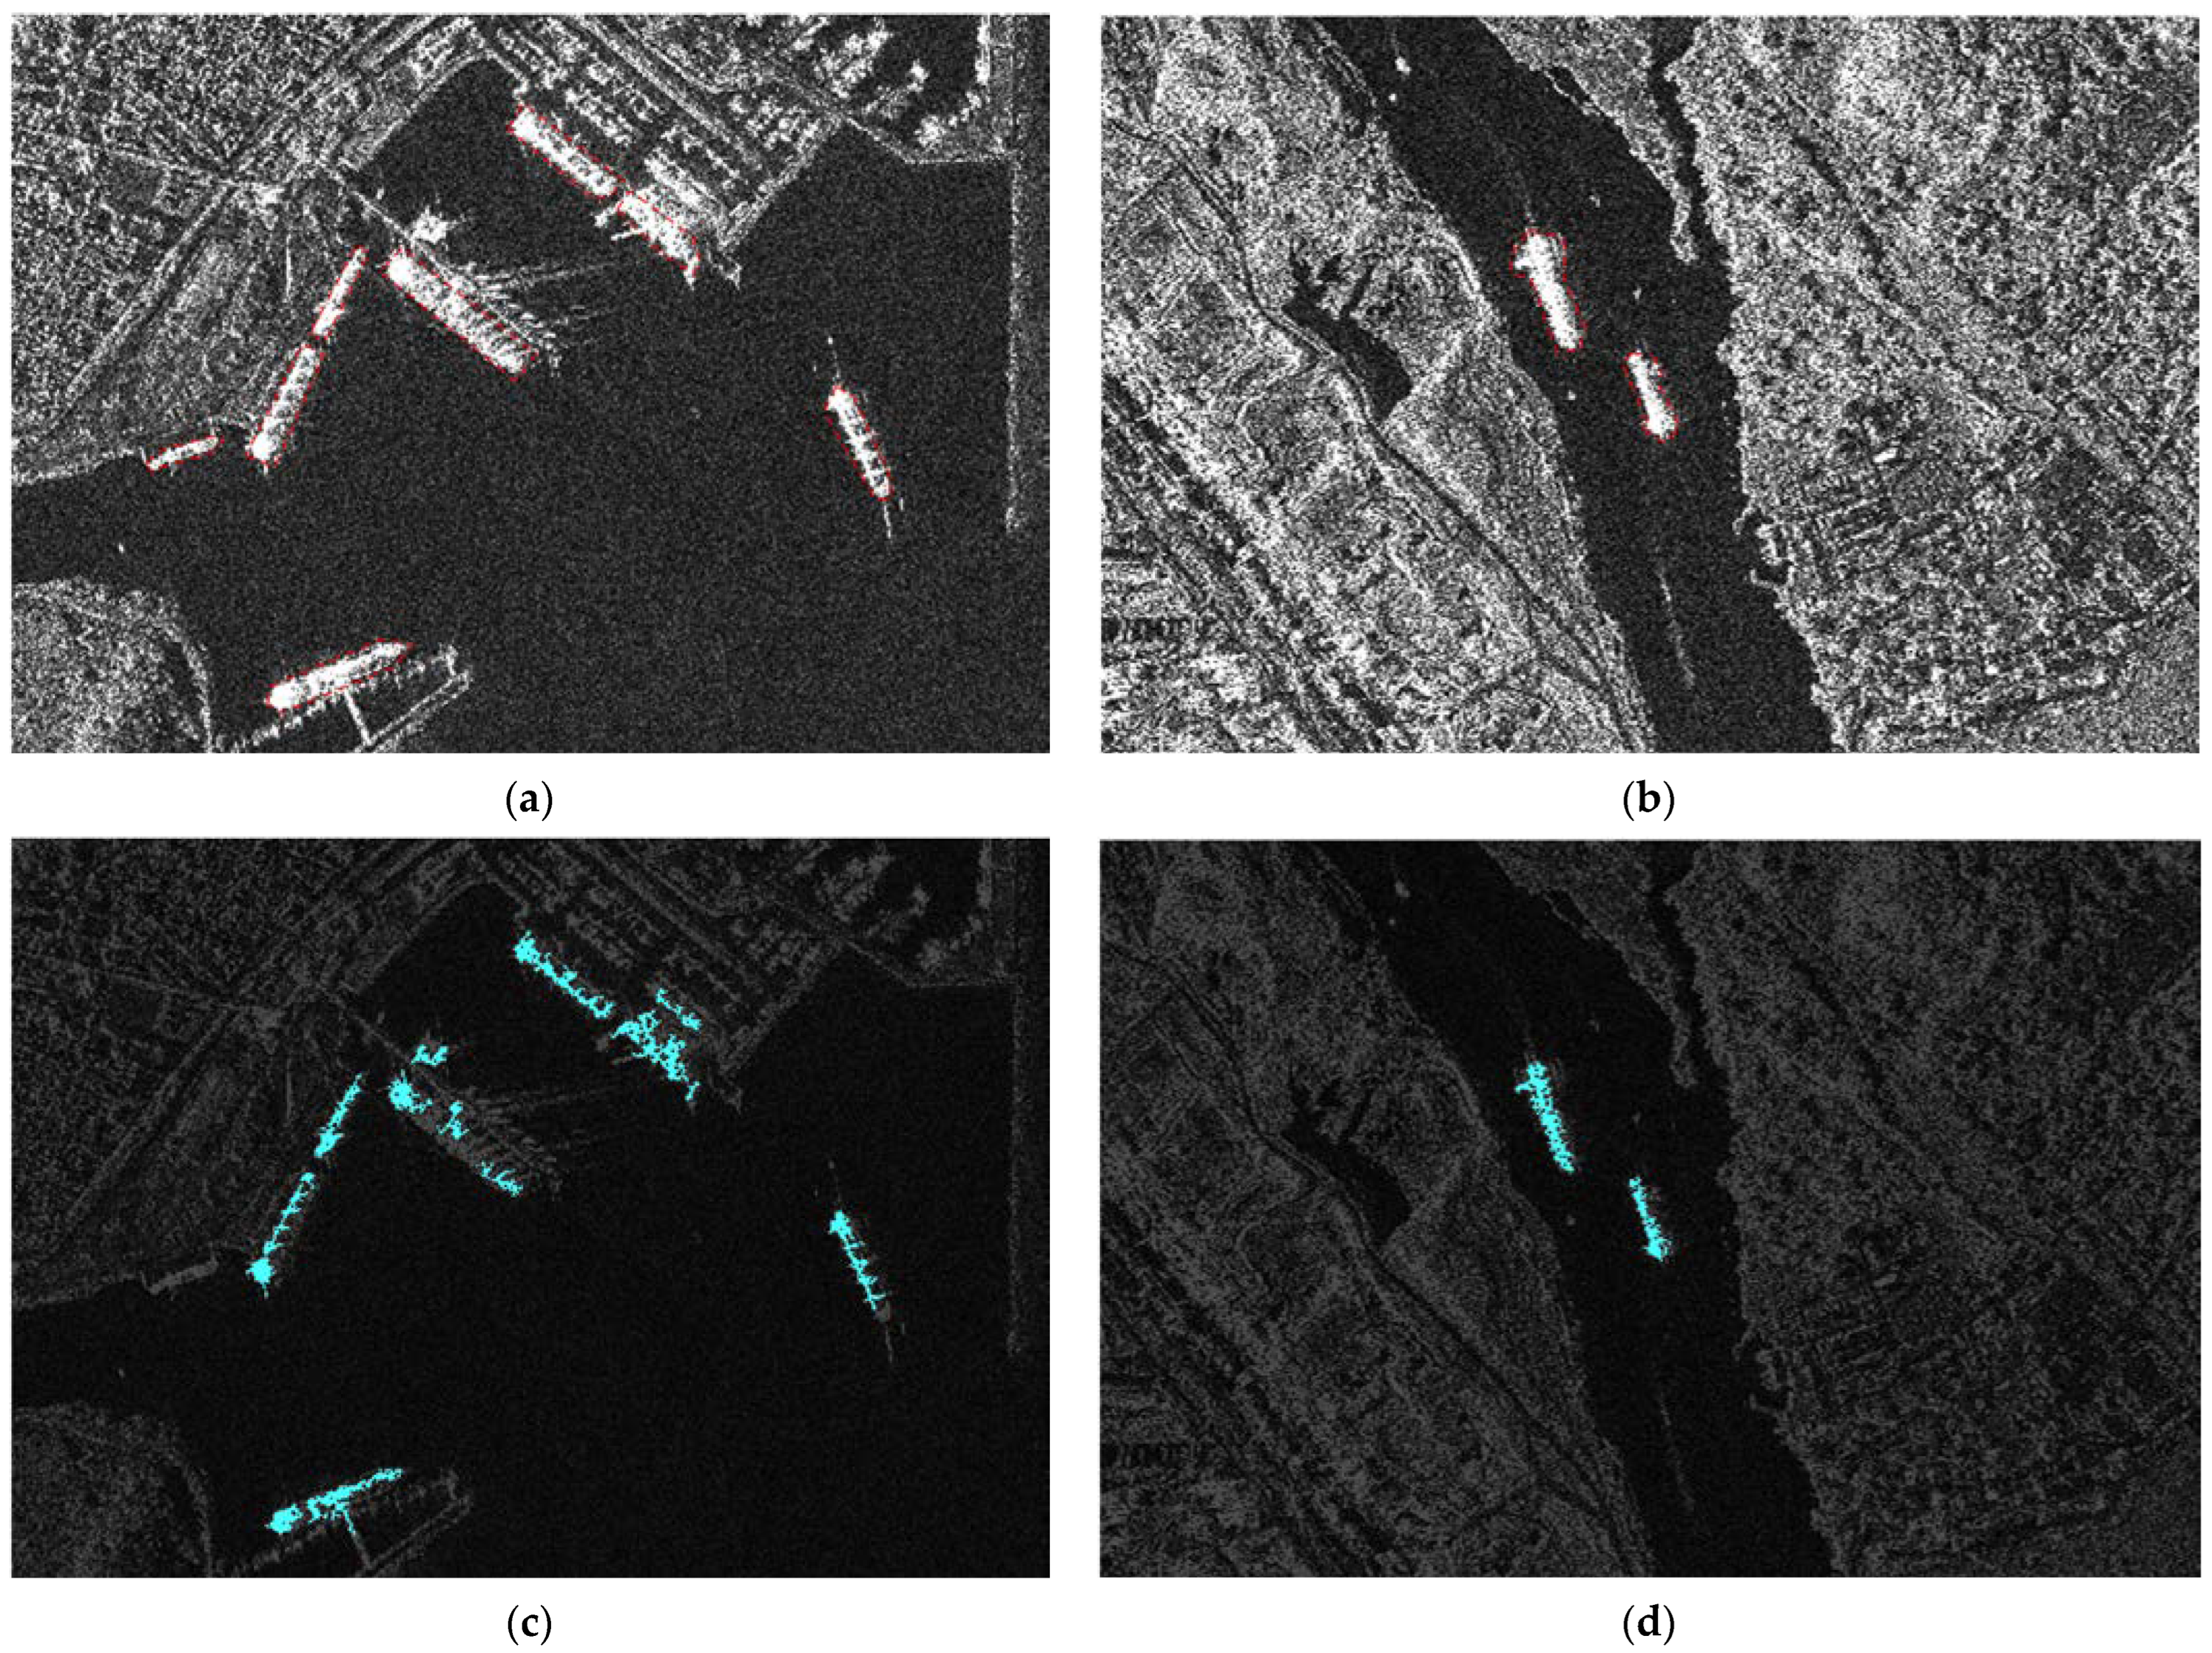
Figure 9 presents the detection results of four methods on offshore scenes with an inhomogeneous background, in which Figure 9a,b show the SAR image 1 and 2 that were tested for detection with the ground truth marked by a red polygon. The size and resolution of the two images were listed in Table 1. Figure 9c,d show the detection results of the K-CFAR method; there are false alarms representing bright land ridges that remained because they resemble ships in shape and intensity. Figure 9e,f show a similar problem with the Gamma-CFAR method. Figure 9g shows less false alarms with the SLIC-CFAR method because super-pixels representing bright ridges relate to each other and can be excluded by size. However, in Figure 9h, a ship target is miss detected with the SLIC-CFAR method. Figure 9i,j show the detection result of the proposed MMS method, which could suppress the false alarm land clutters and retain good, detailed target characteristics, but some side slopes are also detected. The pixel-level F1 score describing the degree of the pixel level coincidence between the detection results and ground truth, along with the computing time, are listed in Table 2.
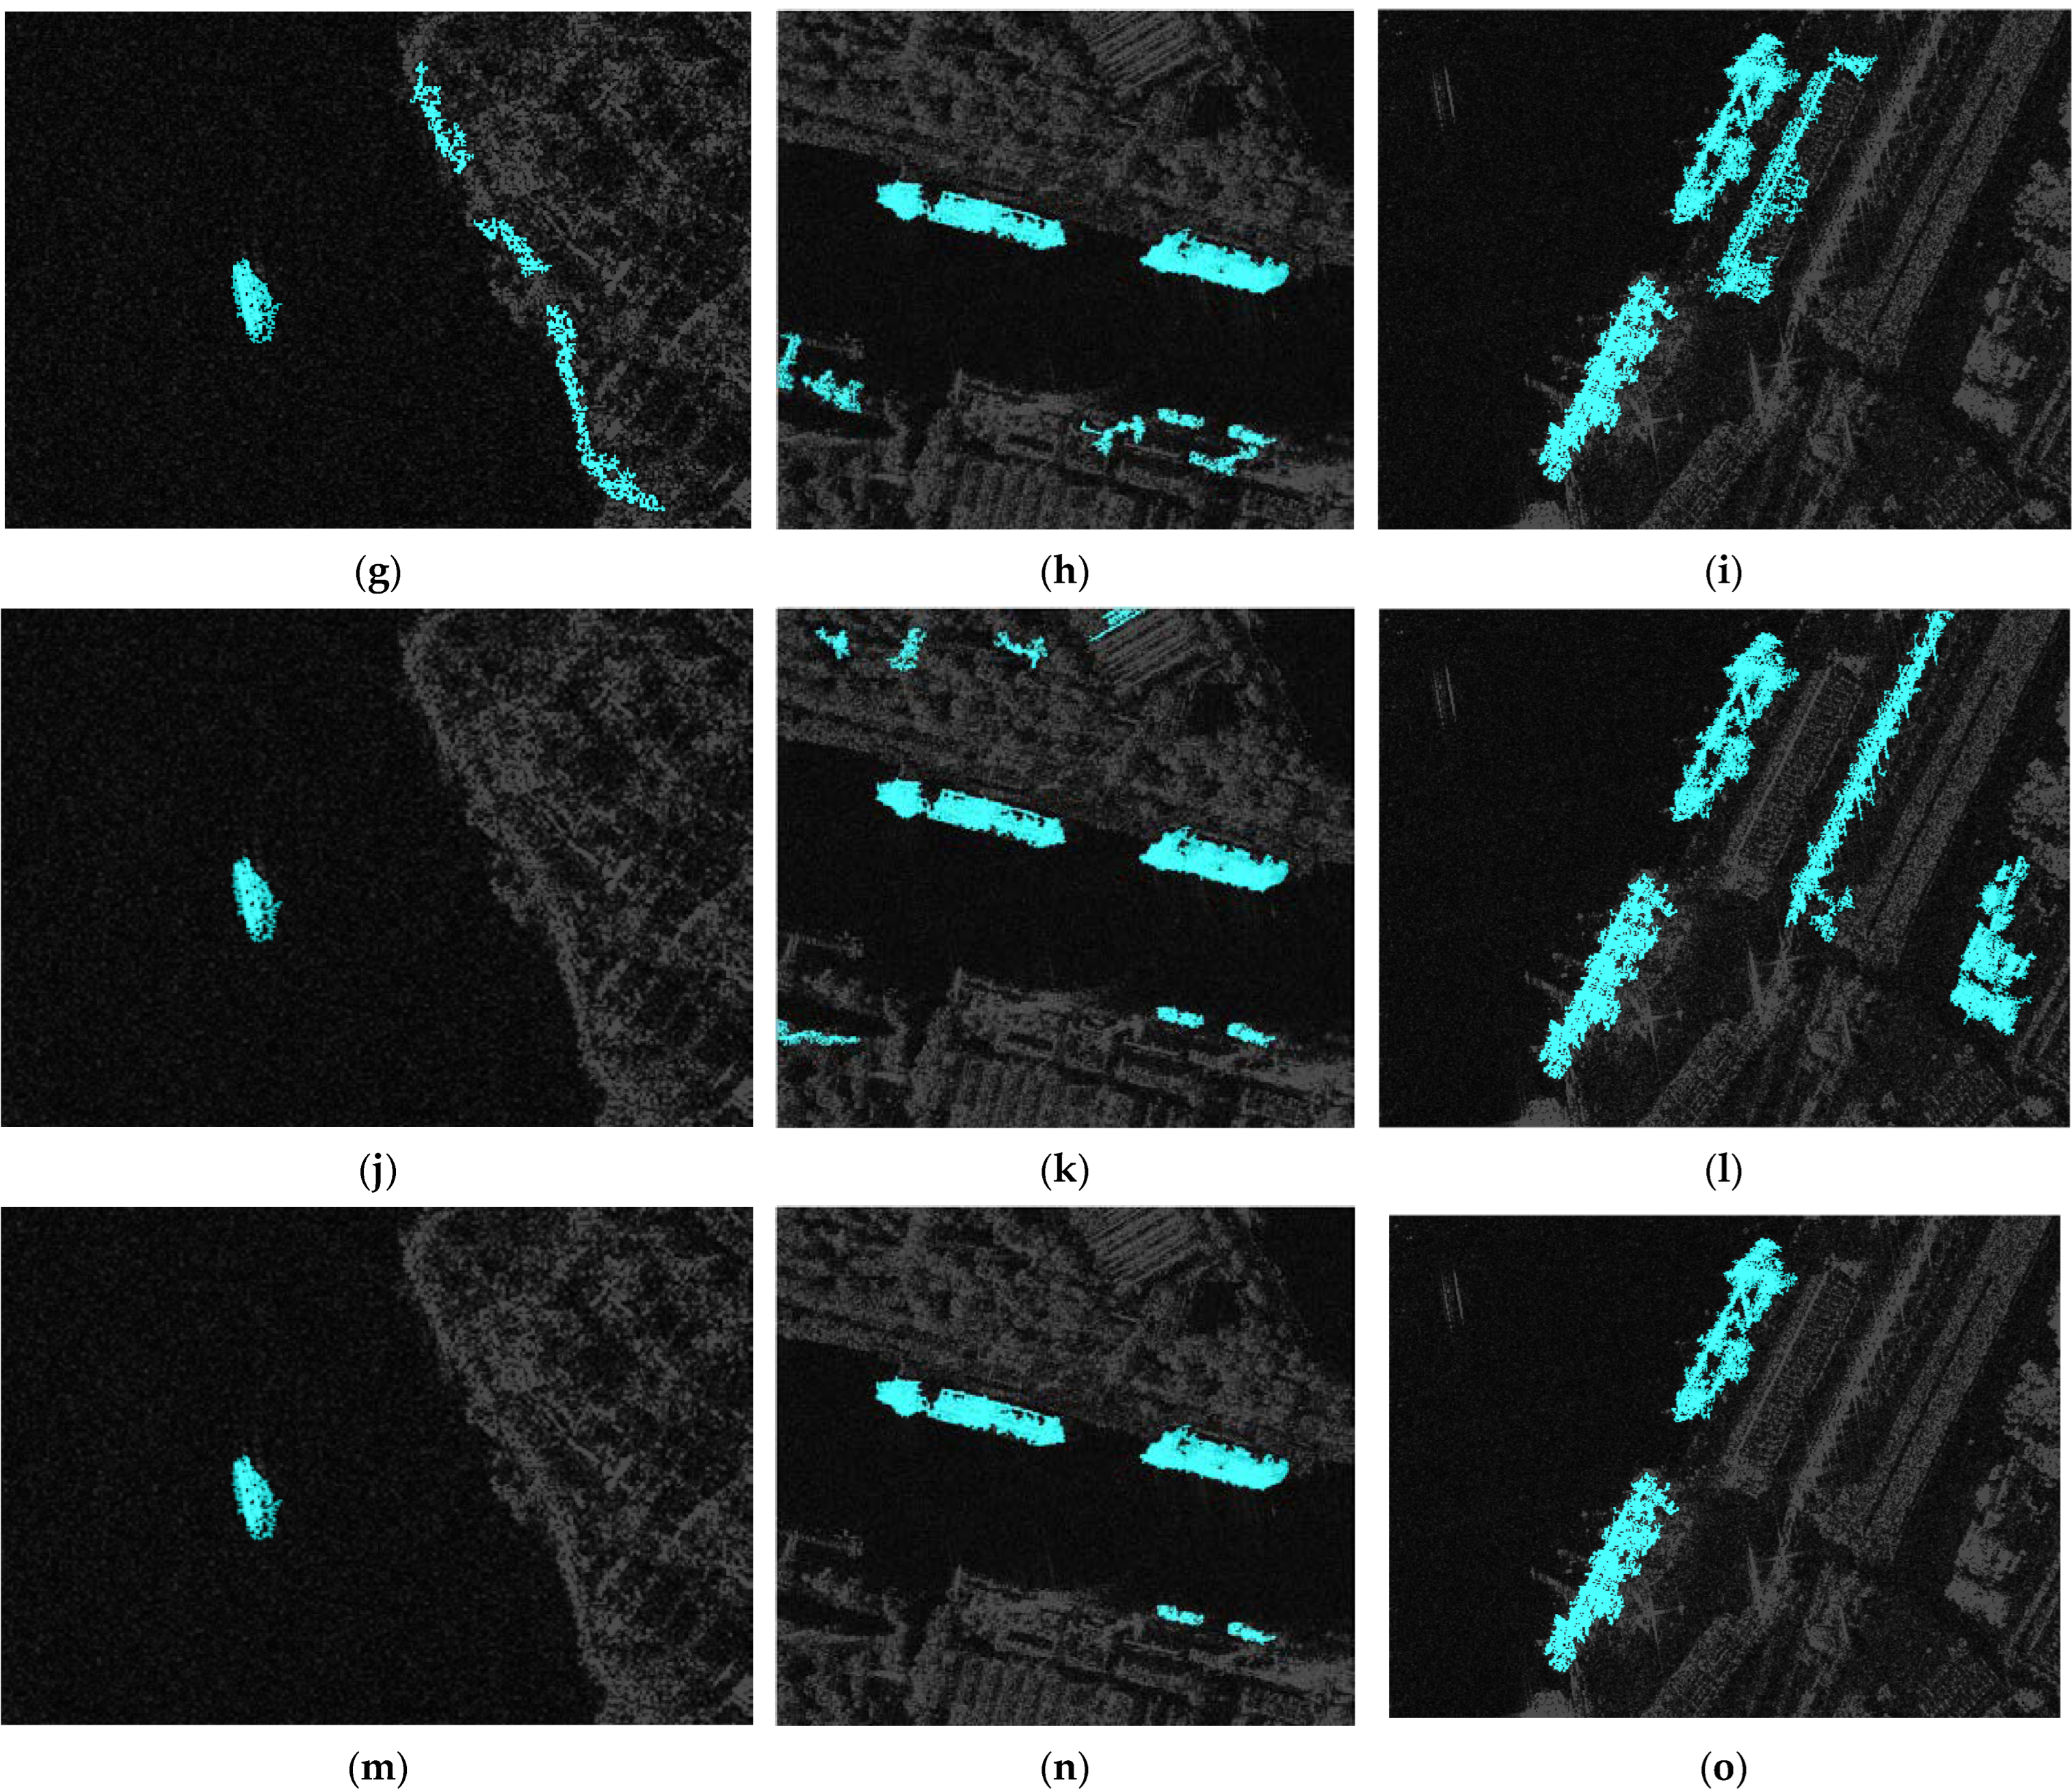
Figure 10 presents the detection results of the four methods on inshore scenes without port facilities, in which Figure 10a,b show the SAR image 3 and 4 that were tested for detection with the ground truth marked by a red polygon. The size and resolution of the two images were listed in Table 3. Figure 10c shows false alarms and miss detected parts of the ship with the K-CFAR method because the long heavy tail feature of a heterogeneous clutter affects fitting, resulting in a high threshold. The same miss detections are found in Figure 10d. The detection results in Figure 10e,f with the Gamma-CFAR method are quite similar with those using the K-CFAR method. Figure 10g shows heavy false alarms and miss detections with the SLIC-CFAR method, while Figure 10h shows pretty good detection results because there are less confusing concentrated bright clutters in Image 4. Figure 10i,j show the detection result of the proposed MMS method, the ship contours are well outlined, and no false alarms are observed. Numerical results and computing time are listed in Table 4.
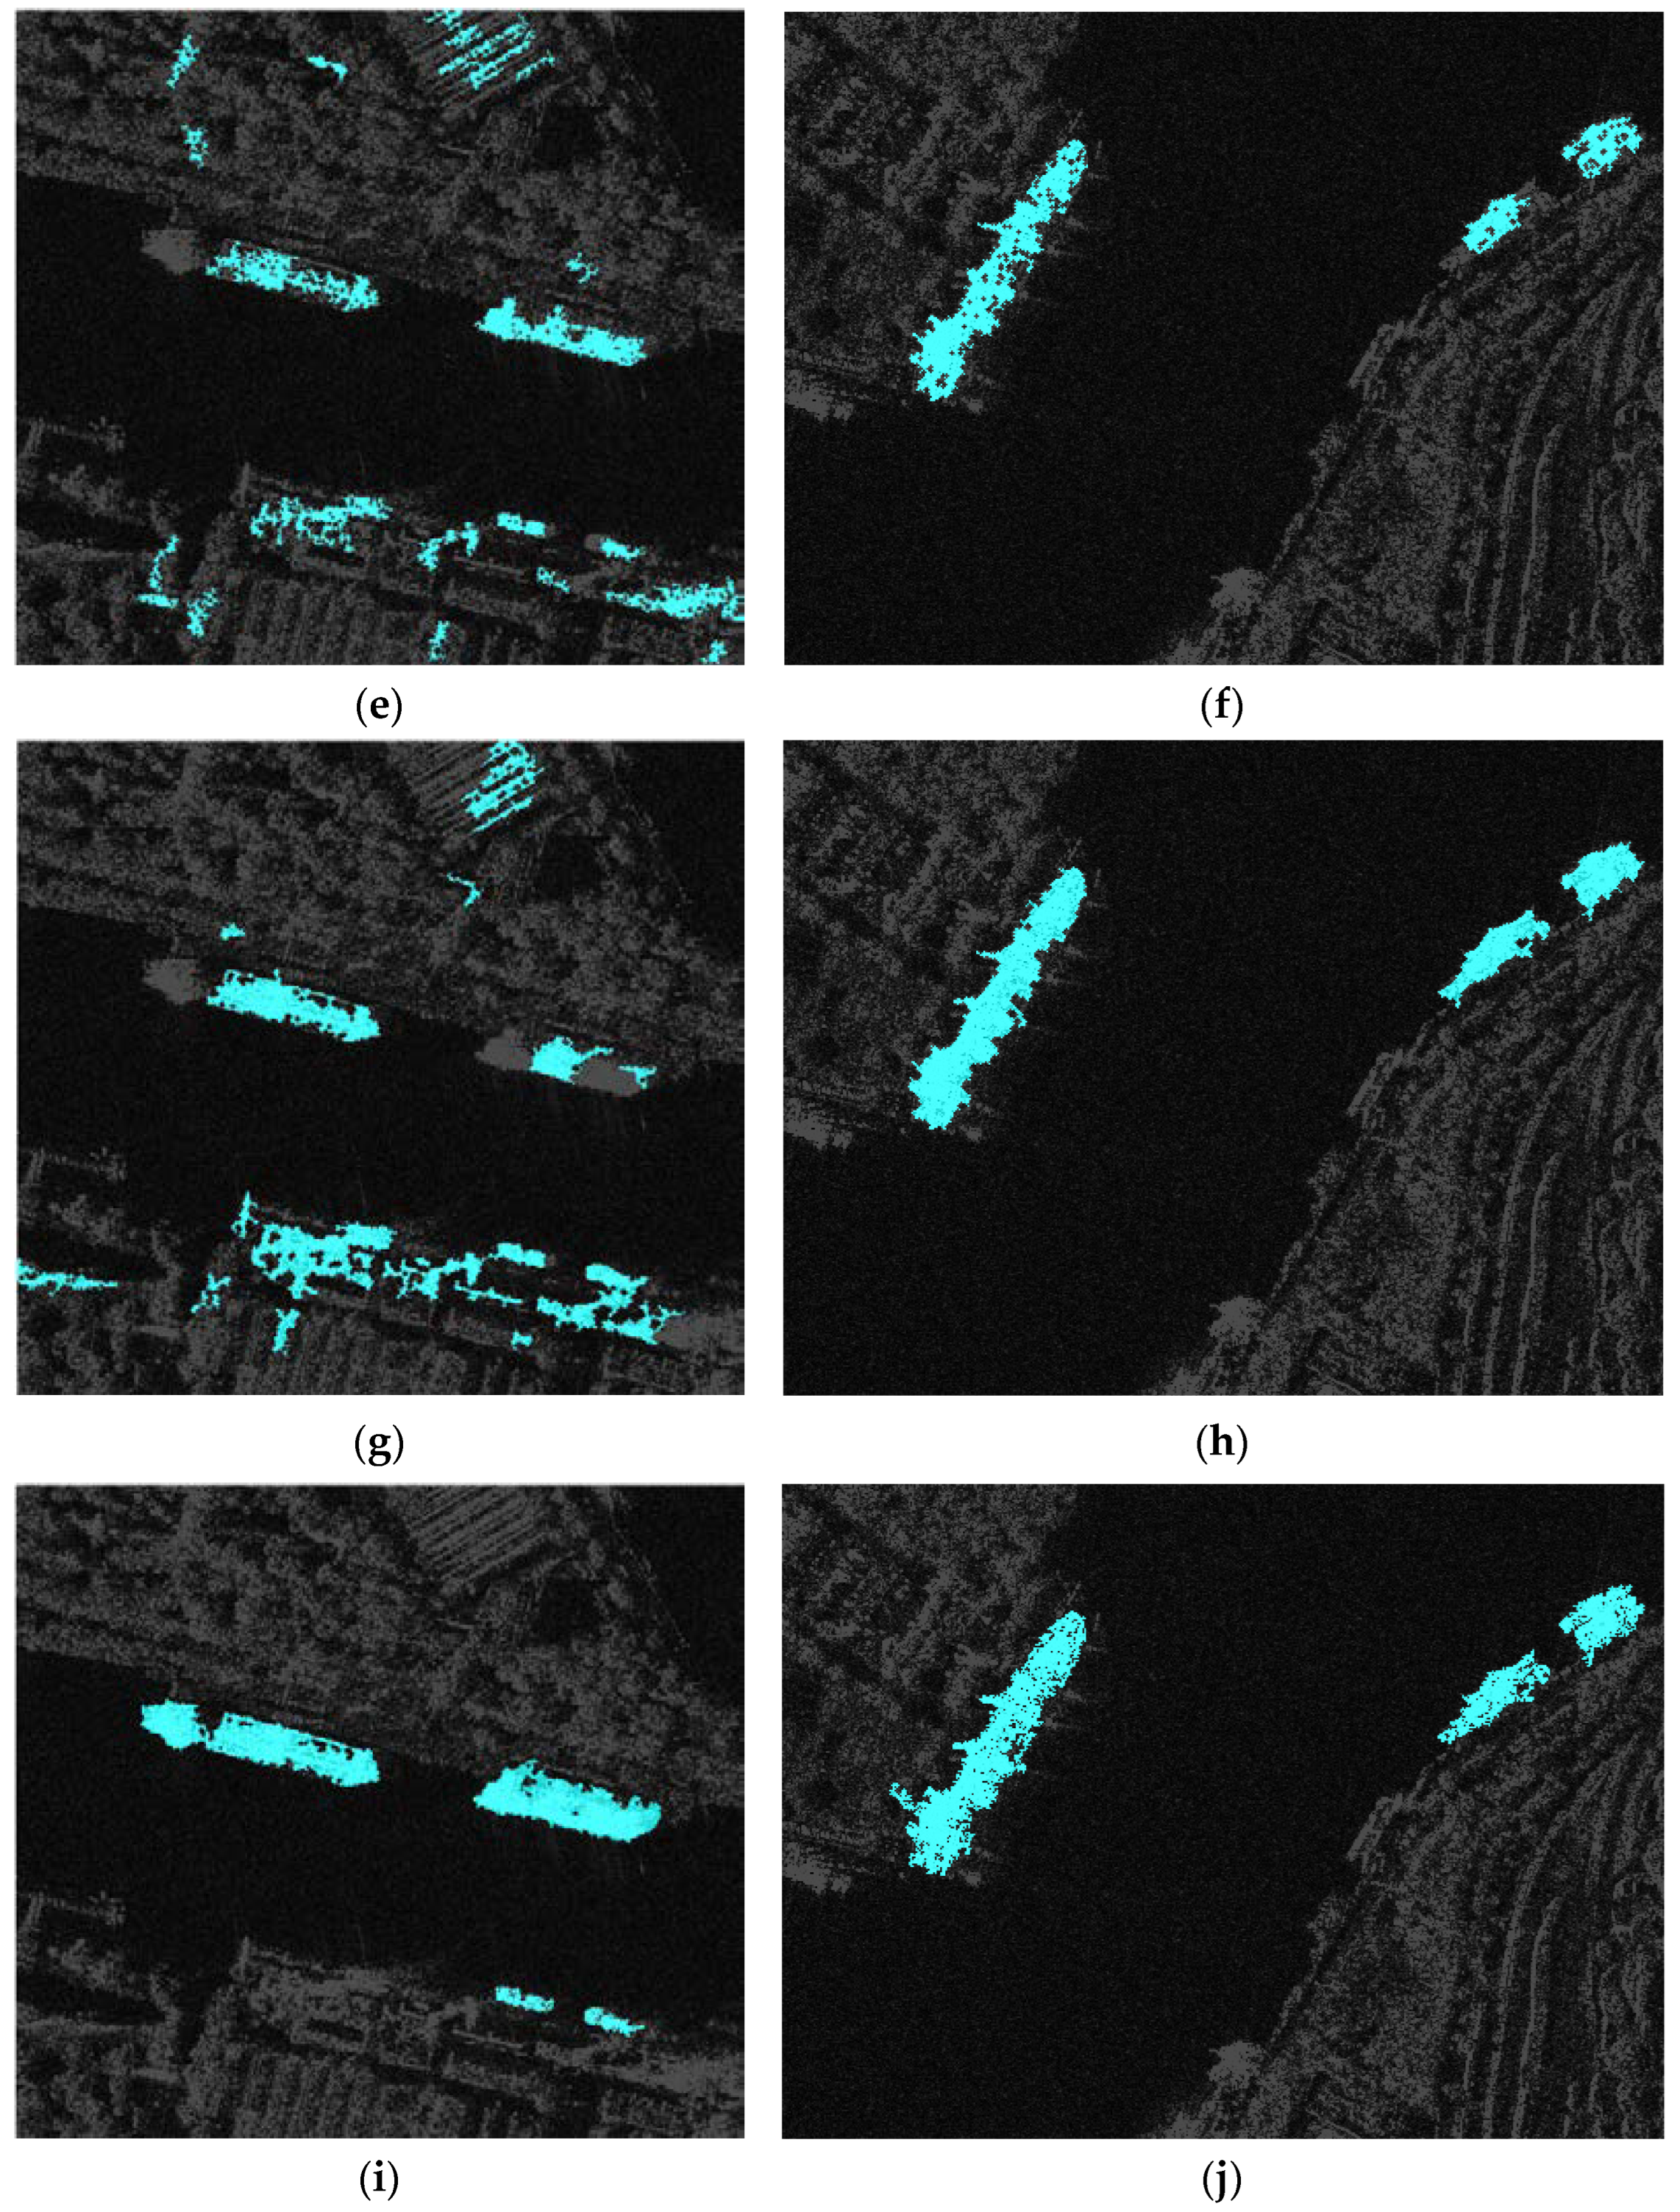
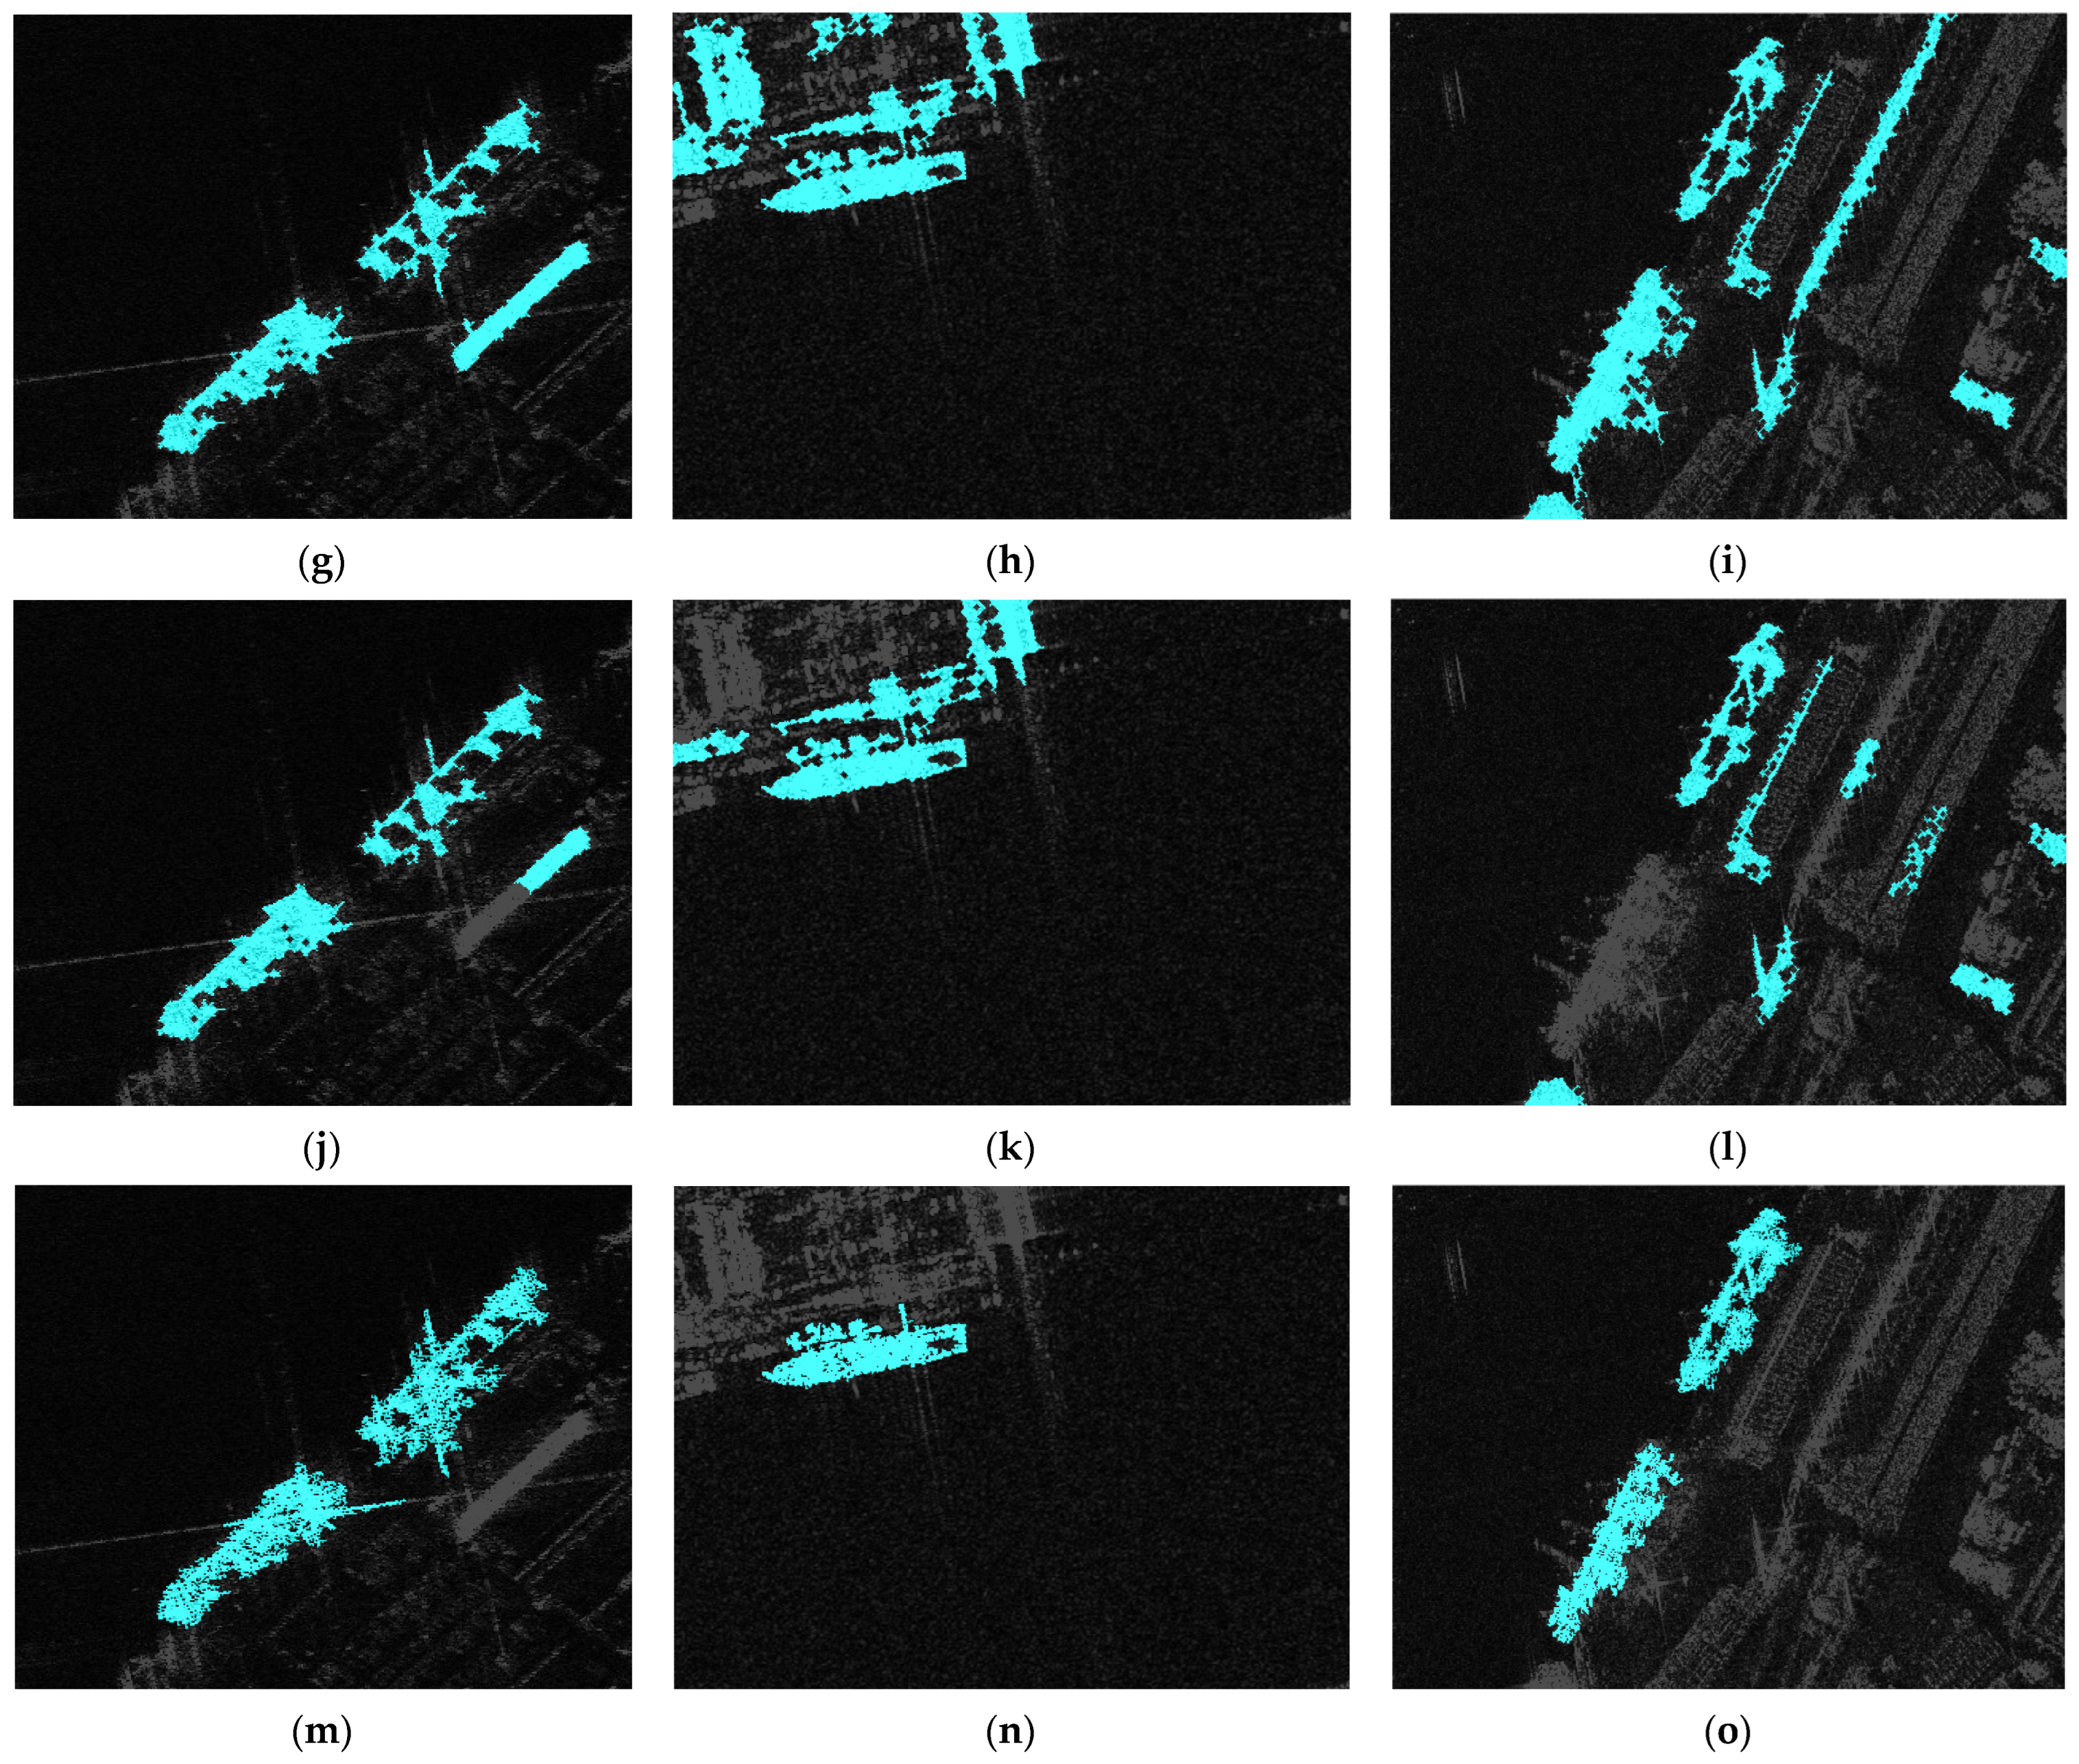
Figure 11 presents the detection results of the four methods on inshore scenes with confusing port facilities, in which Figure 11a–c show the SAR Images 5, 6, and 7 that were tested for detection with the ground truth marked by a red polygon. The size and resolution of the three images were listed in Table 5. Figure 11d–f show the detection results with the K-CFAR method. Both ships and confusing metallic port facilities are detected. The detection results in Figure 11g–i with the Gamma-CFAR method are quite similar to those using the K-CFAR method; the difference lies in the threshold value affected by different model fitting. Figure 11j–l show the detection results with the SLIC-CFAR method, in addition to false alarms, some parts of the metallic port facilities are missing in Figure 11j, and a whole target is miss detected in Figure 11l. The reason for the miss detection is that a local CFAR detector is applied to the detected SPs by comparing them with their neighboring SPs. When there are large bright structures in the image, the intensity of the neighboring SPs will be too high, resulting in miss detection of the central SPs. Figure 11m–o show the detection results of the proposed MMS method; all ship targets are detected with no false alarms (confusing port facilities), but there are some side lopes and land structures connected with the ship targets. Numerical results and computing time are listed in Table 6.
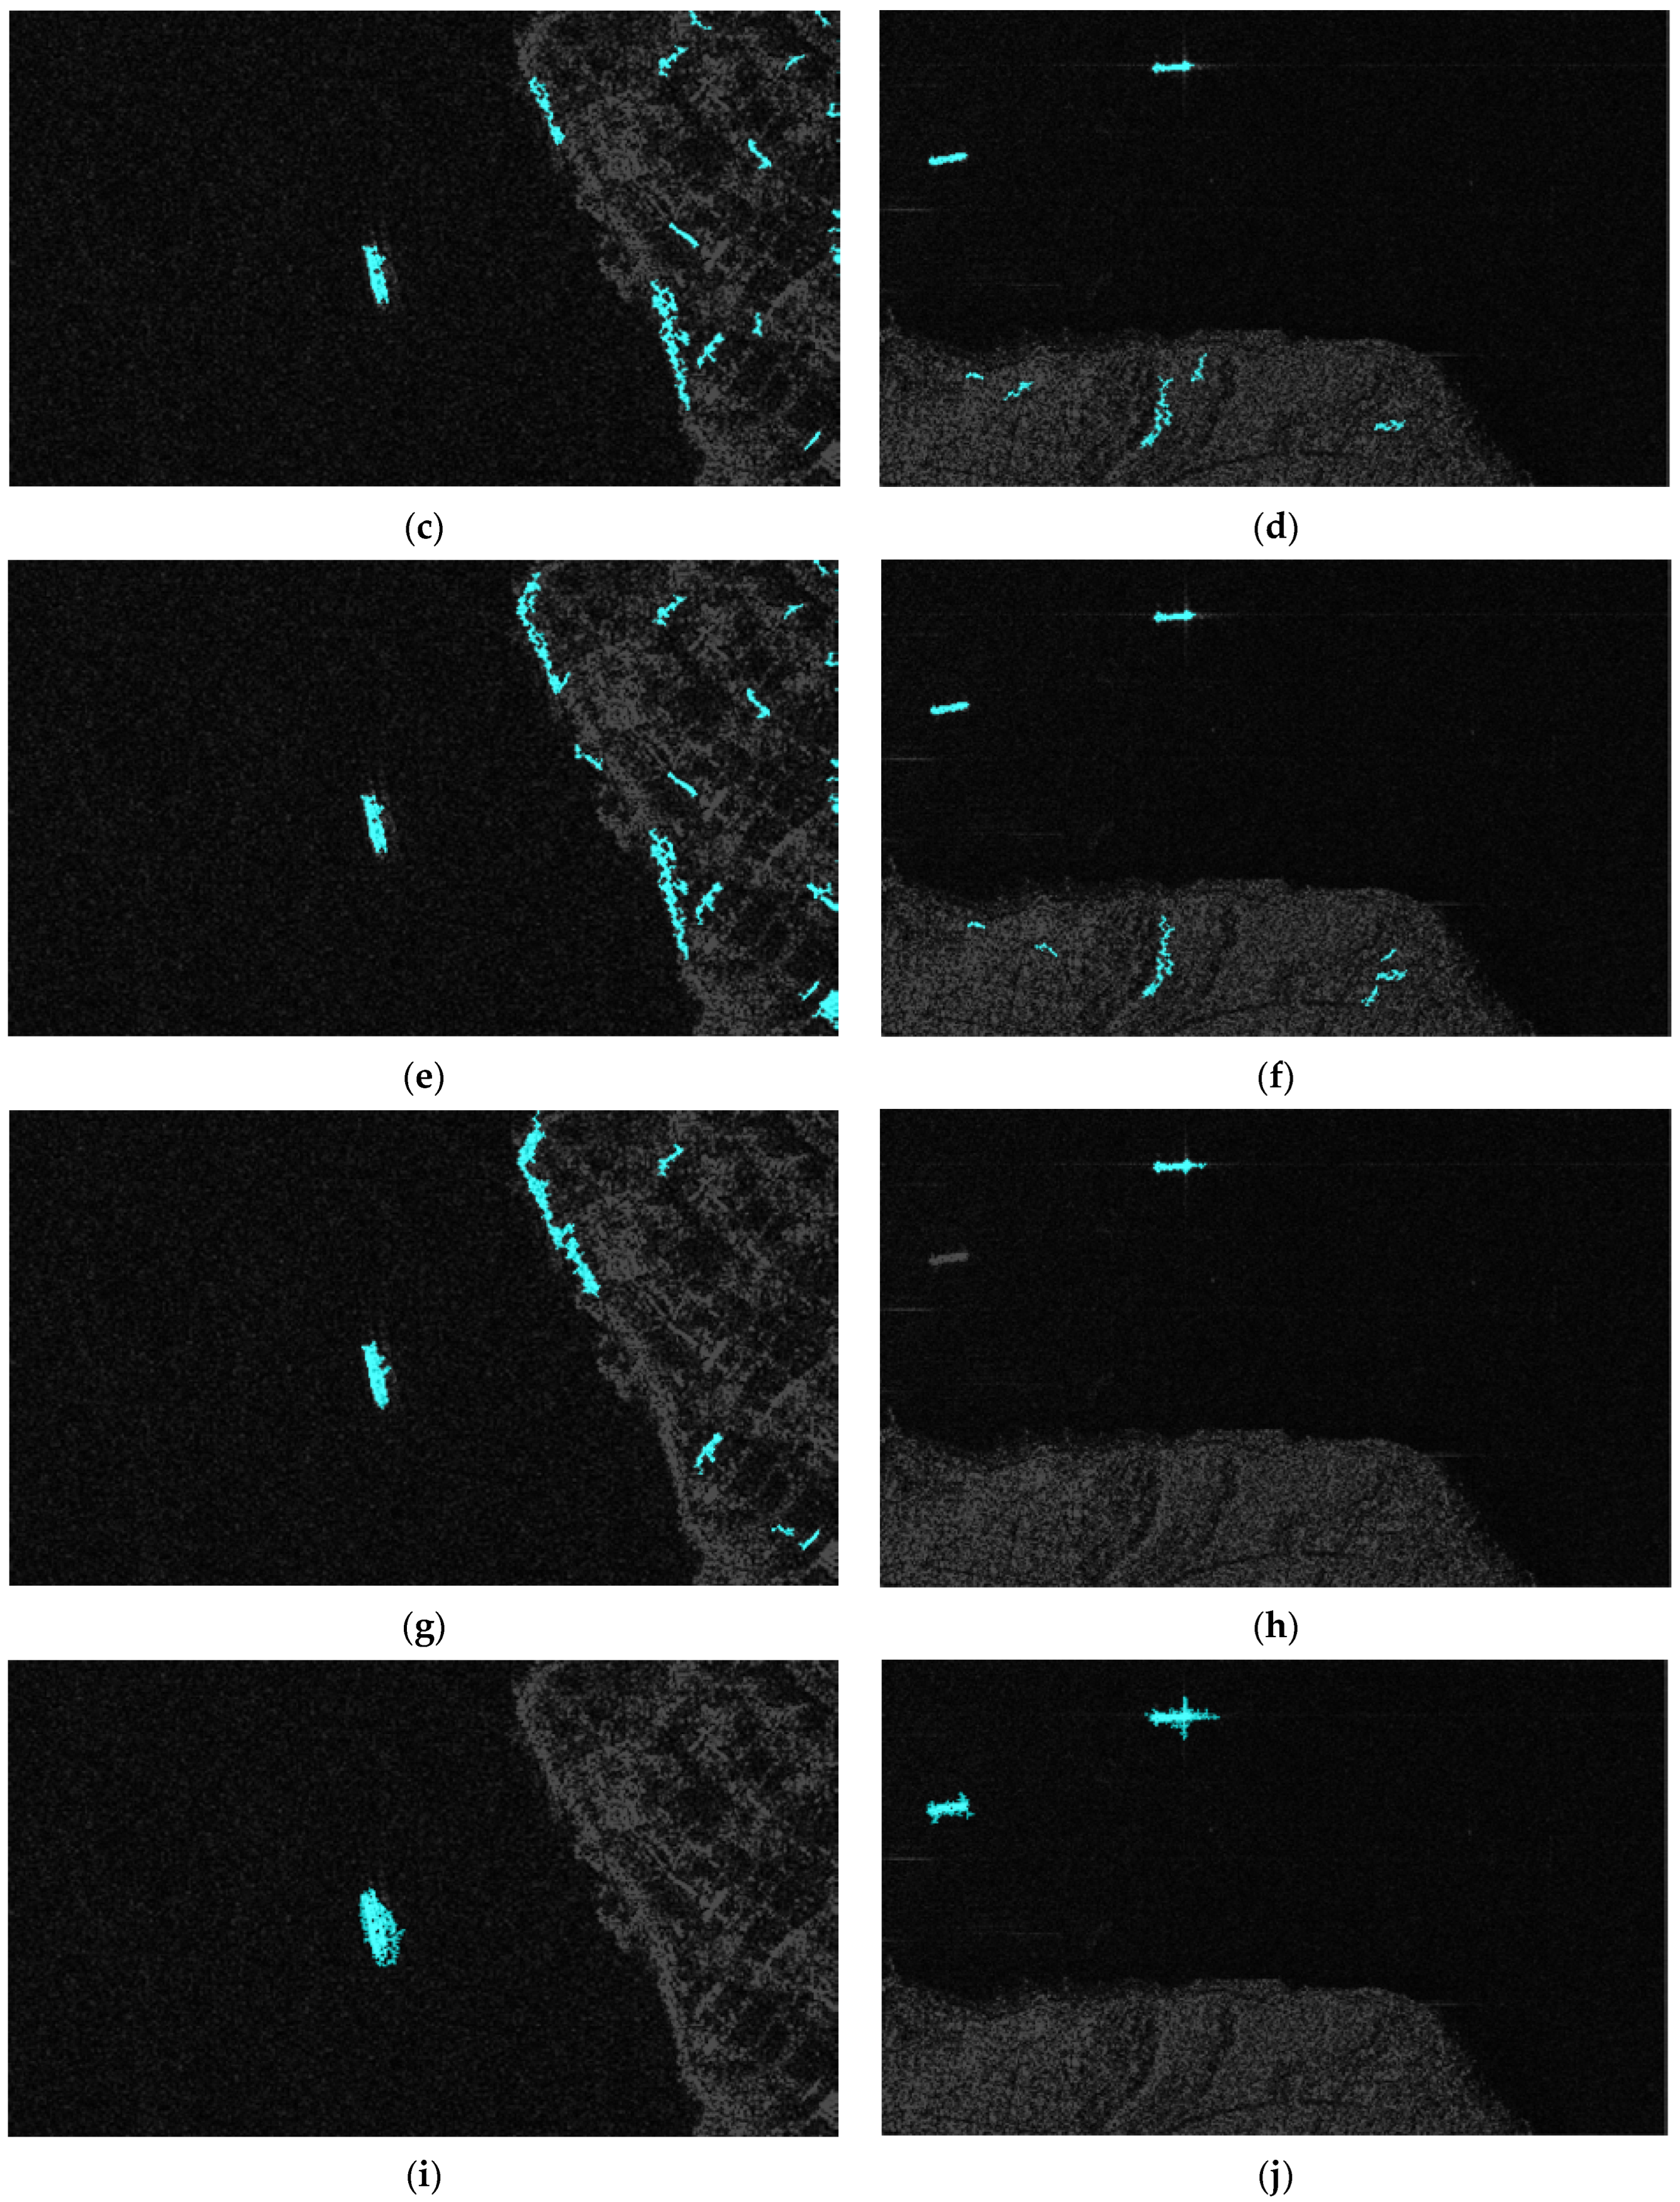
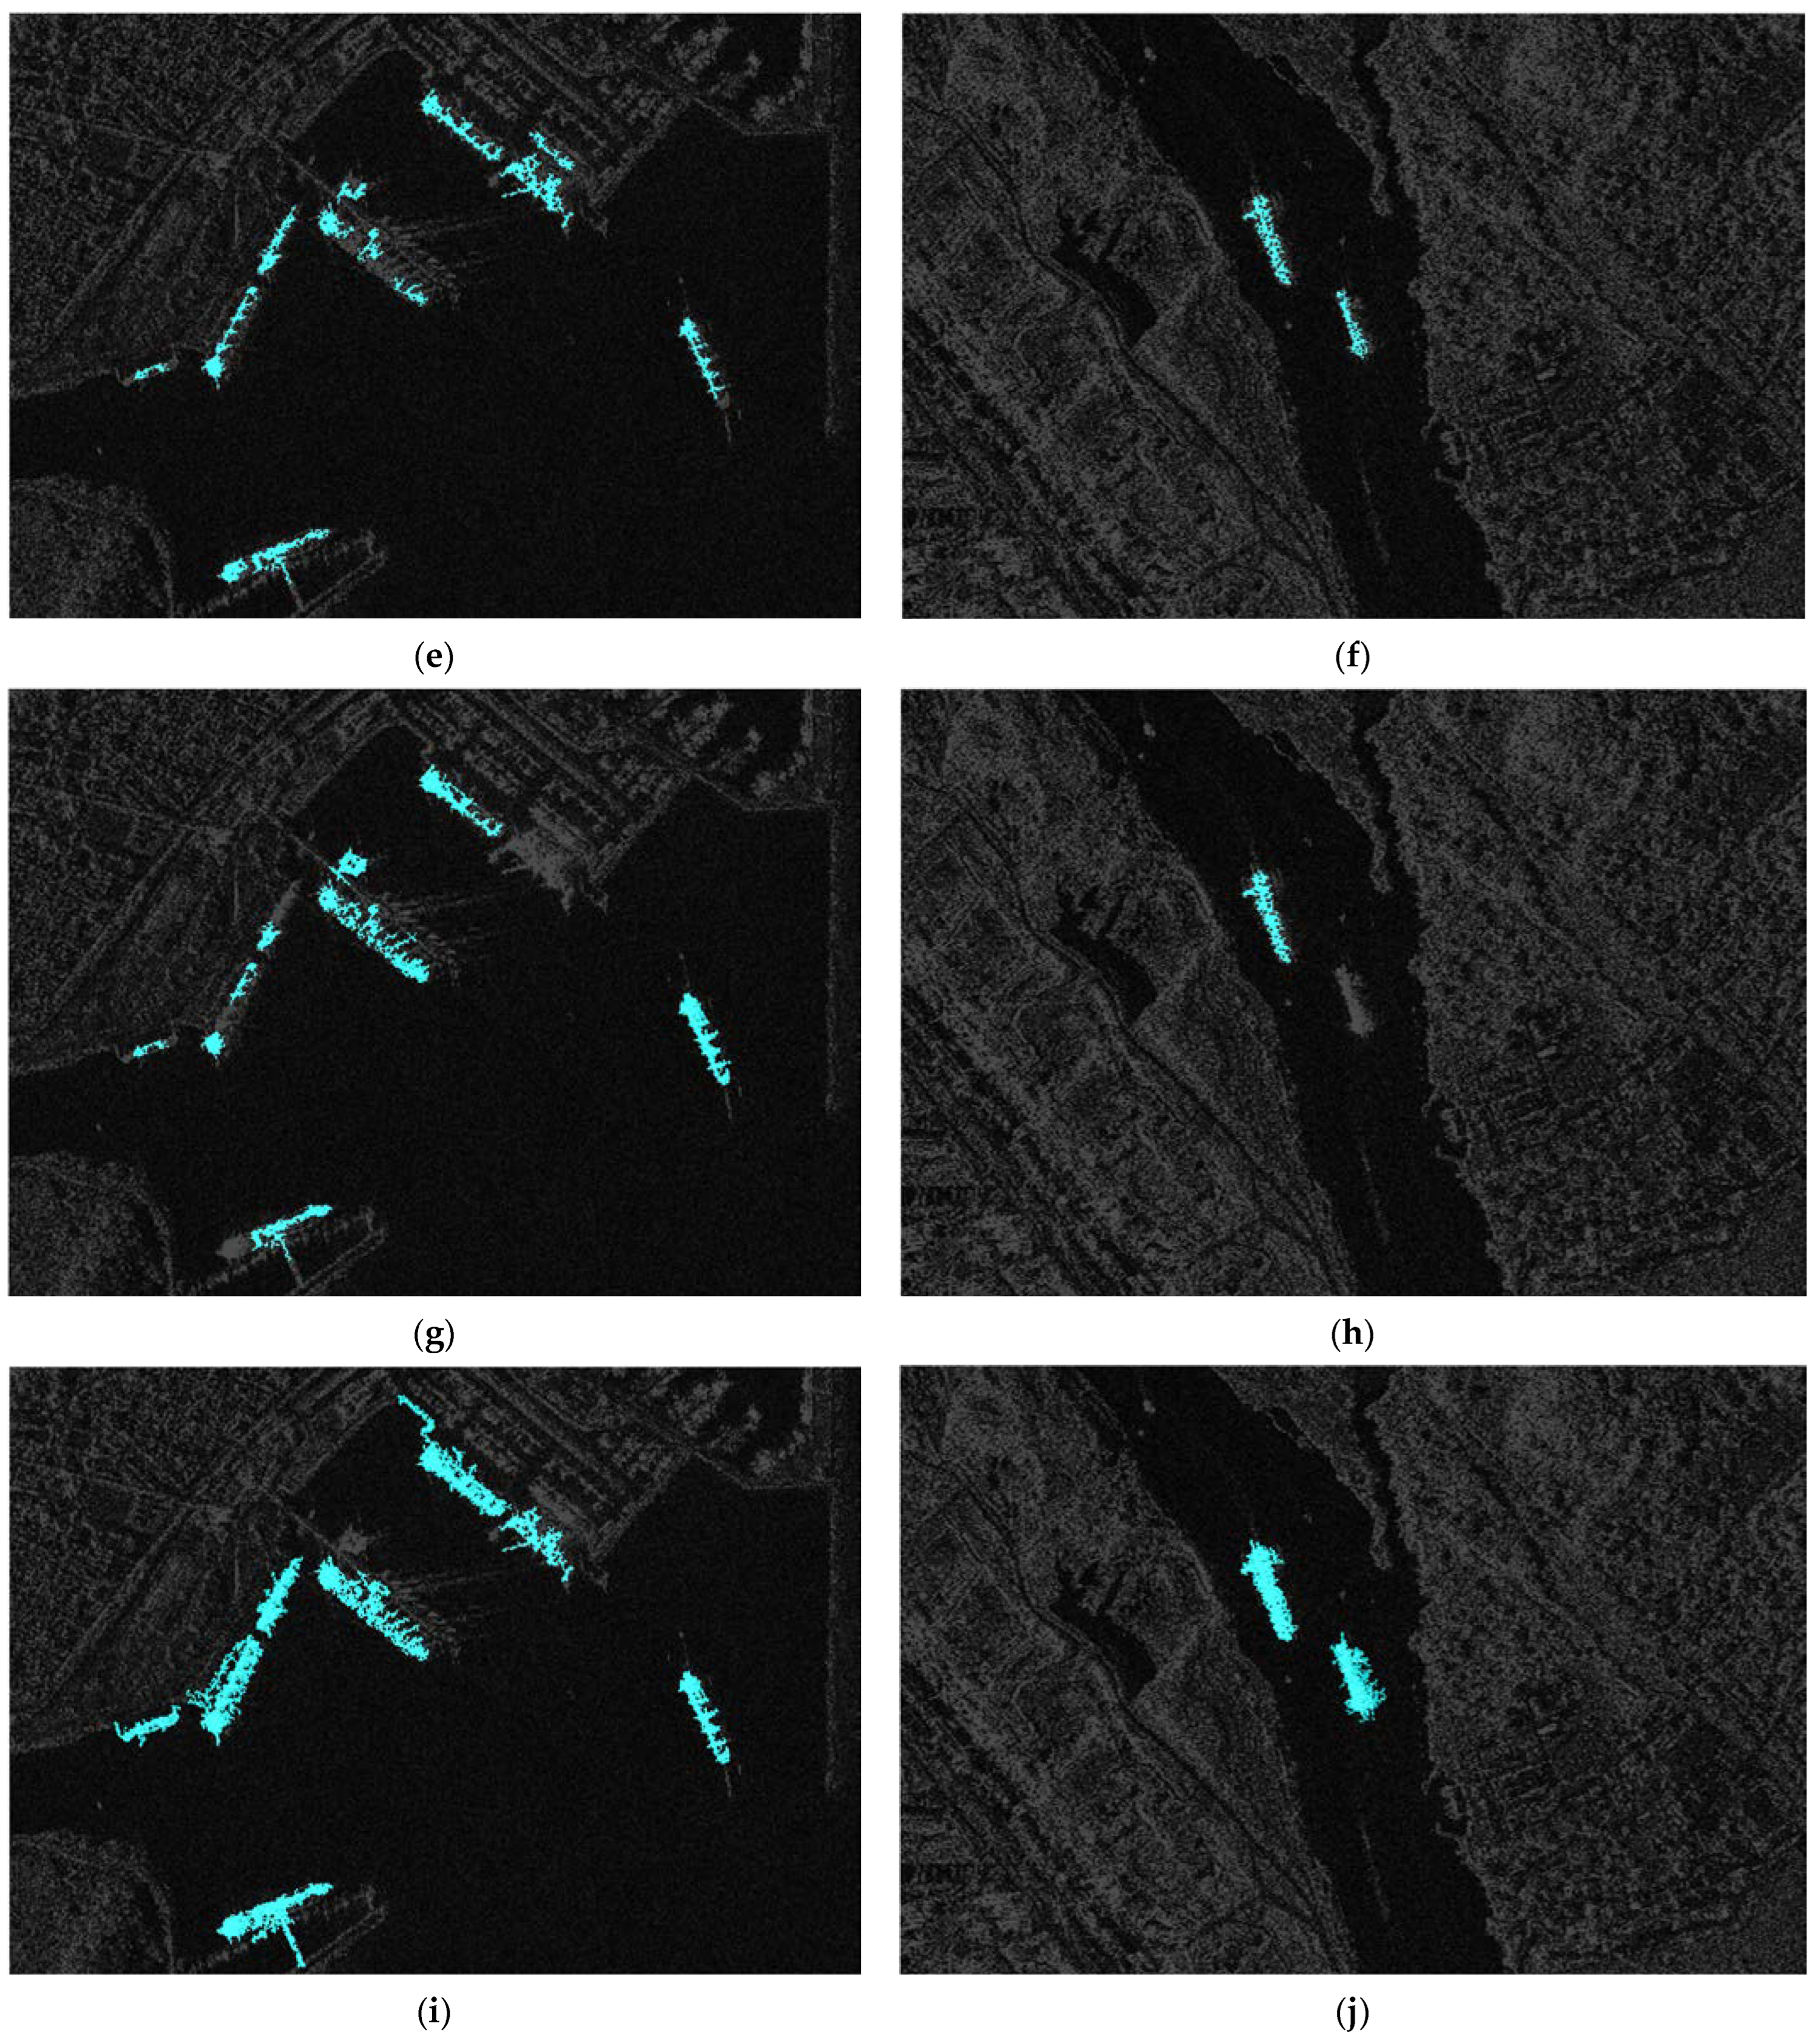
Figure 12 shows the detection results of the four methods on large scenes in which Figure 12a,b show the SAR Image 8 and 9 that were tested for detection with ground truth marked by a red polygon. For CFAR-based methods, the detection results show missing parts of the detected target ships with few false alarms, as shown in Figure 12c–f. The reason for the missing parts is due to the high threshold caused by the overfitting to land clutters, while few false alarms is because no confusing large port facilities exist in Image 8 and 9. For the SLIC-CFAR method, there are still missing targets, as shown in Figure 12g,h, due to the local CFAR procedure based on SPs. All ship targets are detected with no false alarms using the proposed MMS method, as shown in Figure 12i,j, while some land structures are connected with the detected targets in Figure 12i. The size and resolution of the three images were listed in Table 7. Numerical results and computing time are listed in Table 8.

4.3. Ablation Tests

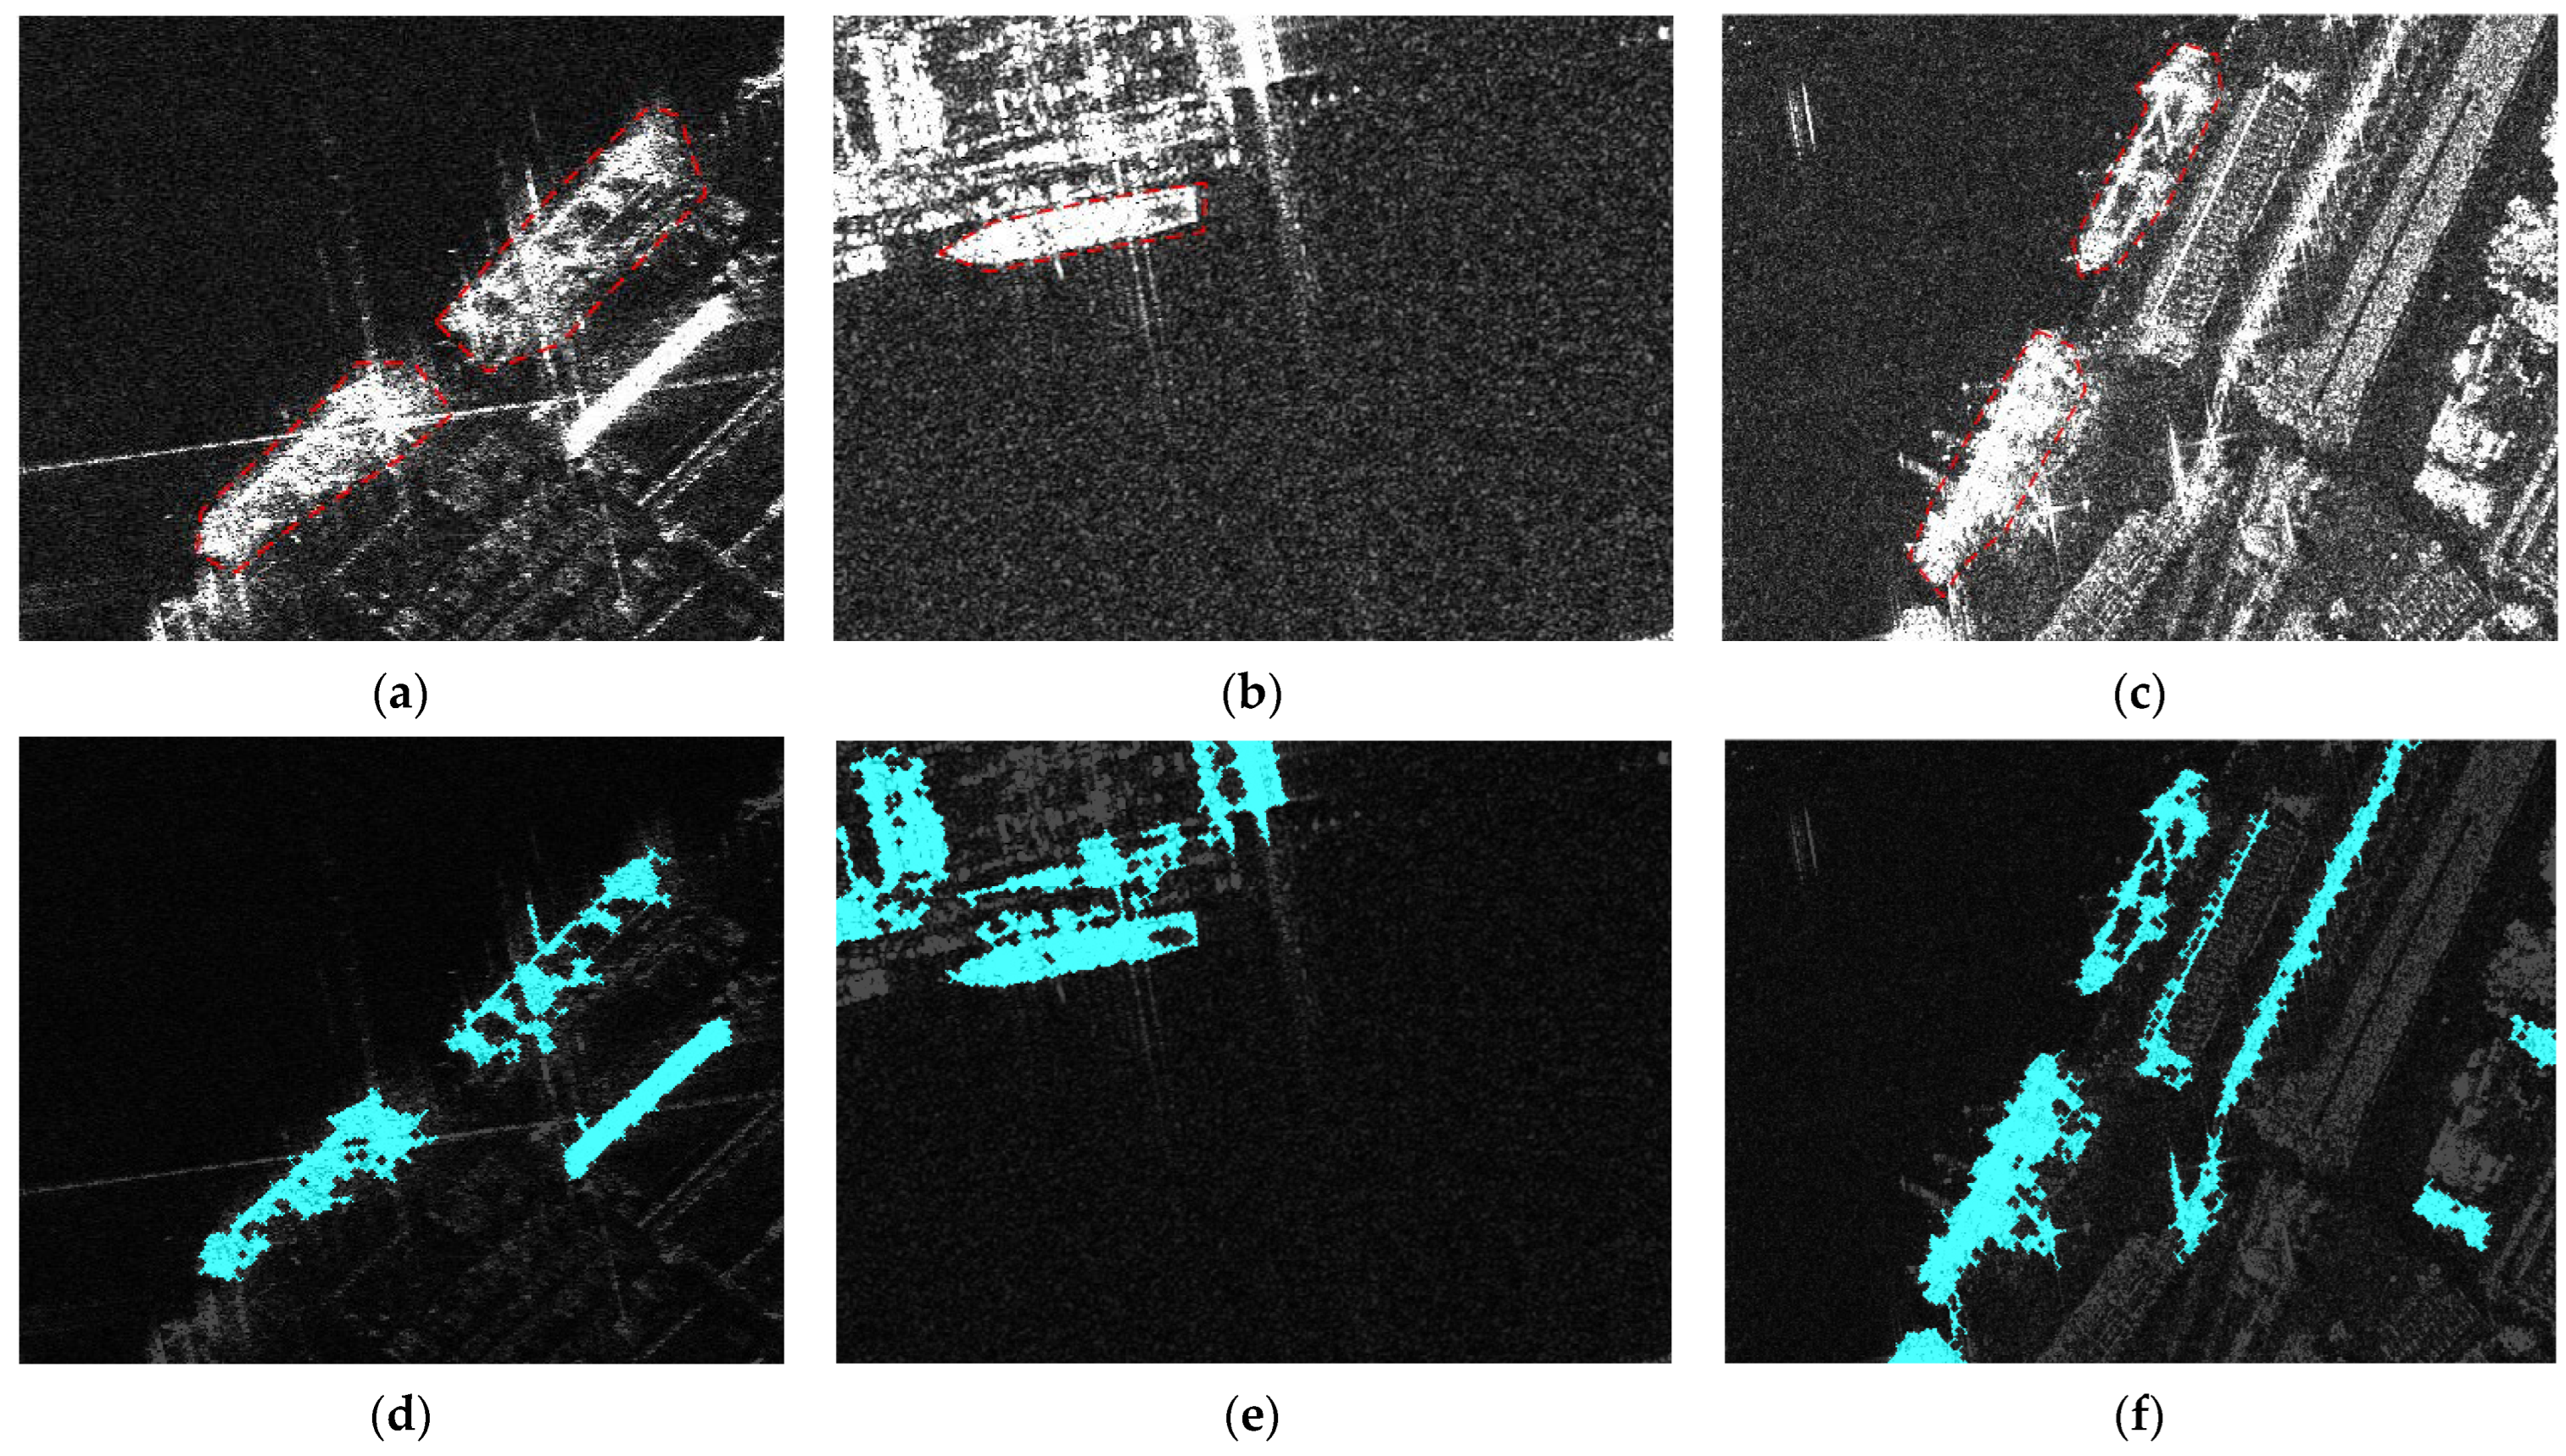
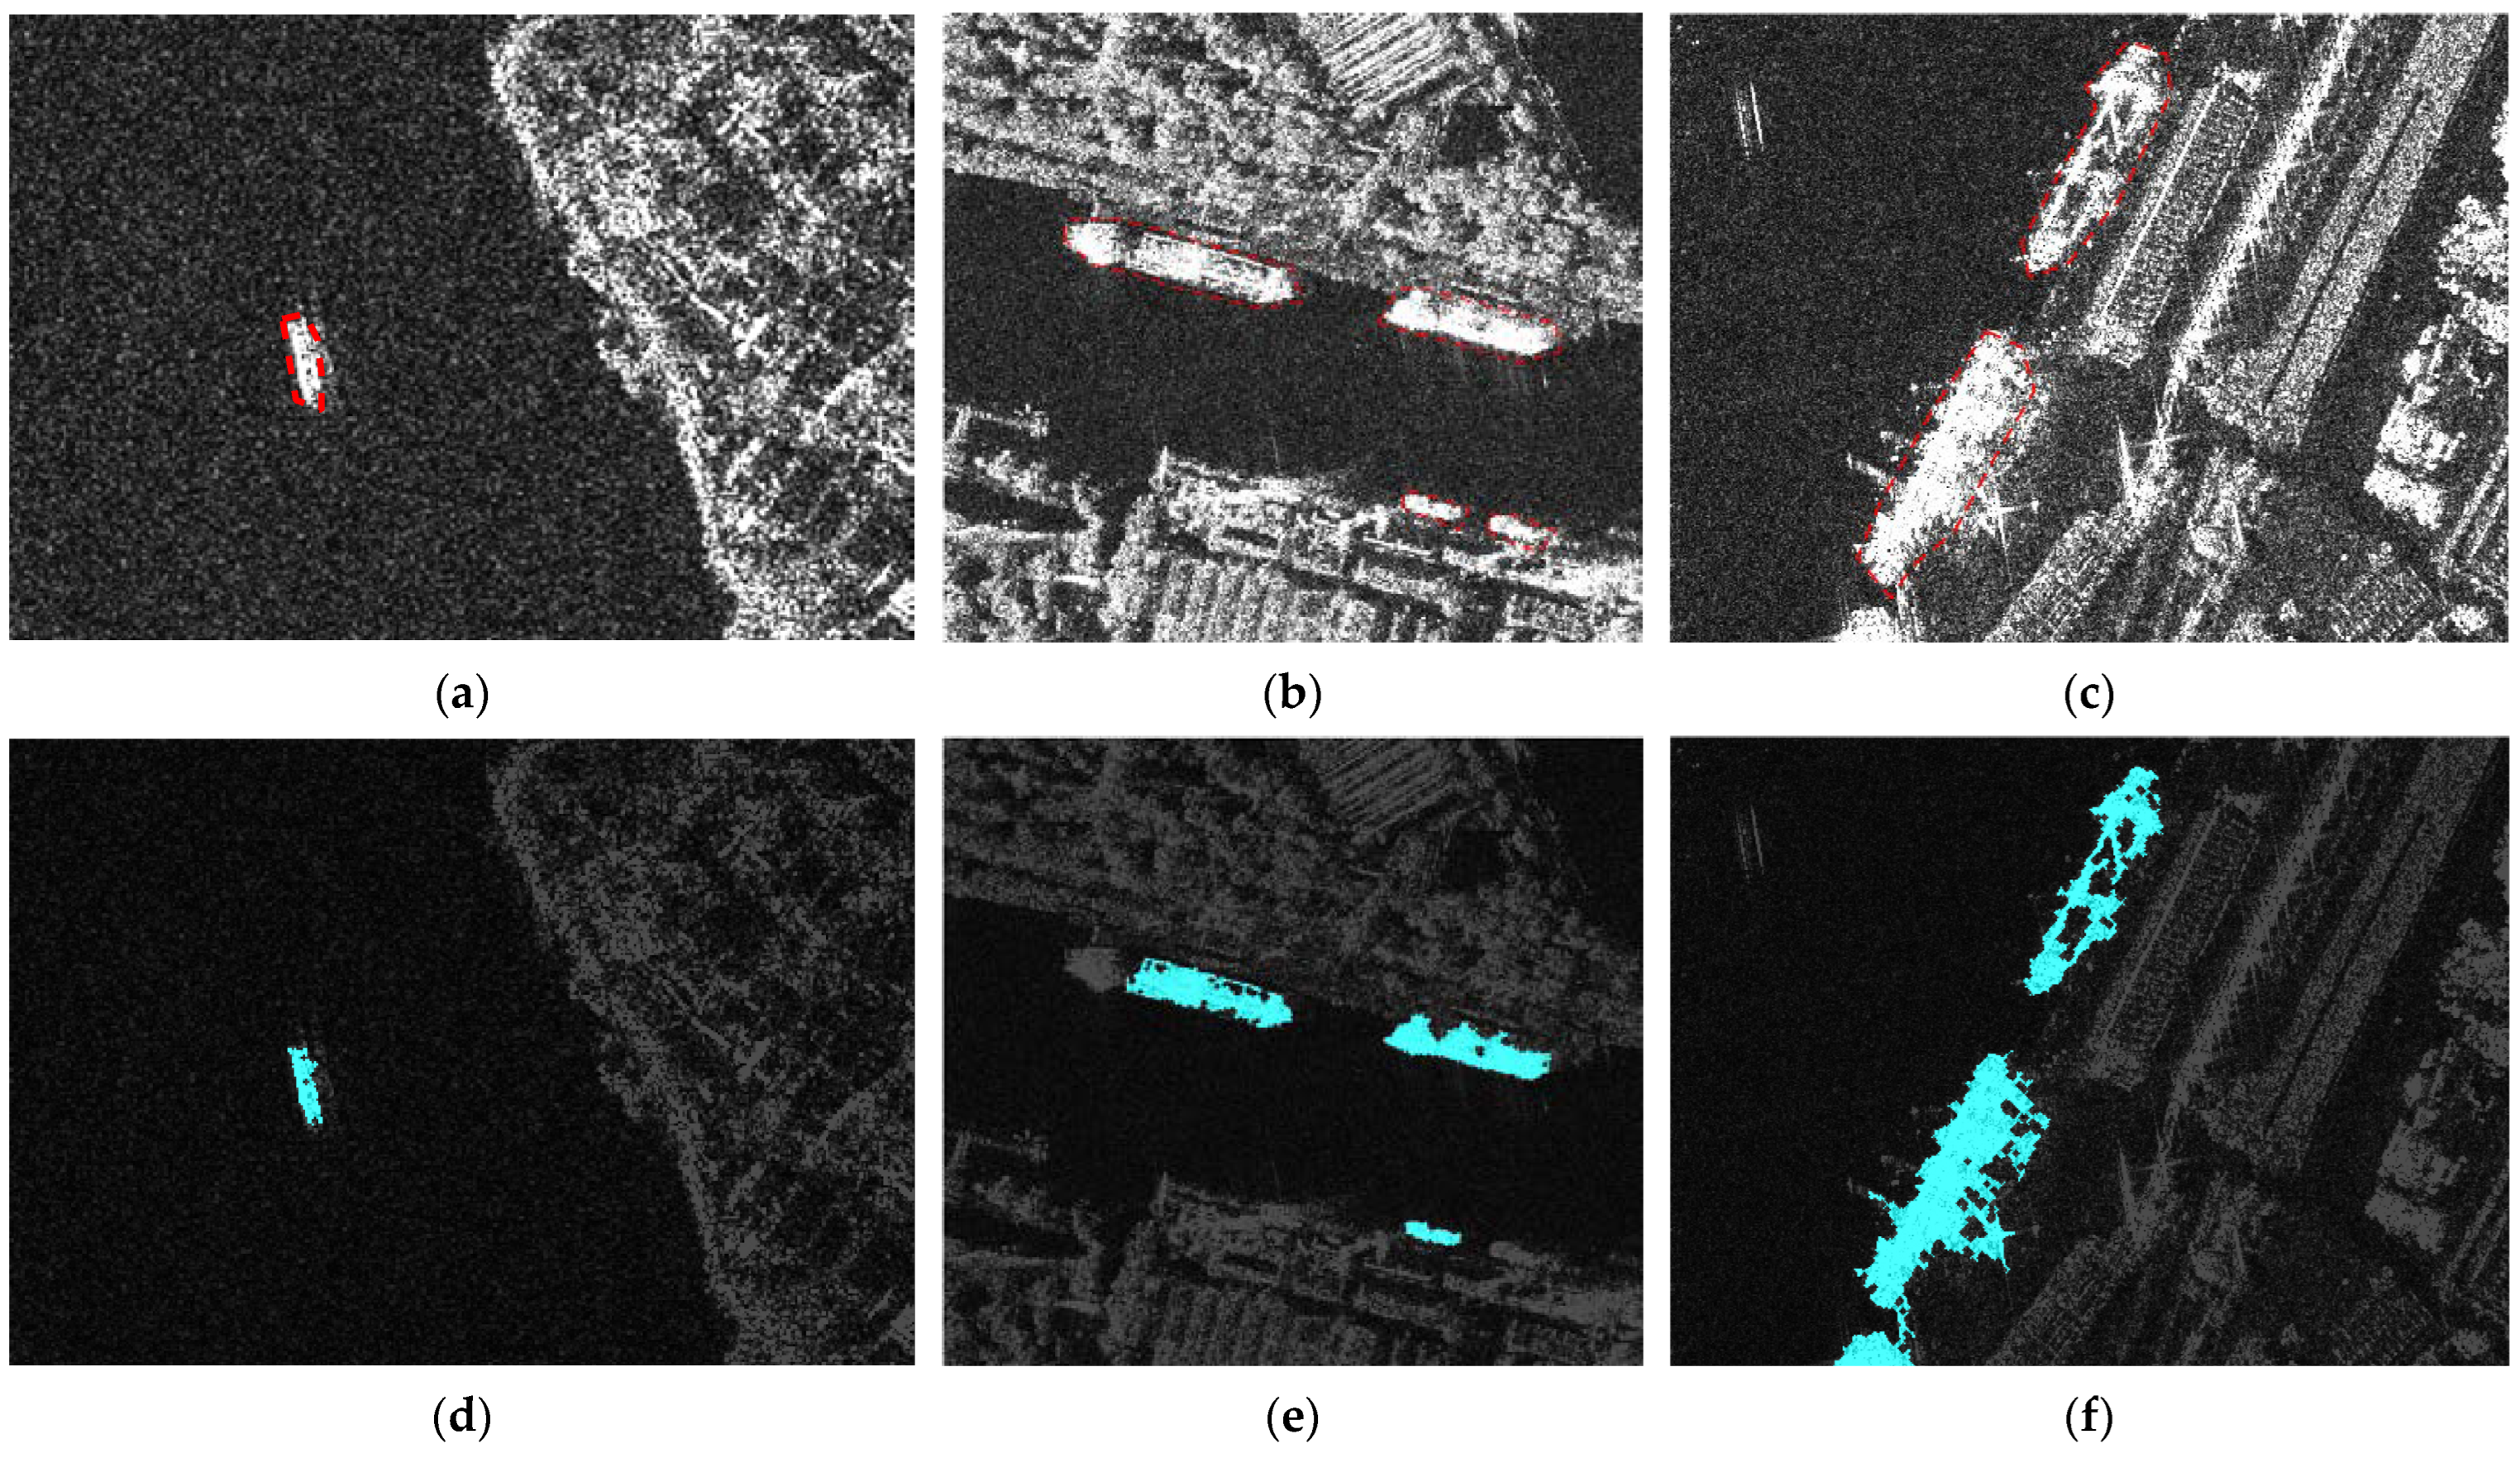
To further evaluate the concrete contributions of the saliency maps in our MMS method, we removed the OBSM, SPSM, and LSSM once each time and checked the performances of the degraded MMS methods. We thought it better to conduct the ablation tests on images with different scenes that other methods performed not well, so we chose Image 1 (offshore scene), Image 3 (inshore scene without port facilities), and Image 7 (inshore scene with confusing port facilities). The ISM is used as the backbone since it addresses the fundamental characteristics of pixel intensity, which is key to SAR ship detection; therefore, ISM is not included in the ablation test. Figure 13 shows the ablation tests, in which Figure 13d–f show the detection results without SPSM. The SPSM addresses the clustering characteristics of detected pixels, ships are often connected with other facilities, as shown in Figure 13f, and may be wrongly excluded, as shown in Figure 13e. Figure 13g–i show the detection results without LSSM, in which asymmetric land clutter clusters are detected along coast lines. Figure 13j–l show the detection results without OBSM; some concentrated land elements and facilities are falsely detected among the land regions.

5. Discussion and Conclusions

This paper proposed a novel multi-modality saliency (MMS) method for ship detection in SAR images with complex inshore scenes. The MMS method was validated on images with offshore scenes, inshore scenes without port facilities, inshore scenes with confusing port facilities, and large-scale scenes. The performance was compared with those of several existing methods to demonstrate the effectiveness and superiority. For all three scene types, the MMS method can successfully detect the ship targets without false alarms, while either miss detection or false alarms exist in the detection results of other methods. However, side lopes and some small land structures are found connected with the detected ships using MMS method, since a limitation of the MMS method is that it relies heavily on the performance of the MSER method for ship contour detection. A future research direction is to develop a clustering and pruning process for the MMS method for a more accurate ship contour, avoiding excluding ships connected with port facilities. Ablation tests are also conducted on three scene types to evaluate the concrete contributions of the saliency maps in our MMS method. Ships are falsely connected with land clutters without SPSM. Asymmetric land clutter clusters are detected along coast lines without LSSM. Concentrated land elements and facilities are falsely detected among the land regions without OBSM.
We can further draw the following conclusions from this paper: (1) It shows that the main elements of SAR images in complex scenes (noise, ship targets, and landforms) can be well separated by their scale difference from the perspective of surface metrology. This segmentation method is hardly affected by speckle noise, which surpasses most existing methods, such as Otsu’s method. This provides a novel interdisciplinary perspective for SAR image segmentation. (2) It utilizes the spatial characteristics of SAR image elements to mark the potential ships. For now, we only employ pixels with the most local stability, but further research can employ pixels with other extents of local stability for better ship locating. (3) It proposes a novel robust CFAR procedure that can eliminate the effects of noise and large ships on the background clutters’ statistical fitting. The robust KDE CFAR detection is just one application, and this procedure is also available for other statistical models. In summary, the proposed MMS method exploits multi-modality information of SAR images and transforms them into saliency maps. The fusion of these saliency maps enables effective and accurate ship detection in various scenes of SAR images. The experimental results demonstrate that the MMS method can achieve high detection performance in both inshore and offshore scenes, regardless of confusing port facilities, and outperforms the widely used methods, such as CFAR-based methods and super-pixel methods.
Author Contributions

Conceptualization, Z.C. and X.Z.; methodology, Z.C. and Z.D.; software, Z.C. and Y.Z.; validation, Z.C. and X.Z.; formal analysis, Z.C.; investigation, X.W.; resources, Z.C. and X.W.; data curation, Z.C.; writing—original draft preparation, Z.C.; writing—review and editing, Z.C., X.W. and X.Z.; visualization, Z.C.; supervision, Z.D.; project administration, Z.D.; funding acquisition, Z.D. All authors have read and agreed to the published version of the manuscript.

Funding

This research received no external funding.

Data Availability Statement

No new data were created or analyzed in this study. Data sharing is not applicable to this article. The SSDD dataset is available from https://github.com/TianwenZhang0825/Official-SSDD (accessed on 29 July 2023).

Acknowledgments

The authors would like to thank the editors and anonymous reviewers for their valuable comments that greatly improved our manuscript.

Conflicts of Interest

The authors declare no conflict of interest.

References

  1. Schwegmann, C.P.; Kleynhans, W.; Salmon, B.P. Manifold adaptation for constant false alarm rate ship detection in South African oceans. IEEE J. Sel. Top. Appl. Earth Obs. Remote Sens. 2015, 8, 3329–3337. [Google Scholar] [CrossRef] [Green Version]
  2. Wang, R.; Xu, F.; Pei, J.; Zhang, Q.; Huang, Y.; Zhang, Y.; Yang, J. Context semantic perception based on superpixel segmentation for inshore ship detection in SAR image. In Proceedings of the 2020 IEEE Radar Conference (RadarConf20), Florence, Italy, 21–25 September 2020; pp. 1–6. [Google Scholar]
  3. Zhai, L.; Li, Y.; Su, Y. Inshore ship detection via saliency and context information in high-resolution SAR images. IEEE Geosci. Remote Sens. Lett. 2016, 13, 1870–1874. [Google Scholar] [CrossRef]
  4. Leng, X.; Ji, K.; Yang, K.; Zou, H. A bilateral CFAR algorithm for ship detection in SAR images. IEEE Geosci. Remote Sens. Lett. 2015, 12, 1536–1540. [Google Scholar] [CrossRef]
  5. Li, J.; Xu, C.; Su, H.; Gao, L.; Wang, T. Deep Learning for SAR Ship Detection: Past, Present and Future. Remote Sens. 2022, 14, 2712. [Google Scholar] [CrossRef]
  6. Ai, J.; Qi, X.; Yu, W.; Deng, Y.; Liu, F.; Shi, L. A new CFAR ship detection algorithm based on 2-D joint log-normal distribution in SAR images. IEEE Geosci. Remote Sens. Lett. 2010, 7, 806–810. [Google Scholar] [CrossRef]
  7. Wang, X.; Li, G.; Zhang, X.-P.; He, Y. A fast CFAR algorithm based on density-censoring operation for ship detection in SAR images. IEEE Signal Process. Lett. 2021, 28, 1085–1089. [Google Scholar] [CrossRef]
  8. Liu, S.; Cao, Z.; Yang, H. Information theory-based target detection for high-resolution SAR image. IEEE Geosci. Remote Sens. Lett. 2016, 13, 404–408. [Google Scholar] [CrossRef]
  9. Tao, D.; Anthony, P.D.; Camilla, B. A segmentation-based CFAR detection algorithm using truncated statistics. IEEE Trans. Geosci. Remote Sens. 2016, 54, 2887–2898. [Google Scholar] [CrossRef] [Green Version]
  10. Arivazhagan, S.; Rosaline, M.M. Optimal Gabor sub-band-based spectral kurtosis and Teager Kaiser energy for maritime target detection in SAR images. In Signal, Image and Video Processing; Springer: Berlin/Heidelberg, Germany, 2022; pp. 1–9. [Google Scholar]
  11. Vatansever, S.; Dirik, A.E.; Memon, N. Detecting the presence of ENF signal in digital videos: A superpixel-based approach. IEEE Signal Process. Lett. 2017, 24, 1463–1467. [Google Scholar] [CrossRef] [Green Version]
  12. Li, T.; Peng, D.; Chen, Z.; Guo, B. Superpixel-Level CFAR detector based on truncated gamma distribution for SAR images. IEEE Geosci. Remote Sens. Lett. 2020, 18, 1421–1425. [Google Scholar] [CrossRef]
  13. Achanta, R.; Shaji, A.; Smith, K.; Lucchi, A.; Fua, P.; Süsstrunk, S. SLIC superpixels compared to state-of-the-art superpixel methods. IEEE Trans. Pattern Anal. Mach. Intell. 2012, 34, 2274–2282. [Google Scholar] [CrossRef] [Green Version]
  14. Matas, J.; Chum, O.; Urban, M.; Pajdla, T. Robust wide-baseline stereo from maximally stable extremal regions. Image and Vision Computing 2004, 22, 761–767. [Google Scholar] [CrossRef]
  15. Sun, K.; Ma, L.; Wang, F.; Liang, Y. Ship detection method based on frequency enhanced MSER for high resolution SAR image. In Proceedings of the 2nd China International SAR Symposium (CISS), Shanghai, China, 3–5 November 2021; pp. 1–4. [Google Scholar]
  16. Wang, R.; Huang, Y.; Zhang, Y.; Pei, J.; Wu, J.; Yang, J. An inshore ship detection method in SAR images based on contextual fluctuation information. In Proceedings of the 2019 6th Asia-Pacific Conference on Synthetic Aperture Radar, Xiamen, China, 26–29 November 2019; pp. 1–5. [Google Scholar]
  17. Zhai, L.; Li, Y.; Su, Y. Segmentation-based ship detection in harbor for SAR images. In Proceedings of the 2016 CIE International Conference on Radar (RADAR), Guangzhou, China, 10–13 October 2016; pp. 1–4. [Google Scholar]
  18. Zhang, L.; Yang, K. Region-of-interest extraction based on frequency domain analysis and salient region detection for remote sensing image. IEEE Geosci. Remote Sens. Lett. 2013, 11, 916–920. [Google Scholar] [CrossRef]
  19. Li, H.; Yu, X.; Wang, X. A saliency-based method for SAR target detection. In Proceedings of the 2018 IEEE International Geoscience and Remote Sensing Symposium, Valencia, Spain, 22–27 July 2018; pp. 2837–2840. [Google Scholar]
  20. Ni, J.C.; Luo, Y.; Wang, D.; Liang, J.; Zhang, Q. Saliency-based SAR target detection via convolutional sparse feature enhancement and Bayesian inference. IEEE Trans. Geosci. Remote Sens. 2023, 61, 22545617. [Google Scholar] [CrossRef]
  21. Chen, Y.; Xin, Y. An efficient infrared small target detection method based on visual contrast mechanism. IEEE Geosci. Remote Sens. Lett. 2016, 13, 962–966. [Google Scholar] [CrossRef]
  22. Sharifzadeh, F.; Akbarizadeh, G.; Kavian, Y.S. Ship classification in SAR images using a new hybrid CNN–MLP classifier. J. Indian Soc. Remote Sens. 2019, 47, 551–562. [Google Scholar] [CrossRef]
  23. Samadi, F.; Akbarizadeh, G.; Kaabi, H. Change detection in SAR images using deep belief network: A new training approach based on morphological images. IET Image Process. 2019, 13, 2255–2264. [Google Scholar] [CrossRef]
  24. Zalpour, M.; Akbarizadeh, G.; Alaei-Sheini, N. A new approach for oil tank detection using deep learning features with control false alarm rate in high-resolution satellite imagery. Int. J. Remote Sens. 2020, 41, 2239–2262. [Google Scholar] [CrossRef]
  25. Qian, X.; Lin, S.; Cheng, G.; Yao, X.; Ren, H.; Wang, W. Object detection in remote sensing images based on improved bounding box regression and multi-level features fusion. Remote Sens. 2020, 12, 143. [Google Scholar] [CrossRef] [Green Version]
  26. Liu, W.; Zhang, C.; Ding, H.; Hung, T.Y.; Lin, G. Few-shot segmentation with optimal transport matching and message flow. arXiv 2021, arXiv:2108.08518. [Google Scholar] [CrossRef]
  27. Lin, S.; Zhang, M.; Cheng, X.; Zhou, K.; Zhao, S.; Wang, H. Dual collaborative constraints regularized low-rank and sparse representation via robust dictionaries construction for hyperspectral anomaly detection. IEEE J. Sel. Top. Appl. Earth Obs. Remote Sens. 2022, 16, 2009–2024. [Google Scholar] [CrossRef]
  28. Shen, Z.; Liu, J.; He, Y.; Zhang, X.; Xu, R.; Yu, H.; Cui, P. Towards out-of-distribution generalization: A survey. arXiv 2021, arXiv:2108.13624. [Google Scholar]
  29. Du, C.; Zhang, L. Adversarial attack for SAR target recognition based on UNet-Generative adversarial network. Remote Sens. 2021, 13, 4358. [Google Scholar] [CrossRef]
  30. Huang, Z.; Yao, X.; Liu, Y.; Dumitru, C.O.; Datcu, M.; Han, J. Physically explainable CNN for SAR image classification. ISPRS J. Photogramm. Remote Sens. 2022, 190, 25–37. [Google Scholar] [CrossRef]
  31. Ao, W.; Xu, F. Robust ship detection in SAR images from complex background. In Proceedings of the 2018 IEEE International Conference on Computational Electromagnetics (ICCEM), Chengdu, China, 26–28 March 2018; pp. 1–2. [Google Scholar]
  32. Wang, Z.; Wang, C.; Zhang, H.; Wang, F.; Jin, F.; Xie, L. SAR-based ship detection in sea areas containing small islands. In Proceedings of the 2015 IEEE 5th Asia-Pacific Conference on Synthetic Aperture Radar (APSAR), Singapore, 1–4 September 2015; pp. 591–595. [Google Scholar]
  33. Lin, H.; Chen, H.; Jin, K.; Zeng, L.; Yang, J. Ship detection with superpixel-level Fisher vector in high-resolution SAR images. IEEE Geosci. Remote Sens. Lett. 2019, 17, 247–251. [Google Scholar] [CrossRef]
  34. Cui, X.; Su, Y.; Chen, S. A saliency detector for polarimetric SAR ship detection using similarity test. IEEE J. Sel. Top. Appl. Earth Obs. Remote Sens. 2019, 12, 3423–3433. [Google Scholar] [CrossRef]
  35. Yang, M.; Guo, C.; Zhong, H.; Yin, H. A curvature-based saliency method for ship detection in SAR images. IEEE Geosci. Remote Sens. Lett. 2020, 18, 1590–1594. [Google Scholar] [CrossRef]
  36. Xie, T.; Zhang, W.; Yang, L.; Wang, Q.; Huang, J.; Yuan, N. Inshore ship detection based on level set method and visual saliency for SAR images. Sensors 2018, 18, 3877. [Google Scholar] [CrossRef] [Green Version]
  37. An, Q.; Pan, Z.; Liu, L.; You, H. DrBox-v2: An improved detector with rotatable boxes for target detection in SAR images. IEEE Trans. Geosci. Remote Sens. 2019, 57, 8333–8349. [Google Scholar] [CrossRef]
  38. Chen, C.; He, C.; Hu, C.; Pei, H.; Jiao, L. A deep neural network based on an attention mechanism for SAR ship detection in multiscale and complex scenarios. IEEE Access 2019, 7, 104848–104863. [Google Scholar] [CrossRef]
  39. Rezatofighi, H.; Tsoi, N.; Gwak, J.; Sadeghian, A.; Reid, I.; Savarese, S. Generalized intersection over union: A metric and a loss for bounding box regression. In Proceedings of the IEEE/CVF Conference on Computer Vision and Pattern Recognition (CVPR), Long Beach, CA, USA, 15–20 June 2019; pp. 658–666. [Google Scholar]
  40. Ward, K.D.; Tough, R.J.A. Sea clutter: Scattering, the K Distribution and Radar Performance; The Institution of Engineering and Technology: London, UK, 2006. [Google Scholar]
  41. Hill, P.D. Kernel estimation of a distribution function. Commun. Stat. Theory Methods 1985, 14, 605–620. [Google Scholar]
  42. Silverman, B.W. Density Estimation for Statistics and Data Analysis; Chapman & Hall/CRC: London, UK, 1986. [Google Scholar]
  43. Muralikrishnan, B.; Raja, J. Computational Surface and Roundness Metrology; Springer Science & Business Media: Berlin/Heidelberg, Germany, 2008. [Google Scholar]
  44. Zeng, W.; Jiang, X.; Scott, P.J. Fast algorithm of the robust Gaussian regression filter for areal surface analysis. Meas. Sci. Technol. 2010, 21, 055108. [Google Scholar] [CrossRef]
  45. Wang, Z.; Bovik, A.C.; Sheikh, H.R.; Simoncelli, E.P. Image quality assessment: From error visibility to structural similarity. IEEE Trans. Image Process. 2004, 13, 600–612. [Google Scholar] [CrossRef] [PubMed] [Green Version]
  46. Otsu, N. A threshold selection method from gray-level histograms. IEEE Trans. Syst. Man Cybern. 1979, 9, 62–66. [Google Scholar] [CrossRef] [Green Version]
  47. Lagarias, J.C.; Reeds, J.A.; Wright, M.H.; Wright, P.E. Convergence properties of the Nelder-Mead simplex method in low dimensions. SIAM J. Optim. 1998, 9, 112–147. [Google Scholar] [CrossRef] [Green Version]
  48. Zhang, T.; Zhang, X.; Li, J.; Xu, X.; Wang, B.; Zhan, X.; Xu, Y.; Ke, X.; Zeng, T.; Su, H.; et al. SAR ship detection dataset (SSDD): Official release and comprehensive data analysis. Remote Sens. 2021, 13, 3690. [Google Scholar] [CrossRef]
Figure 1. The workflow of the proposed multi-modality saliency ship detection method.
Remotesensing 15 03868 g001
Figure 2. Nested and non-nested MSER region extractions of a SAR image.
Remotesensing 15 03868 g002
Figure 3. The fitting results between the KDE distribution and robust KDE distribution.
Remotesensing 15 03868 g003
Figure 4. The results between the KDE CFAR and robust KDE CFAR detectors.
Remotesensing 15 03868 g004
Figure 5. The LSSM generation process.
Remotesensing 15 03868 g005aRemotesensing 15 03868 g005b
Figure 6. Filtration result of a SAR image with weak noise.
Remotesensing 15 03868 g006
Figure 7. Filtration result of a SAR image with strong noise.
Remotesensing 15 03868 g007
Figure 8. The OBSM generation process.
Remotesensing 15 03868 g008
Figure 9. Comparison on SAR images with an offshore, inhomogeneous scene. (a) Image 1. (b) Image 2. (c,d) Detection results with the K-CFAR based method. (e,f) Detection results with the Gamma-CFAR based method. (g,h) Detection results with the SLIC-CFAR method. (i,j) Detection results with the proposed MMS method.
Remotesensing 15 03868 g009aRemotesensing 15 03868 g009b
Figure 10. Detection results of the four methods on inshore scenes without port facilities. (a) Image 3. (b) Image 4. (c,d) Detection results with the K-CFAR based method. (e,f) Detection results with the Gamma-CFAR based method. (g,h) Detection results with the SLIC-CFAR method. (i,j) Detection results with the proposed MMS method.
Remotesensing 15 03868 g010aRemotesensing 15 03868 g010b
Figure 11. Detection results of the four methods on inshore scenes with confusing port facilities. (a) Image 5. (b) Image 6. (c) Image 7. (df) Detection results with the K-CFAR based method. (gi) Detection results with the Gamma-CFAR based method. (jl) Detection results with the SLIC-CFAR method. (mo) Detection results with the proposed MMS method.
Remotesensing 15 03868 g011aRemotesensing 15 03868 g011b
Figure 12. Detection results of the four methods on large scenes. (a) Image 8. (b) Image 9. (c,d) Detection results with the K-CFAR based method. (e,f) Detection results with the Gamma-CFAR based method. (g,h) Detection results with the SLIC-CFAR method. (i,j) Detection results with the proposed MMS method.
Remotesensing 15 03868 g012aRemotesensing 15 03868 g012b
Figure 13. Ablation tests. (a) Image 1. (b) Image 3. (c) Image 7. (df) Detection results without SPSM. (gi) Detection results without LSSM. (jl) Detection results without OBSM. (mo) Detection results with all saliency maps.
Remotesensing 15 03868 g013aRemotesensing 15 03868 g013b
Table 1. Information of Image 1 and Image 2.
ImageResolution (m)Size (Pixels)
12495 × 284
25505 × 305
Table 2. Pixel-level F1 score and computing time of the four methods on Image 1 and Image 2.
MethodsK-CFARGamma-CFARSLIC-CFARMMS
F1 (%)Time (s)F1 (%)Time (s)F1 (%)Time (s)F1 (%)Time (s)
Image 124.280.0619.070.0834.110.6178.020.40
Image 242.910.0542.730.1144.560.7472.640.37
Table 3. Information for Image 3 and Image 4.
ImageResolution (m)Size (Pixels)
31549 × 494
41502 × 374
Table 4. Pixel-level F1 score and computing time of the four methods on Image 3 and Image 4.
MethodsK-CFARGamma-CFARSLIC-CFARMMS
F1 (%)Time (s)F1 (%)Time (s)F1 (%)Time (s)F1 (%)Time (s)
Image 337.950.0937.950.0735.901.2779.560.16
Image 454.900.0854.900.1067.920.9468.800.12
Table 5. Information on Image 5, Image 6, and Image 7.
ImageResolution (m)Size (Pixels)
51389 × 318
61500 × 373
71521 × 391
Table 6. Pixel-level F1 score and computing time of the four methods on Image 5, Image 6, and Image 7.
MethodsK-CFARGamma-CFARSLIC-CFARMMS
F1 (%)Time (s)F1 (%)Time (s)F1 (%)Time (s)F1 (%)Time (s)
Image 549.650.0352.960.0454.220.5267.700.12
Image 637.880.0735.980.0346.920.8275.730.53
Image 753.500.0553.500.0425.981.0073.420.28
Table 7. Information for Image 8 and Image 9.
ImageResolution (m)Size (Pixels)
811074 × 1506
911023 × 1524
Table 8. Pixel-level F1 score and computing time of the four methods on Image 8 and Image 9.
MethodsK-CFARGamma-CFARSLIC-CFARMMS
F1 (%)Time (s)F1 (%)Time (s)F1 (%)Time (s)F1 (%)Time (s)
Image 843.820.1546.180.0948.8317.3271.390.66
Image 947.290.1542.680.1535.1315.1979.810.54
Disclaimer/Publisher’s Note: The statements, opinions and data contained in all publications are solely those of the individual author(s) and contributor(s) and not of MDPI and/or the editor(s). MDPI and/or the editor(s) disclaim responsibility for any injury to people or property resulting from any ideas, methods, instructions or products referred to in the content.