1. Introduction
Remote sensing allows for the active monitoring of many processes on the Earth’s surface, including the monitoring of water bodies. One of the acknowledged sources for studying water bodies is radar satellite imagery. Radar is not dependent on weather conditions and can image the surface independent of light sources, i.e., day and night. As such, synthetic aperture radar (SAR) images are a helpful resource, providing continuous insight into water bodies [
1]. Studying water surfaces using radar satellites has been a widely used research practice for several years. Researchers have used different approaches for their tasks, such as using lower-resolution SAR systems like ENVISAT with the addition of aerial imagery [
2] or using imagery from higher-resolution satellite data with limited access, such as TerraSAR-X and Radarsat-2 [
3,
4]. In recent years, there has been a growing number of analyses focused on studying waters from open Sentinel-1 imagery [
5,
6,
7,
8,
9,
10] or even analyses combining different satellite systems (e.g., Sentinel-1, Sentinel-2, and Landsat 8) to obtain the best solution from a synergetic approach [
11].
An essential advantage of Sentinel-1 for monitoring water bodies is its universal accessibility and spatial resolution (~10 m). The latter also allows for the monitoring of smaller areas such as Cerknica and Planina intermittent lakes (karst poljes) and a Ljubljana Moor marsh studied in this research. The flood areas of these specific karst landscapes in Slovenia vary considerably during the year—from completely dry to completely flooded. McCormack et al. [
12] analysed a similar geomorphological phenomenon called turlough and took a similar visual approach using data obtained from raw Sentinel-1 imagery. Unlike McCormack et al. [
12], the source for this research was not raw but already processed data. Water surfaces were obtained from Sentinel-1 radar satellite imagery using the automatic water surface detection algorithm (from now on, referred to as S1 WBD—Sentinel-1 water bodies data, or single date WB—water body raster on a specific date) developed by Čotar et al. [
13,
14,
15]. To conduct the research, data were generated for each available Sentinel-1 image, which allowed for the inclusion of a time range spanning from October 2014 (the first Sentinel-1 image available) to December 2019 (the last year thoroughly analysed in the study).
This research aimed to assess the potential of the S1 WBD time series [
15] to investigate karst water dynamics, particularly flooding. Also important are the findings on the methodological procedures and, consequently, the possibilities of their reuse. The main objectives were to assess the dataset’s reliability and test the data’s applicability for further use and research. To accomplish a range of objectives, several steps were taken to assess the accuracy and reliability of the data. First, a visual inspection was conducted on the S1 WBD to identify and remove any inaccurately detected water areas. Additionally, a thorough comparison was made between the S1 WBD and official hydrological data (water level) to assess correlation and ensure consistency. Furthermore, the WBs were summed and represented as heat maps, which were then compared with the official flood maps. Attempts have also been made to overcome a disadvantage of radar remote sensing—a reduction of water detection under dense vegetation. Data obtained from SAR can be easier to interpret by knowing the vegetation conditions in the area during the period of record [
16,
17]. Therefore, a vegetation cover map (vegetation mask) was created to identify misrepresented areas.
An important contribution of this study is an assessment of the adequacy of the data from the automatic water surface detection algorithm developed by Čotar et al. [
13,
14] for karst floods research. This has (to our knowledge) not been carried out before. It was important to determine whether the data are suitable for research on karstic water dynamics. Major co-product is also an addition to the knowledge of water dynamics of the Ljubljanica catchment area. The data processing of this research presents (to our knowledge) the first time that the dynamics of waters in the study area within such a long time range (October 2014–December 2019) have been analysed. Current studies of this area mainly concern the use of optical remote sensing imagery (such as Sentinel-2) for the needs of studying vegetation in karst poljes [
18] that, to some extent, also explore the flooding of the Cerknica polje. The holistic approach that would consider several areas of the hinterland of the Ljubljanica River has up to now mainly been researched for understanding groundwater distribution [
19], and for that, contact methods (such as on-site measurements) were usually used. Our research, using a time series of processed Sentinel-1 data, thus demonstrates an important contribution to science, both methodologically and substantively.
2. Materials and Methods
2.1. Study Sites
The research refers to the water dynamics in floods on the karst surface. Because of karst’s unique water properties—limestone is water-soluble—karst has a specifically different water flow than the fluvial relief. Flooding in karst is usually a cyclical (annual) phenomenon, determined by rainfall, snowmelt, vegetation, etc. The most common karst floods are intermittent lakes. They typically occur in karstic basins, called karst poljes, whose bottoms extend into the occasional phreatic zone. Karst poljes are characterised by a closed perimeter over a flat bottom and karst hydrology. Their formation is related to the proximity of the groundwater table to the surface, which regulates the ground of the poljes through lateral corrosion. Tectonics also play an important role in their formation, as many poljes are formed in tectonic depressions that deepen. Tectonically fragmented zones are less permeable, which often leads to the appearance of surface water on the karst’s surface [
20]. This study was conducted in the Ljubljanica catchment area at intermittent karst lakes—Cerknica polje and Planina polje—lake and Ljubljana Moor (
Figure 1).
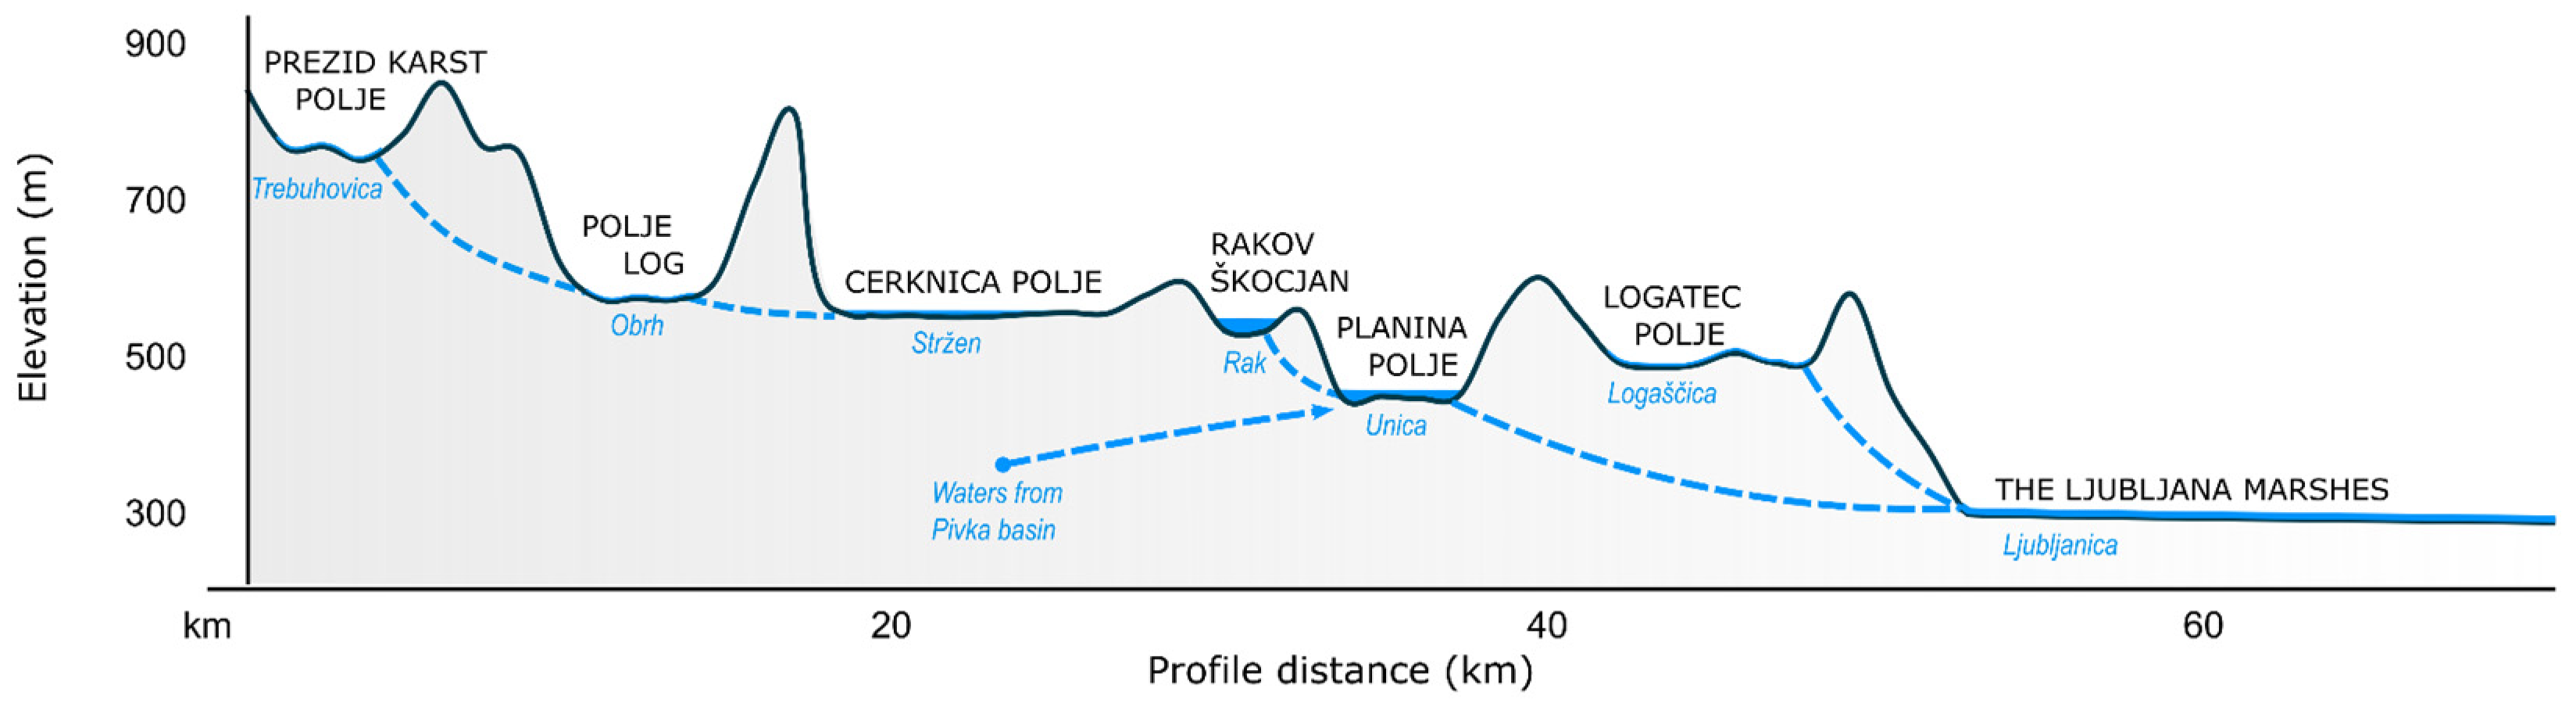
The tectonic fault of Idrija, which caused the subsidence of the surface, is crucial for the formation of the Cerknica and Planina karst poljes. The tectonics and the geological composition of the karst area are the most important factors for the development of the landscape in this area. The subsidence also directed water into these areas. Today, the Ljubljanica catchment area is drawn as a step profile (
Figure 2) based on the known surface waters.
2.1.1. Cerknica polje
The Cerknica polje (
Figure 3a,b) is the most known karst polje in Slovenia, as it is a highly active intermittent system. It is about 70 km
2 in size, and its bottom lies between 547 m and 550 m above sea level (m a.s.l.) [
26]. The flooding of the Cerknica polje results from poorly permeable dolomite ground. Both fluvial and karstic tributaries flow into it; the largest tributary from the fluvial hinterland is the Cerkniščica River, and the strongest karstic tributary of the polje is Stržen River, most of which flows from the the polje Log (
Figure 2) where water sinks (as Obrh River) and rises again in the southern part of the Cerknica polje. In the state of low water level, the waters cross Cerkniško polje along the riverbed, where they sink into the Javornik limestone in the southwestern part and continue towards Planinsko polje. During high waters, Cerknica polje is flooded [
26].
Various researchers have attempted to estimate the maximum and minimum flows in the Cerknica polje. Thus, inflows are assumed to vary between 2 m
3/s in dry periods and up to 240 m
3/s at the highest water levels [
27]. Due to the intermittent regime, the surface of the lake varies considerably. The lake can disappear entirely during dry periods except for the dammed section. As the water table rises above 546 m a.s.l., the lowest areas of the polje begin to fill with water. As the water table reaches 550 m a.s.l., the lake covers an area of approximately 20.3 km
2, and only in rare instances, the lake surface exceeds 30 km
2. At this extent, the water level reaches an elevation of more than 553 m a.s.l. Such high water levels also flood the surrounding settlements. On average, Cerknica polje is flooded for about half the year, with an average annual water level of 550 m a.s.l. and a flooding area of 20 km
2 [
26]. The maximum filling of the polje is usually due to two processes: snowmelt or heavy precipitation [
28].
2.1.2. Planina polje
The level ground of the Planina polje (
Figure 3c,d) varies between 444 and 447 m a.s.l. The polje, 6 km long and 2 km wide, has a pronounced rim, which at its lowest point near Grčarevec is 30 m higher than the polje ground. The tributaries of the polje originate in the southern part. The strongest tributaries include the Unica River (which flows from Planina cave) and the Malenščica River (which rises in the Malna pocket valley). The main waters flow to Planina polje from the direction of Cerknica polje and the Pivka basin. The waters mainly sink at the northeastern and northern edges of the polje. Planina polje is 10 km
2 in size [
26], and its hydrographic hinterland is estimated at 540 to 723 km
2. Exact figures are unavailable, as water flows at different elevations due to karst bifurcation [
29]. Annual floods in the polje measure about 9 km
2, inundating almost the entire polje area.
The flooding of Planina polje begins when the Unica gaging station at Hasberg records a flow of about 60 m
3/s [
30]. This is also the maximum water flow the Planina polje can discharge. Floods in Planina polje are usually relatively stable (the average floodplain is in the same areas and up to the usual elevation—about 448 m.a.s.l.), but occasionally higher water levels occur. In such cases, the floodwaters in Planina polje inundate residential houses and endanger the inhabitants of the surrounding villages.
2.1.3. Ljubljana Moor
The Ljubljana Moor (
Figure 3e,f) lies in the southern part of the Ljubljana Basin. It is a 150 km
2 wetland whose main watercourse is the Ljubljanica River. It mainly collects water from the karst hinterland but is also connected with smaller, non-karstic watercourses (e.g., Iška).
The Ljubljana Moor is characterised by floods, with the central part of the marsh experiencing frequent flooding that covers approximately 15% of its total area. Three main reasons for flooding are the rising of rivers (that block the Ljubljanica and raise its level), the flat area (there is a minimal slope towards the Ljubljanica and its tributaries), and high groundwater, which (in contact with impermeable clay in the Ljubljana Moor) originates in the form of numerous smaller springs [
31].
Flooding in the Ljubljana Moor usually occurs to a limited extent two or three times a year. It is a slow flooding development, but areas remain flooded for at least several days, sometimes weeks. Regular floods do not cause any damage. The most frequently flooded part of Ljubljana Moor is the central part between Vrhnika and Ljubljana [
32]. Occasionally there are major floods, causing greater damage. The last of these events occurred in 2010 when 76.8 km
2 of land was flooded [
33].
2.2. Core Data—Automatically Detected Water Bodies from Sentinel 1 Imagery
The Sentinel-1 water bodies data (S1 WBD) used in this study are available at VodaKje.si (
https://vodakje.si/, accessed on 24 March 2020) interactive map—web application (with limited access). Data are managed by GeoCodis d.o.o. and the Slovenian Center of Excellence for Space Sciences and Technologies, SPACE-SI [
15].
The detection of water bodies using Sentinel-1 imagery is based on the differences between the reflection of radar signals from land and water. Microwave signals do not penetrate water, and the surface roughness of flat areas (such as water) is low; therefore, we see a mirror reflection. This results in very dark areas of water bodies in the image. Other surfaces—such as the land—tend to be brighter due to different reflectance properties. The automatic detection of water bodies using Sentinel-1 by Čotar et al. [
13,
14] uses a machine learning model that relies on this characteristic as a basic.
The process begins automatically as soon as a new image acquisition for Slovenia (and its surroundings) becomes available on the Data Hub. Preprocessing of downloaded data is made with the open-source Sentinel Application Platform toolbox (SNAP) and consists of noise removal on the edges of the image, radiometric calibration, speckle noise removal, and georeferencing and topographic corrections. Initial water bodies (called seeds) are separated from land upon a computation of threshold values for land and water (calculated for each image). Those values are calculated for areas of permanent water bodies, which are included as ancillary data in this process. The detection of water bodies is followed by geometric error removal, which consists of removing incorrect water detections (pixels on steep terrain and high in the mountains and others). The next step is region growing, which determines the exact border between water and land. During this step, the initially detected areas (seeds) expand to the areas of neighbouring pixels with similar grey values. Lastly, the area of detected water is compared to the reference area of water and the process is considered erroneous and stopped if the ratio between the image and the reference area is higher than 10. The process outputs rasters. Before using the data in the web application (
www.vodakje.si, accessed on 24 March 2020), the rasters are vectorised [
13,
14,
15]. Raw raster data (produced before vectorisation) were used for the study.
The dataset is available from October 2014 and is updated according to the received Sentinel-1 images. For the analysis of the study, we used data from the period between October 2014 and the end of 2019 (due to the beginning of the research in 2020, 2019 data was the last fully engaged year—in the case of repeating the study, up-to-date data could be obtained). All S1 WBs with timestamps that covered the study area were selected for analysis. Their number differs slightly among the study locations, as the analysed areas can be taken in different scenes. For the Cerknica polje area, 643 S1 WBs were examined, the Planina polje area 648 S1 WBs, and the Ljubljana Moor area 645 S1 WBs. All S1 WBs were visually inspected to remove those where errors could be identified. The errors detected were mainly exaggerated floodplains that also occurred in areas that are very unlikely to flood (
Figure 4). After the visual inspection, 633 S1 WBs were used for the Cerknica polje area, 634 for Planina polje, and 624 for Ljubljana Moor.
2.3. Comparative and Ancillary Data
2.3.1. Water Level Data
At the beginning of the study, comparisons with both water level and flow data were considered. Later, we abandoned the latter, as the flow data are inaccurate when the watercourse starts flooding over the river banks [
28].
The Slovenian environment agency acquires open-access water level data for statistical analyses. The water level data (
https://www.arso.gov.si/vode/podatki/, accessed on 8 January 2020) were available through the year 2018 at the time of the study; data for 2019 were not publicly available at the time of the analysis as they required technical review before being publicly available [
34]. Therefore, statistical analyses were only completed up to the end of the year 2018, although S1 WBD is also available for 2019.
For the selected detailed study area, we used the following gaging stations: Gorenje jezero, Dolenje jezero, and Cerknica I for the Cerkniško polje study area, Hasberg and Malni for the Planinsko polje study area, and Kamin and Iška vas for the Ljubljana Moor study area (
Figure 1).
2.3.2. Flood Maps
To compare flood data, we used different types of existing flood data, namely flood risk maps and integrated flood hazard maps.
Open assess flood warning maps provided by The Slovenian Water Agency [
23] are precursors of up-to-date flood hazards maps, created according to the EU Floods Directive [
35] and Slovenian legislation adopted to it [
36]. Flood warning maps are based on previously collected and analysed data of multiple flood events, either historical or statistical, as well as on results of the computational hydraulic analysis. The maps have several classes: frequent (return period between 2 and 5 years), rare (return period 20 years), and catastrophic—very rare floods (return period 50 years or more). Considering the reliability of flood warning maps, data on past flood events, and precision of analysis, these maps have varying estimated reliability values, ranging from one to ten, with ten being the highest reliability level [
36,
37]. The advantage of flood warning maps is that they cover floodplains throughout Slovenia and thus represent the most comprehensive source of information on flood risk. A comparison with these maps was used only at the Ljubljana Moor study area since this was the only study area represented by all classes (frequent, rare, and vary rare; Cerknica and Planina polje were presented only with the rare and very rare classes).
Integrated flood hazard maps are the most detailed publicly available flood maps (
http://www.evode.gov.si/index.php?id=119, accessed on 20 March 2020) provided by the Slovenian Water Agency. Their data identifies flood-hazard areas based on the probability analysis of natural flooding occurrence [
23]. The methodology is described in the rules on methodology to define flood risk areas and erosion areas connected to floods and classification of plots into risk classes [
36] based on the European Floods Directive [
37]. These maps are considered reliable but have the disadvantage of being time-consuming to produce and covering a relatively small area. Therefore, these maps do not cover all flood-prone areas. Usually, these maps are produced where flooding causes significant damage and timely action is required. We used an integral flood hazard map with a ten-year return period (Q10) for visual comparison with S1 WBD. We chose this map because floods with higher return periods did not occur in selected areas during the study period. This data could only be used in some areas of Planina polje and Ljubljana Moor where the hydraulic studies have been conducted.
2.3.3. Land Use—Vegetation Mask
It is characteristic of radar satellite imagery that the detection of areas under vegetation is limited. The basis for using vegetation masks to identify areas that could be poorly detected was primarily based on research by Desrochers et al. [
16]. Their study used optical satellite images (Sentinel-2) acquired during the same period for vegetation information (normalised difference vegetation index—NDVI was the base of the vegetation mask). In Slovenia, official data on actual land use collected with computer-assisted photo interpretation, using orthophoto (with a resolution of the image element up to 1 m) as a basis, are available [
38,
39]. The Slovenian Ministry of Agriculture, Forestry and Food is responsible for open access to actual land use data (
https://rkg.gov.si/vstop/, accessed on 30 December 2020). Data generation depends on aerial surveys conducted in the Republic of Slovenia. The specific surveys undertaken for the study region were carried out during the years 2017 and 2018.
During the research, both data (Sentinel-2 and official data on actual land use) were used. The official data on actual land use was found to be more accurate (it better explained due to vegetation poorly detected floodplains). Therefore, we have omitted the Sentinel-2 data in the following process.
From official actual land use data, a basis for determining the less-sensitive areas in remote sensing based on vegetation was established before examining and processing the S1 WBD. To create a vegetation mask, we selected all layers with denser vegetation (
Table 1) from the actual land use data. Our analysis found that active agricultural activity is extremely important for good floodplain perception. Land uses where agriculture was abandoned due to waterlogging and overgrowing are often depicted in imagery as having significantly less flood activity.
2.3.4. Relief
The influence of relief was primarily investigated concerning vegetation, given that hills and high-elevation areas are frequently forested and may be mistakenly identified as undetected flood zones due to vegetation cover. However, it is worth noting that these areas do not typically experience flooding. Some areas also suffered from relief shadow, but those mistakes were detected less frequently. For relief analysis, we used Slovenia’s open-access Digital elevation model, with a 5 m grid (
https://egp.gu.gov.si/egp/, accessed on 10 November 2020) managed by the Surveying and Mapping Authority of the Republic of Slovenia [
21].
2.3.5. Permanent Water Bodies
To avoid making the mistake of defining permanent water as floodplains, we visually inspected the data on permanent waters. Some permanent waters were already identified during the physical study of the study areas. Existing official digital topographic maps with water surfaces mapped on them were used to verify the permanent water. The topographic maps (
https://egp.gu.gov.si/egp/, accessed on 20 May 2020) are managed by the Surveying and Mapping Authority of the Republic of Slovenia [
40]. If the above data were not sufficient for identification, we also used the data of permanent surface areas of the hydrography of the Slovenian Water Agency (
http://www.evode.gov.si/index.php?id=108, accessed on 18 November 2020) [
24].
2.4. Methodology and Post-Processing
To assess the data, the methodology takes, after clipping the S1 WBs, two distinct (unrelated) paths. One studied the statistical correlation of numerically calculated (quantified) areas of S1 WBD with the official water level data, and another visually examined the frequency of flooding based on S1 WBD and the spatial adequacy of water detection in S1 WBD. In this part, an attempt was also made to compare the existing flood maps with the detected areas. Accordingly, the results are also divided. The methodological workflow is presented in
Figure 5.
2.4.1. Correlation with Water Level Data
This part of the research aimed to assess whether the time series of water surface data (numerically calculated flood areas) derived from S1 WBD exhibits a comparable trend to the data obtained from publicly available official sources for water levels. The correlation is based on understanding how flooding works in the study areas. Higher karst water levels cause water to spill out of the river channel area. As the water level increases, the area inundated by the water also increases [
26]. The size of the flooded area is thus directly related to the water level. The comparison between water levels and remotely sensed areas has also been highlighted in other studies such as one conducted by Shen et al. [
9], where researchers also compared numerical areas gained from surfaces derived from Sentinel 1 imagery with water level data from the official gaging station. During this research, a methodologically identical analysis of the correlation of S1 WBD with flow data and official precipitation data was assessed. Still, these research results are excluded from this paper due to their lower relevance.
To gain quantified flood areas of S1 WBD (in ha), the area for every single date S1 WB has been calculated using ArcMap’s [
41] cell statistics. The calculation was based on the number of flooded grid cells multiplied by the size of a grid cell. The numerical data thus obtained were compared with official water levels. The data correlation was checked graphically (with a line and combination plot) and with Spearman’s correlation coefficient test, which was chosen due to the pronounced abnormal data distributions [
42]. To streamline the processes, a Python script [
43], based on pandas, numpy, and matplotlib libraries, was run within the Jupyter environment [
44] to generate graphs and calculate Spearman’s correlation coefficient (ρ). The script is available at:
http://hdl.handle.net/20.500.12556/RUL-124538, accessed on 30 January 2021). For comparing quantified flood areas from S1 WBD with official water level data, Spearman’s correlations are tied to the exact date of the image, but to facilitate graphical comparison (in time), the areas were averaged based on the number of recordings per week or month. This treatment of the data was necessary due to variations in the number of S1 WB during different periods. In certain weeks, no observations were available, while there were three or more in others. The quantified flood areas were averaged based on the number of recordings per week or month to facilitate graphical comparison.
2.4.2. Heat Maps and Comparison with Flood Maps
Heat maps were created by raster-summing the single dates WBs with ArcMap’s Raster Calculator—the sum represents the total number of S1 WBD when the grid cell (pixel) contained water (max number of S1 WBD depends on the study area; values were displayed based on the percentage of waters present in all the S1 WBD used). Despite our visual inspection of the errors, some areas with lower sums were still incorrectly identified as water areas, and empirically, we found that deleting pixels with a value of two or less best eliminated the errors. Maps were produced based on the whole data period, i.e., from October 2014 to December 2019. For visual representation, a blue colour ramp (from bright to dark blue tones) was used due to the context (floods).
The heat maps were examined to identify regions with a high incidence of flooding. To mitigate the potential for misinterpretation, this analysis involved a visual comparison implemented by overlapping heat map layers with vegetation masks and a digital elevation model. It is recognised that areas covered by vegetation may yield less precise detection results, potentially leading to incorrect inferences regarding flooding frequency. As a result, the data were carefully screened to minimize any such errors. An examination of relief was also considered to reduce the likelihood of making double mistakes in identifying flood-prone areas (identification of undetected flood zones due to vegetation in hilly and high-elevation regions). To avoid defining permanent water surfaces as floodplains, we also took data on permanent waters into account when interpreting the heatmaps (thus this is not shown on the heatmaps themselves).
In a separate process, the flooded areas obtained by heat-mapping were overlayed and compared with publicly available flood data (where available)—both flood warning maps (Ljubljana Moore study area) and integrated flood hazard maps Q10 (Planina polje and Ljubljana Moore study areas). The results obtained from the heat maps were visually analysed.
3. Results
3.1. Correlation with Water Level Data
3.1.1. Cerknica Polje
The Spearman’s correlation coefficients and the corresponding diagrams show that the best correlations between the water level data and quantified S1 WBD areas are in the Cerknica polje area (
Table 2). A higher positive correlation (0.7 ≤ ρ < 0.9,
p ≤ 0.001) and graphical matching were obtained between the quantified S1 WBD areas and official water levels at Dolenje and Gorenje jezero; Spearman’s correlation coefficient between water levels of the Cerkniščica River with quantified S1 WBD areas shows that they were primarily associated with moderate positive connectivity, except for 2018, where the connectivity was higher and reached the class of high connectivity (0.4 ≤ ρ < 0.7,
p ≤ 0.05). Based on the results, we can confidently say that the floods in the Cerknica polje were mostly related to karst waters and the Stržen tributary. This is coherent with the Stržen River being the strongest tributary to Cerknica polje [
26]. The high significance of the data, with most data reaching
p value ≤ 0.001, also testifies that the S1 WBD for Cerknica polje is reliable. The same can be seen on the weakly averaged graph (
Figure 6) and scatterplot (
Figure 7a).
3.1.2. Planina Polje
In 2015, a low positive correlation (0.2 ≤ ρ < 0.4,
p ≤ 0.05) was observed between water levels from gaging station Hasberg and quantified S1 WBD areas at the Planina polje study area. In 2016 and 2018, we detected a moderate positive correlation (0.4 ≤ ρ < 0.7,
p ≤ 0.001), which was in 2018 at the upper limit of Spearman’s moderate correlation class. In the years 2017 and 2014, we recorded a high positive correlation (0.7 ≤ ρ < 0.9,
p ≤ 0.001). The year 2014 was not very representative because only three months were included, and the sample of data was small. Apart from 2014, we can see that the degree of association between S1 WBD areas data and water level data increased with the number of available images after the launch of the second satellite (launch in April 2016, data from September 2016 onwards) and was comparable between 2017 and 2018, when the satellite images were recorded regularly. We also found a comparable correlation for the data from the Malni gaging station for years 2017 and 2018 in an upper part of a moderate correlation (0.4 ≤ ρ < 0.7,
p ≤ 0.001) (
Table 2,
Figure 7b).
3.1.3. Ljubljana Moor
When comparing the water levels in Ljubljana Moor, we found that the quantified S1 WBD areas and water level data did not match to the same extent as in Planina and Cerknica polje. This is most likely due to the greater size of the study area and, thus, the much more complex water system. We see that water levels in both the Kamin and Iška vas gaging stations correlate with the floodplains of the Ljubljana Moor. Still, these are lower and, at best, exceed the moderate positive correlation threshold in 2017 and 2018 (0.4 ≤ ρ < 0.7,
p ≤ 0.001) (
Table 2,
Figure 7c).
3.2. Heat Maps and Comparison with Flood Maps
We created heat maps for all areas, giving us an overview of the most frequently flooded regions. We presented them with a shaded relief as background. Due to the different water conditions in the Karst Ljubljanica study area and some places also due to minor perception errors (occasional failure to recognise permanent water areas), the total number of flooding events is lower than the number of all images used. This is particularly evident in the Planina polje study area, with no permanent water surfaces except part of the Unica River near the source. The Unica River is rarely detected due to its riparian vegetation belt and variable flow length. In Planina polje, the highest number of total flood events on the grid cells is half of all records.
3.2.1. Cerknica Polje
In the Cerknica polje, water remains longest along the Dolenje jezero (
Figure 8, No. 1) and in the Vodonos Bay area (
Figure 8, No. 2). Longer water retention can also be observed in the Cerknica polje in the Zadnji kraj (
Figure 8, No. 3) and the eastern part of Otok—Levišča (
Figure 8, No. 5).
On a closer visual inspection of the more often flooded small circular-shaped areas, we found that they correspond to the depressions detected on the digital relief model. These are mostly larger estavelles [
46]. Satellite images determine very well, for example, the location of Kotel estavelle in Zadnji kraj (
Figure 8, No. 3). We used the vegetation maps to determine locations that might be flooded more frequently than shown in the images. An example is the dense vegetation belt in the northeastern part of the floodplain, which perfectly matches the lower perception of flooding (
Figure 8, No. 4). A similar example is east of the Otok, where many sinkholes and estavelles are located, for example, the Levišča sinkhole (
Figure 8 No. 5). Regions that stand out entirely on the vegetation map and are never flooded are mostly vegetated hills (e.g., Gorica,
Figure 8, No. 6).
3.2.2. Planina Polje
Water areas were detected in a much smaller proportion (50.5%) in Planina polje than in Cerknica polje (99.8%). The sum of flooded grid cells from all WB rasters represents this well. The total number of WB rasters used in the Planina polje area is 634 (for Cerknica polje, 633), but the highest sum of flooded grid cells was 320 (this means that at least one pixel had a sum value of 320, meaning that the maximum water coverage is about 50%; for Cerknica polje 632 WB rasters—99.8%). Based on the area of detected water bodies, we can conclude that there are more frequently flooded areas along the course of the Unica River. Due to the vegetation, the river itself is much less perceived, and therefore its meanders stand out as non-water surfaces. We believe this is due to the riparian zone blocking the reflection of water surfaces. The most frequently flooded parts of Planina polje are around the first sinkholes on the southeastern edge (
Figure 9, No. 1) and the area of the northernmost sinkholes (Grčarevski log and Babji dol,
Figure 9, No. 2 and 3). The area east of the Liplje village is one of the rarest flooded areas. The area also does not stand out in terms of vegetation density; that is why we can conclude that it is a less frequently flooded part of the polje (
Figure 9, No. 4). This contrasts with a larger area on its eastern side (
Figure 9, No. 5), which has never been recorded as flooded but is a slight wet depression unsuitable for agriculture due to its consistently wet nature [
29]. In these (and similar) areas, shrubs and lower trees often completely cover the underlying water (regarding radar satellite detection). The Jakovica hill (
Figure 9, No. 6), which is also covered with dense vegetation, is not flooded due to its higher elevation and should be considered a separate element.
In Planina polje, near the settlement of Planina, detailed hydrological-hydraulic modelling was performed, which we compared with S1 WBD areas. The floodplain boundary of S1 WBD in the validity area of the results mostly coincides with the flood risk areas with a ten-year return period (
Figure 10). The exceptions are the areas along the pocket valleys (
Figure 10, No. 1 and 2), especially the Unica pocket valley and along the Unica watercourse (
Figure 10, No. 3). We believe these areas can be defined as frequently flooded but are misidentified due to radar perceptual limitations—both radar shadow (
Figure 10, No. 1 and 2) and vegetation (
Figure 10, No. 1, 2 and 3). The study showed that most of the detected areas are flooded annually. The integrated flood hazard map at discharge Q10 at some areas covers just a bit more surface than we perceived with S1 WBD. Considering the overlap of S1 WBD and the results of hydrological-hydraulic modelling, examined visually, it is reasonable to conclude that the detection of flooding with S1 WBD in Planina polje is satisfactory.
3.2.3. The Ljubljana Moor
The Ljubljana Moor is the most extensive among the analysed sites in our research, but flooding is less frequent. As in the Cerknica polje, there are permanent waters in Ljubljana Moor, which were detected by the satellite on 621 S1 WBD. We used 624 WB rasters during the analysed period. With a large data set, we see that perceptual errors can occur, but in a perfectly understandable percentage (0.5%) due to the nature of the data (and possibly other influences). Flooding occurs on 115 WB rasters, initially in the frequently flooded areas between Bevka and Notranje Gorice (
Figure 11, No. 1). At higher water levels, floods also occur in smaller karst poljes of the Ljubljana Moor area, like karst poljes Ponikve pri Preserjah (
Figure 11, No. 2) and polje near Podpeč (Podpeško polje,
Figure 11, No. 3). More significant flooding events were detected less often (30 times or less in the studied period).
Due to the agricultural nature of Ljubljana Moor, the area has a distinct pattern of flooding—it follows the pattern of land parcels. The reason for this may be the type of cultivation and, more often, hedges—vegetation at parcel boundaries, mainly consisting of shrubs and trees. These provide a distinctive plot pattern to the floodplain, which can also be traced on the vegetation map.
Figure 12 represents a zoom-in to selected floodplains of Sinja Gorica (A) and Notranje Gorice (B) (
Figure 11, No. 1). Hydrological-hydraulic analysis and integrated maps of flood hazard classes were performed for these areas. The S1 WBD covers these sufficiently in the case of a ten-year flood. The detected areas do not occupy every jagged edge of flooded areas determined through the hydrological-hydraulic model; still, the agreement of the results is good—the least consistent area is north of the highway at Sinja Gorica.
We performed a comparison of flood warning maps and S1 WBD areas (
Figure 13) in the same area where hydrological-hydraulic modelling took place (Sinja Gorica (A) and Notranje Gorice (B)). Flood warning maps were only used in the Ljubljana Moor study area because this is the only case (within our study areas) where regular flooding class is represented on flood warning maps. The reliability of data from flood warning maps in the Ljubljana Moor area is estimated at 4/10 for most polygons categorised as frequent floods, 7/10 for rare floods, and between 5/10 and 7/10 for catastrophic floods. Since we only inspected larger polygons in this assessment, the reliability of smaller polygons may be significantly different. Areas of frequent floods roughly coincide with the Ljubljana Moor S1 WBD. By this, we mean that the areas of S1 WBD are presented more often in frequently flooded areas.
Nevertheless, areas detected as flooded by S1 WBD are also marked as rare, very rare, or even non-flooding in the flood warning maps. The most frequently flooded area between Bevke and Notranje Gorice in the northern part is outside the area of the frequent flooding (
Figure 13B, No. 1). According to flood warning maps, these frequently flooded areas are, on average, only flooded once in 10 to 20 years (including the floodplains of the smaller karst poljes—Ponikve pri Preserju (
Figure 13B, No. 2) and Podpeč (
Figure 13B, No. 3)). The lack of historical data on past flood events or detailed hydraulic analysis of the area may have led to misrepresentation of flood hazard extend (that can be well seen in
Figure 12 with the integral flood hazard map). Therefore, the flood mapping of flood warning maps may be considered deficient, as missing information could critically impact future land use plans for these areas. From this point of view, we consider the possibility of monitoring floodplains with the S1 WBD as a source for improving the reliability of flood warning maps in areas with frequent flooding.
4. Discussion
The Ljubljanica River basin is (mainly due to the karstic relief) one of the most challenging Slovenian water dynamics areas to study. This is one of the reasons that this area, with extremely diverse water dynamics, has already attracted many researchers [
18,
19,
26,
28,
29,
30,
31,
46], but the phenomena of these areas are still not sufficiently explained. Therefore, new technologies and data sources such as S1 WBD that allow for insight into processes are welcome. In three separate methodological procedures, we tried to identify the strengths and weaknesses of the S1 WBD.
A comparison of quantified areas obtained from S1 WBD with the official water level data in the study areas shows that the quality of the correlation of these data depends on the Sentinel-1 temporal resolution. The correlation increased after the second satellite—Sentinel-1B—was launched, whose images became available in the middle of September 2016 [
47]. In 2017 and 2018, it was statistically significant that Spearman’s coefficient of correlation between water levels and S1 WBD increased and reached high positive correlations. Especially the correlation in Cerknica polje stood out due to the high frequency of flooding. Consequently, examining the correlation between high waters from quantified S1 WBD areas and official water level data can be observed more often. We can speak of better data reliability due to a larger dataset. The reliability of the correlation between the data also depends on the size and complexity of the study area. Thus, Ljubljana Moor showed poorer results in this analysis. The hinterland of the Ljubljana Moor is more extensive and consists of numerous tributaries, many of which are not included in official hydrological monitoring. The area is, therefore, oversized, has insufficient data, and is too complex for the study’s objective. The water level of the analysed rivers, the Ljubljanica and the Iška, cannot fully describe the flood activity of Ljubljana Moor, as the groundwater condition and discharges of other tributaries significantly impact flooding. Therefore, poorer correlations were found in the Ljubljana Moor.
The heat maps identified the most frequently flooded areas and permanent water bodies, but they also reflected the main shortcoming of the radar satellites. There are many factors to consider when referring to S1 WBD water detection (e.g., processing errors and deficiency due to the nature of the radar). One of the most pressing is the lack of detection under denser vegetation, especially forests, areas with abandoned agricultural activity, marshy but vegetated areas, and others. Vegetation maps with actual land use data indicate floodplains that might be under- or misidentified. Heatmaps combined with vegetation maps and relief showed that the water lingers longest in the areas of sinkholes and estavelles, which corresponds to the logical course of karst flooding. Contradictory rivers were often not recognised as water bodies because the riparian belt covered most of the surface and caused misinterpretation. Larger permanent water bodies at the Ljubljana Moor (water reservoirs and lakes) were almost always detected.
Heat maps obtained from long and dense time series of S1 WBD are useful in spatial planning and floodplain mapping. Research in the Ljubljana Moor area shows that S1 WBD could be more reliable than flood warning maps. Floodplains are detected that are not shown as frequent floods on the flood warning maps, but at the same time, they are interpreted as floods with a Q10 flow by the integral flood hazard map. The latter is currently considered the most reliable publicly available flood data. S1 WBD provided valuable information about the floodplain in Planina polje, where the edge of the heat map coincides with the edge of the integral flood hazard map for an event with a ten-year return period.
The overall heat map of the water areas confirms that Cerknica polje has the highest flood activity of all study areas. In contrast, flooding is significantly reduced in Planina polje and Ljubljana Moor (
Figure 14). The heat map of flood dynamics is displayed with identical intervals between the minimum and maximum determined values. The map shows possibilities for further research and study of floods in this part. Due to the volume of data, our study was limited to the ground of the karst poljes and the Ljubljana Moor, though a broader study could show interesting results outside these areas.
The area correlation analysis and the heat map shows that the reliability of the S1 WBD is better in areas that flood more frequently. Therefore, in the Cerknica polje, the possibilities for research are broader and can relate not only to the study of floods but also to the study of the lake level of the Cerknica polje. At the same time, the fact that the satellites enable monitoring of irregular floods is also important, which has added value, especially in the Ljubljana Moor.
5. Conclusions
This study used diverse methods to validate the time series data obtained from the automatic detection of water bodies from the Sentinel-1 imagery developed by Čotar et al. [
13,
14,
15] on the karstic relief with cyclical floods. The results show that the S1 WBD is suitable for analysing the water dynamic of flooding in karstic areas, both for analyses dealing with the surface area and location of flooding. However, S1 WBD should be used with caution and the preliminary verification of outlying data. Care should also be taken when reusing the methods since the suitability of methods for individual areas is different. The statistical method (comparison of quantified S1 WBD areas [
15] with the official water level data [
34]) proved more effective in areas with a less complex water inflow system that is well monitored by on-site water level measurement and, at the same time, in areas with more frequent flooding activity (such as Cerknica polje). On the other hand, heat map analysis is less sensitive to this shortcoming and can be useful when mapping flooding areas. It was shown that the detected water bodies are easier to interpret by using heat maps in combination with a vegetation mask and relief.
The results show a possibility for the use of S1 WBD as additional data for the determination of flood extent in areas with frequent flooding, where official hydrological and hydraulic modelling will not take place (areas where flood damage is lower and the number of people at risk from floods is smaller, usually in rural areas) and as a possible source for an update of flood warning map. There are also opportunities to explore the combination of hydraulic modelling with S1 WBD. New sensor technologies, particularly the Internet of Things, are opening new opportunities for observation and modelling. When combined with in situ or drone observations, our methods could be used in other areas—particularly urban areas, where the problem of flooding is more pressing and needs to be addressed more urgently. A great potential for time series is also to study the impacts of climate change and related extreme events since the official data do not give an insight into the spatiotemporal extent of flooding. The analysis of such data on a longer time basis could have long-term effects on environmental and spatial policies.
The potential of the data and methods we have assessed goes beyond the scope of this study. There are many opportunities to improve and enhance the methods for obtaining better research results, such as a systematical statistical search for outliers, systematic long-term monitoring, combining with other (more specific) data, comparing different seasons, creating a time model (animation) of flooding for a more detailed analysis of water flow, and others.
Although the analysis was completed on the data and algorithm designed for the area of Slovenia, it is also possible to transfer the methods (with sufficient caution) to other areas (such as the turloughs in Ireland or karst fields in the Dinaric Karst); the methods (if properly adapted) could also be used to study other non-karst systems with intermittent properties and to analyse data from other algorithms based on the principle of detection from SAR, such as Sentinel-1. New applications for water surface detection from Sentinel-1 imagery have emerged recently, such as Sentinel-1-based Inland water dynamics Mapping System (SIMS) [
48] or the Surface Water Monitoring Project [
49]. Studies also show high possibilities for validating water bodies from Sentinel-1 with aerial imagery [
2]. As for future developments, the method adopted today for Sentinel-1 can also be developed for satellite systems with higher resolution, e.g., ICEYE, COSMO-SkyMed, or TerraSAR-X, which could lead to more spatially accurate results.
Author Contributions
Conceptualization, J.B., K.O., G.R. and M.I.; methodology, J.B., K.O. and G.R.; software, J.B. and K.O.; validation, J.B., K.O. and G.R.; formal analysis, J.B.; investigation, J.B.; resources, M.I.; data curation, J.B., K.O. and M.I.; writing—original draft preparation, J.B.; writing—review and editing, K.O. and G.R.; visualization, J.B.; supervision, K.O. and G.R.; project administration, J.B. and K.O.; funding acquisition, K.O. All authors have read and agreed to the published version of the manuscript.
Funding
This research was funded by the Slovenian Research Agency research core funding No. P2-0406 (Earth observation and geoinformatics), No. P2-0227 (Geoinformation Infrastructure and Sustainable Spatial Development of Slovenia), No. P2-0180 (Water Science and Technology, and Geotechnical Engineering: Tools and methods for process analyses and simulations, and development of Technologies), and project No. J2-9251 (M3Sat–Methodology of Multitemporal Multisensor Satellite Image Analysis).
Data Availability Statement
The authors confirm that access to all open-source data underpinning the findings of this study is available and is described in the study under the heading “2.3. Comparative and ancillary data”. Access to the processed data depends on the use and is subject to individual agreements.
Acknowledgments
The authors of this research acknowledge GeoCodis d.o.o. for the provision of the raster dataset from the automatic detection of water bodies from Sentinel-1 imagery (VodaKje.si).
Conflicts of Interest
The authors declare no conflict of interest.
References
- Simard, M. Radar Remote Sensing of Mangrove Forests. In Synthetic Aperture Radar (SAR) Handbook: Comprehensive Methodologies for Forest Monitoring and Biomass Estimation; Flores-Anderson, A.I., Herndon, K., Thapa, R.B., Cherrington, E., Eds.; SERVIR Global: Huntsville, AL, USA, 2019; pp. 255–263. [Google Scholar]
- Schlaffer, S.; Matgen, P.; Hollaus, M.; Wagner, W. Flood detection from multi-temporal SAR data using harmonic analysis and change detection. Int. J. Appl. Earth Obs. Geoinform. 2015, 38, 15–24. [Google Scholar] [CrossRef]
- Martinis, S.; Kersten, J.; Twele, A. A fully automated TerraSAR-X based flood service. ISPRS J. Photogramm. Remote Sens. 2015, 104, 203–212. [Google Scholar] [CrossRef]
- Voormansik, K.; Praks, J.; Antropov, O.; Jagomagi, J.; Zalite, K. Flood Mapping With TerraSAR-X in Forested Regions in Estonia. IEEE J. Sel. Top. Appl. Earth Obs. Remote Sens. 2014, 7, 562–577. [Google Scholar] [CrossRef]
- Bhatt, C.M.; Gupta, A.; Roy, A.; Dalal, P.; Chauhan, P. Geospatial analysis of September, 2019 floods in the lower gangetic plains of Bihar using multi-temporal satellites and river gauge data. Geomat. Nat. Hazards Risk 2021, 12, 84–102. [Google Scholar] [CrossRef]
- Bioresita, F.; Puissant, A.; Stumpf, A.; Malet, J.-P. A Method for Automatic and Rapid Mapping of Water Surfaces from Sentinel-1 Imagery. Remote Sens. 2018, 10, 217. [Google Scholar] [CrossRef] [Green Version]
- Huth, J.; Gessner, U.; Klein, I.; Yesou, H.; Lai, X.; Oppelt, N.; Kuenzer, C. Analyzing Water Dynamics Based on Sentinel-1 Time Series—A Study for Dongting Lake Wetlands in China. Remote Sens. 2020, 12, 1761. [Google Scholar] [CrossRef]
- Martinis, S.; Plank, S.; Ćwik, K. The Use of Sentinel-1 Time-Series Data to Improve Flood Monitoring in Arid Areas. Remote Sens. 2018, 10, 583. [Google Scholar] [CrossRef] [Green Version]
- Shen, G.; Fu, W.; Guo, H.; Liao, J. Water Body Mapping Using Long Time Series Sentinel-1 SAR Data in Poyang Lake. Water 2022, 14, 1902. [Google Scholar] [CrossRef]
- Tuna, C.; Merciol, F.; Lefevre, S. Analysis of Min-Trees over Sentinel-1 Time Series for Flood Detection. In Proceedings of the 2019 10th International Workshop on the Analysis of Multitemporal Remote Sensing Images (MultiTemp), Shanghai, China, 5–7 August 2019; pp. 1–4. [Google Scholar]
- Tottrup, C.; Druce, D.; Meyer, R.P.; Christensen, M.; Riffler, M.; Dulleck, B.; Rastner, P.; Jupova, K.; Sokoup, T.; Haag, A.; et al. Surface Water Dynamics from Space: A Round Robin Intercomparison of Using Optical and SAR High-Resolution Satellite Observations for Regional Surface Water Detection. Remote Sens. 2022, 14, 2410. [Google Scholar] [CrossRef]
- McCormack, T.; Naughton, O.; Bradford, R.; McAteer, J.; Morrissey, P.; Gill, L. Monitoring and Mapping Groundwater Flooding in Ireland. In Proceedings of the Irish National Hydrology Conference 2017, Hodson Bay, Ireland, 21 November 2017; pp. 13–23. [Google Scholar]
- Čotar, K.; Kokalj, Ž.; Beden, A.; Ivačič, M.; Oštir, K. Samodejno zaznavanje vodnih površin iz radarskih satelitskih posnetkov in njihov prikaz na spletnem portalu [Automatic Mapping of Water Bodies from Radar Satellite Images and Their Web Based Dissemination]. In Digitalni Podatki; Ciglič, R., Geršič, M., Perko, D., Zorn, M., Eds.; Založba ZRC: Ljubljana, Slovenia, 2016; pp. 45–52. [Google Scholar]
- Čotar, K.; Oštir, K.; Kokalj, Ž. Radar Satellite Imagery and Automatic Detection of Water Bodies. Geod. Glas. 2016, 47, 5–15. [Google Scholar]
- Geocodis d.o.o, SPACE:SI. Sentinel-1 Water Bodies Data. Available online: https://vodakje.si/ (accessed on 24 March 2020).
- Desrochers, N.M.; Trudel, M.; Peters, D.L.; Siles, G.; Leconte, R. Hydraulic Model Calibration Using Water Levels Derived from Time Series High-Resolution SAR Images. J. Hydraul. Eng. 2020, 146, 05020001. [Google Scholar] [CrossRef]
- Pierdicca, N.; Pulvirenti, L.; Chini, M.; Guerriero, L.; Candela, L. Observing floods from space: Experience gained from COSMO-SkyMed observations. Acta Astronaut. 2013, 84, 122–133. [Google Scholar] [CrossRef]
- Ojdanič, N.; Zelnik, I.; Holcar, M.; Gaberščik, A.; Golob, A. Contrasting Dynamics of Littoral and Riparian Reed Stands within a Wetland Complex of Lake Cerknica. Plants 2023, 12, 1006. [Google Scholar] [CrossRef] [PubMed]
- Blatnik, M. Groundwater Distribution in the Recharge Area of Ljubljanica Springs; Springer Theses; Springer International Publishing: Cham, Swizertland, 2020; ISBN 978-3-030-48335-7. [Google Scholar]
- Stepišnik, U. Fizična Geografija Krasa [Physical Geography of Karst], 1st ed.; Znanstvena Založba Filozofske Fakultete: Ljubljana, Slovenia, 2011; ISBN 978-961-237-416-7. [Google Scholar]
- Surveying and Mapping Authority of the Republic of Slovenia. Digital Elevation Model 5 × 5. Available online: https://ipi.eprostor.gov.si/jgp/data (accessed on 10 November 2020).
- Slovenian Environment Agency. Hidrološke Merilne Postaje [Hydrological Gauging Stations]. Available online: https://gis.arso.gov.si/geoportal/catalog/main/home.page;jsessionid=FC5CCA094920843AD7265C2B361D6BCD (accessed on 1 April 2020).
- Slovenian Water Agency. Poplavna Območja [Flood Areas]. Available online: http://www.evode.gov.si/index.php?id=119 (accessed on 20 March 2020).
- Slovenian Water Agency. Podatkovni Sloj Hidrografije—Površinske Vode [Hydrography Data Layer—Surface Waters]. Available online: http://www.evode.gov.si/index.php?id=108 (accessed on 18 November 2020).
- Skoberne, P. Ljubljanica : Od Izvira do Izliva [Ljubljanica : From Source to Confluence]; Mladinska knjiga: Ljubljana, Slovenia, 2004; ISBN 86-11-16655-8. [Google Scholar]
- Gams, I. Kras v Sloveniji v Prostoru in času [Karst in Slovenia in Space and Time], 2nd ed.; Založba ZRC, ZRC SAZU: Ljubljana, Slovenia, 2004; ISBN 961-6500-46-5. [Google Scholar]
- Jenko, F. Idejni Projekt Stalne Ojezeritve Cerkniškega Jezera [Conceptual Design for the Permanent Lake Reservoir of Lake Cerknica]; Zavod za vodno gospodarstvo SRS: Ljubljana, Slovenia, 1965. [Google Scholar]
- Kovačič, G. An Attempt Towards an Assessment of the Cerknica Polje Water Balance. Acta Carsologica 2010, 39, 39–50. [Google Scholar] [CrossRef]
- Gams, I. Poplave na Planinskem polju [Inundations in the polje of Planina]. Geogr. Zb. 1981, 20, 5–34. [Google Scholar]
- Frantar, P.; Ulaga, F. Visoke vode Planinskega polja leta 2014 [High Waters at the Planinsko Polje in 2014]. Ujma 2015, 29, 66–73. [Google Scholar]
- Lovrenčak, F.; Orožen Adamič, M. Ljubljansko Barje. In Slovenija: Pokrajine in Ljudje [Slovenia: Land and People]; Perko, D., Orožen Adamič, M., Eds.; Mladinska knjiga: Ljubljana, Slovenia, 1998; pp. 380–390. ISBN 86-11-15033-3. [Google Scholar]
- Komac, B.; Natek, K.; Zorn, M. Geografski Vidiki Poplav v Sloveniji [Geographical Aspects of Floods in Slovenia]; Perko, D., Kladnik, D., Eds.; Geografija Slovenije; Založba ZRC, ZRC SAZU: Ljubljana, Slovenia, 2008; Volume 20, ISBN 978-961-254-091-3. [Google Scholar]
- Globevnik, L.; Vidmar, A. Poplave Na Ljubljanskem Barju v Septembru 2010 [Floods in Ljubljana Moor in September 2010]. In Proceedings of the Zbornik referatov 21. Mišičevega vodarskega dne, Maribor, Slovenia, 6 December 2010; pp. 24–29. [Google Scholar]
- Slovenian Environment Agency. Arhivski hidrološki podatki [Archive Hydrological Data]. Available online: https://www.arso.gov.si/vode/podatki/ (accessed on 8 January 2020).
- European Parliament; Council of European Communities. Directive on the Assessment and Management of Flood Risks; European Union: Brussels, Belgium, 2007; Volume 288, pp. 27–34. [Google Scholar]
- Government of the Republic of Slovenia; The Ministry of the Environment and Spatial Planning. Rules on Methodology to Define Flood Risk Areas and Erosion Areas Connected to Floods and Classification of Plots into Risk Classes; Official Gazette of the Republic of Slovenia: Ljubljana, Slovenia, 2007; Volume 67/02, 110/02, 2/04, 41/04.
- Rak, G.; Steinman, F.; Gosar, L. Kartiranje poplavno ogroženih območij v skladu z novo zakonodajo v Sloveniji [Flood Hazard Mapping Based on the New Guidline in Slovenia]. In Geografski Informacijski Sistemi v Sloveniji 2007–2008; Perko, D., Zorn, M., Razpotnik Visković, N., Čeh, M., Hladnik, D., Krevs, M., Podobnikar, T., Repe, B., Šumrada, R., Eds.; Založba ZRC: Ljubljana, Slovenia, 2008; pp. 107–116. [Google Scholar]
- Government of the Republic of Slovenia; Ministry of Agriculture, Forestry and Food. The Land Use Database. Available online: https://rkg.gov.si/vstop/ (accessed on 30 December 2020).
- Government of the Republic of Slovenia; Ministry of Agriculture, Forestry and Food. Rules on Land Use Data Base; Official Gazette of the Republic of Slovenia: Ljubljana, Slovenia, 2008; Volume 122/08, 4/10 & 110/10.
- Surveying and Mapping Authority of the Republic of Slovenia. Državne Topografske Karte [National Topographic Maps]. Available online: https://egp.gu.gov.si/egp/ (accessed on 20 May 2020).
- ArcMap 10.7; ESRI: Redlands, CA, USA, 2019.
- Spearman, C. The Proof and Measurement of Association between Two Things. Am. J. Psychol. 1904, 15, 72. [Google Scholar] [CrossRef]
- Python Programming Language 3.8; Python Software Foundation: Wilmington, DE, USA, 2001.
- Project Jupyter. Jupyter Notebook: 2014. Available online: https://jupyter.org/ (accessed on 23 June 2022).
- Surveying and Mapping Authority of the Republic of Slovenia. Consolifated Cadastre of Public Infrastructure. Available online: https://egp.gu.gov.si/egp/?lang=sl (accessed on 18 October 2020).
- Kranjc, A. Cerkniško Jezero in Njegove Poplave: (z 10 Slikami in 14 Tabelami Med Besedilom in 1 Karto v Prilogi) [The Lake of Cerknica and Its Floods]; Geografski Zbornik = Acta Geographica; SAZU: Ljubljana, Slovenia, 1986; p. 123. [Google Scholar]
- The European Space Agency. Operations Ramp-Up Phase. Available online: https://sentinels.copernicus.eu/web/sentinel/missions/sentinel-1/data-distribution-policy/operations-ramp-up-phase (accessed on 23 June 2022).
- Soman, M.K.; Indu, J. Sentinel-1 based Inland water dynamics Mapping System (SIMS). Environ. Model. Softw. 2022, 149, 105305. [Google Scholar] [CrossRef]
- Chen, Z.; Zhao, S. Automatic monitoring of surface water dynamics using Sentinel-1 and Sentinel-2 data with Google Earth Engine. Int. J. Appl. Earth Obs. Geoinform. 2022, 113, 103010. [Google Scholar] [CrossRef]
| Disclaimer/Publisher’s Note: The statements, opinions and data contained in all publications are solely those of the individual author(s) and contributor(s) and not of MDPI and/or the editor(s). MDPI and/or the editor(s) disclaim responsibility for any injury to people or property resulting from any ideas, methods, instructions or products referred to in the content. |
© 2023 by the authors. Licensee MDPI, Basel, Switzerland. This article is an open access article distributed under the terms and conditions of the Creative Commons Attribution (CC BY) license (https://creativecommons.org/licenses/by/4.0/).


