1. Introduction
The global average temperature increased by 0.85 °C between 1880 and 2012. It is expected to reach 1.5 °C above preindustrial temperatures by 2040 [
1]. Atmospheric concentrations of carbon dioxide are responsible for 20% of thermal energy absorbed by Earth’s atmosphere [
2], and the increase in atmospheric carbon and resulting warming due to the greenhouse effect has severe negative ramifications for many important ecological systems on a planet-wide scale. A viable strategy to achieve net-negative emissions is the recapture and storage of atmospheric carbon as recalcitrant plant mass. Among proposed plant materials, grass species have been suggested as efficient targets for sequestration efforts through the restoration and establishment of natural grasslands or improvement of the carbon sequestration potential of dominant cereal crops. Grasslands can sequester up to ~3 Mg of C per hectare per year [
3], and also serve as a carbon sink in agricultural settings. Previous estimates predict that ~750 Mha are available globally for conversion to bioenergy cultivation, with an estimated sequestration potential of ~1600 Tg C y
−1 [
4]. Furthermore, the addition of perennially conferring traits, such as rhizomes, to current grain crops, such as wheat, rice, barley, maize, sorghum, and millet, could increase their carbon sequestration potential several-fold compared to the current low biomass found in current fibrous root cereals.
A step toward optimizing carbon deposition via crop methods is the systematic study and refinement of root and rhizome traits through breeding. The scale needed by breeding strategies requires a fast and efficient means of phenotyping root traits; however, there is currently no method that meets these requirements. Maximizing belowground biomass necessitates developing high-throughput phenotyping methods for making rapid trait selection decisions in field trials. The current methods of root phenotyping in a field setting provide high-quality root information; however, some aspects of these methods are unattractive for plant breeders: they tend to be labor intensive, challenging due to inherent field variability, require a secondary cleaning of root samples, and are destructive [
5]. Recent studies have shown that increasing the quantity of the acquired phenotypic data collected may reduce error, making high-throughput phenotyping an attractive alternative to manual phenotyping methods [
6].
Ground-penetrating radar (GPR) is emerging as a potential high-throughput and non-destructive root phenotyping method. GPR is a geophysical technique that uses electromagnetic waves in the MHz–GHz frequency range to image subsurface structures. It operates by first sending a pulse of energy into the ground and then recording the resulting time-variations in the returned field amplitude caused by scattering, reflection, and diffraction of the pulse due to subsurface discontinuities in electromagnetic wave impedance. Beginning in the late 20th century, GPR has been used to monitor water flow through soil horizons [
7], map bedrock [
8], estimate soil depth [
9], and track movement of agrochemicals [
10].
Tree roots were among the first botanical targets studied, and given their large diameter, they are readily detected by GPR [
11]. As such, the majority of early root studies using GPR are within the field of forestry. Beyond simple detection, forestry studies indicate the possibility of predicting both tree root biomass and architecture based on GPR signals [
12,
13]. Theoretically, the technology should also be able to detect the roots of agronomic crops, and as such, GPR is attracting research interest in agriculture [
14,
15,
16,
17]. Within GPR studies, roots and the surrounding soil often compete for visibility on B-scans, with soils that are heavy in clay negatively affecting resolution and visibility both of roots and of other soil features [
12]. As such, soils with low permittivity are preferred for root studies, as high permittivity can interfere with the detection of roots. Roots that absorb large amounts of water can affect the permittivity of the soil by drying it out, and thus making the soil less responsive to electric fields [
18]. Roots, even those fine in scale, can affect overall soil permittivity due to their influence on overall soil moisture content. Even so, it is difficult to determine the extent to which this can happen in field settings due to the variety of other variables that influence electric permittivity, and conclusive results have only been achieved in highly controlled settings [
19].
The antenna used in this study operates over the frequency range 0.9 GHz to 2.7 GHz. As a rule of thumb, a quarter of the electromagnetic wavelength (λ/4) in the subsurface medium is required to determine the smallest separation necessary to distinguish between two nearby objects [
20]. The minimum separation, or so-called “detection threshold”, varies depending on the velocity of the signal in the medium, and in an agricultural context, it is largely determined by field moisture levels. Using a range of values typically found in non-conducting materials of agricultural soil (commonly between two and ten), velocities of 0.21 m/ns to 0.09 m/ns, respectively, can be calculated using the equation:
where
c is the speed of light in a vacuum and
εr is the relative dielectric (non-conductive) permittivity, or dielectric constant, of the soil medium [
21]. In practice, this means that the lowest frequency of the prototype antenna (0.9 GHz) used in this study corresponds to a detection threshold that ranges from 5.89 cm to 2.63 cm, while the highest frequency (2.7 GHz) corresponds to a detection threshold that ranges between 1.96 cm and 0.88 cm. As mentioned above, the images displayed in GPR scans represent reflection, diffraction, and backscatter of electromagnetic energy from objects buried in the subsurface. Visual representations of the reflected electromagnetic energy are typically viewed in one of two forms: an ‘A-scan’ is a single return which is displayed as a time-varying function with amplitude peaks and valleys on one axis and time on the other, and a ‘B-scan’, which is a pseudo-2D cross section of the subsurface formed when a series of A-scans is acquired along a survey path. In such a 2D radargram, the signal amplitude is often represented by brightness on a gray-scale, time is given on the vertical axis, and survey position is given on the horizontal axis. ‘C-scans’ further extend GPR data visualization by combining data from multiple B-scans to create a 3D data-cube. These have proven useful in projects attempting to map the subsurface in terms of depth as well as position relative to the visible x–y plane of the surface.
The depth potential of a GPR antenna depends primarily upon both its frequency and the quality of the soil on which it is being used. Frequency tends to be a trade-off in terms of resolution and penetration power: higher-frequency antennas (900 MHz to 2 GHz) have high resolution but relatively low ground penetration, while lower-frequency antennas (under 900 MHz) can penetrate several meters into the ground but provide low resolution. In the case of this study, a high-frequency antenna (0.9 GHz to 2.7) was used as the targets were close to the surface and required a higher resolution in order to distinguish between roots and undesirable underground features (lower frequency is more common for examining groundwater tables or piping).
Time analysis, as in many forms of remote sensing, is important in determining spatial relations for objects of interest, especially as it relates to depth. The amount of time it takes for the reflection of electromagnetic waves to travel from transmitter to target to receiver can be used to calculate the depth of the target given the velocity of the signal in the soil medium. This, combined with the dielectric properties of the targets and soil media, begins to paint a picture of the structure of the subsurface, which can then be used to distinguish the targets from their surroundings.
The application of GPR is an approach that is being successfully tested as a tool for precision agriculture [
17]. The present study assesses the feasibility of root biomass quantification by exploring correlations between features extracted from GPR responses and harvested belowground biomass. Root detection by GPR shows promise for further development both in theory—since roots present a dielectric contrast to the host soil—and based on previous studies documented in the literature [
14,
15,
16,
22]. Most of these studies have adopted an image analysis approach to quantify the presence of belowground biomass. For example, radargram pixel counts have been used to quantify the mass of cassava tubers [
14]. A similar pixel-level image analysis was used to predict peanut yield [
15]. An alternative to an image analysis approach is a frequency-based analysis where the GPR signal is decomposed into its component frequencies, which are then evaluated as features predictive of biomass. Observed root biomass of cassava and peanut has been predicted using this method [
16,
23]. An additional alternative for GPR feature extraction is the use of wavelet methodologies. Wavelet analysis in GPR has been largely applied as a de-noising technique [
24,
25]; wavelets have also been applied in a diagnostic capacity in civil engineering [
26] as well as in evaluation of soil moisture [
27]. The fibrous and rhizomatous biomass assessed in this current study are characterized by a lack of a single large, discrete target object and are distributed among three depth layers. The dispersed nature of both the biomass and the signal makes a wavelet-based time/frequency analysis more appropriate in this case.
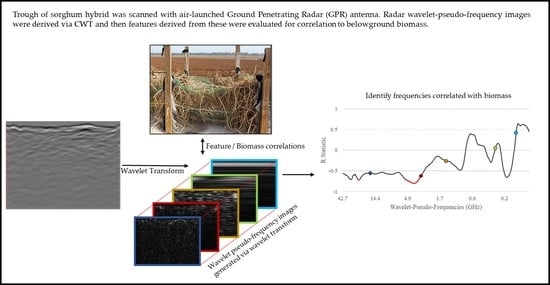
The objective of this study is to determine the ability of the continuous wavelet transform (CWT) technique to identify and quantify the belowground material of a perennial sorghum hybrid based on GPR B-scans. We hypothesize that correlations between B-scan wavelet pseudo-frequencies (WPFs) features and dry biomass will produce an accurate representation of subterranean sorghum that can be used as a proxy for belowground mass measurements in the field. The relevance of this correlation is that greater biomass in root structures is indicative of greater carbon sequestration, making GPR an appropriate tool to assess carbon sequestration potential in agricultural ecosystems defined by perennial grasses.
2. Materials and Methods
To test the working hypothesis that belowground root and rhizome biomass is detectable via GPR using a time-frequency analysis hypothesis, a sorghum hybrid selected for high belowground biomass was grown as a monoculture in a pure sand environment. The root and rhizome systems were scanned using a prototype GPR antenna, and then harvested biomass information was regressed against features extracted from the radargrams. Signal features were derived using time-frequency analysis on B-scans via the continuous wavelet transform (CWT). A high-level process overview is given in
Figure 1.
The sorghum hybrid
Sorghum bicolor L. Moench ×
Sorghum halepense L. Pers (i.e., PSH09TX15) used for this study was kindly provided by Dr. Russell Jessup (Texas A&M, College Station, TX, USA) [
28]. This hybrid is generally sterile and grows to a height of ~2 m. It was chosen due to its dense rooting growth characteristic and method of propagation via rhizomes, which are produced with a diameter of ~1 cm and serve as the emanation point of the plant’s fibrous root system [
28]. Rhizomes comprise modified stem tissue that grows laterally beneath the soil’s surface to produce new clone shoots from their nodes. They can persist from season to season, and have been shown to accumulate mass over multiple growing seasons [
29]. Additionally, rhizomes have the capability of growing with a smaller energy investment in each subsequent growing season. This capability results in a crop that can sequester carbon more effectively than an annual crop.
The aboveground planted PSH09TX1 material was mowed to the soil media surface, and the troughs scanned with a prototype air-launched GPR antenna array developed by IDS GeoRadar (Golden, CO, USA). The latter utilizes a unique air-launched resistively loaded vee dipole antenna design, which had been developed as a means to detect buried objects without the necessity of ground contact [
30,
31,
32]. The antenna array unit has been used in other published research [
15,
16,
23,
33] and is pictured in
Figure 2. An air-launched antenna was used because of its greater suitability for scanning uneven agricultural surfaces with the accepted trade-offs of a strong ground return and less energy being transmitted into the soil subsurface than with a ground-coupled unit [
34]. The antenna array used was mounted onto a cart at a height of approximately 50 cm from the soil’s surface (
Figure 2). This height was chosen to prevent the overlap of the direct wave and the surface return [
34]. The antenna was oriented in a direction normal to the soil’s surface to minimize the amount of energy reflected away from the subsurface. Plants were scanned only in the long-direction with respect to the trough due to the narrow trough width. An encoder wheel was mounted to the base of the cart and was used to gather one A-scan every centimeter traveled, as seen in
Figure 2. While an exact GPR footprint is difficult to determine, communications with the manufacturer of the antenna estimated that the expected “view” of the antenna was approximately elliptical, with a 60° swath in the front-to-back look direction and a 120° swath in the left–right direction, corresponding to an ellipsoid with a short-axis of approximately 114 cm and a long-axis of approximately 200 cm at a height of 50 cm. A-scan returns were gathered along the path of travel at a regular interval of 1 return per centimeter using an attached encoder wheel. In the context of this study, A-scans were averaged into observations based on which plot they were collected within; the smallest of which was 117 cm long, which corresponded to 117 returns.
Experimental plots of PSH09TX15 were established from rhizome propagules. The plots were located at the Texas A&M University Farm (30.530, −96.426) and consisted of an aboveground trough constructed with a post-and=rope structure supporting an enclosed growth matrix lined within a weed cloth barrier (
Figure 3b). The trough was filled with 100% silica sand. The artificial environment pictured, referred herein as a ‘trough’, was divided into individual plots with boundaries defined by the posts making up the wall. The target plots and buffer plots on each end had an average length of 2.6 m, width of 2.1 m, and depth of 1.1 m. Prior to filling the troughs with the sand, nylon nets were installed at three different depths. The nets were used during harvest to separate belowground biomass into different layers following the removal of growth substrate. A top view and a side view of the trough setup is shown in
Figure 3a. Plants were irrigated via a drip tape and fertigated as needed via liquid fertilizer injector.
After the GPR scanning, the weed cloth barrier supporting the sides of the berm (shown in
Figure 3c) was removed, exposing the bare sand matrix. The troughs were washed with a high-pressure water hose over the course of one week, resulting in the gradual exposure of root material (see
Figure 3b). The fibrous root systems and rhizomes were captured by the nylon nets in the three different accessible layers. Measured from the soil’s surface, the thicknesses of each of the layers were 15, 45, and 45 cm (see side view in
Figure 3a). The fibrous roots and rhizomes were then harvested by hand. Plant crowns were included in the collected tissue of the top zone, and were separated into tissue groupings of either fibrous roots or rhizomes depending on morphology. Roots were severed where they crossed the nylon nets that separated adjacent layers. Roots were collected within each plot (see top view in
Figure 3a) at each of the three layers. Harvesting took place immediately after the washing process had concluded, and the root material was dried in a greenhouse in order to preserve mass against microbial degradation. The root samples were then re-washed in large plastic containers to remove excess sand. During the entirety of the washing process, care was taken to retain rhizome tissue and the fibrous root system (i.e., roots with an approximate diameter of ~1 to 4 mm). However, the fibrous system was not further separated into size-based subcategories due to the lack of resources to process the amount of material. All plant material examined in this study, therefore, is either the rhizome tissue, the fibrous root tissue, or the sum of these two groupings. Samples were hand-separated into two main tissue sub-groups: rhizomatous and fibrous root biomass. Each sample was then dried in an oven at 60 °C until its weight stabilized to remove variability in measured mass due to water content.
The GPR workflow (
Figure 4) comprises a small number of key steps. The processing and analysis was performed using GPR-Studio version 1.0.1 (Crop Phenomics, College Station, TX, USA, (
cropphenomics.com, accessed on 14 June 2023)), an in-house software combination of graphical user interface and Python library that provides GPR processing, analysis, and visualization services. A notable difference between the data in this analysis and that from other surveys is the lack of distinct visual features in the raw radargrams. In many other contexts, GPR data produces characteristic hyperbola features present prior to any preprocessing steps that are taken. The data examined in this study had no similar obvious features that could be directly attributed to plant mass. As such, part of our working hypothesis is that any detection is of bulk material as opposed to individual roots or rhizomes. This is not to say that the current method is not applicable to the detection of individual fine roots, however, but that specific application is not explored in the current study. While performing the exploratory analysis of B-scans, it was found that GPR processing workflows involving certain widely applied signal-processing techniques (e.g., bandpass filters, gain correction) produced inconsistent results. With regards to bandpass filters, at this stage in the field’s development, it is uncertain which frequency ranges correspond to noise and which ranges indicate the presence of target biomass. The net result of any filtering operation is always the removal, or at least the alteration, of potentially informative features. Generally, it is wise to proceed only with the simplest processing steps with the intention of addressing a particular aspect of the data [
35]. With this in mind, the final preprocessing workflow used was a minimal pipeline, illustrated below.
The initial GPR processing step is the cropping of the B-scan to remove regions known to contain unwanted non-informative signals. The raw B-scan is cropped to exclude the direct wave and associated ground clutter (normally indicated by the high-amplitude bands at the top of the section), as well as any samples recorded after 32 ns two-way travel time. The latter region appears to contain mostly deeper soil horizons beneath the trough system and/or multiple reflections of a shallower structure. Multiples may be generated as a direct result of the engineering of the prototype antenna hardware (verbal comm., A. Delgado, IDS GeoRadar, 2018, Pisa, Italy). The appearance of strong multiples in the GPR data was not anticipated prior to acquisition.
After cropping the radargram, background correction was performed. The background correction algorithm used in this analysis first computes the mean signal amplitude across each row of a given B-scan. The row-wise means are then subtracted from the B-scan. The expected result of this operation is the reduction of noise in the form of sub-horizontal bands of enhanced signal amplitude. These high-amplitude horizontal bands distort the desired information that is directly related to the compact three-dimensional root system.
The continuous wavelet transform (CWT) is a technique that localizes the individual frequency components contained within a time-varying signal. In GPR research, wavelets are often applied to analyze the response of topography [
36] to detect objects such as landmines [
37] and to filter signals [
38]. Wavelet application in agricultural root detection is based on the supposition that, similarly to spectrophotometry performed in a wet lab, distinct root sizes or structures will preferentially respond to specific frequencies in the electromagnetic wave. While similar to Fourier analysis, wavelet analysis has the key difference of identifying the signal frequency of interest in time, in addition to reporting the relative amplitude of each frequency. The recording of such frequencies of interest is performed by collecting scaled and translated versions of a ‘mother’ wavelet function across the extent of a mapped signal. The collection of the signal with the variously scaled and translated ‘daughter’ wavelets records the relative amplitude of a specific ‘pseudo-frequency’ (hereinafter referred to as a ‘wavelet pseudo-frequency’, WPF) at each instant of time within the signal. It is hypothesized that the presence of root mass can be predicted by analyzing the cohesiveness of all WPF components extracted from GPR B-scans of agricultural fields.
A novel application of CWT was used herein, similar to the one used in a prior analysis of electromagnetic induction survey data [
39]. The observed biomass from the harvest was correlated with sums of the wavelet coefficients at a given WPF. The mother wavelet chosen for analysis was the complex Morlet wavelet [
39,
40,
41]. The result of combining the complex Morlet wavelet with the GPR trace is a complex signal. We took into consideration only the size of the resulting wavelet coefficients, which is obtained by computing the vector length of a given sample. These size values are then summed within an agricultural plot to produce a GPR feature that corresponds to a given biomass measurement. The complex Morlet wavelet was chosen because it resembles the emitted GPR pulse, with the idea that reflected pulses, though distorted and attenuated by the propagation through the soil medium, would retain the basic frequency content of the emitted pulse. Each sum was divided by the length of its respective plot. The feature investigated here is thus coined a ‘wavelet pseudo frequency density’ (WPFD) measure. The biomass measurements were also divided by the length of their respective plots. This division was performed to standardize both WPF feature and biomass values because the sizes of the trough plots varied (the smallest plot was 1.17 m in length, while the longest was 3.11 m). The standardization was performed to make the data values between each of the differently sized plots comparable.
Biomass values collected for each layer were compared using an ANOVA test to demonstrate existing variability at different depths (
N = 27). Following this ANOVA, a Tukey’s HSD post hoc test was performed to determine which layers differed from each other. The results of both tests can be found in the
Appendix A. These tests were both performed in R studio. For each tissue grouping at each depth layer, an experiment was conducted wherein the Pearson correlation coefficients (R statistics) were calculated at each WPF using the open source ‘scipy’ Python library (
n = 8 for each layer) [
42]. These correlations were evaluated based on their corresponding two-tailed p-value. After calculating the correlations, each WPF was evaluated for the strength of its relationship with belowground mass. The strongest of these correlations for each experiment was reported, and the strongest of this subset were further analyzed by generating a simple linear regression equation describing the line of best fit between the WPFs and the standardized mass values. These correlations were further analyzed using a bootstrapping analysis with 1000 iterations implemented with the open source ‘numpy’ Python library to comment on the robustness of each statistic and the associated regression equation.
4. Discussion
The wavelet analysis produced significant correlations at several distinct WPFs, depending on the layer and tissue type of the biomass. Most interestingly, all significant correlations found in this work indicate a negative relationship between biomass and the wavelet feature.
The bootstrapping analysis showed that after 1000 iterations, the derived mean correlation statistics were close to what was observed in the original experiments. The 95% confidence intervals further confirmed the existence of relationships for the fibrous root system at layers 1, 2, and all layers combined; rhizomes at layer 2; and the combined biomass in the combined top two layers. The results of this analysis are encouraging, as they further validate the observed statistics shown in
Table 2. However, it is also worth noting that the histograms shown in
Figure 10 demonstrate that while it is likely that the correlations exist, they may be substantially weaker than what is observed.
The regression equations defining the lines of best fit for the observed relationships differed in their y-intercept values and slopes. This was shown to be due to the differences in the amount of mass being considered for each separate experiment. As greater depths contain more variation in biomass and the x-axis will always be between 0 and 1, an increase in slope and intercept are to be expected. It should also be noted that this observation regarding these equations can only be inferred from the experiments examining the fibrous root system and the experiments examining rhizomes at the top two layers, as the other experiments detailed here investigated various combinations of mass and depth layers.
Negative relationships between belowground biomass and GPR signal features have been reported in the previous literature [
43], and correlations have been shown to switch from negative to positive at progressive depths [
15]. A possible explanation for negative relationships is that the presence of a root zone may result in less soil compaction, thus causing a weaker reflection at the surface. Another possibility is that PSH12TX09′s complicated root architecture results in an attenuation of certain frequencies resulting in a detection method analogous to absorbance techniques used in wet labs. An important takeaway from the plots of correlation vs. WPF (
Figure 7b,
Figure A1, and
Figure A2) is that there are ranges within which biomass correlates well to the GPR signal. This could potentially be leveraged in future studies by effectively using CWT analysis as a filter to remove information outside of a given WPF range.
Belowground plant structures in this study were sub-classified as fibrous root or rhizomatous tissue, a helpful distinction in the exploration of detectability with ground-penetrating radar. A majority of the PSH12TX09 hybrid’s belowground biomass is contained in the rhizome tissue. This finding has positive implications for the use of rhizomatous plants as carbon sequestration targets, as perennial rhizomatous crops can survive between seasons. This, in turn, encourages no-till agricultural practices and provides a system that can continually deposit root exudates without requiring the re-investment of energy for a new growth cycle. Contrary to expectations, the fibrous root system, despite making up a minority of the total biomass, had stronger correlations and wider significant WPF ranges than the rhizome root system. This may be due to different interactions of the GPR signal and growth environment to the fibrous root system as compared to their interaction with the system of rhizome tissue. A second possible explanation is that the correlation at low frequencies is the result of a strong association between the vascularly connected belowground fibrous root biomass and the near-surface crown structures. During the harvesting and classification of biomass, no effort was made to determine whether fibrous roots originated from the crown or from rhizome tissue. Given the presence of crown material during scanning (see
Figure 3c for visual reference of crown size), returns associated with the belowground fibrous root system crown structure could be co-correlated with crown mass.
As the frequency of a GPR signal return corresponding to a large object would typically be low, the expectation is that belowground tissue with a larger radius would be correlated with lower wavelet frequency. In general, this was consistent with this study’s results; however, the fibrous root system exhibited significant correlations at lower frequencies in addition to higher frequencies (see
Appendix A). This was unexpected. However, a possible explanation warranting further study is that individual fibrous roots do not solely interact with EM radiation in the expected higher frequency ranges but are also detected as an ‘aggregate root zone’. This hypothesis is partially supported by the results shown in
Appendix A, as fibrous roots correlate with multiple WPF ranges. Moreover, the resolution limit for detection using radar can be estimated using the λ/4 rule of thumb [
20]. With the current instrument’s frequency range of 0.9–2.7 GHz, this limit prevents resolution of objects less than ~0.88 cm in length. This is much larger than a typical diameter of fine roots or root hairs but potentially of the same scale as rhizomes and the spatial changes in root architecture and/or the root system’s zone of influence (i.e., the area within which water interacts with the root system). Alternatively, the correlation to the lower frequencies may be due to these frequencies responding to the near-surface crown structure that derives the plant stems and large network of vascularly connected fibrous roots. This fraction of the fibrous root system was quite large, yet not segregated from the lower biomass of fibrous roots originating from the rhizome nodes. Collectively, the relatively large size of the entire root system and its zone of influence is a positive indicator for detectability and belowground mass quantification.
There is limited consistency with which WPFs correlate strongly with biomass as burial depth increases. The lack of a clear relationship between WPF and biomass at each burial depth suggests that morphological structures may respond differently at varying burial depths. The lack of a consistent radar signature using this approach could present a challenge moving forward, as the eventual goal for this technology is its application in realistic settings where soil conditions and root mass are not known beforehand.
The use of wavelet transforms in GPR biogeoscience research is relatively new. Wavelets were discussed in a review by Liu [
38], who noted their use in various engineering applications, primarily as a de-noising and feature extraction technique. The analyses presented herein have adapted wavelets for B-scan feature extraction, thus building on the earlier work [
39]. An encouraging feature of these results is that the correlations for layers 1 and 2 were significant for both the rhizomes and fibrous roots. This result indicates that even though signal attenuation occurred, it was still possible to detect the biomass to a depth of 60 cm, a result that is highly encouraging for further applications of this technology in a field setting.
Despite these results, there are several additional factors that either affect the reliability of the results or the ability to apply GPR and CWT in other environments. The biomass of the root system may have been influenced by the soil quality used in the experiment. Sand was used for this study as it would have provided the purest soil medium and also would allow for cleaner root samples after washing. However, it is not typically grown in 100% pure sand, and as such, the vegetation material used in this study was subject to higher draining and less water content than usual. It was also uncharacteristically dependent upon fertilizers, which may have affected how much biomass accumulated in different soil layers. In this way, the GPR may have been biased toward the layers most affected by fertilization. There were also many opportunities for fibrous root material to be lost between scanning time and harvest. The roots were washed away over a period of a week, allowing ample opportunity to lose finer root mass due to the washing process.
The degree to which the soil medium composition and its moisture content affect the results was not explored in the present study; however, these variables are crucial to consider in GPR applications. The main strategy undertaken by using pure sand was to eliminate potential variation caused by more naturalistic soil media in order to maximize the chances for root detection. The expected behavior of repeated measurements in a more water-saturated and clay-like soil setting would be a more rapid attenuation of signal strength as it travels further into the subsurface [
12]. Furthermore, the drying of soil media due to drainage would likely cause scans of the same area to appear substantially different, and some form of compensation would need to be used to control this effect. From another perspective, the strategic use of soil moisture may, in fact, be a tool that can be used to increase the efficacy of this detection technique at shallower depths in a manner similar to Liu et al. [
43]. This being the case, this analysis methodology cannot be deployed in a practical sense without further research into its stability in other environments.
Although sorghum has previously been investigated using GPR [
44], it differs from other crops with successful correlations due to its absence of tubers and relatively small root structures. While the presence of such structures may be more easily determined in a controlled environment (such as in a manicured sand trough), it will certainly be more difficult to differentiate between rhizomes and irrelevant materials (such as rocks or solidified soil) in a standard agricultural setting.
The sand troughs themselves may have presented some uncertainties for the data collected. Based upon their construction, it was nearly impossible to break the sample down into sub-samples without introducing measurement error to the harvest process. The requirement to examine the roots in bulk thus limited the sample size and inhibited the ability to determine individual rhizomes.
While encouraging, it should be noted that the regression equations derived for each of the reported features cannot be directly applied to other settings. Foremost is the fact that each regression equation describes a standardized mass measure as a function of a standardized GPR feature. This standardization is itself specific to the dimensions of the experimental trough environment, which immediately makes applying the regression equations impossible for prediction in other settings. Second, the relationships found are based upon a small sample size which was demonstrated to influence the robustness of the results per the bootstrapping analysis. Third, these results are limited by the fact that they were obtained from a single experimental environment and a single plant model. It can be hypothesized that similar approaches may yield success when varying species and environmental factors given the essential physical principles the technique is based upon; however, this must be experimentally confirmed and validated. Regarding the application to other conditions, the current study serves as a starting point for this method by providing a set of relationships to be further explored, improved, and integrated into predictive algorithms.


 ,
, 


