Identification and Measurement of Shrinking Cities Based on Integrated Time-Series Nighttime Light Data: An Example of the Yangtze River Economic Belt
Abstract
1. Introduction
2. Materials and Methods
2.1. Data Source and Processing
2.1.1. DMSP/OLS NTL Data Processing
2.1.2. NPP/VIIRS NTL Data Processing
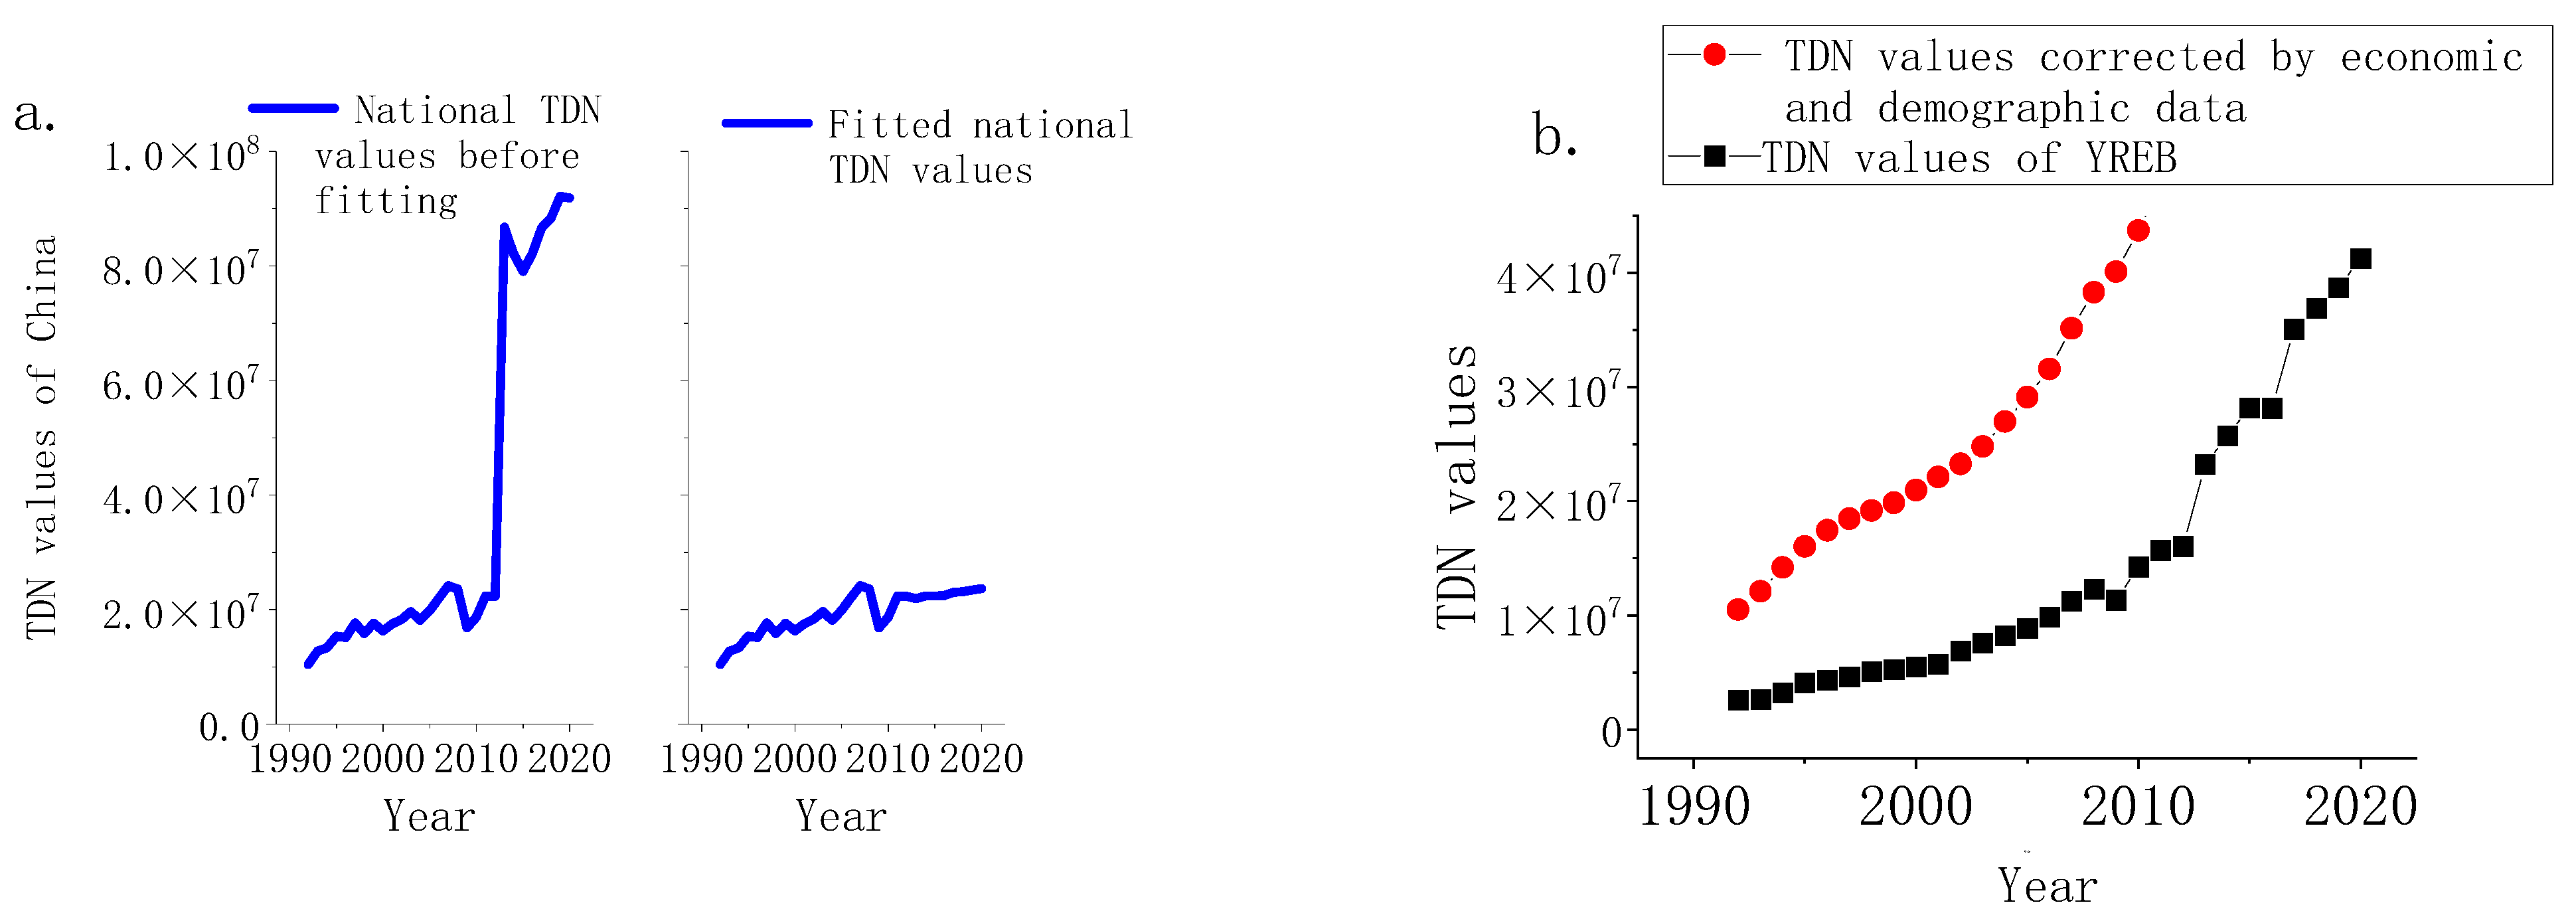
2.1.3. Data Fitting and Integration Processing
2.2. Methodology
2.2.1. Identifying Shrinking Cities
- (1)
- The urban shrinkage identification index
2.2.2. Measuring Urban Shrinkage
- (1)
- The average urban shrinkage intensity index
- (2)
- Urban shrinkage frequency index
3. Results
3.1. Spatial Pattern of Shrinking Cities
3.2. Spatial Autocorrelation Analysis of Shrinking Cities
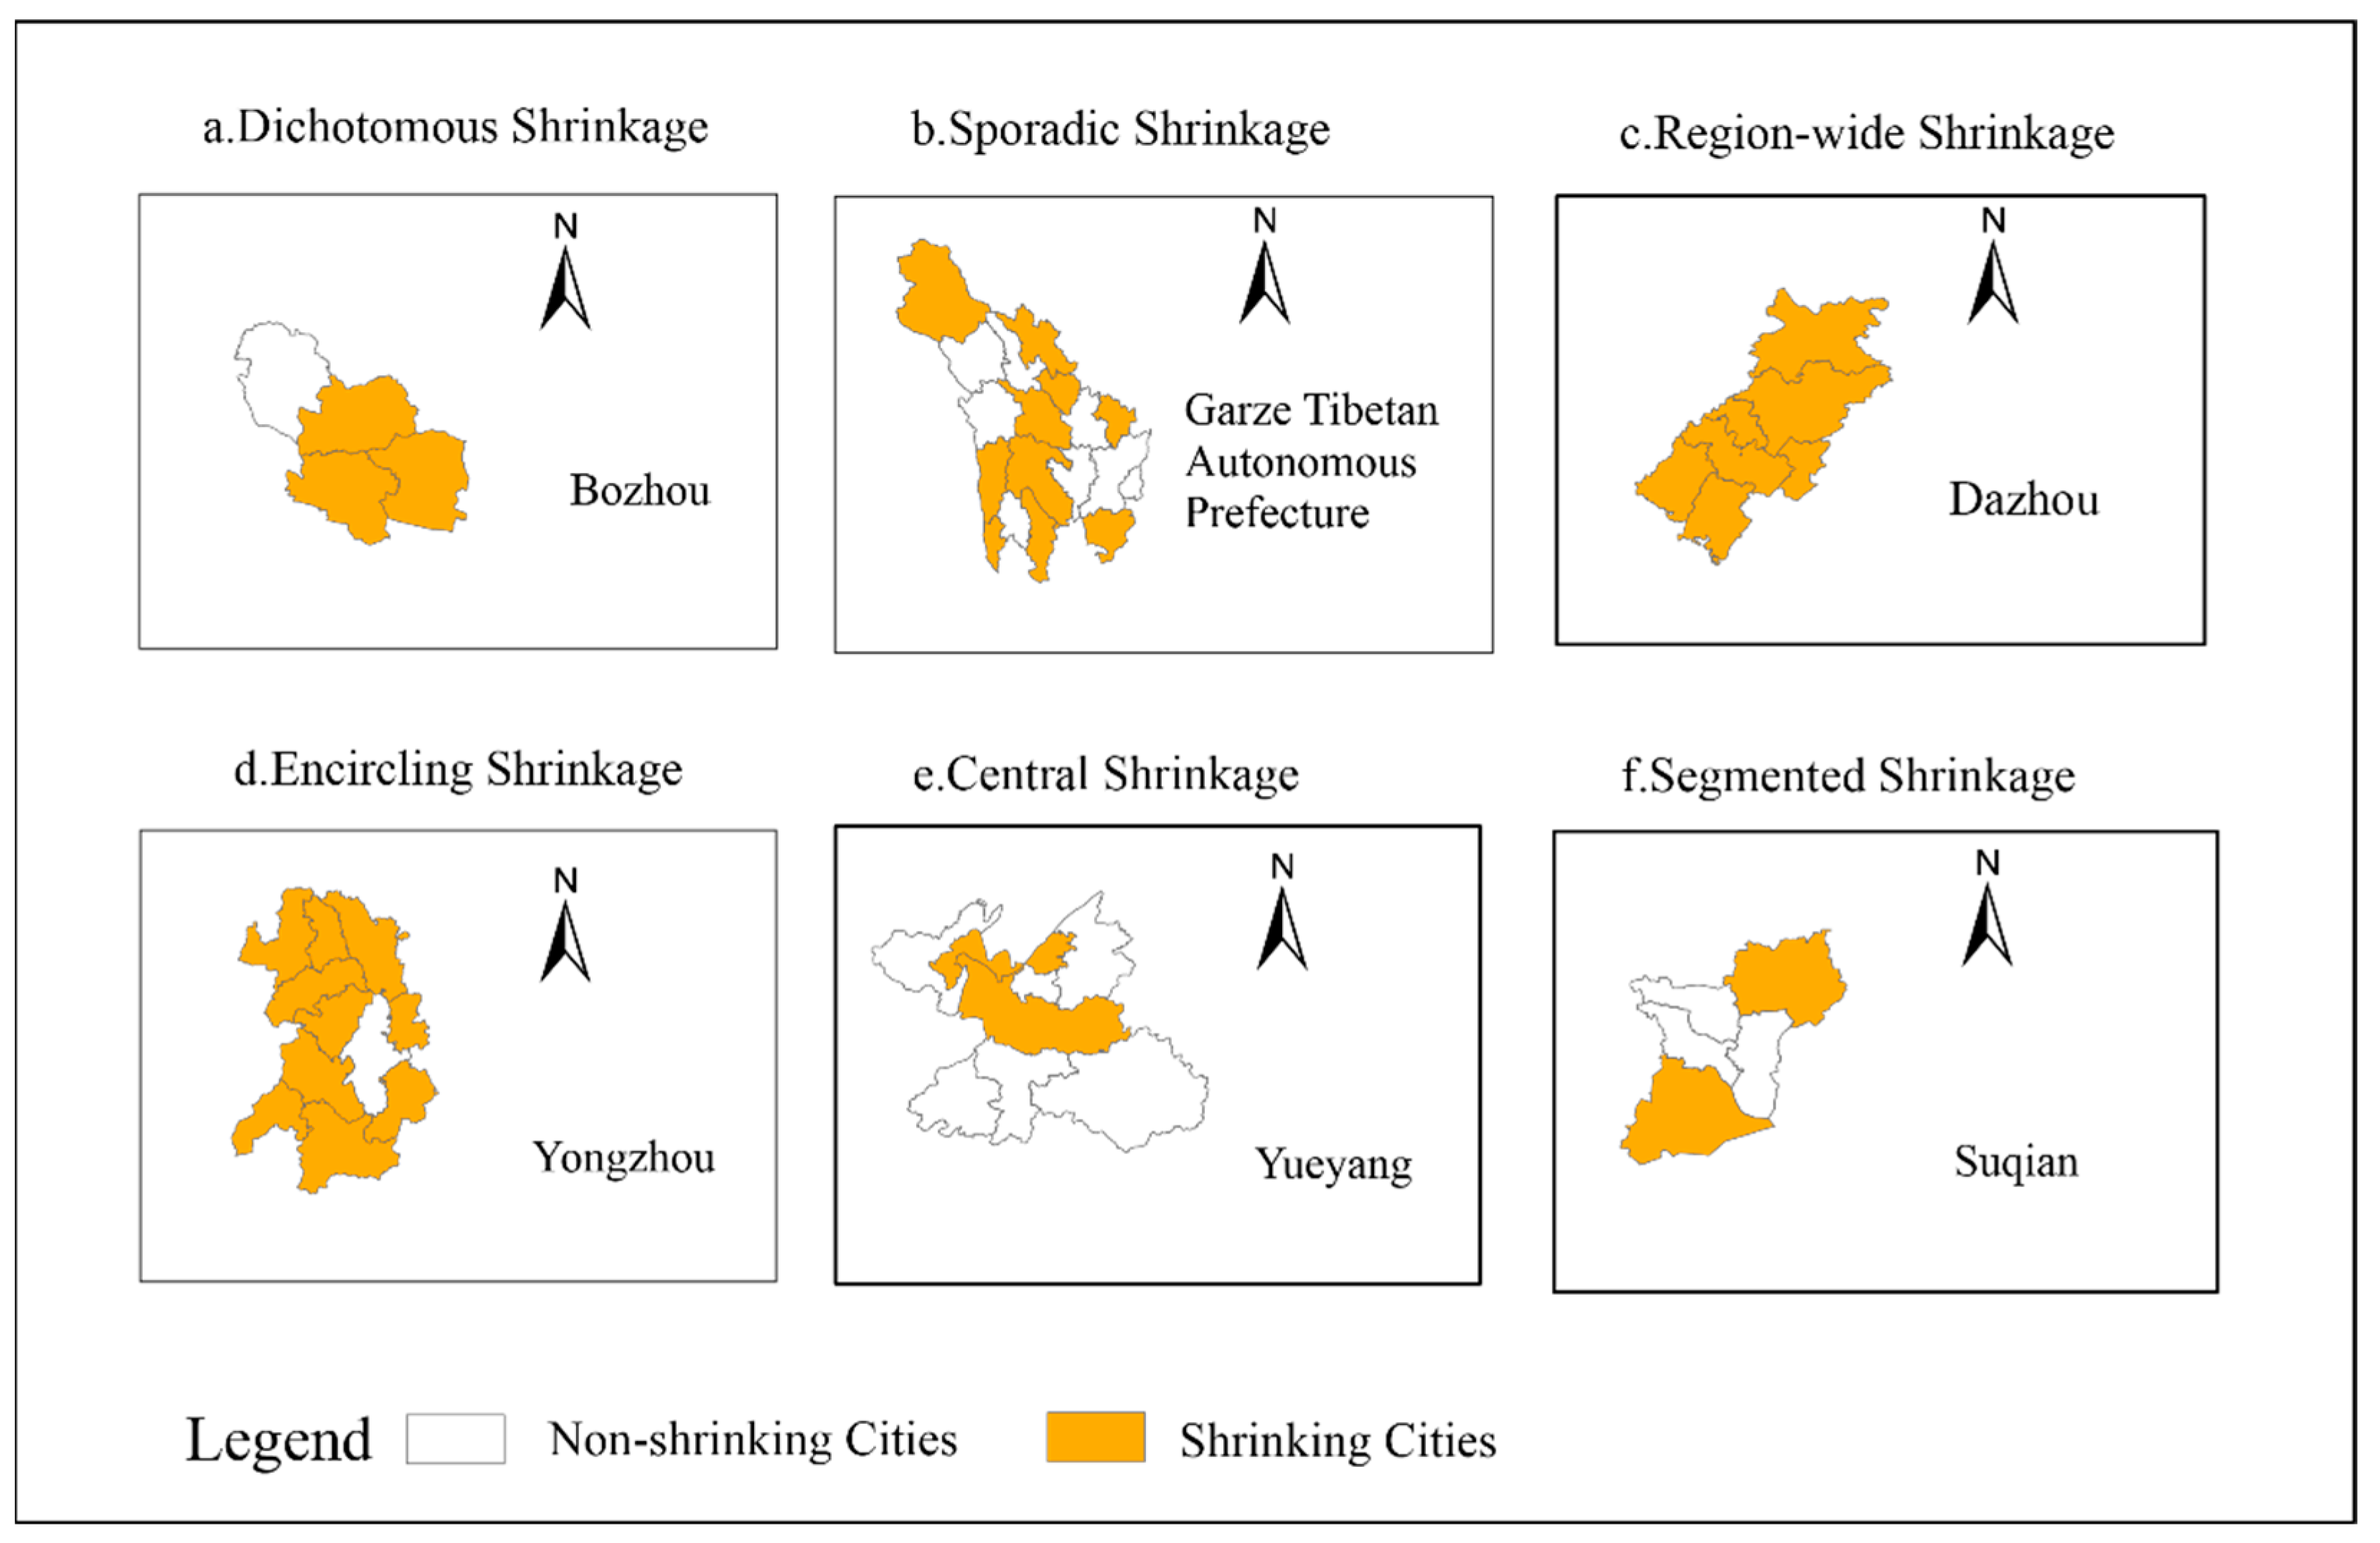
3.3. Analysis of Shrinkage Type for Shrinking Cities
3.4. Analysis of City Types for Urban Shrinking
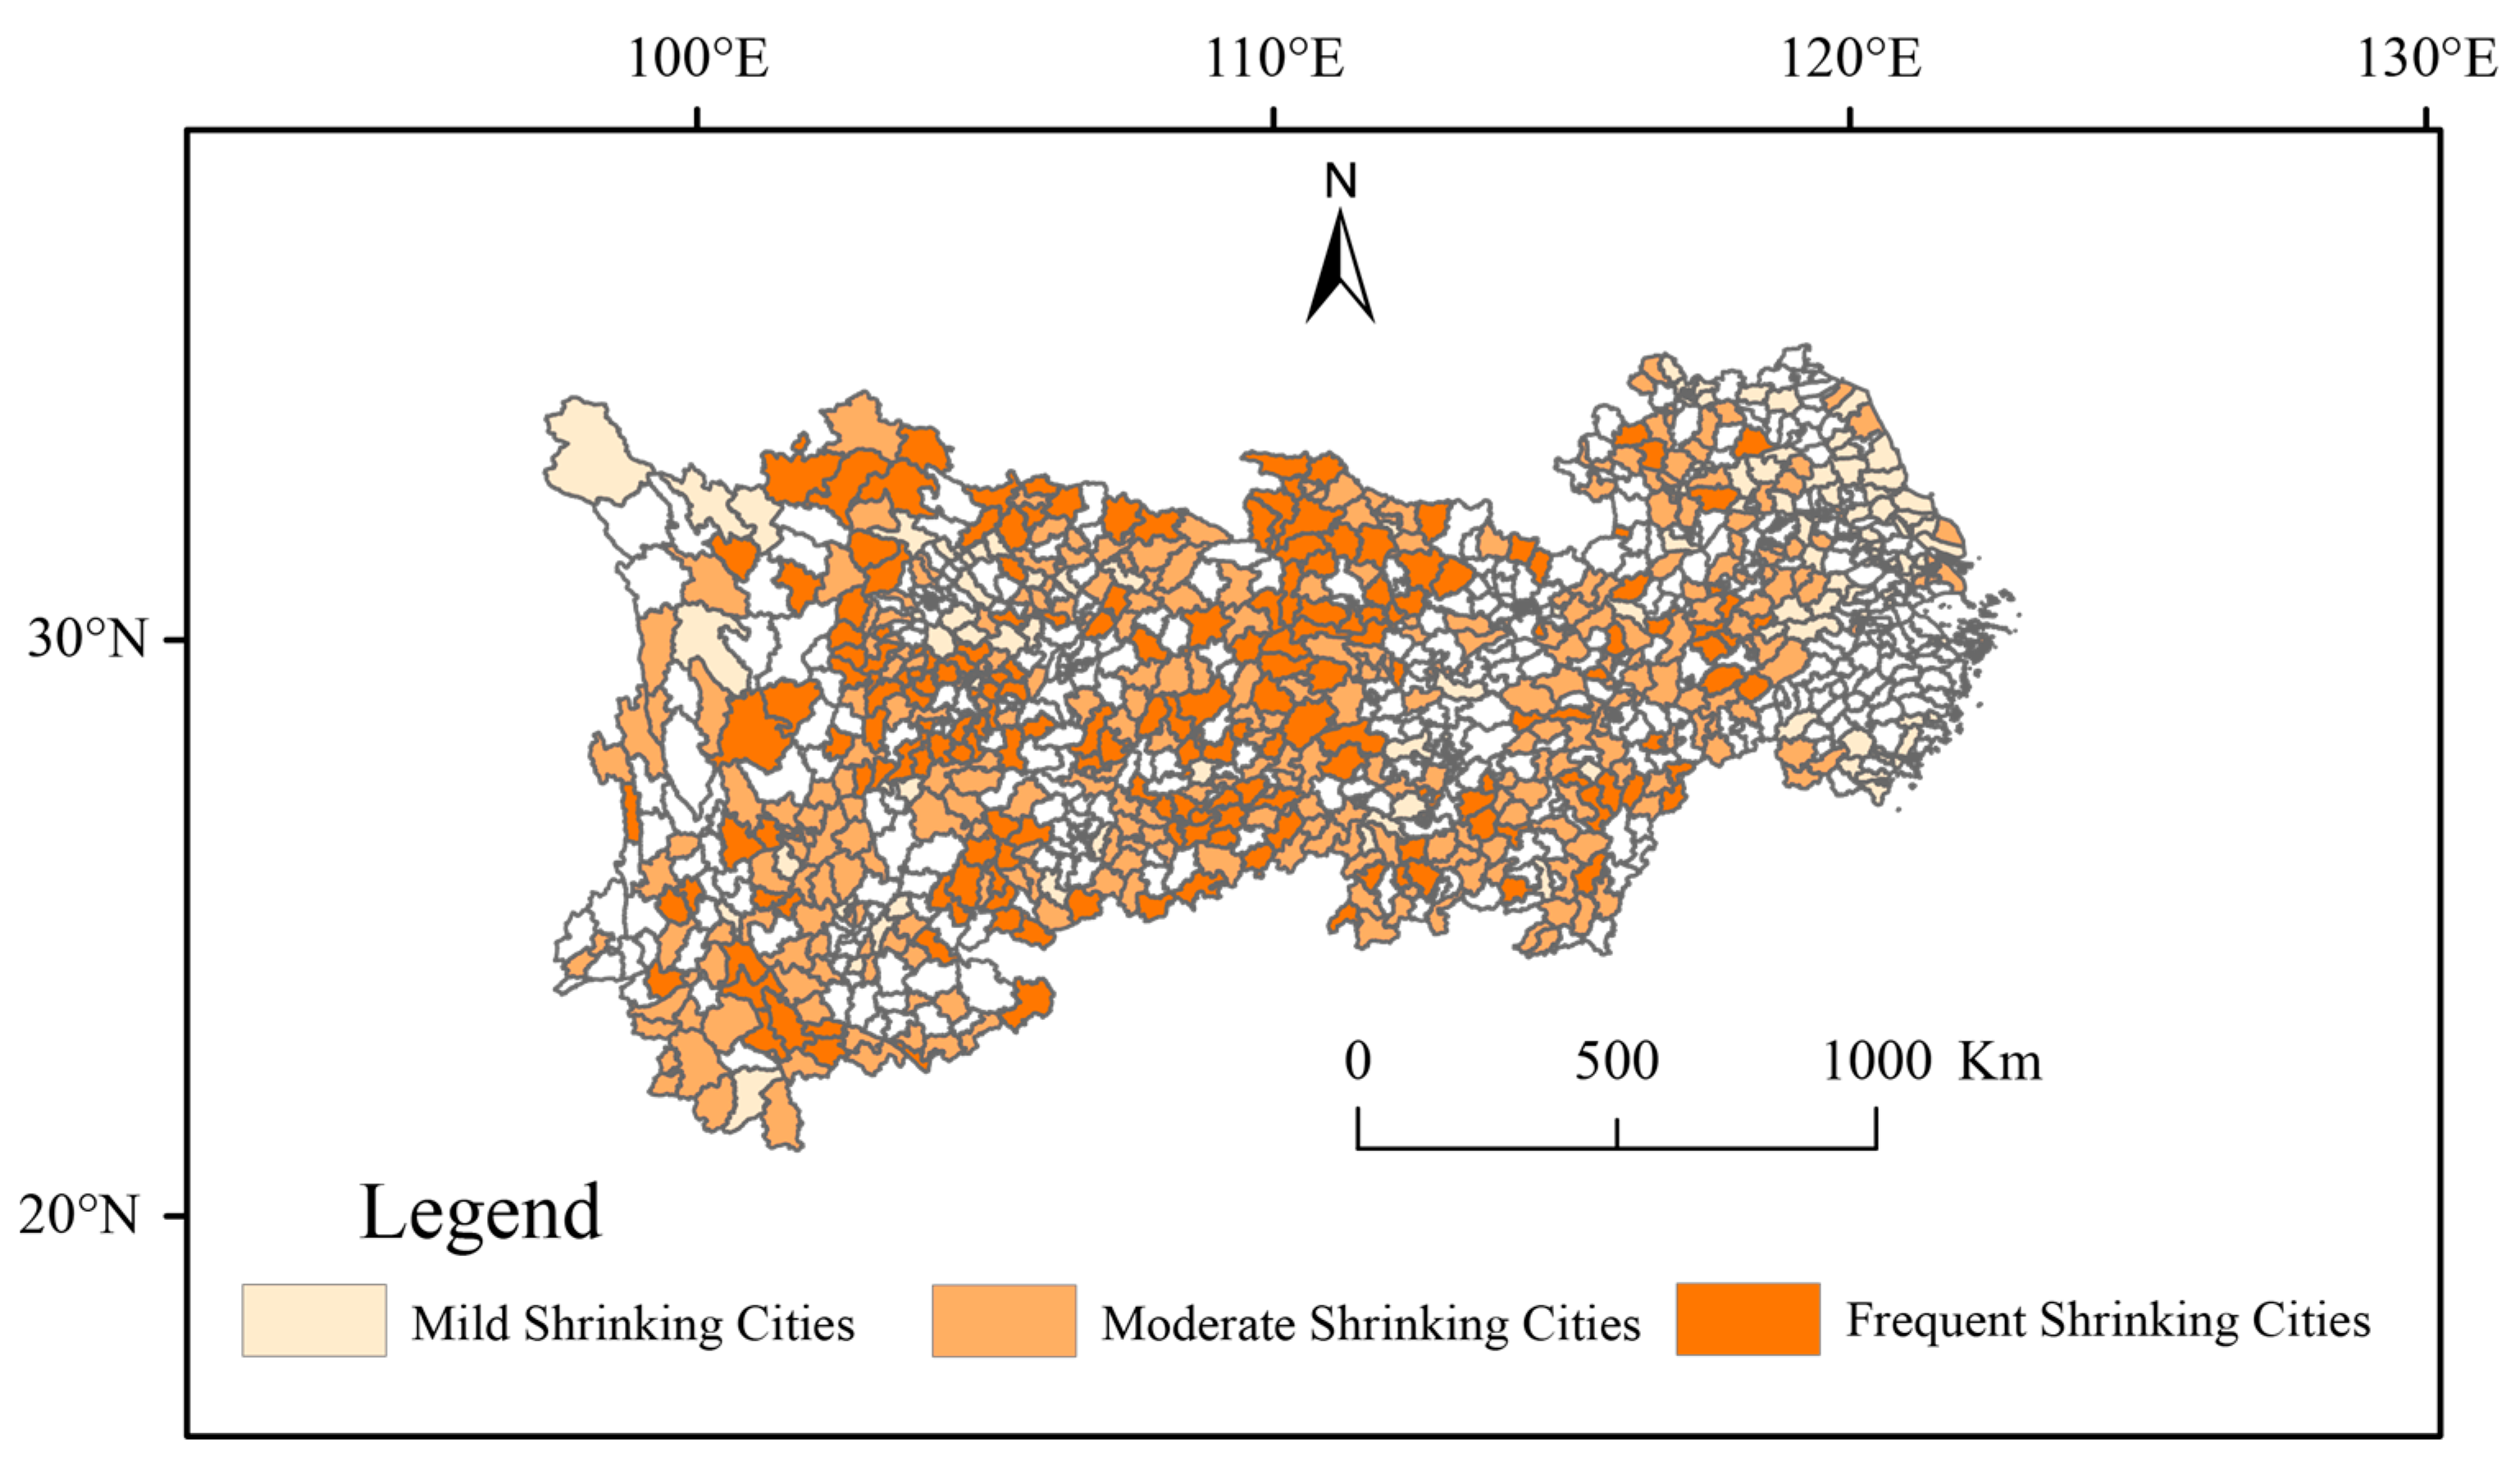
3.5. Analysis of the Frequency of Shrinking Cities
4. Discussion
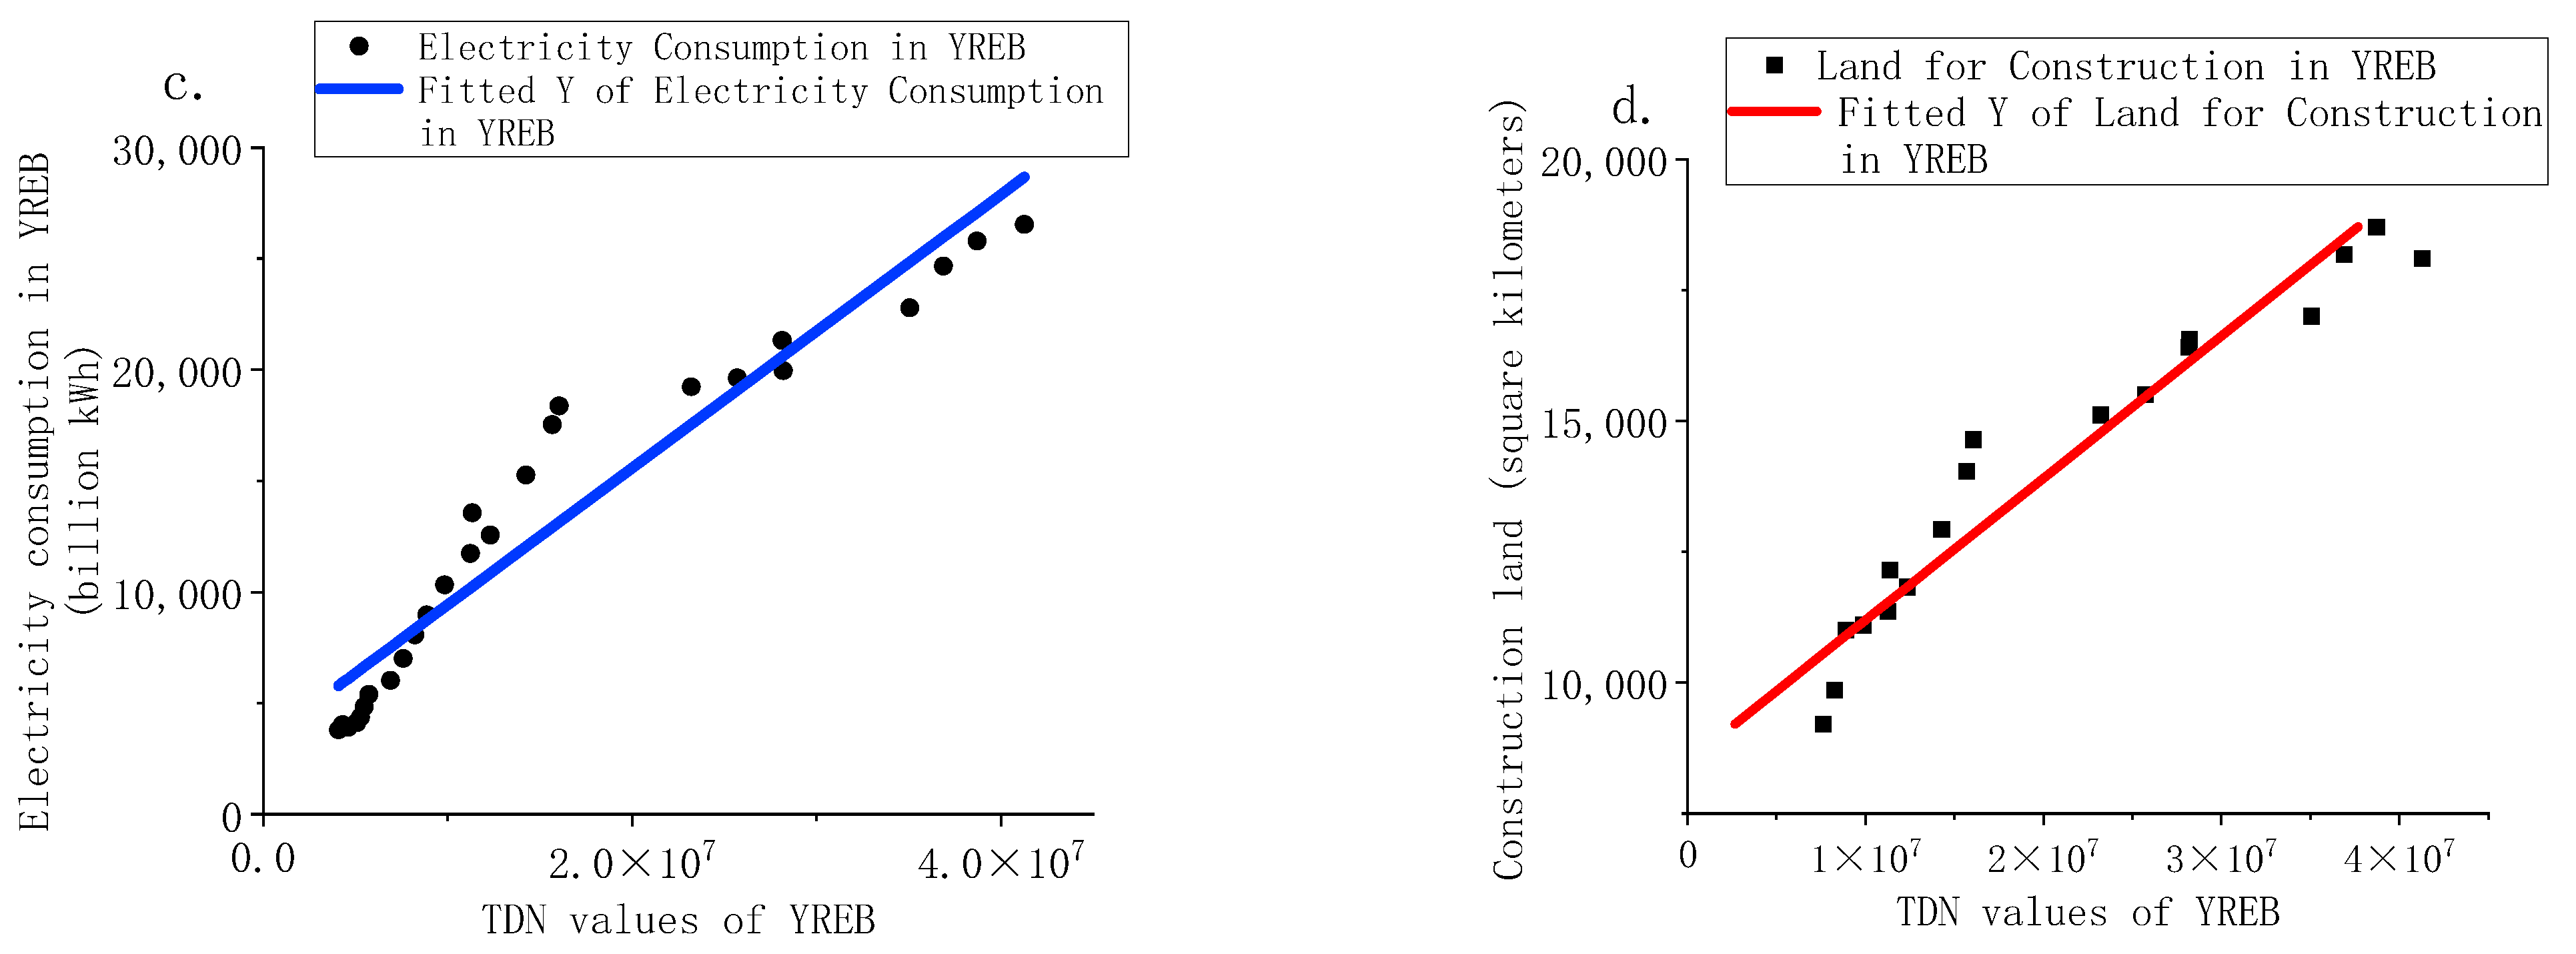
4.1. Stability and Performance of NTL Integrated Data
4.2. Limitations and Future Research Directions
5. Conclusions
Author Contributions
Funding
Data Availability Statement
Acknowledgments
Conflicts of Interest
References
- Großmann, K.; Bontje, M.; Haase, A.; Mykhnenko, V. Shrinking cities: Notes for the further research agenda. Cities 2013, 35, 221–225. [Google Scholar] [CrossRef]
- Camarda, D.; Rotondo, F.; Selicato, F. Strategies for dealing with urban shrinkage: Issues and scenarios in Taranto. Eur. Plan. Stud. 2015, 23, 126–146. [Google Scholar] [CrossRef]
- Nelle, A.; Großmann, K.; Haase, D.; Kabisch, S.; Rink, D.; Wolff, M. Urban shrinkage in Germany: An entangled web of conditions, debates and policies. Cities 2017, 69, 116–123. [Google Scholar]
- Berg, L.; Drewett, R.; Klaassen, L.H. A Study of Growth and Decline; Elsevier: Amsterdam, The Netherlands, 1982. [Google Scholar]
- Häußermann, H.; Siebel, W. Die schrumpfende Stadt und die Stadtsoziologie. In Soziologische Stadtforschung; VS Verlag für Sozialwissenschaften: Wiesbaden, Germany, 1988; pp. 78–94. [Google Scholar]
- Pallagst, K. Planning Challenges from an International Perspective. Int. J. Hydrogen Energy 1996, 21, 387–395. [Google Scholar]
- Oswalt, P. Shrinking Cities: International Research; Hatje Cantz: Ostfildern-Ruit, Germany, 2005. [Google Scholar]
- Luo, X. Mechanisms and types of urban shrinkage. City Plan. Rev. 2018, 3, 107–108. [Google Scholar]
- Martinez-Fernandez, C.; Weyman, T.; Fol, S.; Audirac, I.; Cunningham-Sabot, E.; Wiechmann, T.; Yahagi, H. Shrinking cities in Australia, Japan, Europe and the USA: From a global process to local policy responses. Prog. Plan. 2016, 105, 1–48. [Google Scholar]
- Deng, T.; Wang, D.; Yang, Y.; Yang, H. Shrinking cities in growing China: Did high speed rail further aggravate urban shrinkage? Cities 2019, 86, 210–219. [Google Scholar]
- Wang, J.; Yang, Z.; Qian, X. Driving factors of urban shrinkage: Examining the role of local industrial diversity. Cities 2020, 99, 102646. [Google Scholar] [CrossRef]
- Chen, C.; Luo, Z.; He, H. The Progress of the Research on the Shrinkage of Small Towns: Mechanism and Countermeasures. Mod. Urban Res. 2016, 31, 23–28+98. [Google Scholar]
- Johnson, K.M. Demographic Trends in Rural and Small Town America; Carsey Institute, University of New Hampshire: Durham, NH, USA, 2006. [Google Scholar]
- Cunningham-Sabot, E.; Fol, S. Shrinking cities in France and Great Britain: A silent process. 2009. [Google Scholar]
- Fluchter, W. Gunkanjima-view of an abandoned island. Shrinking Cities Complete Works. 2008. [Google Scholar]
- Zhou, Y.; Li, C.; Zheng, W.; Rong, Y.; Liu, W. Identification of urban shrinkage using NPP-VIIRS nighttime light data at the county level in China. Cities 2021, 118, 103373. [Google Scholar]
- Long, Y.; Wu, K.; Wang, J. Shrinking Cities in China. Mod. Urban Res. 2015, 9, 14–19. [Google Scholar]
- Chen, Y. Comprehensive Measurement and Influencing Factor Analysis of Shrinking Cities in Chin. Stat. Decis. 2021, 37, 68–71. [Google Scholar]
- Zhang, M.; Xiao, H. Spatial pattern characteristics and mechanism of urban contraction in Northeast China. Urban Probl. 2020, 33–42. [Google Scholar]
- Zhang, L. Increasing Cities and Shrinking Regions: Migration in China’s Urbanization: Cases from Sichuan Province and Xinyang City in Henan Province. Urban Dev. Stud. 2015, 9, 7. [Google Scholar]
- Liu, Y.; Zhang, X. A Study on The Shrinkage of Wuhan Metropolitan Area. Planners 2017, 33, 18–25. [Google Scholar]
- Wang, Z.; Zhou, H.; Zhou, F.; Xue, Y.; Wang, X. The Economic and Social Development of the Yangtze River Economic Belt: 2011–2015. Shanghai Econ. 2016, 5–25. [Google Scholar]
- Zhang, M.; Wang, Y. Analysis of the Spatial Pattern, Heterogeneity, and Mechanism of Urban Shrinkage: A Case Study of 110 Prefectural and Above Cities in the Yangtze River Economic Belt. Jianghan Trib. 2021, 5, 32–40. [Google Scholar]
- Chen, X.; Shao, D.; Zhang, S. Spatial Pattern and Influencing Factors of Urban Shrinkage in the Yellow River Basin from the Perspective of Population Change. Econ. Geogr. 2020, 40, 37–46. [Google Scholar]
- Liu, X. The influence of urban haze pollution on urban shrinkage in China—An analysis of the mediating effect of the labor supply. Environ. Sci. Pollut. Res. 2023, 28, 63297–63304. [Google Scholar] [CrossRef]
- Khavarian-Garmsir, A.R.; Pourahmad, A.; Hataminejad, H.; Farhoodi, R. Climate change and environmental degradation and the drivers of migration in the context of shrinking cities: A case study of Khuzestan province, Iran. Sustain. Cities Soc. 2019, 47, 101480. [Google Scholar]
- Schackmar, J.; Fleschurz, R.; Pallagst, K. The Role of Substitute Industries for Revitalizing Shrinking Cities. Sustainability 2021, 13, 9250. [Google Scholar] [CrossRef]
- Jaroszewska, E.; Stryjakiewicz, T. Drivers, Scale, and Geography of Urban Shrinkage in Poland and Policy Responses. J. Urban Plan. Dev. 2020, 146, 05020021. [Google Scholar] [CrossRef]
- Gert-Jan, H. Policy Responses to Urban Shrinkage: From Growth Thinking to Civic Engagement. Eur. Plan. Stud. 2014, 22, 1507–1523. [Google Scholar]
- Ehrenfeucht, R.; Trivers, I.R.; Schreiber, C. Toward sustainable urban forms in shrinking cities? The impacts of rental-housing configuration in new orleans after hurricane katrina. J. Archit. Plan. Res. 2016, 33, 121–139. [Google Scholar]
- Ohashi, H.; Phelps, N.A.; Tomaney, J. Between decentralization and recentralization: Conflicts in intramunicipal and intermunicipal governance in Tokyo’s shrinking suburbs. Urban Plan. 2022, 7, 98–114. [Google Scholar]
- Wu, K.; Wang, X. Understanding growth and shrinkage phenomena of industrial and trade cities in southeastern China: Case study of Yiwu. J. Urban Plan. Dev. 2020, 146, 05020028. [Google Scholar]
- Delken, E. Happiness in shrinking cities in Germany: A research note. J. Happiness Stud. 2008, 9, 213–218. [Google Scholar] [CrossRef]
- Alves, D.; Barreira, A.P.; Guimarães, M.H.; Panagopoulos, T. Historical trajectories of currently shrinking Portuguese cities: A typology of urban shrinkage. Cities 2016, 52, 20–29. [Google Scholar]
- Hoekveld, J.J. Time-space relations and the differences between shrinking regions. Built Environ. 2012, 38, 179–195. [Google Scholar] [CrossRef]
- Yang, Y.; Wu, J.; Wang, Y.; Huang, Q.; He, C. Quantifying spatiotemporal patterns of shrinking cities in urbanizing China: A novel approach based on time-series nighttime light data. Cities 2021, 118, 103346. [Google Scholar] [CrossRef]
- Pallagst, K.; Wiechmann, T.; Martinez-Fernandez, C. Shrinking Cities: International Perspectives and Policy Implications; Routledge: London, UK, 2013. [Google Scholar]
- Wiechmann, T. Errors expected—Aligning urban strategy with demographic uncertainty in shrinking cities. Int. Plan. Stud. 2008, 13, 431–446. [Google Scholar] [CrossRef]
- Haase, D.; Haase, A.; Rink, D. Conceptualizing the nexus between urban shrinkage and ecosystem services. Landsc. Urban Plan. 2014, 132, 159–169. [Google Scholar] [CrossRef]
- Murdoch, J., III. Specialized vs. diversified: The role of neighborhood economies in shrinking cities. Cities 2018, 75, 30–37. [Google Scholar]
- Zhang, S.; Wang, C.; Wang, J.; Yao, S.; Zhang, F.; Yin, G. On the comprehensive measurement of urban shrink in China and its spatio-temporal differentiation. China Popul. Resour. Environ. 2020, 30, 72–82. (In Chinese) [Google Scholar]
- Wichowska, A. Economic aspects of shrinking cities in Poland in the context of regional sustainable development. Sustainability 2021, 13, 3104. [Google Scholar] [CrossRef]
- Bartholomae, F.; Woon Nam, C.; Schoenberg, A. Urban shrinkage and resurgence in Germany. Urban Stud. 2017, 54, 2701–2718. [Google Scholar] [CrossRef]
- Schilling, J.; Logan, J. Greening the rust belt: A green infrastructure model for right sizing America’s shrinking cities. J. Am. Plan. Assoc. 2008, 74, 451–466. [Google Scholar]
- Schilling, J.; Schamess, L. Blueprint Buffalo Action Plan: Regional Strategies for Reclaiming Vacant Properties in the City and Suburbs of Buffalo; National Vacant Properties Coalition: Washington, DC, USA, 2006. [Google Scholar]
- Li, Y.; Chen, Z. Does transportation infrastructure accelerate factor outflow from shrinking cities? An evidence from China. Transp. Policy 2023, 134, 180–190. [Google Scholar]
- Pickett, S.T.A.; Boone, C.G.; McGrath, B.P.; Cadenasso, M.L.; Childers, D.L.; Ogden, L.A.; Grove, J.M. Ecological science and transformation to the sustainable city. Cities 2013, 32, S10–S20. [Google Scholar] [CrossRef]
- Long, Y. Redefining Chinese city system with emerging new data. Appl. Geogr. 2016, 75, 36–48. [Google Scholar] [CrossRef]
- Chen, J.; Kinoshita, T.; Li, H.; Luo, S.; Su, D.; Yang, X.; Hu, Y. Toward green equity: An extensive study on urban form and green space equity for shrinking cities. Sustain. Cities Soc. 2023, 90, 104395. [Google Scholar]
- Meng, X.; Jiang, Z.; Wang, X.; Long, Y. Shrinking cities on the globe: Evidence from LandScan 2000–2019. Environ. Plan. A Econ. Space 2021, 53, 1244–1248. [Google Scholar] [CrossRef]
- Peng, X.; Zhou, Y.; Fu, X.; Xu, J. Study on the spatial-temporal pattern and evolution of surface urban heat island in 180 shrinking cities in China. Sustain. Cities Soc. 2022, 84, 104018. [Google Scholar] [CrossRef]
- Berland, A.; Locke, D.H.; Herrmann, D.L.; Schwarz, K. Beauty or blight? Abundant vegetation in the presence of disinvestment across residential parcels and neighborhoods in Toledo, OH. Front. Ecol. Evol. 2020, 8, 566759. [Google Scholar] [CrossRef]
- Thompson, E.S.; de Beurs, K.M. Tracking the removal of buildings in rust belt cities with open-source geospatial data. Int. J. Appl. Earth Obs. Geoinf. 2018, 73, 471–481. [Google Scholar] [CrossRef]
- Meng, X.; Ma, S.; Xiang, W.; Kan, C.; Wu, K.; Long, Y. Classification of shrinking cities in China using Baidu big data. Acta Geographica Sinica 2021, 10, 2477–2488. [Google Scholar]
- Ma, Y. Spatiotemporal Characteristics of Urbanization in China from the Perspective of Remotely Sensed Big Data of Nighttime Light. J. Geo-Inf. Sci. 2019, 21, 59–67. [Google Scholar]
- Croft, T.A. Nighttime Images of the Earth from Space. Sci. Am. 1978, 239, 86–101. [Google Scholar] [CrossRef]
- Xu, Z.; Xu, Y. Study on the Spatio-Temporal Evolution of the Yangtze River Delta Urban Agglomeration by Integrating Dmsp/Ols and Npp/Viirs Nighttime Light Data. J. Geo-Inf. Sci. 2021, 23, 837–849. [Google Scholar]
- Yang, M. Identification of Chinese Urban Shrink and Its Causes—Based on Night Light Data. Hebei Acad. J. 2020, 40, 130–136. [Google Scholar]
- Chen, J.; Zhuo, L.; Shi, P.; Toshiaki, I. The study on urbanization process in China based on DMSP/OLS data: Development of a light index for urbanization level estimation. J. Remote Sens. 2003, 7, 168–175. [Google Scholar]
- Zhao, J.; Ji, G.; Yue, Y.; Lai, Z.; Chen, Y.; Yang, D.; Wang, Z. Spatio-temporal dynamics of urban residential CO2 emissions and their driving forces in China using the integrated two nighttime light datasets. Appl. Energy 2019, 235, 612–624. [Google Scholar] [CrossRef]
- Zhai, W.; Jiang, Z.; Meng, X.; Zhang, X.; Zhao, M.; Long, Y. Satellite monitoring of shrinking cities on the globe and containment solutions. iScience 2022, 25, 104411. [Google Scholar] [PubMed]
- Dong, B.; Ye, Y.; You, S.; Zheng, Q.; Huang, L.; Zhu, C.; Wang, K. Identifying and classifying shrinking cities using long-term continuous night-time light time series. Remote Sens. 2021, 13, 3142. [Google Scholar] [CrossRef]
- Li, X.; Li, D.; Xu, H.; Wu, C. Intercalibration between DMSP/OLS and VIIRS night-time light images to evaluate city light dynamics of Syria’s major human settlement during Syrian Civil War. Int. J. Remote Sens. 2017, 38, 5934–5951. [Google Scholar] [CrossRef]
- Zheng, Q.; Weng, Q.; Wang, K. Developing a new cross-sensor calibration model for DMSP-OLS and Suomi-NPP VIIRS night-light imageries. ISPRS J. Photogramm. Remote Sens. 2019, 153, 36–47. [Google Scholar] [CrossRef]
- Wu, J.; He, S.; Peng, J.; Li, W.; Zhong, X. Intercalibration of DMSP-OLS night-time light data by the invariant region method. Int. J. Remote Sens. 2013, 34, 7356–7368. [Google Scholar] [CrossRef]
- Cao, Z.; Wu, Z.; Kuang, Y.; Huang, N. Correction of DMSP/OLS night-time light images and its application in China. J. Geo-Inf. Sci. 2015, 17, 1092–1102. [Google Scholar]
- Ma, J.; Guo, J.; Ahmad, S.; Li, Z.; Hong, J. Constructing a new inter-calibration method for DMSP-OLS and NPP-VIIRS nighttime light. Remote Sens. 2020, 12, 937. [Google Scholar] [CrossRef]
- Wu, Y.; Shi, K.; Chen, Z.; Liu, S.; Chang, Z. Developing improved time-series DMSP-OLS-like data (1992–2019) in China by integrating DMSP-OLS and SNPP-VIIRS. IEEE Trans. Geosci. Remote Sens. 2021, 60, 4407714. [Google Scholar] [CrossRef]
- Oswalt, P.; Rieniets, T. Atlas of Shrinking Cities; Hatje Cantz: Ostfildern-Ruit, Germany, 2006. [Google Scholar]
- Zhen, J.; Wang, T.; Chen, H. Identification and Influencing Factors of Population Shrinking Cities in the Yangtze River Economic Belt. East China Econ. Manag. 2022, 36, 13–25. [Google Scholar]
- Zhang, M.; Qu, J. Spatial Pattern and Structural Characteristics of Urban Contraction in the Middle Reaches of the Yangtze River. Res. Financ. Econ. Issues 2019, 8, 113–121. [Google Scholar]
- Ma, S.; Zhang, W. Industrial Transformation Path and Models of Resource-based Cities and Old Industrial Bases in the Yangtze River Economic Belt. Think Tank Theory Pract. 2019, 4, 58–67. [Google Scholar]
- Northam, R.M. Population size, relative location, and declining urban centers: Conterminous United States, 1940–1960. Land Economics 1969, 45, 313–322. [Google Scholar] [CrossRef]
- Wei, Y.; Liu, H.; Song, W.; Yu, B.; Xiu, C. Normalization of time series DMSP-OLS nighttime light images for urban growth analysis with pseudo invariant features. Landsc. Urban Plan. 2014, 128, 1–13. [Google Scholar] [CrossRef]
- Niu, W.; Xia, H.; Wang, R.; Pan, L.; Meng, Q.; Qin, Y.; Zhao, W. Research on large-scale urban shrinkage and expansion in the Yellow River affected area using night light data. ISPRS Int. J. Geo-Inf. 2020, 10, 5. [Google Scholar] [CrossRef]
- Haase, A.; Rink, D.; Grossmann, K.; Bernt, M.; Mykhnenko, V. Conceptualizing urban shrinkage. Environ. Plan. A 2014, 46, 1519–1534. [Google Scholar] [CrossRef]
- Zhang, Y.; Yu, Z.; Zhang, F. Spatial Pattern and Influential Factors of Urban Shrinkage in Yangtze River Economic Zone. J. Geomat. 2019, 44, 16–19. [Google Scholar]
| Data | Data Description | Time Range/Resolution | Source |
|---|---|---|---|
| DMSP/OLS | annual DMSP/OLS nighttime steady light data | 1992–2013 1 km2 | NOAA/NGDC https://www.ngdc.noaa.gov/eog/dmsp/download V4composites.html (accessed on 1 July 2022) |
| NPP/VIIRS | annual NPP/VIIRS nighttime light data | 2013–2020 500 m2 | https://payneinstitute.mines.edu/eog/nighttime-lights (accessed on 1 July 2022) |
| RCNL | Global radiance calibrated night lighting products | 2006 | NOAA/NGDC https://www.ngdc.noaa.gov/eog/dmsp/download_radcal.html (accessed on 1 July 2022) |
| Population | National population data | 1992–2019 | National Bureau of Statistics of the People’s Republic of China http://data.stats.gov.cn/index.htm (accessed on 23 January 2023) |
| GDP | National GDP data | 1992–2019 | National Bureau of Statistics of the People’s Republic of China http://data.stats.gov.cn/index.htm (accessed on 23 January 2023) |
| Boundaries | Shapefile of Counties and Cities in China and the YREB | 2021 | China National Geographic Information Center National Geomatics Center of China http://sgic.geodata.gov.cn (accessed on 23 January 2023) |
| Electricity consumption | Electricity Consumption in Municipal Cities of YREB | 1995–2020 | National Bureau of Statistics of the People’s Republic of China http://data.stats.gov.cn/index.htm (accessed on 23 January 2023) |
| Land area for urban construction | Land area for urban construction in the YREB | 2003–2020 | City Statistical Yearbook of China (accessed on 23 January 2023) |
| Year | Beijing and Shanghai | Guangzhou and Shenzhen |
|---|---|---|
| 2013 | 192.779 | 174.89 |
| 2014 | 209.976 | 296.256 |
| 2015 | 443.53 | 340.514 |
| 2016 | 769.782 | 260.427 |
| 2017 | 238.213 | 269.902 |
| 2018 | 243.683 | 337.364 |
| 2019 | 2083.39 | 341.573 |
| 2020 | 373.565 | 293.881 |
| Shrinking Counties | Growing Counties | Shrinking Municipalities | Growing Municipalities | |
|---|---|---|---|---|
| Number | 644 | 425 | 36 | 94 |
| Percentage | 60.2432% | 39.7568% | 27.6923% | 72.3077% |
| Year | Z | I | Year | Z | I |
|---|---|---|---|---|---|
| 1993 | 6.034 | 0.339 *** | 2007 | 9.138 | 0.518 *** |
| 1994 | 13.332 | 0.764 *** | 2008 | 4.928 | 0.270 *** |
| 1995 | 3.294 | 0.179 *** | 2009 | 13.907 | 0.775 *** |
| 1996 | 9.745 | 0.519 *** | 2010 | 6.075 | 0.332 *** |
| 1997 | 4.807 | 0.265 *** | 2011 | 11.646 | 0.651 *** |
| 1998 | 6.465 | 0.362 *** | 2012 | 8.455 | 0.480 *** |
| 1999 | 9.447 | 0.535 *** | 2013 | 13.054 | 0.740 *** |
| 2000 | 4.741 | 0.264 *** | 2014 | 8.486 | 0.482 *** |
| 2001 | 8.875 | 0.504 *** | 2015 | 6.374 | 0.358 *** |
| 2002 | 10.110 | 0.573 *** | 2016 | 9.726 | 0.552 *** |
| 2003 | 7.505 | 0.406 *** | 2017 | −0.268 | −0.023 |
| 2004 | 11.447 | 0.645 *** | 2018 | 7.513 | 0.422 *** |
| 2005 | 6.263 | 0.344 *** | 2019 | 11.040 | 0.630 *** |
| 2006 | 6.520 | 0.368 *** | 2020 | 6.469 | 0.363 *** |
| Year | Z | I | Year | Z | I |
|---|---|---|---|---|---|
| 1993 | −3.105 | −0.046 *** | 2007 | 3.937 | 0.056 *** |
| 1994 | −1.760 | −0.026 * | 2008 | 2.675 | 0.038 *** |
| 1995 | −0.751 | −0.011 | 2009 | −2.601 | −0.039 *** |
| 1996 | 4.316 | 0.061 *** | 2010 | 6.014 | 0.087 *** |
| 1997 | −1.012 | −0.016 | 2011 | 0.396 | 0.005 |
| 1998 | 2.234 | 0.030 ** | 2012 | −3.739 | −0.055 *** |
| 1999 | 1.047 | 0.014 | 2013 | 1.911 | 0.027 ** |
| 2000 | 0.493 | 0.006 | 2014 | −1.594 | −0.024 |
| 2001 | −3.167 | −0.047 *** | 2015 | 3.163 | 0.046 *** |
| 2002 | 3.834 | 0.054 *** | 2016 | −3.137 | −0.046 *** |
| 2003 | −6.061 | −0.089 *** | 2017 | −2.147 | −0.031 ** |
| 2004 | 0.946 | 0.013 ** | 2018 | 1.837 | 0.025 ** |
| 2005 | 1.942 | 0.029 * | 2019 | −1.575 | −0.024 |
| 2006 | 4.204 | 0.060 *** | 2020 | 0.210 | 0.004 |
| Shrinkage Type | Dichotomous Shrinkage | Sporadic Shrinkage | Region-Wide Shrinkage | Encircling Shrinkage | Growing Cities | Central Shrinkage | Segmented Shrinkage |
|---|---|---|---|---|---|---|---|
| Number | 36 | 23 | 22 | 11 | 6 | 12 | 20 |
| proportion | 27.69% | 17.69% | 16.92% | 8.46% | 4.62% | 9.23% | 15.39% |
| City Category | Description | Shrinking Cities | Proportion | Shrinking Counties | Proportion |
|---|---|---|---|---|---|
| Resource-based Cities | 19 | 52.78% | 97 | 33.68% | |
| Old industrial base cities | 22 | 64.71% | 88 | 32.71% | |
| Large-Scale Cities | Cities with an urban non-farm population of 500,000 or more | 18 | 81.82% | 119 | 47.98% |
| Medium-Scale cities | Cities with an urban non-farm population of 200,000–500,000 | 31 | 64.58% | 292 | 77.66% |
| Small-scale cities | Cities with an urban non-farm population of 200,000 or less | 13 | 86.67% | 52 | 50.49% |
| Shrinkage Frequency | Mild Shrinkage | Moderate Shrinkage | Frequent Shrinkage |
|---|---|---|---|
| Number | 62 | 473 | 109 |
| proportion | 9.63% | 73.44% | 16.93% |
Disclaimer/Publisher’s Note: The statements, opinions and data contained in all publications are solely those of the individual author(s) and contributor(s) and not of MDPI and/or the editor(s). MDPI and/or the editor(s) disclaim responsibility for any injury to people or property resulting from any ideas, methods, instructions or products referred to in the content. |
© 2023 by the authors. Licensee MDPI, Basel, Switzerland. This article is an open access article distributed under the terms and conditions of the Creative Commons Attribution (CC BY) license (https://creativecommons.org/licenses/by/4.0/).
Share and Cite
Tan, Z.; Xiang, S.; Wang, J.; Chen, S. Identification and Measurement of Shrinking Cities Based on Integrated Time-Series Nighttime Light Data: An Example of the Yangtze River Economic Belt. Remote Sens. 2023, 15, 3797. https://doi.org/10.3390/rs15153797
Tan Z, Xiang S, Wang J, Chen S. Identification and Measurement of Shrinking Cities Based on Integrated Time-Series Nighttime Light Data: An Example of the Yangtze River Economic Belt. Remote Sensing. 2023; 15(15):3797. https://doi.org/10.3390/rs15153797
Chicago/Turabian StyleTan, Zhixiong, Siman Xiang, Jiayi Wang, and Siying Chen. 2023. "Identification and Measurement of Shrinking Cities Based on Integrated Time-Series Nighttime Light Data: An Example of the Yangtze River Economic Belt" Remote Sensing 15, no. 15: 3797. https://doi.org/10.3390/rs15153797
APA StyleTan, Z., Xiang, S., Wang, J., & Chen, S. (2023). Identification and Measurement of Shrinking Cities Based on Integrated Time-Series Nighttime Light Data: An Example of the Yangtze River Economic Belt. Remote Sensing, 15(15), 3797. https://doi.org/10.3390/rs15153797


