
High Accuracy Solar Diffuser BRDF Measurement for On-Board Calibration in the Solar Reflective Band

1
Science Island Branch of Graduate School, University of Science and Technology of China, Hefei 230026, China
2
Key Laboratory of Optical Calibration and Characterization, Hefei Institutes of Physical Science, Chinese Academy of Sciences, Hefei 230031, China
*
Author to whom correspondence should be addressed.
Remote Sens. 2023, 15(15), 3783; https://doi.org/10.3390/rs15153783
Submission received: 15 April 2023
/
Revised: 7 July 2023
/
Accepted: 28 July 2023
/
Published: 29 July 2023
(This article belongs to the Special Issue Accuracy and Quality Control of Remote Sensing Data)
Abstract
:In the solar reflective band, an on-board calibration method based on a solar diffuser (SD) can realize full aperture, full field of view, and end-to-end absolute radiometric calibration of optical remote sensors. The SD’s bidirectional reflectance distribution function (BRDF) is a key parameter that affects the accuracy of the on-board calibration. High-accuracy measurement of the SD BRDF is required in the laboratory before launch. Due to the uncertainty of the goniometer system, polarization effects, and other factors, the measurement uncertainty of the SD BRDF at large incident angles is much higher than that at a 0° incident zenith angle and 45° reflection zenith angle. In this paper, an absolute BRDF measurement facility is reported. The goniometric system consists of a high-brightness integrating sphere as a radiation source, a six-axis robot arm, and a large rotation stage. The measurement wavelength range was from 350 nm to 2400 nm. An improved data processing method based on the reciprocity theorem was proposed to reduce the measurement uncertainty of the SD BRDF at large incident angles. At an incident zenith angle of 75°, the improved data processing method reduced the measurement uncertainty of the SD BRDF by 52% at 410 nm to 480 nm, by 70% at 480 nm to 1000 nm, and by 20% at other bands compared to the absolute measurement method. The influence of the radiation source, goniometer system, detection system, and other factors on the measurement uncertainty are analyzed in this paper. The results show that the measurement uncertainty (coverage factor k = 2) of the SD BRDF was better than 1.04% at 350 nm to 410 nm, 0.60% at 410 nm to 480 nm, 0.43% at 480 nm to 1000 nm, and 0.86% at 1000 nm to 2400 nm.
1. Introduction
An optical remote sensor requires absolute radiometric calibration to quantify the sensor’s response to a known radiometric input [1]. Although a remote sensor has been calibrated with high accuracy before launch, its performance inevitably changes during its transportation, launch, and on-orbit operation. Therefore, on-orbit calibration is necessary [2,3]. Among the various on-orbit calibration methods, an on-board calibration method based on a solar diffuser (SD) has the advantages of high frequency, full aperture, a full field of view, and end-to-end characteristics. This is currently the dominant on-board calibration method in the solar reflective band. In this calibration method, the solar radiance reflected from an SD is used as a high radiance source. The radiance at the sensor aperture when viewing the SD is directly influenced by the SD BRDF [4,5,6,7,8,9]. Therefore, the SD BRDF is a key parameter that determines the uncertainty of on-board calibration.
The BRDF can accurately describe the spatial and spectral characteristics of an object. It is defined as the ratio of irradiance falling on the object’s surface from a given direction, and its contribution, to the radiance that is reflected in another direction. The initial SD BRDF for an on-board calibration can only be measured in a laboratory before launch [10]. After entering orbit, the stability of the BRDF can be monitored through an SD stability monitor or a backup SD [11,12].
In recent years, many institutions have conducted research on absolute BRDF measurement. The Robotic Optical Scattering Instrument (ROSI) developed by the National Institute of Standards and Technology (NIST) realized a high-accuracy BRDF measurement in the range of 250 nm to 2400 nm. In the range of 250 nm to 1050 nm, the uncertainty (coverage factor k = 2) of a BRDF measurement at standard in-plane geometry (0°/45°), i.e., with an incident zenith angle of 0° and a reflected zenith angle of 45°, was less than 0.82% and increased to 1.92% for 1050 nm to 2400 nm [13,14]. The Physikalisch-Technische Bundesanstalt (PTB) developed a gonioreflectomter based on a five-axis robot. The wavelength range covered 250 nm to 1700 nm. The uncertainty (k = 2) of the BRDF measurement in standard geometry was less than 0.5% at 400 nm to 1700 nm and 1.5% at 250 nm to 400 nm [15,16,17]. The National Research Council (NRC, Canada) gonioreflectometer applied an array spectroradiometer as the radiation measurement device to achieve high-accuracy BRDF measurement at 250 nm to 1700 nm. The k = 2 uncertainty in the standard geometry was less than 0.5% in the range of 400 nm to 900 nm [18]. The Consejo Superior de Investigaciones Científicas (CSIC) Research Institute developed a measurement facility named Gonio-EspectroFótometro Español (GEFE), which could measure the BRDF and bidirectional transmittance distribution function (BTDF) of samples. The wavelength range covered 380 nm to 780 nm. The overall BRDF measurement uncertainty was less than 1% [17,19]. All uncertainties above are the measurement uncertainties for a BRDF of a nearly perfect diffuser.
The measurement facilities of the above national metrology laboratories are mainly used for standard transfer, rather than SD BRDF measurement for on-board calibration. At present, most SD BRDF measurement facilities achieve measurements that are traceable to a reflectance standard, i.e., a reference sample. The reflectance of the reference is known for the specified geometry and wavelength range. The facility is first calibrated with reference to the standard, and then the sample is substituted for the standard. For example, two scatterometers at NASA GSFC’s Diffuser Calibration Lab (DCL) were used to effect NIST traceable BRDF scale transfers and enable the prelaunch testing of large-area solar diffuser flight unit panels in their on-orbit configurations [20]. The relative measurement method is simple and convenient. However, the disadvantages are obvious. The standard transfer is needed in this method. The major uncertainty then lies in the BRDF of the standard. The reference sample can easily be contaminated, which affects the measurement results [10].
To further reduce measurement uncertainty, some laboratories have developed absolute BRDF measurement facilities, such as the Polarization and Scatter Characterization Analysis of Lambertian materials (PASCAL) at Raytheon [21]. An absolute measurement means that the BRDF is obtained by measuring the incident and reflected radiation according to the definition of the BRDF. Additionally, no reference standard is introduced into the absolute measurement. Compared to relative measurement, an absolute measurement system needs a linear receiver over a sufficiently wide dynamic range [10].
In the on-board calibration process, the relative geometric relationship with respect to the SD between the incident direction of the sunlight and the observed direction of a remote sensor determines the incident and reflected angles of the SD BRDF measurement in the laboratory. Due to the limitations of satellite orbits, on-board calibration times, and other factors, it is necessary to measure SD BRDF with high accuracy at in- and out-of-plane and large angle geometries. In this case, the BRDF measurement’s uncertainty increases compared to measuring in the standard geometry. There are many reasons for this problem, such as angle uncertainty and polarization [22].
An SD is often made of polytetrafluoroethylene (PTFE), sand-blasted aluminum, etc. [23]. According to the spatial and spectral characteristics of the SD, an improved data processing method could be designed based on the reciprocity theorem. This method could reduce the dependence of the measurement uncertainty on the angular accuracy of the goniometer system. An integrating sphere radiator was used as a source to ensure high-irradiance uniform illumination while reducing the influence of polarization on the measurement results.
This article is organized as follows. In Section 2, the principle of absolute BRDF measurement is introduced. In Section 3, an absolute BRDF measurement facility is introduced, including the configuration, calibration methods, and results of each part. The workflow of the facility is also presented. In Section 4, the determination of the SD BRDF measurement angle and the causes of large-angle incidence and detection in on-board calibration are discussed. An improved data processing method based on the reciprocity theorem is also introduced. The uncertainty of the SD BRDF measurement is analyzed based on the system calibration results from the overall facility in Section 5. The measurement results of the SD BRDF for on-board calibration are provided in Section 6. Finally, conclusions are given in Section 7.
2. Absolute BRDF Measurement Principle
The BRDF can be defined as [24]
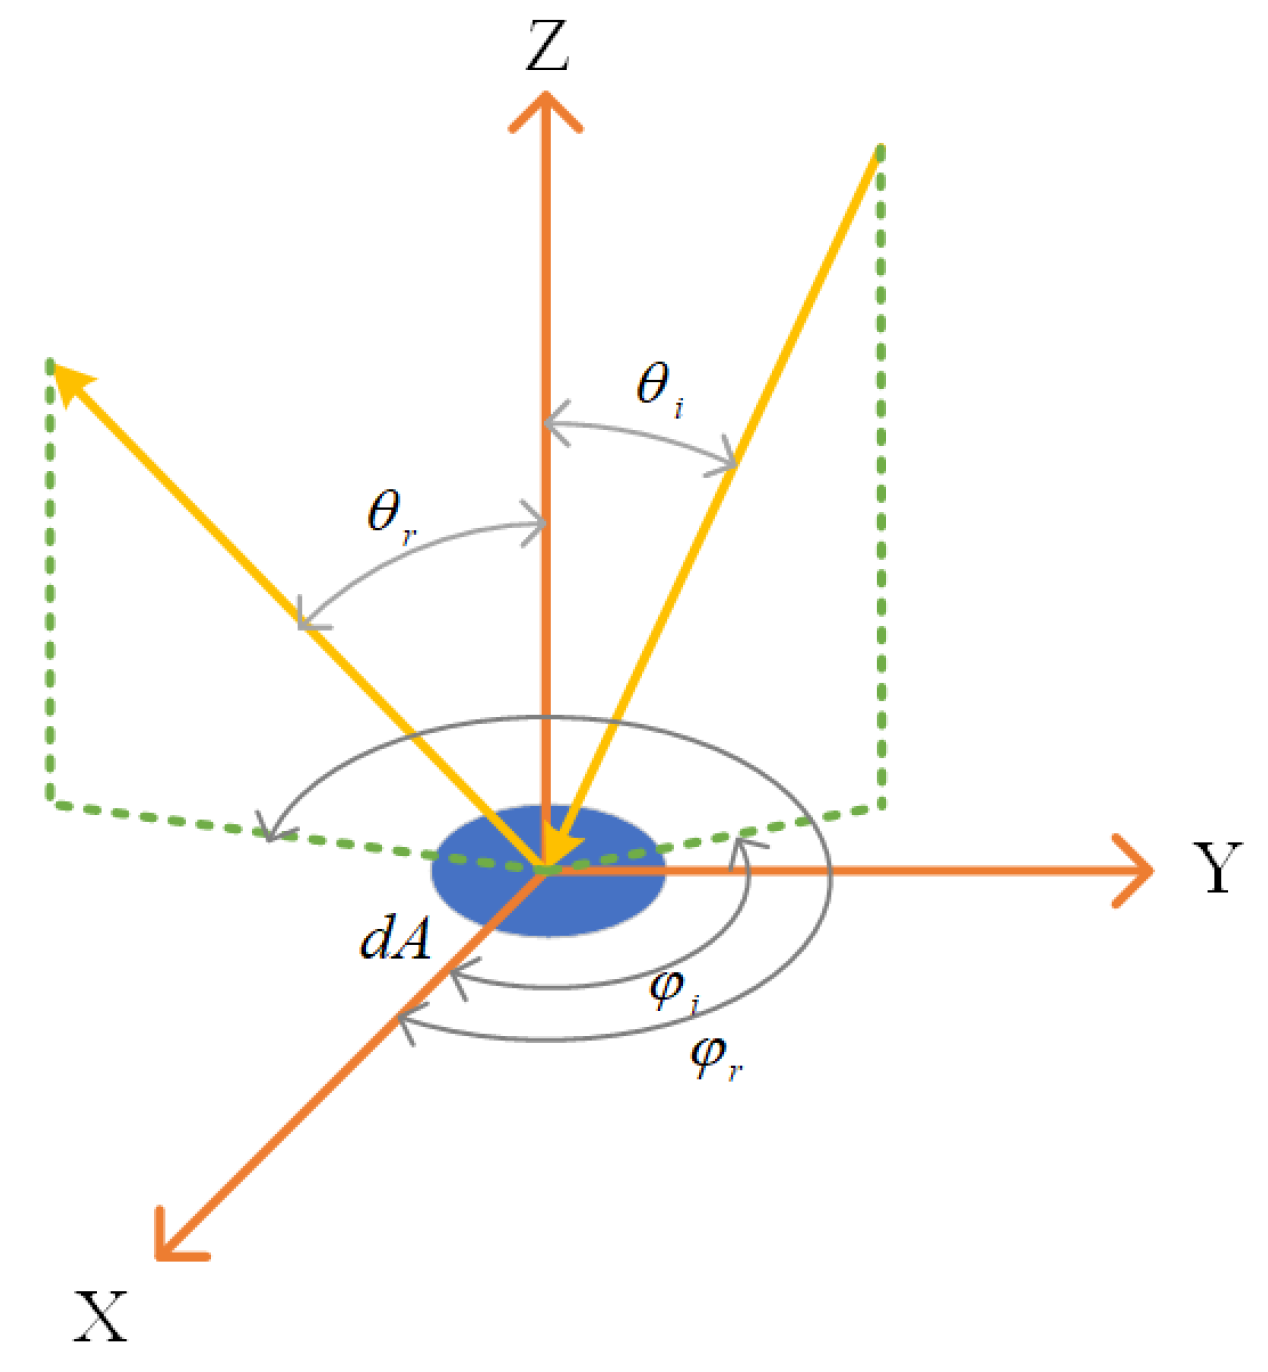
where represents the radiance reflected in a given direction by an infinitesimal element; represents the irradiance from the incident direction that falls on this infinitesimal surface element; represent the zenith angle and azimuth angle in the incident direction; represent the zenith angle and azimuth angle in the reflected direction; and stands for the wavelength. The geometric relationship of is shown in Figure 1.
According to the definition of radiance and irradiance,
where and represent the radiance and irradiance, respectively, when the direction of incidence is perpendicular to the sample, and represents the illumination solid angle.
Equation (2) can be substituted into Equation (1), integrating both sides at the same time:
These measurements can be made at narrow solid angles and on small surfaces; the output of the radiation source is uniform (in spatial direction). The SD for on-board calibration is a nearly perfect diffuser. Therefore, and can be considered constants. Then
where R represents the distance from the radiation source opening to the center of the sample, and A represents the area of the radiation source opening. Equation (4) shows that the required SD BRDF could be obtained by measuring the incident radiance, the illumination solid angle, and the reflected radiance.
The incident and reflected radiance are measured using the same detection system, and the final BRDF calculation requires only the ratio of the incident radiance to reflected radiance; therefore, it is not necessary to know the absolute value of the measured radiance. Thus, Equation (4) can be expressed as
where and represent the digital number (DN) of the detector for the reflected and incident radiance, respectively. To simplify the expression, DN was subtracted from the dark currents in this paper.
3. Description and Calibration of the Facility
An absolute BRDF measurement facility is shown in Figure 2. It consists of three parts: an irradiation system, a goniometer system, and a detection system. All devices are connected to the same industrial control computer. The required BRDF of a sample can be automatically measured by the control software.
3.1. Irradiation System
An integrating sphere was chosen as the radiation source to ensure that the brightness and uniformity requirements of the irradiation system were met. It also reduced the effect of polarization on the measurement results.
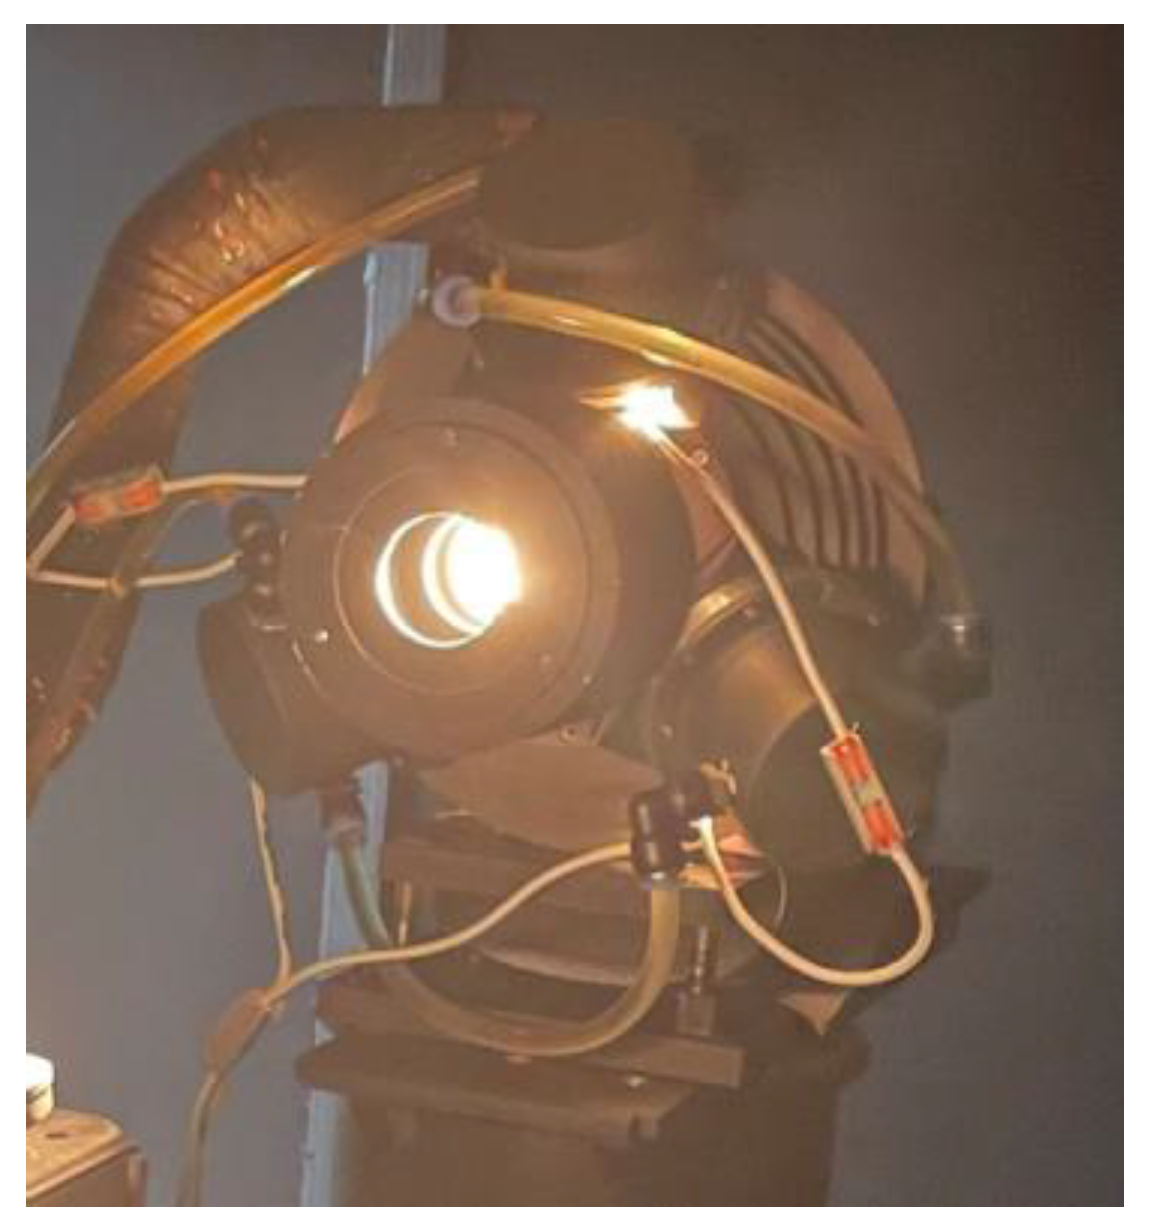
The inner coating of the sphere radiator is shown in Figure 3. It was made of pressed PTFE with a reflectivity above 99%. The inner diameter of the sphere was 150 mm, and three 400 W halogen lamps were built in. The sphere was equipped with hydrocooling and air-cooling systems. The power supply was set to 1000 W (approximately 80% of the rated power) when the sphere radiator operated. A stray light hood was added in front of the sphere radiator opening to reduce the influence of stray light during measurement.
To verify the homogeneity of the sphere radiator, a special homogeneity measurement facility was built. Imaging optics for radiation at a 1:1 reproduction scale were chosen and mounted on a two-dimensional xy-translation stage. The step interval was set to 2 mm, and the scanning area covered the whole opening of the sphere radiator. The results show that the nonuniformity of the opening was less than 0.5%.
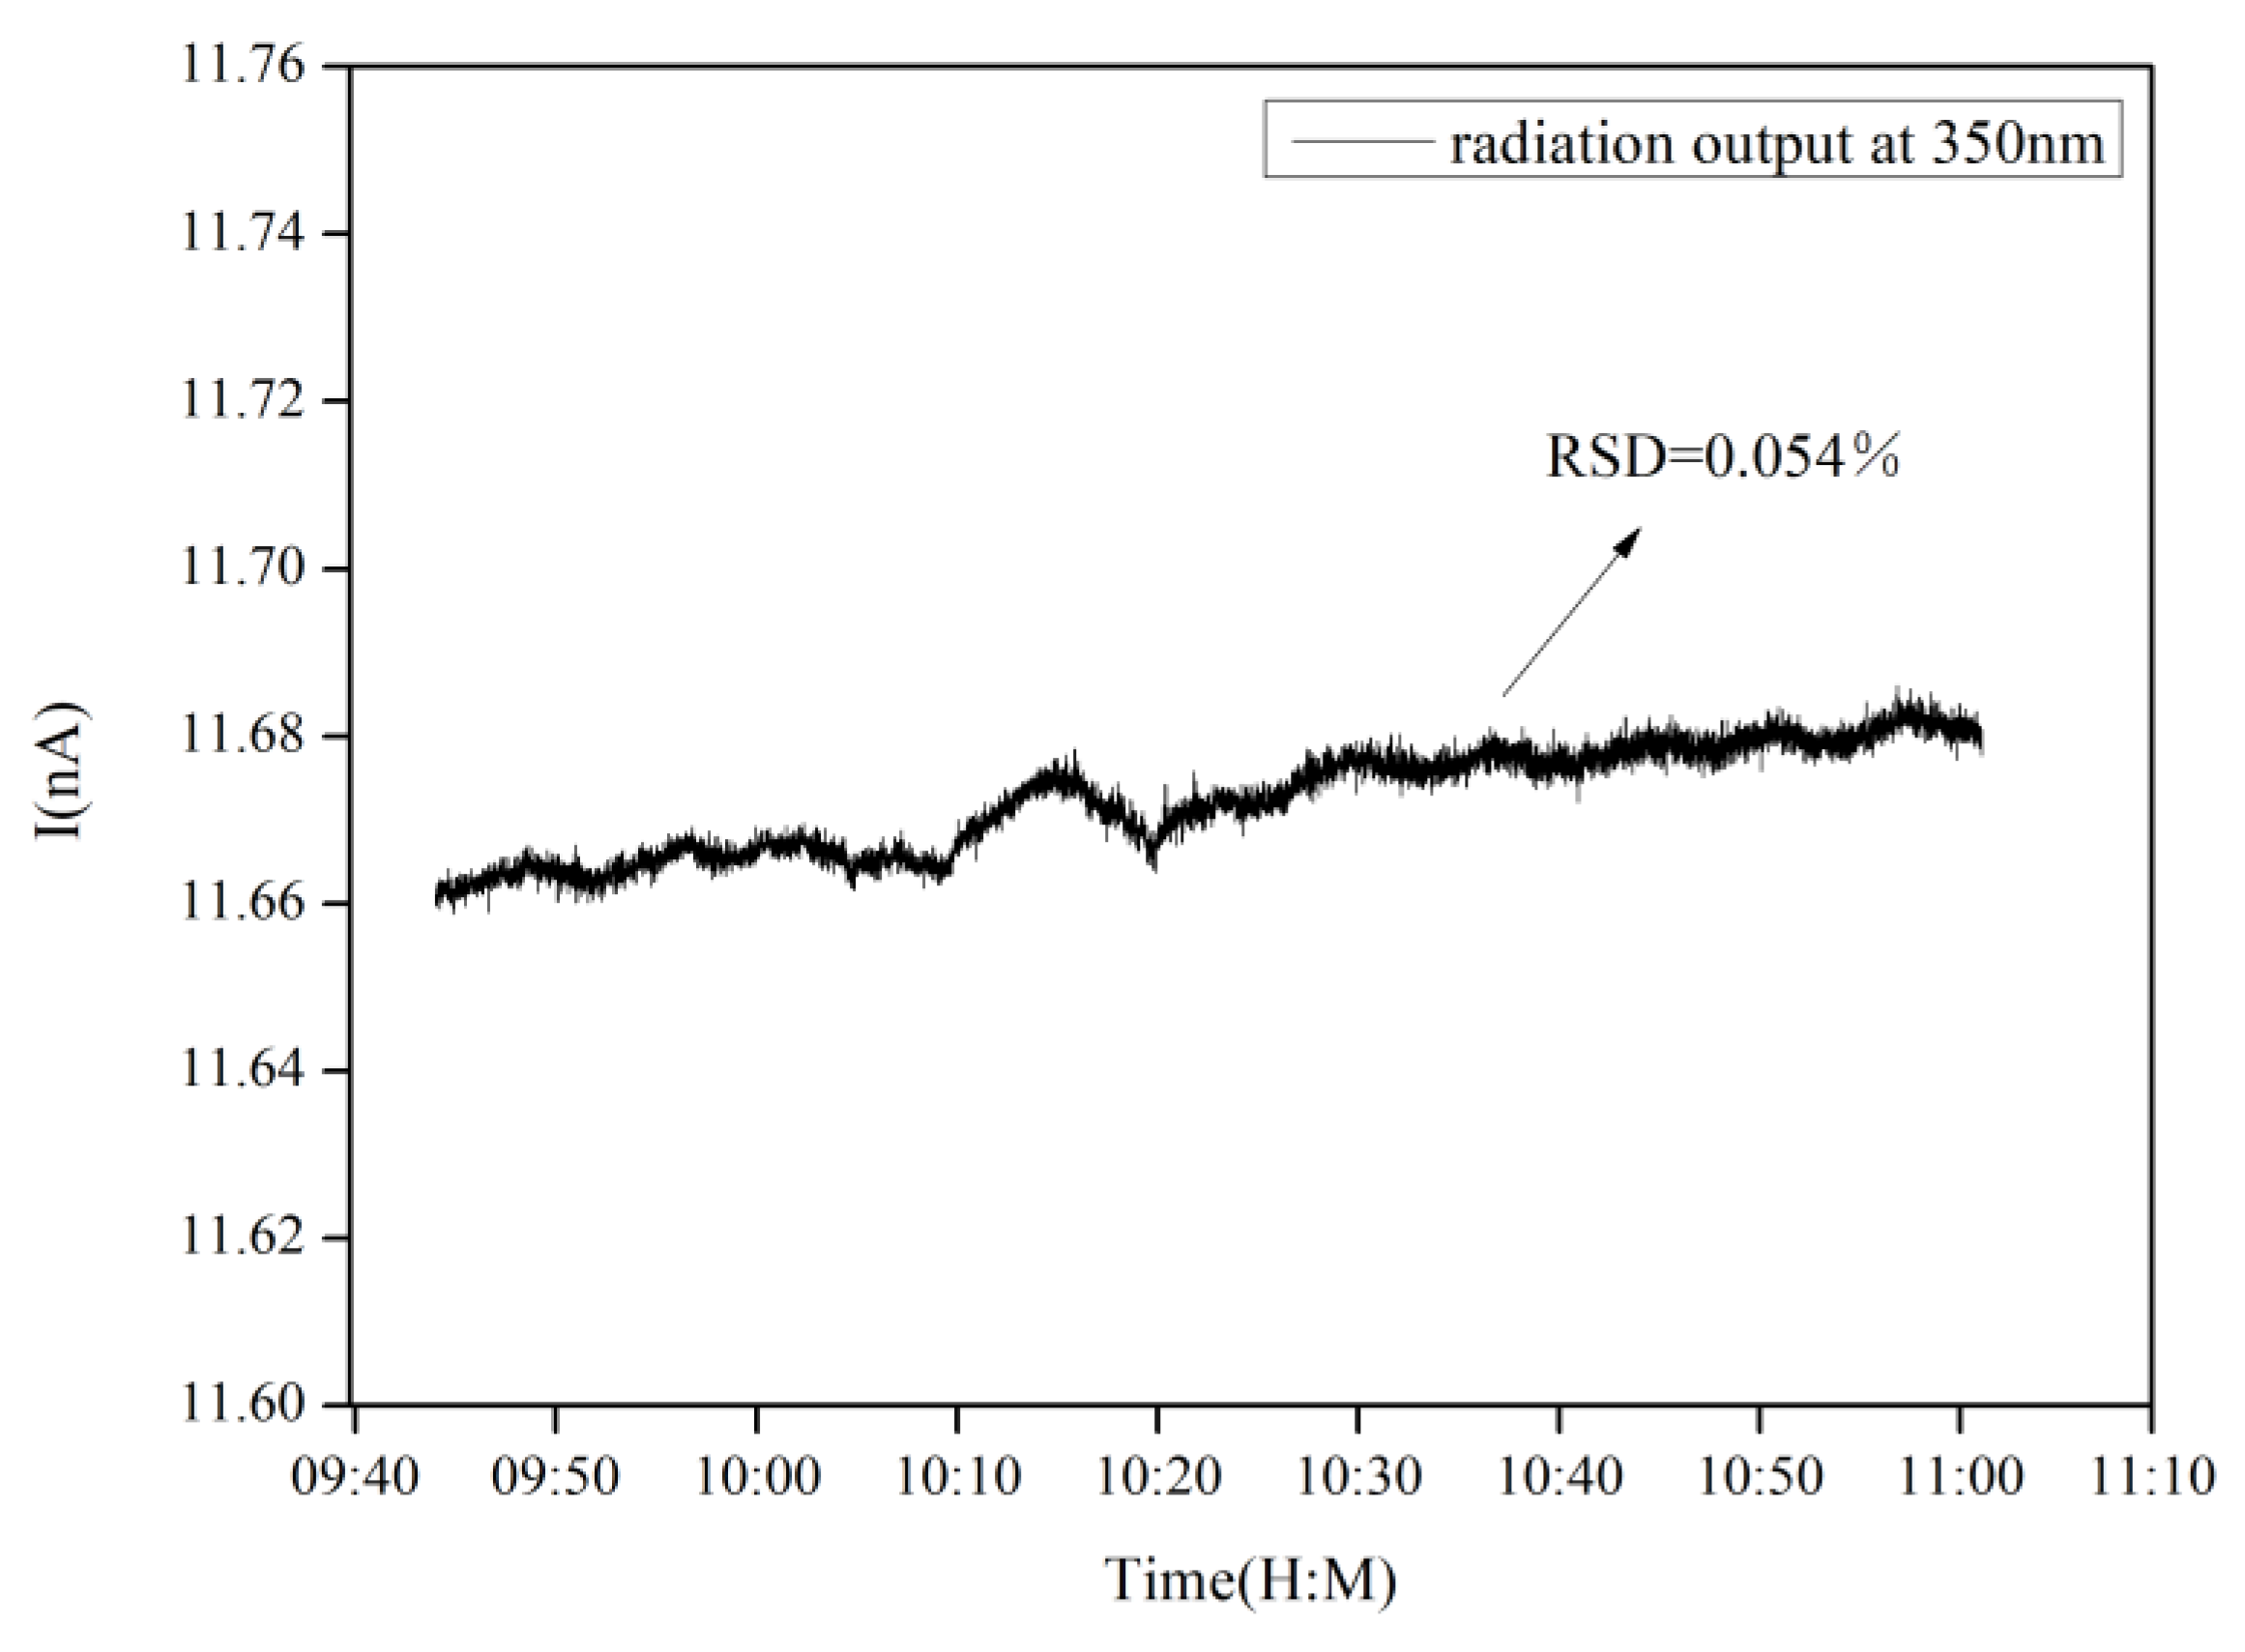
The stability of the sphere radiator could be detected by the facility’s detection system. The facility was adjusted to the position for measuring incident radiation. The output power of the high-precision current source was set to 1000 W, and the measurement wavelength was 350 nm. After 30 min of preheating, the measurement lasted 80 min with a sampling interval of 20 ms. The results are shown in Figure 4. Stability was expressed as relative standard deviation, and the instability of the light source was less than 0.06% (80 min).
3.2. Goniometer System
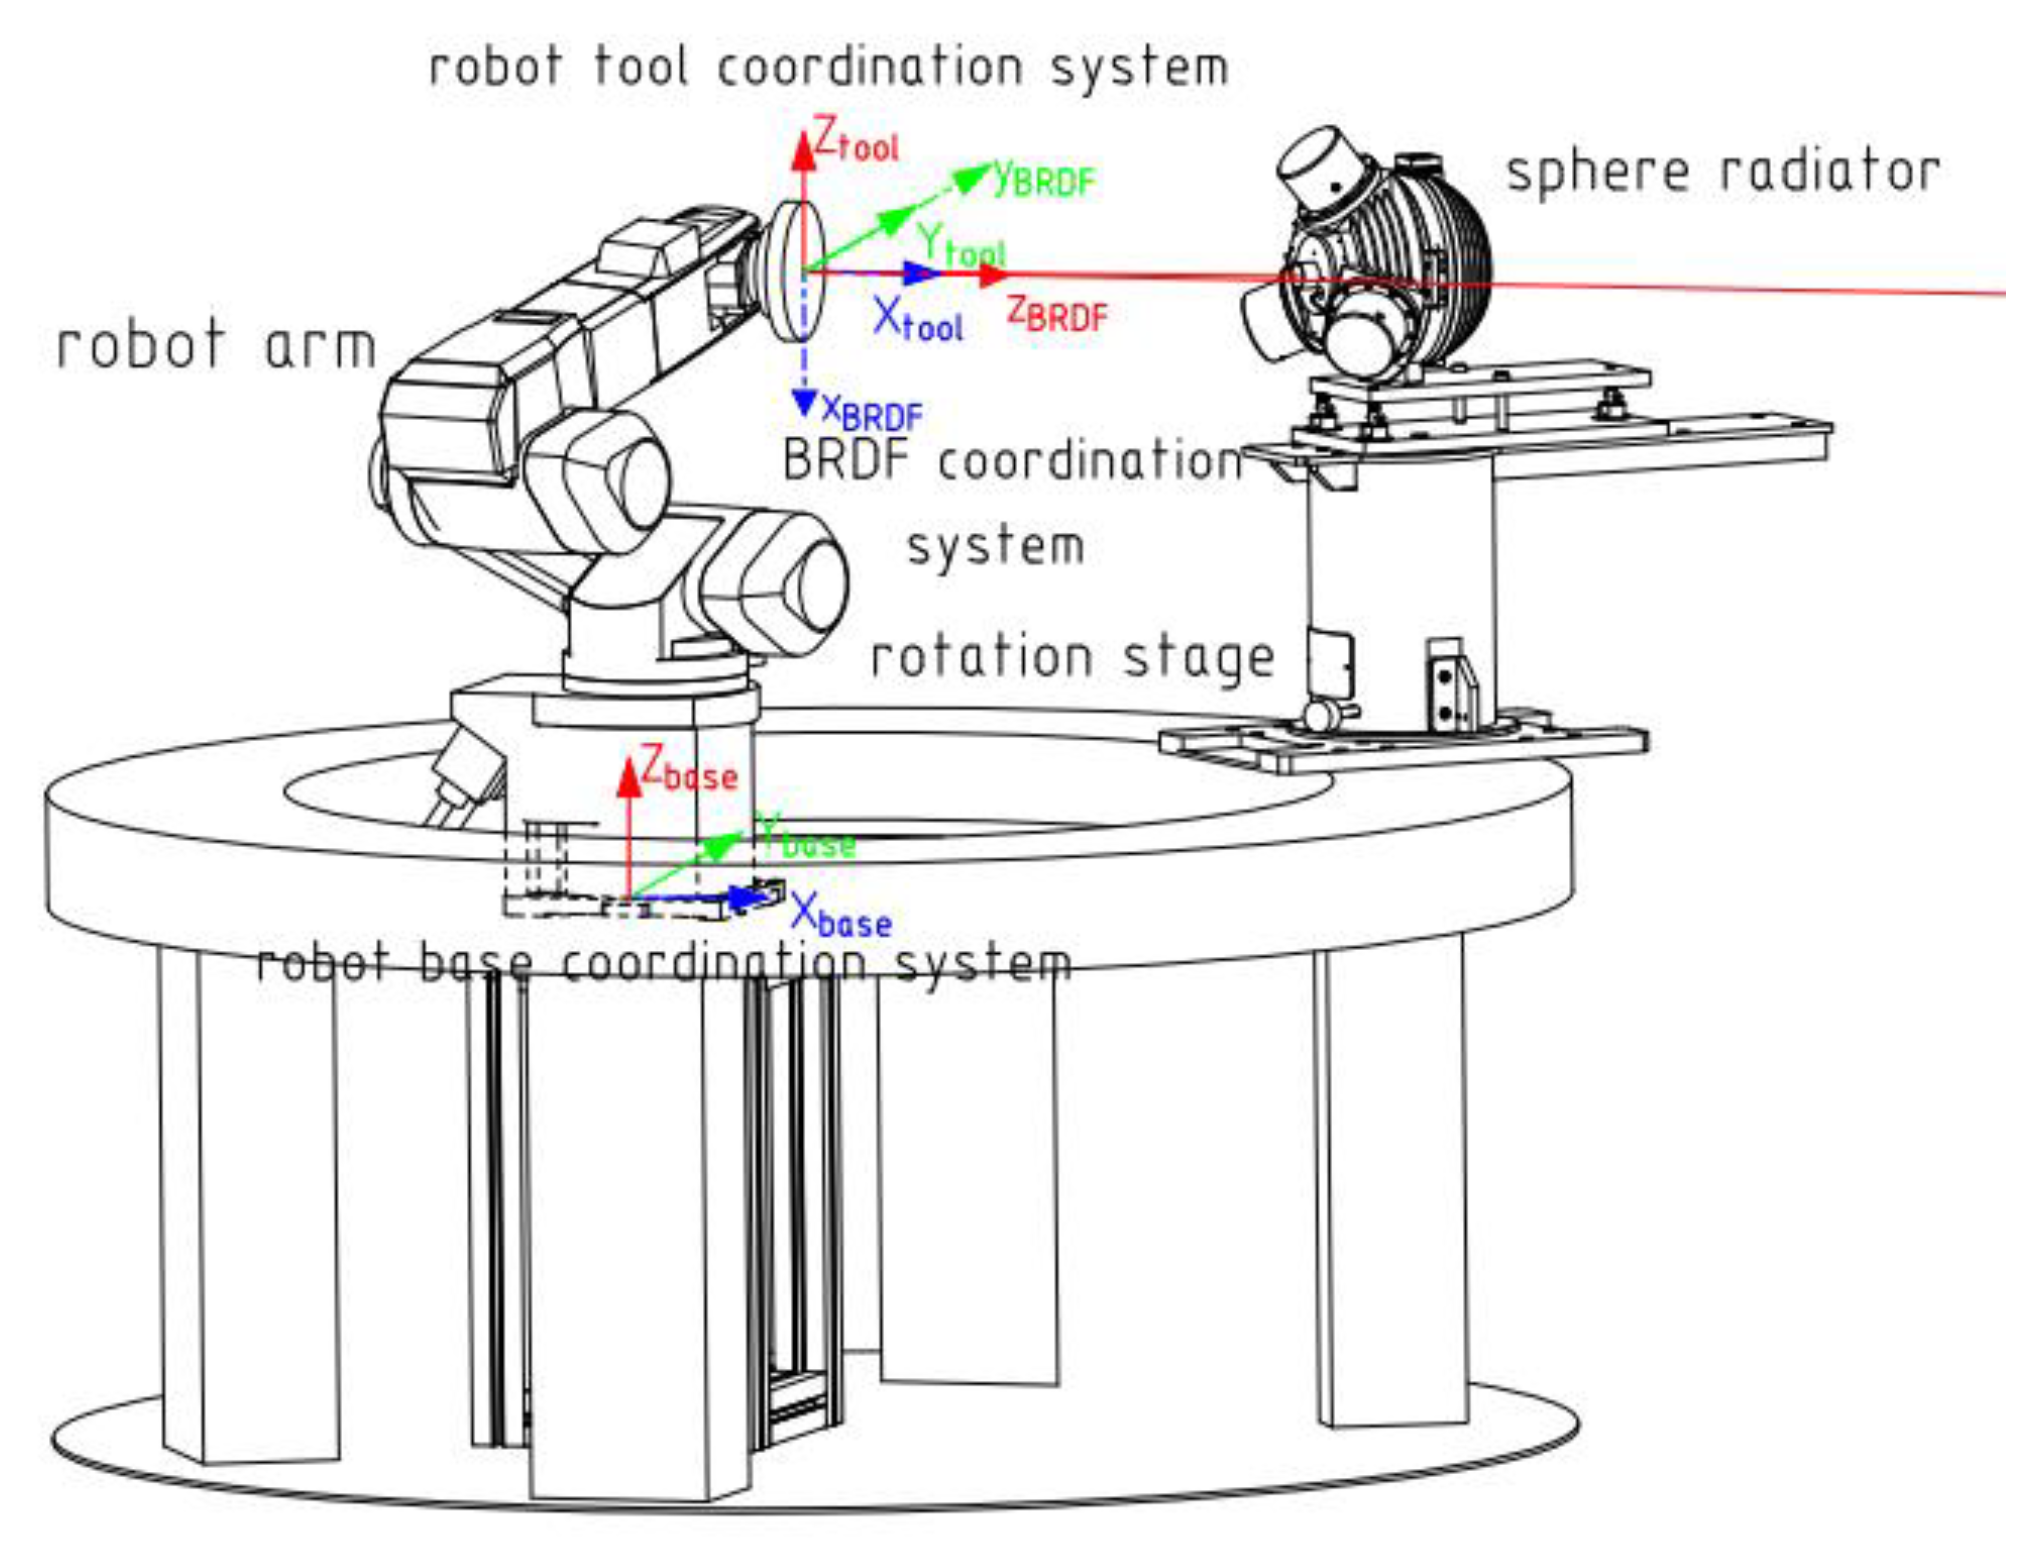
A six-axis robot arm and a large rotation stage from the goniometer system of the facility are shown in Figure 5. The robot arm held the sample for three-dimensional rotation, and the rotation stage loaded the irradiation system for one-dimensional rotation. The detection system was fixed to ensure high-accuracy radiation measurement.
The angle ranges for BRDF measurement at the facility are shown in Table 1.
Two coordinate systems were defined on the surface of the SD: the robot tool coordinate system XYZ and the BRDF coordinate system xyz. They both shared a common coordinate origin, which was located at the center of the sample. This point was also the intersection point of the rotation axis during the rotation stage and the centerline of the opening of the sphere radiator. The relative positions of the two coordinate systems are shown in Figure 5.
The angle of rotation of the robot arm around the XYZ axis of the robot tool coordinate system could be defined as , and the rotation angle of the rotation stage was . According to the different expression relationships between the incident vector, the reflected vector and the sample normal in the two coordinate systems, the relationship between and could be established as follows:
For a given BRDF angle (), the rotational angle of the robot arm and rotation stage () could be calculated using Equations (6)–(9). The goniometer system was rotated based on the calculated to achieve the geometric relationships required for the measurement.
3.3. Detection System
An SD can reflect the incident radiation into the hemisphere so that only a small portion of the incident radiation is collected during measurement. The detection solid angle of the facility was very small, approximately 0.003 sr, and depending on the different incident angles of the radiation source, there were approximately four orders of magnitude of difference between the incident radiation and the reflected radiation. For different measurement wavelengths, the difference could even exceed four orders of magnitude. In this large dynamic range, non-linearity in the detection system needed to be determined and corrected.
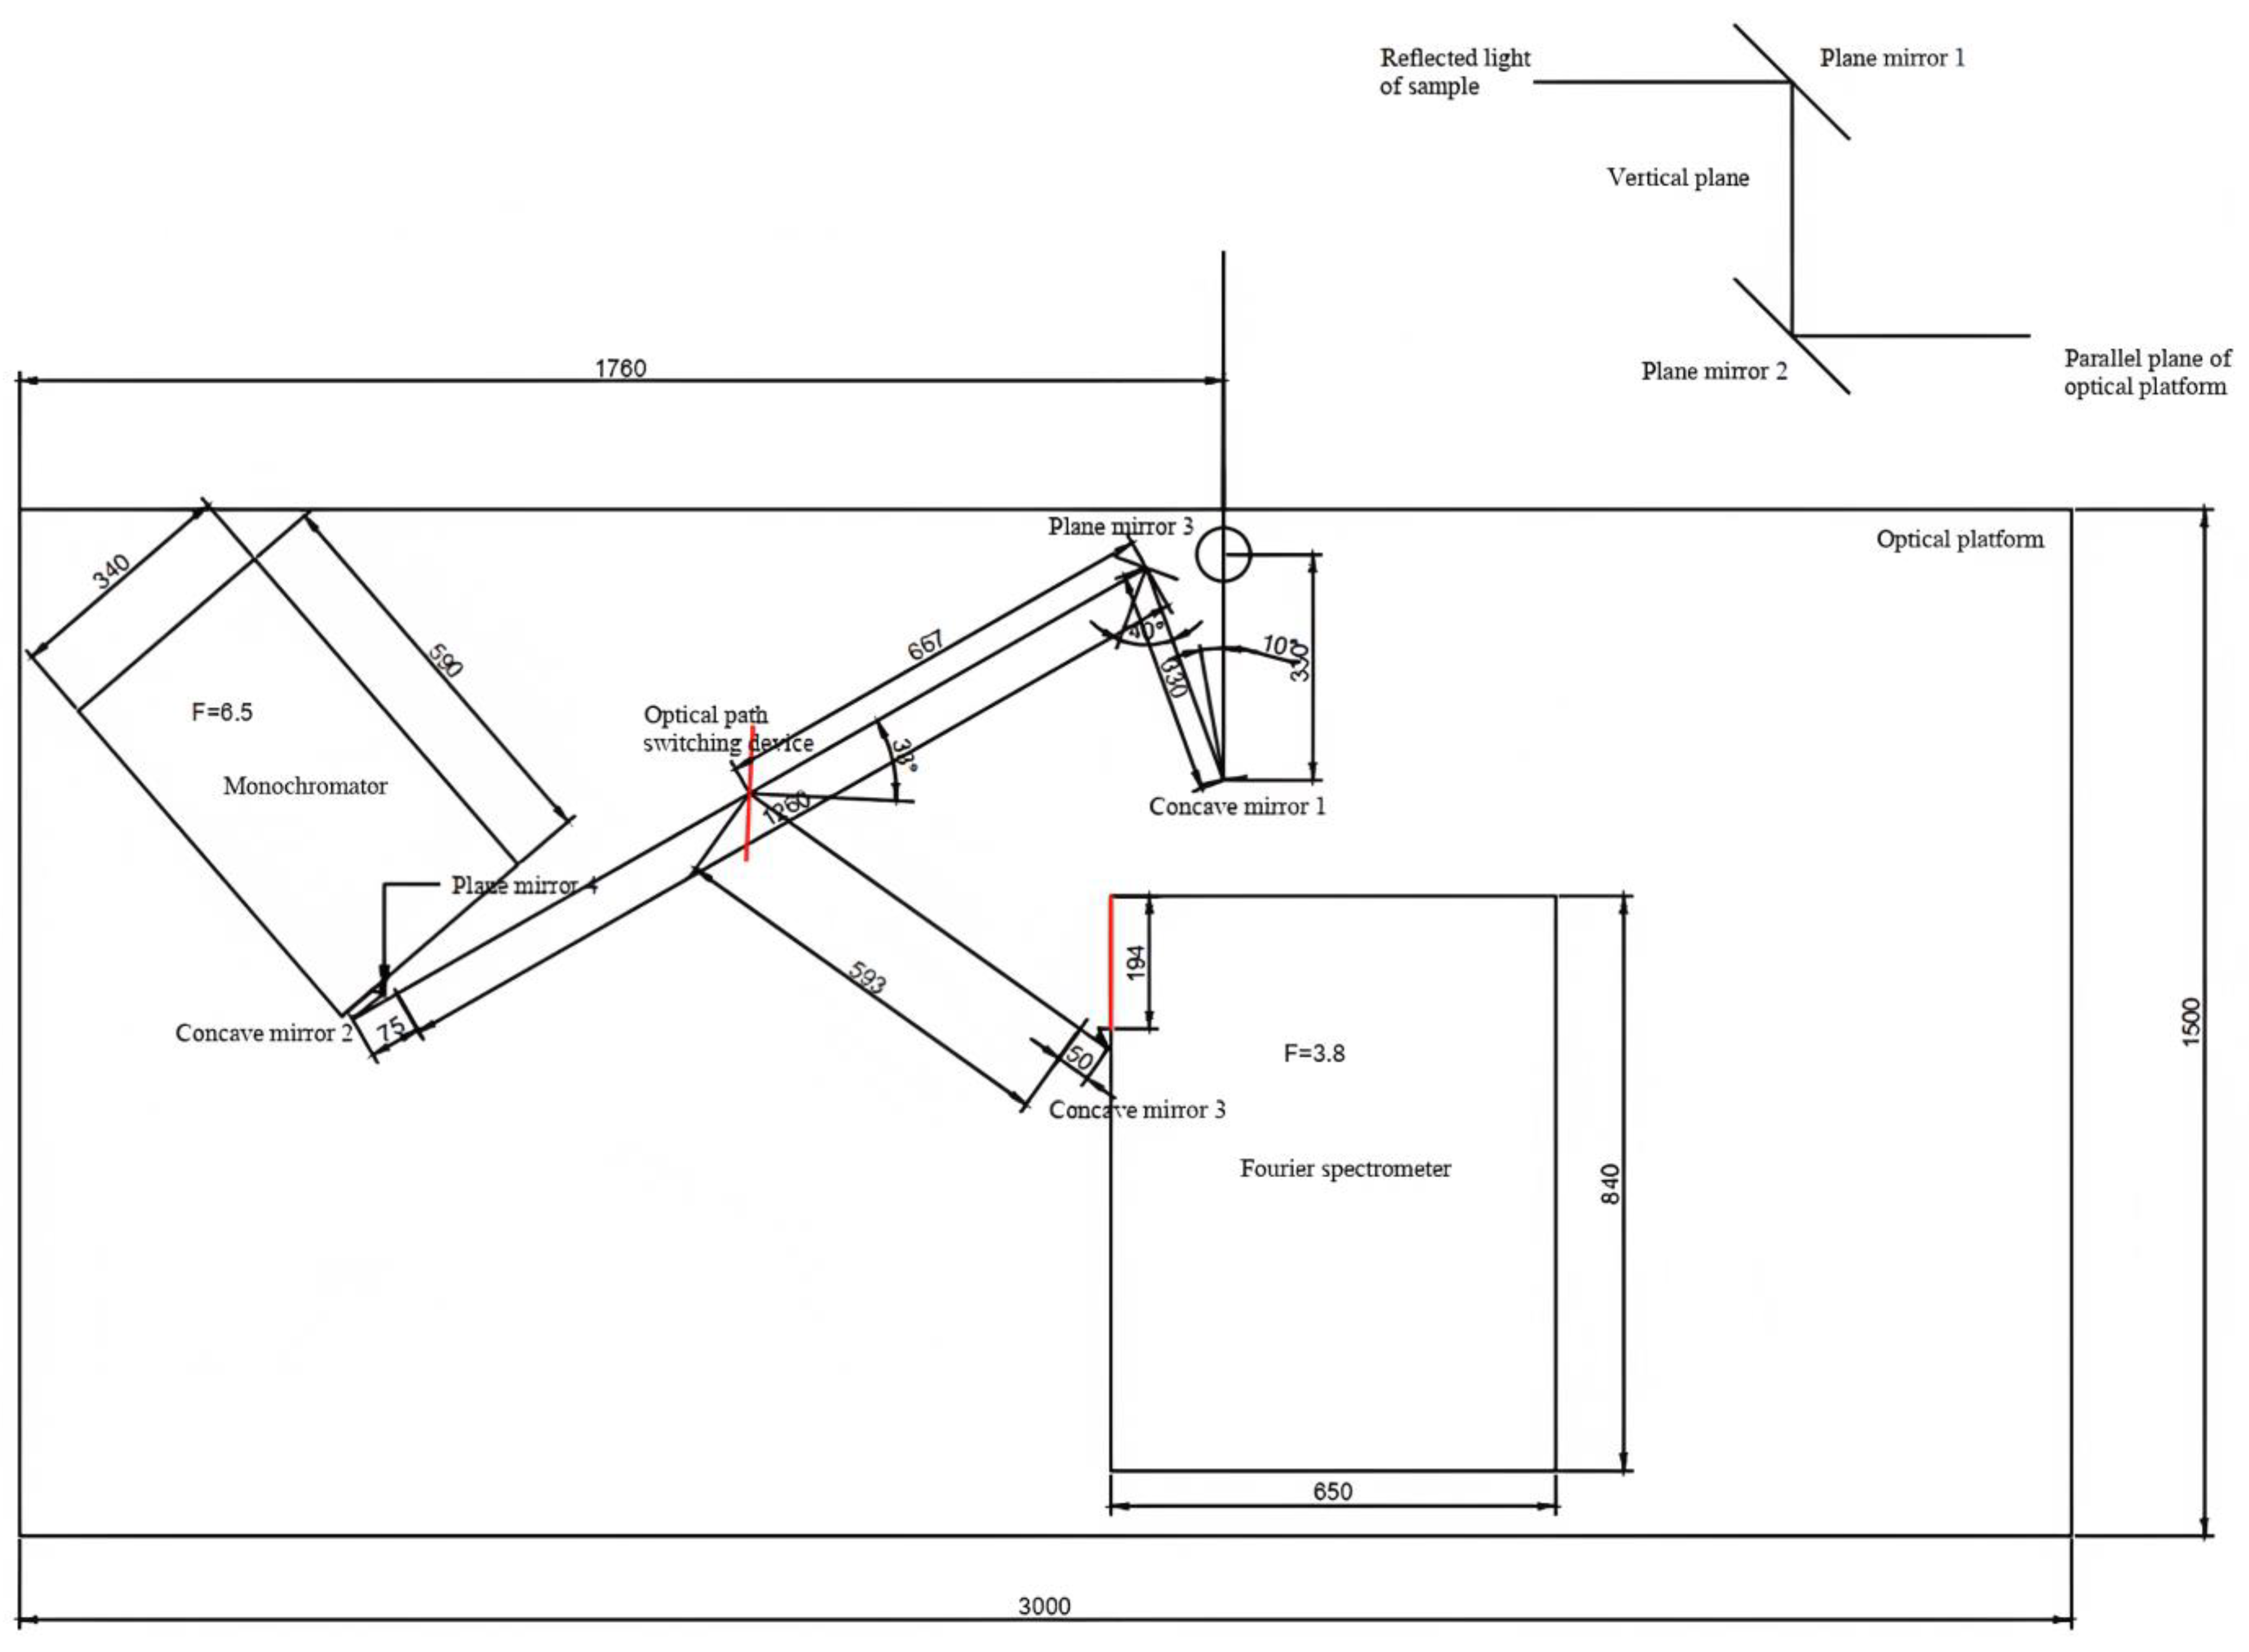
The detection system had two configurations. One was a combination of a monochromator, detectors, and a picoamperemeter. The other was a Fourier transform infrared (FTIR) spectrometer. These two detection devices shared the same front optical path systems. Depending on the wavelength required, a combination of a plane reflector and an electric translation platform was used to switch the optical path.
The front optical path is shown in Figure 6. It was composed of five plane mirrors, three concave mirrors and one electric translation platform. The radiation reflected from the sample was parallel to the optical platform plane after being reflected by plane mirror 1 and plane mirror 2 and then converging on concave mirror 1. It was then reflected by plane mirror 3 to the optical path-switching device, which was composed of an electric translation platform and a plane mirror. After passing through the optical path-switching device, the concave mirror converged the light to the optical inlet of the monochromator or FTIR spectrometer.
The electric translation platform controlled the back-and-forth movement of the plane mirror. From Figure 2, when the plane mirror was in the red dashed box position on the optical path-switching device, it reflected the radiation to the optical inlet of the FTIR spectrometer. Additionally, when it was completely removed (in the yellow dashed box position), the radiation entered the optical inlet of the monochromator.
The performance of the detection devices in these two configurations was as follows:
- Monochromator, detector and picoamperemeter:The monochromator had a spectral resolution of approximately 3 nm at 350 nm to 600 nm and 6 nm at 600 nm to 1700 nm. Depending on the different measurement wavelengths, two types of detectors were equipped: Si (350 nm to 1000 nm) and InGaAs (1000 nm to 1700 nm, two-stage TE cooled, −40 °C) detectors. All photoelectric signals were detected by the picoamperemeter, and the measurement results were transmitted to a computer for data storage and calculation.
- FTIR spectrometer:The FTIR spectrometer was a VERTEX80 [25] from the BRUKER company. In the measurement facility, the InGaAs detector was selected as the detector for the VERTEX80. The measurement spectral range was set at 11,764 cm−1 (850 nm) to 4148 cm−1 (2410 nm), and the spectral resolution was set at 64 cm−1 (4.6 nm to 36.6 nm). This resolution was selected because of the spectral characteristics of the SD’s reflectivity (spectral flatness) and the improvement in the signal-to-noise (SNR) ratio when measuring the reflected radiation. In the process of inverse Fourier transform, the Blackman Harris 4-Term was used as the apodization function; the zero filling factor was 2; the power spectrum mode was selected for phase correction; and the absolute largest value was selected for the peak position retrieval mode.
When measuring the reflected radiation, the circuit amplification coefficient used by the FTIR spectrometer was different from that used for the incident radiation to ensure a sufficiently high SNR. The calculation method for scaling factor was as follows:
where and represent the DN of the FTIR spectrometer for the reflected radiation at 0°/45° and incident radiation, respectively, and and represent the DN of the InGaAs detector for reflected radiation at 0°/45° and incident radiation, respectively.
The DN ratio of the incident radiation and reflected radiation from the InGaAs detector at 0°/45° was compared with the DN ratio from the FTIR spectrometer under the same conditions. Data at the 1200 nm and 1300 nm bands were selected for calculation. The average scaling factor was 99.10.
3.4. System Calibration
3.4.1. Geometric Calibration
The geometric calibration of the facility was divided into two main aspects: determining the initial position (the rotation center of the robot arm and the origin of the rotation stage) of the BRDF measurement and verifying the uncertainty of the rotation angle.
The rotation center of the robot arm was located at the intersection point of the rotation axis of the rotation stage and the normal to the center of the sphere radiator opening. Before measuring, the initial position of the sample needed to be determined.
With the laser beam emitted from the sphere radiator opening as the indicator and the robot arm as the measuring tool (the measuring principle is shown in Figure 7a), the space linear equation of the rotation stage was obtained by measuring the beam emitted from the sphere radiator opening at different angles (the measuring schematic is shown in Figure 7b), and the transformation relationship between the robot’s base coordinate system and the laboratory coordinate system was preliminarily established. Then, the laser beam was adjusted perpendicular to the rotation axis of the rotation stage, and the position of the laboratory coordinate origin and the changing relationship between the two coordinate systems were determined according to the position of the incident laser beam on the Y-axis of the tool coordinate system and the axis equation. A calibration model of the instrument was established. The position and attitude of the rotation center in space were calculated, and the initial position of the sample was determined. This calibration method is described in great detail in the literature [26].
The origin of the rotation stage (red points marked in Figure 8) was corrected using a coordination measurement with the overall system. The radiation source was placed at the origin before correction, and the sample held by the robot arm was placed at the initial position determined and described in the previous paragraph. The radiation source was rotated counterclockwise by 30° to a starting point. Then, the reflected radiation was collected at 5° intervals. The measuring schematic is shown in Figure 8a. After acquisition was complete, the radiation source was returned to the origin, and the sample was rotated 180° around the z-axis by the robot arm. The radiation source was rotated clockwise 30° to the starting point. Then, the reflected radiation was collected again at 5° intervals. The measuring schematic is shown in Figure 8b. A schematic diagram of the whole correction operation follows:
If the angle of counterclockwise rotation was , the angle of clockwise rotation was , and the origin angle before correction was , then,
The correction value at the origin of the rotation stage could be calculated using Equation (11). After correction, the reflected radiation is shown in Figure 9. The relative deviation of and was less than 0.2%.
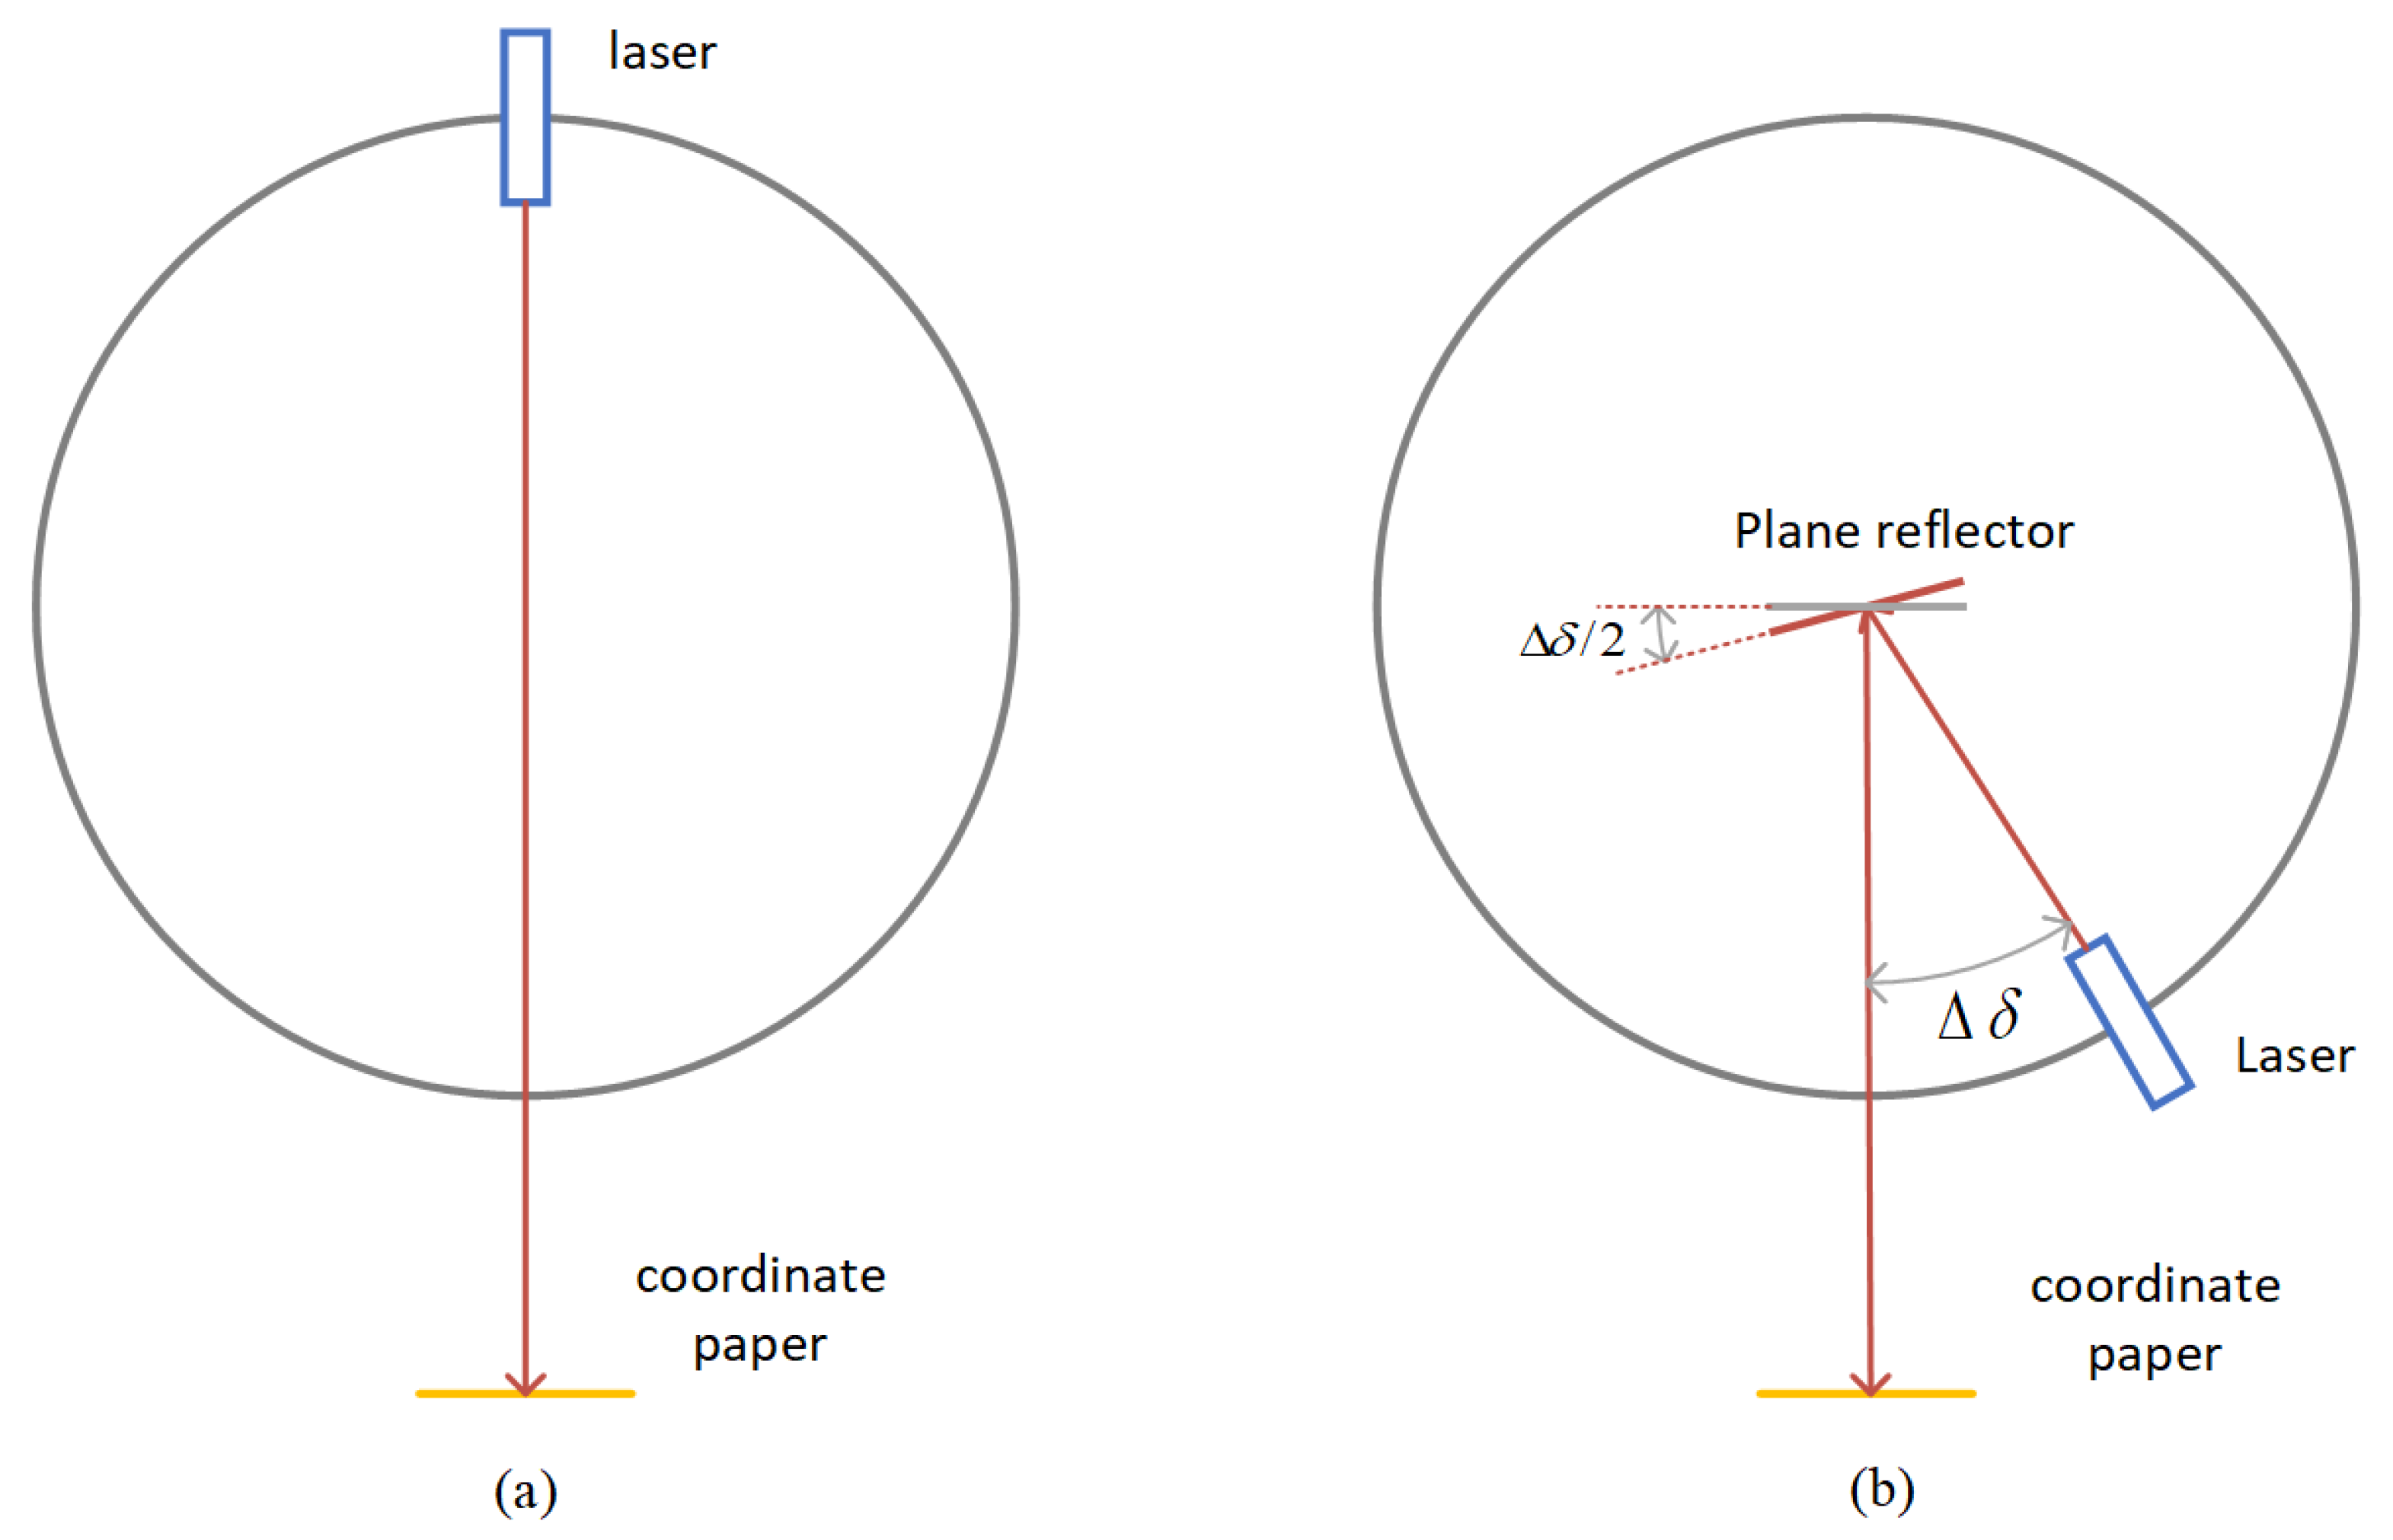
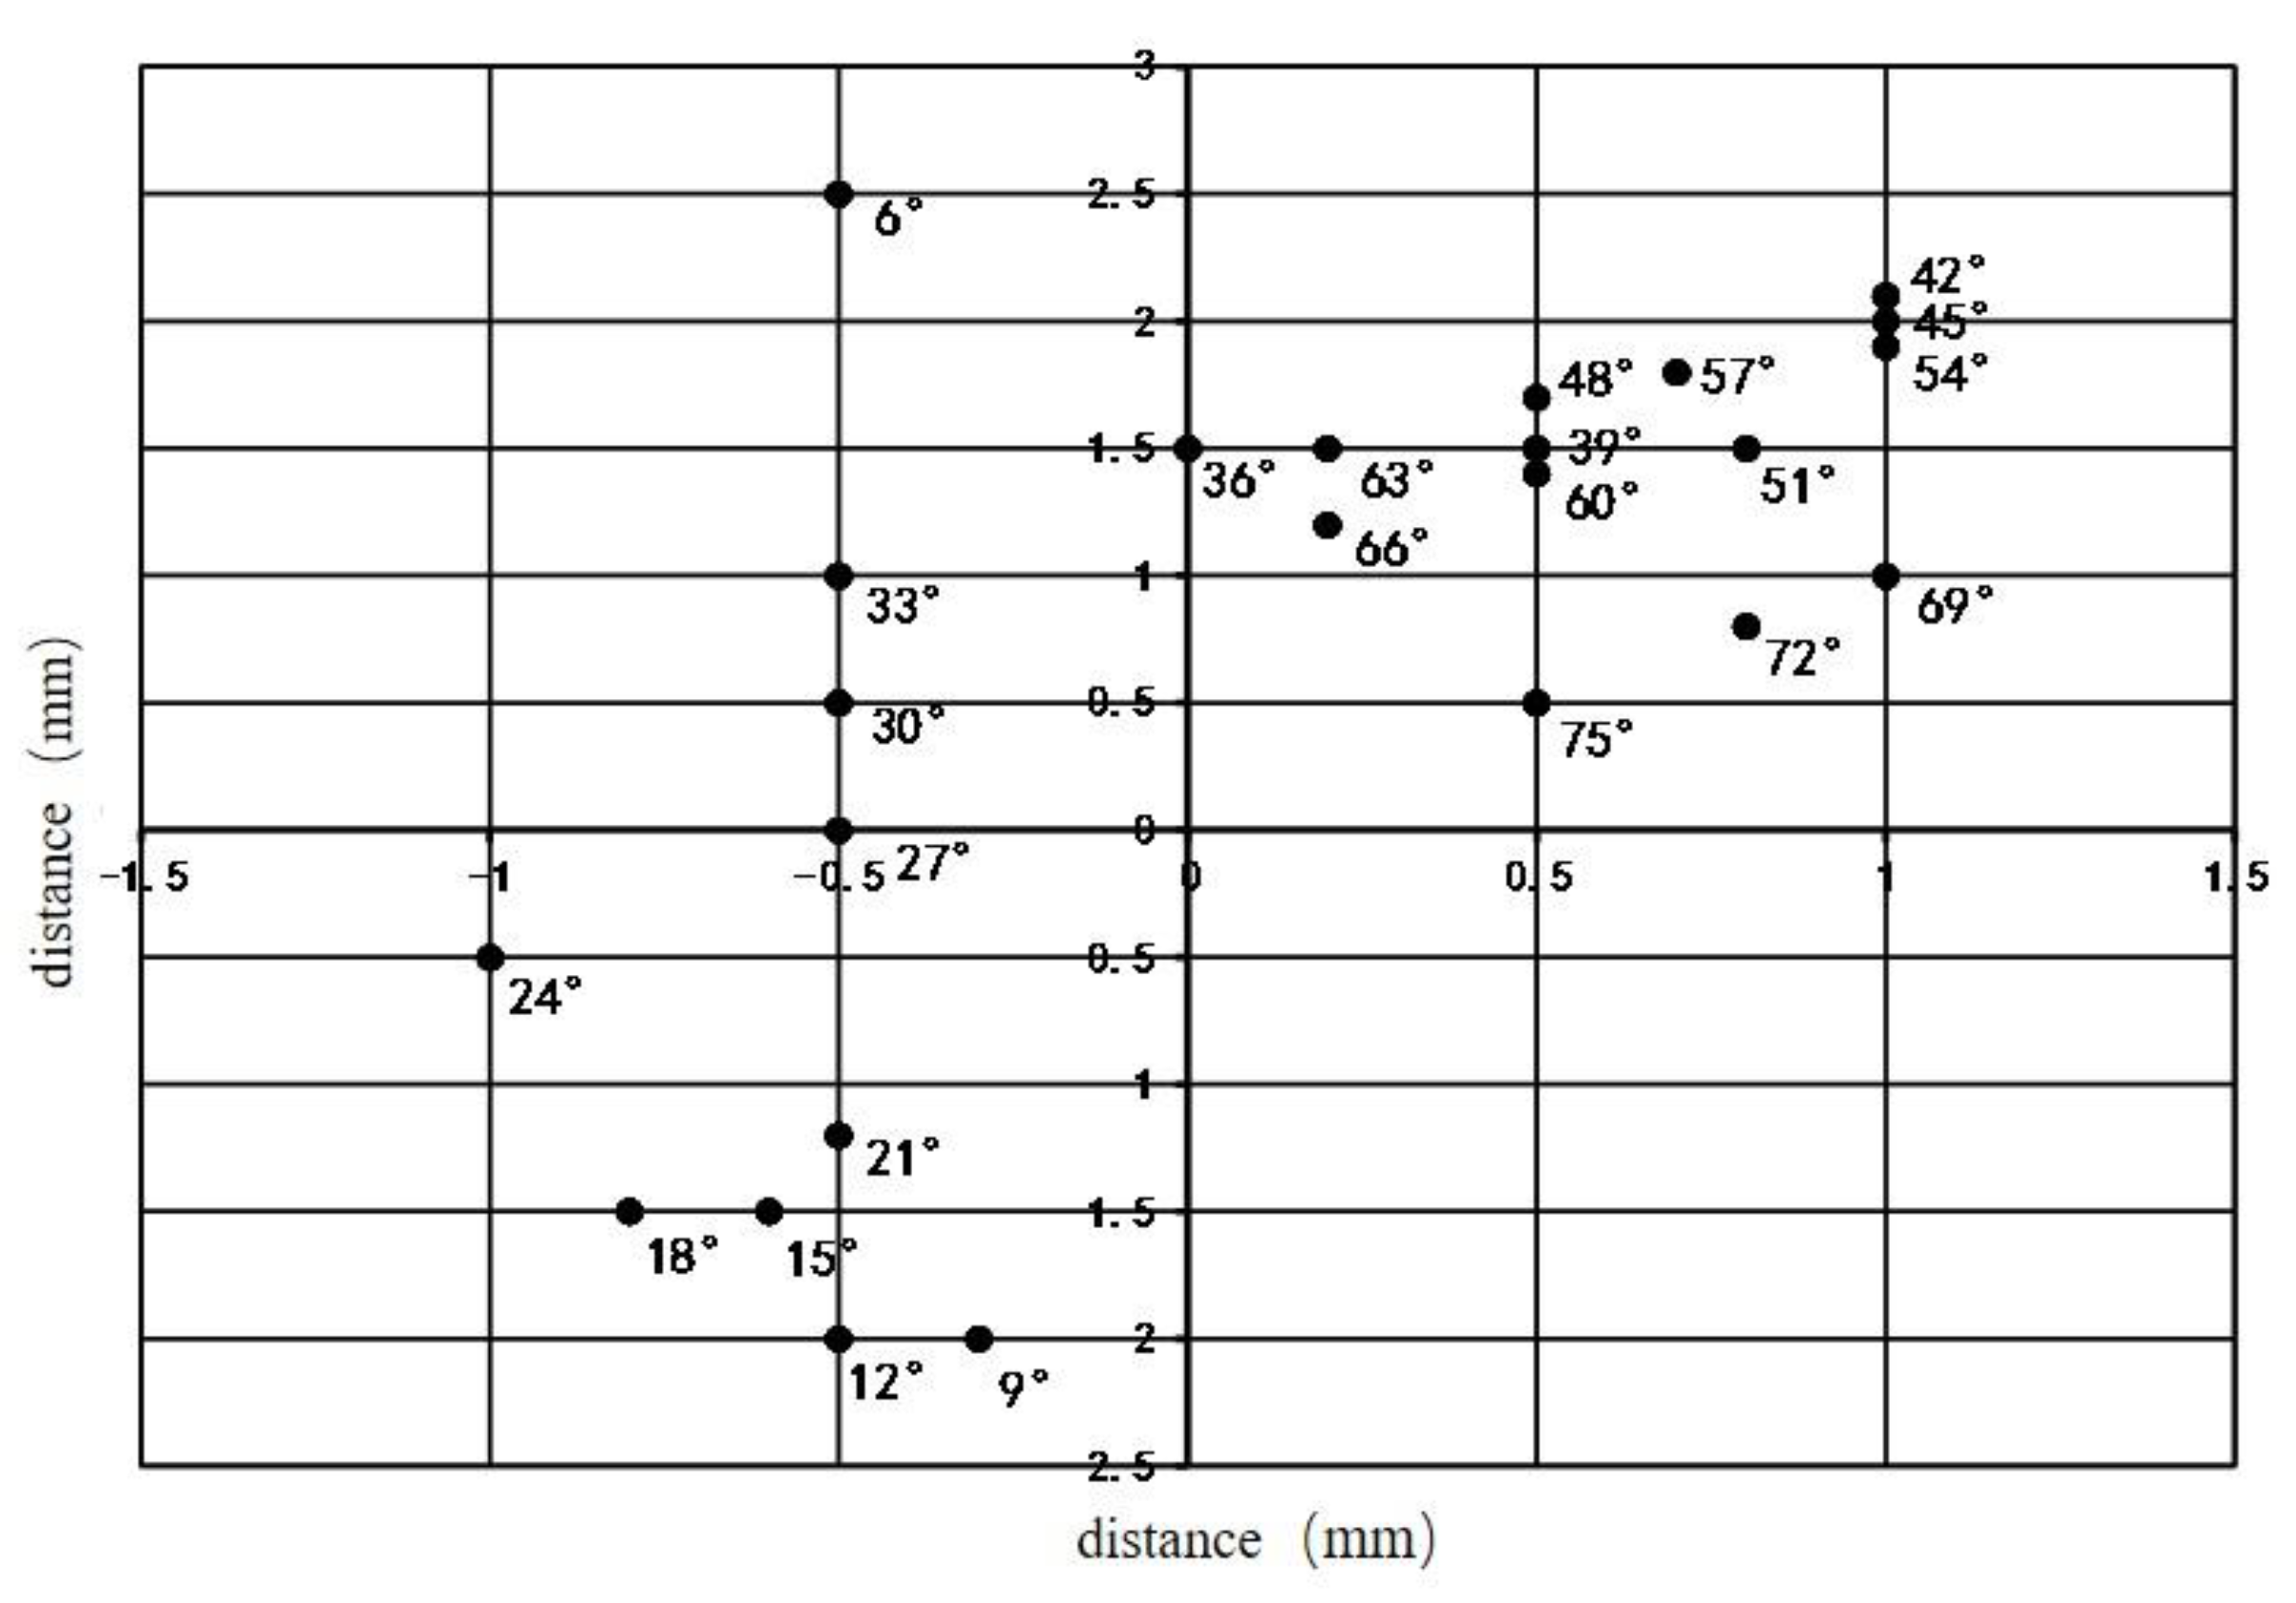
A detection method based on the principle of specular reflection was used to verify the angular uncertainty of the goniometer system. The origin of the coordinate paper was placed at the center spot of the incident light beam after rotating the radiation source 180° counterclockwise. Assuming that the counterclockwise rotation angle of the radiation source was , the robot was adjusted so that the reflector rotated about the Y-axis, and the position of the center spot of the reflected light beam was recorded at this time. The experimental diagram is shown in Figure 10.
The range of was set to 6°–75°, and measurements were taken every 3°. The distance between the coordinate paper and the rotation center was 1900 mm. The experimental results are shown in Figure 11, and the incident angle when measuring the spot is marked beside each point.
The angle error could be expressed as
where represent the horizontal and vertical coordinates, respectively, of the reflected light spot on the coordinate paper at the current angle; represents the distance between the coordinate paper and the rotation center. Calculating the results based on Figure 11 and using Equation (12), the maximum deviation angle was 0.0769°; this means that the angular accuracy of the goniometer system was less than 0.1°.
3.4.2. Nonlinear Calibration of the Detection System
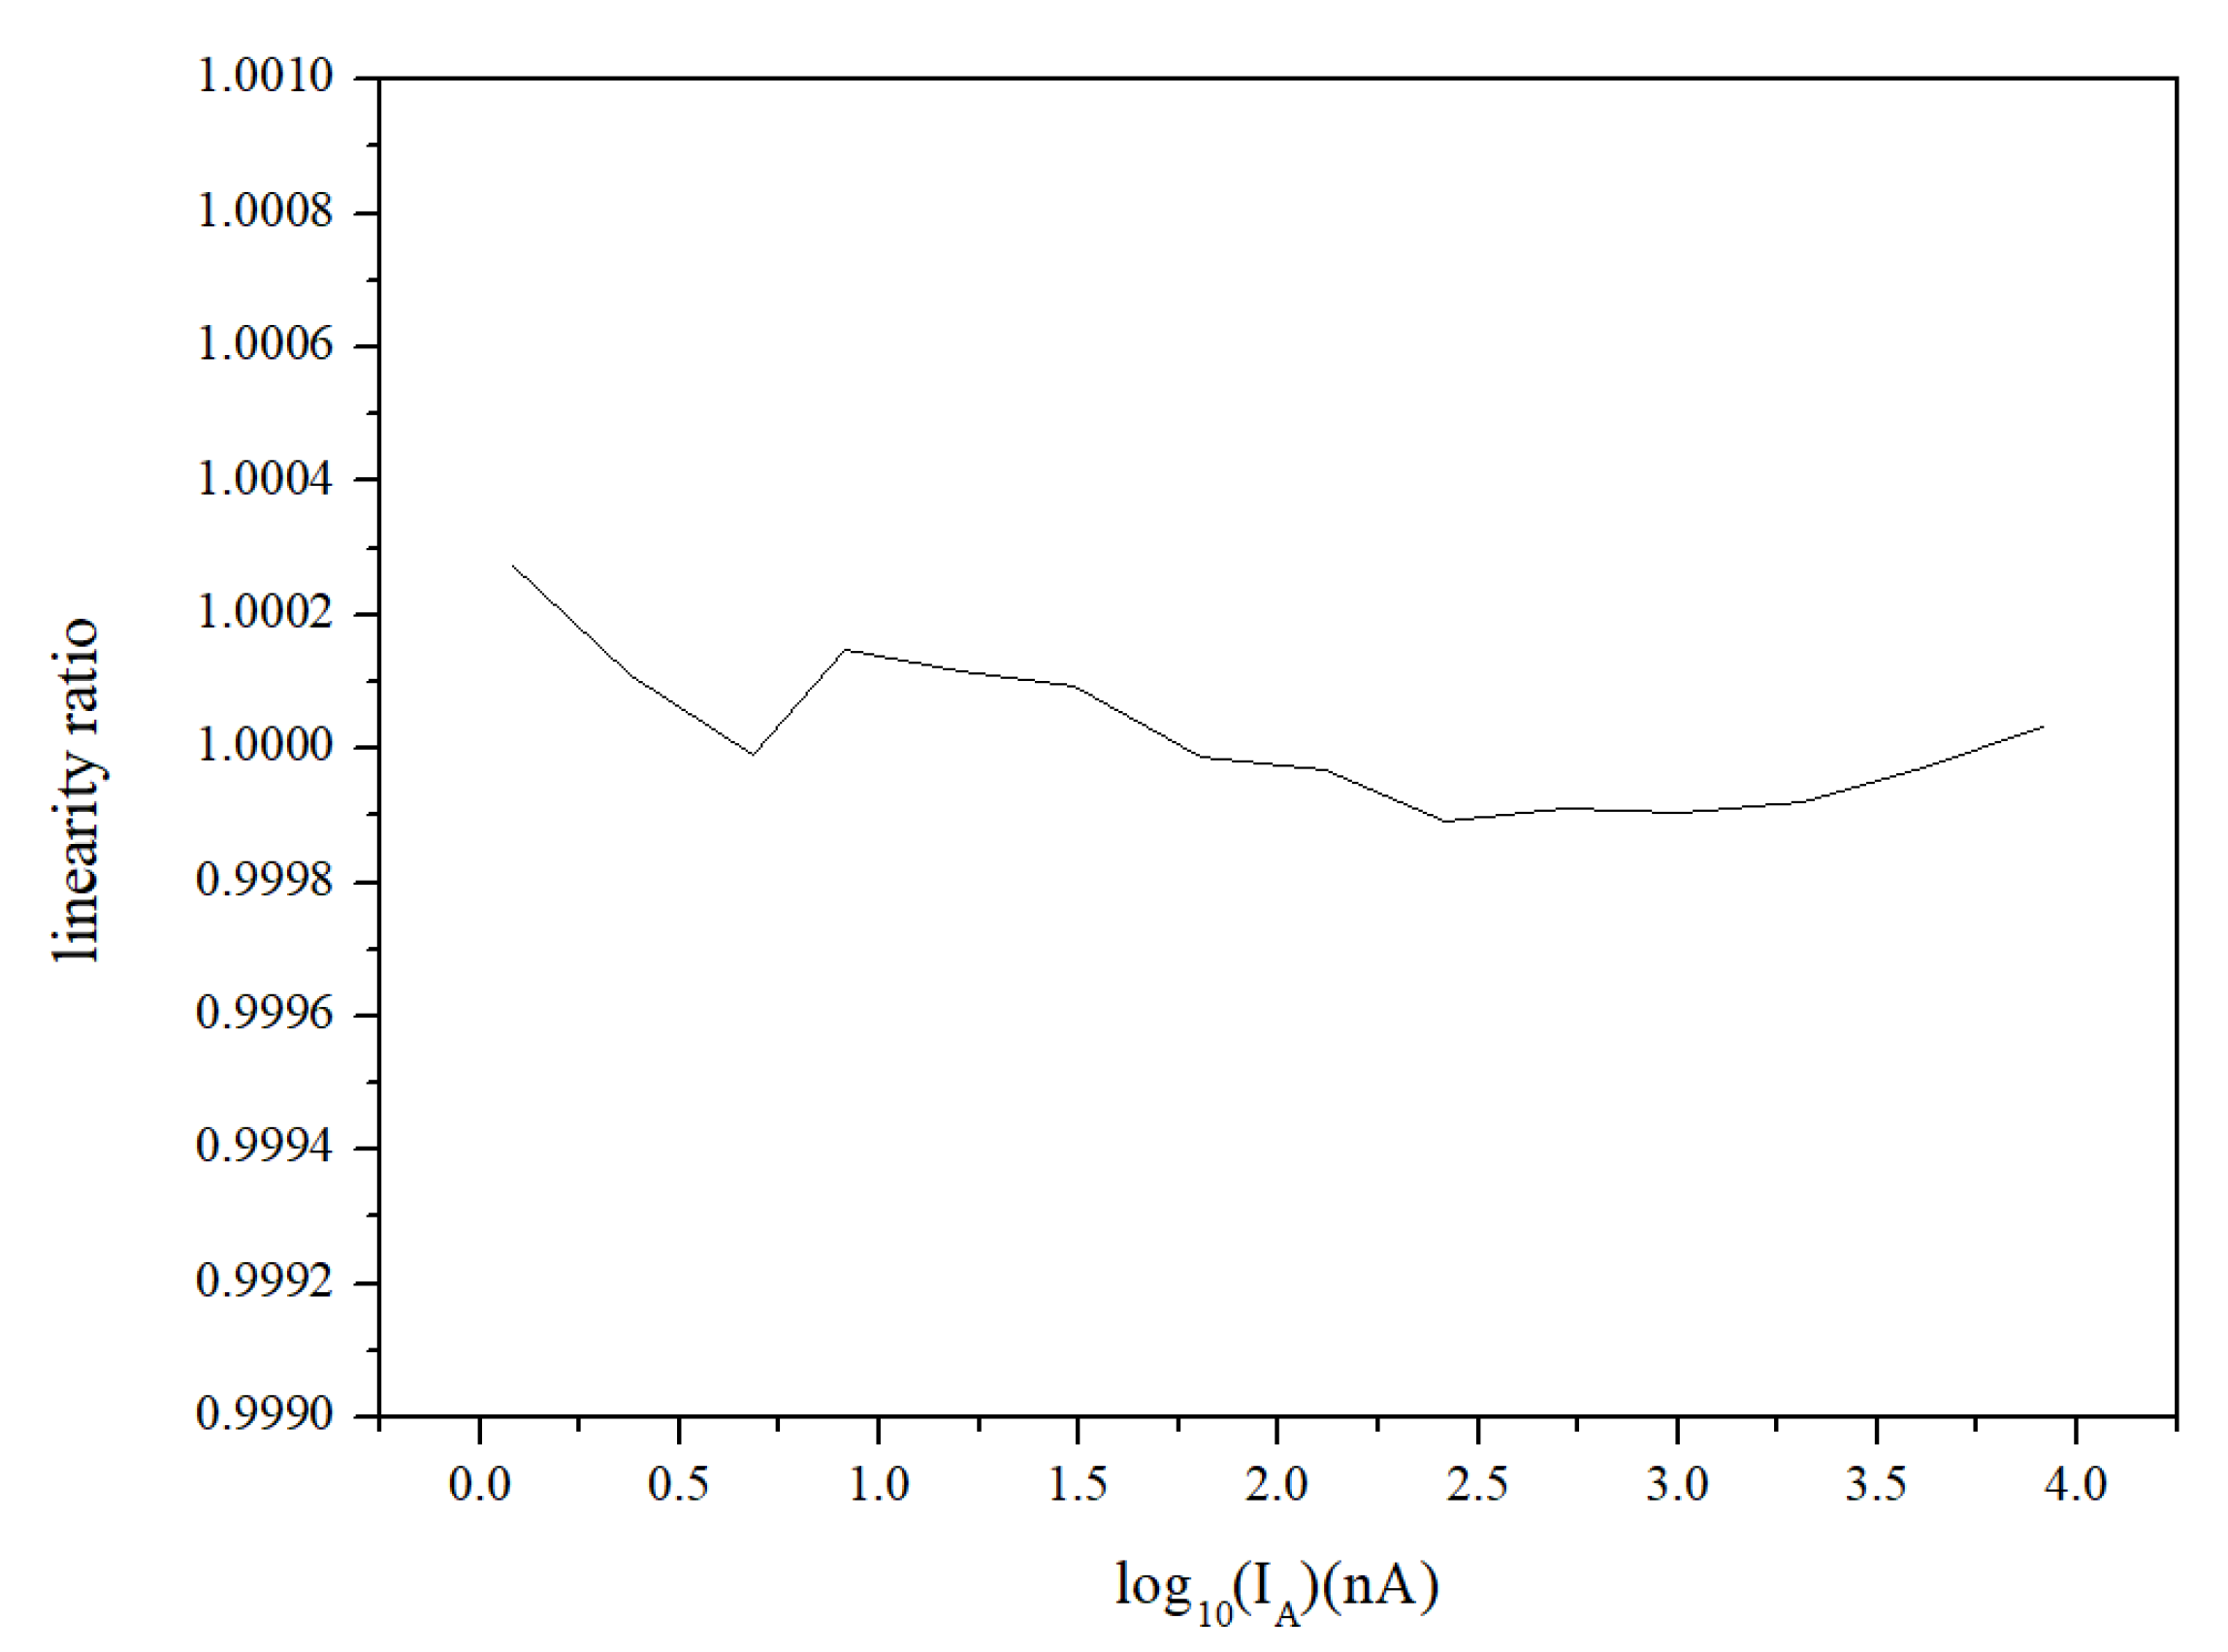
- 350 nm to 1000 nm:A method based on the flux addition of two light-emitting diodes (LEDs) in an integrating sphere was used to detect nonlinearity in the detector system [27]. The measurement range was from 12 pA to 364 nA, which matched the dynamic range of the facility. The measurement results are shown in Figure 12.
- 1000 nm to 2400 nm:
The linear uncertainty of the FTIR spectrometer as measured by the manufacturer was 0.02%.
3.5. Absolute Measurement Workflow for the Facility
The measurement steps for the facility are outlined as follows.
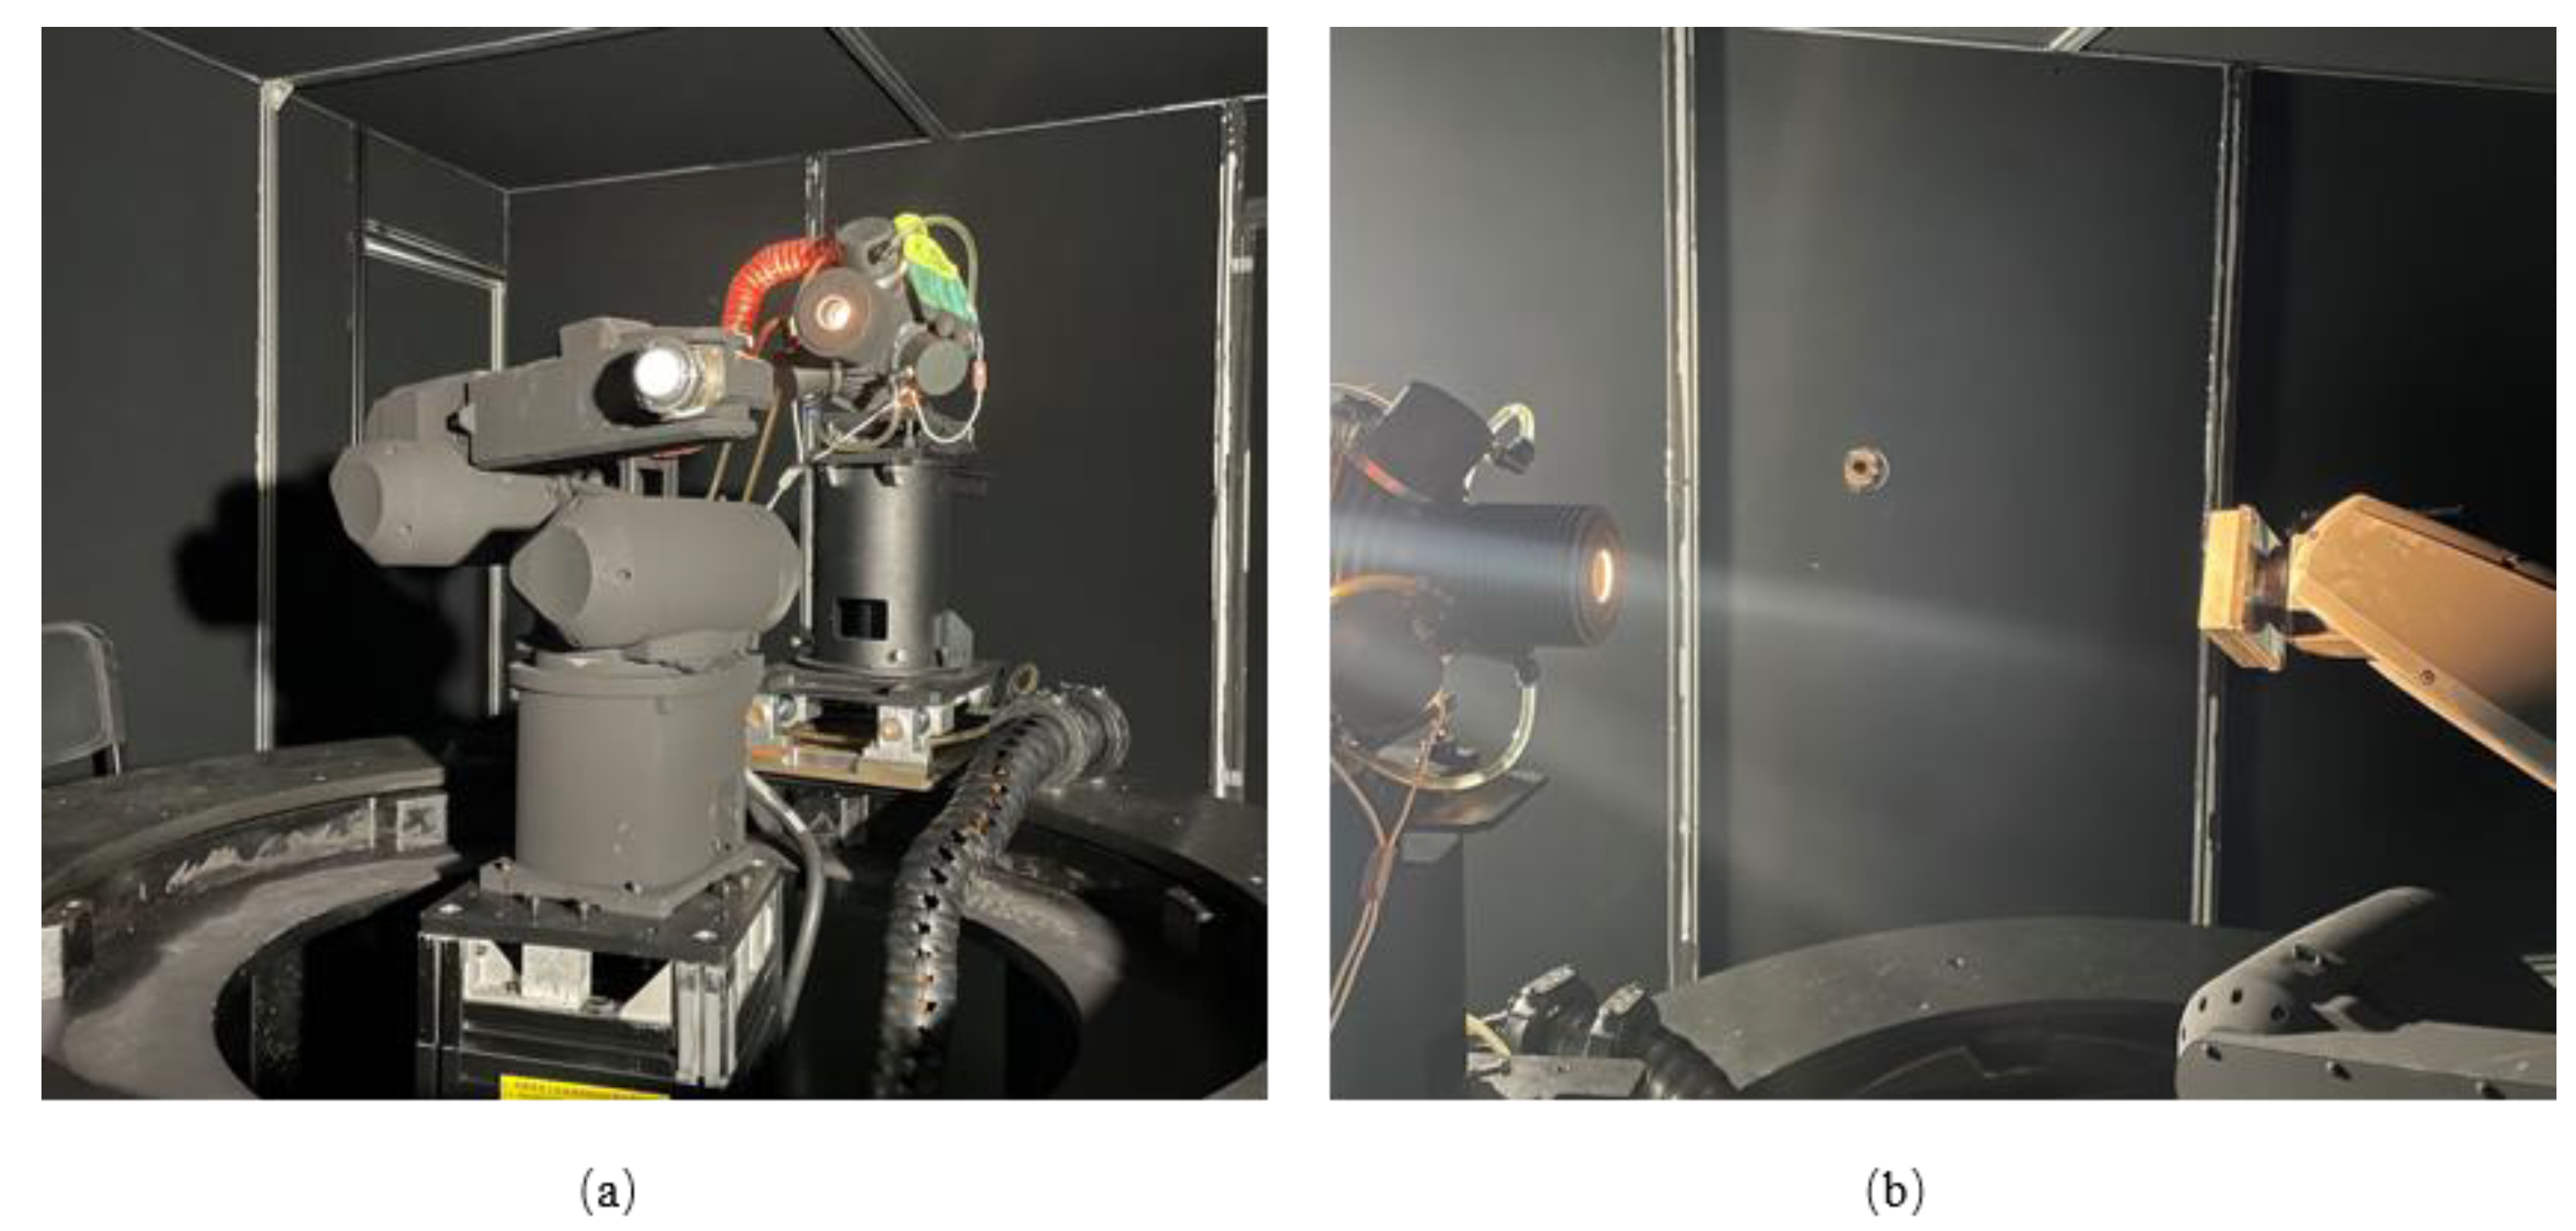
First, the robot held the sample and moved it to the avoidance position, and the radiation source was rotated 180° counterclockwise from the origin of the rotation stage. The incident radiation at the required wavelength was measured. Then, the software controlled the radiation source and the sample to the position required for measurement and measured the reflected radiation from the sample. After the reflected radiation measurements were complete, the facility returned to measure the incident radiation again. The software could control the acquisition frequency of the incident radiation by setting the number of reflected radiation acquisitions. Generally, the number of reflected radiation acquisitions was set to 10 to ensure that the incident radiation measurement interval did not exceed 15 min. Photos of the measurement process are shown in Figure 13a,b.
4. BRDF Measurement by the SD for On-Board Calibration
4.1. Determination of the SD BRDF Measurement Angle
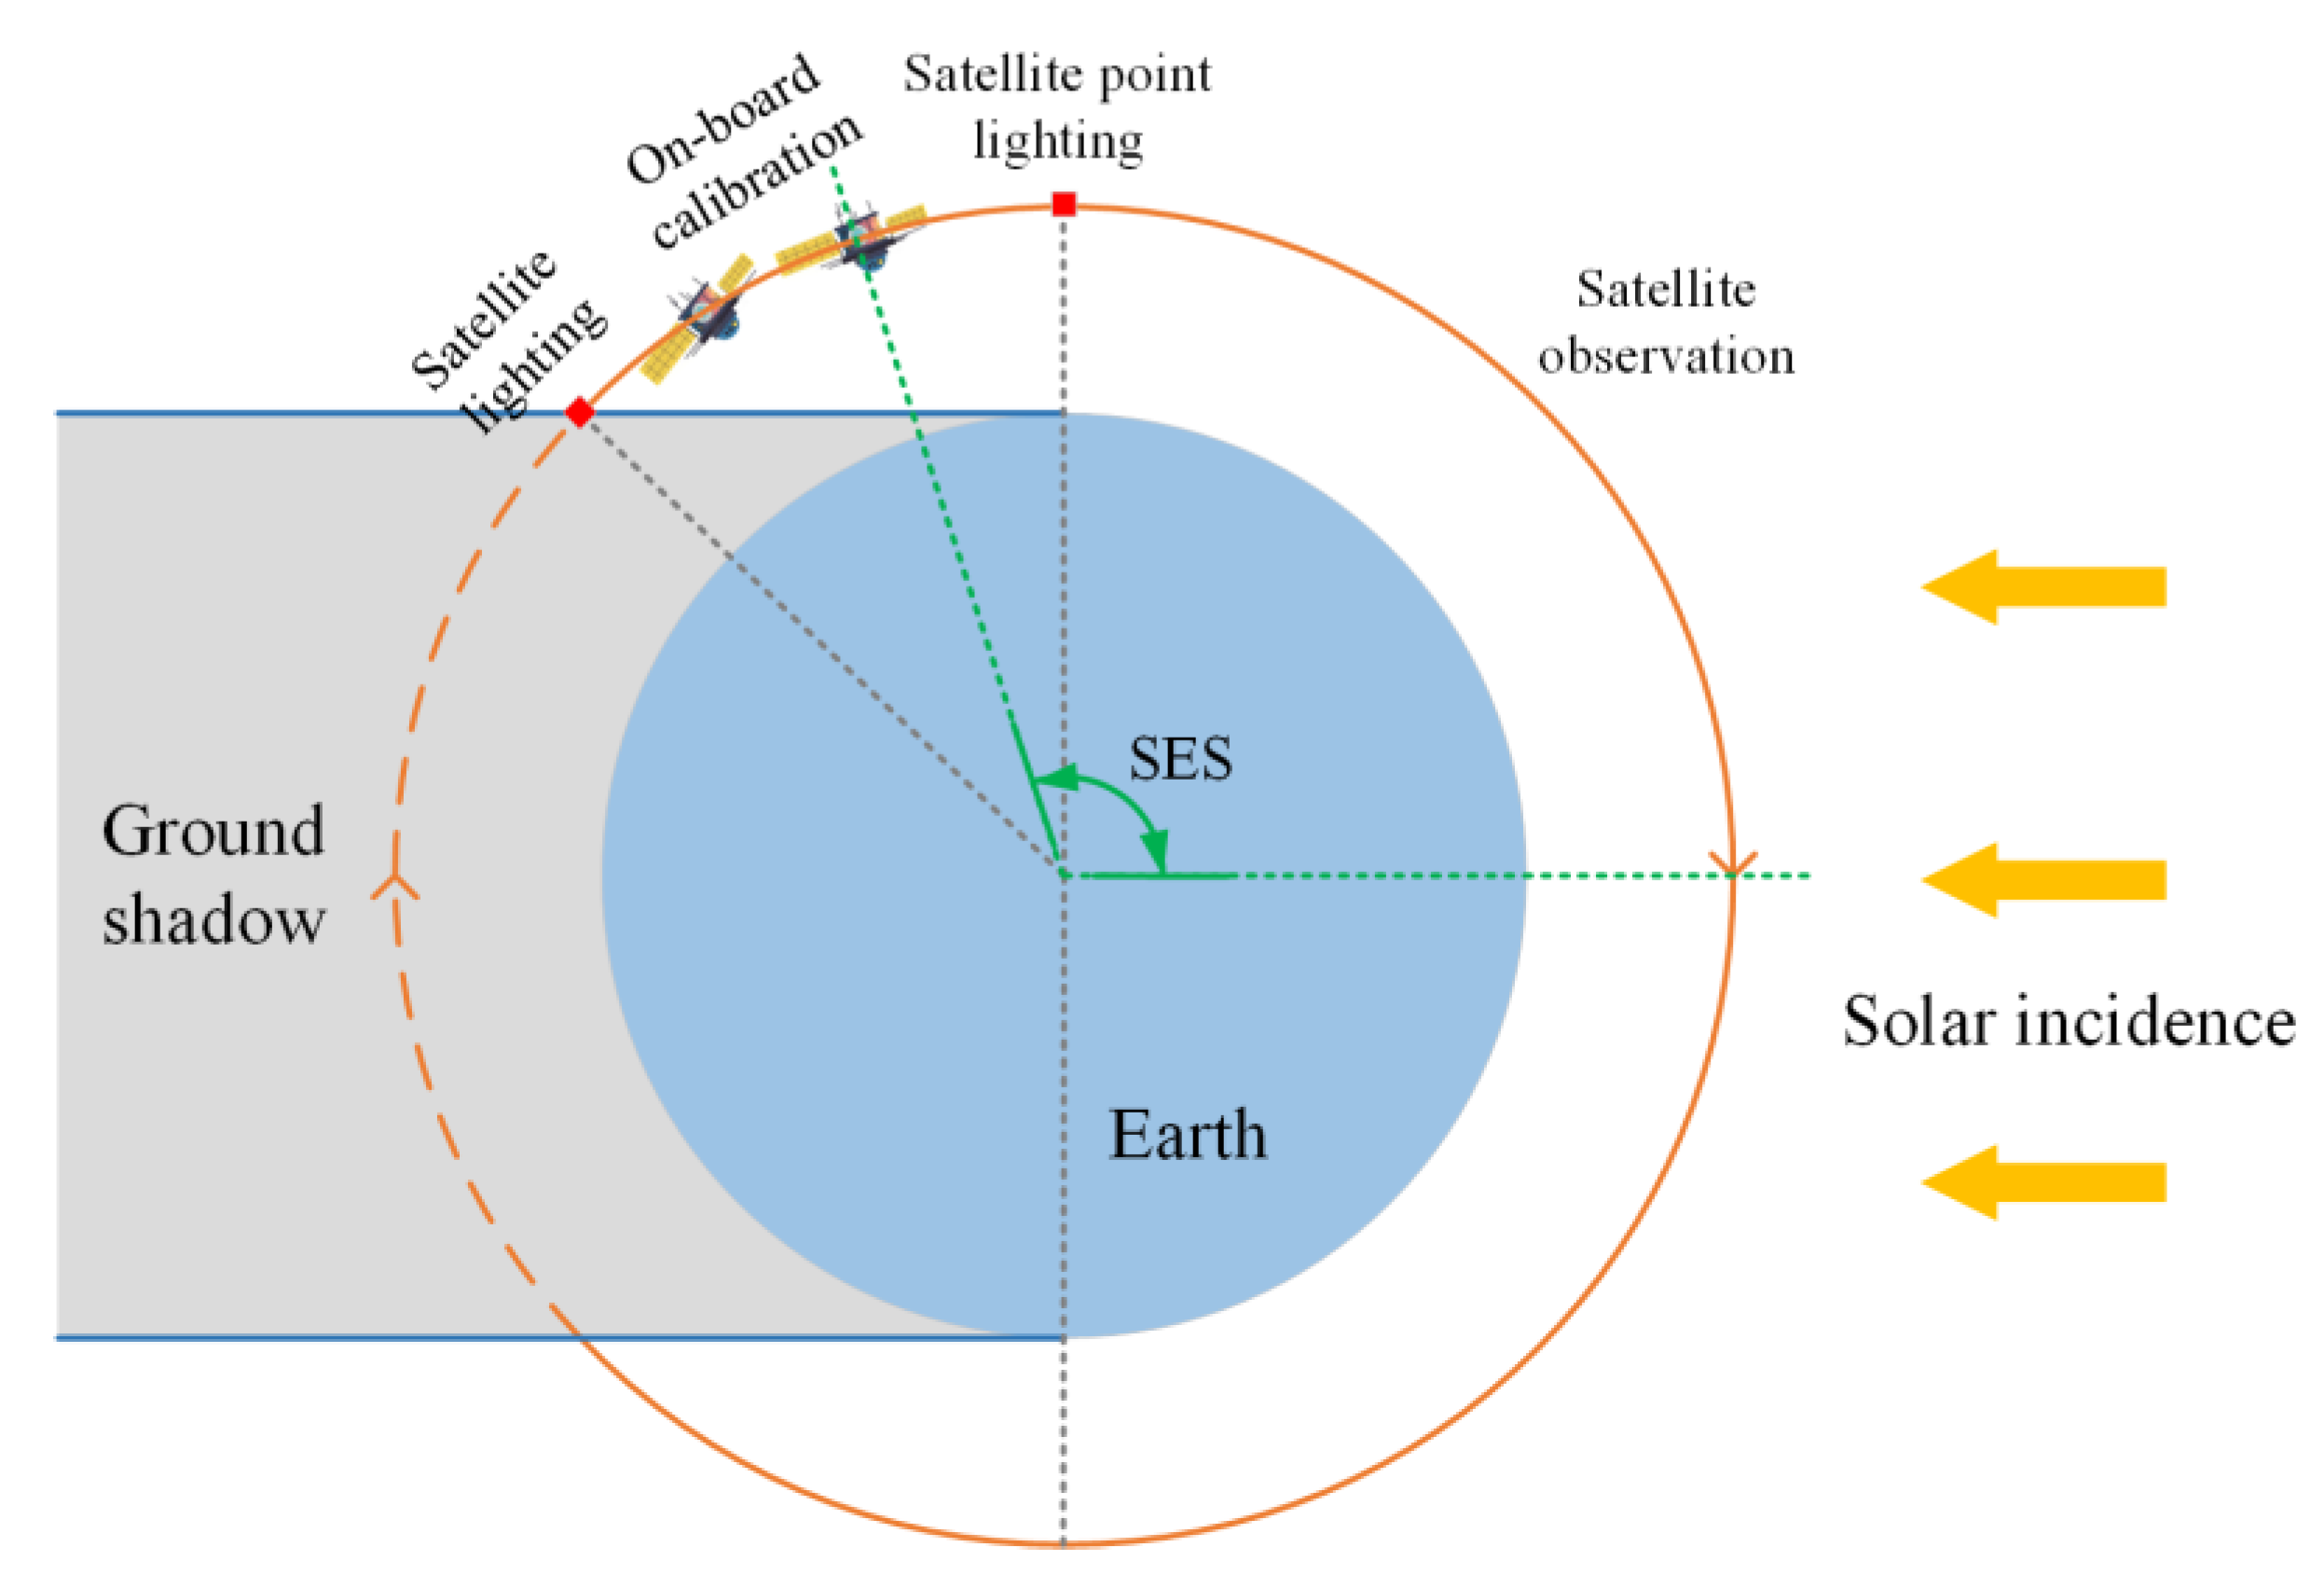
On-board calibration is generally conducted after satellite lighting and before subsatellite point lighting (Figure 14). Based on the analysis of observations from hyperspectral instruments on international satellites, on-board calibration is susceptible to scattered and reflected stray light from the Earth and the atmosphere. The appropriate Sun–Earth–satellite (SES) angle at on-board calibration times is selected to reduce this influence. For example, the SES angle for on-board calibration was just above 105° on the Greenhouse Gases Observing Satellite (GOSAT) [28].
After determining the calibration time on the satellite and the satellite orbital parameters, the elevation angle and azimuth angle of the incident beam were also determined. According to the design requirements of an on-board calibration facility based on an SD, the direction of the central axis of the payload (the observation direction) could also be determined at the calibration time.
The attitude of the SD was determined from the vectors of the incident and observation directions. It was required that the zenith angles of the incident and observation directions be as small as possible, and mirror positions of the incident and observation azimuth angles should be avoided.
However, if the angle between the incident and observation vectors was large, the zenith angles of the incidence and observation directions could not be reduced, no matter how the SD was placed. If the zenith angle in the observation direction was too large, the size of the optical surface of the SD would increase in order to ensure that the whole detector could be covered. An oversized SD takes up a large space, which affects the design of other systems in the satellite. Therefore, it is common to prepare a design for a large observation zenith angle and a small reflection zenith angle.
4.2. Improved Data Processing Method Based on Reciprocity Theorem for Measuring Large Angle BRDF
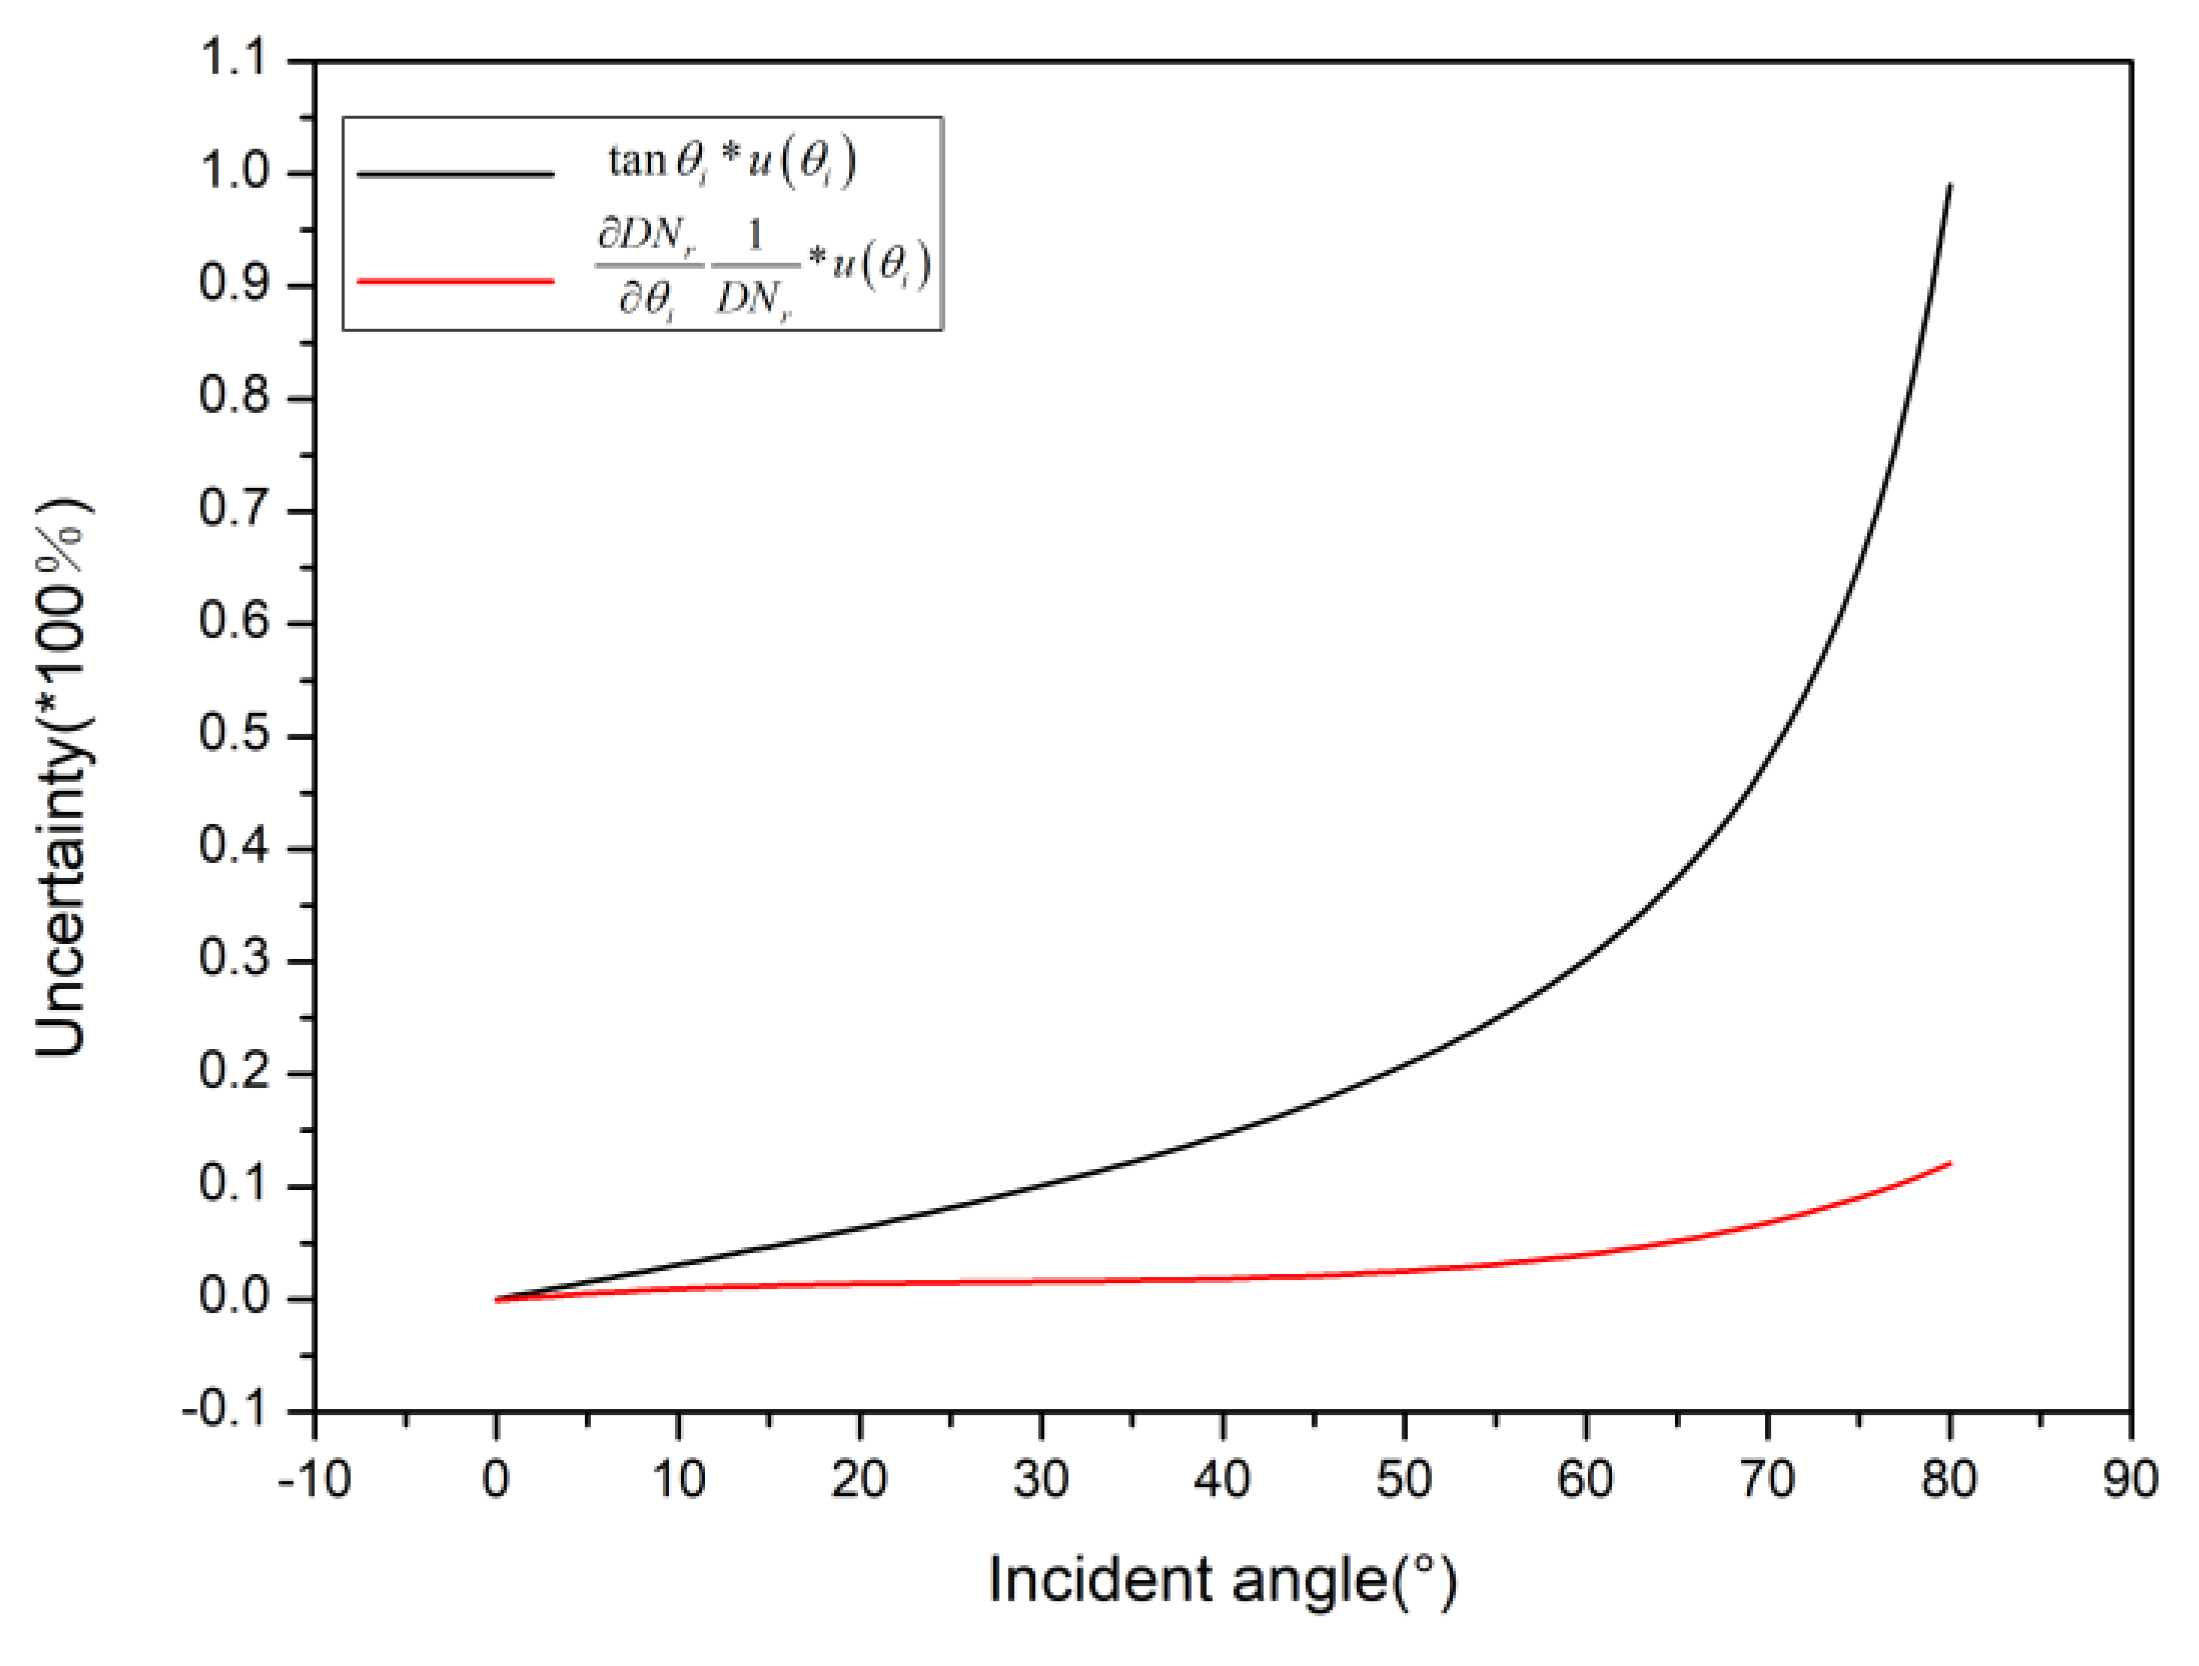
According to Equation (5), the uncertainty of an absolute BRDF measurement could be related to the uncertainty of the incident angle, and the relative uncertainty [29] component associated with the incident angle () was
Assuming that , the trend of and with could be calculated as shown in Figure 15. Note that the results here are for pressed or sintered PTFE. was obtained by fitting data from a 10° to 75° (5° interval) incident zenith angle and 0° reflected zenith angle. It was obvious that the greater the incident angle, the greater and were. At an 80° incident angle, when , which caused a significant impact on BRDF measurement.
For pressed PTFE, the angle had a small effect on . In the extreme case of large incident and reflected angles, the relative uncertainty of the reflected radiation component associated with the angle was less than 0.15% when . At large incident angles, the effect of the angle’s uncertainty on was much smaller than that on . Therefore, an improved data processing method for measuring the BRDF at a large angle was designed. This method was based on the reciprocity theorem. The principle of this method was that, with vertical detection as a reference, the BRDF of a tilted observation could be obtained by comparing tilted observation and vertical observation at the same illumination. This improved method could reduce the dependence of the measurement uncertainty on the angular accuracy of the goniometer system.
The reciprocity theorem describes the reversibility of an optical path. It refers to the concept that the energy emitted by a light beam after arbitrary reflection or refraction on a surface or in a passive medium is equal to the energy emitted by the beam along the opposite path. When applied to the BRDF, BRDF remained unchanged when the incident angle and reflection angle were interchanged:
Compared with tilted illumination (), the influence of on Equation (12) was the least when vertically illuminated (). Therefore, the BRDF measured at 0°/45° was used as a reference to obtain the BRDF for other angles at the same irradiance. Then
where represents the DN of the incident radiance.
From (14),
For other nonvertical irradiance conditions,
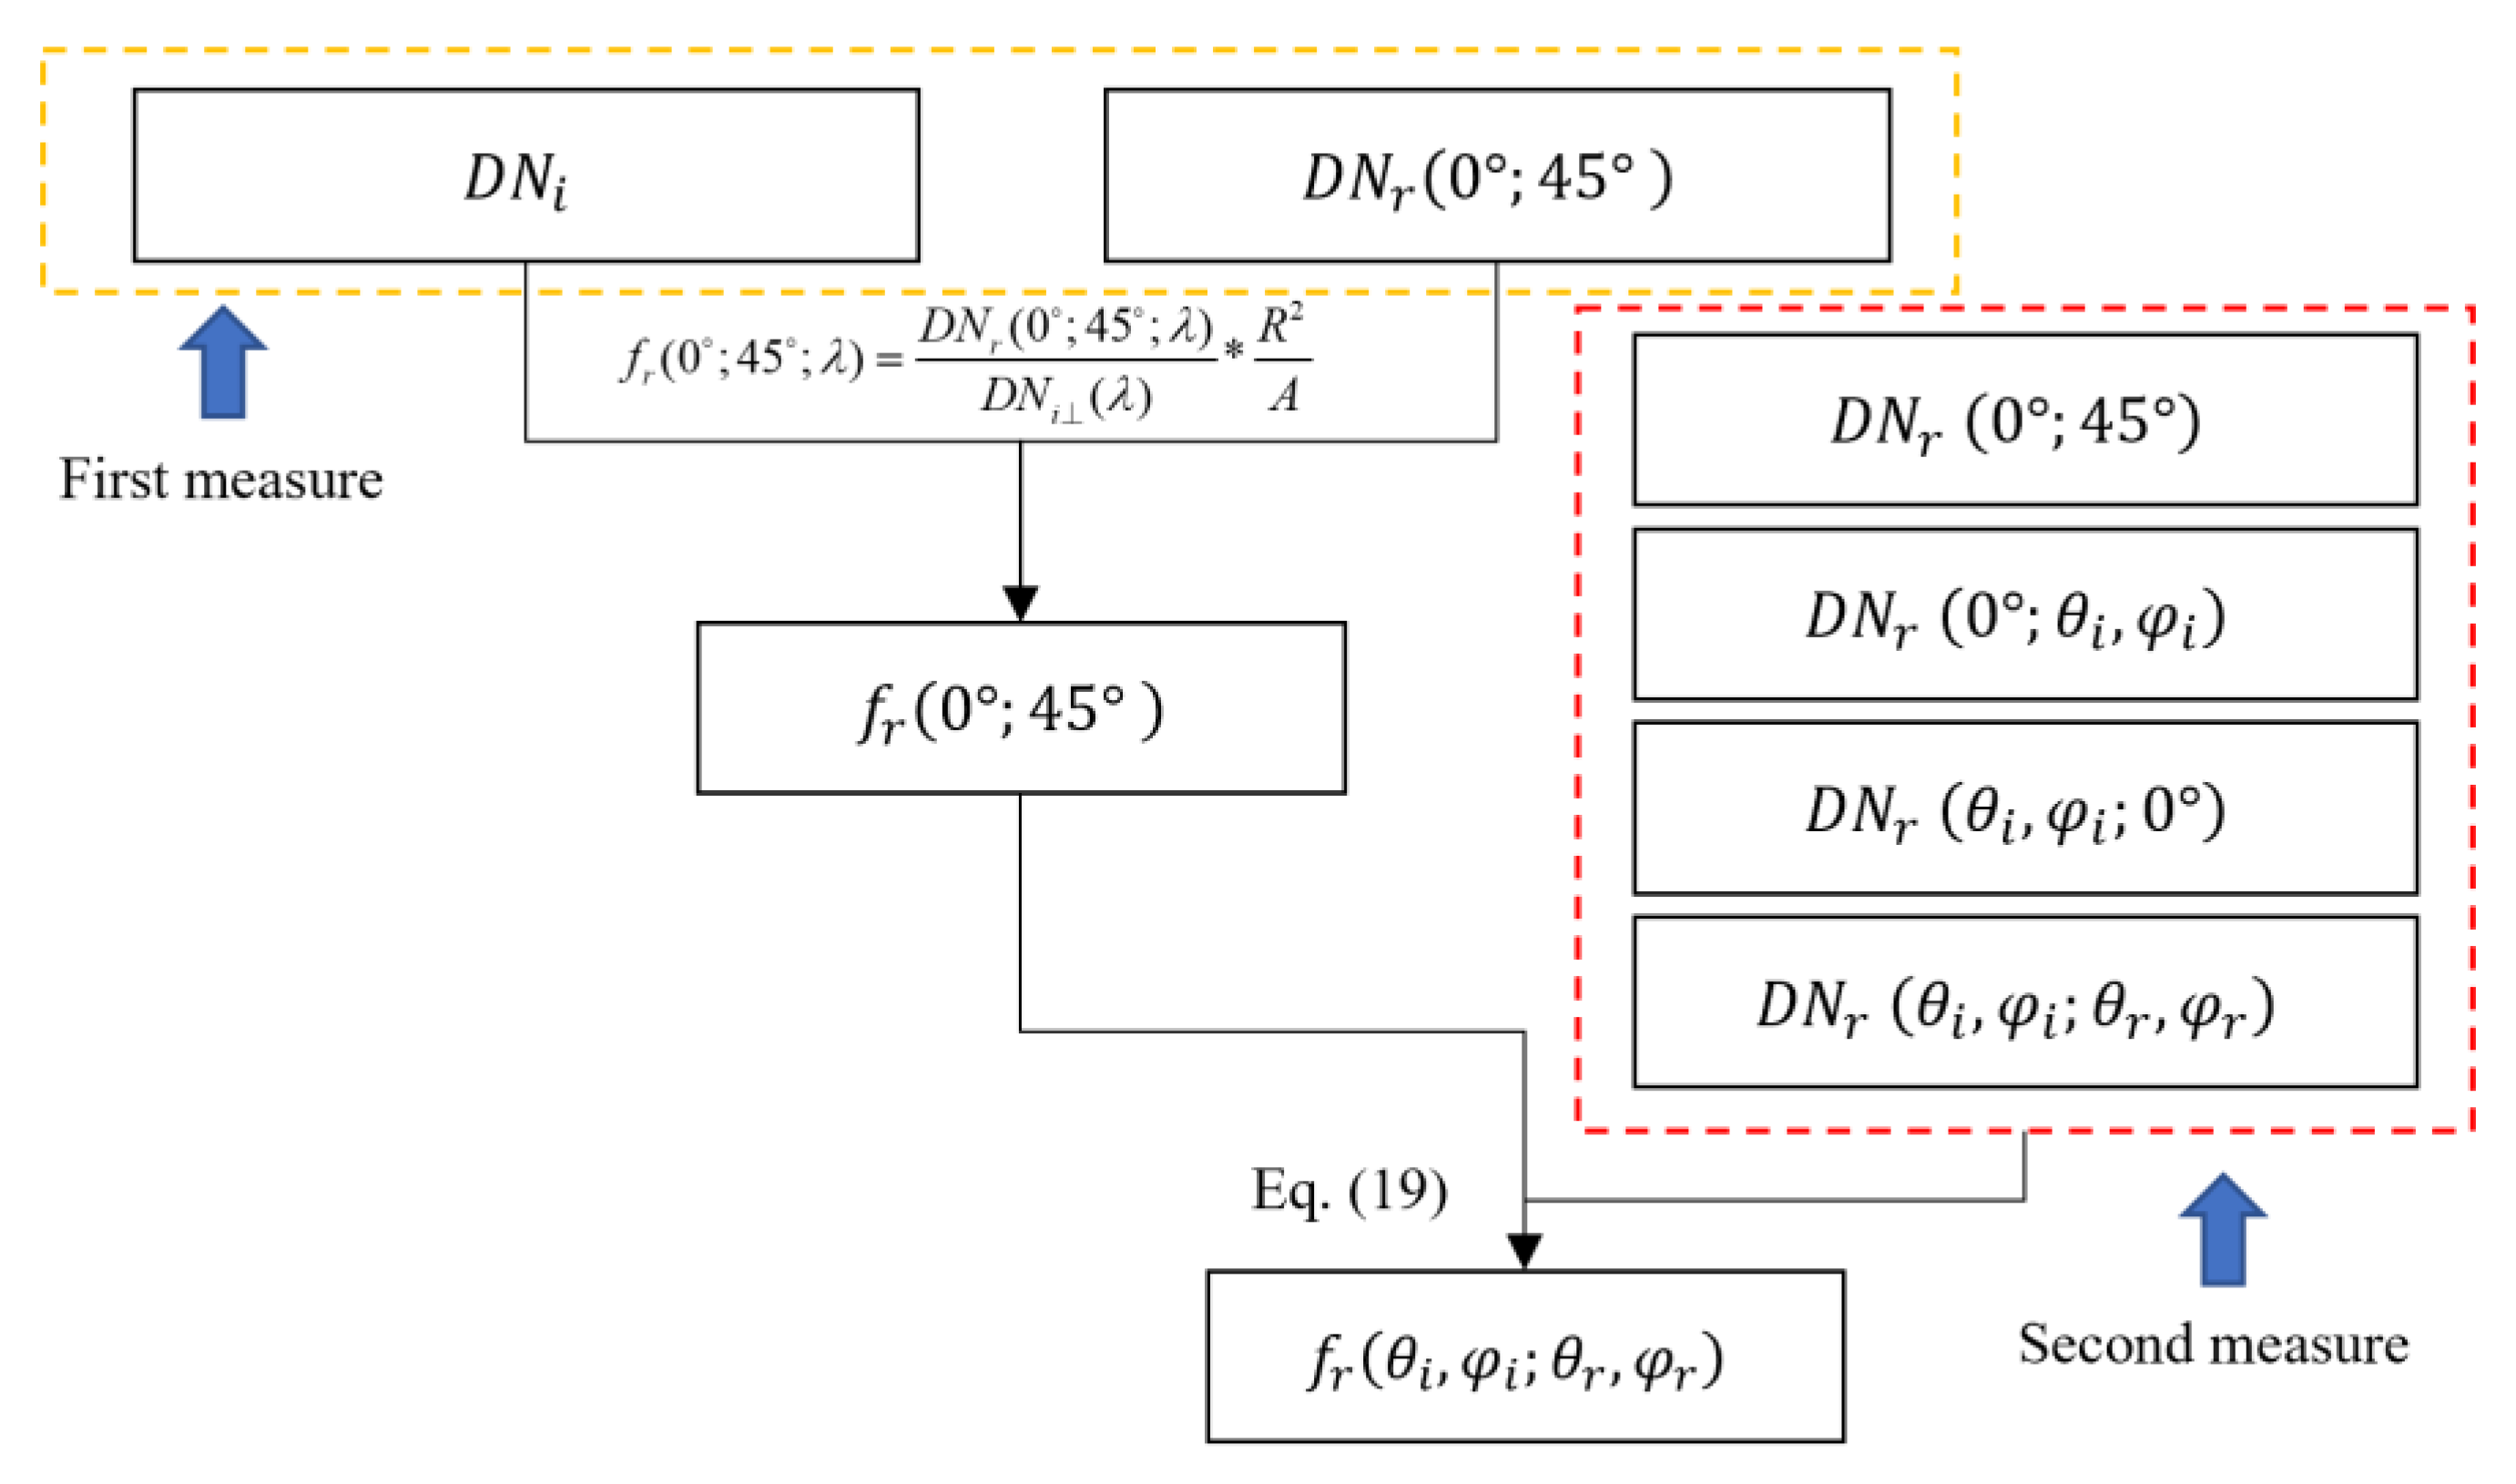
The measurement process for the improved data processing method is shown in Figure 16.
5. Uncertainty Budget
5.1. Relative Uncertainty Budget for Absolute Measurement of the SD BRDF at 0°/45°
According to Equation (15), the relative uncertainty of the BRDF at 0°/45° could be given by
where and represent the relative uncertainty components associated with the measurement geometric factor; represents the relative uncertainty component associated with the stability of the light source; , , , represent the relative uncertainty components associated with the detection system, which correspond to the linearity and repeatability of the incident and reflected radiation detection and solution of the amplification factor; represents the relative uncertainty component associated with the wavelength; represents the relative uncertainty component associated with the incident angle; represents the relative uncertainty component associated with the polarization; and represents the relative uncertainty component associated with stray light.
5.1.1. Measurement Geometric Factors
Distance R was measured using a 1000 mm Vernier caliper, a dial gauge, and a connecting rod. Area A of the opening was measured using an inner diameter ruler. The R and A were obtained from the average of multiple measurements. The measurement accuracy was 0.01 mm. The measurement process is shown in Figure 17.
The measurement uncertainties of the distance and area were described by the standard deviation of multiple measurements. The relative uncertainty components associated with R and A, respectively, were as follows:
5.1.2. Stability of the Light Source
According to the description in Section 3.1, the measurement interval of the incident radiation did not exceed 15 min. According to Figure 3, .
5.1.3. Linearity
The linear uncertainty could be expressed as
where represents the nth order corresponding to the nonlinear correction factor and represents the nonlinearity uncertainty. The calculation steps for are described in detail in [30].
According to the results in Section 3.4.2, the relative uncertainty component associated with the Si detector could be calculated to be .
From the factory test report of the FTIR spectrometer, the linearity of the spectrometer was better than 0.02%, that is, .
5.1.4. Wavelength
From the characteristics of PTFE, the reflectance of the SD was flat along the spectrum (excluding the absorption band near 2200 nm); therefore, .
5.1.5. Angle
According to Figure 11, the angle uncertainty (0.1°) had little impact on the reflected signal at 0°/45°. Therefore, .
5.1.6. Repeatability of Incident and Reflected Signal Detection
The DN at the detection system was obtained from an average of 36 repeated measurements. The uncertainty calculation method for n repeated measurements of the DN was as follows:
where represents the DN for the i-th measurement and represents the average of n measurements.
5.1.7. Scaling Factor
According to (5), .
5.1.8. Stray Light
The transfer coefficient could be calculated as
where represents the signal ratio of the stray light to the incident flux and represents the signal ratio of the stray light to the reflected flux [31]. The relative uncertainty component associated with the stray light was estimated to be 0.1% based on an actual condition.
5.2. Relative Uncertainty Budget for SD BRDF Measurement at Large Angles
According to Equation (18), the relative uncertainty budget for SD BRDF measurement at a large angle was
where represents the relative uncertainty component associated with the repeatability of the reflected radiation at ; represents the relative uncertainty component associated with the repeatability of the reflected radiation at ; represents the relative uncertainty component associated with the repeatability of the reflected radiation at ; represents the relative uncertainty component associated with the repeatability of the reflected radiation at 0°/45°; represents the relative uncertainty of the absolute measurement of the SD BRDF at 0°/45°; represents the relative uncertainty component associated with the angle.
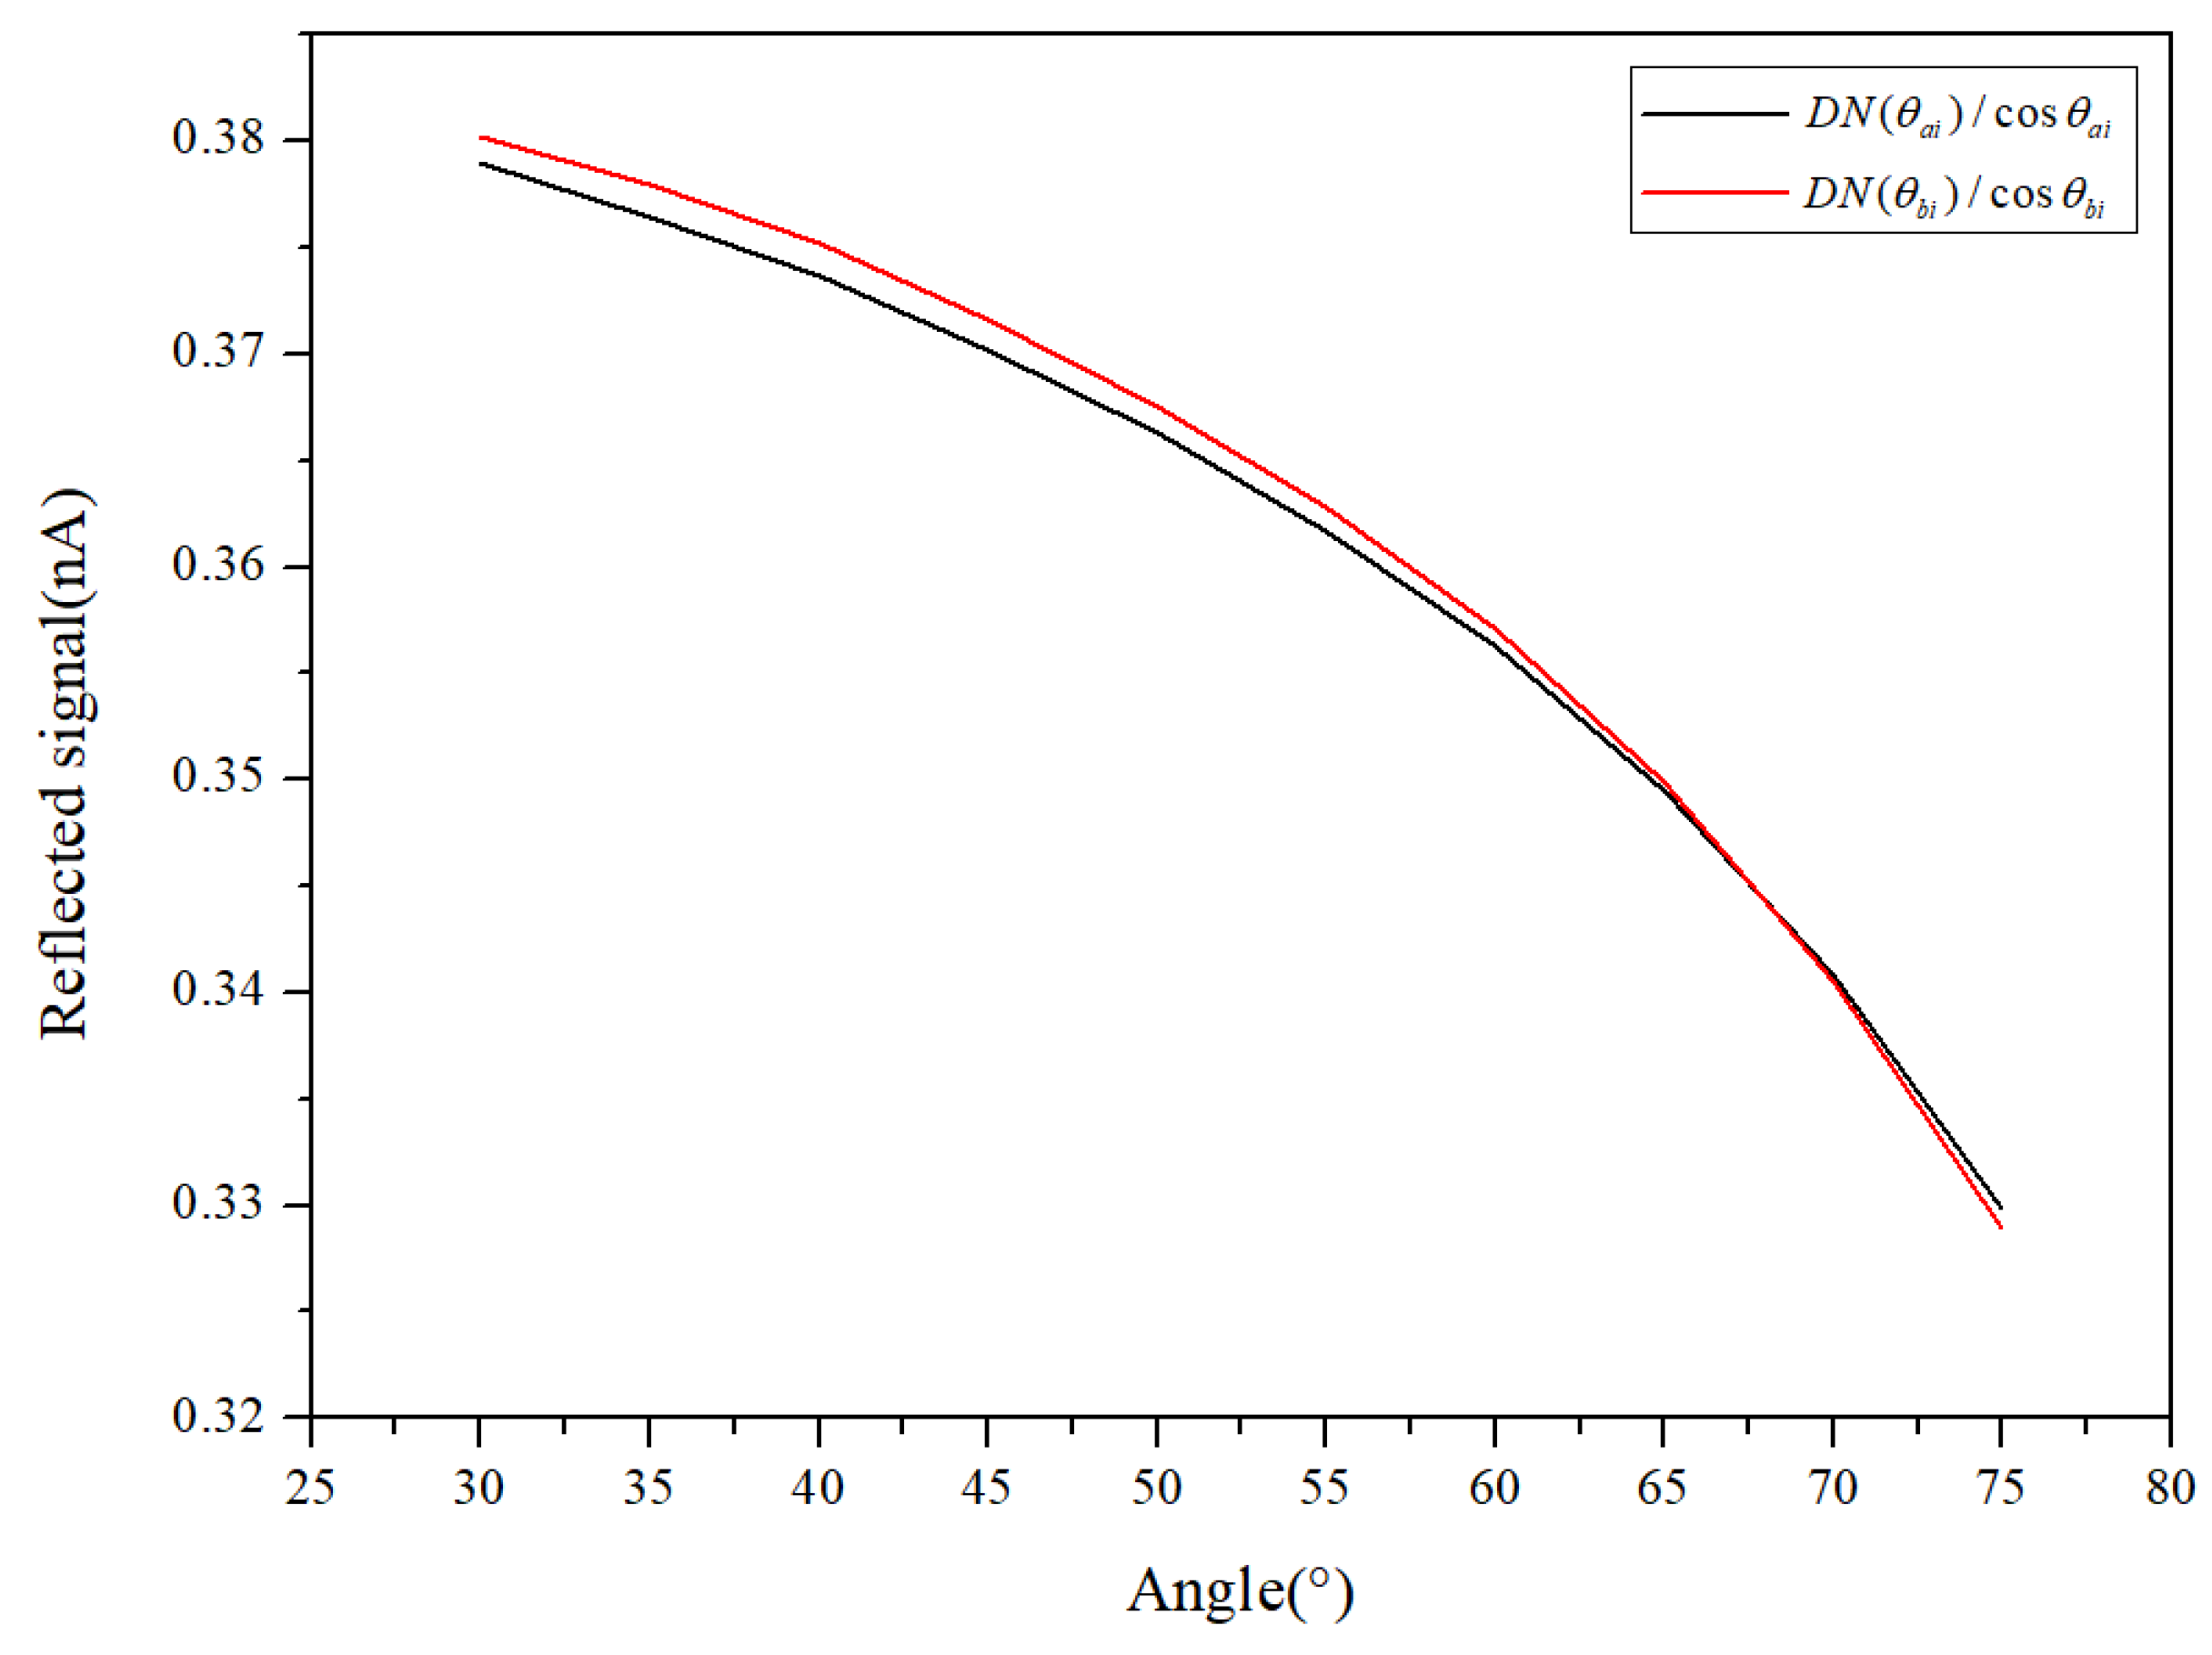
From the figure and table in Section 5.1.6, the relative uncertainty of the radiation at a 0° incident angle with different reflection angles was basically the same as that of the radiation at 0°/45°. At a large incident angle, the relative uncertainty of the radiation with different reflection angles was also the same as that of the signal with a 0° reflection angle. That is,
When , the relative uncertainty component of the reflected radiation at a 0° incident angle or 0° reflection angles (,) was small and could be ignored. In the extreme case of large angles of incidence and reflection, this relative uncertainty of reflected radiation () was less than 0.15% with the same angular uncertainty.
According to Equation (25), the uncertainty of the improved method based on the reciprocity theorem is shown in Table 6.
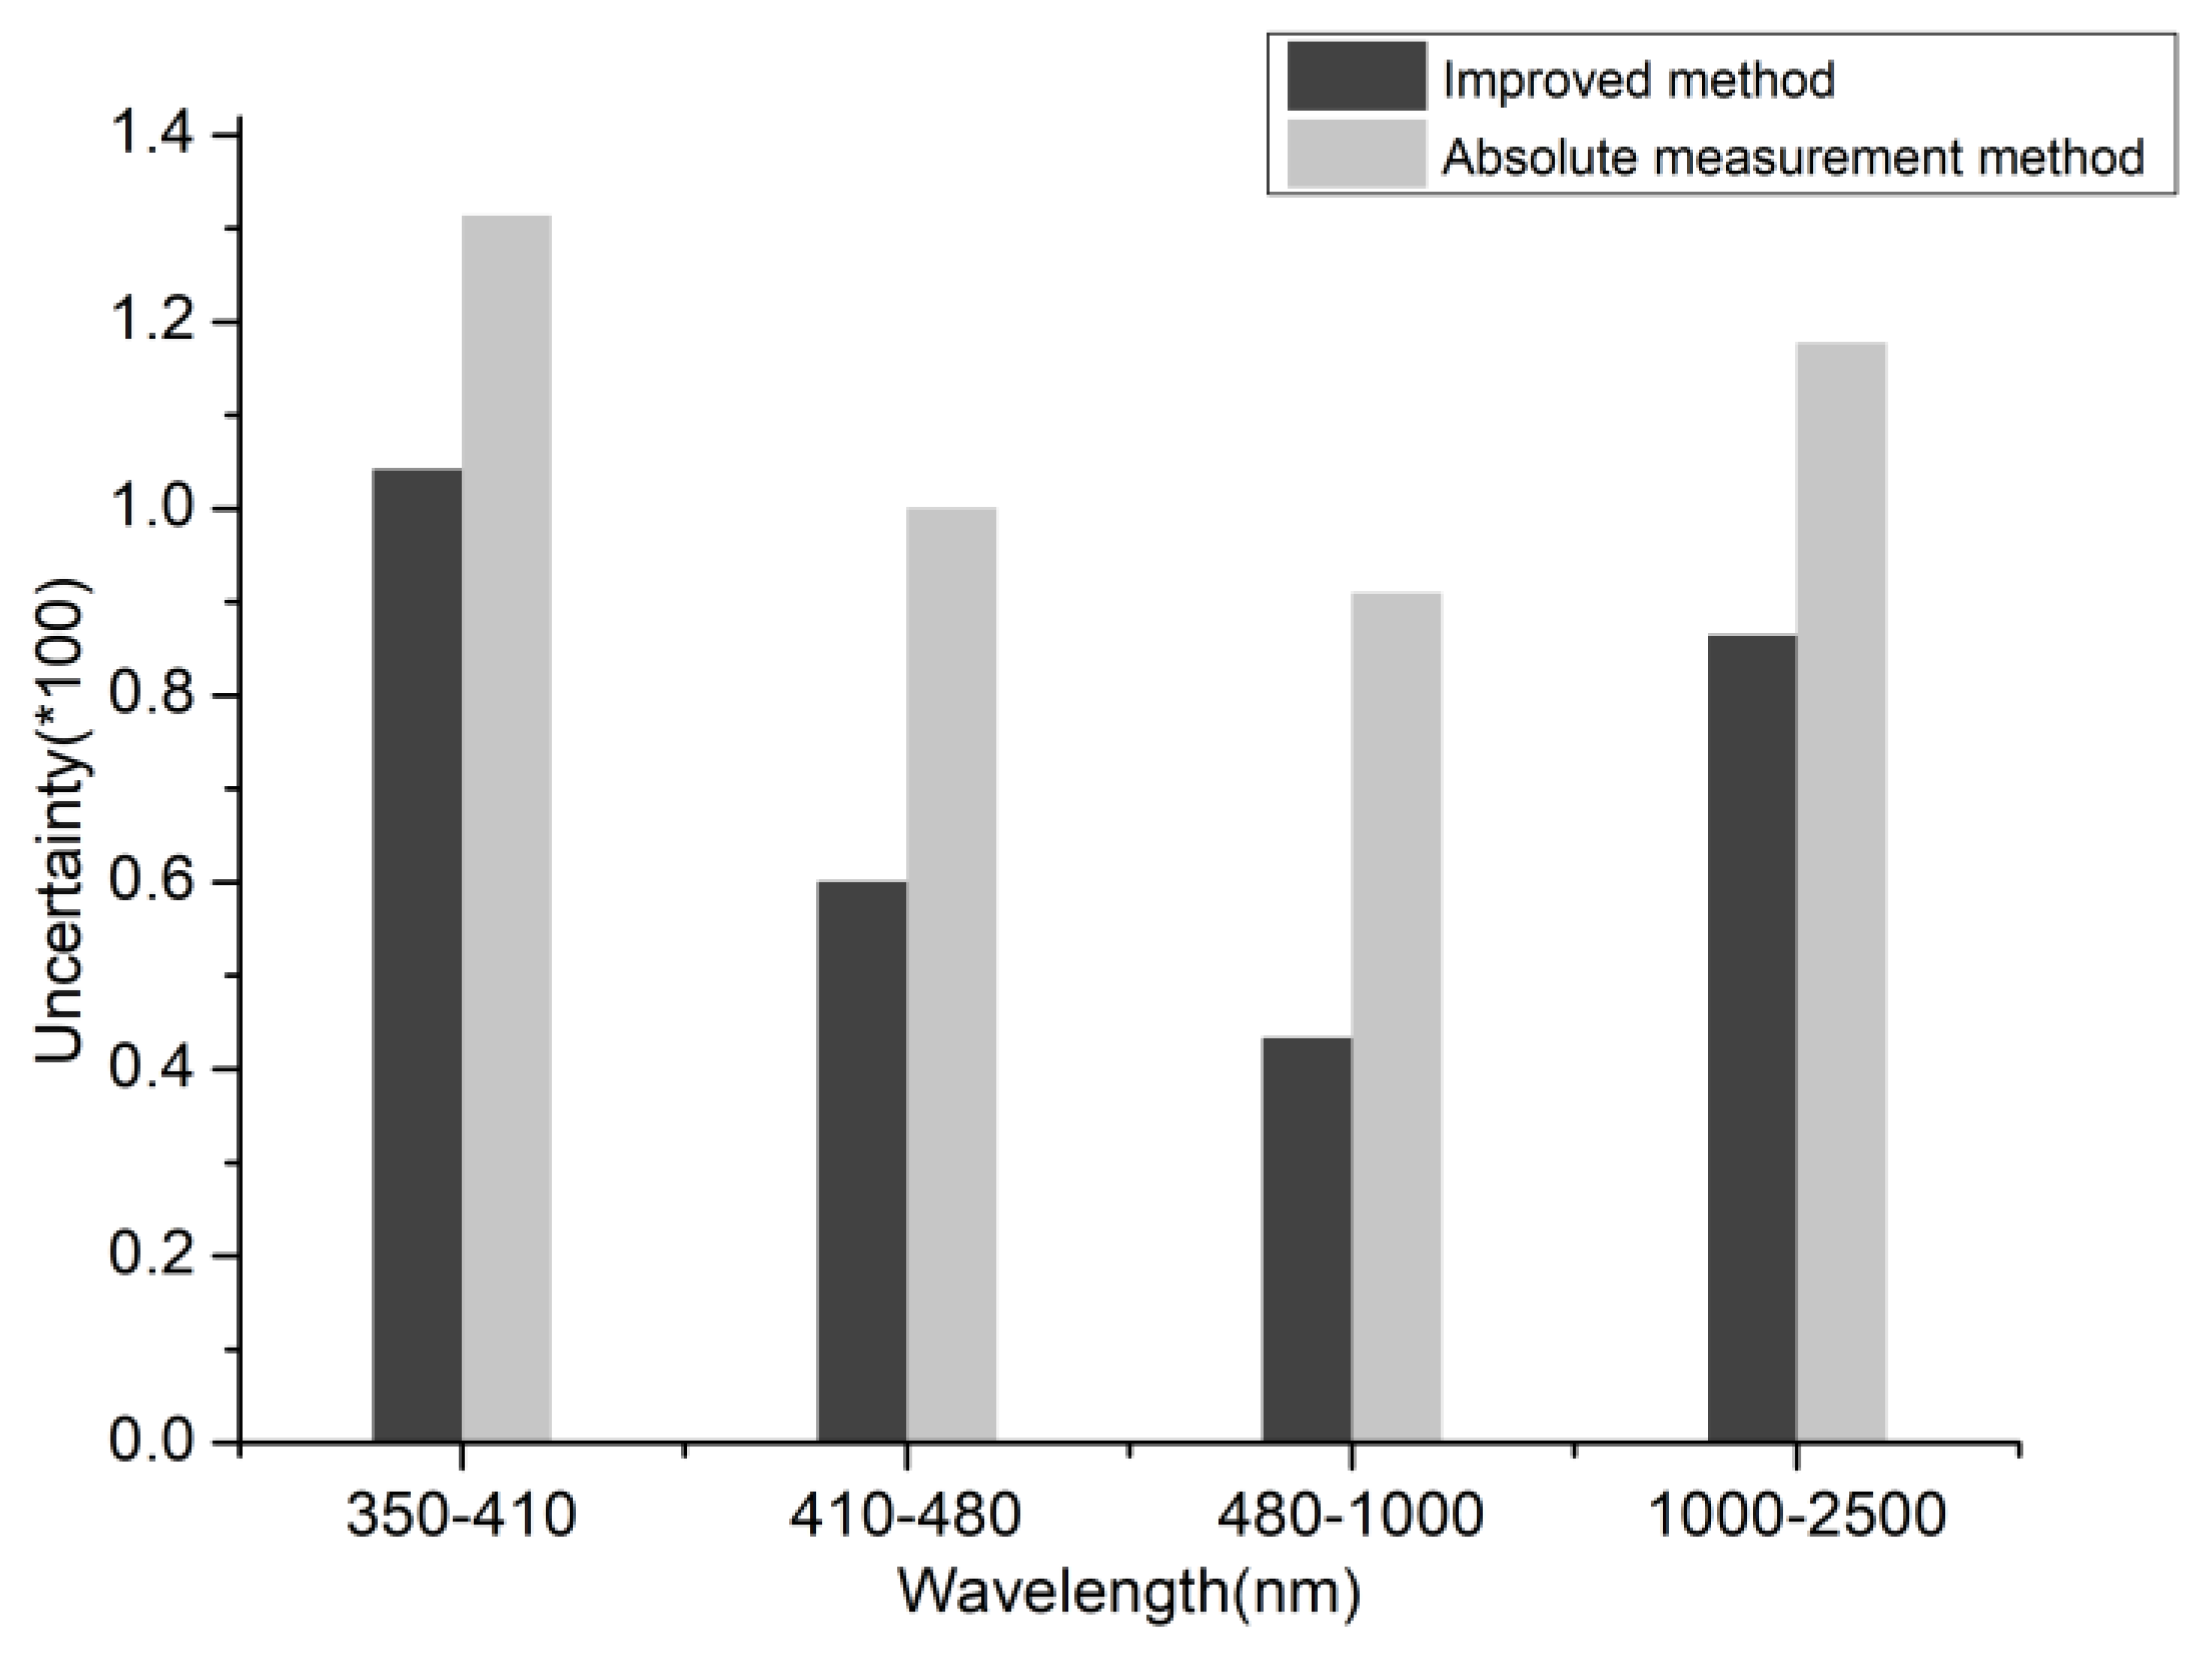
5.3. Comparison of the Measurement Uncertainty at Large Angles between Improved Method and Absolute Measurement Method
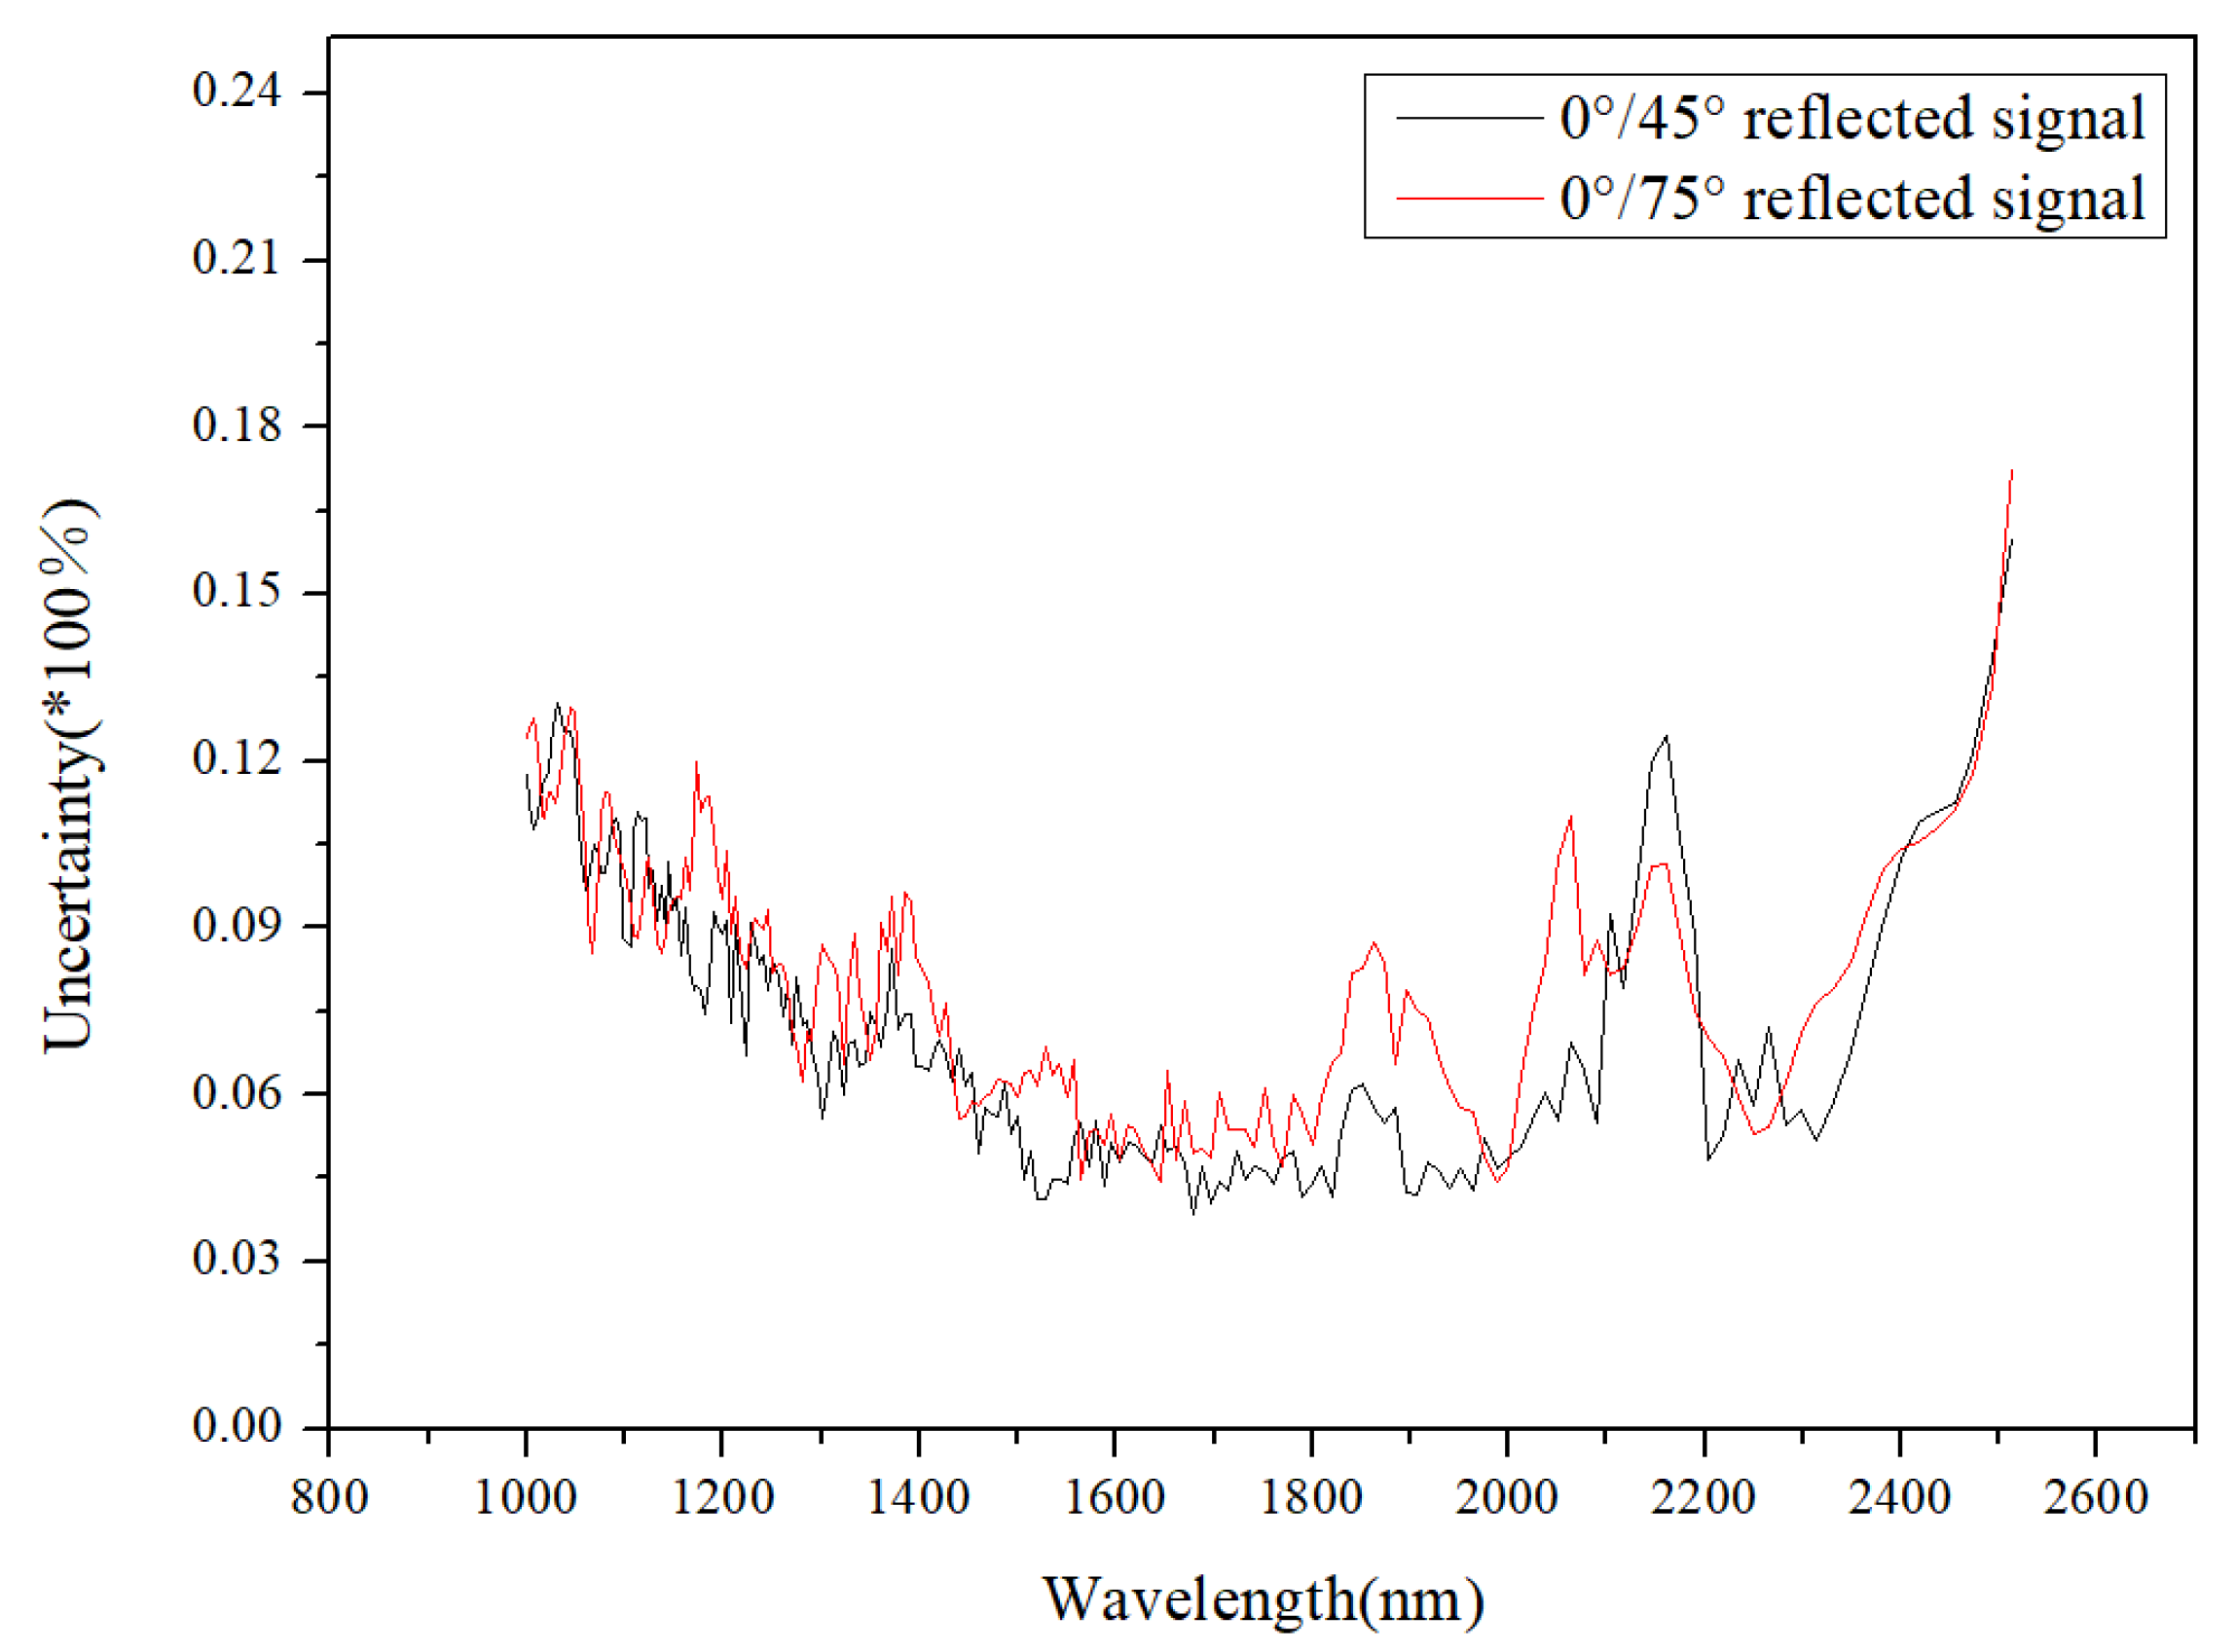
The uncertainty of the SD BRDF measured by the two methods in Section 2 and Section 4.2 for a large incident angle (75°) is shown in Figure 21. The uncertainty budget for the absolute measurement method was similar to that given in Section 5.1. It differed only in Section 5.1.5. The absolute BRDF measurement of an SD at a 75° incident angle (incident zenith angle is 75°) was
The uncertainty of the absolute BRDF measurement method could be obtained according to Equation (20).
In the range of 410 nm to 1000 nm, the improved method based on the reciprocity theorem reduced the measurement uncertainty by more than 50%. The measurement accuracy was significantly improved because the dependence of the measurement uncertainty on the angular accuracy of the goniometer system was reduced by the comparison measurement. However, in the 350 nm to 410 nm and 1000 nm to 2500 nm ranges, improvement in the measurement accuracy was limited. The reason for this was that the SNR of the reflected radiation in the current band was low.
6. Results
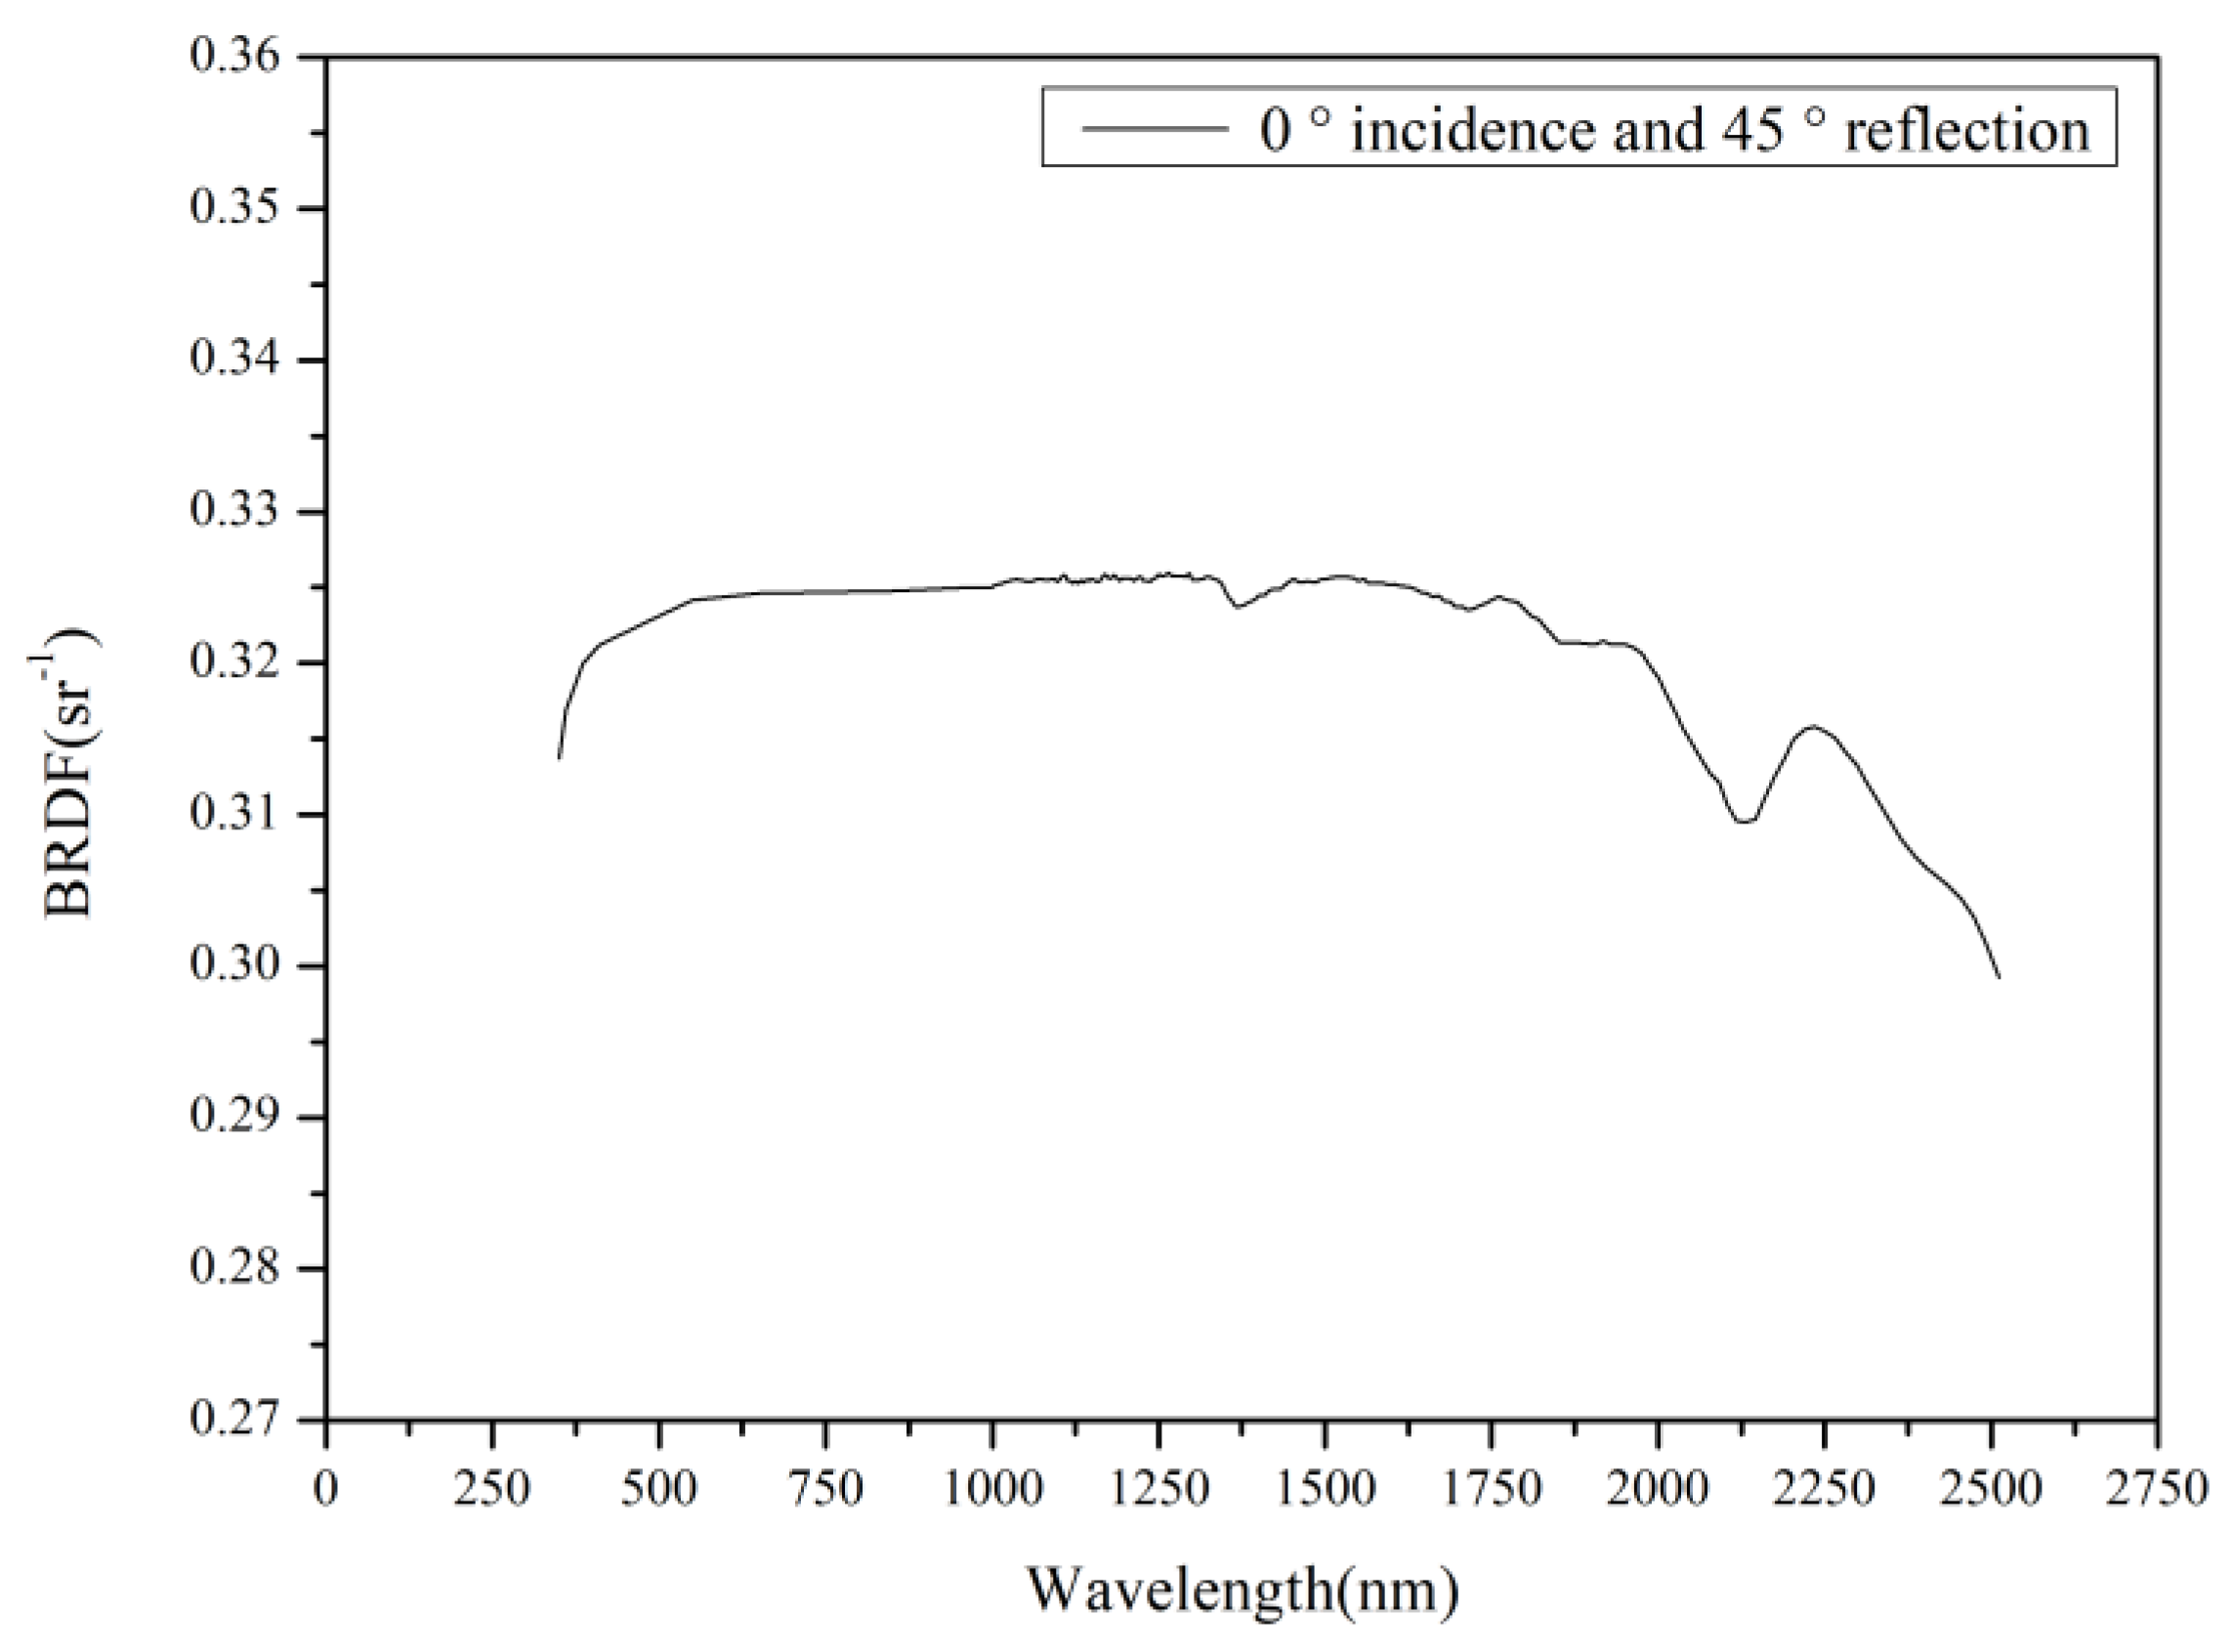
The SD BRDF at 0°/45° was measured in the range of 350 nm to 2400 nm. The results are shown in Figure 22.
With the angle of incidence or reflection fixed at 0°, the SD BRDF (at 650 nm) was measured, and the result is shown in Figure 23.
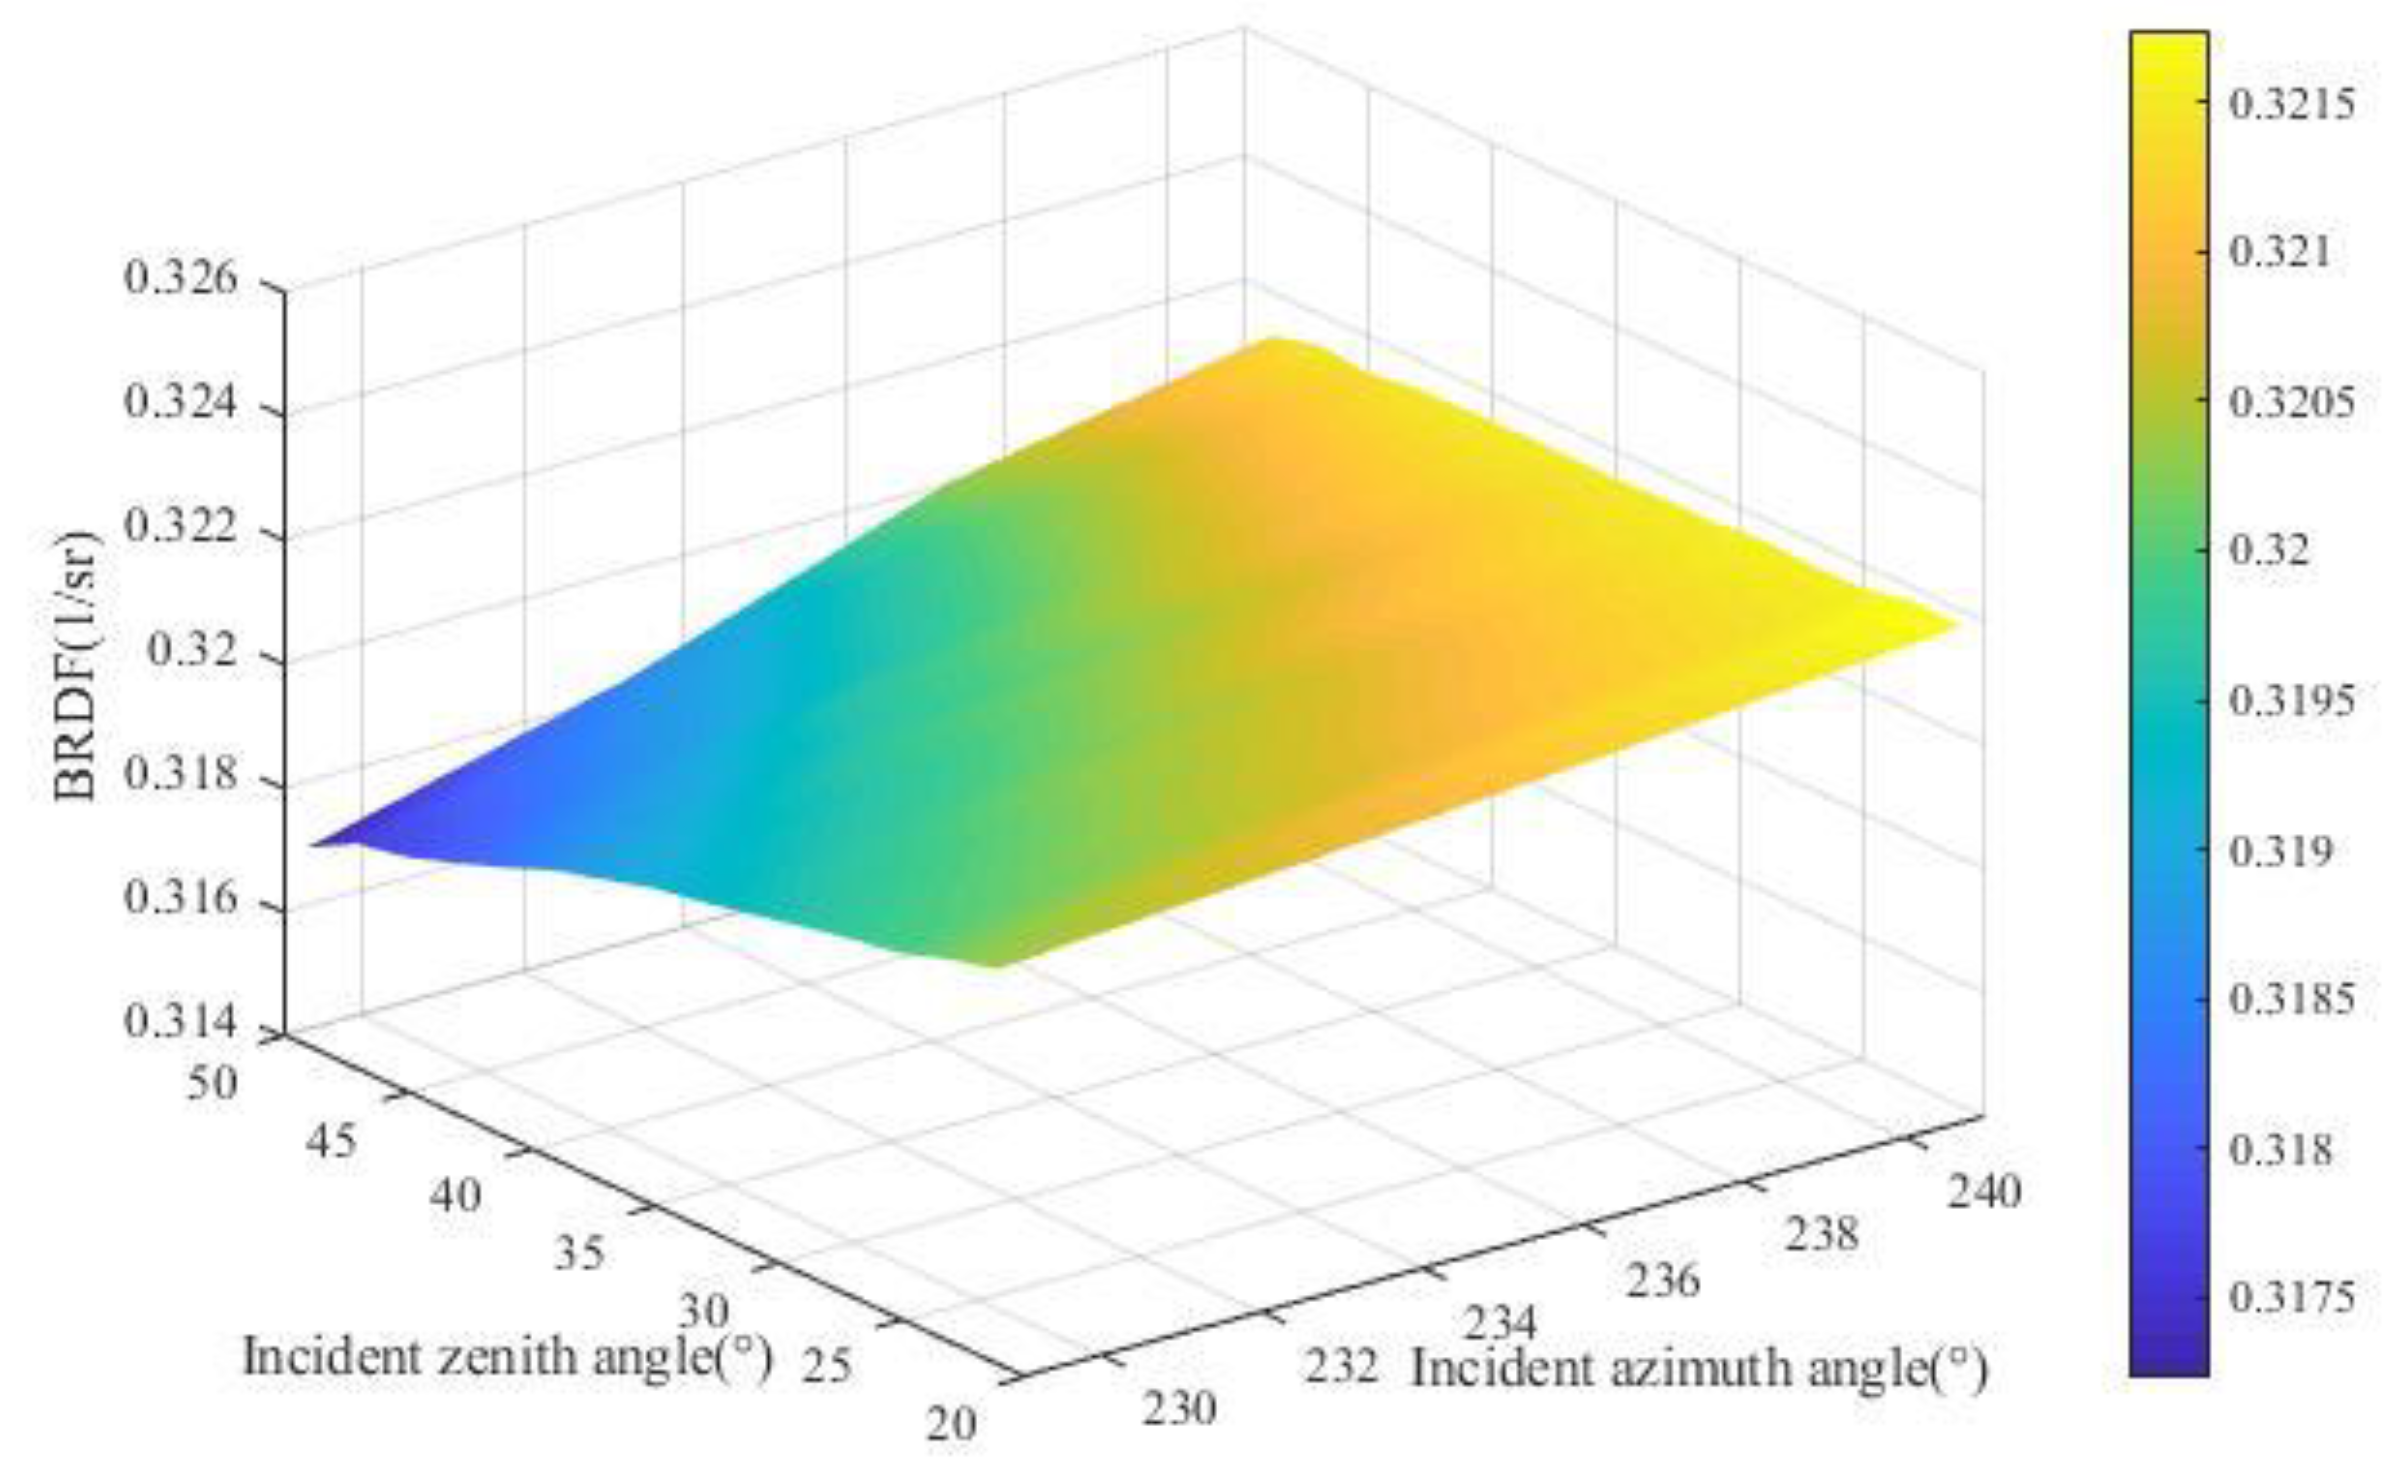
Some measurement results of the SD BRDF that were obtained using improved data processing based on the reciprocity theorem are shown in Figure 24. The angles of incidence and reflection come from the on-board calibration system in HY-1C.
7. Conclusions
Measurement of the SD BRDF at in- and out-of-plane and large angle geometries for on-board calibration is inevitable under the restrictions of the satellite orbit, the on-board calibration time, and other factors. An improved data processing method based on the reciprocity theorem to realize the SD BRDF at in- and out-of-plane and large angle geometries for on-board calibration in the solar reflective band was suggested. The results show that the measurement uncertainty (k = 2) was better than 1.04% at 350 nm to 410 nm, 0.60% at 410 nm to 480 nm, 0.43% at 480 nm to 1000 nm, and 0.86% at 1000 nm to 2400 nm.
Compared with the absolute measurement method, at 410 nm to 1000 nm, the measurement accuracy of the improved method was significantly improved, and the measurement uncertainty was reduced by ½. In the ultraviolet and near-infrared bands, improvement was limited because the improved method transferred the dependence of the uncertainty of the absolute measurement method on the angle to a dependence on the radiation detection accuracy. Similarly, this was the reason for the high uncertainty of measurement in the ultraviolet and near-infrared bands. Different lamps could be used to improve the incident radiation. We aim to explore this to improve the measurement accuracy of the reflected radiation in future work.
The literature [19] suggests that the effect of polarization on the measurement results may be negligible if the radiation source is an unpolarized source. However, some devices in the detection system, such as the grating monochromator, could be polarization-sensitive in the near infrared band, which may affect the measurement results. It is hoped that further research will be carried out in this area.
Author Contributions
Z.Z. was responsible for data analysis and writing the manuscript. H.C. led the experiment and participated in data processing. L.Z. contributed to the main research ideas. W.H. and X.Z. reviewed the manuscript and provided valuable suggestions. All authors have read and agreed to the published version of the manuscript.
Funding
Supported by the Instrument Developing Project of the Chinese Academy of Sciences, Grant No. YZ201125.
Data Availability Statement
Not applicable.
Acknowledgments
The authors thank Alfred Schirmacher for the comments and suggestions on this manuscript.
Conflicts of Interest
The authors declare no conflict of interest.
References
- Tansock, J.; Bancroft, D.; Butler, J.; Cao, C.; Datla, R.; Hansen, S.; Helder, D.; Kacker, R.; Latvakoski, H.; Mylnczak, M.; et al. Guidelines for Radiometric Calibration of Electro-Optical Instruments for Remote Sensing. 2015. Available online: https://nvlpubs.nist.gov/nistpubs/hb/2015/NIST.HB.157.pdf (accessed on 15 May 2023).
- Dinguirard, M.; Slater, P.N. Calibration of Space-Multispectral Imaging Sensors: A Review. Remote Sens. Environ. 1999, 68, 194–205. [Google Scholar] [CrossRef]
- Gu, X.F.; Tian, G.L.; Yu, T.; Li, X.; Gao, H.; Xie, Y. Principle and Method of Radiometric Calibration for Aerospace Optical Remote Sensor; Science Press: Beijing, China, 2013. [Google Scholar]
- Guenther, B.; Xiong, X.; Salomonson, V.; Barnes, W.; Young, J. On-orbit performance of the Earth Observing System Moderate Resolution Imaging Spectroradiometer; first year of data. Remote Sens. Environ. 2002, 83, 16–30. [Google Scholar] [CrossRef]
- Xiong, X.; Barnes, W. An overview of MODIS radiometric calibration and characterization. Adv. Atmos. Sci. 2006, 23, 69–79. [Google Scholar] [CrossRef]
- Xiong, X.; Sun, J.; Barnes, W.; Salomonson, V.; Esposito, J.; Erives, H.; Guenther, B. Multiyear On-Orbit Calibration and Performance of Terra MODIS Reflective Solar Bands. IEEE Trans. Geosci. Remote Sens. 2007, 45, 879–889. [Google Scholar] [CrossRef]
- Olij, C.; Schaarsberg, J.G.; Werij, H.G.; Zoutman, E.; Baudin, G.; Chommeloux, B.; Bezy, J.-L.; Gourmelon, G. Spectralon diffuser calibration for MERIS. In Proceedings of the SPIE 3221, Sensors, Systems, and Next-Generation Satellites, London, UK, 31 December 1997; pp. 63–74. [Google Scholar] [CrossRef]
- Sun, J.; Wang, M. VIIRS Reflective Solar Bands Calibration Progress and Its Impact on Ocean Color Products. Remote Sens. 2016, 8, 194. [Google Scholar] [CrossRef] [Green Version]
- Haas, E.; Moyer, D.; De Luccia, F.; Rausch, K.; Fulbright, J. VIIRS solar diffuser bidirectional reflectance distribution function (BRDF) degradation factor operational trending and update. In Proceedings of the Earth Observing Systems XVII, San Diego, CA, USA, 15 October 2012; Volume 8510, pp. 443–450. [Google Scholar]
- Renotte, E.; Novi, A.; Labate, D.; Melozzi, M.; Giunti, C.; Meynart, R. Solar diffuser preflight calibration set-up. In Proceedings of the Advanced and Next-Generation Satellites II, Taormina, Italy, 27 January 1997; Volume 2957, pp. 355–372. [Google Scholar]
- Xiong, X.J.; Angal, A.; Sun, J.; Choi, T.J.; Johnson, E. On-orbit performance of MODIS solar diffuser stability monitor. J. Appl. Remote Sens. 2014, 8, 083514. [Google Scholar] [CrossRef] [Green Version]
- Huang, W.X.; Zhang, L.M.; Si, X.L.; Xu, W.W.; Zou, P.; Wang, J.X.; Zhu, X.M. Design of solar diffuser degeneration monitor and its performance evaluation. Opt. Precis. Eng. 2016, 24, 732. [Google Scholar] [CrossRef]
- Patrick, H.J.; Zarobila, C.J.; Germer, T.A. The NIST Robotic Optical Scatter Instrument (ROSI) and its application to BRDF measurements of diffuse reflectance standards for remote sensing. In Proceedings of the Earth Observing Systems XVIII, San Diego, CA, USA, 23 September 2013; Volume 8866, pp. 364–375. [Google Scholar]
- Patrick, H.J.; Cooksey, C.C.; Germer, T.A.; Nadal, M.E.; Zarobila, C.J. Bidirectional reflectance capabilities of the NIST Robotic Optical Scattering Instrument. Appl. Opt. 2021, 60, 8774–8786. [Google Scholar] [CrossRef] [PubMed]
- Hünerhoff, D.; Grusemann, U.; Höpe, A. New robot-based gonioreflectometer for measuring spectral diffuse reflection. Metrologia 2006, 43, S11. [Google Scholar] [CrossRef] [Green Version]
- Holopainen, S.; Manoocheri, F.; Ikonen, E.; Hauer, K.-O.; Höpe, A. Comparison measurements of 0:45 radiance fac-tor and goniometrically determined diffuse reflectance. Appl. Opt. 2009, 48, 2946–2956. [Google Scholar] [CrossRef] [PubMed] [Green Version]
- Bernad, B.; Ferrero, A.; Strothkämper, C.; Campos, J.; Pons, A.; Quast, T.; Hauer, K.-O.; Schirmacher, A. Deviation of white diffuse reflectance standards from perfect reflecting diffuser at visible and near-infrared spectral ranges. Metrologia 2019, 56, 055005. [Google Scholar] [CrossRef]
- Baribeau, R.; Neil, W.S.; Côté, E. Development of a robot-based gonioreflectometer for spectral BRDF measurement. J. Mod. Opt. 2009, 56, 1497–1503. [Google Scholar] [CrossRef]
- Rabal, A.M.; Ferrero, A.; Campos, J.; Fontecha, J.L.; Pons, A.; Rubiño, A.M.; Corróns, A. Automatic gonio-spectrophotometer for the absolute measurement of the spectral BRDF at in- out-of-plane and retroreflection geometries. Metrologia 2012, 49, 213–223. [Google Scholar] [CrossRef]
- Zeng, J.; Butler, J.J.; Xiong, X. Comparison of BRDF results from two different scatterometers for instrument validation in support of satellite instrumentation. In Proceedings of the Earth Observing Systems XXVII, San Diego, CA, USA, 30 September 2022; Volume 12232, pp. 9–18. [Google Scholar]
- Murgai, V.; Johnson, L.; Moskun, E.M. BRDF Characterization of Solar Diffuser for JPSS J1 using PASCAL. In Proceedings of the Earth Observing Systems XIX, San Diego, CA, USA, 2 October 2014; Volume 9218, pp. 346–355. [Google Scholar]
- Georgiev, G.T.; Butler, J.J. The effect of incident light polarization on Spectralon BRDF measurements. In Proceedings of the Sensors, Systems, and Next-Generation Satellites VIII, Maspalomas, CI, USA, 4 November 2004; Volume 5570, pp. 492–502. [Google Scholar]
- Guzman, C.T.; Palmer, J.M.; Slater, P.N.; Bruegge, C.J.; Miller, E.A. Requirements of a solar diffuser and measurements of some candidate materials. In Proceedings of the Calibration of Passive Remote Observing Optical and Microwave Instrumentation, Orlando, FL, USA, 1 August 1991; Volume 1493, pp. 120–131. [Google Scholar]
- Nicodemus, F.E.; Richmond, J.C.; Hsia, J.J.; Ginsberg, I.W.; Limperis, T. Geometrical Considerations and Nomenclature for Reflectance; Final Report National Bureau of Standards 1977; US Department of Commerce, National Bureau of Standards: Washington, DC, USA, 1977. [Google Scholar] [CrossRef]
- Bruker. The Flyer of VERTEX80. Available online: https://www.bruker.com/en/products-and-solutions/infrared-and-raman/ft-ir-research-spectrometers/vertex-research-ft-ir-spectrometer/vertex-80-80v-ft-ir-spectrometer/_jcr_content/root/sections/more_information/sectionpar/search.download-asset.pdf/7670882f-08ac-4fa2-9fb4-86ffa5764a69/VERTEX80_Flyer_EN.pdf (accessed on 16 May 2023).
- Guzman, C.T.; Palmer, J.M.; Slater, P.N.; Bruegge, C.J.; Miller, E.A. Calibration method of BRDF absolute measurement device based on six axis robot. Chin. J. Quantum Electron. 2022, 39, 707–719. [Google Scholar]
- Shin, D.-J.; Park, S.; Jeong, K.-L.; Park, S.-N.; Lee, D.-H. High-accuracy measurement of linearity of optical detectors based on flux addition of LEDs in an integrating sphere. Metrologia 2013, 51, 25–32. [Google Scholar] [CrossRef]
- Yoshida, Y.; Kikuchi, N.; Yokota, T. On-orbit radiometric calibration of SWIR bands of TANSO-FTS onboard GOSAT. Atmos. Meas. Tech. 2012, 5, 2515–2523. [Google Scholar] [CrossRef] [Green Version]
- Taylor, B.N.; Kuyatt, C.E. Guidelines for Evaluating and Expressing the Uncertainty of NIST Measurement Results. Rev. Diane Publishing. 2009. Available online: https://www.nist.gov/pml/nist-technical-note-1297 (accessed on 15 February 2023).
- Liu, H.; Chen, H.; Si, X.; Zhang, L. Linear Calibration of Wide Dynamic Range Response of Silicon Detectors Based on Double LEDs Light Source Integrating Sphere. Acta Opt. Sin. 2017, 37, 0904001. [Google Scholar] [CrossRef]
- Barnes, P.Y.; Early, E.A.; Parr, A.C. Spectral reflectance. NIST Spec. Publ. 1998. [Google Scholar] [CrossRef]
Figure 1.
Geometry of incident and reflected beams.

Figure 2.
Absolute BRDF measurement facility.
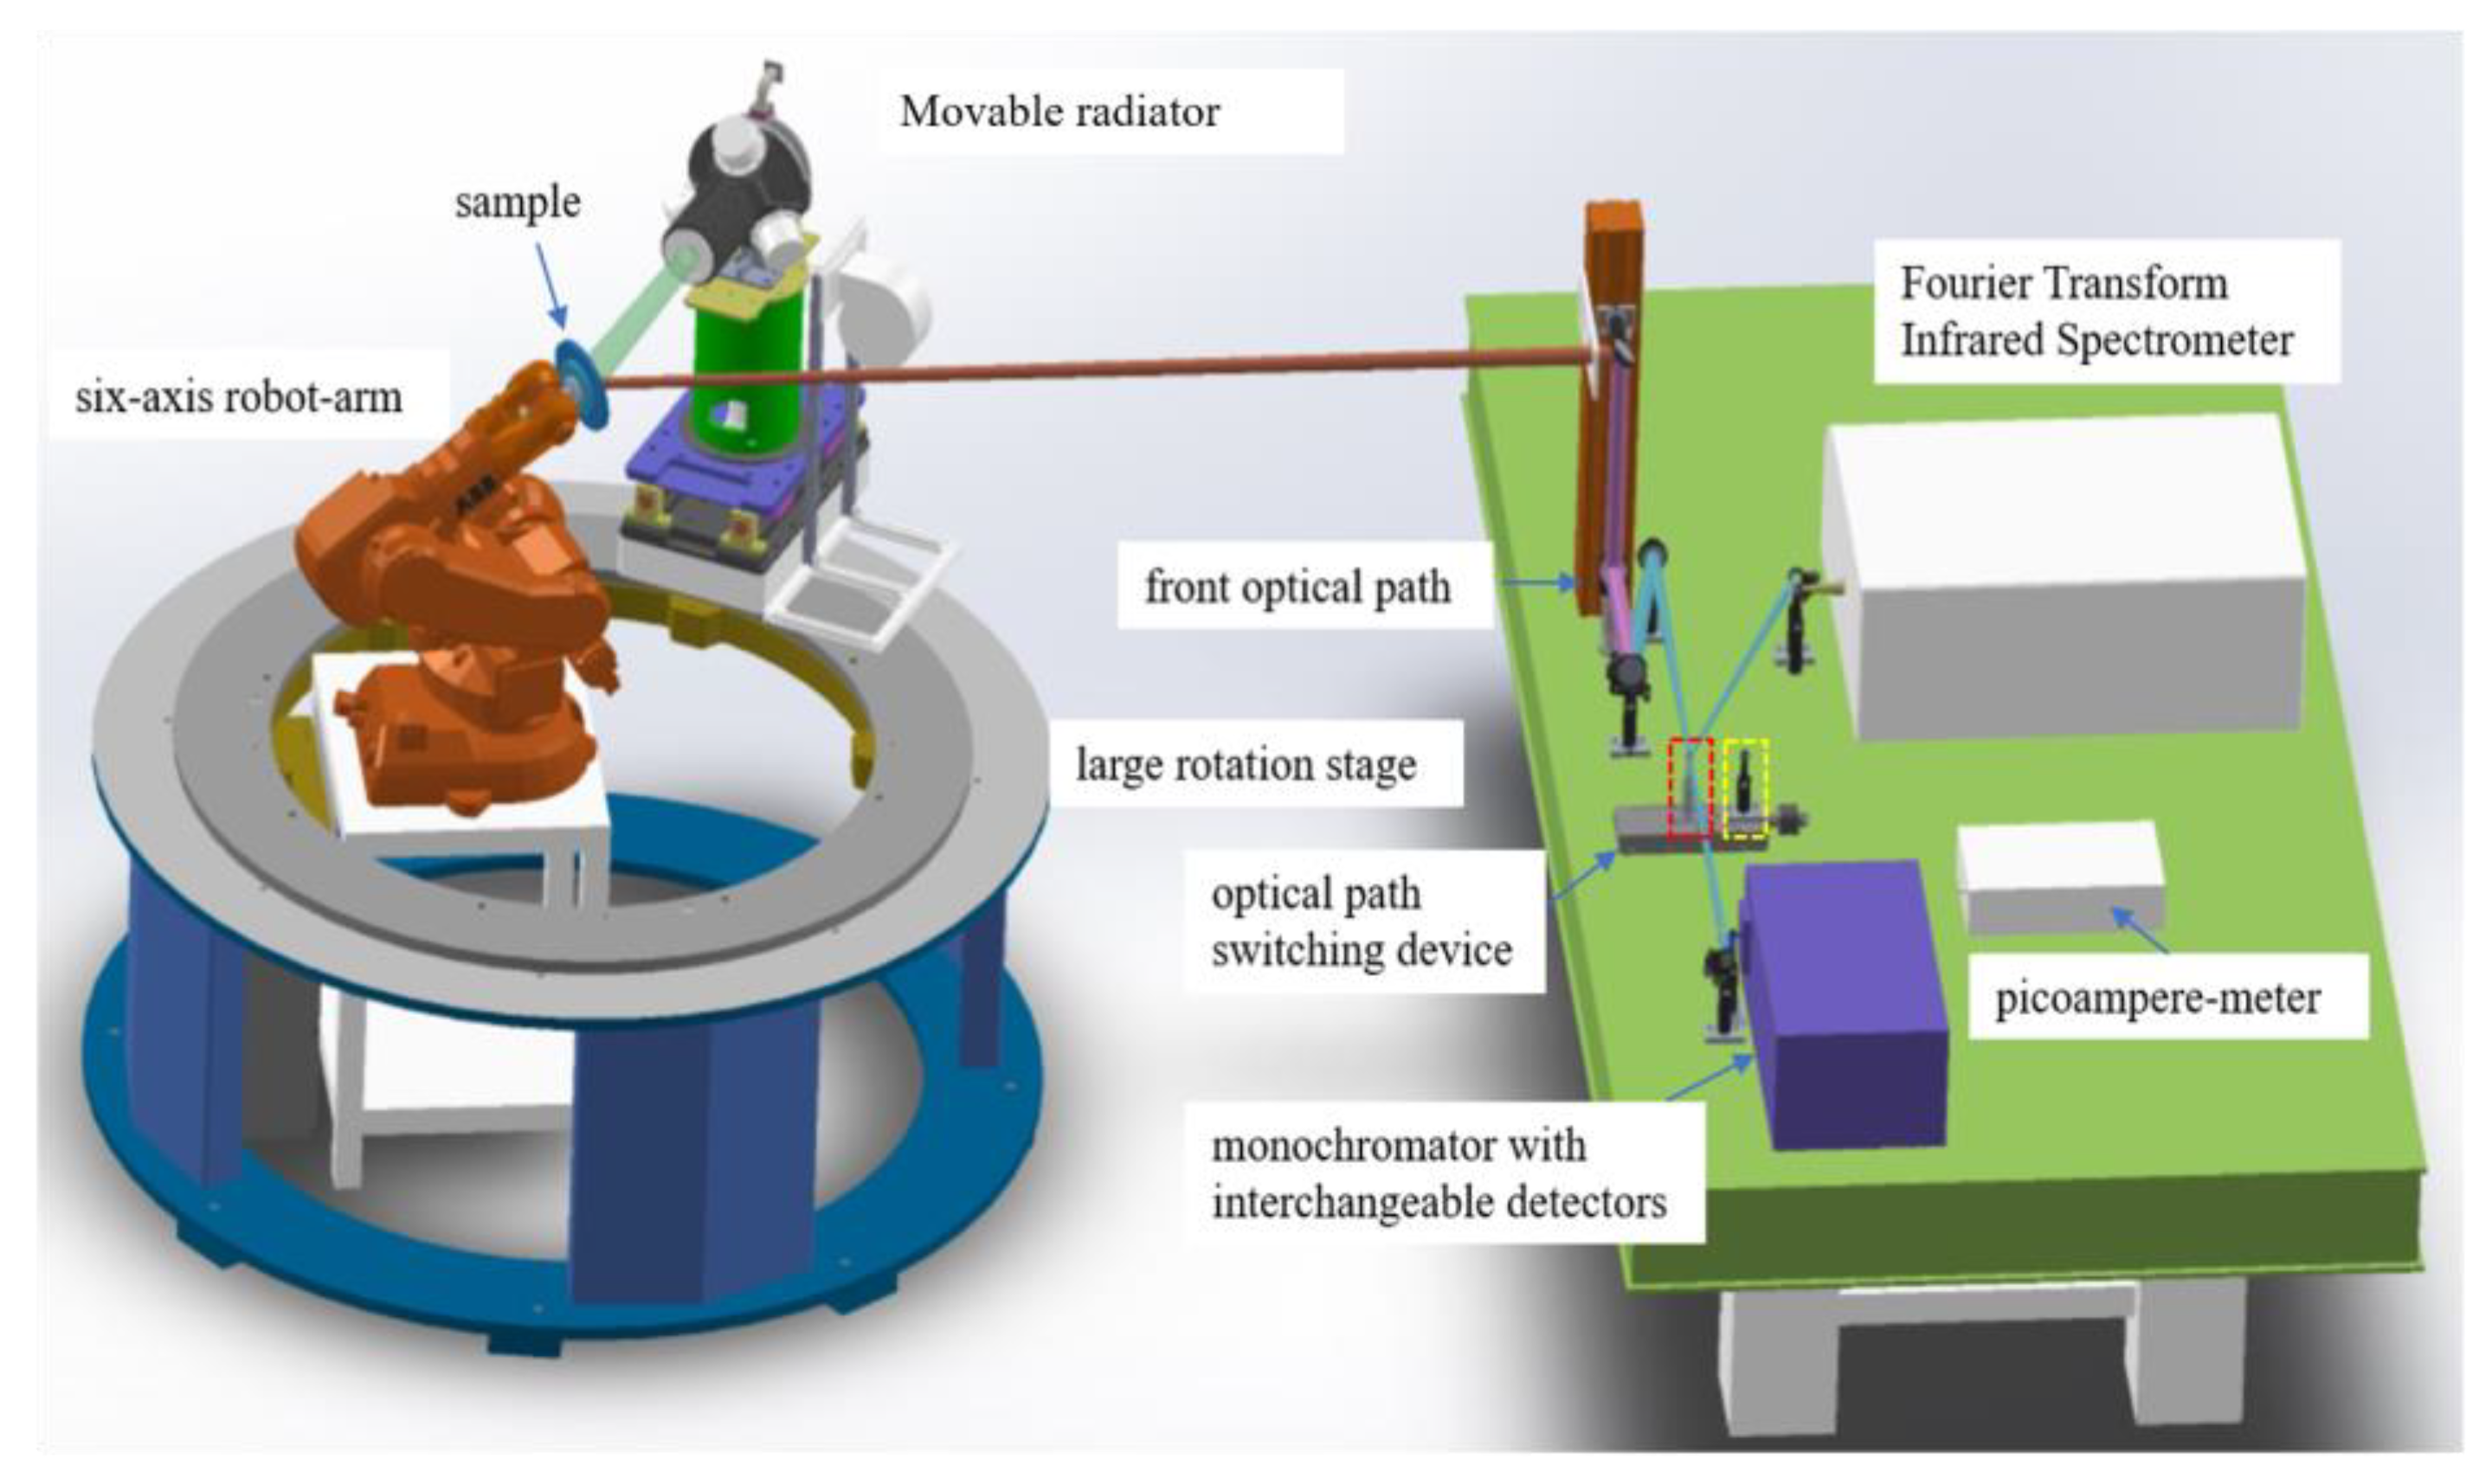
Figure 3.
Integrating sphere radiator.

Figure 4.
Stability test results of the sphere radiator.

Figure 5.
Goniometer system.

Figure 6.
Optical path diagram of the detection system.

Figure 7.
(a) Principle of measuring the beam. (b) Principle of determining the rotation axis by measuring the beam.
Figure 7.
(a) Principle of measuring the beam. (b) Principle of determining the rotation axis by measuring the beam.
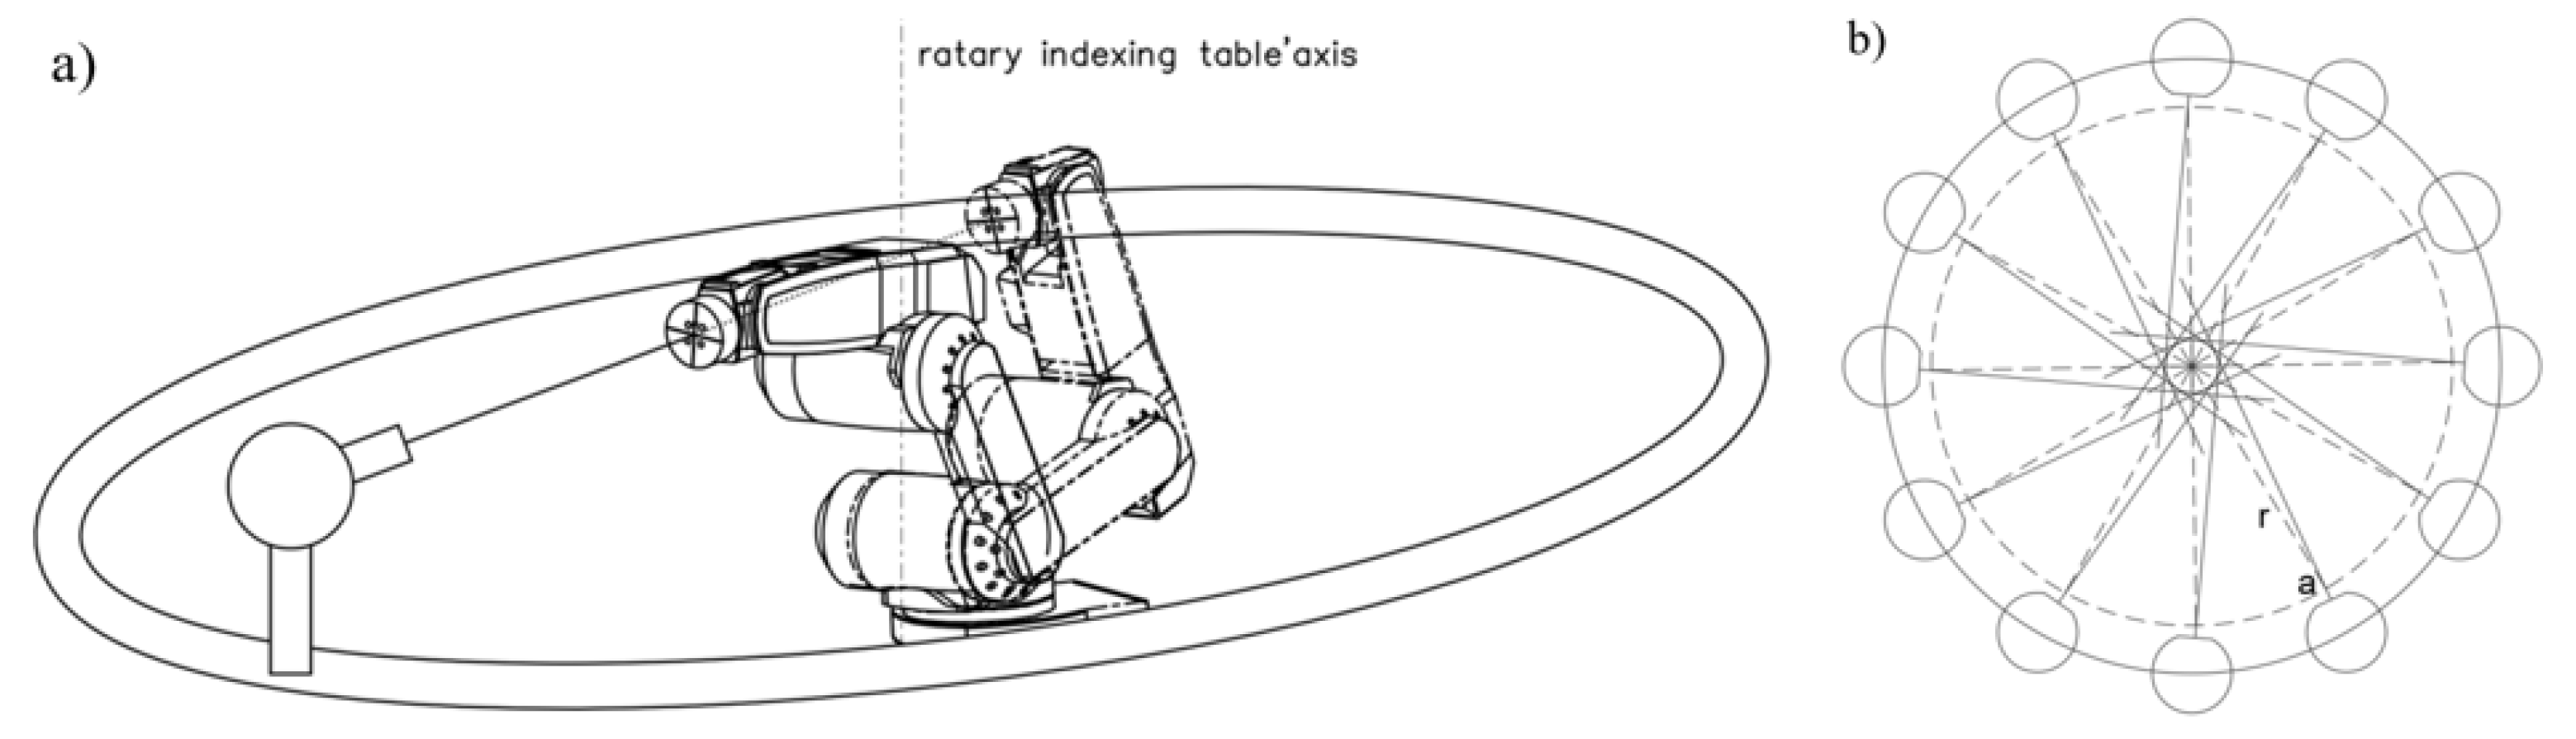
Figure 8.
(a) Rotating the radiation source counterclockwise and collecting the reflected radiation. (b) Rotating the radiation source clockwise and collecting the reflected radiation.
Figure 8.
(a) Rotating the radiation source counterclockwise and collecting the reflected radiation. (b) Rotating the radiation source clockwise and collecting the reflected radiation.
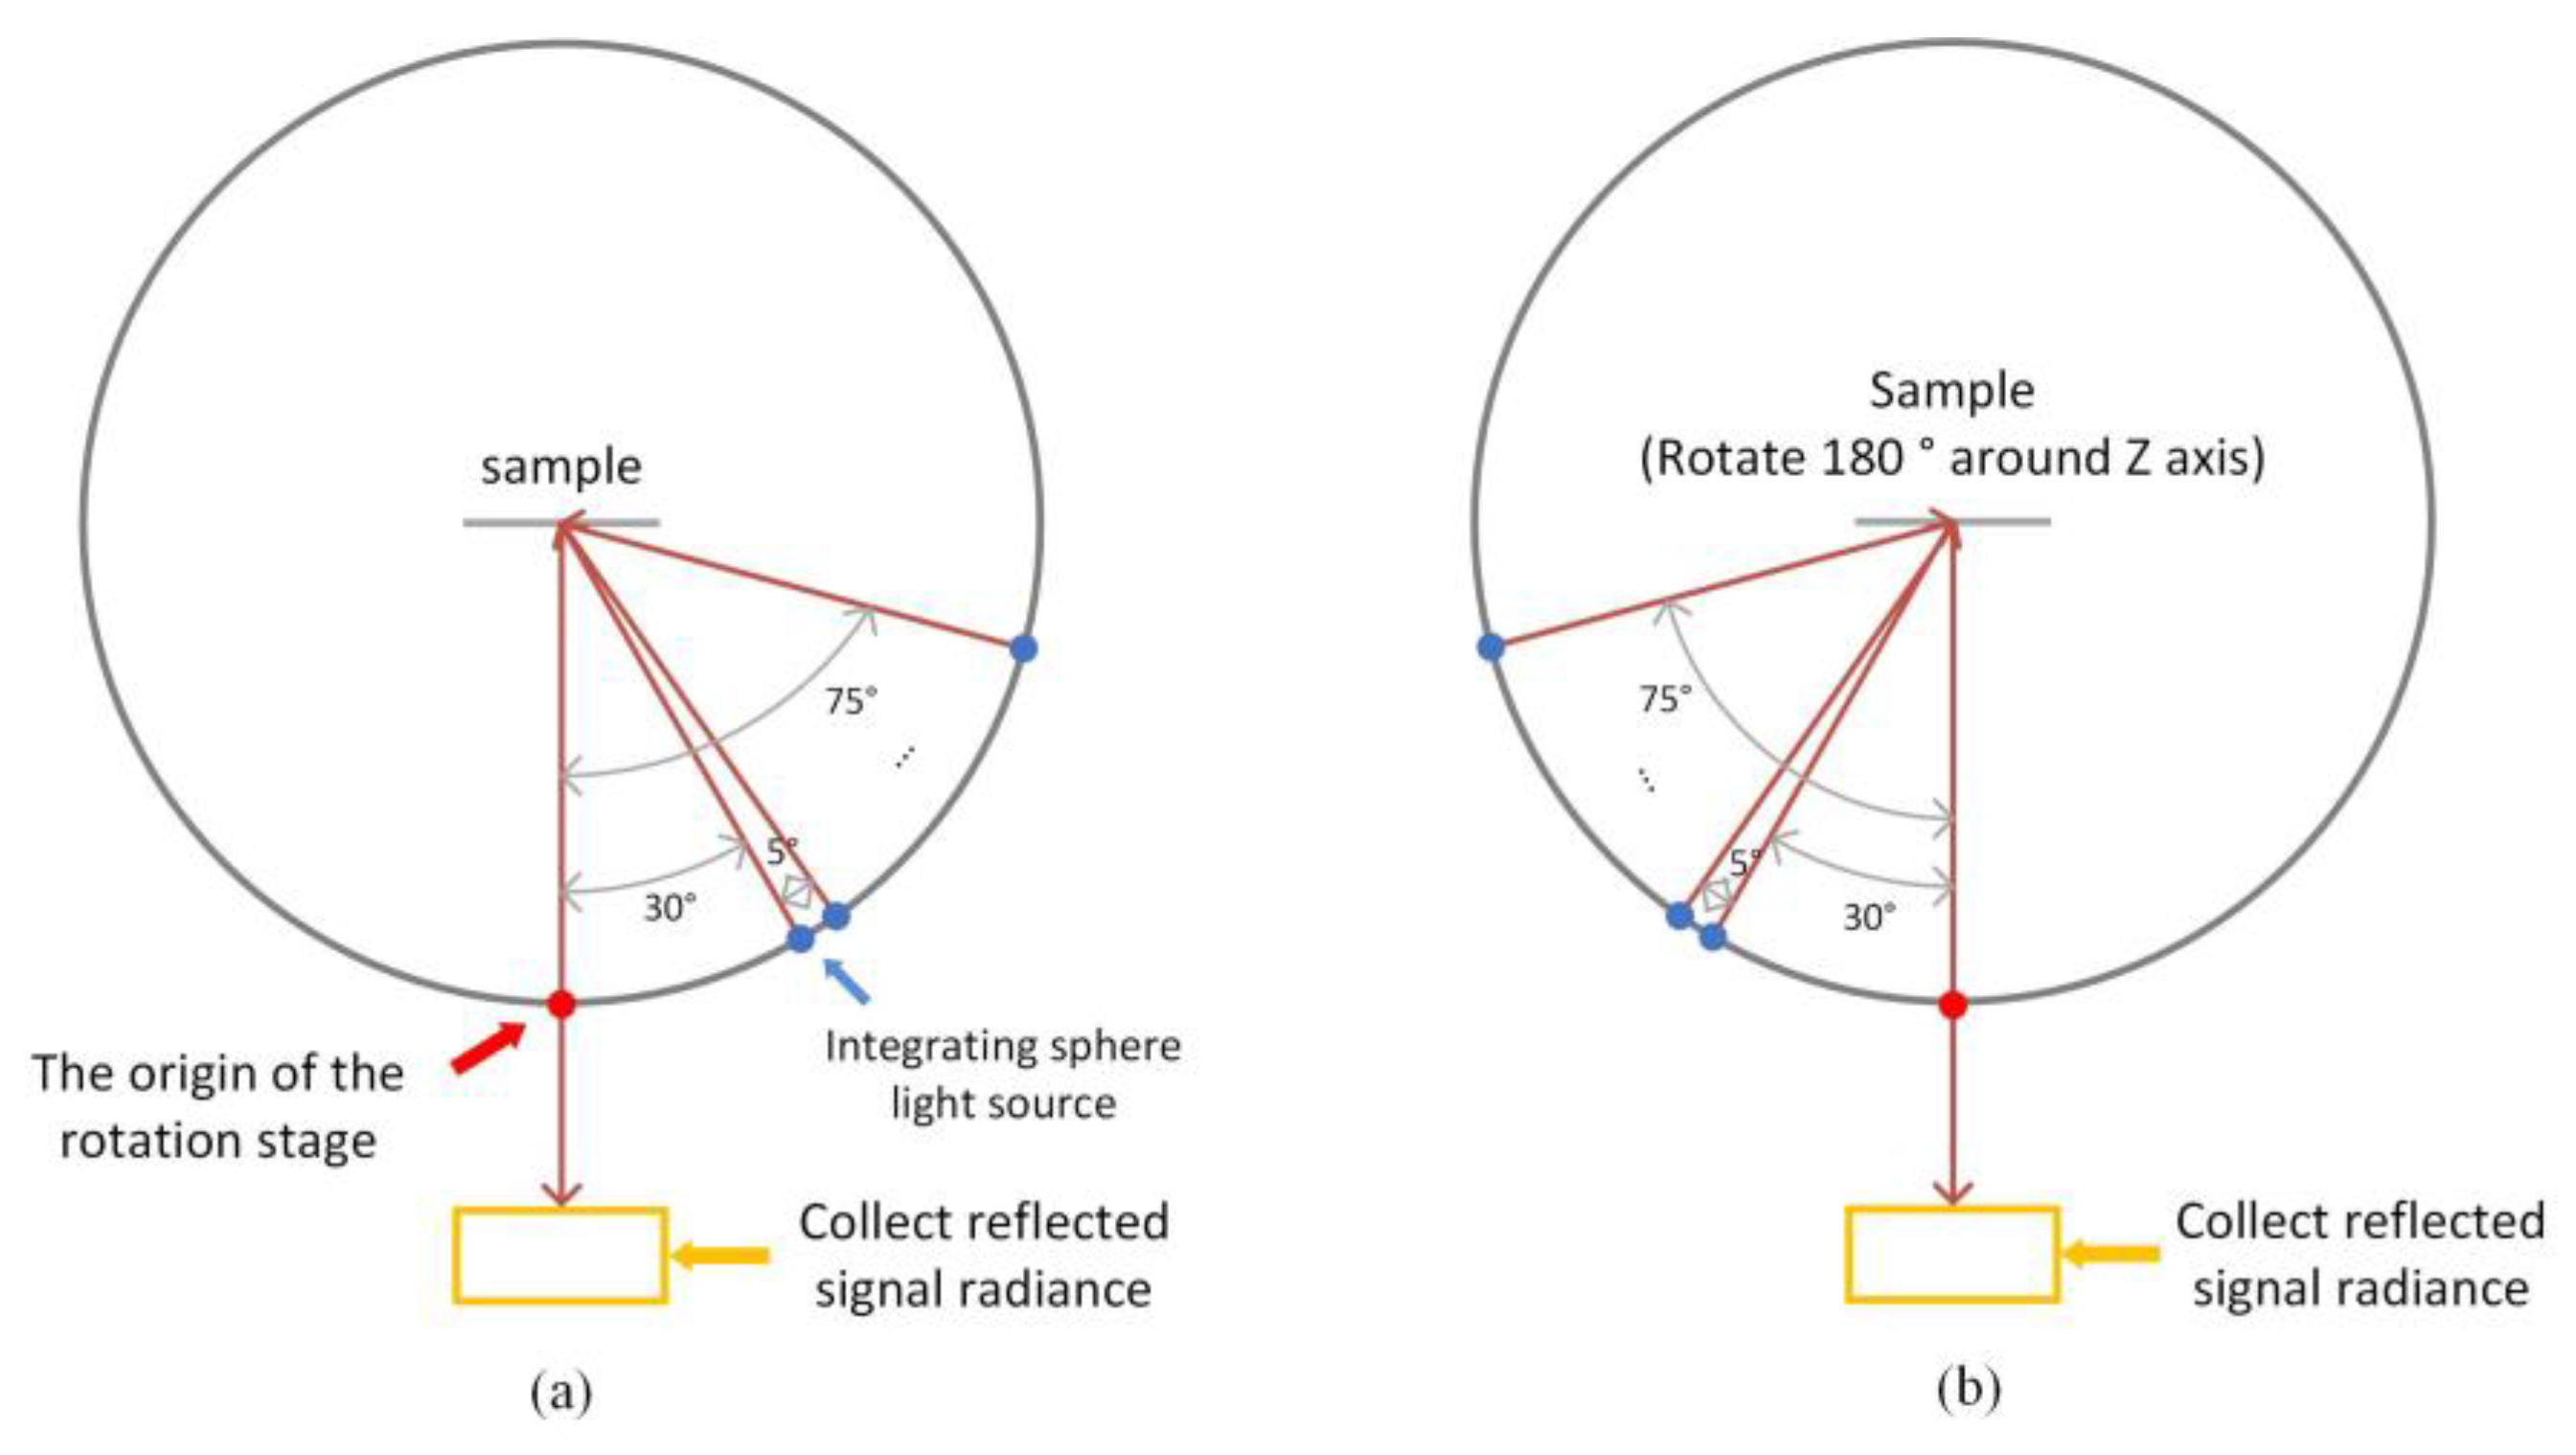
Figure 9.
Reflected radiation at different incident angles of the incident after correction.

Figure 10.
(a) Determining the origin of the coordinate paper. (b) Specular reflection test.

Figure 11.
Measurement of reflected spot position data based on mirror reflection (incident angles are marked beside the points).
Figure 11.
Measurement of reflected spot position data based on mirror reflection (incident angles are marked beside the points).

Figure 12.
Measurement results for detector nonlinearity.

Figure 13.
(a) Measurement of the radiation of the radiation source. (b) Measurement of the reflected radiation of the sample.
Figure 13.
(a) Measurement of the radiation of the radiation source. (b) Measurement of the reflected radiation of the sample.

Figure 14.
Schematic diagram of the on-board calibration time.

Figure 15.
Relative uncertainty component associated with the incident angle.

Figure 16.
Measurement process of improved data processing method.

Figure 17.
(a) Measuring the distance from the integrating sphere opening to the sample surface. (b) Measuring the area of the light opening.
Figure 17.
(a) Measuring the distance from the integrating sphere opening to the sample surface. (b) Measuring the area of the light opening.

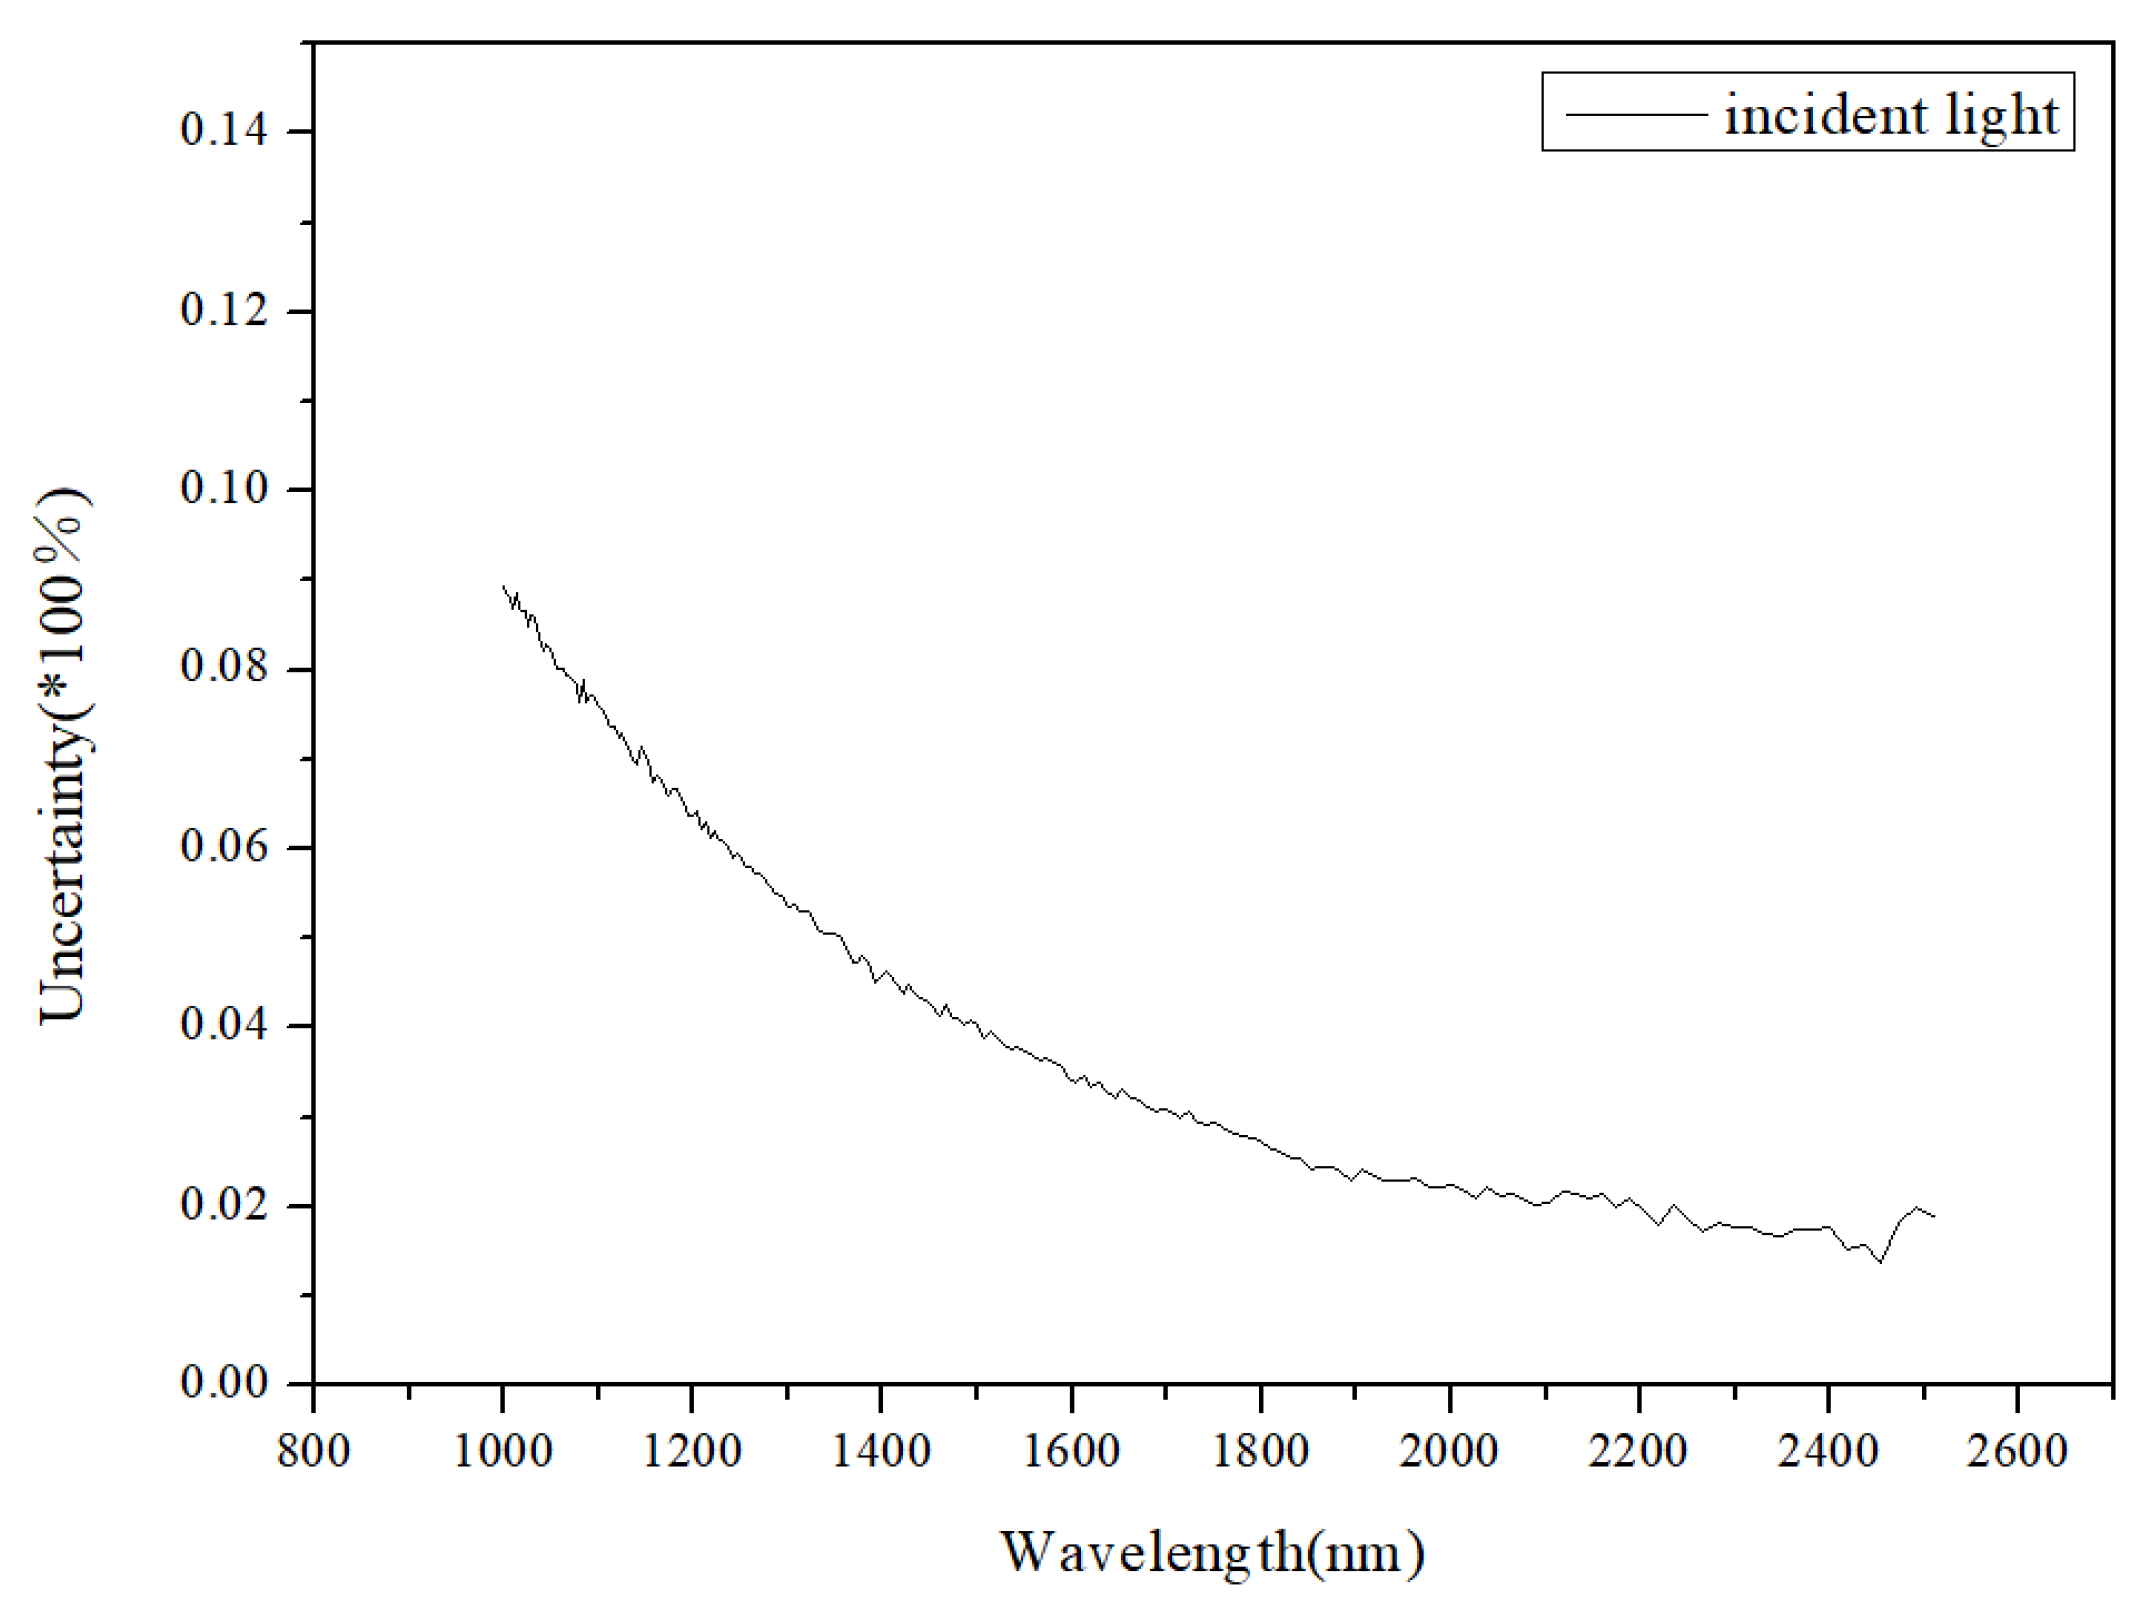
Figure 18.
Uncertainty (k = 1) of the incident radiation of the FTIR spectrometer.

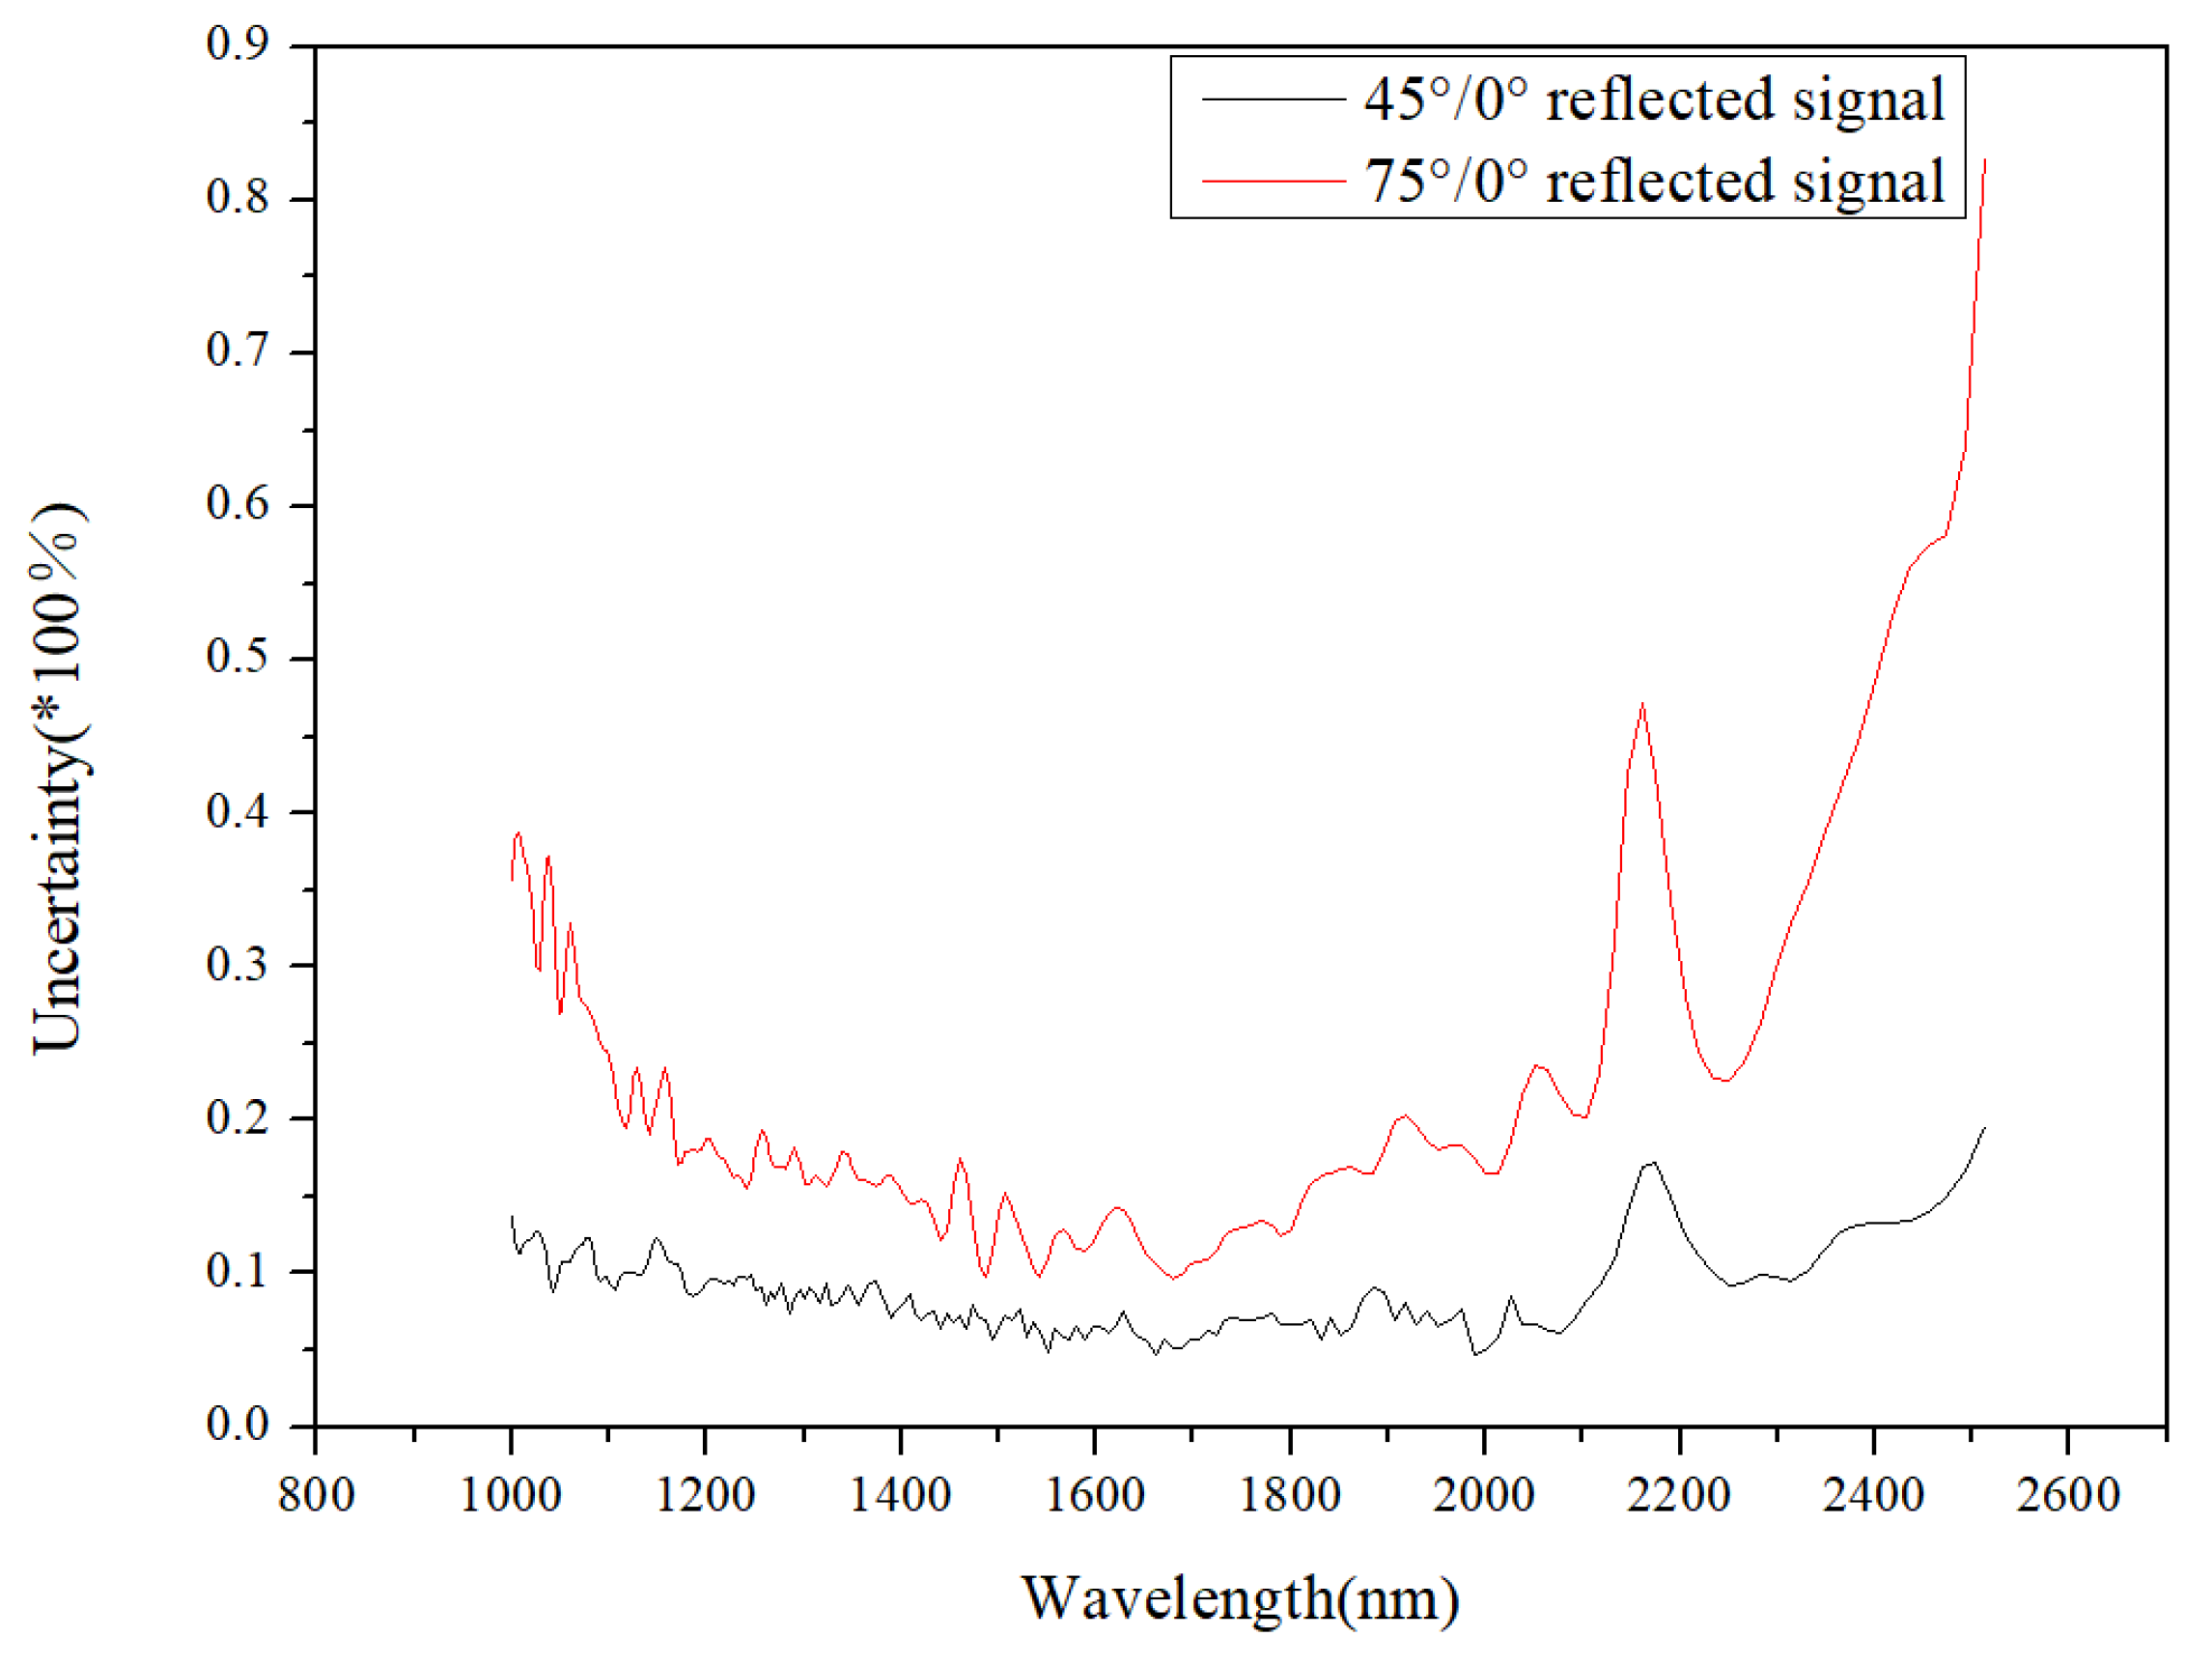
Figure 19.
Uncertainty (k = 1) of the reflected radiation of the FTIR spectrometer at 0° reflection.
Figure 19.
Uncertainty (k = 1) of the reflected radiation of the FTIR spectrometer at 0° reflection.

Figure 20.
Uncertainty (k = 1) of the reflected radiation of the FTIR spectrometer at 0° incidence.

Figure 21.
Uncertainty (k = 2) of the two methods at a 75° incident angle.

Figure 22.
SD BRDF at 0°/45°.

Figure 23.
(a) SD BRDF for different reflected angles at 0° incidence. (b) SD BRDF for different incident angles at 0° reflection.
Figure 23.
(a) SD BRDF for different reflected angles at 0° incidence. (b) SD BRDF for different incident angles at 0° reflection.
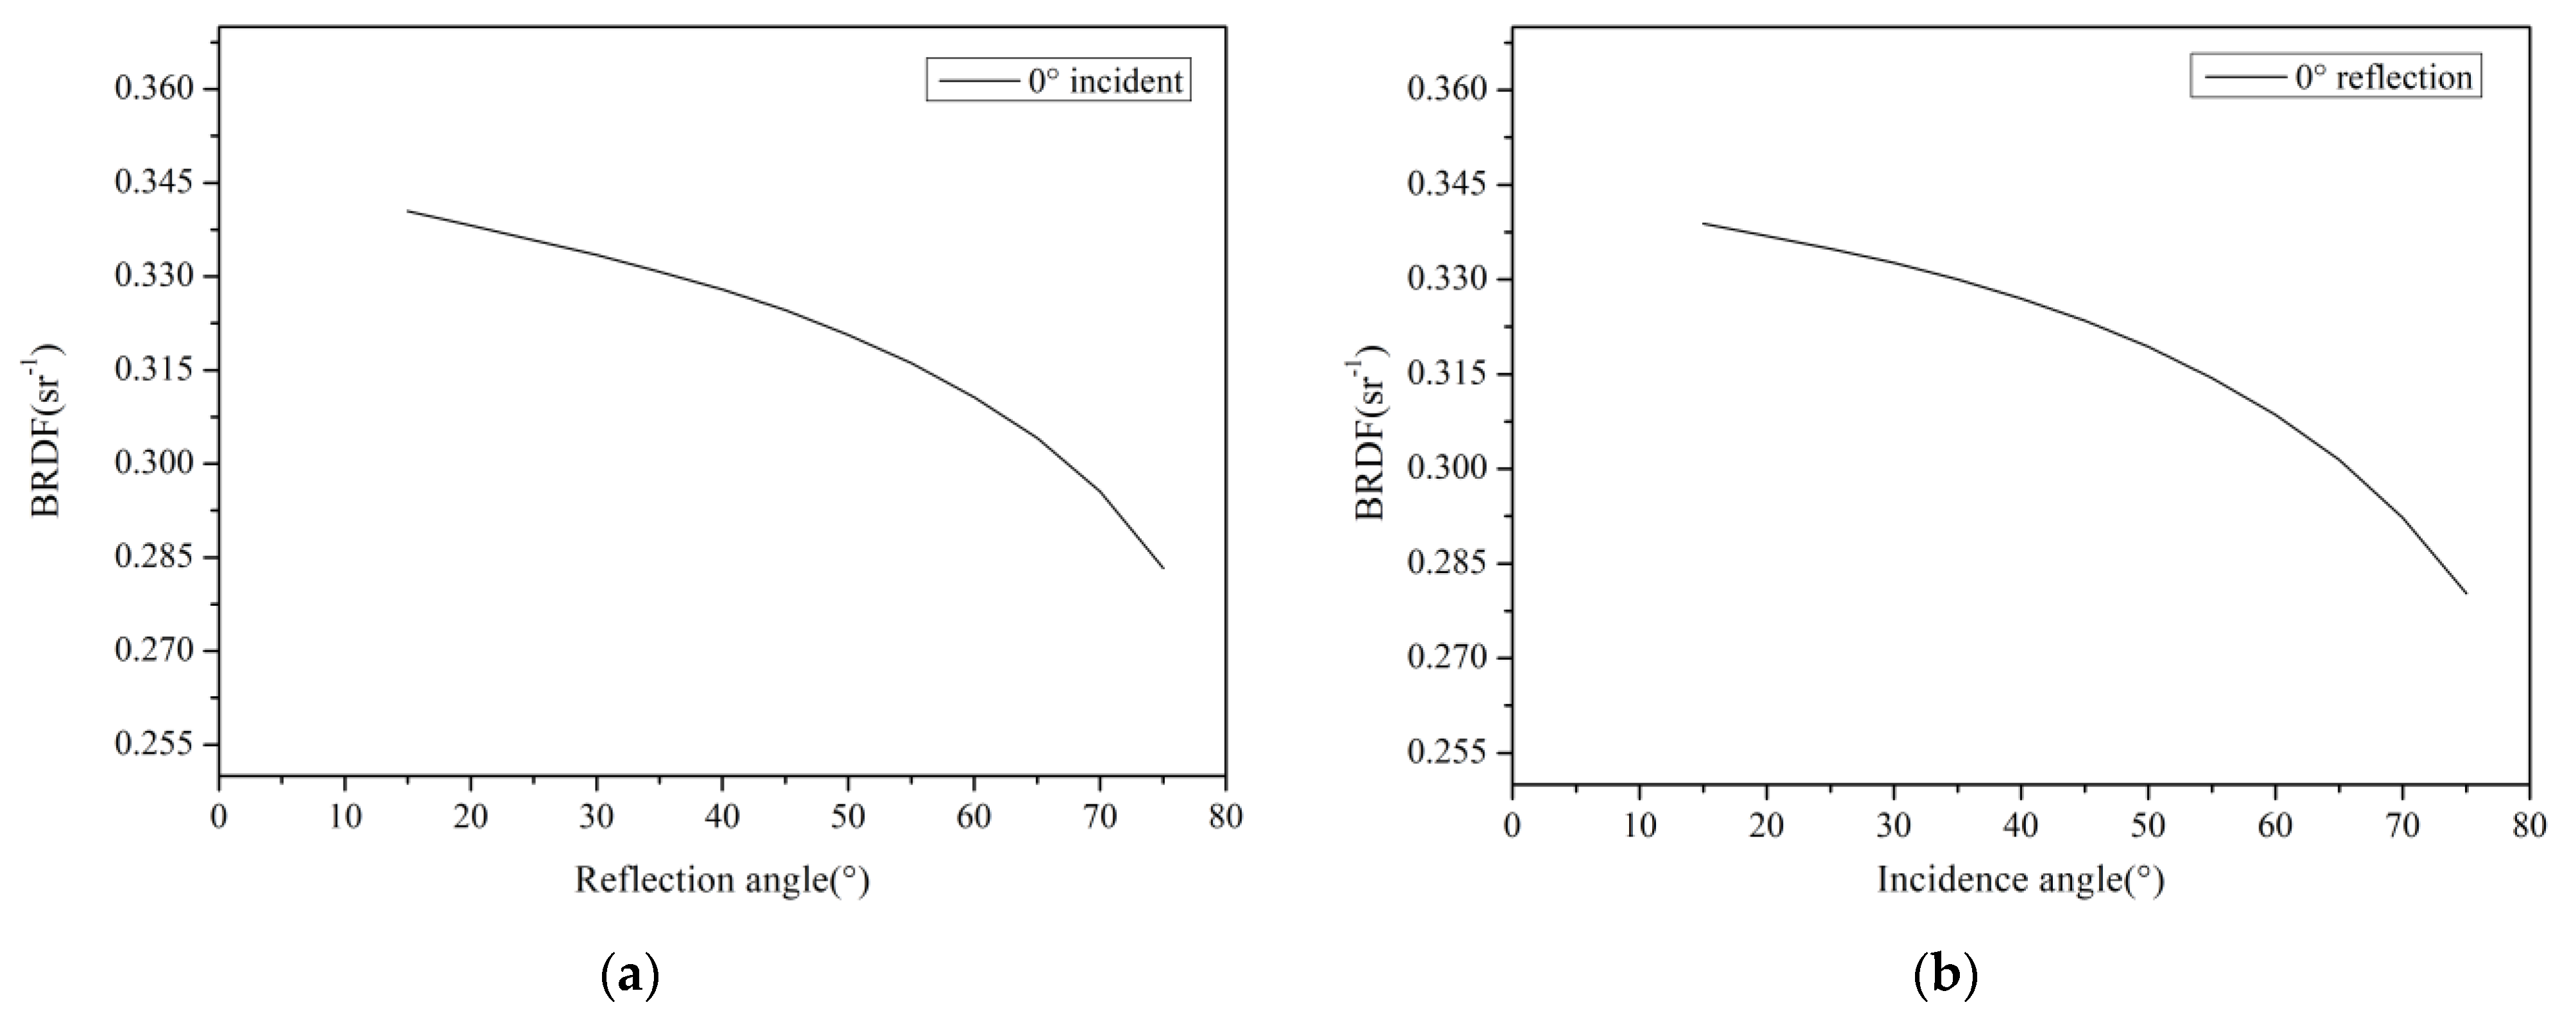
Figure 24.
SD BRDF for different incident azimuth angles and incident zenith angles when the reflection zenith angle was 41.4° and azimuth angle was 117° at 565 nm.
Figure 24.
SD BRDF for different incident azimuth angles and incident zenith angles when the reflection zenith angle was 41.4° and azimuth angle was 117° at 565 nm.

Table 1.
Angle ranges for BRDF measurement.
| Angle Parameter | Range (°) | Notes |
|---|---|---|
| Incident zenith angle () | 0–75 | Due to obstruction of the radiation source, the angle between the incident and reflected rays is greater than 10° |
| Incident azimuth angle () | 0–360 | |
| Reflection zenith angle () | 0–75 | |
| Reflection azimuth angle () | 0–360 |
Table 2.
Uncertainty (k = 1) of the incident radiation of the detectors.
| Incident Angle | Detector | |||
|---|---|---|---|---|
| Si | InGaAs | |||
| 350–410 nm | 410–480 nm | 480–1000 nm | 1000–1600 nm | |
| 0° | <0.01% | <0.01% | <0.01% | <0.01% |
Table 3.
Uncertainty (k = 1) of the SD reflected radiation of the detectors at 0° reflection.
| Incident Zenith Angle | Detector | |||
|---|---|---|---|---|
| Si | InGaAs | |||
| 350–410 nm | 410–480 nm | 480–1000 nm | 1000–1600 nm | |
| 15° | 0.10% | 0.03% | 0.01% | 0.04% |
| 30° | 0.12% | 0.04% | 0.02% | 0.05% |
| 45° | 0.16% | 0.05% | 0.02% | 0.05% |
| 60° | 0.22% | 0.07% | 0.02% | 0.06% |
| 75° | 0.31% | 0.15% | 0.04% | 0.16% |
Table 4.
Uncertainty (k = 1) of the SD reflected radiation of the detectors at 0° incident.
| Incident Zenith Angle | Detector | |||
|---|---|---|---|---|
| Si | InGaAs | |||
| 350–410 nm | 410–480 nm | 480–1000 nm | 1000–1600 nm | |
| 15° | 0.10% | 0.02% | 0.01% | 0.02% |
| 30° | 0.11% | 0.03% | 0.01% | 0.03% |
| 45° | 0.11% | 0.03% | 0.01% | 0.03% |
| 60° | 0.11% | 0.04% | 0.01% | 0.04% |
| 75° | 0.12% | 0.04% | 0.01% | 0.04% |
Table 5.
Absolute measurement uncertainty (k = 2) of the SD BRDF at 0°/45°.
| Component of Uncertainty | Type | Relative Uncertainty (%) |
|---|---|---|
| Distance | A | 0.166% |
| Aperture area | A | 0.096% |
| Source stability | A | 0.03% |
| Detector linearity | B | 0.066%(350–1000 nm) |
| 0.04%(1000–2500 nm) | ||
| Wavelength | B | <0.01% |
| Rotation angle | B | <0.01% |
| Incident radiation | A | <0.01% |
| Reflected radiation | A | 0.22% (350–410 nm) |
| 0.06% (410–480 nm) | ||
| 0.02% (480–1000 nm) | ||
| 0.24% (1000–2500 nm) | ||
| Scaling factor | B | 0.056% (1000–2500 nm) |
| Stray light | B | 0.2% |
| Total | 0.36% (350–410 nm) | |
| 0.29% (410–480 nm) | ||
| 0.29% (480–1000 nm) | ||
| 0.37% (1000–2500 nm) |
Table 6.
Uncertainty (k = 2) of measurement of the SD BRDF using the improved method.
| Component of Uncertainty | Relative Uncertainty (k = 2) (×100%) | |||
|---|---|---|---|---|
| 350–410 nm | 410–480 nm | 480–1000 nm | 1000–2500 nm | |
| 0.62 | 0.30 | 0.08 | 0.45 | |
| 0.62 | 0.30 | 0.08 | 0.45 | |
| 0.22 | 0.06 | 0.02 | 0.24 | |
| 0.22 | 0.06 | 0.02 | 0.24 | |
| 0.36 | 0.29 | 0.29 | 0.37 | |
| 0.30 | 0.30 | 0.30 | 0.30 | |
| Total | 1.04 | 0.60 | 0.43 | 0.86 |
Disclaimer/Publisher’s Note: The statements, opinions and data contained in all publications are solely those of the individual author(s) and contributor(s) and not of MDPI and/or the editor(s). MDPI and/or the editor(s) disclaim responsibility for any injury to people or property resulting from any ideas, methods, instructions or products referred to in the content. |
© 2023 by the authors. Licensee MDPI, Basel, Switzerland. This article is an open access article distributed under the terms and conditions of the Creative Commons Attribution (CC BY) license (https://creativecommons.org/licenses/by/4.0/).
Share and Cite
MDPI and ACS Style
Zhang, Z.; Chen, H.; Huang, W.; Zheng, X.; Zhang, L. High Accuracy Solar Diffuser BRDF Measurement for On-Board Calibration in the Solar Reflective Band. Remote Sens. 2023, 15, 3783. https://doi.org/10.3390/rs15153783
AMA Style
Zhang Z, Chen H, Huang W, Zheng X, Zhang L. High Accuracy Solar Diffuser BRDF Measurement for On-Board Calibration in the Solar Reflective Band. Remote Sensing. 2023; 15(15):3783. https://doi.org/10.3390/rs15153783
Chicago/Turabian StyleZhang, Zhiyuan, Hongyao Chen, Wenxin Huang, Xiaobing Zheng, and Liming Zhang. 2023. "High Accuracy Solar Diffuser BRDF Measurement for On-Board Calibration in the Solar Reflective Band" Remote Sensing 15, no. 15: 3783. https://doi.org/10.3390/rs15153783
Note that from the first issue of 2016, this journal uses article numbers instead of page numbers. See further details here.