Technical Note

Chaotic Coding for Interference Suppression of Digital Ionosonde

1
Key Laboratory of Microwave Remote Sensing Technology, National Space Science Center, Chinese Academy of Sciences, Beijing 100190, China
2
University of Chinese Academy of Sciences, Beijing 100040, China
3
Aerospace Information Research Institute, Chinese Academy of Sciences, Beijing 100101, China
4
National Engineering Research Center of Satellite Remote Sensing Application, Beijing 100101, China
5
Key Laboratory of Earth Observation of Hainan Province, Hainan Aerospace Information Research Institute, Sanya 572029, China
6
National Institute of Natural Hazards, Ministry of Emergency Management of China, Beijing 100085, China
*
Author to whom correspondence should be addressed.
Remote Sens. 2023, 15(15), 3747; https://doi.org/10.3390/rs15153747
Submission received: 10 May 2023 / Revised: 21 July 2023 / Accepted: 26 July 2023 / Published: 27 July 2023
(This article belongs to the Special Issue Advanced Radar Signal Processing and Applications)

Abstract

:
External interference in ionospheric sounding seriously degrades the quality of echo signals and data; thus, it should be eliminated. This paper presents a method for suppressing interference using chaotic coding with a set of Bernoulli map sequences; compared with other commonly used coding methods such as Barker code, complementary code, and Barker-like codes, through simulation, the ambiguity function (AF) of Bernoulli map codes has better performance in terms of peak sidelobe level (PSL), integral sidelobe ratio (ISL), noise suppression (NS), and signal-to-noise ratio (SNR). Experimental tests were performed using a vertical ionosonde in Yinchuan, Ningxia Hui Autonomous Region, China, and the ionosonde was operated by alternating 40-bit Barker-like coding and 40-bit Bernoulli map coding each day to compare the effectiveness of interference suppression. The results showed that using Bernoulli map coding could remove interference and improve SNR significantly, thereby improving the data quality of the resulting ionograms.

1. Introduction

The Chaotic Coding Digital Ionosonde (CCDI) was developed by the National Space Science Center (NSSC), Chinese Academy of Science, and deployed in 2020 in Yinchuan, China [1,2,3]. Originally, the ionosonde employed a 40-bit Barker-like code, intercepted from a 31-order m sequence [4], for a better tradeoff between high pulse compression ratio (PCR) and low sidelobe compared with Barker code and complementary code, but this led to distinct coherent interferences in some frequencies; the consequent spurious signals were present in the autocorrelation waveforms and the ionograms. To address this problem, a set of 40-bit chaotic sequences was applied for the first time, and the desired effect was achieved.
The electromagnetic environment from the sky is very sophisticated. Co-channel radio broadcasts, wireless communication and Radar, etc., may be the main sources causing interference to the ionosonde [5]. The two most commonly used pulse codes are 13-bit Barker and 16-bit complementary for interference suppression [6,7,8,9,10,11,12,13]. They have autocorrelation functions (ACF) with high main lobes and insignificant sidelobes; specifically, the sidelobes cancel each other while averaging a pair of complementary sequences. It is more attractive to use longer encoding to obtain a higher pulse compression ratio and better interference suppression performance. A 1019-bit Legendre code, proposed for bistatic oblique sounding, can minimize interference [14]. A 63-bit m sequence and a 64-bit Wolfman–Goutelard (WG) sequence were employed in inter-pulse coding mode to suppress interference [13,15]. A complete complementary code consisting of four sets of 4-order 16-bit complementary sequences was proposed for multi-station ionospheric oblique sounding to address the coherent interference problem [16].
All the proposals mentioned above are valuable for interference suppression, but if any external signals that are partially coherent with the ionosonde echo exist, the interference may not be eliminated by a single coding sequence or several pairs of complementary coding. So, it is well worth trying to use a set of statistically independent pseudorandom sequences to solve the problem. This paper introduces a set of 40-bit Bernoulli chaos sequences [17] in CCDI and, through describing a field experiment, illustrates its ability to essentially eliminate coherent interference (in contrast to 40-bit Barker-like coding) while significantly improving signal-to-noise ratio (SNR).

2. Chaotic Coding

2.1. Bernoulli Map

Bernoulli mapping is an excellent chaotic coding approach which has an ideal “thumbtack” ambiguity function and good statistical performance compared with other typical chaotic maps such as Logistic and Tent maps [18,19,20,21,22,23]. A one-dimensional Bernoulli map is expressed as Equation (1):
x n + 1 =   Bx n + 1 2   ,   x n   <   0   Bx n   - 1   2   ,   x n     0 ,   1 . 4   <   B     2 ,   x n     [   - 0 . 5 ,   0 . 5   ]
A set of 40-bit pseudorandom sequences obtained via binary phase quantization and truncation are listed in Table 1. The sequences are non-periodic and random-like; every single sequence has a good autocorrelation property with a sharp spike at the origin and a small peak sidelobe level (PSL), and there is statistical independence between sequences.

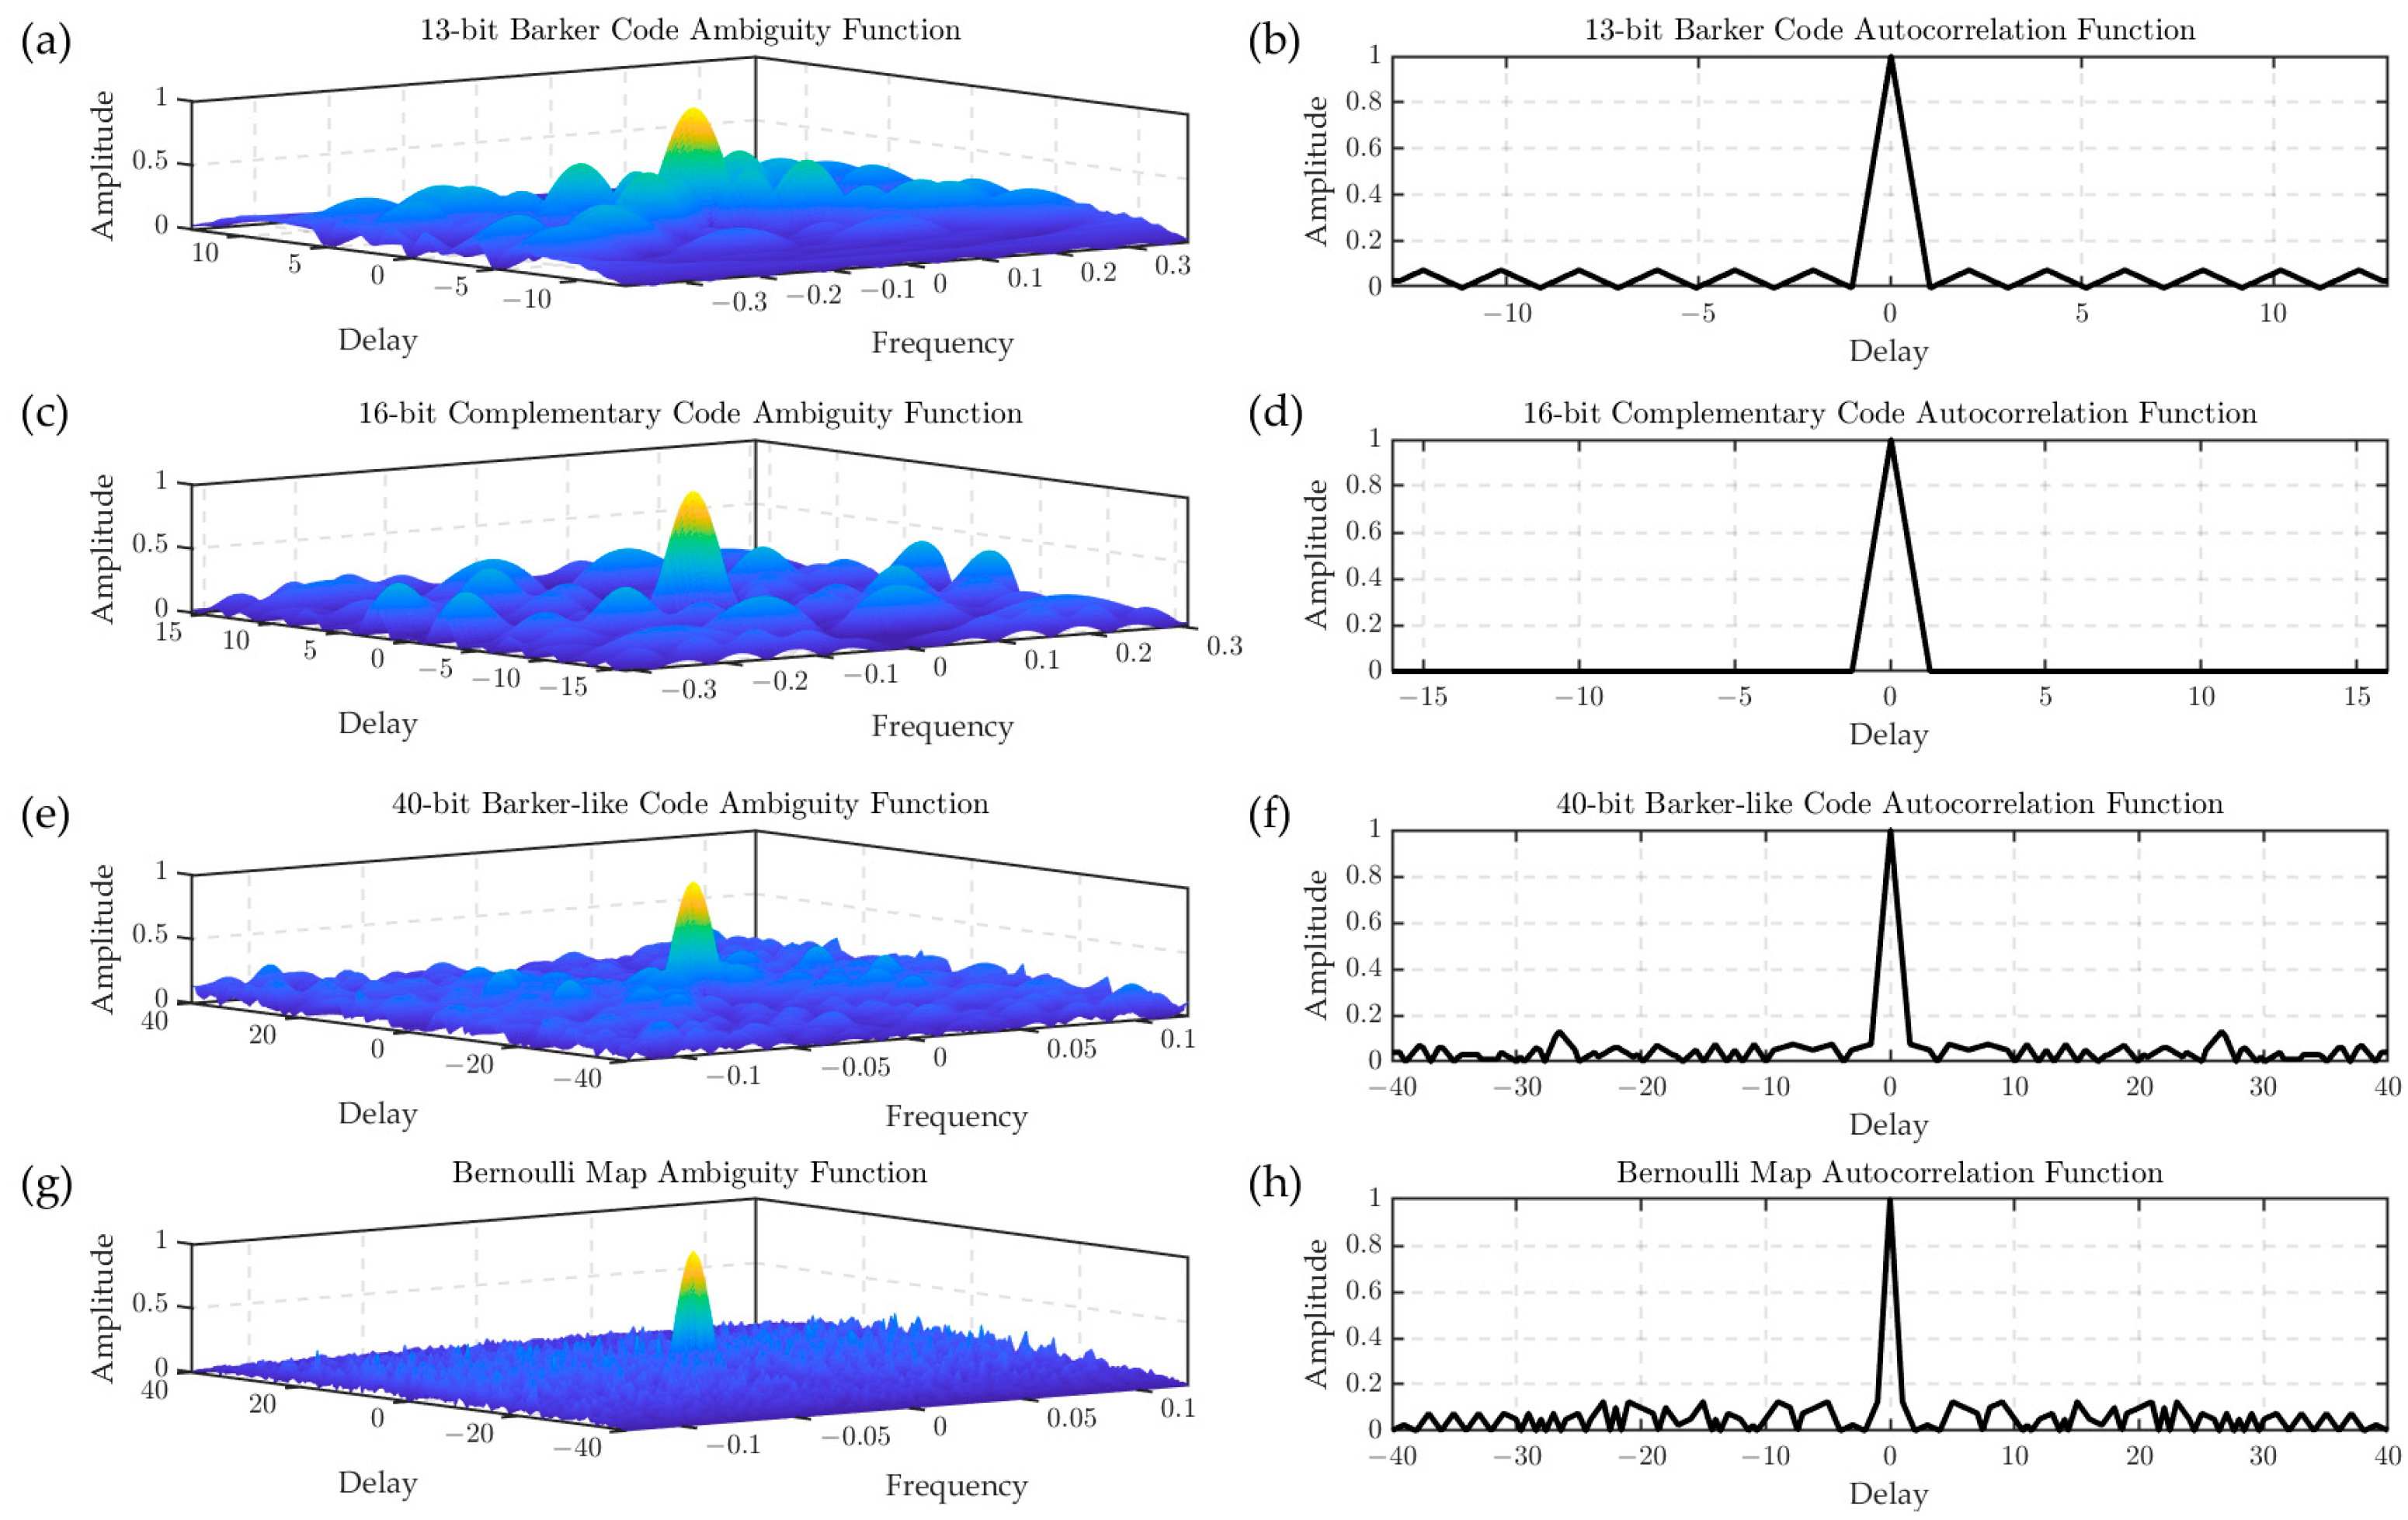
2.2. Ambiguity Function of Different Codes

The ambiguity function indicates the matching degree between the original signal and the echo, and it is usually used to evaluate the performance of a system coding sequence. It represents the range and the Doppler frequency resolution and is denoted by |X(t,fd)| [24],
X ( τ , f d ) = - + u ( t ) u * ( t - τ ) exp ( j 2 π f d t ) dt
where, u(t) is a sequence, fd shows a Doppler frequency shift, and t shows the time delay.
Equation (2) is a 2D ACF in time and frequency domain. When f d = 0 , it becomes a 1D ACF, it is generally used to extract range information and evaluates the PSL, integrated sidelobe level (ISL), and noise suppression (NS).
According to radar theory [24], PSL is defined as:
PSL = 10 log   max P m / P 0  
where Pm is the sidelobe power and m ≠ 0, P0 is the main lobe power.
ISL indicates the ratio of energy in the sidelobes to that in the main lobe and is defined as:
ISL = 10 log 2 i = 1 N - 1 X i 2 X 0 2
where X(i) is the amplitude of i-th sample of the ACF and NS is defined as:
NS = 10 logN
where N is the length of the code sequence; it is also a factor of improved sequence SNR to a single chip.
If a system uses a set of different coding sequences rather than a single sequence, the accumulatively averaged ambiguity function is expressed as Equation (6):
X ( τ , f d ) = 1 N   i = 1 N   - + u i ( t ) u i *   ( t - τ ) exp ( j 2 π f d t ) dt
where subscript i denotes the i-th sequence. For a pair of complementary codes, N = 2 [25,26], and for Bernoulli coding in CCDI, N = 100 is chosen in routine measurements.
This has been tested in [4], with code lengths ranging from 32 to 50 bits; 40-bit sequences perform best and are most suitable for the CCDI system. Figure 1 shows the normalized ambiguity functions and the ACFs of 13-bit Barker code, 16-bit complementary code, 40-bit Barker-like code, and 40-bit Bernoulli map code. The x-axis in the ambiguity function indicates the Doppler frequency shift, and the y-axis indicates the time delay. The position of the main lobe in the ambiguity function plot indicates the time delay τ and the Doppler frequency f d of the target.
Table 2 shows the main performance parameters of the different codes.
The following should be noted:
  • The main lobe width of ambiguity functions is related to the resolution of the encoding sequences. The narrower the main lobe, the higher the radar signal resolution.
  • The pulse compression ratio is proportional to the sequence length, and a longer sequence provides a narrower main lobe, which results in a higher resolution in consistent pulse duration, along with a higher SNR [24].
  • Theoretically, complementary code should present much better performance if the pair of codes are transmitted and processed simultaneously. In addition, its sidelobe is also affected by Doppler shift.
  • Bernoulli map code is a set of stochastic independent sequences; hence, the sidelobes are reduced to a relatively ideal state, but it needs more storage units.

2.3. SNR Analysis by Simulation

Statistically, the interference fading caused by irregularities in the reflecting surfaces of the ionosphere obeys Nakagami–Rice distribution. With the rapid fading and time samples of 3 to 7 min (just like the conditions of most ionosondes), the distribution is approximately Rayleigh [27,28,29], so the echo signals fluctuate and are noise-like. In order to further estimate the performance of SNR, the echo signals are simulated by adding noise with Rayleigh distribution. Figure 2 shows the ACFs of the four different coding sequences with different SNRs (−5 dB, −12 dB, −17 dB, and −20 dB, respectively). Compared with 13-bit Barker code and 16-bit complementary code, the main lobe of the ACF of the 40-bit coding sequence is narrower, and the range resolution is higher. When the SNR is high, at −5 dB and −12 dB, the four coding sequences have the same ability to suppress noise, and the main lobe is very obvious. The 16-bit complementary code still has a strong suppression effect on noise at SNR −17 dB, which is the best among the four codes. When the SNR is −20 dB, the complementary code no longer has an advantage, and the main lobe of the two 40-bit coding sequences is still relatively obvious. In the actual test, if complementary codes are used, the two sequences need to be transmitted successively; if not, the detection period is prolonged and the efficiency of the CCDI system is reduced. Considering the resolution, 40-bit coding should be chosen, and the statistical properties of the Bernoulli map sequences is more attractive to a single 40-bit Barker-like sequence.

3. System Description
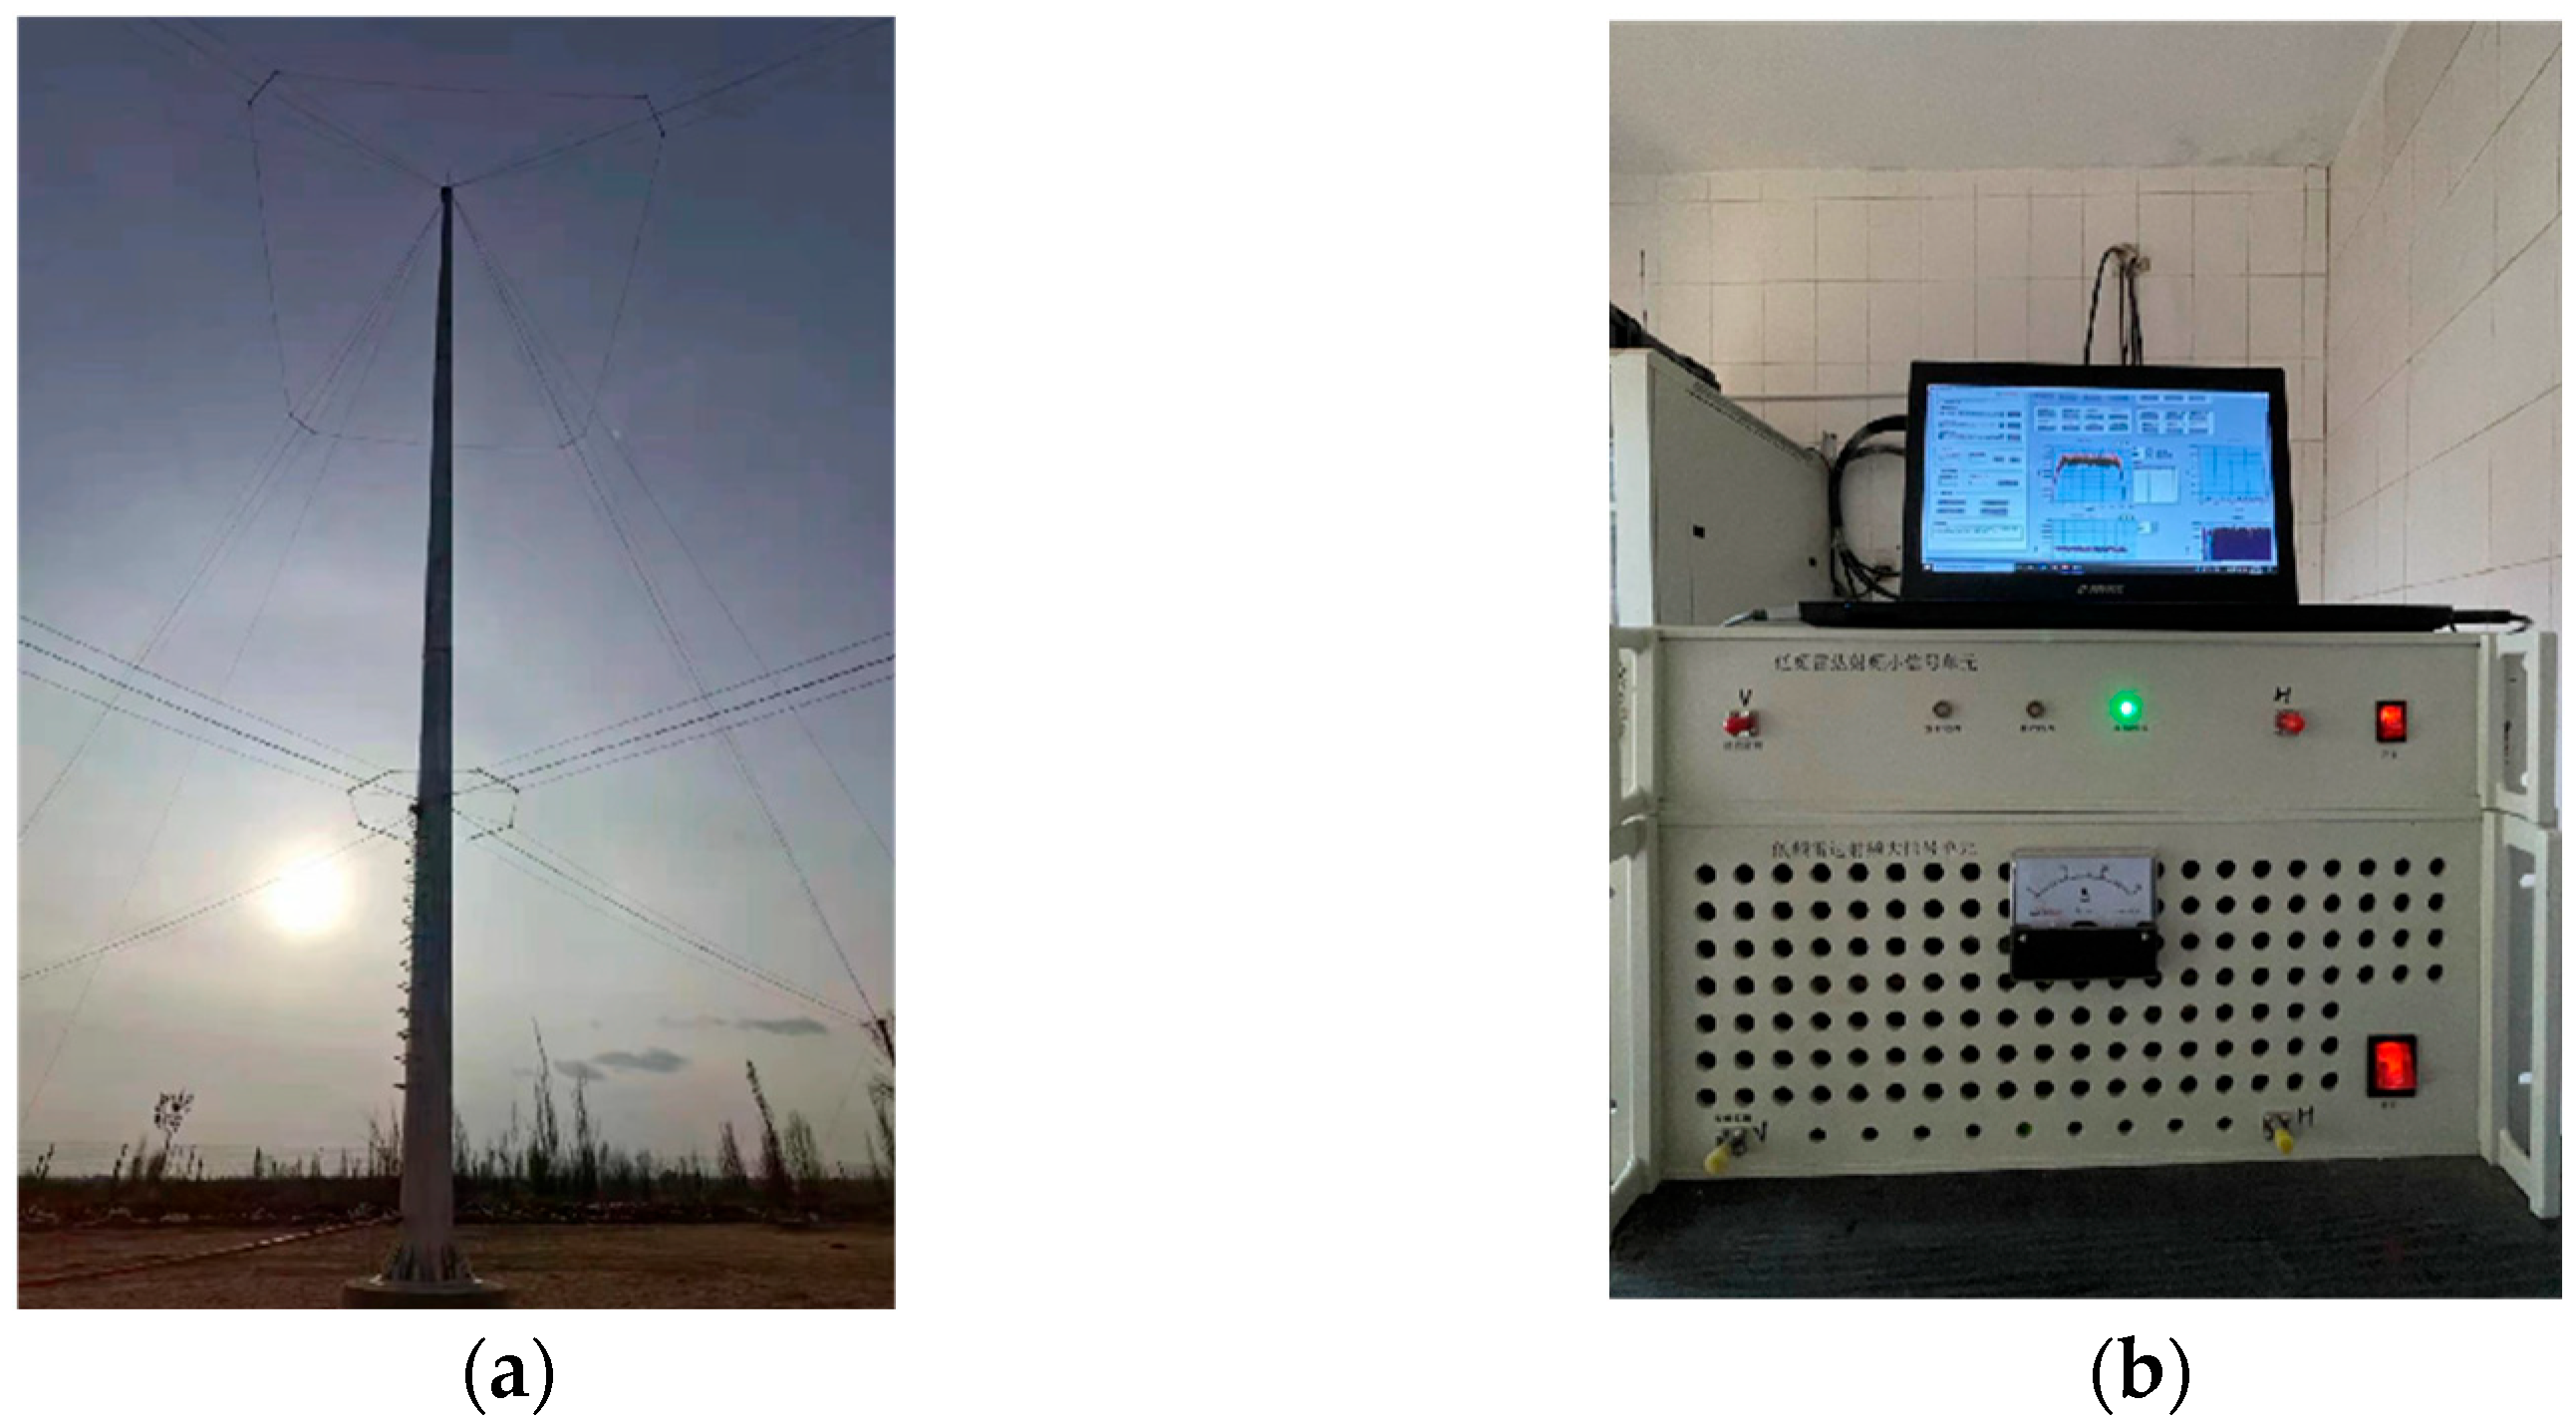
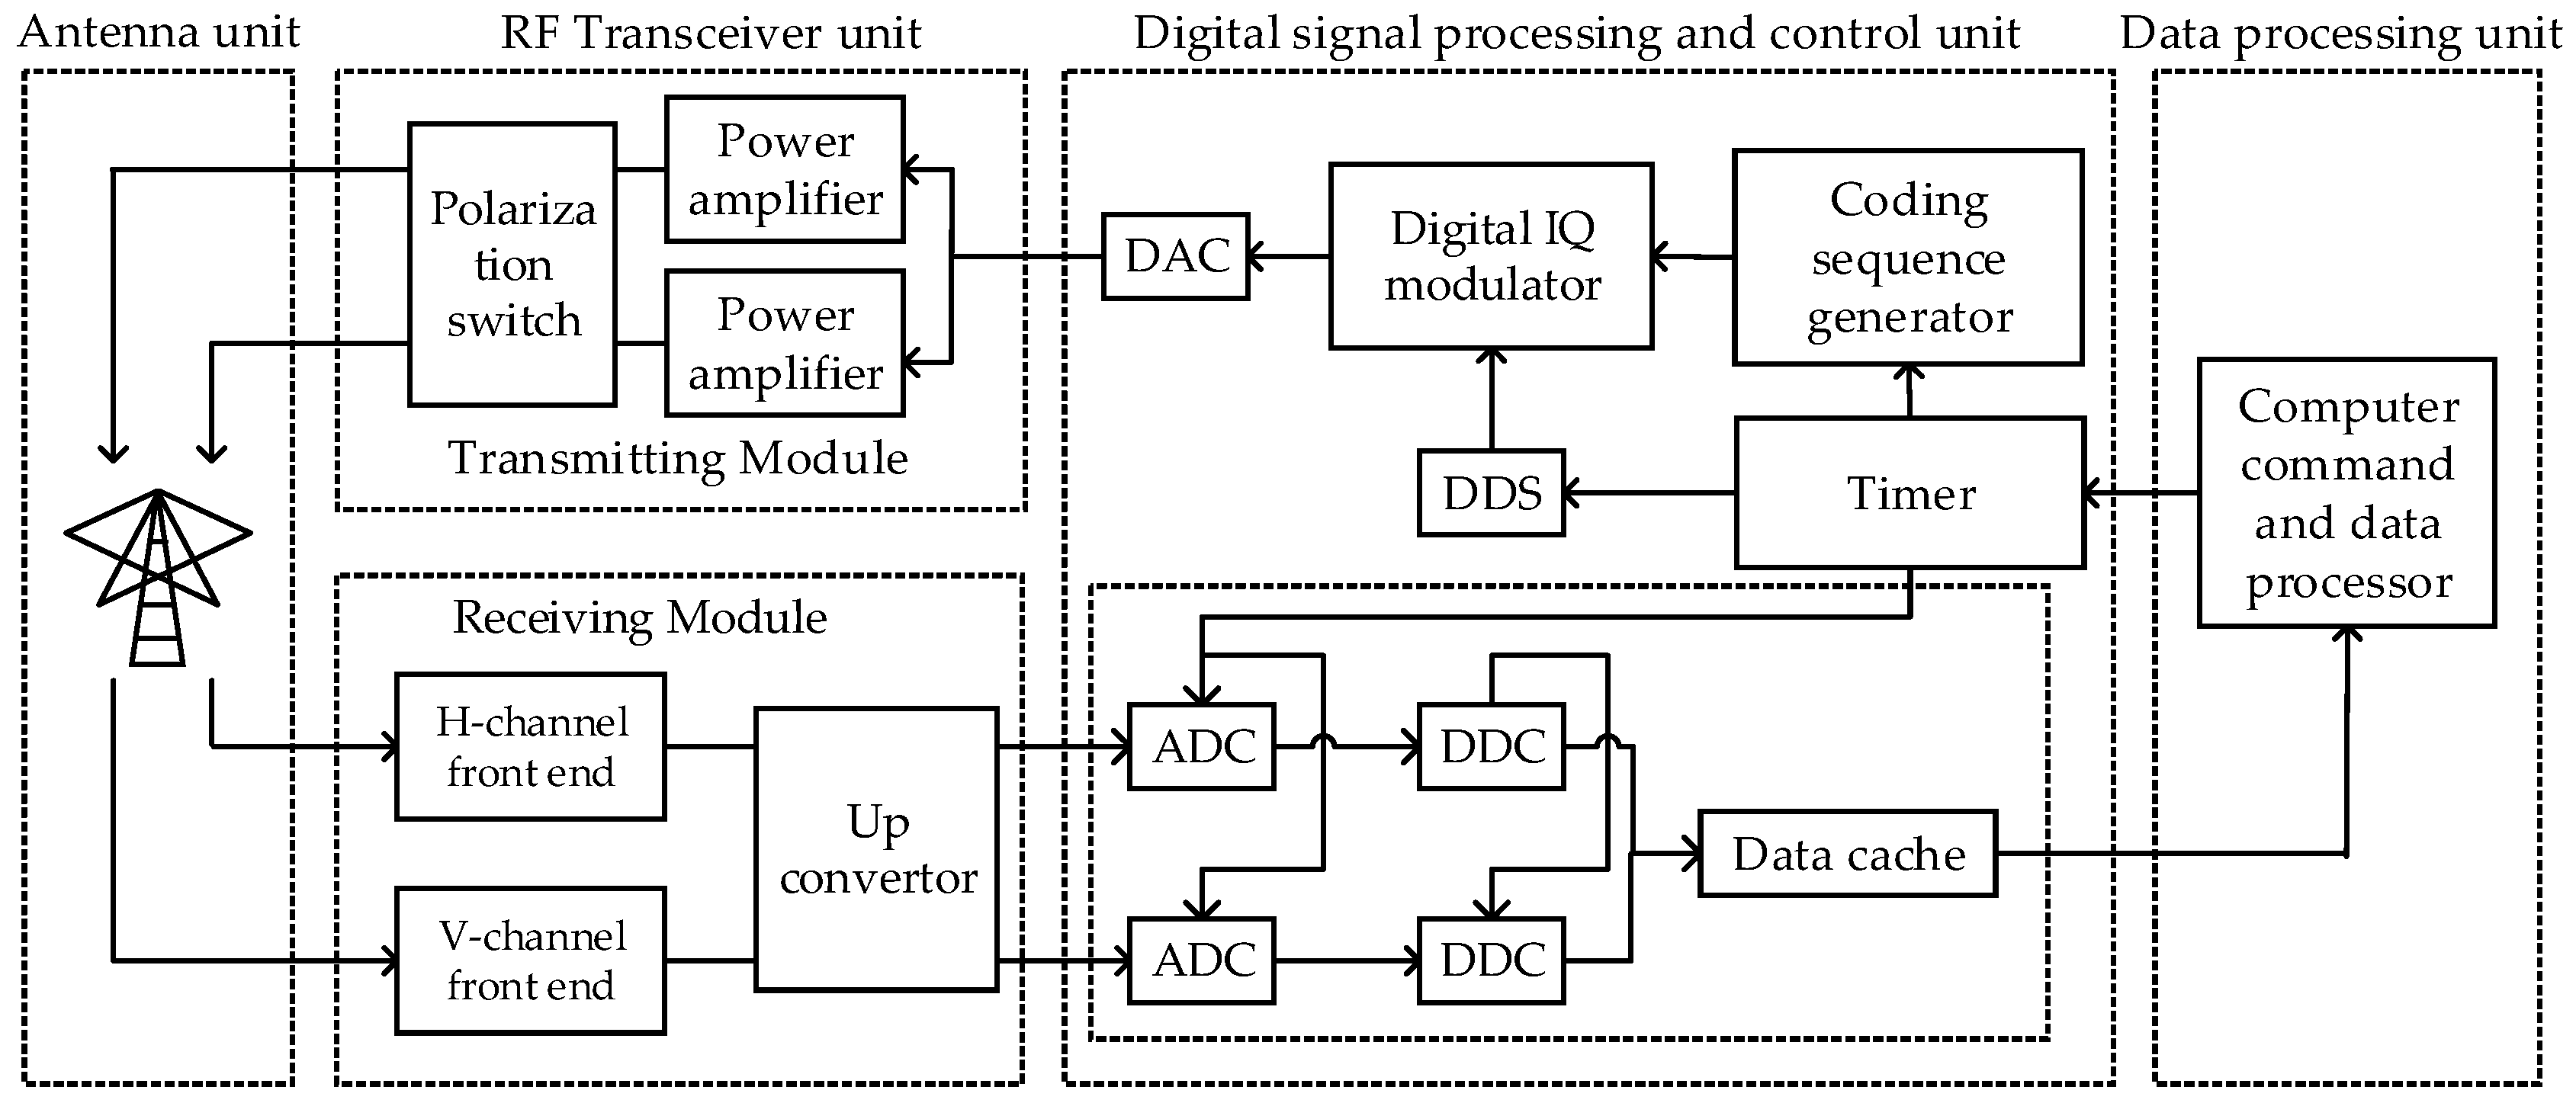
3.1. Configuration

The CCDI vertical ionosonde shown in Figure 3 is composed of an antenna unit, a RF transceiver unit, a digital signal processing and control unit, and data processing unit. The block diagram is shown in Figure 4. The antenna unit consists of a pair of orthogonal polarization Δ antennas and switches between transmitting and receiving. The RF transceiver unit includes a transmitting module and a receiving module. The transmitting module amplifies the signal from a digital to analog convertor (DAC) and provides the output to the antenna unit via a polarization switch. The receiving module includes a two-channel front end, which amplifies the bipolarized echo and upconverts it to IF. The digital processing and control unit is a software defined radio (SDR) unit; under the control of the timer, the coding sequence is modulated to the carrier in the digital IQ modulator, the carrier is generated by the direct digital synthesizer (DDS) with the frequency range of 1–30 MHz, and then the modulated digital signal is converted to the analog one via a digital analog convertor (DAC) and provided to the power amplifier for transmission. When receiving, the IF echo signals first pass through the two channels of the receiving module, are bandpass-sampled by the analog to digital converter (ADC), and then converted to the baseband signals by the digital downconverter (DDC). Finally, the baseband signals are transmitted to the computer over the network. The computer sends the system control command and implements data processing. The CCDI system specifications are listed in Table 3.

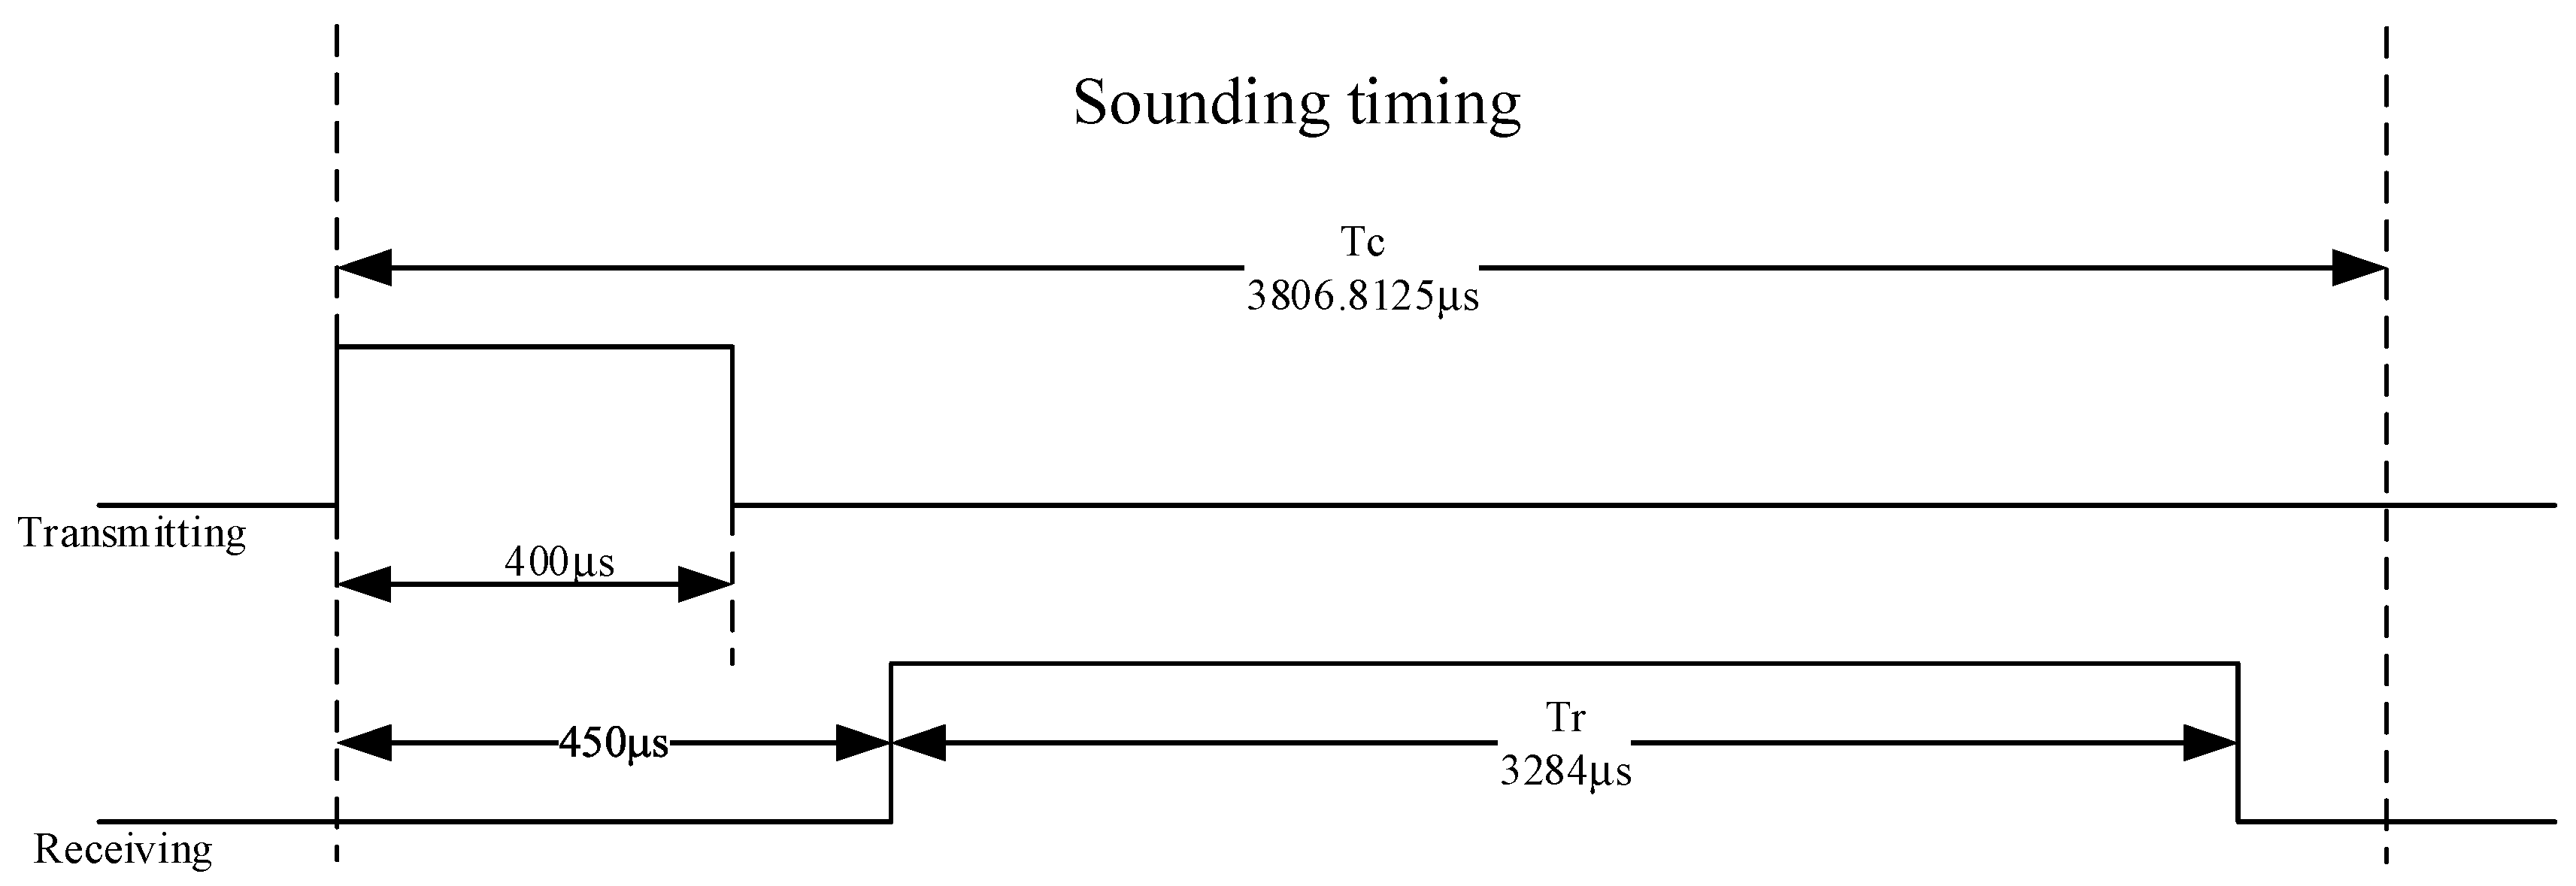
3.2. Sounding Timing

The CCDI system’s timing of a sounding cycle is present in Figure 5. The transmitted pulse width is 400 μs, which is coded by a 40-bit sequence and 10 μs/bit. The protection interval between transmitting and receiving is 50 ms; hence, the receiving range window is 67.5 km~560.1 km. Instead of range scanning, the receiving signal processing performs full range window sampling with a baseband sampling rate of 2 MHz; the single pulse echo has 6568 sampling points, and the corresponding coding sequence length is 800 sampling points. With 100 times the cumulative average of autocorrelation using the coding sequence, the echo range is determined by the peak value position, i.e., the virtual height,
h =   i   -   799     c × Tr 2   ×   6568 + 67500 ,   i     800 , 6568
where i is the peak value sample position of the autocorrelation.
The frequency scanning time from 1 MHz to 30 MHz is about 7.36, 3.68, and 1.84 min, corresponding to 25 kHz, 50 kHz, and 100 kHz frequency steps, respectively.

4. Experiment for interference suppression

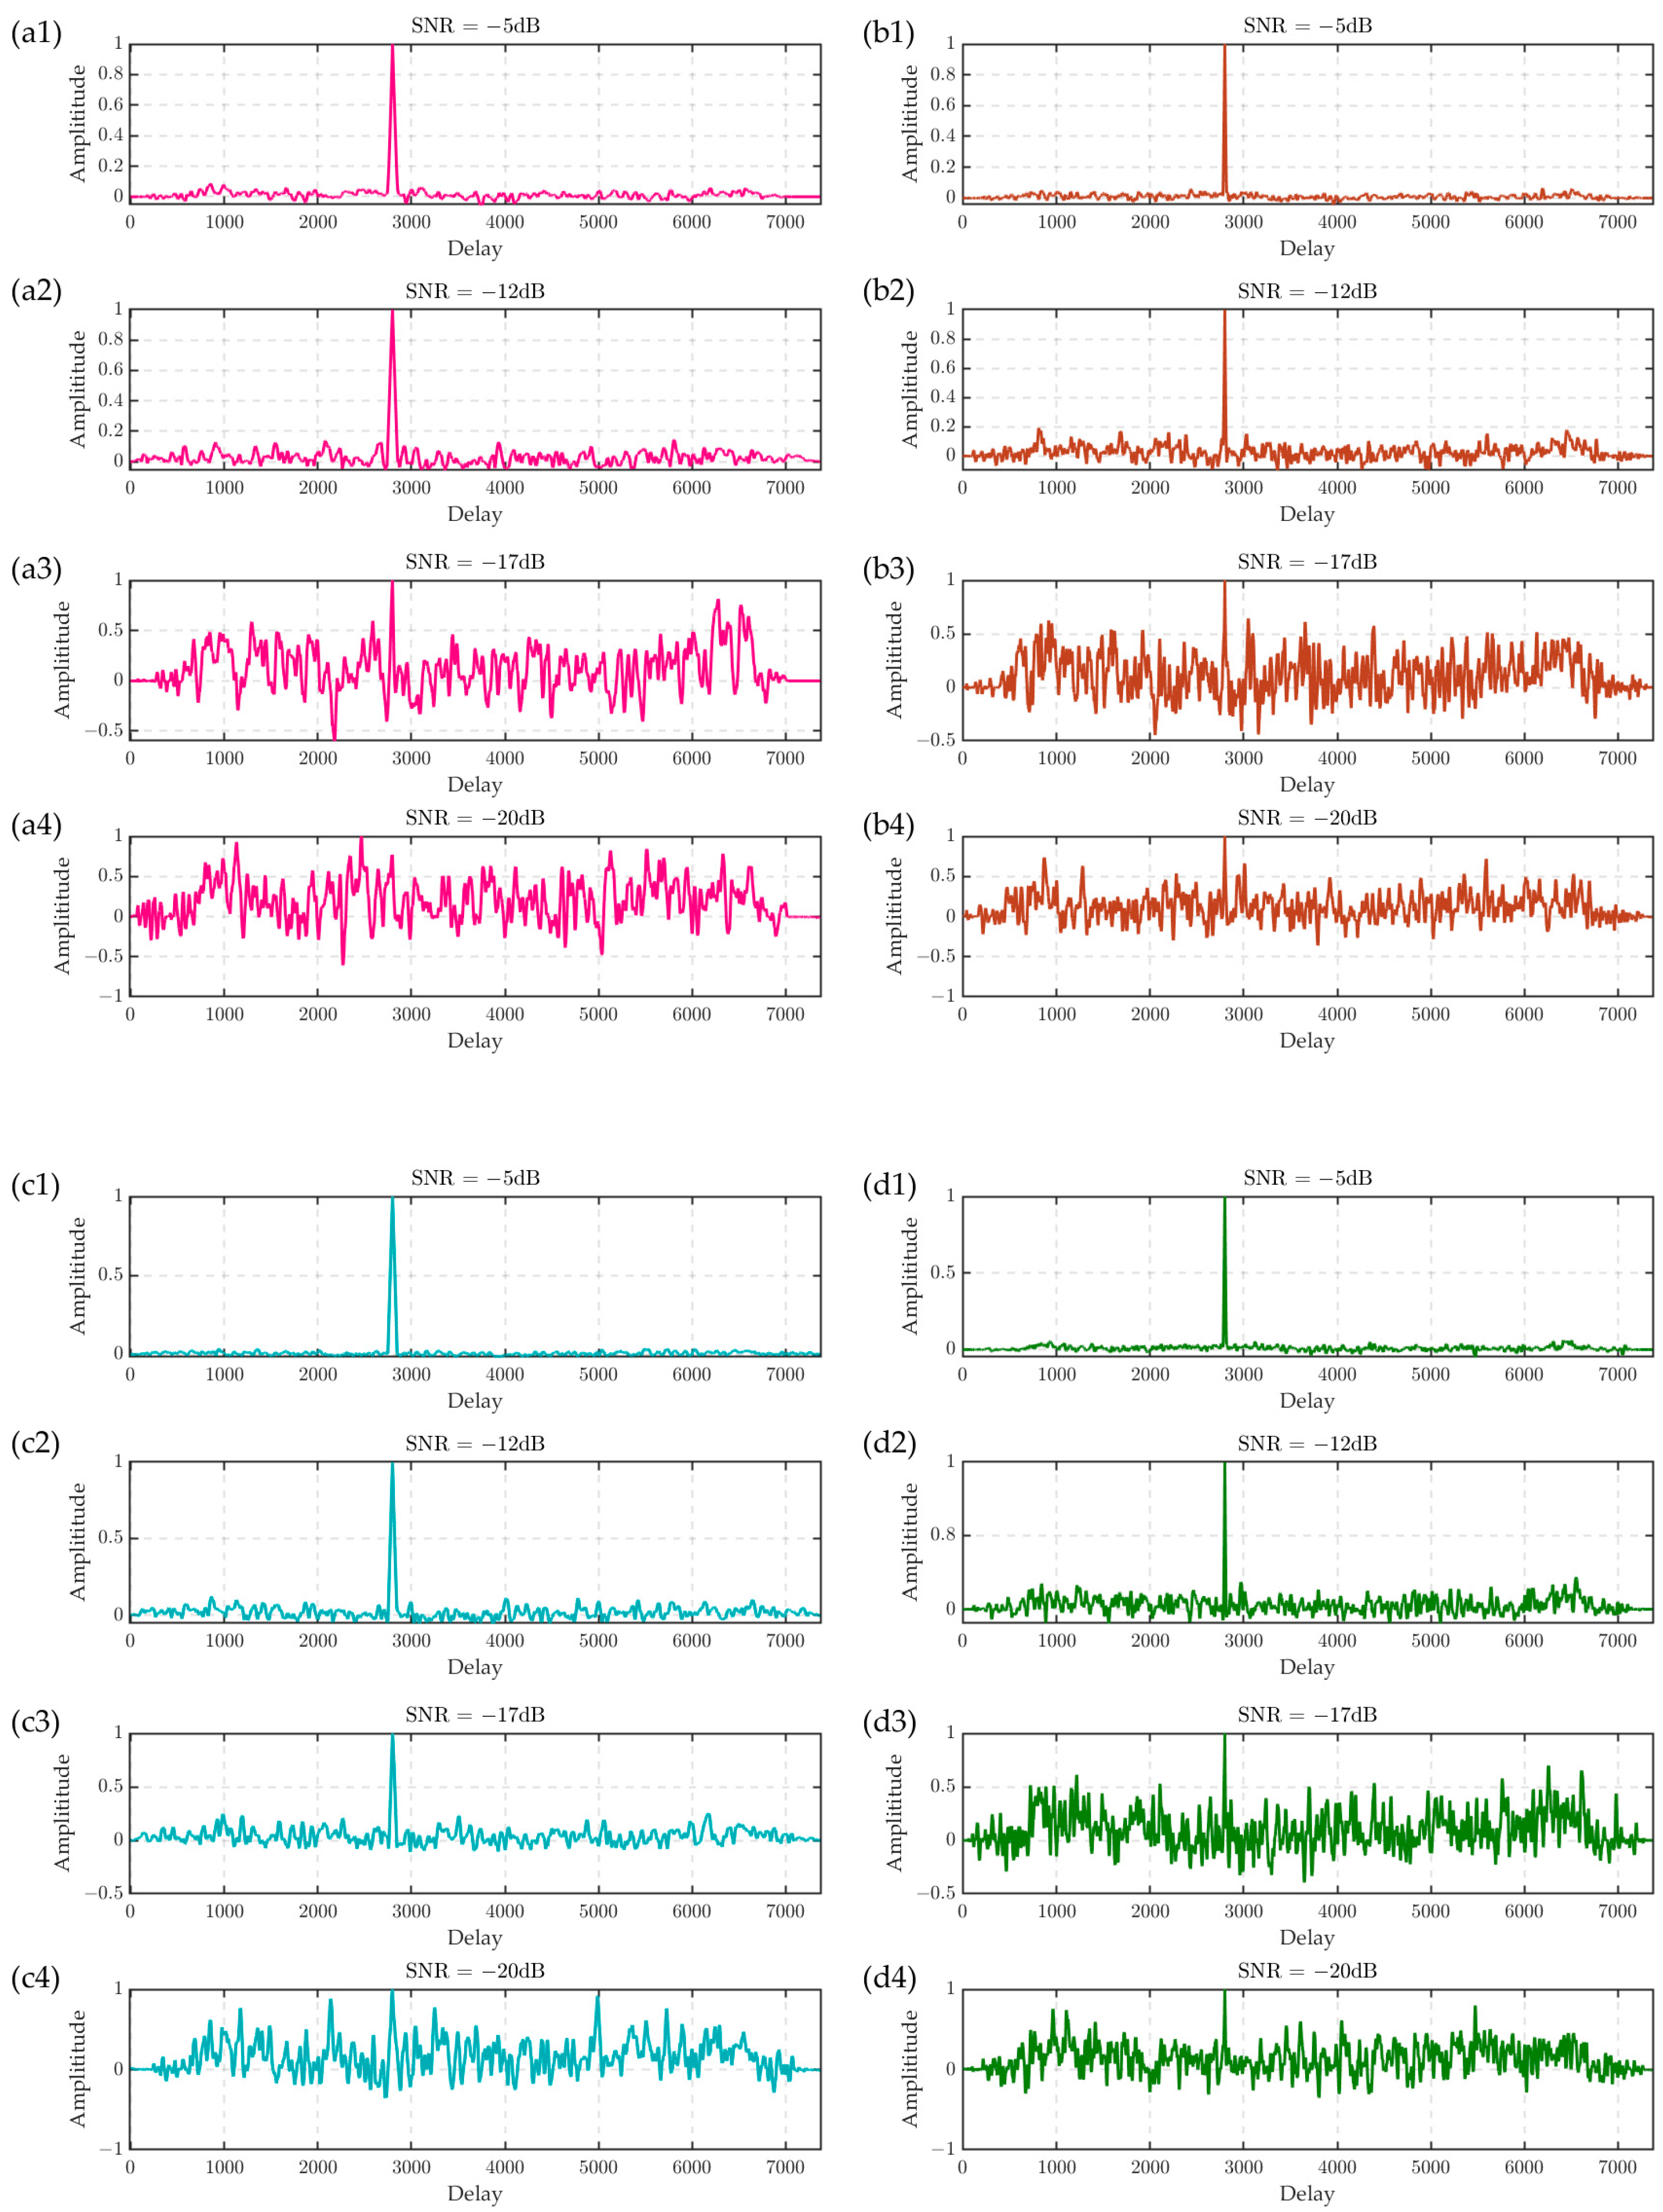
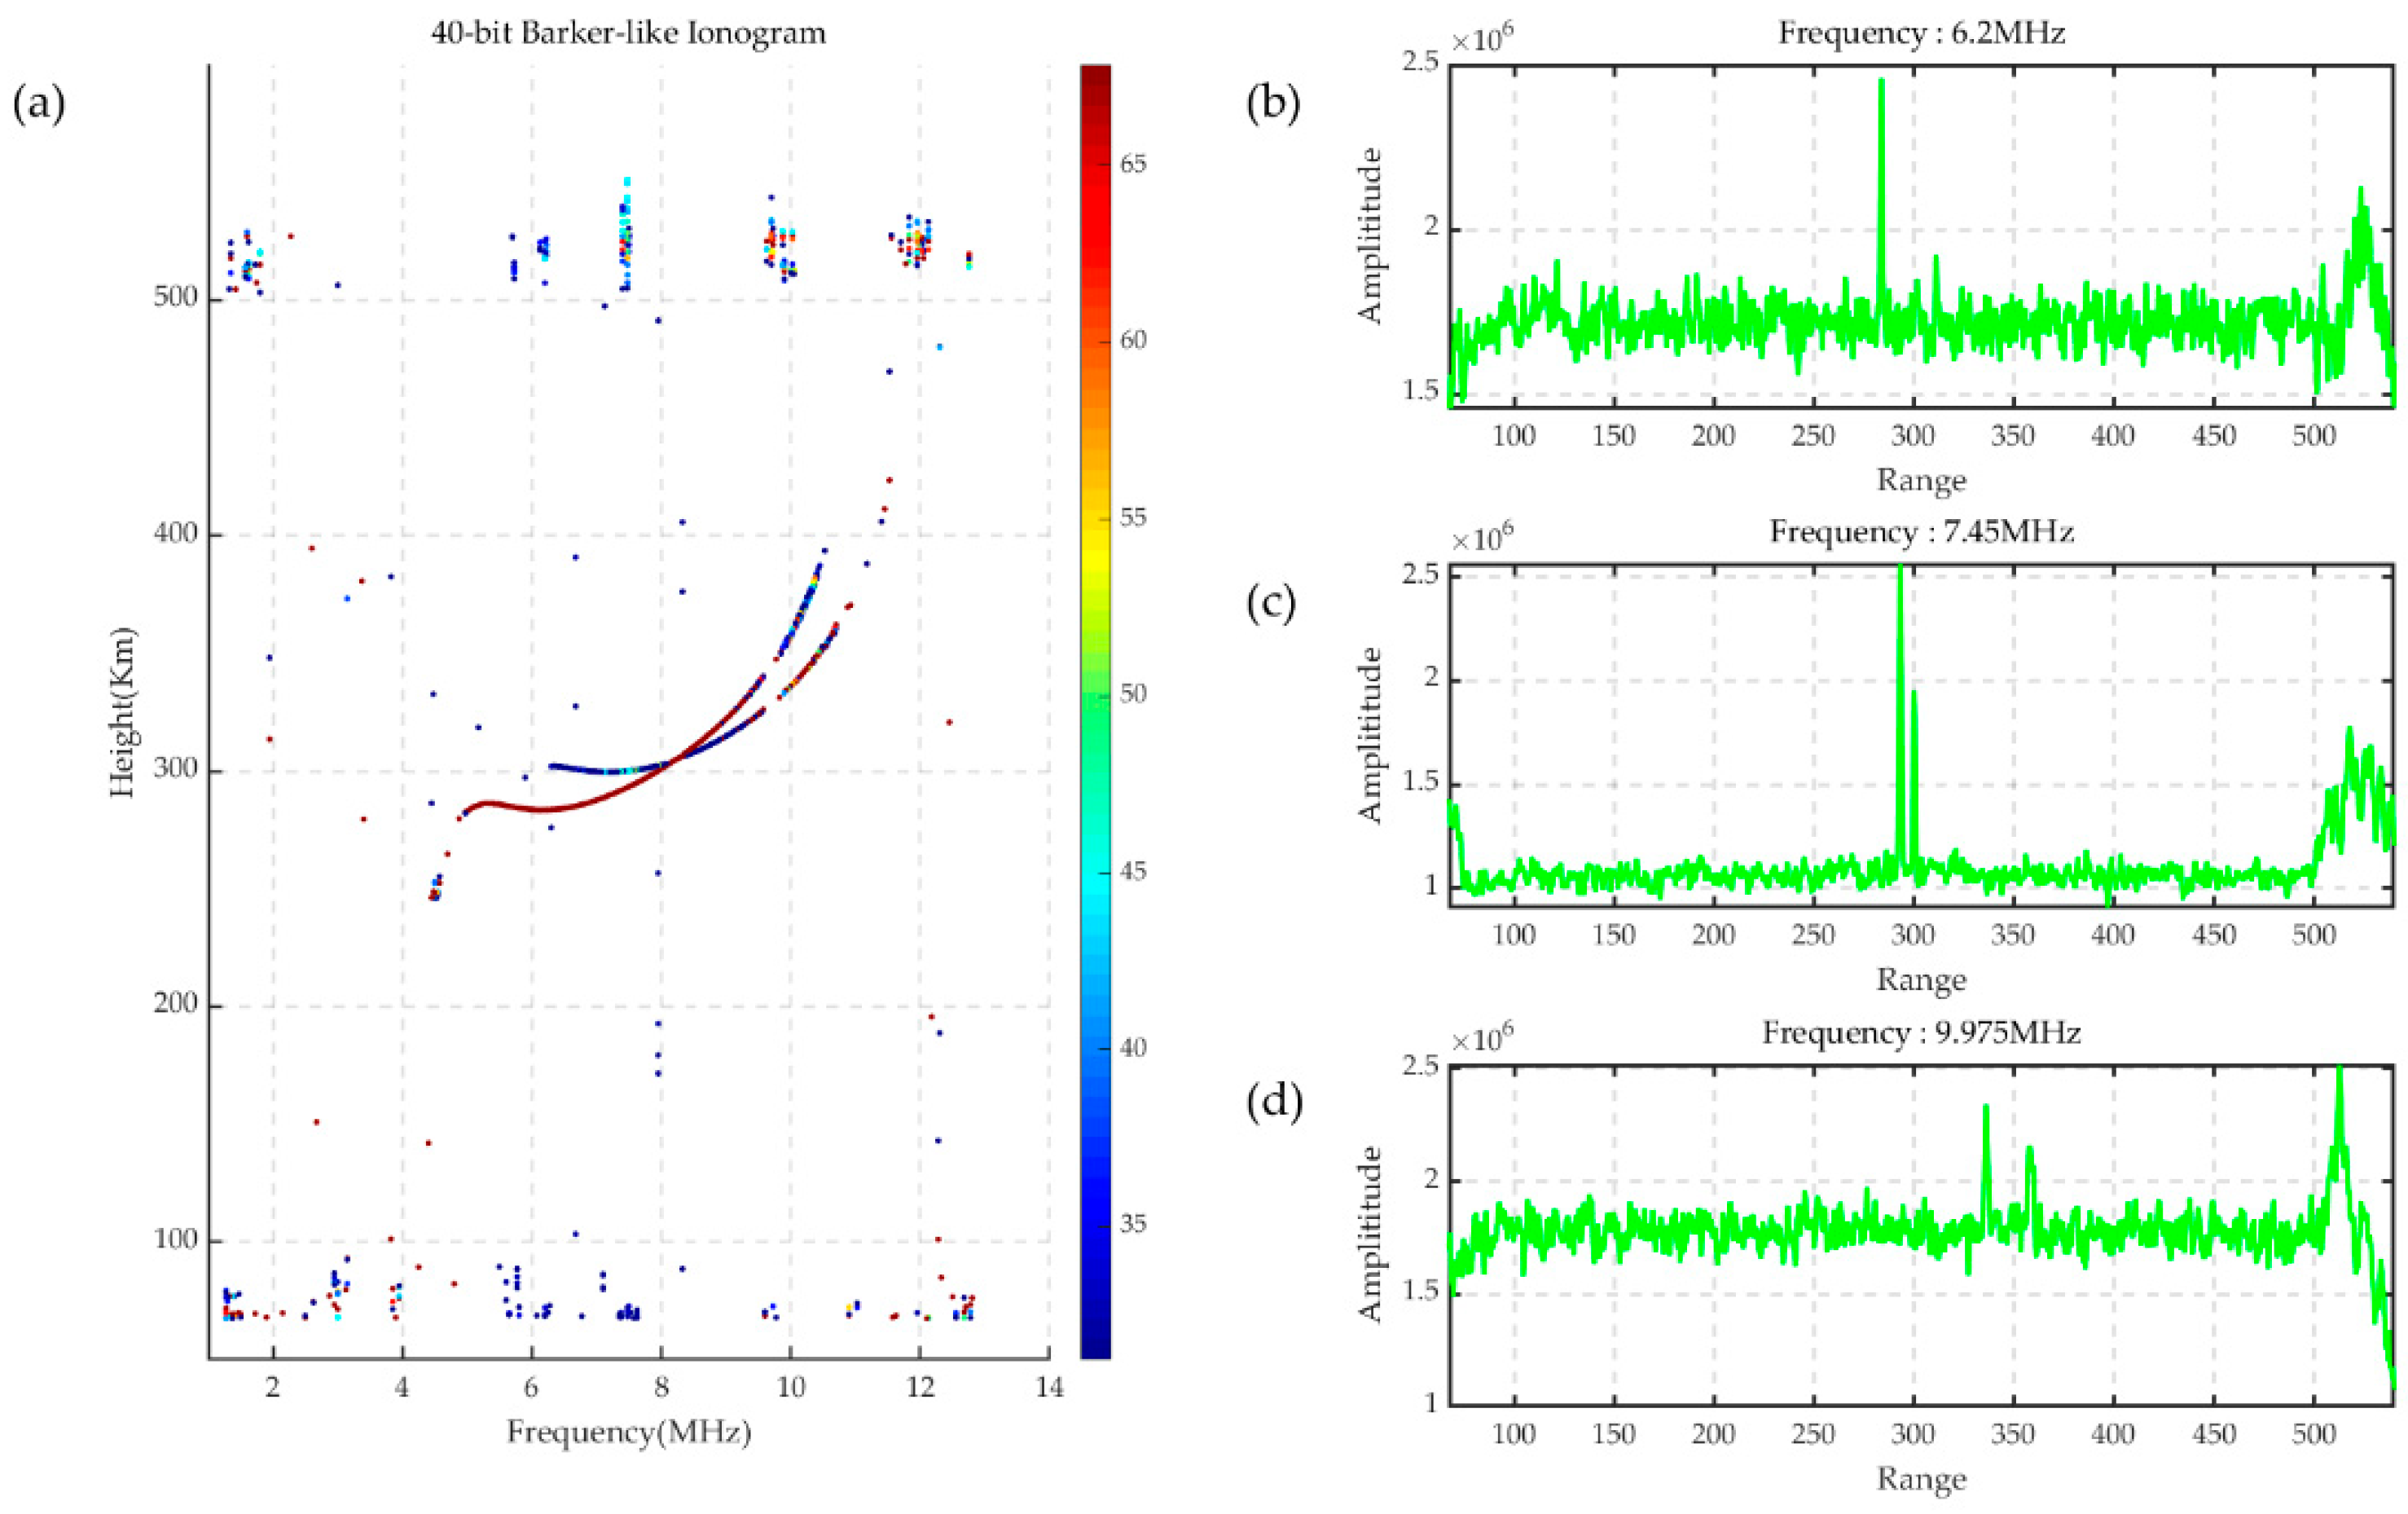
4.1. Influence of Interference on the ACF of Barker-Like Coding

In the presence of interference, the ACF of Equation (2) can be written as:
X τ , 0 =   - +   u t + I t   u * t   -   τ dt  
where I(t) denotes the interference.
Due to the complexity of the electromagnetic environment in space, interference is also very complex, usually emanating from different uncertain interference sources, and I(t) represents the superposition of these interferences. If I(t) is coherent with the coding sequence, it may contribute a series of spurious echo signals, and if I(t) is incoherent, it may add extra noise. In the early stage of CCDI system operation, a 40-bit single Barker-like coding sequence was adopted, and nonnegligible interferences occurred in ACF and the consequent ionograms, as shown in Figure 6. The serious impacts of interference occurred near 70 km and at above 500 km virtual height and in the ionograms, with corresponding frequency points between 5 MHz and 13 MHz. From the perspective of the ACFs, the interferences appeared on the shoulders of the curves, and the noise levels increased accordingly. These appearances led to false echo confusion and an increase in salt and pepper noise in the ionograms, so the influences of the interference should be eliminated.

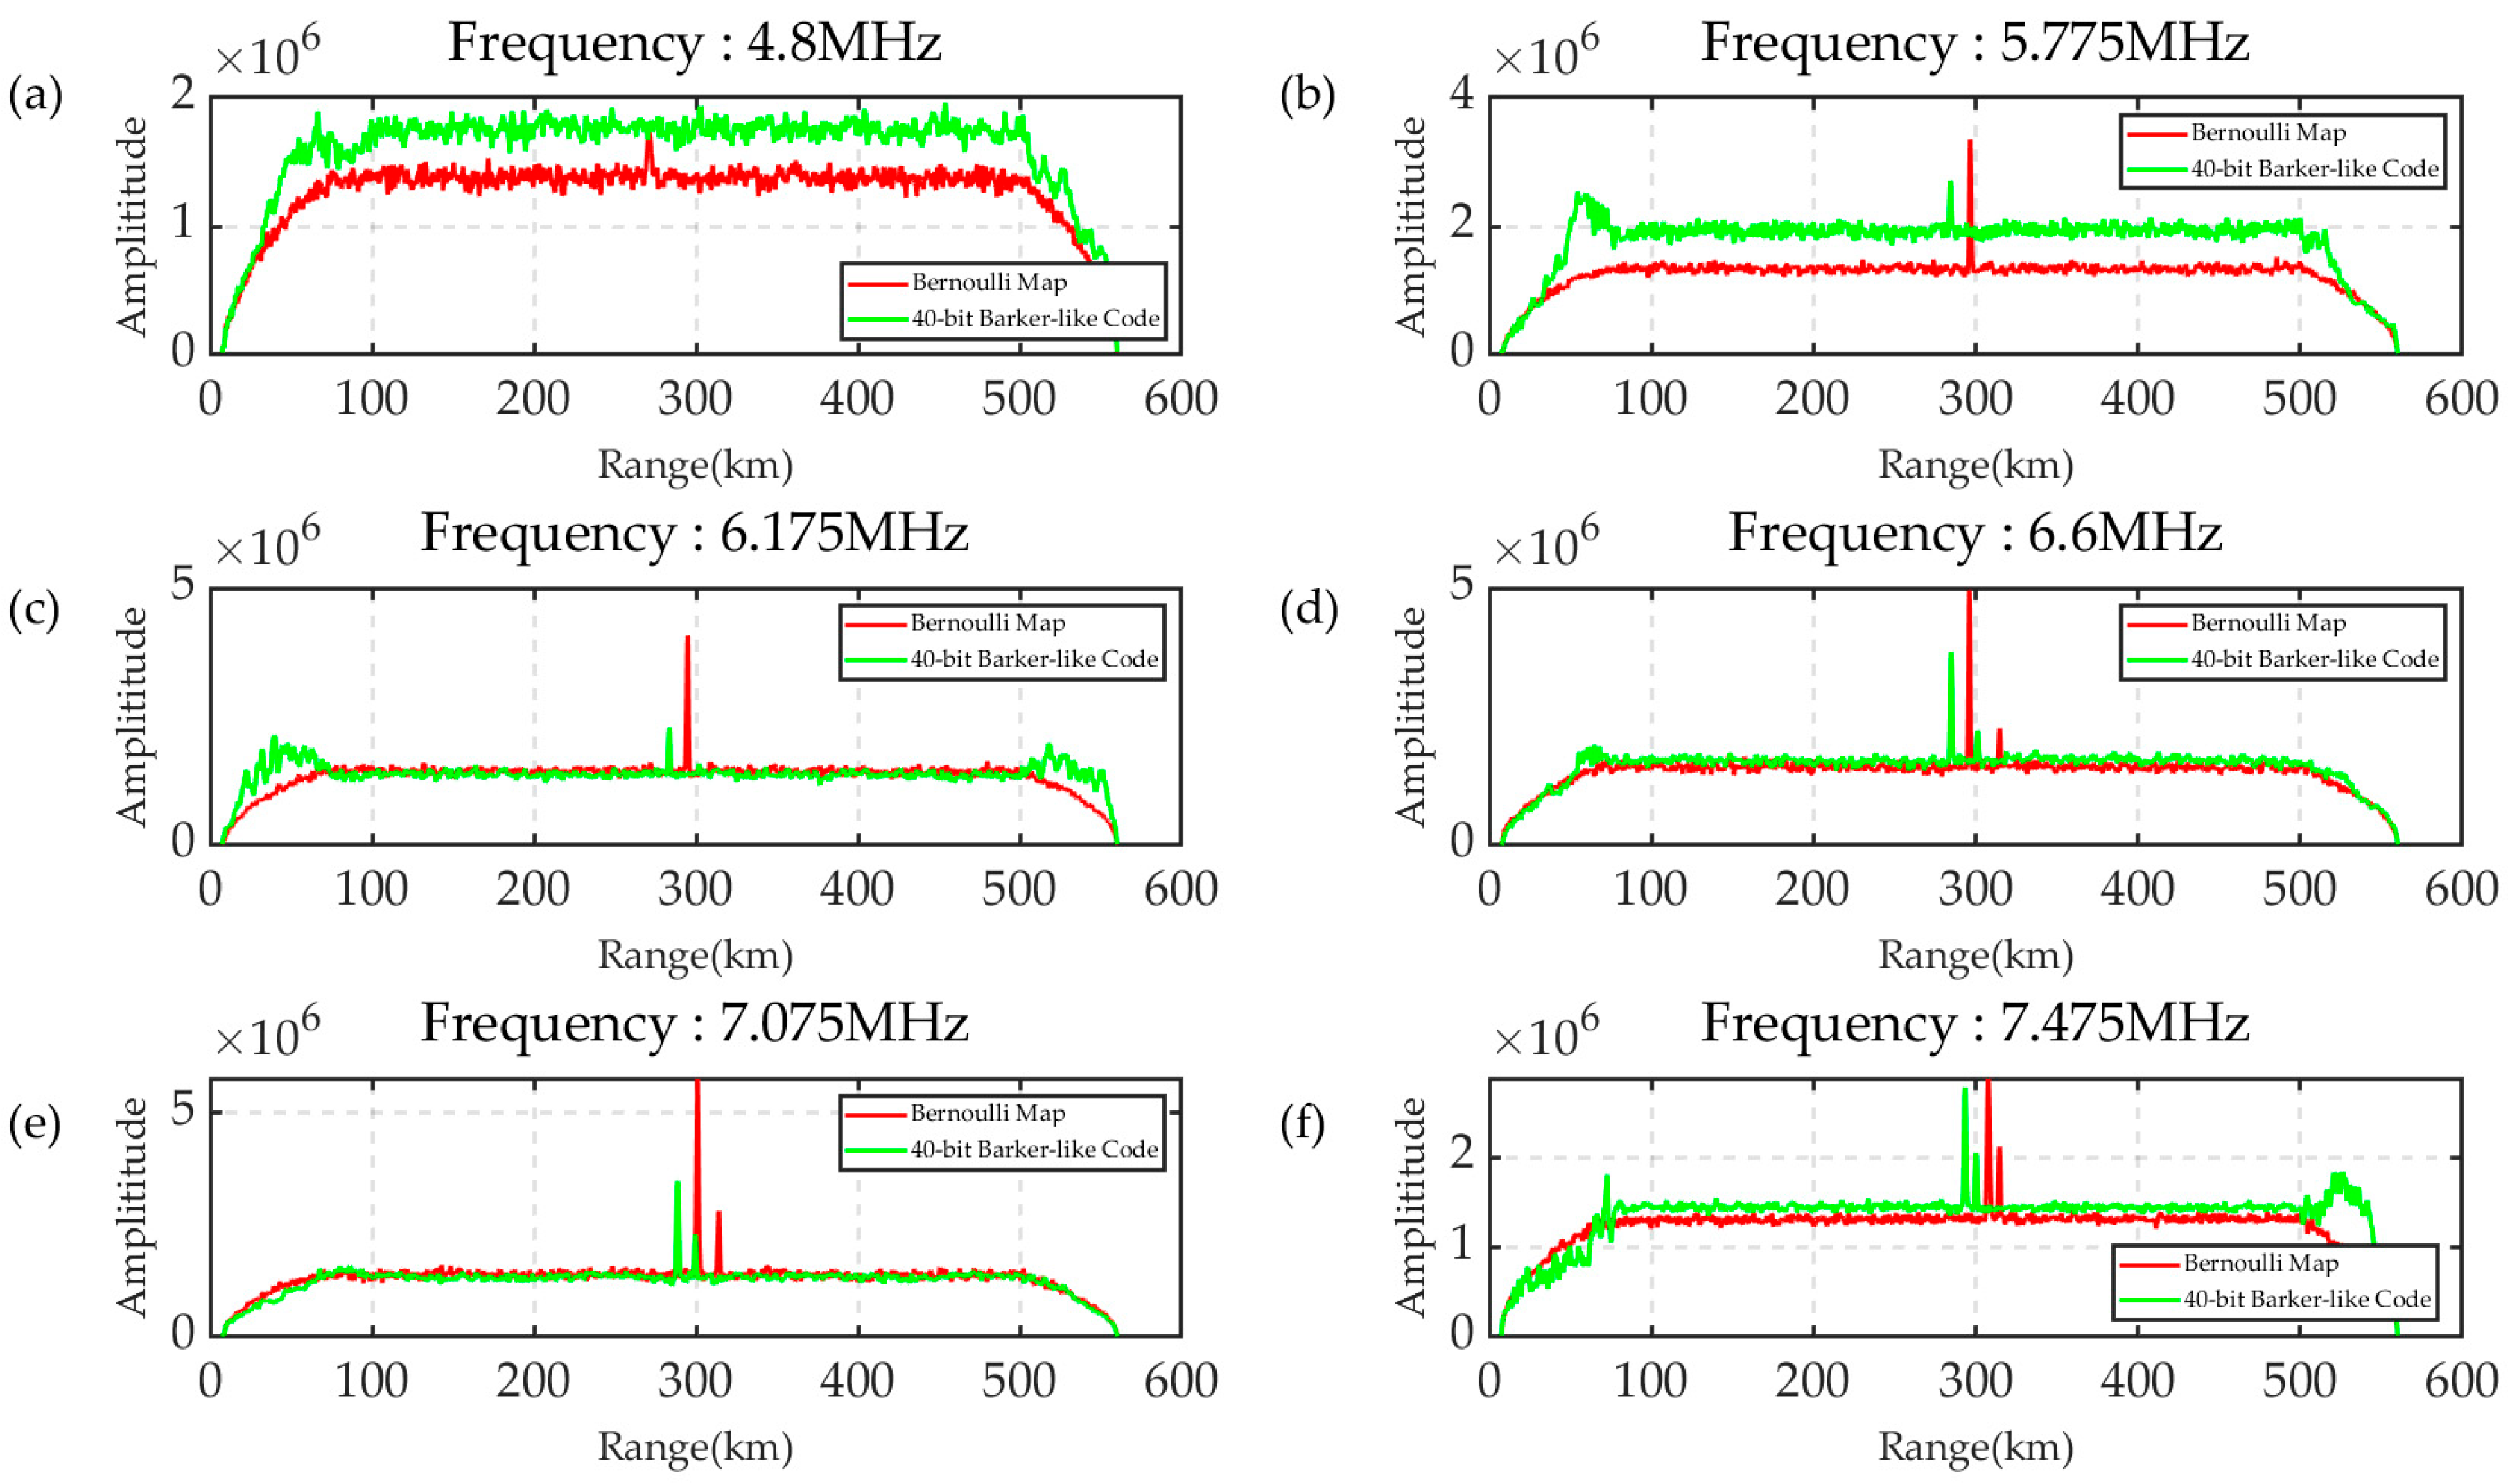
4.2. Interference Suppression by Bernoulli Coding

Instead of using single-sequence coding, it is reasonable to use a set of random sequences to remove the effect of interference. The CCDI system adopts a set of 40-bit Bernoulli map sequences (as mentioned above), and according to Equation (6), the ACF with interference can be expressed as:
  X ( τ , 0 )       1   N i = 1 N - + u i ( t ) u i * ( t - τ ) dt   +   1 N i = 1 N - + I ( t ) u i * ( t - τ ) dt  
Due to stochastic independence between Bernoulli map sequences, the second term to the right of Equation (9) will be accumulatively averaged to zero if N is large enough. Figure 7 shows a comparison of ACFs at different frequencies between Barker-like coding(green) and Bernoulli coding(red); under the same conditions, the ACF of Barker-like coding is also accumulatively averaged N times, where N = 100.
In the actual test, the echo signals often have large external environmental interference at a virtual height of about 50 km and 500 km, especially in the 4–7.5 MHz band. The interference is presumed to be from nearby radio stations or other radar signal sources. The statistical independence of the Bernoulli map sequences makes them perform well in suppressing coherent interference. As can be seen from Figure 7, Bernoulli map coding obviously improves SNR, reduces the noise level, almost perfectly removes interference on both shoulders of the ACF, and yields the maximum SNR improvement (up to 5 dB at 5.775 MHz and 6.175 MHz).

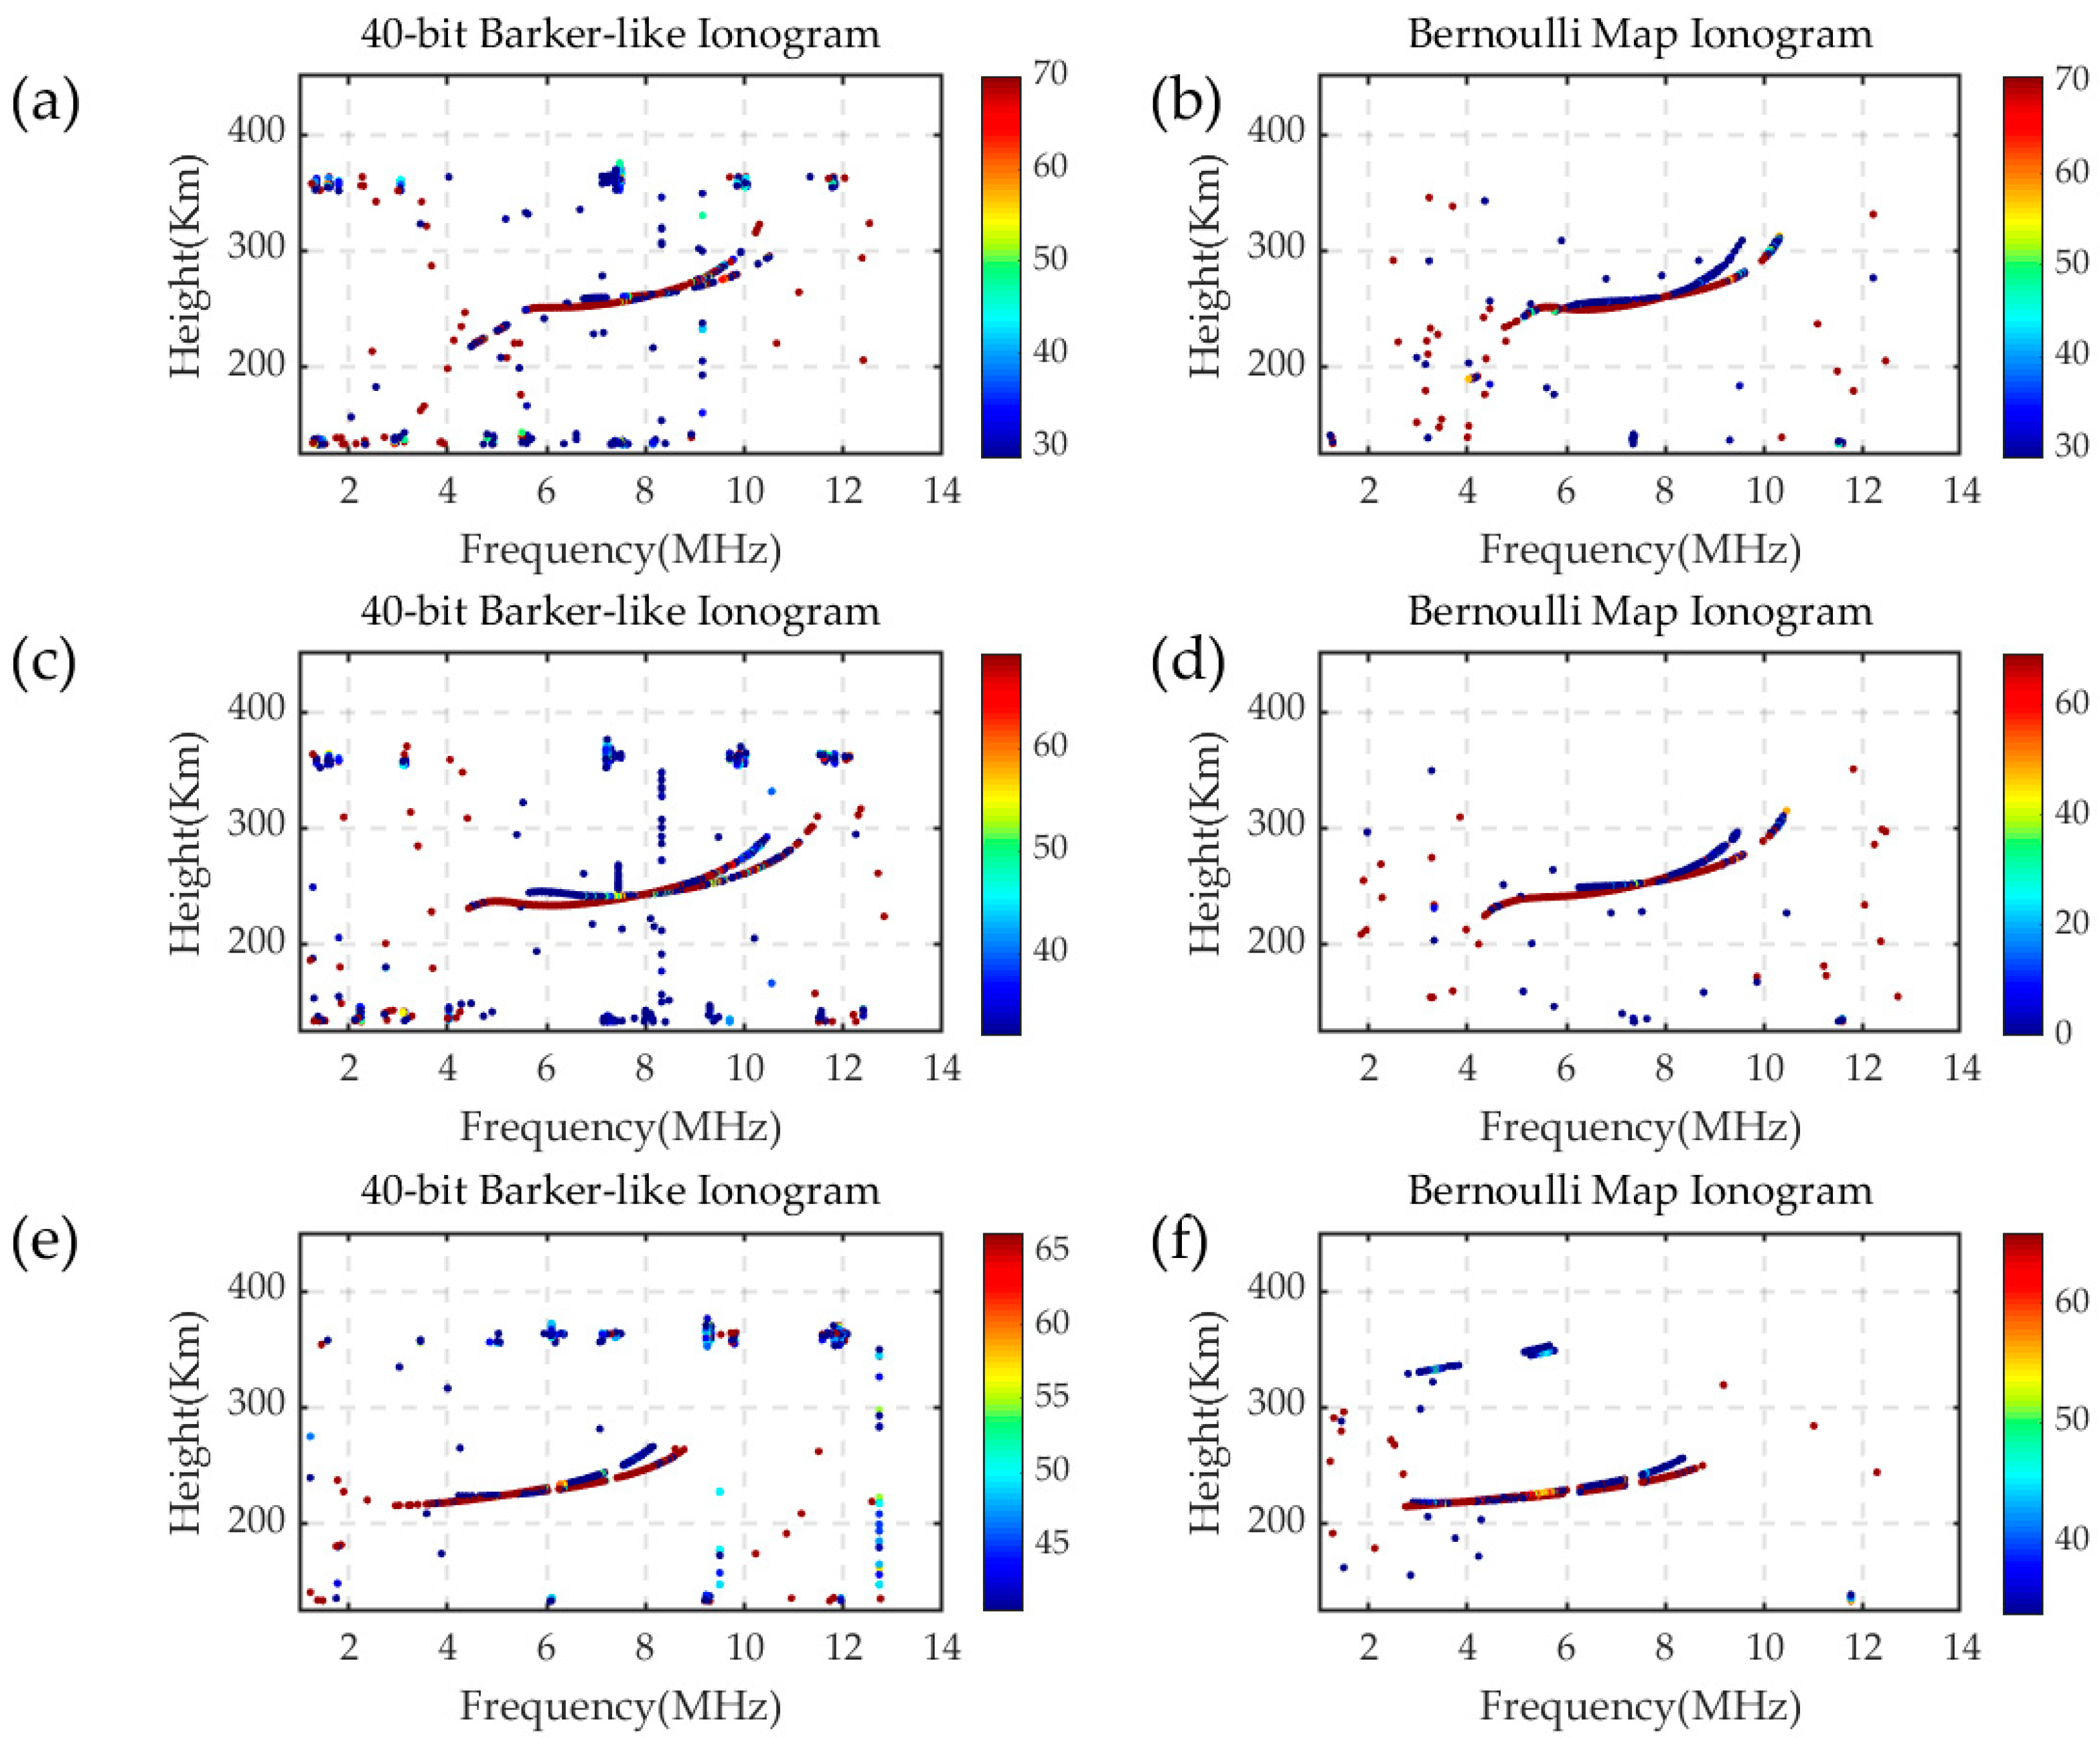
4.3. Effect on Ionograms

The improvement in ACF induced by Bernoulli map coding affects the resulting ionograms. Figure 8 shows a comparison of ionograms between Barker-like coding and Bernoulli map coding (the left and right columns, respectively). In Figure 8a,c,e, the effective sampling points account for 39.6%, 39.8%, and 53% of all points, respectively. Furthermore, in Figure 8b,d,f, the effective points account for 72.8%, 69.4%, and 80.6%, respectively. It can be seen that the Bernoulli Map sequences have a strong suppressive effect on interference and noise compared with the 40-bit Barker-like sequence, which can increase the proportion of effective sampling points by about 30.2% in one detection process.
The ionograms derived from 40-bit Barker-like coding have a large amount of pepper and salt noise, some of which are stronger than the echo traces. Increasing the detection threshold may lead to the removal of a large number of valid echoes and the disconnection of the traces, which cannot guarantee the integrity of the echo traces. In contrast, from Figure 8b,d,f, it can be observed that, in the Bernoulli map ionograms, the traces are intact, only a tiny amount of pretzel noise appears in the ionograms, and the vertical noise is completely suppressed.

5. Conclusions

In this paper, a set of bi-phase Bernoulli map coding sequences is proposed for use in relation to a vertical ionosonde and applied in the CCDI system. The Bernoulli map coding sequences has ideal thumbtack ambiguity function and good statistical performance; its ability to suppress interference and noise was demonstrated through a simulation and field experiment. Compared with 40-bit Barker-like coding, the SNR of Bernoulli map coding can be improved up to more than 5 dB at certain frequencies, and the coherent interference can be almost entirely removed while the integrity of the echo traces is preserved in the resulting ionograms, with the effective sampling points of the echo increased by about 30%; hence, data quality is improved significantly. After conducting our field experiment, Bernoulli map coding was conventionally applied in the CCDI system. Finally, it should be emphasized that Bernoulli map coding may not be unique with respect to its superior performance; any coding approach with good statistical characteristics, such as M sequences, is worth trying.

Author Contributions

Conceptualization, S.H. and W.G.; methodology, S.H. and W.G.; software, T.W.; validation, S.H., W.G. and C.W.; formal analysis, D.L. and J.H.; investigation, S.H. and Q.F.; resources, D.L. and J.H.; data curation, D.L. and J.H.; writing—original draft preparation, S.H.; writing—review and editing, S.H., W.G. and Q.F.; visualization, T.W. and P.L.; supervision, J.Y. and L.L.; project administration, W.G.; funding acquisition, J.Y. and L.L. All authors have read and agreed to the published version of the manuscript.

Funding

This research is based on National space infrastructure common application support platform and supported by National Development and Reform Commission, the funding numbers are E0A203020F and E0A203010F. The research was also supported by Natural Science Foundation of Hainan Province, China, the funding number is 423MS112.

Data Availability Statement

Not applicable.

Acknowledgments

Thank you to everyone who provided valuable advice and contributions during the preparation of this manuscript.

Conflicts of Interest

The authors declare no conflict of interest.

References

  1. Mengya, J. Antenna Design and Digital Control System Development of a High Performance Ionosonde; University of Chinese Academy of Sciences: Beijing, China, 2020. [Google Scholar]
  2. Mengya, J.; Wei, G.; Peng, L.; Caiyun, W. Design of Digital Control System for High-Performance Ionosonde Based on FPGA. Chin. J. Space Sci. 2021, 41, 580–588. [Google Scholar] [CrossRef]
  3. Gangquan, Z. Ionospheric Radar Echo Data Processing in Yinchuan Area; University of Chinese Academy of Sciences: Beijing, China, 2022. [Google Scholar]
  4. Kun, C. Design of the Ionosonde; South-Central Minzu University: Wuhan, China, 2009. [Google Scholar]
  5. Ghebrebrhan, O.; Luce, H.; Yamamoto, M.; Fukao, S. Interference Suppression Factor Characteristics of Complementary Codes for ST/MST Radar Applications. Radio Sci. 2004, 39, RS3013. [Google Scholar] [CrossRef]
  6. Tsmots, I.; Riznyk, O.; Rabyk, V.; Kynash, Y.; Kustra, N.; Logoida, M. Implementation of FPGA-Based Barker’s-Like Codes. In Lecture Notes in Computational Intelligence and Decision Making; Springer: Cham, Switzerland, 2020; pp. 203–214. [Google Scholar]
  7. Zhishen, S.; Xiaojun, L.; Bo, Z. Application of Complementary Codes in Ionosphere Sounding. Sci. Technol. Eng. 2011, 11, 5047–5052. [Google Scholar]
  8. Liu, T.; Yang, G.; Hu, Y.; Jiang, C.; Lan, T.; Zhao, Z.; Ni, B. A Novel Ionospheric Sounding Network Based on Complete Complementary Code and Its Application. Sensors 2019, 19, 779. [Google Scholar] [CrossRef] [PubMed] [Green Version]
  9. Bostan, S.M.; Urbina, J.V.; Mathews, J.D.; Bilén, S.G.; Breakall, J.K. An HF Software-Defined Radar to Study the Ionosphere. Radio Sci. 2019, 54, 839–849. [Google Scholar] [CrossRef]
  10. Semeter, J.; Butler, T.; Heinselman, C.; Nicolls, M.; Kelly, J.; Hampton, D. Volumetric Imaging of the Auroral Ionosphere: Initial Results from PFISR. J. Atmos. Sol. Terr. Phys. 2009, 71, 738–743. [Google Scholar] [CrossRef]
  11. Chen, G.; Jin, H.; Yan, J.-Y.; Cui, X.; Zhang, S.-D.; Yan, C.-X.; Yang, G.-T.; Lan, A.-L.; Gong, W.-L.; Qiao, L.; et al. Hainan Coherent Scatter Phased Array Radar (HCOPAR): System Design and Ionospheric Irregularity Observations. IEEE Trans. Geosci. Remote Sens. 2017, 55, 4757–4765. [Google Scholar] [CrossRef]
  12. Li, J.; Liu, M.; Ou, J.; Wang, W. A Novel Radar Waveform Design for Suppressing Autocorrelation Side-Lobe Based on Chaotic and Single Fusion Encoding Method. Prog. Electromagn. Res. M 2022, 111, 77–88. [Google Scholar] [CrossRef]
  13. Yao, M.; Zhao, Z.; Chen, G.; Yang, G.; Su, F.; Li, S.; Zhang, X. Comparison of Radar Waveforms for a Low-Power Vertical-Incidence Ionosonde. IEEE Geosci. Remote Sens. Lett. 2010, 7, 636–640. [Google Scholar] [CrossRef]
  14. Huang, J.; MacDougall, J.W. Legendre Coding for Digital Ionosondes. Radio Sci. 2005, 40, RS4013. [Google Scholar] [CrossRef]
  15. Gang, C.; Zhengyu, Z.; Guoqiang, Z.; Shuzhu, S. The Wuhan Ionospheric Sounding Systems. IEEE Geosci. Remote Sens. Lett. 2009, 6, 748–751. [Google Scholar] [CrossRef]
  16. Shi, S.; Yang, G.; Jiang, C.; Zhang, Y.; Zhao, Z. Wuhan Ionospheric Oblique Backscattering Sounding System and Its Applications—A Review. Sensors 2017, 17, 1430. [Google Scholar] [CrossRef] [Green Version]
  17. Evans, J.V. Ionospheric Movements Measured by Incoherent Scatter: A Review. J. Atmos. Terr. Phys. 1972, 34, 175–209. [Google Scholar] [CrossRef]
  18. Dong, S.; Wang, Y.; Xin, X.; Tong, X. A Chaos-Based True Random Number Generator Based on OTA Sharing and Non-Flipped Folded Bernoulli Mapping for High-Precision ADC Calibration. Microelectron. J. 2021, 116, 105259. [Google Scholar] [CrossRef]
  19. Yang, Q.; Zhang, Y.; Gu, X. A Signal Model Based on Combination Chaotic Map for Noise Radar. Prog. Electromagn. Res. M 2013, 28, 57–71. [Google Scholar] [CrossRef] [Green Version]
  20. Babu, S.B.S.; Kumar, R. 1D-Bernoulli Chaos Sequences Based Collaborative-CDMA: A Novel Secure High Capacity CDMA Scheme. Wirel. Pers. Commun. 2017, 96, 2077–2086. [Google Scholar] [CrossRef]
  21. Ameen, M.J.M.; Hreshee, S.S. Securing Physical Layer of 5G Wireless Network System over GFDM Using Linear Precoding Algorithm for Massive MIMO and Hyperchaotic QR-Decomposition. Int. J. Intell. Eng. Syst. 2022, 15, 579–591. [Google Scholar] [CrossRef]
  22. da Costa, R.A.; Loiola, M.B.; Eisencraft, M. Spectral Properties of Chaotic Signals Generated by the Bernoulli Map. J. Eng. Sci. Technol. Rev. 2015, 8, 12–16. [Google Scholar] [CrossRef]
  23. Tsuneda, A. Orthogonal Chaotic Binary Sequences Based on Bernoulli Map and Walsh Functions. Entropy 2019, 21, 930. [Google Scholar] [CrossRef] [Green Version]
  24. Nadav, L.; Eli, M. Radar Signals; Wiley: Hoboken, NJ, USA, 2004; ISBN 0-471-47378-2. [Google Scholar]
  25. Golay, M.J.E. Complementary Series. IRE Trans. Inf. Theory 1961, 7, 82–87. [Google Scholar] [CrossRef]
  26. Yang, G.; Duan, P.; Jiang, C.; Liu, T.; Lan, T.; Zhao, Z.; Shi, S.; Xu, C. Application of Biphase Complete Complementary Code for Ionospheric Sounding. Sensors 2018, 18, 2811. [Google Scholar] [CrossRef] [PubMed]
  27. Davies, K. Ionospheric Radio; P. Peregrinus on behalf of the Institution of Electrical Engineers: London, UK, 1989; ISBN 086341186X. [Google Scholar]
  28. Chen, H.; Yuan, K.; Yao, M.; Xiong, J. A Novel Composite Coding Method for Incoherent Scatter Radar. Atmosphere 2021, 12, 1518. [Google Scholar] [CrossRef]
  29. Foreman, T.L.; Wilson, S.G. Multiple Pulse Detection in Distributed Rayleigh Clutter. In Proceedings of the Record of the IEEE 2000 International Radar Conference [Cat. No. 00CH37037], Alexandria, VA, USA, 12–12 May 2000; pp. 637–642. [Google Scholar]
Figure 1. In this figure, (a,b) are the ambiguity function and ACF of the 13-bit Barker code, respectively, (c,d) represent that of the 16-bit complementary code, (e,f) represent that of the 40-bit Barker-like code, and (g,h) represent that of the Bernoulli Map.
Remotesensing 15 03747 g001
Figure 2. The ACF simulations of the four different coding sequences with different SNRs; (a) 13-bit Barker code, (b) 40-bit Barker-like code, (c) 16-bit complementary code, (d) Bernoulli map code. (1–4) represent the ACFs simulations in different SNRs (−5 dB, −12 dB, −17 dB and −20 dB).
Remotesensing 15 03747 g002
Figure 3. Field deployment of CCDI. (a) Antenna unit; (b) system hardware.
Remotesensing 15 03747 g003
Figure 4. Block diagram of the CCDI system.
Remotesensing 15 03747 g004
Figure 5. Sounding timing of the CCDI system.
Remotesensing 15 03747 g005
Figure 6. Influence of interference on ACF and ionogram. (a) Ionogram; (bd) ACF of 6.2 MHz, 7.45 MHz, and 9.975 MHz, respectively. Acquisition time (UTC): 06:56:59, 6 April 2022.
Remotesensing 15 03747 g006
Figure 7. Comparison of ACFs between Barker-like coding and Bernoulli map coding. In Figure 7, the echo signal acquisition time of the six frequency points is universal time (UT), and the acquisition time was as follows: Barker-like at 06:56:59, 6 April 2022 and Bernoulli at 06:51:43, 7 April 2022. (af) The comparison of ACFs at 4.8 MHz, 5.775 MHz, 6.175 MHz, 6.6MHz, 7.075MHz and 7.475 MHz, respectively.
Remotesensing 15 03747 g007
Figure 8. Comparison of ionograms between Barker-like coding and Bernoulli map coding. The six subgraphs in the figure are all acquired in universal time (UT). The specific collection time was as follows: (a) 06:10:18, 6 April 2022; (b) 06:06:02, 7 April 2022; (c) 07:31:55, 6 April 2022; (d) 07:13:09, 7 April 2022; (e) 20:09:03, 6 April 2022; (f) 20:05:23, 7 April 2022.
Remotesensing 15 03747 g008
Table 1. The sequence generated by Bernoulli mapping.
NumberCode
S e q 0 −1,−1,−1,1,1,−1,−1,−1,1,1,1,−1,1,−1,−1,1,−1,1,−1,−1,−1,1,−1,−1,1,1,1,1,1,1,−1,1,−1,−1,1,1,1,1,−1,1
S e q 1 −1,−1,−1,−1,−1,−1,1,−1,−1,1,−1,1,1,−1,−1,−1,−1,1,1,1,−1,−1,−1,1,−1,1,−1,1,−1,1,−1,−1,1,1,1,−1,1,1,−1,−1
S e q N −1,1,−1,−1,1,−1,1,1,−1,1,1,1,−1,−1,−1,1,−1,−1,1,1,1,−1,1,−1,−1,−1,1,1,1,1,1,−1,1,1,1,1,1,−1,−1,1
Table 2. The performance of the coding sequences.
13-Bit Barker Code16-Bit Complementary Code40-Bit Barker-Like Code40-Bit Bernoulli Map Code
PSL (dB)−22.28/−22.50−46.02
ISL (dB)−0.70/−1.94−25.50
NS (dB)11.1412.041616
Table 3. CCDI system specifications.
ItemSpecification
AntennaA pair of orthogonal Δ
Transmitted peak power500 W
Coding sequence40-bit Bernoulli or Barker-like
Coding chip width10 μs
Operating frequency
Frequency step
1–30 MHz
25 kHz, 50 kHz, 100 kHz
Receiver bandwidth
IF
100 kHz
70 MHz
ADC sampling
Coherent accumulation times
40 MHz
100
Detecting rang
Range resolution
67.5–560.1 km
1.5 km
Disclaimer/Publisher’s Note: The statements, opinions and data contained in all publications are solely those of the individual author(s) and contributor(s) and not of MDPI and/or the editor(s). MDPI and/or the editor(s) disclaim responsibility for any injury to people or property resulting from any ideas, methods, instructions or products referred to in the content.

