Article

Using InSAR and GPR Techniques to Detect Subsidence: Application to the Coastal Area of “A Xunqueira” (NW Spain)

by
Alex Alonso-Díaz
1,*,
Josué Casado-Rabasco
2,
Mercedes Solla
1 and
Susana Lagüela
2
1
CINTECX, GeoTECH Research Group, Universidade de Vigo, 36310 Vigo, Spain
2
Department of Cartographic and Terrain Engineering, Universidad de Salamanca, Calle Hornos Caleros, 50, 05003 Avila, Spain
*
Author to whom correspondence should be addressed.
Remote Sens. 2023, 15(15), 3729; https://doi.org/10.3390/rs15153729
Submission received: 14 June 2023 / Revised: 19 July 2023 / Accepted: 21 July 2023 / Published: 26 July 2023
(This article belongs to the Special Issue Review of Application Areas of GPR)

Abstract

:
Climate change represents an important cause of subsidence, especially in coastal cities affected by changes in surface water level and water table. This paper presents a complementary study of Interferometric Synthetic Aperture Radar (InSAR) and Ground Penetrating Radar (GPR) for the early detection of subsidence and sinkhole phenomena. The methodology was applied to a coastal urban area in Galicia, northwest Spain (humid region), showing apparent signs of subsidence and building settlement during the last two years. Two different InSAR methods are compared for the period from June 2021 to March 2022: PSI (Persistent Scatterer Interferometry) and SBAS (Small Baseline Subsets), and the average deformation velocities obtained resulted in −3.0 mm/yr and −4.1 mm/yr, respectively. Additional GPR data were collected in January 2022 to validate the InSAR results, which detected subsidence in agreement with the persistent scatters obtained from the PSI method. This is crucial information to plan preventive maintenance.

1. Introduction

Soil deformation represents an important issue for infrastructure, implying a major hazard for people and property. The most dangerous and undetectable type of soil deformation are sinkholes [1,2]. As defined by [3], “these are karstic features formed by movement of rocks and sediments into voids created by the dissolution of water-soluble rocks”. Unpredictable and sudden collapses may then happen when the soil or rock abruptly breaks, or generating subsidence if a gradual settling happens without abrupt rupture. These types of failures have increased in number in recent decades. As an example, the Florida Department of Environmental Protection reported 4159 sinkholes between 1909 and 2022 [4,5]. Climate change is among the major triggers of this increase, with an estimation of a 1 to 3% increase in the number of sinkholes per 0.1 °C rise in mean global temperature [6].
Climate change is combined with human factors in the most populated coastal areas to cause a dangerous effect called “sinking cities”: the main effect of climate change is sea-level rise, a consequence of the global warming that provokes the melting of glaciers and the polar ice caps, in addition to the expansion of sea water associated with the water temperature increase. What is more, global warming provokes a change in the rain regime and an augmentation in water evaporation, increasing the need for water consumption by population and vegetation, and consequently reducing the recharging of the water reservoirs and lowering the water table, especially in humid regions [7]. The withdrawal of the water table produces material compaction, consequently provoking the shrinkage of the soil [8]. On the other hand, human actions such as extraction of water, fuel, or gas, mining, and overloading of cities due to unsustainable construction, provoke vertical land motion, which exacerbates the effects of sea-level rise [7,8,9]. Both sea level rise and land subsidence of coastal areas cause problems such as inundation, storm surges, high waves, and erosion [9].
As subsidence is a major problem, different methods for detecting this type of soil deformation are currently being used. Mitigating the hazards associated with land subsidence requires knowledge of the spatial distribution of the ground deformation, which is usually known only at certain point locations. The purpose of subsidence detection methods is to determine the area affected by subsidence, subsidence velocities and accelerations, and the causes of subsidence, as well as the evaluation of the preventive measures to be taken.
Traditionally, dynamic topographic techniques are used, which consist of the observation of control points at different times, by subtracting the corresponding DEMs (Digital Elevation Models) [10]. In addition to traditional topography, photogrammetric methods can also be applied to the evaluation of subsidence; these methods determine the geometric properties of an object from images captured from different angles, thus creating a stereoscopic view, used for example in [11] together with leveling techniques. If GNSS stations are available in the area, subsidence patterns can also be investigated. For example [12], analyzed anthropogenically induced subsidence from 10 years of GNSS (Global Navigation Satellite System) data, while [13] developed a real-time subsidence monitoring system using GNSS data from a six-month period. In addition, current research is dealing with the application of machine learning algorithms for the prediction of subsidence from GNSS time-series data [14]. Machine learning algorithms are also being developed for the modeling and prediction of land subsidence from a dataset of different types of data, including some of the risk factors of subsidence: topography, geomorphology, hydrology, and lithology [15].
Regarding the use of remote sensing techniques to detect deformations, these are divided into LIDAR (Light Detection and Ranging) [16], and RADAR (Radio Detection and Ranging) techniques. The latter includes spaceborne radar, with the use of InSAR (Interferometric Synthetic Aperture Radar) techniques [17,18,19]; but also, the GPR (Ground Penetrating Radar), used in conjunction with InSAR, as in [20]. InSAR is the most extensively used technique for the monitoring of land deformations, due to its capability of measuring topography at large and local scales (from km to mm), and both as a standalone technique [21], or combined with other techniques such as GNSS [22], which can also be used for the calibration of the InSAR method [23].
The information achieved with spaceborne radar techniques is only partially equaled using current field technologies, such as leveling or GNSS stations [24]. The precision and accuracy of these systems are well known, but, on the other hand, they provide deformation information only in correspondence with the device positions and exclusively from the beginning of the field campaign. Moreover, their installation usually requires a considerable investment in resources. On the other hand, the InSAR configuration allows the investigation of entire systems in a relatively short time compared to current monitoring systems, and does not require in situ installations, since it takes advantage of the reflecting elements already present on the surface. Moreover, this method does not interfere in any way with the usual activity in the study area.
The combination of GNSS and InSAR data has provided valuable insights for a better understanding of various geodetic phenomena. It proved to be a powerful tool for studying the relationship between crustal deformation and fault activity [25], earthquake ruptures characteristics [26], and landslides (informing about deformation, strain and impact on the terrain) [27]. The importance of combining GNSS and InSAR for validation purposes has been highlighted [28] after evaluating the accuracy of InSAR results using GNSS analysis techniques in areas with medium to high-grade deformation.
This work presents the application of InSAR to the characterization of land subsidence. Two different processing techniques are applied, PSI (Persistent Scatterer Interferometry) and SBAS (Small Baseline Subsets), with the aim of evaluating the capacities of each technique for land subsidence detection and characterization at a local scale. The GPR technique is used as a complementary method, providing more details for the complete understanding of the occurring phenomena. The study is performed through its application to a real case study, an area affected by land subsidence and sinking buildings in the city of Pontevedra (NW Spain). This case study was selected as a representative city of the areas most potentially affected by land subsidence due to climate change: a coastal city in a humid region that grew towards the coast by means of land refills.

Complementary InSAR and GPR Surveying

Table 1 compiles previous studies using both InSAR and GPR on sinking building assessment, highlighting the advantages of the combination.

2. Materials and Methods

2.1. Description of the Case Study

The case study is in the vicinity of the Forestry Engineering School (42.440250°N 8.636861°W, coordinates defined in WGS84) at the Xunqueira University campus (Figure 1) belonging to the University of Vigo. It is in the city of Pontevedra, next to one of the meanders of the Lérez River near the mouth of the Pontevedra estuary. The campus was built in the 1990s [38] in a wetland area, as shown in the historical map of this zone (Figure 1c).
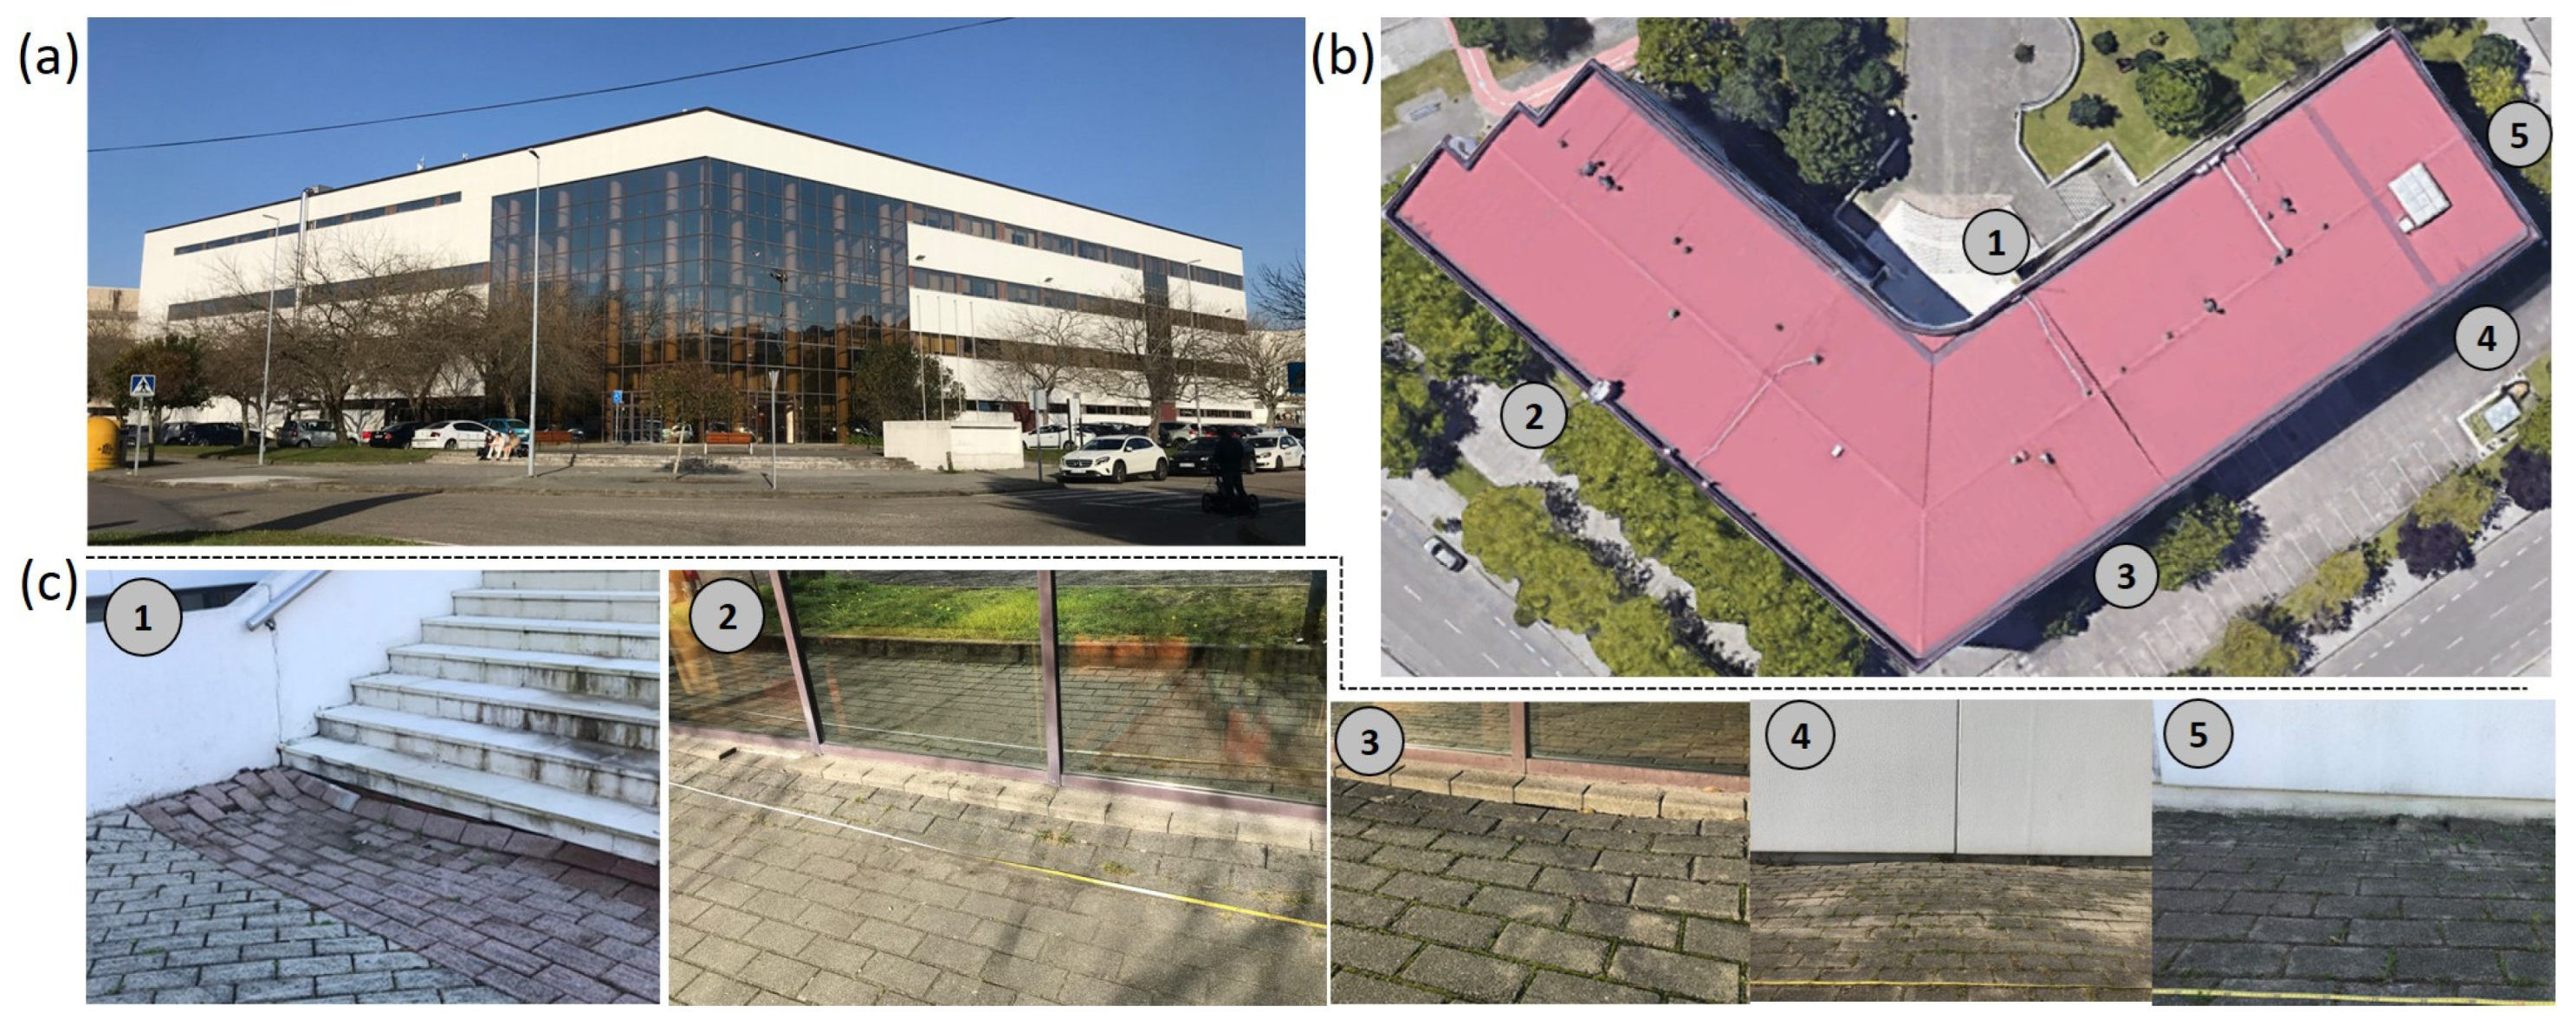
In the case of the buildings, they were anchored to firm foundations, so their safety is assured. However, during the last two years, it was possible to observe defects in pavements, sidewalks, and land roads in the area, such as potholes and subsidence. The case of the Forestry Engineering School is remarkable, showing land subsidence and subsequent rupture of its paved-around building foundations, as observed in Figure 2.
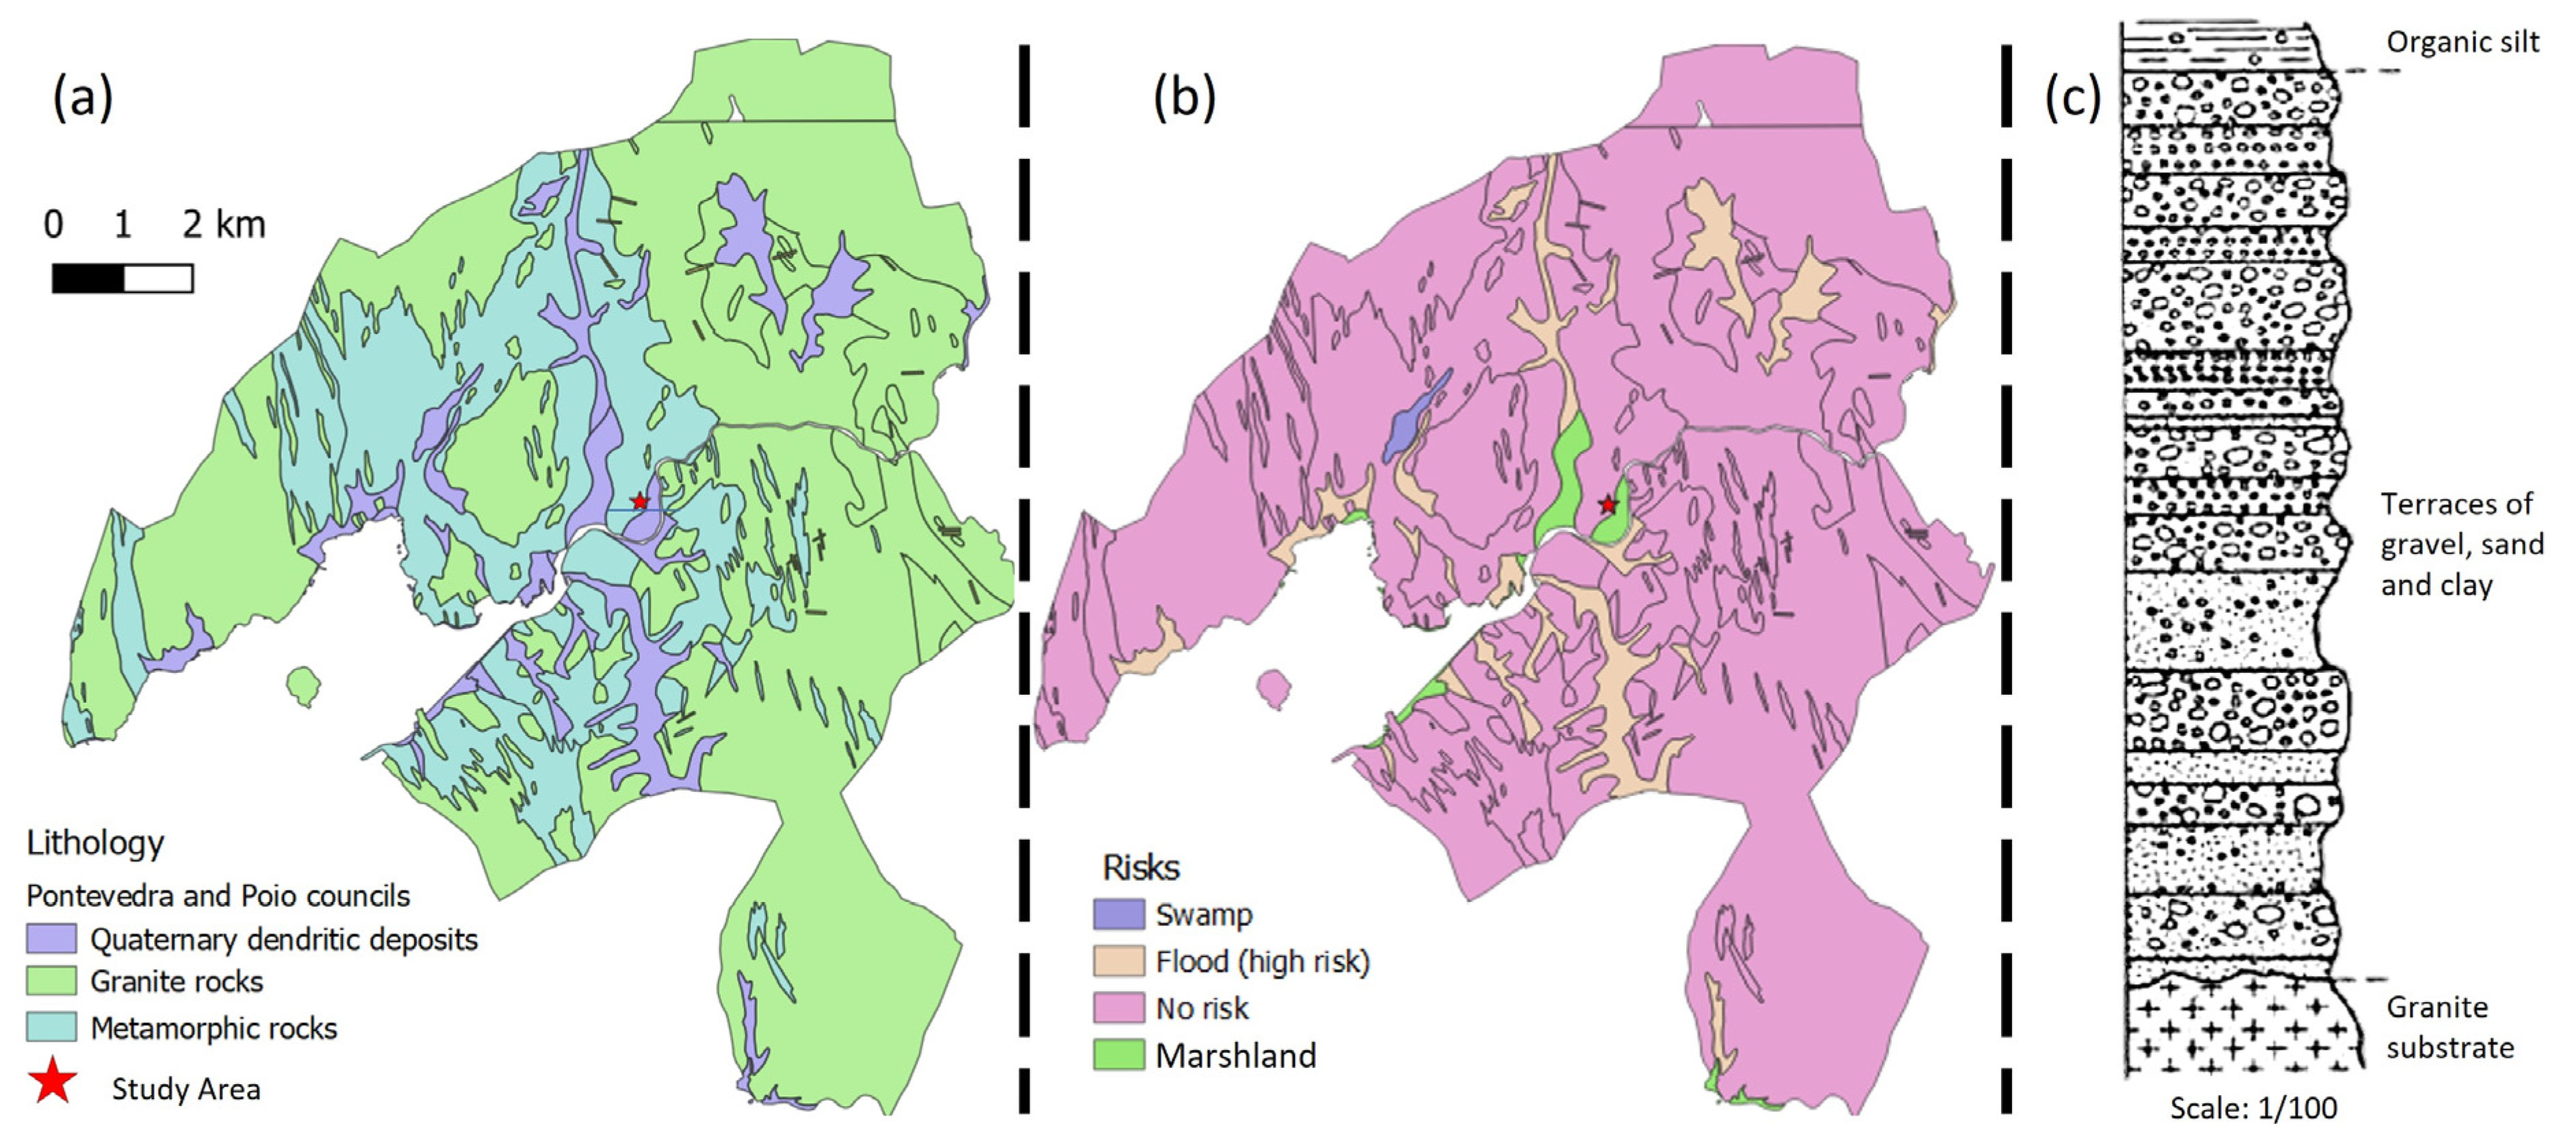
Moreover, the following maps in Figure 3 show the lithology (a) and risks (b) for the area under investigation. This area is characterized by the lithological composition resulting from the interaction of quaternary dendritic deposits over a marshland zone and metamorphic rocks. The lithology in this region is diverse and presents a range of geological formations. The quaternary dendritic deposits consist mainly of unconsolidated sediments of small thickness (on the order of a few dm), made up of organic silt with passages of fine sand, clay and gravel, which have been transported and deposited by the ocean tides and floods. These deposits often exhibit stratification and variable compaction and grading. These superficial deposits rest on a diverse substratum of granite, gneiss or schist. Adjacent to the quaternary deposits, the metamorphic rocks emerge, thus revealing the transformative effects of heat, pressure, and chemical alteration. The metamorphic lithologies in the area include schists, gneisses, and marbles, with distinct foliation and mineralogical characteristics [40].
The settlement phenomena observed in the area surrounding the Forestry Engineering School, built at the end of the 1990s, can be related to the coastal risk map developed by the Climate Change American Organization (Figure 4, based on [42]). According to [43], the area under study will be affected by sea-level rise in 30 years if the effect of climate change continues.

2.2. Methodology

2.2.1. InSAR Data and Processing

Synthetic Aperture Radar (SAR) instruments are spaceborne active imaging systems that provide images of the Earth’s surface using microwave and radio frequency electromagnetic radiation [44]. SAR products consist of complex-valued images, each pixel containing amplitude and phase information [45].
Radar interferometry, or InSAR, is a technique that applies interferometric methods to SAR images. The interferogram obtained from the coupling of two SAR images acquired in different moments contains the phase difference between the received signals, which is related to the path of the wave reaching a ground target, that could have moved in the time interval between the acquisitions of the images [46]. Therefore, by comparing the images of the surface at different times, changes over time may be detected and monitored. The approach that converts the interferometric phase difference into surface displacement by removing topography is called Differential Interferometry SAR, or DInSAR [45,46]. This technique is widely used to measure natural geophysical phenomena, as well as to monitor ground displacements caused by human activities [47].
The interferometric phase difference contains some unwanted phase components due to topographic model inaccuracies, atmospheric artifacts, and orbital parameters, among others. The following equation can be used to consider all unwanted artifacts, together with the phase components due to deformation or displacement, and topography [48,49,50]:
Δϕ = Δϕ_{disp} + Δϕ_{topo} + Δϕ_{artifacts}
where Δϕ_{disp} is associated with the displacement in the LOS (Line Of Sight) direction, which is linked to soil deformation; Δϕ_{topo} represents the contribution of the topography; and Δϕ_{artifacts} includes all contributions due to errors and inaccuracies, including inaccuracies of the topographic model. Therefore, subtracting the phase due to topography and the component due to errors and inaccuracies, the deformation component is obtained.
The latter may limit the applicability of the technique, as the phase component due to ground motion may be overshadowed by contributions due to variations in atmospheric properties or errors in the determination of the orbital parameters or the surface elevation model [46]. Moreover, changes in the scattering properties of the Earth’s surface with time and with respect to the angle of incidence may add a noise phase component, which leads to decorrelation phenomena. Therefore, decorrelation and atmospheric inhomogeneities limit the application of DinSAR [46,51].
To overcome the limitations of conventional DInSAR, advanced InSAR techniques were developed [51,52]. These techniques reduce sources of error by analyzing the time series of SAR images and allow the extraction of the temporal evolution of the surface deformation [46,49,53,54]. These advanced methods extract deformation signals only from points with certain scattering properties, called persistent scatterers (PSs) and distributed scatterers (DSs) [48]. PSs are ground objects that can maintain stable scattering properties over long periods of time, while DS targets contain several small and random scatterers, with none being dominant [55].
A remarkable PS technique is PSI [51], which identifies permanent scatterers and operates on a time series of interferograms all formed with respect to a single master SAR image. PSI makes it possible to associate deformation with a specific scatterer, rather than a resolution cell of dimensions dictated by the radar system [46].
The SBAS algorithm is among the DS-based techniques [52], which uses a multi-master interferogram stack aimed at reducing geometric and temporal decorrelation effects by forming interferograms only between images separated by a short spatial and temporal baseline (i.e., spatial and temporal distance between the two acquisitions) [55].
On one hand, the PSI method informs about critical points that could be associated with subsidence or even forming sinkholes. This is crucial information for further analysis with in situ techniques, in order to validate the InSAR results and to analyze the possible cause of the subsidence or critical points detected. However, the PSI method has some limitations, such as, for example, uncertainties regarding the proper position of a PS, or even the existence of a PS in the target area. Those factors are influenced by external variables such as vegetation, coherence between images, master image, data contamination and process. Due to these factors, it is important to compare PSI results with those obtained with the SBAS method, since significant risk areas could not be properly detected. As the SBAS method is less affected by external variables, it creates a matrix over the entire study area, thus providing information on all areas, while the PSI method obtains scatters.
On the other hand, the SBAS method provides deformation information over an entire radar resolution cell, i.e., the signal synthesized from a set of surface scatterers. This allows the study and monitoring of large-scale deformation but prevents focusing on specific reflectors. As no stable reflectors are required, SBAS is a technique applicable in rural or mountainous areas, bare soil or rock. However, as a multi-reference network method, the applicability of SBAS is generally restricted to datasets that satisfy the necessary baseline and spatial coherence conditions. A dense network must be created with the optimal quality.
More theoretical background about the InSAR technique, and both PSI and SBAS methods, can be found in [46].
Figure 5 was elaborated based on the review in [56]. Observing the graphics in Figure 5b, it is possible to conclude that the Sentinel-1 satellite has been the most used and that PSI was generally the technique chosen to monitor displacements in urban cities.
In this paper, Pontevedra (Galicia, NW Spain) and its surroundings were investigated using two different sets of Sentinel-1 C-band SAR images in order to derive land subsidence information. In the case of infrastructure, X-band resolution is more convenient, but the lack of data and free-access satellites in this band complicates its application. For this reason, in this paper the Sentinel-1 is selected, as it has been proved as a band for the detection of possible sinkhole movements [31].
Initially, a time series from January 2020 to March 2022 was considered to investigate the evolution of vertical deformation (long-term study) in the area. The SBAS dataset consisted of 126 SAR images from descending orbits, as summarized in Table 2. The PSI dataset consisted of 125 SAR images from descending orbits too, as shown in Table 2. The processing has been carried out by applying the SBAS and PSI techniques, respectively. SAR images were downloaded from the Alaska Satellite Facility (ASF), as they are provided by the European Commission (EC) as part of the Earth-observation Copernicus program.

PSI Processing

The PSI processing consisted of two different steps: (1) single master DInSAR pre-processing using ESA SNAP [57], and (2) the PSI processing using StaMPS [58].
The data pre-processing was performed using ESA SNAP 8.0 (Sentinel Application Platform) software, a multimission toolbox that also includes SAR and optical data processing tools. The first activity consists of determining the master image, which is chosen by optimizing the temporal distance and the perpendicular baseline.
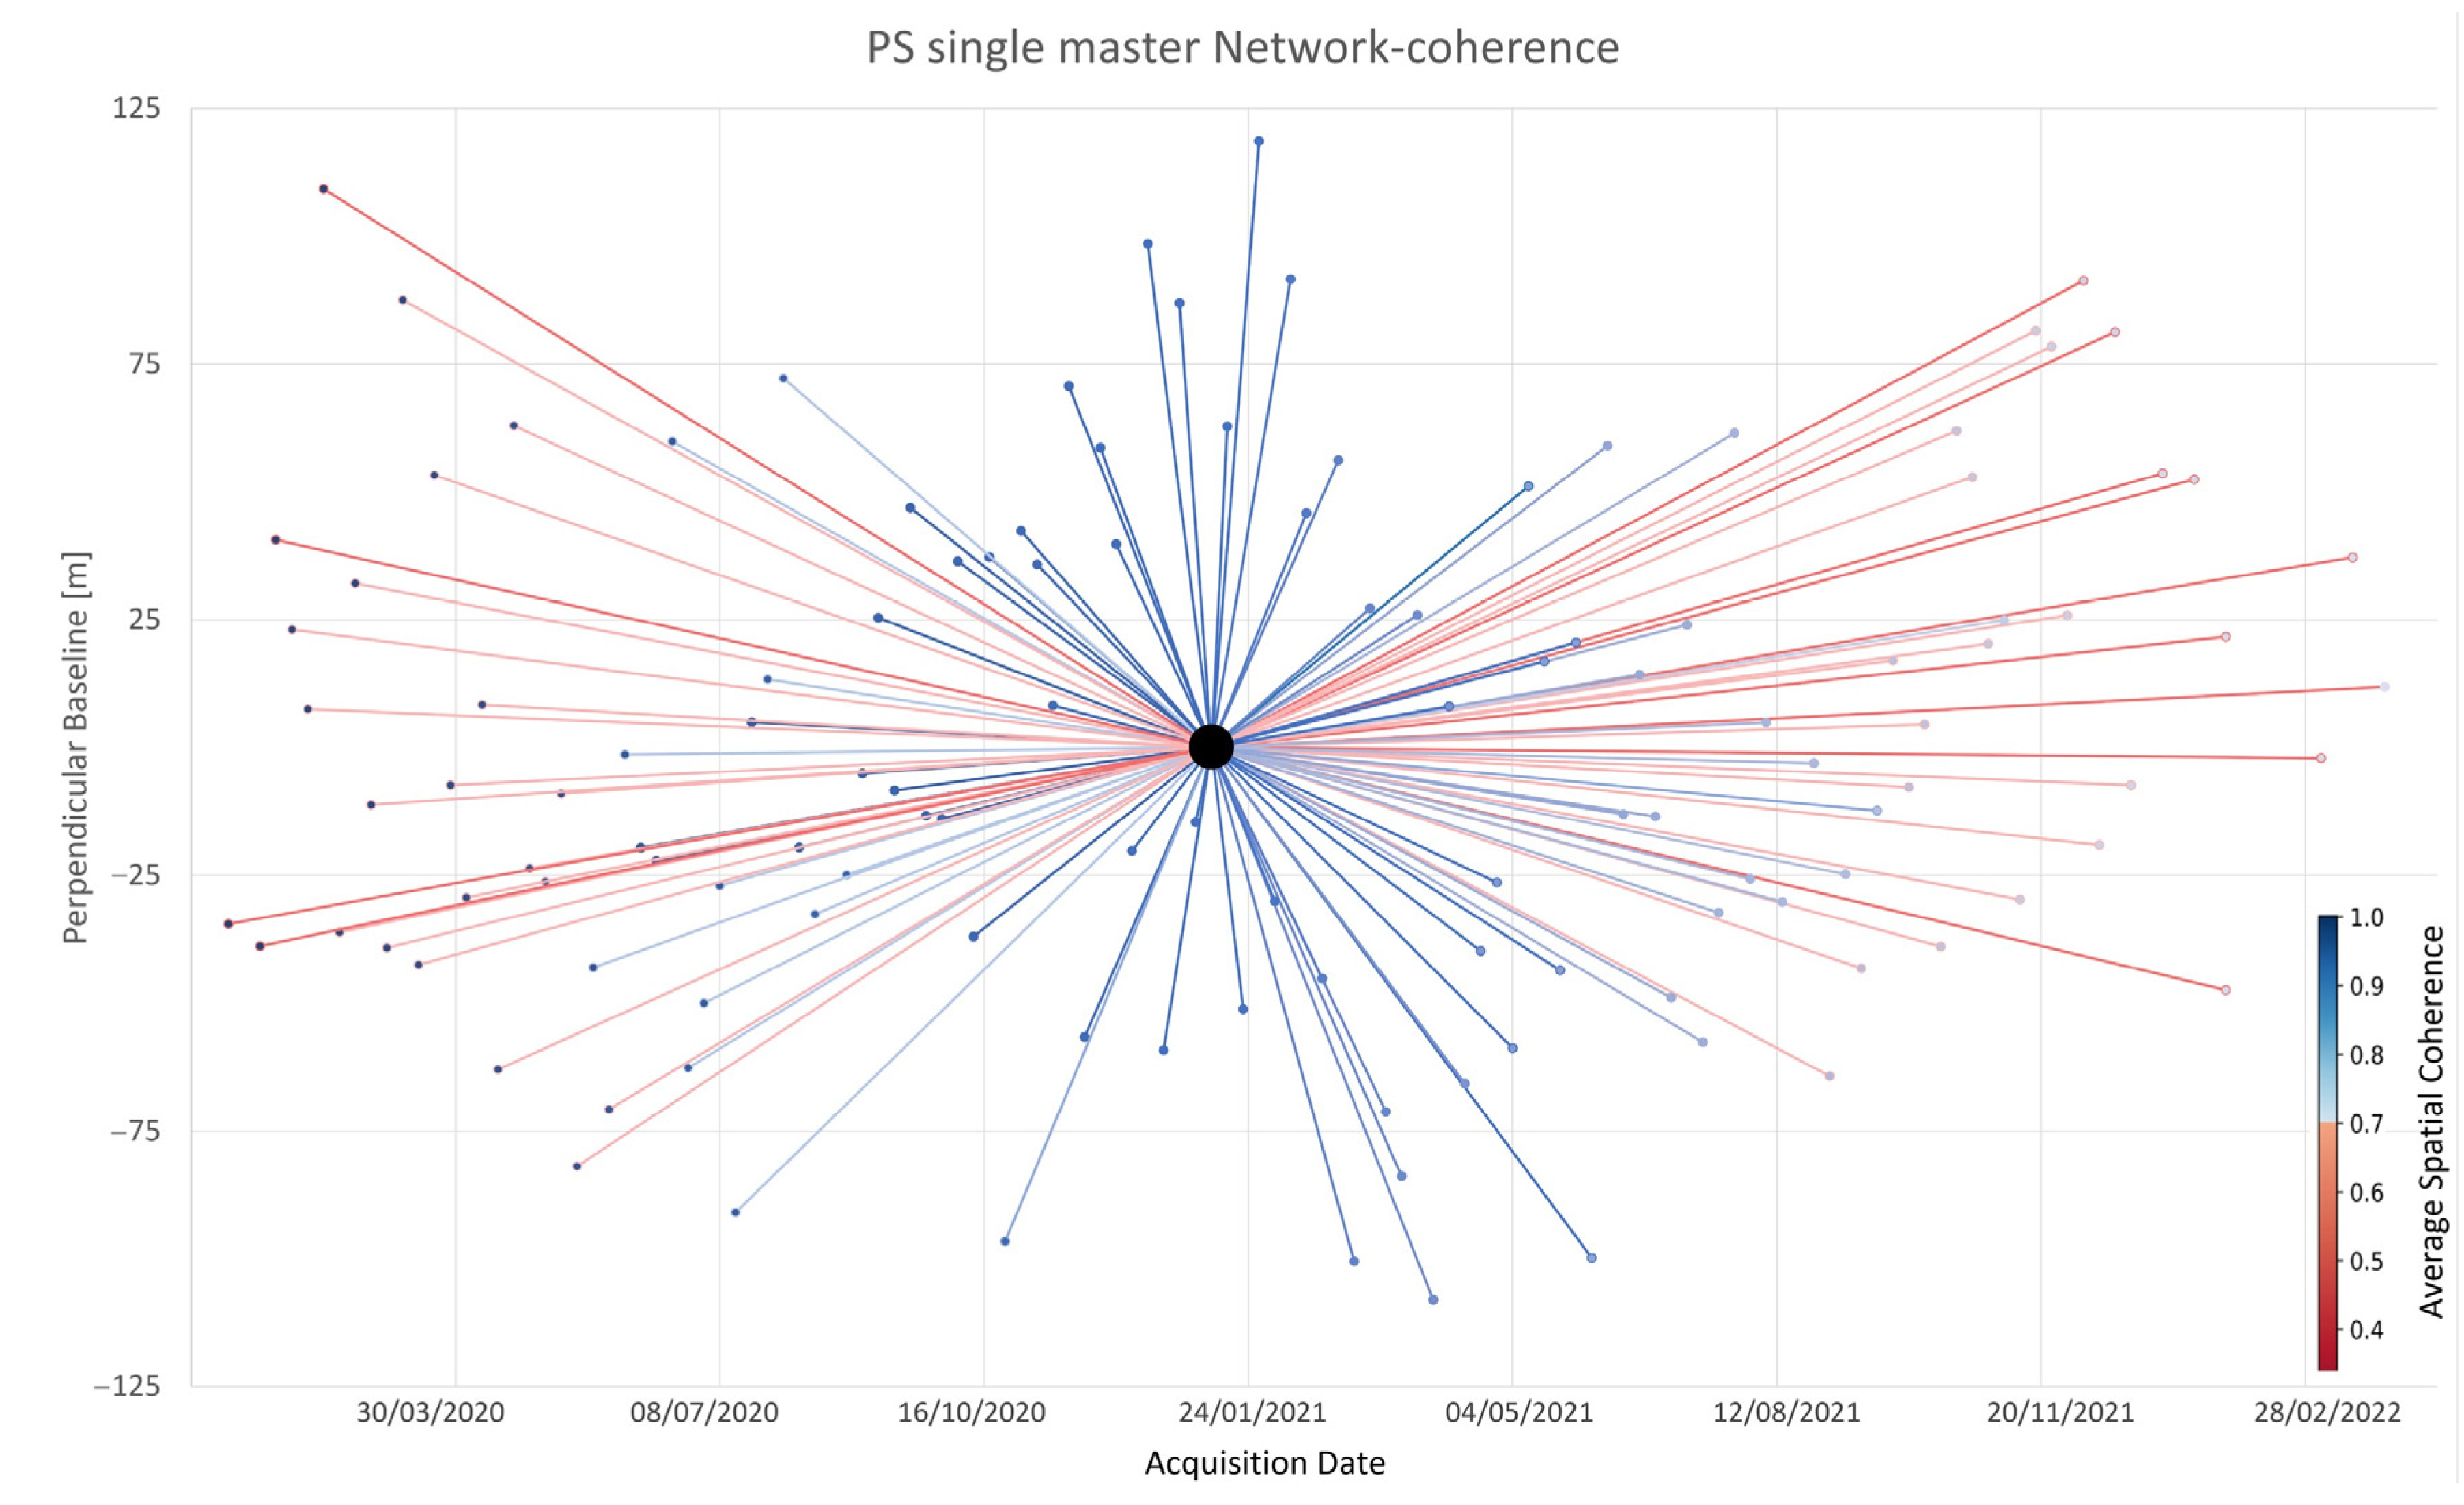
Figure 6 shows the PSI network, where the thick black point represents the master image, and smaller points are the slave images. The slave–master link represents the interferogram, and the colormap of this link is associated with the average spatial coherence between them, where the red color means low coherence and the blue color means high coherence, setting the limit of acceptance at 0.6.
The following tasks focus on the data preparation: splitting the satellite images, creating an interferogram-co-registration combo for each master-slave pair, and exporting to StaMPS process to apply the PSI technique).
After the pre-processing, the data were processed with StaMPS, a free package developed for research purposes, which incorporates PSI and SBAS methods to measure ground displacements from a time series of SAR acquisitions [59].
The processing consists of 7 steps which are 7 StaMPS code functions that filter and process the data until reliable results are obtained (Table 3). Each step is defined by different parameters with default values that can be adjusted depending on the case study. The values of the training document [60] were implemented. In addition, atmospheric and orbital corrections are also performed using the TRAIN (toolbox for reducing atmospheric InSAR noise) extra package. Finally, a reference point located at 8.690775°W, 42.519278°N (all coordinates defined in WGS84) was selected to obtain the final values. This reference area was chosen for mid-stage data neutrality.
The processing obtained from the PSI technique is satisfactory for three reasons. First, the master–slave coherence is acceptable, as seen in Figure 6 (a minimum coherence of 0.6). This coherence is due to the possible deviation from the baseline, the similarity of orbits, the environmental conditions, and the temporal distance between image acquisition. Second, the maximum error values estimated in the area are 0.4 rad, 0.05 rad/m and 0.5 rad associated with tropospheric, spatial and atmospheric corrections, respectively. These parameters are acceptable [46]. The spatially correlated DEM estimated error is around the hundredth radian/meter unit; the orbit phase and atmosphere error are less than two radians in the worst area of the interferograms. The phase tropospheric error (that is stable in A Xunqueira) was corrected using a linear tropospheric correction. Finally, the limit adjustment of the deformation velocity map associated with the reference point is 0.4 mm/yr. The interferogram area is around 4.4 km2.

SBAS Processing

The dataset characterized in Table 2 has been processed using the SBAS method, as implemented in the Miami InSAR time-series (MintPy 1.3.2) software [55], to invert a network of interferograms and retrieve surface displacement through time.
The HyP3 workflow pre-processing [61] is followed in order to generate the stack of differential interferograms that will be used to input MintPy. This pre-processing workflow will prepare the SAR images to be used in SBAS interferometry. The pre-processing resulted in a stack of multilook interferograms, which are also clipped so that the same area is represented in all of them.
The processing in MintPy is divided into two stages for the calculation of the time evolution of the surface deformation. In the first stage, the interferogram network is inverted to obtain the raw phase time series, and reliable pixels are selected based on a coherence threshold. The second part of the processing consists of separating the different phase contributions from the raw phase time series to derive the displacement series. The different processing steps may be consulted in [55].
Our selected network of interferogram pairs is based on baseline thresholds of 60 days and 131 m, as observed in Figure 7. From 126 SAR acquisitions covering the period from January 2020 to March 2022, 917 differential interferograms were computed following the HyP3 workflow. Average spatial coherence is greater than 0.399 for all interferograms, with a maximum coherence of 0.88.
In order to reduce the computational time, a subset area between longitudes 8.59°W and 8.83°W and latitudes 42.413°N and 42.576°N, approximately, is subjected to processing. The reference point used was the same as that for the PSI method.
The closure phase is defined as the cyclic product of the unwrapped interferometric phases of a triplet of interferograms, and its integer ambiguity, as defined in [55], is equal to zero for a triplet without unwrapping errors. Calling the number of triplets with non-zero integer ambiguity Tint, Figure 8a shows the spatial distribution of Tint and Figure 8b shows the histogram of its values, where the occurrence of potential unwrapping error, i.e., pixels with a non-zero value, may be assessed. In our case, Figure 8b shows no major peak with Tint > 0, meaning no coherence unwrapping errors in the dataset. Moreover, pixels in the area of study (green box in Figure 8a) have Tint = 0 (dark blue in Figure 8a), and are free of unwrapping errors.
The root mean square (RMS) of the residual phase (the component that can neither be corrected nor be modeled as ground deformation), is used to characterize the noise level. A SAR acquisition is marked as noisy if its RMS value is larger than three times the median absolute deviation, according to the workflow defined in [55]. This procedure suggests that the following dates should be omitted: 10 May 2021 and 7 September 2021. Reliable pixels are defined as pixels with temporal coherence greater than 0.7, according to [55]. The area of interest (Pontevedra and its surroundings) happens to be in a zone of high temporal coherence.
The computed raw phase time series is corrected by subtracting the phase contributions not related to deformation. This allows the average velocity at each pixel to be calculated as the slope of the line that best fits the series of displacements. In particular, and following [55], the tropospheric delay is estimated using Global Atmospheric Models, provided by the ERA5 dataset, and PyAPS 0.3.1 software; then, the topographic residual caused by a DEM error is estimated based on the proportionality with the perpendicular baseline time-series, and removed (in the case of study, Copernicus GLO-30 Public DEM is used); finally, the phase component that cannot be corrected is used to characterize the noise level, and a SAR acquisition is marked as noisy if its RMS value is larger than three median absolute deviations.

2.2.2. GPR Data Acquisition and Processing

GPR is a geophysical technique widely used to locate and map settlements and sinkhole formations without altering the foundation soil structure. The method allows for the identification of soil discontinuities, and the electromagnetic signal is reflected at the interfaces between adjacent media with sufficient dielectric contrast. The strength of the reflected echo, or amplitude, is proportional to the change in the magnitude of the dielectric constant. More theoretical background can be found in [62].
In comparison with other NDT (non-destructive testing) methods, the GPR provides high-resolution images of the subsoil, and it has the advantage of covering a wide area in a relatively short period of time with a reduced effort [63]. GPR studies focused on the assessment of the structural stability of buildings mainly include the inspection of foundation floor systems, damage in pavements, backfill soil analysis and condition status, and ground subsidence and settlement phenomena [64,65,66,67,68,69,70,71,72,73].
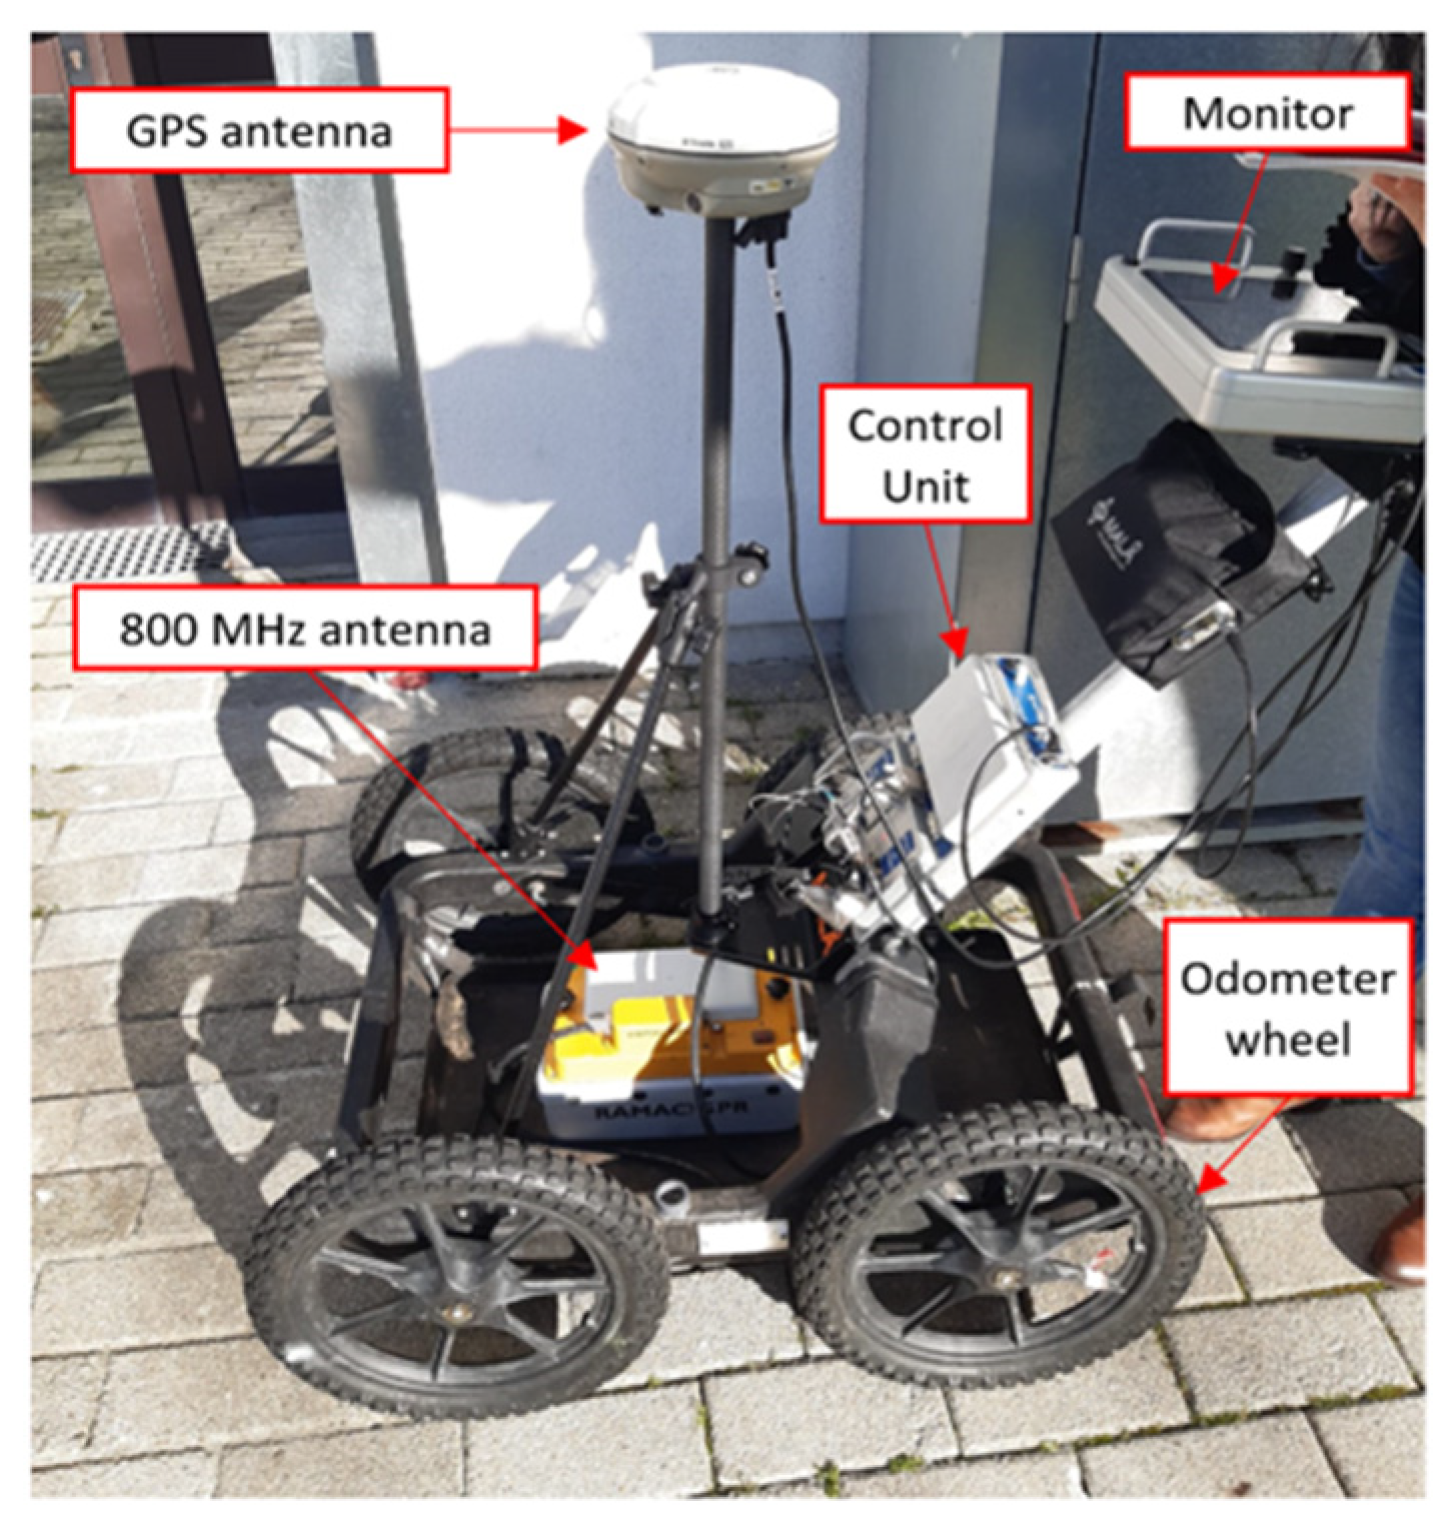
The GPR study was carried out in January 2022 using a ProEx system from the company Malå Geoscience, with 500 MHz and 800 MHz center frequency antennas (Figure 9). Five GPR profile lines were gathered around the building of the Forestry Engineering School. The data acquisition parameters selected were: 1 cm of trace-interval distance and a total time window of 95 ns (composed of 656 samples per trace) for the 500 MHz antenna, and 1 cm of trace-interval distance and a total time window of 61 ns (composed of 912 samples per trace) for the 800 MHz antenna. The GPR system was mounted on a survey cart equipped with an odometer wheel to measure the profile lengths and to control the distance between traces.
The GPR recorder signals were then processed with ReflexW v.9.5 software using the processing sequence described in Table 4. The signal propagation velocity used for migration was previously estimated using the hyperbola fitting method.

3. Results

3.1. PSI Results

The results obtained with the PSI method, for the time series from January 2020 to March 2022, are shown at the following scales: (a) global and (b) specific area.
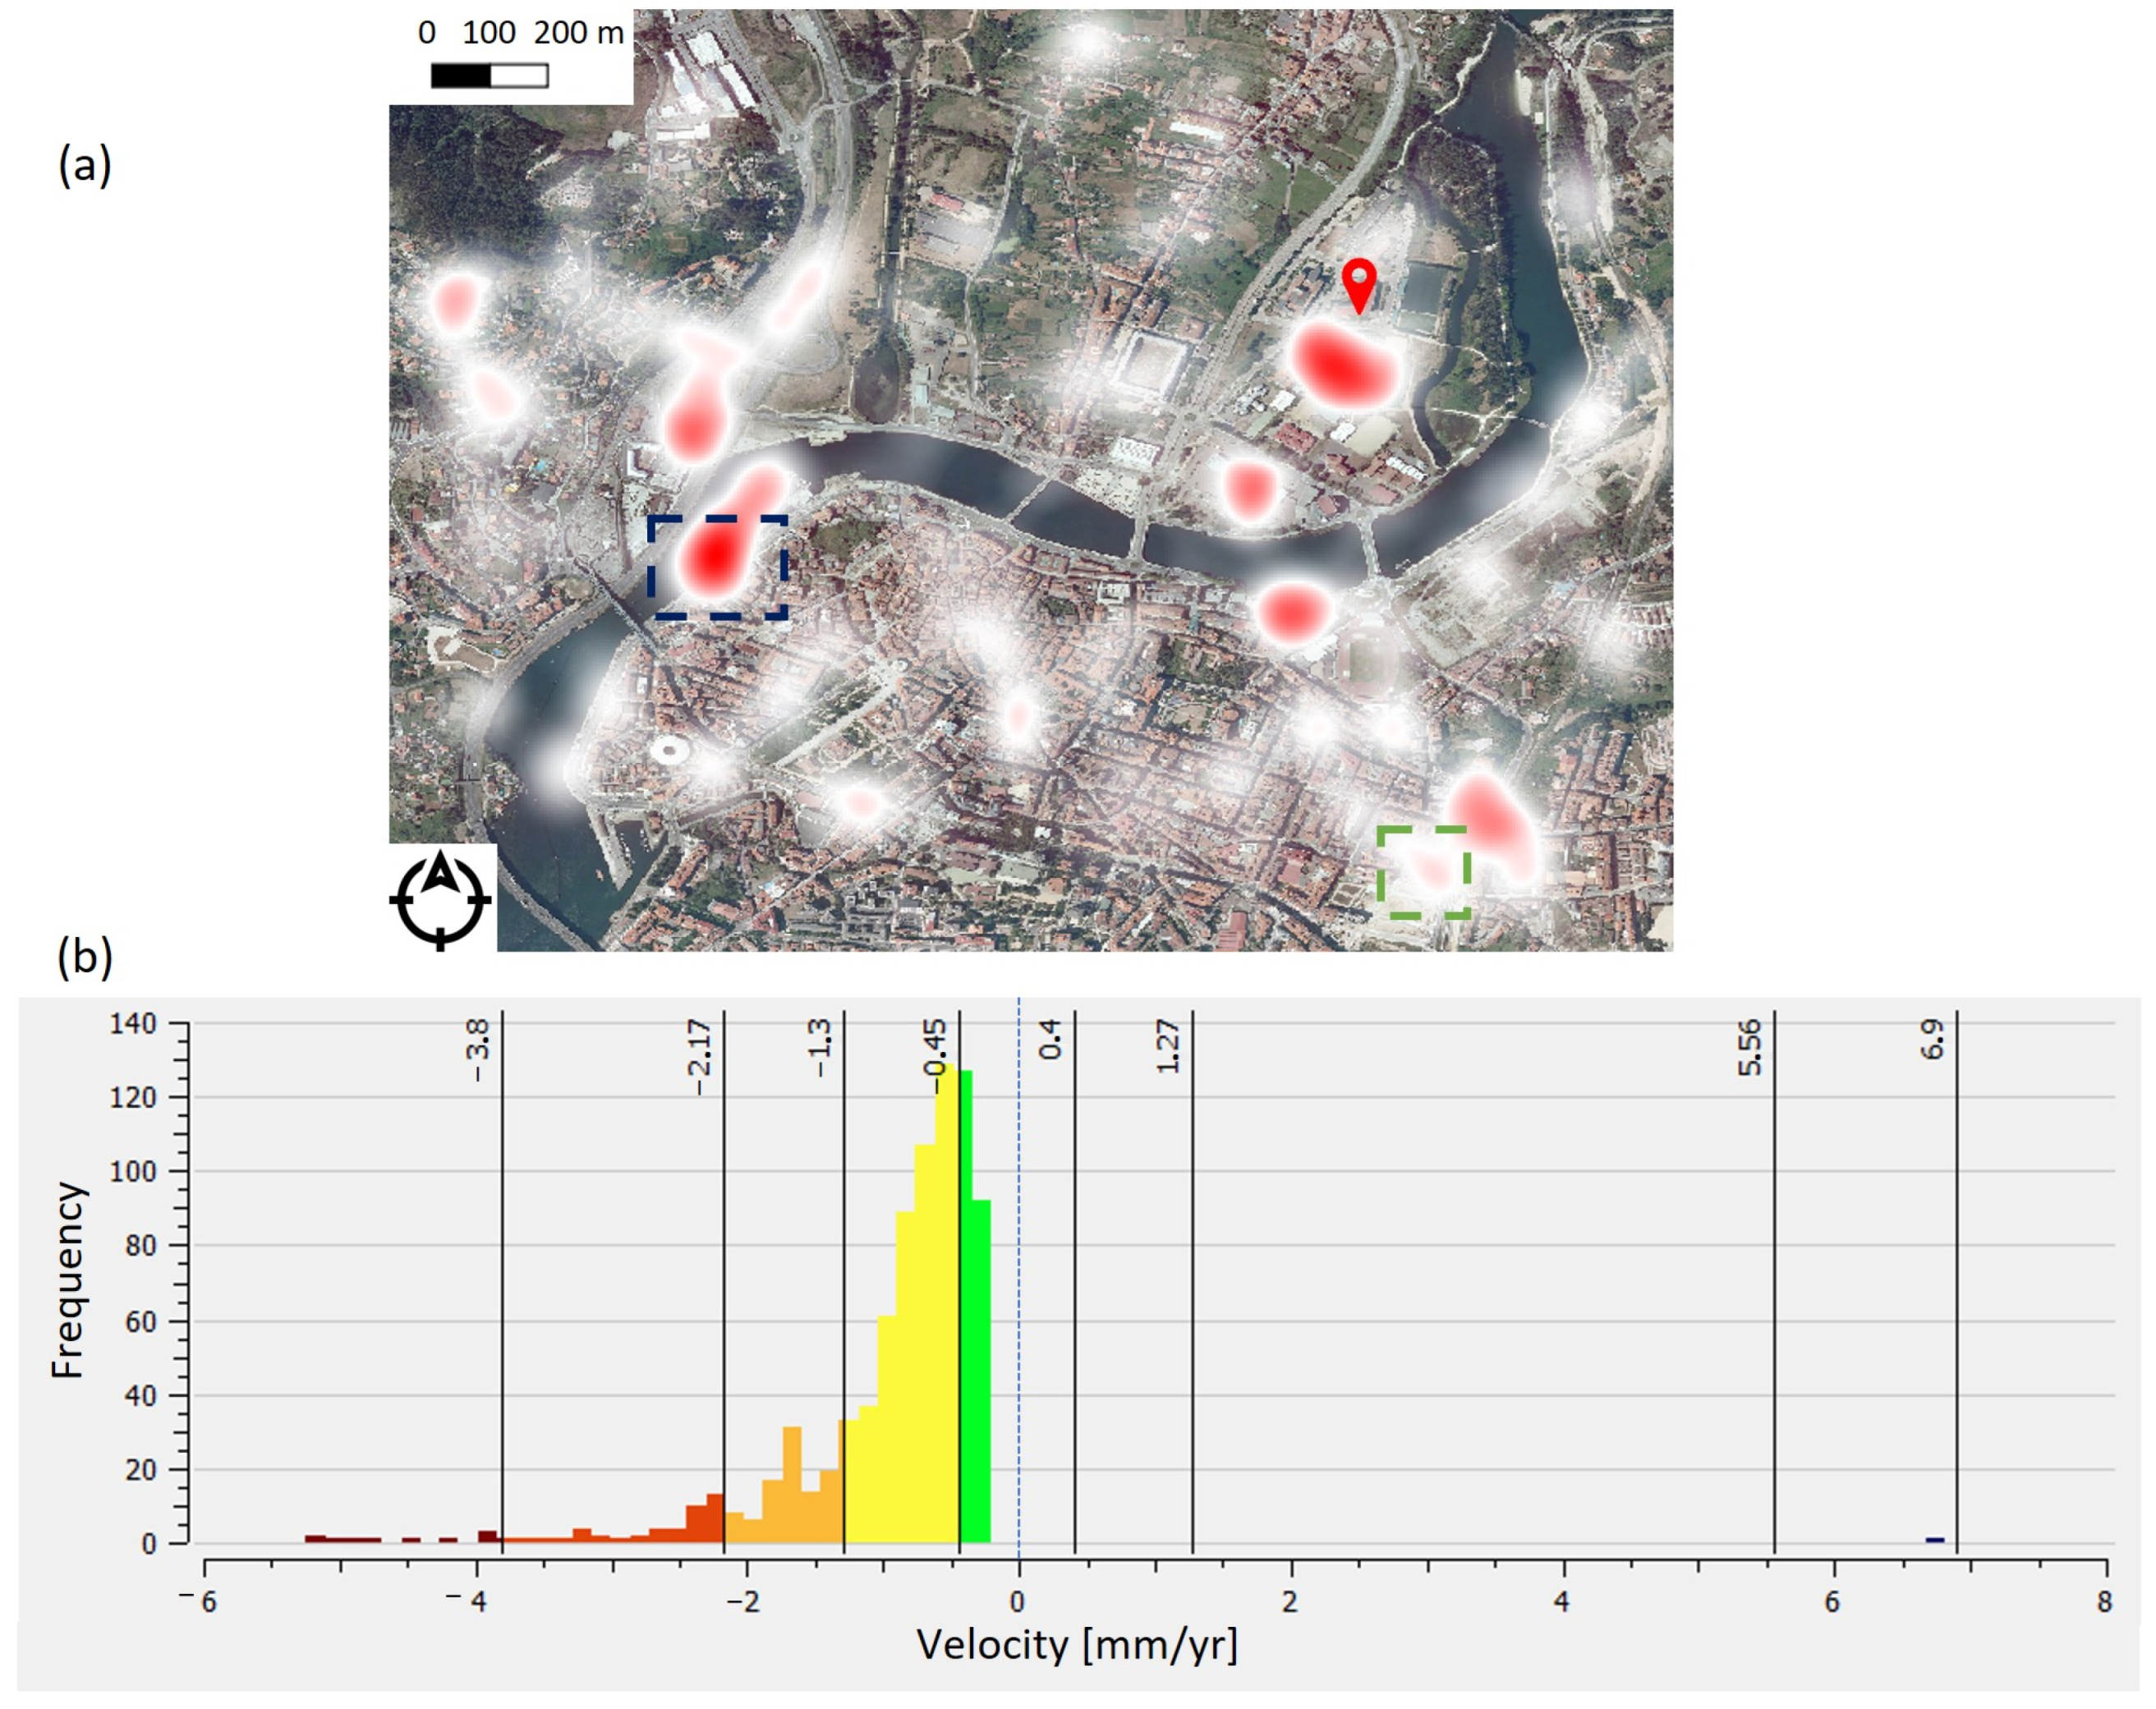
The global vision is shown in Figure 10. Figure 10a presents the heat map around the city of Pontevedra. The results show the areas with higher subsidence density, which correspond to areas such as the port (highlighted into a black dashed line box) (normal due to the variability of a port, activity and tides), a new construction area (highlighted with a green dashed line box) or the area of study (A Xunqueira) (marked with the red location icon). Moreover, Figure 10b represents the displacement velocity histogram of the area of the interferogram, showing a density peak in −0.45 mm/yr and the massive dominance of negative values.
Figure 11 shows the PSI results of the specific area of the Forestry Engineering School building. As observed in Figure 11a, the eight scatters obtained in this zone present different velocity trends (elevation in blue and subsidence in red), with low velocity deformation rates (maximum of 1.0 mm/yr and a minimum of −0.8 mm/yr). Taking into account the randomness of the location of the scatters, the area of influence of the PS is represented in Figure 11a. The visual failures identified in Figure 2 are located in similar areas to the scatters identified by the PSI method. Moreover, Figure 11b presents the mean temporal evolution of the scatters related to the Forestry Engineering building, including the linear trend and slope. The slope indicates a deformation velocity of −0.2 mm/yr. That velocity is not alarming, but tests with a long temporal spectrum (2 years in this study) must be filtered to obtain real data. In this case, the temporal evolution is stable and valid since 96.8% of the points are in a wide displacement range of 10 mm.
Considering the two-years velocity deformation in the area, a slight subsidence was observed. Therefore, the temporal displacement (Figure 11b) was analyzed to find the maximum stable subsidence in the temporal spectrum. Finally, these dates are from June 2021 to March 2022: it is consistent with the surface defect dates (2021–2022) and permits a comparison with the GPR results.

3.2. SBAS Results

According to Figure 12a, the average velocity in the area of interest is close to zero (−0.4 mm/yr) for the period from January 2020 to March 2022, and with negative values in most of the total area. Based on these results, considering the surface defect dates and the maximum stable subsidence spectrum obtained from the PSI method, a second time series was assumed. A total of 278 interferograms from 39 acquisition dates of the same data for the period from June 2021 and March 2022 were used. As shown in Figure 12b, the analysis of this shorter period allowed for highlighting a spatial pattern of subsidence in the city of Pontevedra, located along the Lérez riverbed and the “Marismas da Xunqueira de Alba” (marshlands).
In both time series, high temporal coherence has been obtained in the area of interest, due to the fact that it is located in an urban area, so that coherence can be maintained over long periods of time. The regions dominated by vegetation suffer from decorrelation phenomena over time, which explains the areas of lower coherence (masked out in Figure 12).
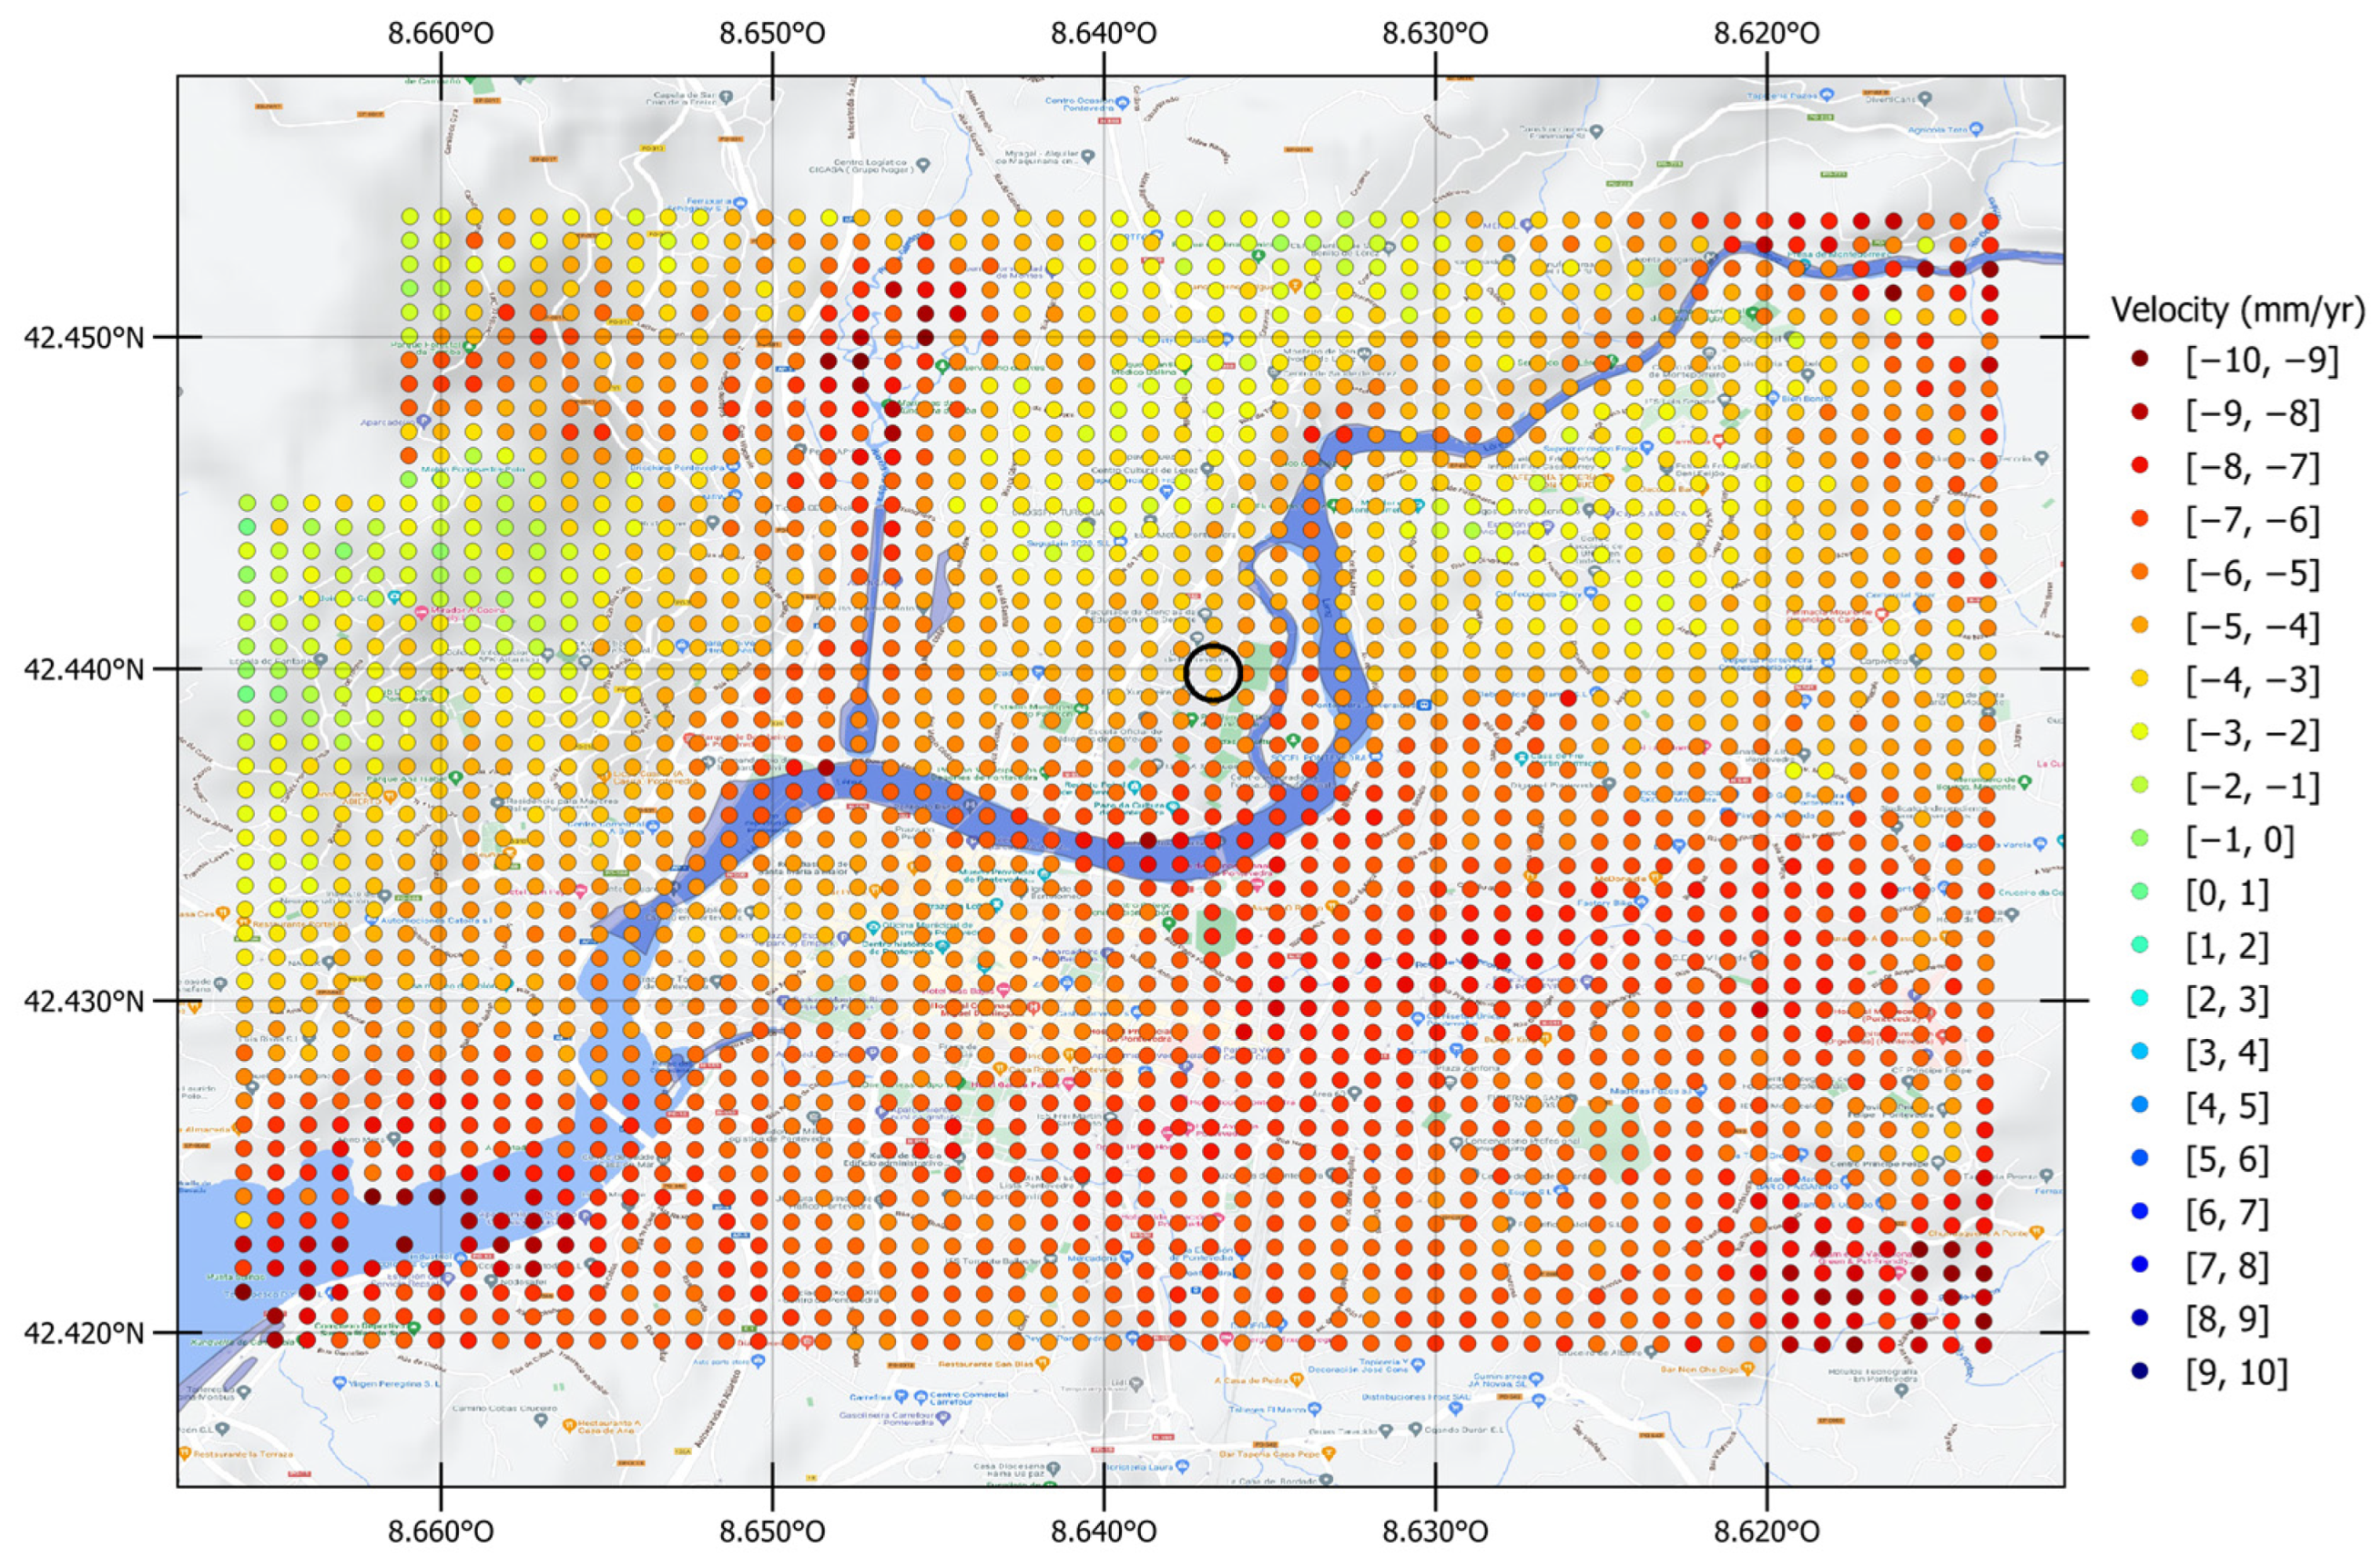
The trend for the velocity values was analyzed through the generation of velocity histograms, using the grid of data points shown in Figure 13. The location of the Forestry Engineering School is indicated with a black circle. The histograms (Figure 14) show another difference that can be perceived between both time series: the magnitude of the linear velocities found by this method shows more pronounced negative velocities for the whole area of the city of Pontevedra for the shorter time period. In the case of using the long time series, this zone is characterized by a velocity deformation close to zero, although mainly negative, as can be seen in the velocity histogram in Figure 14. The more frequent value of subsidence velocity (in the LOS direction) is near –6 mm/yr for the period June 2021 to March 2022, while the long time-series results in an estimation for the average velocity with a mode value at the interval [−1, 0] mm/yr.
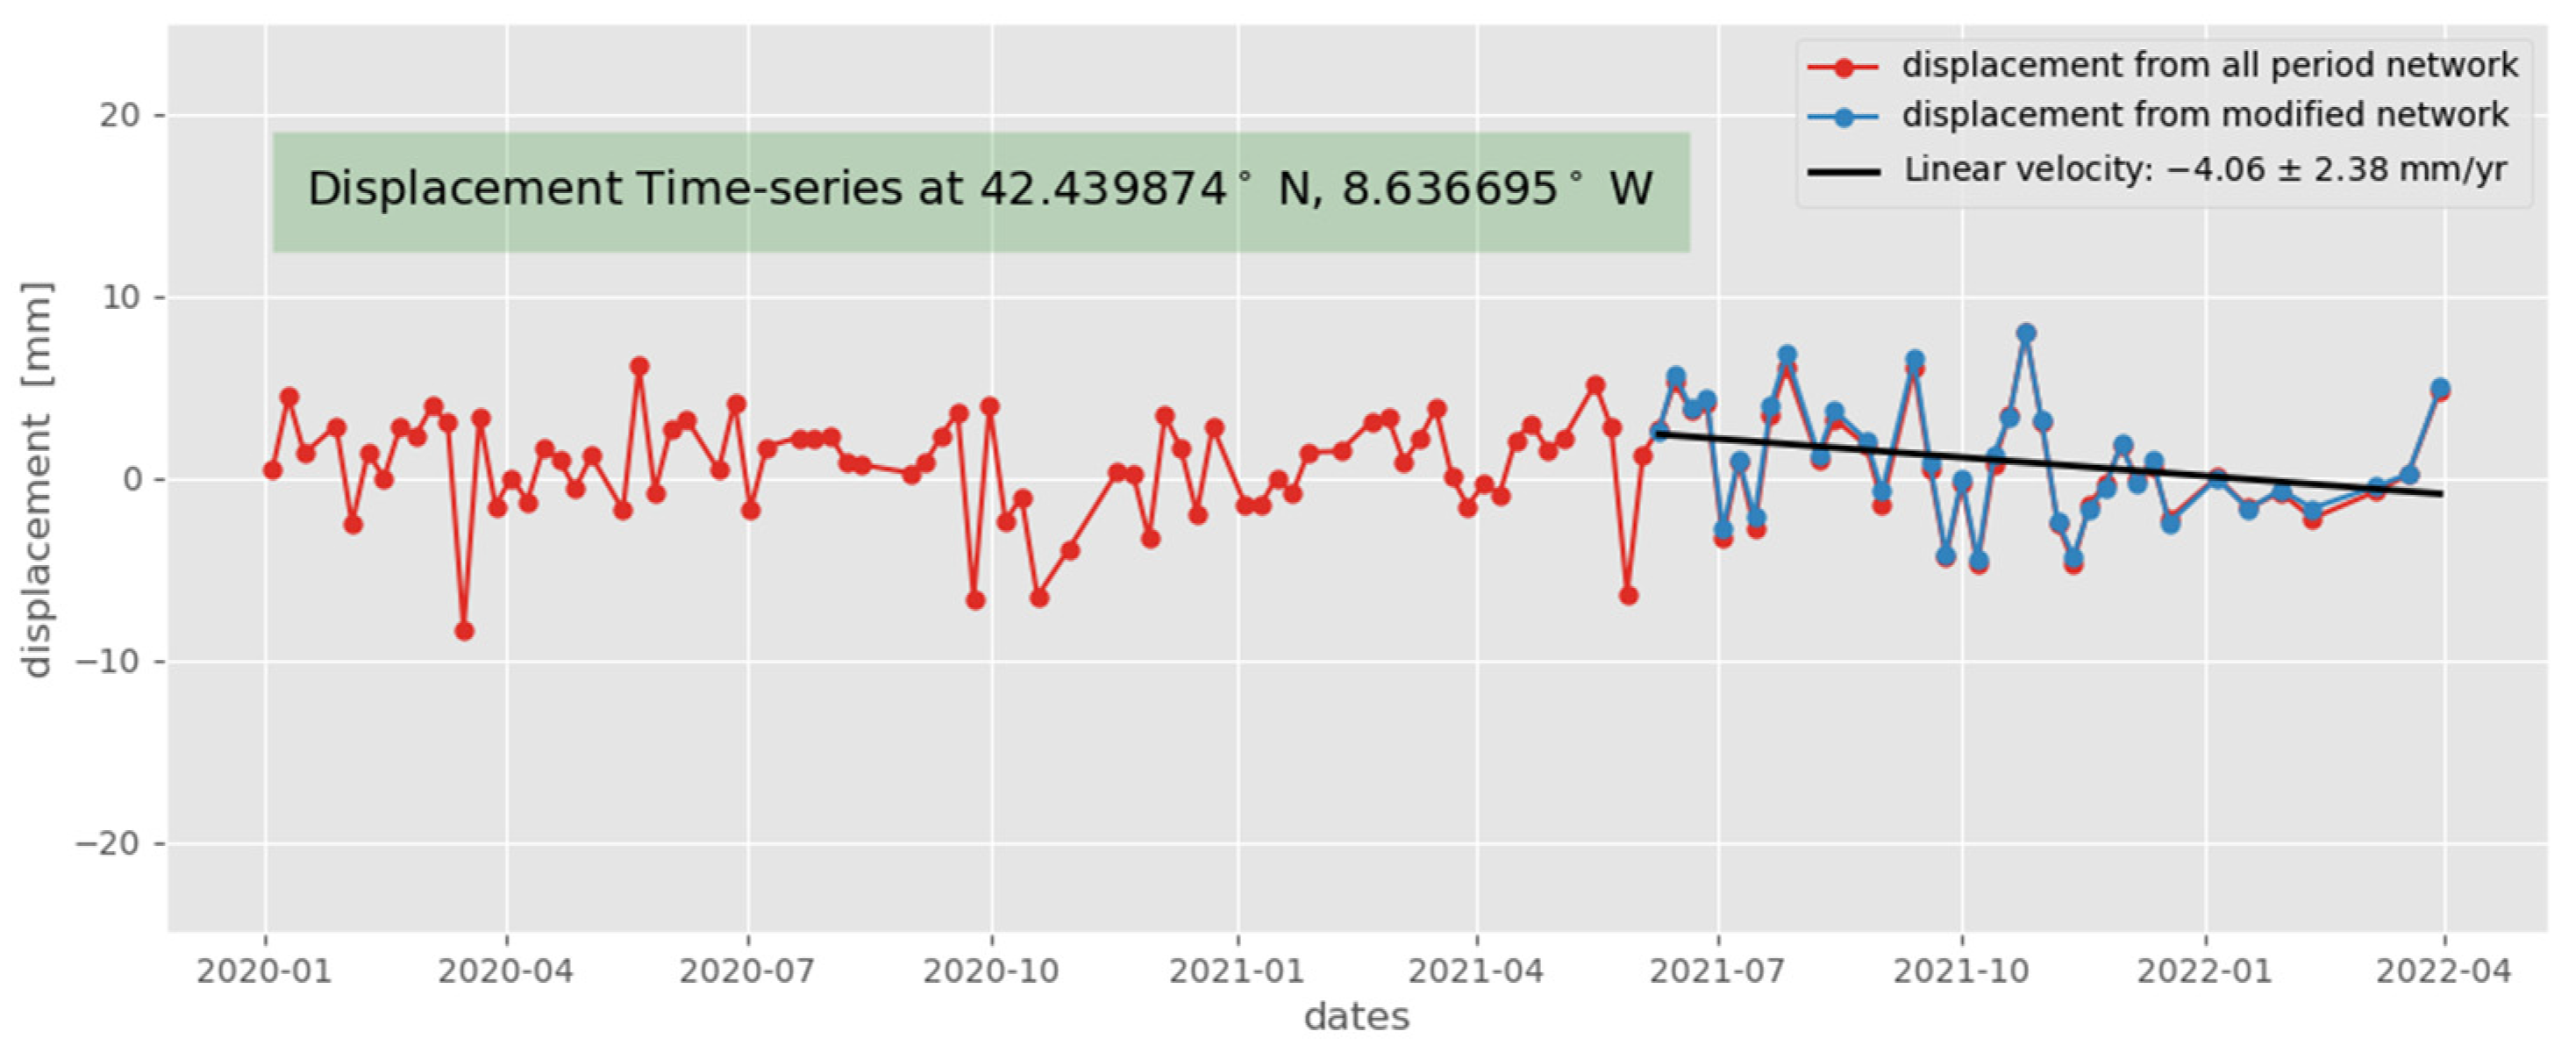
The displacement time series for both SBAS scenarios are plotted in Figure 15. In the noise evaluation stage of the processing, noisy SAR acquisitions are identified. These acquisitions are excluded in the velocity estimation [55]. For this case, the excluded dates are 22 January 2020, 9 May 2020, 14 June 2020, 14 July 2020, 25 August 2020, 24 October 2020, 11 November 2020, 29 December 2020, 3 February 2021, 15 February 2021, 2 August 2021, and 24 December 2021. A linear regression of the displacement series was calculated (Figure 15, black line), yielding an average velocity of −4.1 ± 2.4 mm/yr for the period from June 2021 to March 2022. Instantaneous displacements of about ±1 cm at 12-day intervals have also been observed. On the other hand, the linear long-term velocity computed for the entire period is −0.20 ± 0.44 mm/yr, which can be considered negligible.

3.3. PSI-SBAS Comparison and Additional GPR Analyses

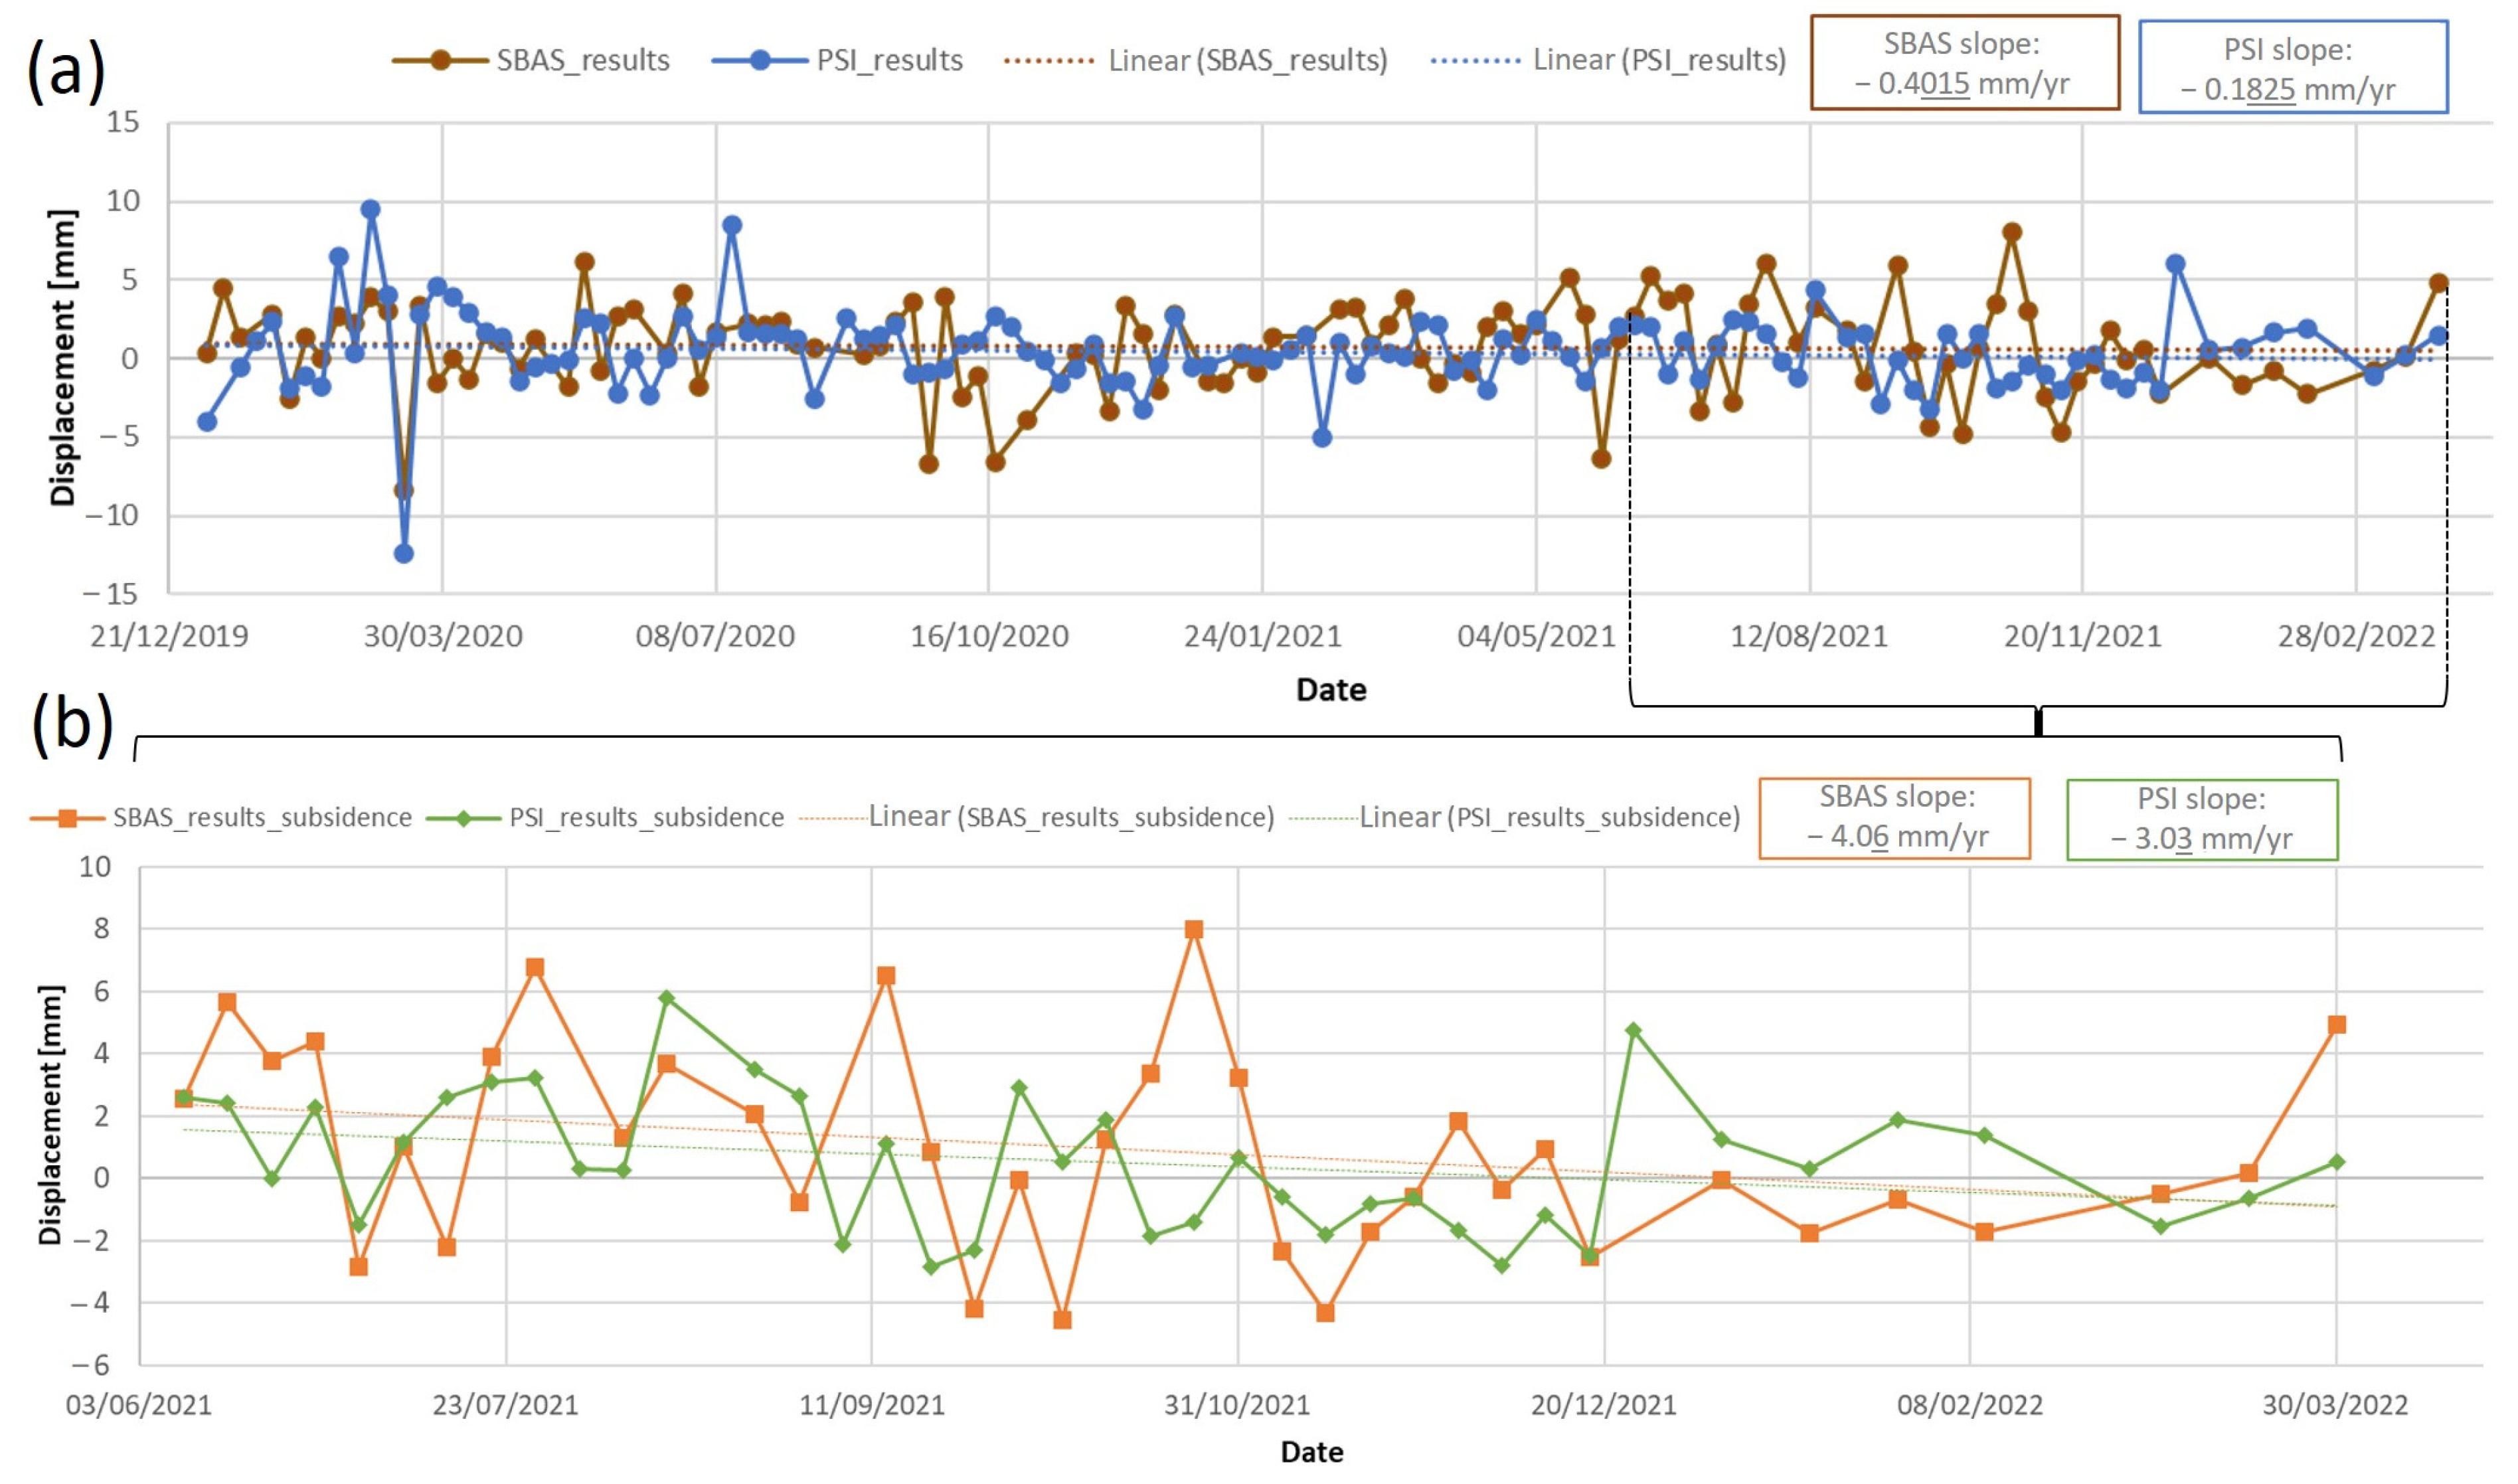
The displacement time series of the Forestry Engineering building obtained from each technique (PSI-SBAS) are presented in Figure 16. From Figure 16a, the time-series displacement between the results from both techniques all along the time acquisition can be observed. In addition, the linear regression models with the slope are displayed in order to quantify results. The slope (in units [mm/yr]) for the period January 2020 to March 2022 obtains subsidence values of −0.2 (PSI) and −0.4 (SBAS). Furthermore, Figure 16b focuses on the period June 2021 to March 2022 where the velocity deformation obtained was −3.0 mm/yr with the PSI method, and −4.1 mm/yr with the SBAS method.
The results obtained with both PSI-SBAS methods have shown similar tendencies in (i) deformation trend, with slight subsidence in the area from January 2020 to March 2022 and higher subsidence from June 2021 to March 2022; and (ii) displacement range values (with a mean error of 2.43 mm and a medium difference of 0.26 mm).
Moreover, to quantify and analyze the similarities and differences between PSI and SBAS time series, two tests were carried out: (i) The Student-t analysis showed a t-statistic of −0.76, which suggests a small difference between both groups. This hypothesis was confirmed with a p-value of 0.44, which was higher than the limit of 0.05. (ii) The dynamic Time Warping (DTW) average distance between PSI-SBAS measurements of 1.65 mm reveals the mean cumulative distance between both techniques.
With the aim of analyzing a possible relationship between climate change and the InSAR results, some weather parameters (temperature, humidity and precipitation) were analyzed. The statistical measure Spearman’s rank correlation coefficient was obtained (Table 5), where positive correlations were observed between the InSAR results and temperature: 0.19 for PSI and 0.24 for SBAS. In both cases, this hypothesis was validated with a p-value < 0.05. Conversely, a negative correlation was observed between humidity and PSI (−0.21) with a p-value of 0.029. Non-correlation was validated for the precipitation factor with both techniques, and for the humidity factor with the SBAS results.
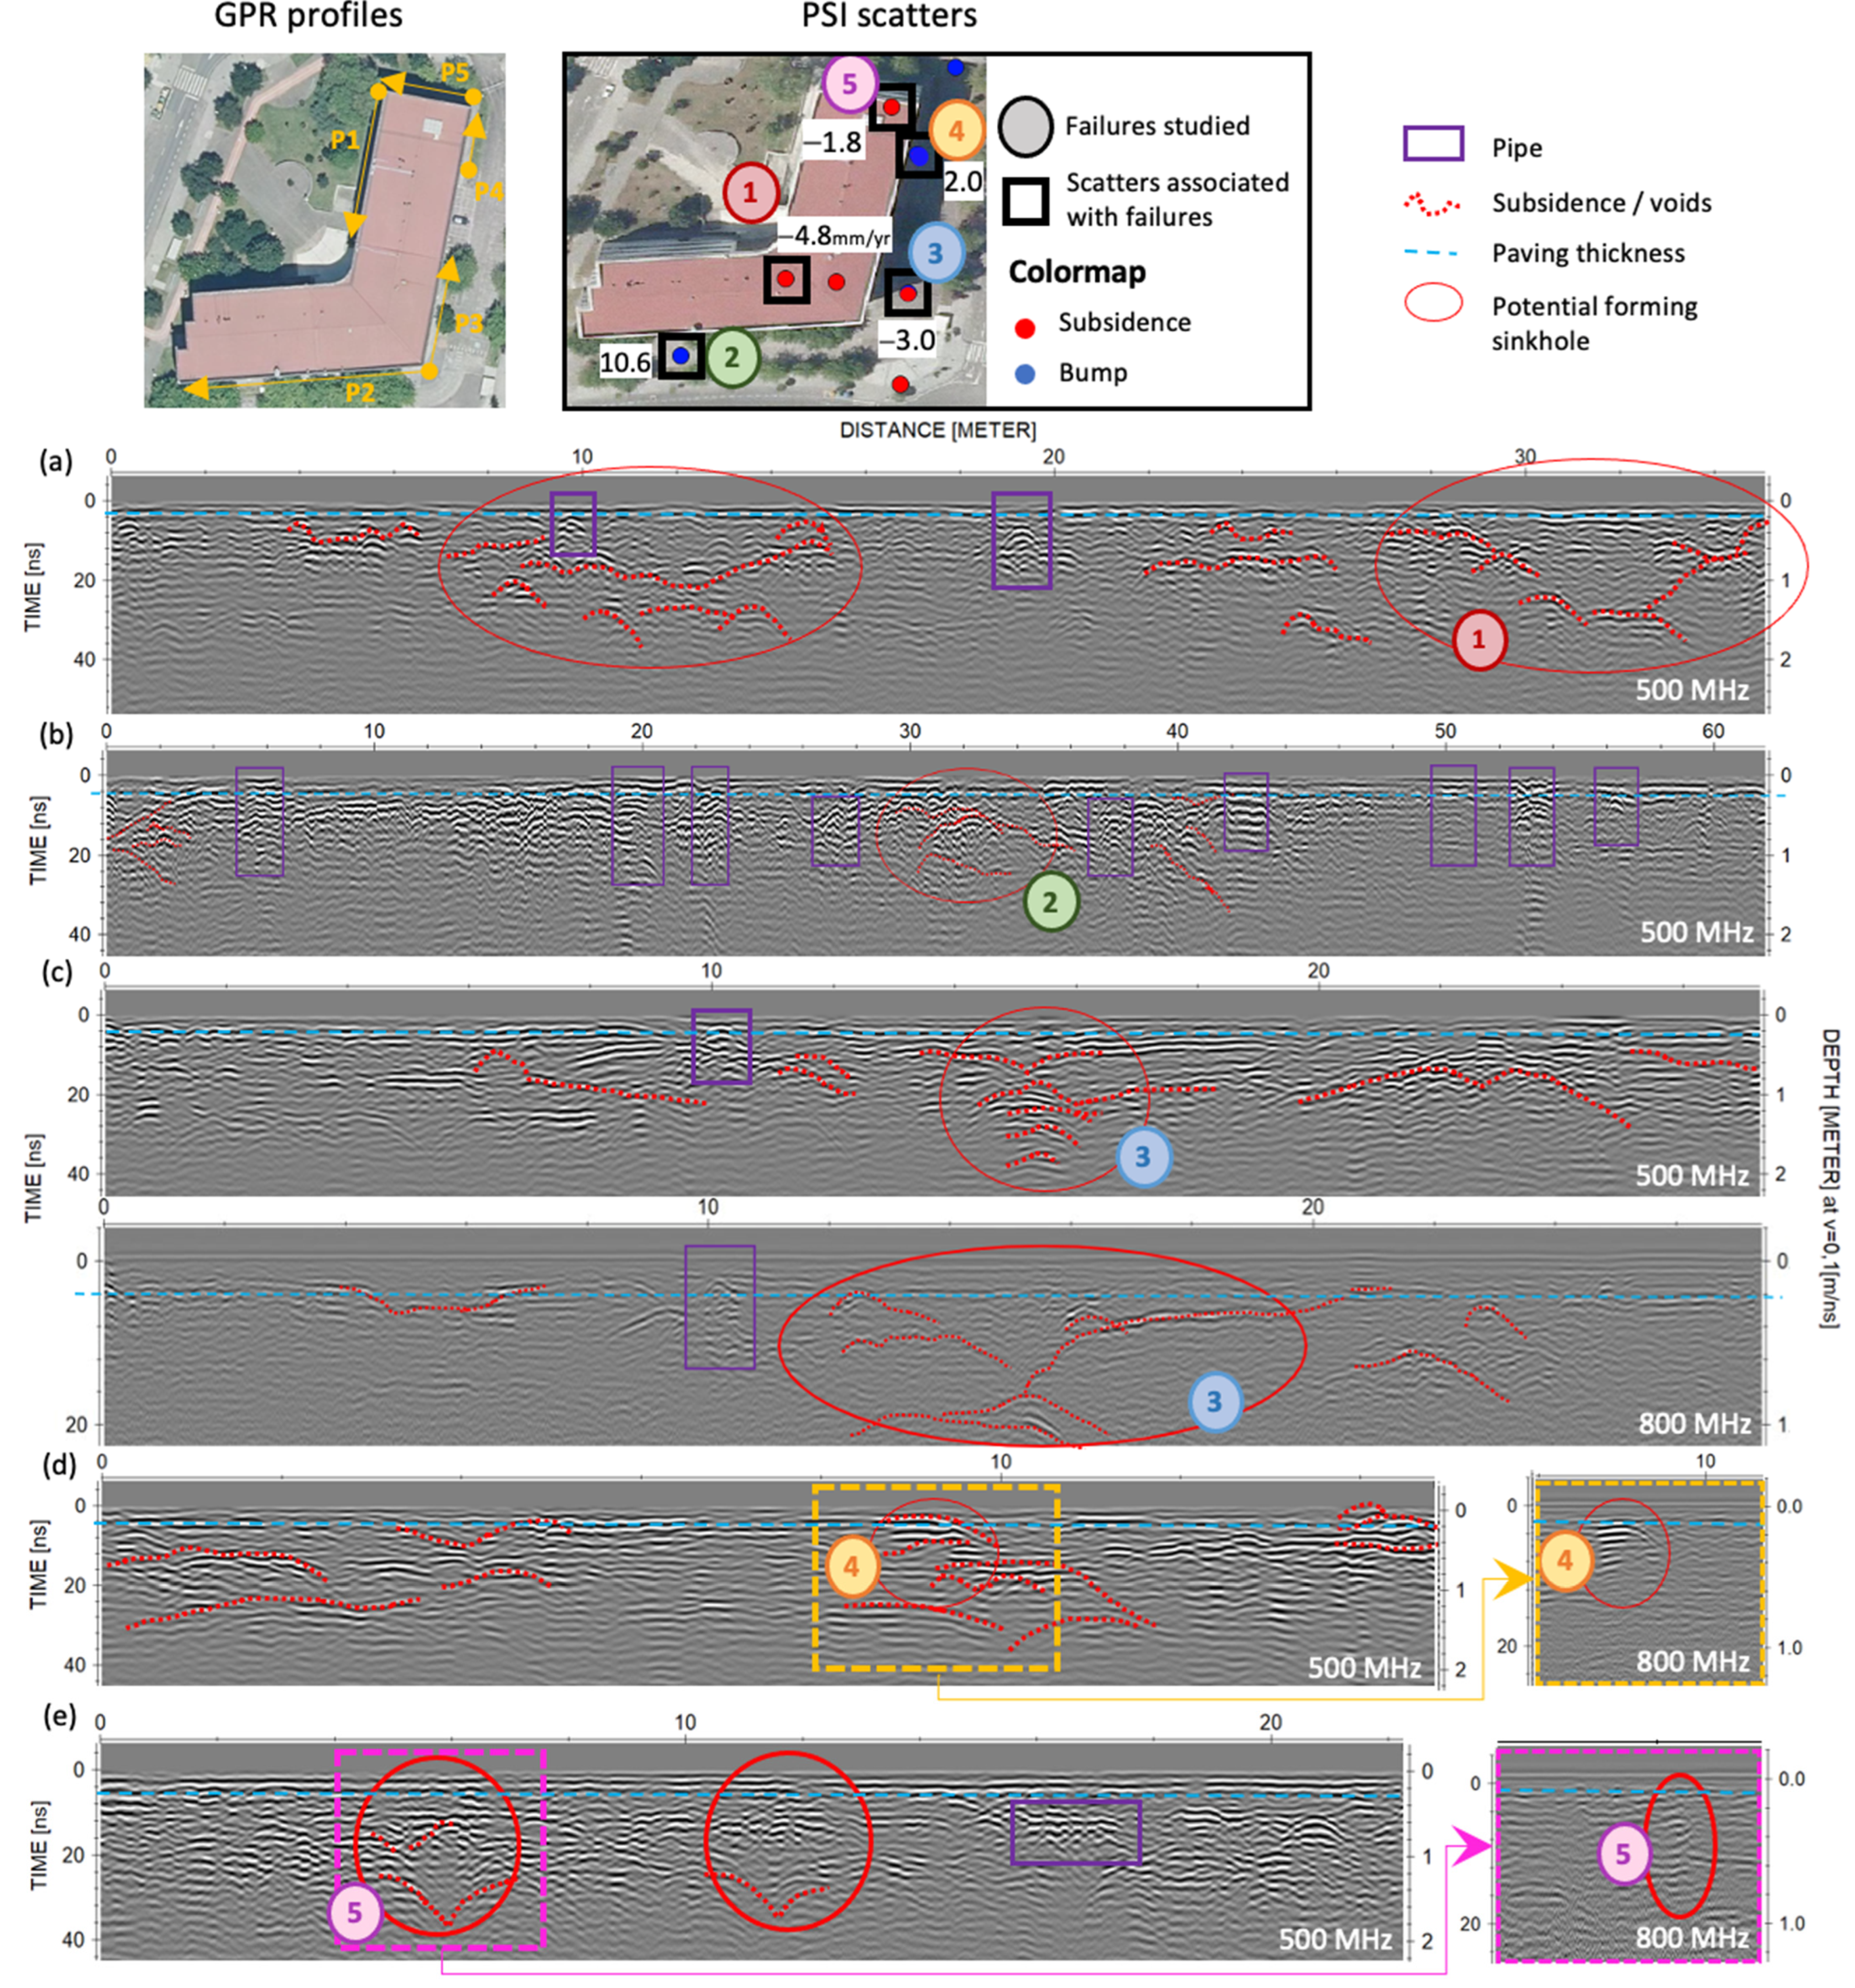
All these results increase the accuracy of the analysis, but further investigation is needed to confirm the interpretations achieved and their relationship with the in situ failures observed in Figure 2. In this paper, the GPR method is used as a complementary technique to obtain extra information (e.g., extent and probable origin of the problem) aimed to provide more reliable results.
Figure 17 shows the processed GPR data produced by the five profile lines conducted around the Forestry Engineering School building. The scatters obtained from the PSI method with the velocity deformation for each PS during the period June 2021 to March 2022 are also represented. Figure 17a presents the 500 MHz data for profile line 1, showing the identification of two possible forming sinkholes (reflection patterns highlighted in red circles). It is necessary to remark that the possible sinkhole interpreted at the end of the radargram in Figure 17a (marked as 1) is coincident with the visual failure number 1 in Figure 2b,c, and converges with the subsidence scatter (−4.8 mm/yr) area of influence obtained with the PSI method.
Figure 17b displays the 500 MHz data obtained for profile line 2, showing the interpretation of a potential forming sinkhole that correlates with the visual failure number 2. The scatter associated is in agreement with GPR and visual analysis, nonetheless, the deformation value does not support this assumption.
Figure 17c includes the 500 MHz and 800 MHz data produced by profile line 3, in which it is possible to interpret a cavity formation and backfill spalling that is consistent with the visual failure number 3. In this case, the scatter associated is close to the visual failure and the sinkhole detected from the radargram.
Figure 17d shows the 500 MHz data produced by profile line 4, highlighting the interpretation of an anomaly that could be associated with the visual failure number 4. The 800 MHz data produced for the damaged area (in a dashed yellow line box) is also included. The scatter associated is in agreement with the location and kind of failure, because the aspect of the damage on the surface is a bump.
Finally, Figure 17e illustrates the 500 MHz data obtained for profile line 5, including the interpretation of potential inner failures, one of which has a spatial distribution that certainly may coincide with the visual failure number 5. Furthermore, the 800 MHz data produced for this damaged area (in a dashed pink line box) is shown. In this case, the PS also has a relation with the GPR and visual analysis, showing a coincident location and similar information about the kind of damage (slight subsidence).

4. Conclusions

This paper presents the complementary use of different radar techniques. First, two different InSAR techniques, PSI and SBAS, were applied to assess the applicability of each method to the detection of land subsidence in urban areas. Second, the GPR technique was used to provide additional information to the InSAR interpretations and to obtain complementary data such as evidence of building settlements and sinkhole formation. The main conclusions of this work are:
  • For the period from January 2020 to March 2022, and for the global area of Pontevedra city, the average velocities obtained with the PSI and SBAS methods were −0.2 mm/yr and −0.4 mm/yr, respectively. In both cases, the area presents a massive dominance of negative values that mean a slight sinking effect.
  • For the same period, the PSI results in the area of the Forestry Engineering School building have revealed scatters with different velocity trends, showing maximum and minimum deformation rates of 1.0 mm/yr and −0.8 mm/yr, respectively. However, a drawback of the PSI method was revealed, which refers to the fact that analyses with long temporal spectrums, such as 2 years in our case, motivate over-filtering. Observing the time series, 96.8% of the measurements were in a displacement range of 10 mm. To overcome this limitation, and taking into account the errors and orography of the zone, a temporal spectrum of one year (from June 2021 to March 2022) was additionally processed.
  • Thus, for the period from June 2021 to March 2022, a higher pattern of subsidence was detected with values of −3.0 mm/yr and −4.1 mm/yr for PSI and SBAS, respectively. Instantaneous displacements of about ±1 cm at 12-day intervals have also been observed with the SBAS method. All the values are within the detection threshold considered for InSAR [74].
  • Overall, the PSI and SBAS methods have shown a good match, with similar tendency and displacement range values. The fact that both methods display similar results, with similar initial data, reinforces the validation of the use of SAR techniques for infrastructure analyses focusing on subsidence.
  • Although both InSAR techniques have provided similar results, it should be highlighted that the PSI method provides extra information (critical points, such as PSs with high subsidence rate).
  • Regarding the complementary GPR method used, the radar data collected in January 2022 allowed for the identification of internal failures around the Forestry Engineering School building. From the reflection patterns produced, it was possible to estimate the extent and depth (edges delineation) of the cavity’s formations.
  • The internal damages interpreted from the GPR data showed a good agreement with the PS obtained for this area and with the visible damages identified from visual inspection (location and kind of failure (subsidence or elevation)), thus providing crucial information, and supporting more appropriate decision making and preventive maintenance.
Aiming to improve the accuracy and range of the InSAR processing, the authors’ recommendations for future works are to incorporate the use of corner reflectors to ensure PS in some specific areas, clustering of the velocity results for PSI technique, the use of X-band images, and the use of new advanced InSAR algorithms (SqueeSAR, JSInSAR). In addition, new methodological approaches will be tested for both methods, such as the analysis of both satellite orbit directions to obtain the vertical component of the displacement, and the combination of InSAR with GNSS and/or leveling techniques for the calibration of the results and the correct positioning of the reference point.

Author Contributions

Conceptualization, A.A.-D. and M.S.; Methodology, A.A.-D., J.C.-R. and M.S.; Software, A.A.-D., J.C.-R. and M.S.; Validation, A.A.-D., J.C.-R., M.S. and S.L.; Formal analysis, A.A.-D., J.C.-R., M.S. and S.L.; Investigation, A.A.-D., J.C.-R. and M.S.; Resources, M.S. and S.L.; Data curation, M.S. and S.L.; Writing – original draft, A.A.-D., J.C.-R., M.S. and S.L.; Writing—review & editing, A.A.-D., M.S. and S.L.; Visualization, A.A.-D., J.C.-R., M.S. and S.L.; Supervision, M.S. and S.L.; Project administration, M.S.; Funding acquisition, M.S. and S.L. All authors have read and agreed to the published version of the manuscript.

Funding

This research was funded as follows: A. Alonso-Díaz acknowledges the funding received from the Xunta de Galicia through the project ENDITí (Ref. ED431F 2021/08). M. Solla acknowledges the grant RYC2019-026604-I, funded by MCIN/AEI/10.13039/501100011033 and by “ESF Investing in your future”, the “José Castillejo” Mobility Grant in foreign centers (Ref. CAS21/00241) from the Spanish Ministry of Universities, and the funding received from the STRADAR project (Ref. TED2021-130183B-I00), funded by MCIN/AEI/10.13039/501100011033 and by the “European Union NextGenerationEU/PRTR”. The University of Salamanca acknowledges the TREEADS project, which has received funding from the European Union’s Horizon 2020 research and innovation program under grant agreement No. 101036926; and the LAW-GAME project, which is co-funded by the HORIZON 2020 scheme of the European Union under grant agreement No. 101021714. Content reflects only the author’s views, and the European Commission is not responsible for any use that may be made of the information it contains.

Data Availability Statement

Not applicable.

Conflicts of Interest

The authors declare that there are no conflict of interest regarding the publication of this paper.

References

  1. Galve, J.P.; Gutiérrez, F.; Guerrero, J.; Alonso, J.; Diego, I. Application of risk, cost–benefit and acceptability analyses to identify the most appropriate geosynthetic solution to mitigate sinkhole damage on roads. Eng. Geol. 2012, 145–146, 65–77. [Google Scholar]
  2. Pueyo-Anchuela, O.; Juan, A.P.; Soriano, M.A.; Casas-Sainz, A.M. Characterization of karst hazards from the perspective of the doline triangle using GPR—examples from Central Ebro Basin (Spain). Eng. Geol. 2009, 108, 225–236. [Google Scholar]
  3. Dobecki, T.L.; Upchurch, S.B. Geophysical applications to detect sinkholes and ground subsidence. Lead. Edge 2006, 25, 336. [Google Scholar] [CrossRef]
  4. SIRs DATA–Map Direct. Subsidence Incident Reports. Florida Department of Environmental Protection. Available online: https://ca.dep.state.fl.us/mapdirect/?focus=fgssinkholes (accessed on 16 March 2022).
  5. Aurit, M.D.; Peterson, R.O.; Blanford, J.I. A GIS Analysis of the Relationship between Sinkholes, Dry-Well Complaints and Groundwater Pumping for Frost-Freeze Protection of Winter Strawberry Production in Florida. PLoS ONE 2013, 8, e53832. [Google Scholar] [CrossRef] [Green Version]
  6. Meng, Y.; Long, J. Global warming causes sinkhole collapse—Case study in Florida, USA. Nat. Hazards Earth Syst. Sci. Discuss. 2018, 1–8. [Google Scholar] [CrossRef] [Green Version]
  7. Cuthbert, M.O.; Gleeson, T.; Moosdorf, N.; Befus, K.M.; Schneider, A.; Hartmann, J.; Lehner, B. Global patterns and dynamics of climate–groundwater interactions. Nat. Clim. Chang. 2019, 9, 137–141. [Google Scholar] [CrossRef]
  8. González, P.; Lamur, A.; Lavallée, Y. Squeezing porous basaltic rocks: Understanding compaction of basaltic aquifers due to groundwater extraction at Tenerife Island. Geophys. Res. Abstr. 2018, 20, 18585. [Google Scholar]
  9. Mimura, N. Rising seas and subsiding cities. Nat. Clim. Chang. 2021, 11, 296–297. [Google Scholar] [CrossRef]
  10. Dávila, F.M.; Ávila, P.; Martina, F. Relative contributions of tectonics and dynamic topography to the Mesozoic-Cenozoic subsidence of southern Patagonia. J. S. Am. Earth Sci. 2019, 93, 412–423. [Google Scholar] [CrossRef]
  11. Varbla, S.; Ellmann, A.; Puust, R. Centimetre-range deformations of built environment revealed by drone-based photogrammetry. Autom. Constr. 2021, 128, 103787. [Google Scholar] [CrossRef]
  12. Argyrakis, P.; Ganas, A.; Valkaniotis, S.; Tsioumas, V.; Sagias, N.; Psiloglou, B. Anthropogenically induced subsidence in Thessaly, central Greece: New evidence from GNSS data. Nat. Hazards 2020, 102, 179–200. [Google Scholar] [CrossRef]
  13. Tao, T.; Liu, J.; Qu, X.; Gao, F. Real-time monitoring rapid ground subsidence using GNSS and Vondrak filter. Acta Geophys. 2019, 67, 133–140. [Google Scholar] [CrossRef]
  14. Kiani, M. A precise machine learning aided algorithm for land subsidence or upheave prediction from GNSS time series. arXiv 2020, arXiv:2006.03772. [Google Scholar]
  15. Rahmati, O.; Falah, F.; Naghibi, S.A.; Biggs, T.; Soltani, M.; Deo, R.C.; Cerdà, A.; Mohammadi, F.; Bui, D.T. Land subsidence modelling using tree-based machine learning algorithms. Sci. Total Environ. 2019, 672, 239–252. [Google Scholar] [CrossRef]
  16. Saganeiti, L.; Amato, F.; Nolè, G.; Vona, M.; Murgante, B. Early estimation of ground displacements and building damage after seismic events using SAR and LiDAR data: The case of the Amatrice earthquake in central Italy, on 24th August 2016. Int. J. Disaster Risk Reduct. 2020, 51, 101924. [Google Scholar] [CrossRef]
  17. Ramirez, R.A.; Lee, G.J.; Choi, S.K.; Kwon, T.H.; Kim, Y.C.; Ryu, H.H.; Kim, S.; Bae, B.; Hyun, C. Monitoring of construction-induced urban ground deformations using Sentinel-1 PS-InSAR: The case study of tunneling in Dangjin, Korea. Int. J. Appl. Earth Obs. Geoinf. 2022, 108, 102721. [Google Scholar]
  18. Wu, P.C.; Wei, M.; D’hondt, S. Subsidence in Coastal Cities Throughout the World Observed by InSAR. Geophys. Res. Lett. 2022, 49, e2022GL098477. [Google Scholar] [CrossRef]
  19. Park, S.W.; Hong, S.W. Nonlinear Modeling of Subsidence From a Decade of InSAR Time Series. Geophys. Res. Lett. 2021, 48, 3. [Google Scholar] [CrossRef]
  20. Tosti, F.; Gagliardi, V.; D’amico, F.; Alani, A.M. Transport infrastructure monitoring by data fusion of GPR and SAR imagery information. Transp. Res. Procedia 2020, 45, 771–778. [Google Scholar] [CrossRef]
  21. Hu, L.; Dai, K.; Xing, C.; Li, Z.; Tomás, R.; Clark, B.; Shi, X.; Chen, M.; Zhang, R.; Qiu, Q.; et al. Land subsidence in Beijing and its relationship with geological faults revealed by Sentinel-1 InSAR observations. Int. J. Appl. Earth Obs. Geoinf. 2019, 82, 101886. [Google Scholar] [CrossRef]
  22. Hu, B.; Chen, J.; Zhang, X. Monitoring the Land Subsidence Area in a Coastal Urban Area with InSAR and GNSS. Sensors 2019, 19, 3181. [Google Scholar] [CrossRef] [PubMed] [Green Version]
  23. Farolfi, G.; Del Soldato, M.; Bianchini, S.; Casagli, N. A procedure to use GNSS data to calibrate satellite PSI data for the study of subsidence: An example from the north-western Adriatic coast (Italy). Eur. J. Remote Sens. 2019, 52, 54–63. [Google Scholar] [CrossRef] [Green Version]
  24. Cigna, F.; Esquivel Ramírez, R.; Tapete, D. Accuracy of Sentinel-1 PSI and SBAS InSAR Displacement Velocities against GNSS and Geodetic Leveling Monitoring Data. Remote Sens. 2021, 13, 4800. [Google Scholar] [CrossRef]
  25. He, Z.; Chen, T.; Wang, M.; Li, Y. Multi-Segment Rupture Model of the 2016 Kumamoto Earthquake Revealed by InSAR and GPS Data. Remote Sens. 2020, 12, 3721. [Google Scholar] [CrossRef]
  26. Carboni, F.; Porreca, M.; Valerio, E.; Mariarosaria, M.; De Luca, C.; Azzaro, S.; Ercoli, E.; Barchi, M.R. Surface ruptures and off-fault deformation of the October 2016 central Italy earthquakes from DInSAR data. Sci. Rep. 2022, 12, 3172. [Google Scholar] [CrossRef] [PubMed]
  27. Lazos, I.; Papanikolaou, I.; Sboras, S.; Foumelis, M.; Pikridas, C. Geodetic Upper Crust Deformation Based on Primary GNSS and INSAR Data in the Strymon Basin, Northern Greece—Correlation with Active Faults. Appl. Sci. 2022, 12, 9391. [Google Scholar] [CrossRef]
  28. Yalvac, S. Validating InSAR-SBAS results by means of different GNSS analysis techniques in medium- and high-grade deformation areas. Environ. Monit. Assess. 2020, 192, 120. [Google Scholar] [CrossRef]
  29. Rauff, K.O.; Abir, I.A. Monitoring of the ground deformation in Penang Island, Malaysia using Permanent Scatterer Interferometry Synthetic Aperture Radar (PS-InSAR) and Ground-Penetrating Radar (GPR) techniques. Acta Geodyn. Geomater. 2021, 18, 461–472. [Google Scholar]
  30. Busetti, A.; Calligaris, C.; Forte, E.; Areggi, G.; Mocnik, A.; Zini, L. Non-Invasive Methodological Approach to Detect and Characterize High-Risk Sinkholes in Urban Cover Evaporite Karst: Integrated Reflection Seismics, PS-InSAR, Leveling, 3D-GPR and Ancillary Data. A NE Italian Case Study. Remote Sens. 2020, 12, 3814. [Google Scholar] [CrossRef]
  31. Talib, O.-C.; Shimon, W.; Sarah, K.; Tonian, R. Detection of sinkhole activity in West-Central Florida using InSAR time series observations. Remote Sens. Environ. 2022, 269, 112793. [Google Scholar] [CrossRef]
  32. Robinson, T.; Rodgers, B.; Oliver-Cabrera, T.; Downs, C.; Kruse, S.; Wdowinski, S.; Zhang, B.; Jazayeri, S.; Kiflu, H. Complex relationships between surface topography, ground motion, and cover sediments in covered karst, west-central Florida, USA. Geomorphology 2021, 392, 107927. [Google Scholar] [CrossRef]
  33. Hubatka, F.; Pospíšil, L.; Lazecký, M. Identification of ground instability in the housing estate complex based on georadar and satellite radar interferometry. Acta Geodyn. Geomater. 2021, 18, 231–240. [Google Scholar] [CrossRef]
  34. Martel, R.; Castellazzi, P.; Gloaguen, E.; Trépanier, L.; Garfias, J. ERT, GPR, InSAR, and tracer tests to characterize karst aquifer systems under urban areas: The case of Quebec City. Geomorphology 2018, 310, 45–56. [Google Scholar] [CrossRef] [Green Version]
  35. Carbonel, D.; Rodríguez-Tribaldos, V.; Gutiérrez, F.; Galve, J.P.; Guerrero, J.; Zarroca, M.; Roqué, C.; Linares, R.; McCalpin, J.P.; Acosta, E. Investigating a damaging buried sinkhole cluster in an urban area (Zaragoza city, NE Spain) integrating multiple techniques: Geomorphological surveys, DInSAR, DEMs, GPR, ERT, and trenching. Geomorphology 2015, 229, 3–16. [Google Scholar] [CrossRef]
  36. Gutiérrez, F.; Galve, J.P.; Lucha, P.; Castañeda, C.; Bonachea, J.; Guerrero, J. Integrating geomorphological mapping, trenching, InSAR and GPR for the identification and characterization of sinkholes: A review and application in the mantled evaporite karst of the Ebro Valley (NE Spain). Geomorphology 2011, 134, 144–156. [Google Scholar] [CrossRef] [Green Version]
  37. Cabral-Cano, E.; Arciniega-Ceballos, A.; Diaz-Molina, O.; Cigna, F.; Avila-Olivera, A.; Osmanoglu, B.; Dixon, T.H.; Demets, C.; Garduño-Monroy, V.H.; Vergara-Huerta, F.; et al. Is there a tectonic component to the subsidence process in Morelia, Mexico? IAHS-AISH Publ. 2010, 339, 164–169. [Google Scholar]
  38. La Voz de Galicia. Comienza la Urbanización de los Terrenos del Campus Universitario de A Xunqueira. Available online: https://www.lavozdegalicia.es/noticia/pontevedra/2017/07/27/comienza-urbanizacion-terrenos-campus-universitario/0003_201707P27C7994.htm (accessed on 12 April 2022).
  39. IberPix. Instituto Geográfico Nacional. Available online: http://www.ign.es/iberpix2/visor/?id=08_09_0315C2_F07_090811PAN (accessed on 10 March 2022).
  40. IGME (Instituto Geológico y Minero de España). Mapa Geológico de España a Escala 1:200.000 de Pontevedra La Guardia Hoja 16–26 1985, 1st ed.; Servicio de Publicaciones Ministerio de Industria y Energía: Madrid, Spain, 1985. [Google Scholar]
  41. Información Xeográfica de Galicia. Available online: http://mapas.xunta.gal/centro-de-descargas/ (accessed on 20 June 2022).
  42. Kulp, S.A.; Strauss, B.H. New elevation data triple estimates of global vulnerability to sea-level rise and coastal flooding. Nat. Commun. 2019, 10, 4844. [Google Scholar] [CrossRef] [Green Version]
  43. Diario de Pontevedra ¿Cómo Será Pontevedra en 30 Años Debido al Efecto del Cambio Climático? Available online: https://www.diariodepontevedra.es/articulo/pontevedra/como-quedara-pontevedra-30-anos/ (accessed on 14 March 2022).
  44. Rosen, P.A.; Hensley, S.; Joughin, I.R.; Li, F.K.; Madsen, S.N.; Rodriguez, E.; Goldstein, R.M. Synthetic aperture radar interferometry. Proc. IEEE 2000, 88, 333–382. [Google Scholar] [CrossRef]
  45. Gabriel, A.K.; Goldstein, R.M.; Zebker, H.A. Mapping small elevation changes over large areas: Differential radar interferometry. J. Geophys. Res. Solid Earth 1989, 94, 9183–9191. [Google Scholar] [CrossRef]
  46. Hooper, A.; Bekaert, D.; Spaans, K.; Arıkan, M. Recent advances in SAR interferometry time series analysis for measuring crustal deformation. Tectonophysics 2012, 514, 1–13. [Google Scholar] [CrossRef]
  47. Li, S.; Xu, W.; Li, Z. Review of the SBAS InSAR Time-series algorithms, applications, and challenges. J. Geodesy Geodyn. 2021, 13, 114–126. [Google Scholar] [CrossRef]
  48. Xue, F.; Lv, X.; Dou, F.; Yun, Y. A Review of Time-Series Interferometric SAR Techniques: A Tutorial for Surface Deformation Analysis. IEEE Geosci. Remote Sens. Mag. 2020, 8, 22–42. [Google Scholar] [CrossRef]
  49. Pepe, A.; Calò, F. A Review of Interferometric Synthetic Aperture RADAR (InSAR) Multi-Track Approaches for the Retrieval of Earth’s Surface Displacements. Appl. Sci. 2017, 7, 1264. [Google Scholar] [CrossRef] [Green Version]
  50. Ullo, S.L.; Addabbo, P.; Di Martire, D.; Sica, S.; Fiscante, N.; Cicala, L.; Angelino, C.V. Application of DInSAR Technique to High Coherence Sentinel-1 Images for Dam Monitoring and Result Validation Through In Situ Measurements. IEEE J. Sel. Top. Appl. Earth Obs. Remote Sens. 2019, 12, 875–890. [Google Scholar] [CrossRef]
  51. Ferretti, A.; Prati, C.; Rocca, F. Permanent scatterers in SAR interferometry. IEEE Trans. Geosci. Remote Sens. 2001, 39, 8–20. [Google Scholar] [CrossRef]
  52. Berardino, P.; Fornaro, G.; Lanari, R.; Sansosti, E. A new algorithm for surface deformation monitoring based on small baseline differential SAR interferograms. IEEE Trans. Geosci. Remote Sens. 2002, 40, 2375–2383. [Google Scholar] [CrossRef] [Green Version]
  53. Li, Z.; Cao, Y.; Wei, J.; Duan, M.; Wu, L.; Hou, J.; Zhu, J. Time-series InSAR ground deformation monitoring: Atmospheric delay modeling and estimating. Earth-Sci. Rev. 2019, 192, 258–284. [Google Scholar] [CrossRef]
  54. Guo, J.; Zhou, L.; Yao, C.; Hu, J. Surface Subsidence Analysis by Multi-Temporal InSAR and GRACE: A Case Study in Beijing. Sensors 2016, 16, 1495. [Google Scholar] [CrossRef] [Green Version]
  55. Yunjun, Z.; Fattahi, H.; Amelung, F. Small baseline InSAR time series analysis: Unwrapping error correction and noise reduction. Comput. Geosci. 2019, 133, 104331. [Google Scholar] [CrossRef] [Green Version]
  56. Fotiou, K.; Kakoullis, D.; Pekri, M.; Melillos, G.; Brcic, R.; Eineder, M.; Hadjimitsis, D.G.; Danezis, C. Space-Based Displacement Monitoring of Coastal Urban Areas: The Case of Limassol’s Coastal Front. Remote Sens. 2022, 14, 914. [Google Scholar] [CrossRef]
  57. ESA (European Space Agency). SNAP Sentinel Application Platform. Available online: https://step.esa.int/main/toolboxes/snap/ (accessed on 18 March 2022).
  58. Hooper, A.; Bekaert, D.; Hussain, E.; Spaans, K. StaMPS/MTI Manual. School of Earth and Environment University of Leeds. 2018. Version 4.1b. Available online: https://github.com/dbekaert/StaMPS/blob/master/Manual/StaMPS_Manual.pdf (accessed on 24 March 2022).
  59. Bovenga, F.; Wasowski, J.; Nitti, D.O.; Nutricato, R.; Chiaradia, M.T. Using COSMO/SkyMed X-band and ENVISAT C-band SAR interferometry for landslides analysis. Remote Sens. Environ. 2012, 119, 272–285. [Google Scholar] [CrossRef]
  60. Serco Italia SPA; StaMPS: Persistent Scatterer Interferometry Processing—Mexico City 2021 (Version 1.1). 2020. Available online: https://rus-copernicus.eu/portal/wp-content/uploads/library/education/training/HAZA12_StaMPsPSI_Processing_Tutorial.pdf (accessed on 11 May 2022).
  61. Hogenson, K.; Kristenson, H.; Kennedy, J.; Johnston, A.; Rine, J.; Logan, T.; Zhu, J.; Williams, F.; Herrmann, J.; Smale, J.; et al. Hybrid Pluggable Processing Pipeline (HyP3): A Cloud-Native Infrastructure for Generic Processing of SAR Data [Computer Software]. 2020. Available online: https://zenodo.org/record/8011588 (accessed on 20 May 2022).
  62. Annan, P. GPR: Principles, Procedures & Applications; Sensors and Software Inc.: Mississauga, ON, Canada, 2003; p. 278. [Google Scholar]
  63. Solla, M.; Pérez-Gracia, V.; Fontul, S. A Review of GPR Application on Transport Infrastructures: Troubleshooting and Best Practices. Remote Sens. 2021, 13, 672. [Google Scholar] [CrossRef]
  64. Solla, M.; Fernández, N. GPR analysis to detect subsidence: A case study on a loaded reinforced concrete pavement. Int. J. Pavement Eng. 2022, 1–15. [Google Scholar] [CrossRef]
  65. Lorenzo, H.; Cuéllar, V.; Hernández, M.T. Close range radar remote sensing of concrete degradation in a textile factory floor. J. Appl. Geophys. 2020, 47, 327–336. [Google Scholar] [CrossRef]
  66. Tallini, M.; Giamberardino, A.; Ranalli, D.; Scozzafava, M. GPR survey for investigation in building foundations. In Proceedings of the Tenth International Conference on Grounds Penetrating Radar, Delft, The Netherland, 21–24 June 2004. [Google Scholar]
  67. Pérez-Gracia, V.; García García, F.; Rodriguez Abad, I. GPR evaluation of the damage found in the reinforced concrete base of a block of flats: A case study. NDT E Int. 2008, 41, 341–353. [Google Scholar] [CrossRef]
  68. Pérez-Gracia, V.; Solla, M. Inspection Procedures for Effective GPR Surveying of Buildings; Benedetto, A., Pajewski, L., Eds.; Civil Engineering Applications of Ground Penetrating Radar; Springer Transactions in Civil and Environmental Engineering; Springer: Cham, Swizterland, 2015; pp. 97–123. [Google Scholar]
  69. Hong, W.-T.; Kang, S.; Lee, S.J.; Lee, J.-S. Analyses of GPR signals for characterization of ground conditions in urban areas. J. Appl. Geophys. 2018, 152, 65–76. [Google Scholar] [CrossRef]
  70. Capozzoli, L.; De Martino, G.; Polemio, M.; Rizzo, E. Geophysical Techniques for Monitoring Settlement Phenomena Occurring in Reinforced Concrete Buildings. Surv. Geophys. 2020, 41, 575–604. [Google Scholar] [CrossRef]
  71. Sevil, J.; Gutiérrez, F.; Carnicer, C.; Carbonel, D.; Desir, G.; García-Arnay, Á.; Guerrero, J. Characterizing and monitoring a high-risk sinkhole in an urban area underlain by salt through non-invasive methods: Detailed mapping, high-precision leveling and GPR. Eng. Geol. 2020, 272, 105641. [Google Scholar] [CrossRef]
  72. Miccinesi, L.; Beni, A.; Monchetti, S.; Betti, M.; Borri, C.; Pieraccini, M. Ground Penetrating Radar Survey of the Floor of the Accademia Gallery (Florence, Italy). Remote Sens. 2021, 13, 1273. [Google Scholar] [CrossRef]
  73. Solla, M.; López-Leira, J.M.; Alonso-Díaz, A.; Rodríguez, J.L. Ground-penetrating Radar and Geotechnical Analyses to Investigate the Foundation Settlements of an Indiana House in NW Spain. Int. J. Arch. Heritage 2022. [Google Scholar] [CrossRef]
  74. Havazli, E.; Wdowinski, S. Detection Threshold Estimates for InSAR Time Series: A Simulation of Tropospheric Delay Approach. Sensors 2021, 21, 1124. [Google Scholar] [CrossRef] [PubMed]
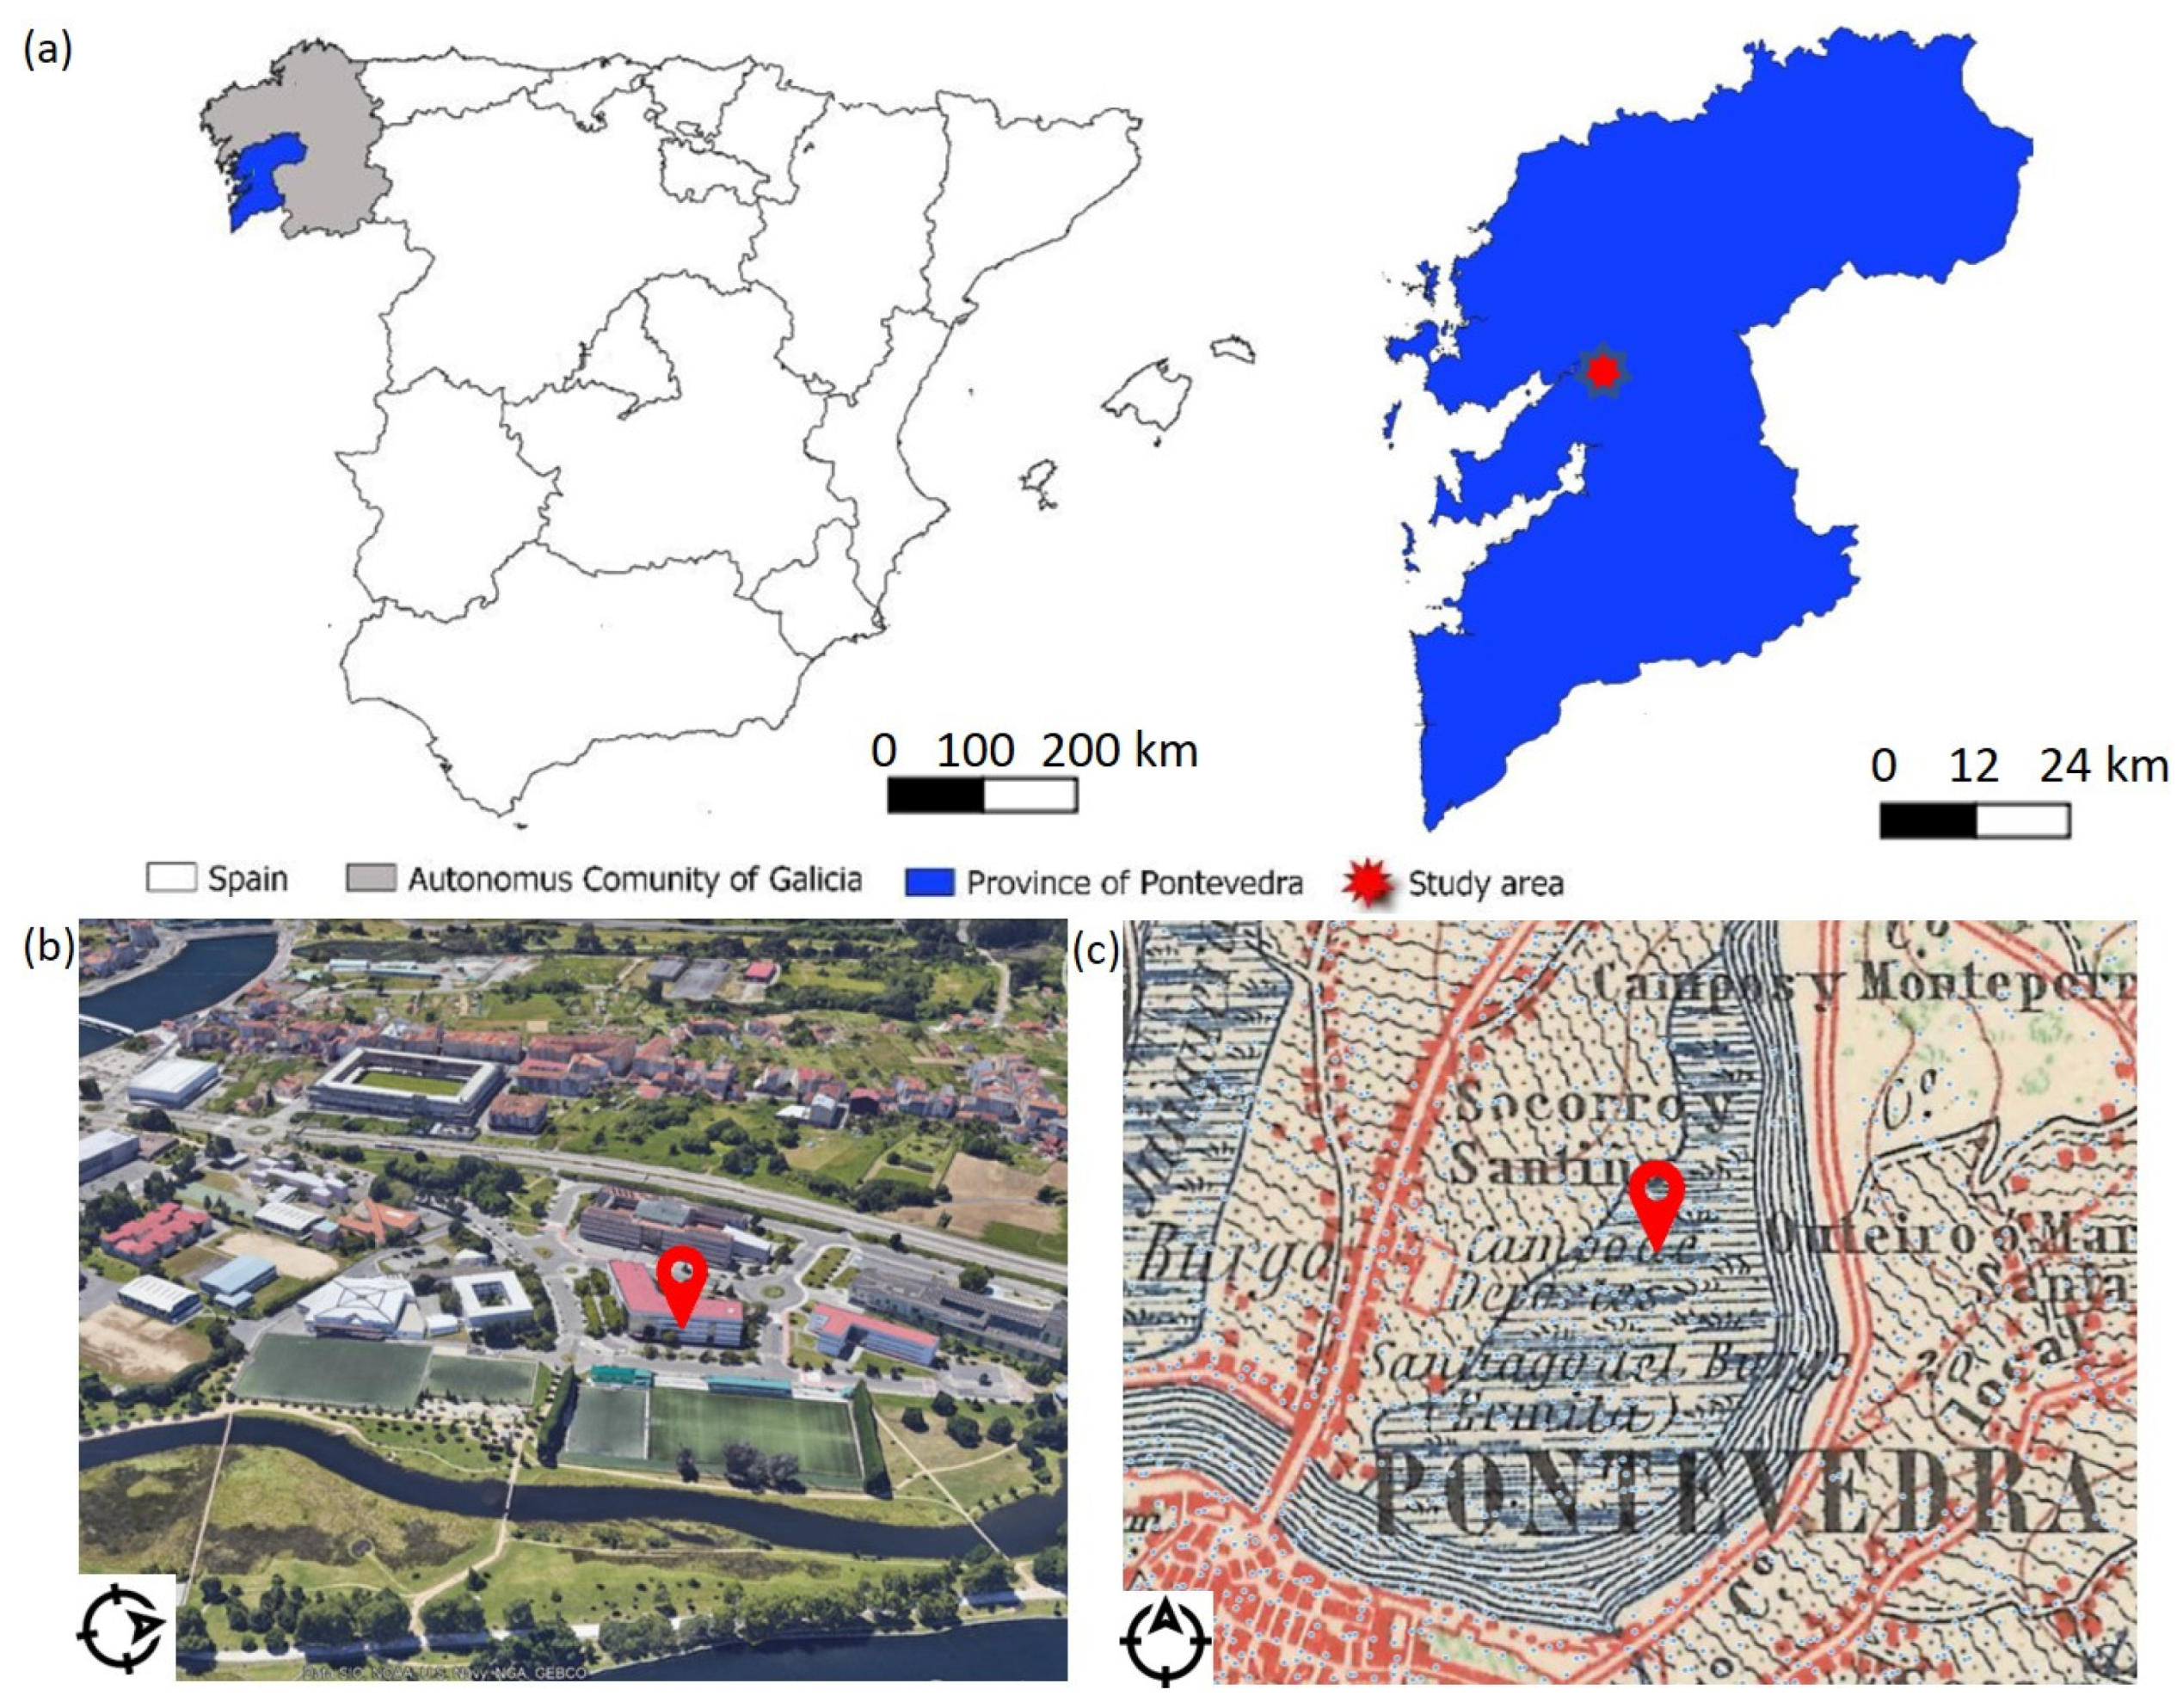
Figure 1. (a) Location of the study area in NW Spain, (b) 3D representation of Xunqueira (Pontevedra), highlighting the location of the Forestry Engineering School (image obtained from Google Earth Pro), and (c) historical cartographic representation of the study [39].
Remotesensing 15 03729 g001
Figure 2. (a) General view of the main facade of the Forestry Engineering School building. (b) Plan view indicating the location of the most affected zones (numbers 1 to 5). (c) Pictures of the settlement damages observed and their position in the Forestry Engineering School building (numbers 1 to 5).
Remotesensing 15 03729 g002
Figure 3. Maps of Pontevedra and Poio councils: (a) Lithology map, (b) risk map [41], and (c) lithostratigraphic column on marshland area [40].
Remotesensing 15 03729 g003
Figure 4. The coastal risk map (areas colored in red) developed by the Climate Change American Organization shows the potential situation of the studied area in 30 years (adapted from [42]). The star marks the Forestry Engineering School building.
Remotesensing 15 03729 g004
Figure 5. Graphics elaborated from the review in the article [56]: (a) Number of case studies using PSI and SBAS techniques and percentages, and (b) the total number of satellite images used in the case studies and type of band (in brackets).
Remotesensing 15 03729 g005
Figure 6. PSI network with colormap coherence connections, the red and blue colors being the low and high coherence, respectively.
Remotesensing 15 03729 g006
Figure 7. Selected network of interferograms for SBAS processing. Colormap based on average spatial coherence.
Remotesensing 15 03729 g007
Figure 8. (a) Map showing the spatial distribution of Tint. The white dot indicates the location of the reference point. The green box indicates the area of study. The area with high values of Tint in the southernmost part of the map corresponds to the Pontevedra estuary. (b) Histogram of Tint values corresponding to the map (a) extension, showing the number (#) of pixels versus the number (#) of triplets with non-zero integer ambiguity.
Remotesensing 15 03729 g008
Figure 9. GPR system used.
Remotesensing 15 03729 g009
Figure 10. (a) Subsidence heat map around Pontevedra city visualized in QGIS, where the port and an area of new construction are highlighted in black and green dashed boxes respectively; and (b) histogram of velocity deformation around Pontevedra city, where the colors are associated with the different rates of velocity deformation.
Remotesensing 15 03729 g010
Figure 11. PSI results at the Forestry Engineering School building: (a) scatters obtained where red points are negative velocities and blue points are positive velocities for the period January 2020 to March 2022, and (b) mean displacement evolution of the scatters related to the Forestry Engineering building.
Remotesensing 15 03729 g011
Figure 12. (a) Velocity map from SBAS processing using the period from January 2020 to March 2022. (b) Velocity map from June 2021 to March 2022 (b). The black dot shows the location of the Forestry Engineering School building; the dotted rectangle illustrates the area shown in Figure 10a. Coastline is indicated with a black line. The Lérez River is indicated with a blue polygon.
Remotesensing 15 03729 g012
Figure 13. Velocity map of the points used for computing the velocity histogram, from SBAS processing for the period from June 2021 to March 2022. The black circumference indicates the location of the Forestry Engineering School building. Points appearing in the water are due to artifacts, so they have not been considered for the study.
Remotesensing 15 03729 g013
Figure 14. Histogram of velocity values at points near the area of interest for the period from January 2020 to March 2022 (red) and from June 2021 to March 2022 (blue).
Remotesensing 15 03729 g014
Figure 15. Displacement time series at the location of the Forestry Engineering School building from the SBAS processing for the period from January 2020 to March 2022 (red line) and from June 2021 to March 2022 (blue line). The black line illustrates the linear regression model.
Remotesensing 15 03729 g015
Figure 16. Comparing displacement time-series results obtained from both techniques for two different periods: (a) from January 2020 to March 2022, and (b) from June 2021 to March 2022.
Remotesensing 15 03729 g016
Figure 17. The 500 MHz and 800 MHz GPR data were produced; highlighted in red circles are the potential forming sinkholes interpreted in the five profile lines: P1 (a), P2 (b), P3 (c), P4 (d), and P5 (e). The persistent scatters obtained with the PSI method and its velocity deformation during the period June 2021 to March 2022 are presented, thus the visual failures from Figure 2.
Remotesensing 15 03729 g017
Table 1. Previous works combining GPR with InSAR to monitor subsidence in urban areas.
Ref.InSAR FindingsGPR FindingsAdvantages of the CombinationLimitations
[29](PSI tech.): deformation values from −2.76 to −4.77 mm/yr(300/800 MHz): subsurface anomalies and shallow depression (cavities, drains and road fractures)The subsidence identified with the PSI technique is associated in the GPR data with subsurface faults (fractures, cavities, etc.), thus providing extra informationNot reported
[30](PSI tech.):
average velocity in both orbit tracks; vertical velocity component (from −6 to 2 mm/yr)
(400 MHz):
maps the shallow subsurface morphology showing depocenters
Both techniques are complementary: InSAR maps the surface movements of wide areas and GPR analyzes the subsurfaceLimitation in the penetration depth of GPR. Some variables (vegetation, orbits…) and assumptions (the north component sensitivity, equal incidence angle, etc.) with InSAR can reduce the accuracy
[31](PSI tech.): several areas of localized subsidence (from −3 to −6 mm/yr)(250 MHz): presence of sinkhole activityGPR was used as ground-truthing: subsidence locations (InSAR) were associated with sinkhole presence (GPR)The InSAR detection is limited to sinkholes that present subsidence for at least a longer period than the repeat pass interval of the satellite, also constrained by the relationship between spatial resolution and observed feature size
[32](PSI tech.):
1 mm/yr subsidence rate on the flank of the topography is low but stable in its center
(250 MHz): ongoing conical subsidence and sediments raveling into underlying voidsThe use of both techniques allows for optimizing the detection and delineation of sinkhole structuresResolving subsidence rates is more difficult in grassy than in arid settings. InSAR interpretation was limited by spatial coverage. Using lower frequency GPR antennas will resolve the deeper structure
[33](PSI tech.): vertical displacement from different orbit tracks (up to −9 mm/yr)(100 MHz): weakened sites, subsoil failures at the level of the bearing layer, tectonic activityThe joint use is very effective at identifying displacement tendencies in urbanized areas. (More reliable results, failures sized and detect tendencies)Not reported
[34](PSI tech.):
karst stability and backtrack historical
ground movements
(100 MHz):
anomalies associated with voids (groundwater flow within the karst system)
A better understanding of a karstic flow system in urban areasPSI limitations: convert phase shifts into distance for sudden and nonlinear movements and discriminates between terrain movement and target instability
GPR urban infrastructures make it difficult for data collection and interpretation
[35](PSI tech.): progressive subsidence(180 MHz):
information from the shallow subsurface
Both techniques complement each other and detect new faultsConductive materials and gardened areas limit the GPR depth investigation
[36](PSI tech.?):
rate values ranging from 4.4 to 17.3 mm/yr
(600/200 MHz): shallow cavities, depth of the rockhead and water table, sinkholes and edges definitionTo determine or corroborate the active nature of some of the sinkholes and, in some cases, improve the location of the sinkhole edgesThe loss of coherence, mainly related to the presence of agricultural fields and vegetation, reduce the density of measurement points
[37](PSI tech.):
the highest subsiding area resulted in −50 mm/yr
(200 MHz & 40/70 MHz): faults and probable originThe subsiding area identified with the PSI technique is supported by the fault detected by the GPRNot reported
Table 2. Dataset and characteristics for both InSAR processing techniques.
TechniqueSBASPSI
Satellite missionSentinel-1A/1B
GeometryDescending
Frequency bandC (5.6 cm)
Revisit period6 days
Incidence angle (Forestry Engineering School building)37.6°
Path125 (frames: 448, 450)
Time coverageJanuary 2020 to March 2022; 821 days
Number of scenes126125
Master imageNot applicable1 October 2021
Table 3. Evolution of persistent scatters during StaMPS processing.
Initial StateStamps (Third Step)Stamps (Fourth Step)
10,989 stable-phase pixels10,921 PS selected1684 PS kept after dropping adjacent pixels1650 PS after dropping noisy pixels
Table 4. Filters and settings used for GPR data processing.
FiltersSetting
500 MHz800 MHz
Subtract-mean (dewow)Time window: 2 nsTime window: 1.25 ns
Gain functionLinear: 1.44 and Exponential: 1.44Linear: 2 and Exponential: 2
Background removalby default (total time window)
Bandpass (Butterworth)Lower: 305 MHz
Upper: 773 MHz
Lower: 522 MHz
Upper: 1563 MHz
Migration (Kirchhoff)Velocity (hyperbola fitting): 0.1 m/ns
Table 5. Correlation between climate change factors and InSAR techniques.
SBAS|PSI
Temperature [°C]Humidity [%]Precipitation [mL]
Spearman
coefficient
Correlation0.19|0.240.09|−0.210.14|−0.16
p value0.047|0.0110.340|0.0290.140|0.090
Disclaimer/Publisher’s Note: The statements, opinions and data contained in all publications are solely those of the individual author(s) and contributor(s) and not of MDPI and/or the editor(s). MDPI and/or the editor(s) disclaim responsibility for any injury to people or property resulting from any ideas, methods, instructions or products referred to in the content.