Article

Characterization of Nitrogen Dioxide Variability Using Ground-Based and Satellite Remote Sensing and In Situ Measurements in the Tiber Valley (Lazio, Italy)

by
Cristiana Bassani
1,*,
Francesca Vichi
1,
Giulio Esposito
1,
Serena Falasca
2,
Annalisa Di Bernardino
2,
Francesca Battistelli
1,
Stefano Casadio
3,
Anna Maria Iannarelli
3 and
Antonietta Ianniello
1
1
C.N.R. Institute of Atmospheric Pollution Research, Strada Provinciale 35d, 9, Montelibretti, 00010 Rome, Italy
2
Department of Physics, Sapienza University of Rome, 00185 Rome, Italy
3
SERCO Italia SpA, Frascati, 00044 Rome, Italy
*
Author to whom correspondence should be addressed.
Remote Sens. 2023, 15(15), 3703; https://doi.org/10.3390/rs15153703
Submission received: 26 May 2023 / Revised: 6 July 2023 / Accepted: 17 July 2023 / Published: 25 July 2023
(This article belongs to the Special Issue Satellite and In Situ Observations of Air Pollution)

Abstract

:
The spatial–temporal distributions of nitrogen dioxide (NO2) in a rural area of Tiber valley were evaluated over one year (March 2022–February 2023) using remote sensing and in situ measurements. Surface concentration monitoring was conducted using a Pandora-2s spectrometer and a chemiluminescence analyzer operated at the Liberti Observatory (CNR-IIA). In spring, when the growing season and the agricultural activities increase, NO2 peaks were detectable by the Pandora but not by the in situ analyzer. The tropospheric Pandora and TROPOMI VCD products showed similar temporal patterns as those of the analyzer at the Observatory. High TROPOMI VCD levels in spring were detected at the Observatory and at six sites selected as representative of rural, residential, and industrial environments. WRF simulations found that high pollution events, observed by the Pandora and analyzer, occurred in calm wind conditions, favouring the accumulation of NO2 locally emitted. The complementary dataset provided by remote sensing and in situ techniques efficiently captured the spatial–temporal NO2 variability in a rural site exposed to low emission sources, thus supporting future decisional policies and actions.

1. Introduction

Nitrogen dioxide (NO2), a component of nitrogen oxides (NOx = NO + NO2), plays a key role in the atmospheric photochemistry affecting the tropospheric ozone (O3), particulate matter (PM), and acid rain formation, with implications for both tropospheric air quality and climate [1]. NO2 is a trace gas that absorbs visible solar radiation with a potentially direct role in global climate change [2].
Moreover, NO2 is a strong oxidant with harmful effects on human health and ecosystems. The negative effect of NO2 exposure on the human health is well-known. Guidelines were recently updated with a systematic review of the new outcomes, highlighting the damage due to long- and short-term exposure to NO2 [2,3,4,5,6].
Regarding ecosystems, nitrogen deposition is a source of nutrients with damaging effects in case of excessive deposition. The most common effects are soil acidification and eutrophication with significant impacts on biodiversity [7].
In this context, rural areas close to urban sites need to be monitored to protect and preserve the natural environment without damage to agri-food economic activities by planning institutional actions. Rural areas cover more than 80% of the total European Union (EU) territory with almost 30% of its population. Indeed, they are included in the European Commission’s long-term vision for EU rural areas up to 2040, which identifies actions to make these regions connected, resilient, and prosperous [8]. In the last decades, as suppliers of food and natural resources, rural areas have undergone major transformations caused by industrialization and urbanization. Therefore, in terms of land use and landscape changes, the environmental impact of the intensive anthropogenic activities on these regions concerns several different factors. In particular, we can consider consequences on environmental pollution (air, water, soil) and biodiversity loss, as well as on the availability of infrastructures and services, such as access to healthcare, education, public transport, and digital connectivity. In addition, rural areas are subject to local air pollution sources as well as secondary effects from nearby urban areas, reducing the quality of rural living environment, agricultural production, and ecosystem conservation.
Consequently, NO2 is selected as reference for the assessment of air pollution level in this work. In general, this pollutant is measured at fixed-located atmospheric monitoring stations using analyzers based on chemiluminescence technology. This is particularly suitable in order to investigate temporal variations of surface concentration at the ground-level, without a clear spatial representativeness of data in the surrounding areas. The spatial distribution thus achieved may not fit with rural areas environmental features as reported in [2].
In addition, ground-based and satellite products of the Earth Observation can be useful tools to fill this gap, providing data with horizontal spatial coverage as well as vertical characterization. As a result, a combined-use of Earth Observation and in situ measurements can provide a more accurate quantification of NO2 to understand its atmospheric spatial–temporal variability and chemical processing.
The study of the NO2 spatial–temporal variability exploits the vertical column densities (VCDs) provided by satellite missions dedicated to atmospheric global monitoring.
The next-generation Earth Observation missions were developed by the European Space Agency (ESA) on behalf of the Copernicus program. The first of these missions concerning climate change and air quality is the Sentinel 5 Precursor (S5P) launched on October 2017, carrying the TROPOMI (TROPOspheric Monitoring Instrument) sensor (http://www.tropomi.eu/, accessed on 24 April 2023). The NO2 TROPOMI VCDs, provided with unprecedented spatial resolution (7 × 3.5 km2 until July 2019 and 5.5 × 3.5 km2 to date), can be used to investigate the spatial distribution of NO2 in rural regions lacking an atmospheric monitoring station. Consequently, TROPOMI products are the most suitable data from space to analyze the spatial variability of the NO2 levels over an area with sparsely distributed emission sources [9,10,11,12,13].
Regarding the NO2 ground-based products, the Pandonia Global Network [14] (PGN, https://www.pandonia-global-network.org/, accessed on 24 April 2023) provides reference NO2 products obtained by the multi-axis differential optical absorption spectroscopy (MAX-DOAS) technique for the validation of satellite VCDs [15,16,17]. Furthermore, the surface concentrations measured by PGN along the horizontal line of sight allow the monitoring of the surroundings of the installation site [18].
In this study, we explore the potential application of the combined use of remote sensing and in situ techniques to investigate the daily, weekly, monthly, and seasonal trends of NO2 in the Tiber Valley, a rural area in the central part of the Italian peninsula (Lazio), not covered by the common air quality monitoring networks. In a previous work, the monitoring of NO2 was performed by analyzer and remote sensing data during the lockdown period in Rome and surrounding areas, including the Tiber Valley [19]. In the investigated area, the only in situ atmospheric data are available from the Liberti Observatory, which provides surface concentration and tropospheric VCDs in the Tiber Valley. The ground-based Pandora 2S spectrometer No. 138 (hereinafter, P138) installed at the Liberti Observatory belongs to PGN and to the Boundary layer Air Quality-analysis Using Networks of Instruments [20] (BAQUNIN, www.baqunin.eu/, accessed on 24 April 2023) supersite. The latter is funded by the ESA to allow the investigation of the atmospheric boundary layer as well as the validation of satellite products [21]. Furthermore, the surface concentration is measured by in situ surface chemiluminescence analyzer operating at the Liberti Observatory to supply data to the European Monitoring and Evaluation Programme (EMEP) [22] since 1983.
The investigation of NO2 over the Tiber Valley has been completed by using the tropospheric VCD provided by TROPOMI. The aim was to evaluate the distribution of the pollutant over a rural site with both agri-food production and growing anthropic activity.
Finally, the events with high NO2 surface concentration measured by both the ground-level instruments (P138 and analyzer) and with the availability of the TROPOMI VCD were explored by using the WRF model for wind profiling simulation to better understand the contribution of local emission over the valley.

2. Materials and Methods

2.1. Study Area

The study area is located in the middle of the Tiber Valley, the central part of the Lazio Region, about 25 km north of Rome and bounded by latitudes 41.50°N to 42.54°N and longitudes 12.00°E to 13.04°E. Figure 1 and Table 1 indicate the seven sites selected for the investigation of atmospheric pollution. The agricultural activities along the irrigated valley of the Tiber River represent the main characteristics of this area, as they have an important role in agricultural production (such as olive and fruits) and for other economic sectors (farming, construction, handicraft). Taking into account these rural resources, three sites have been considered along the valley: the Tiber Valley north part (TVN at 33 m a.s.l.), located about 50 km north of Rome and about 25 km southwest of the small city of Rieti; the Tiber Valley central part (TVC at 47 m a.s.l.), predominantly hilly and bordered to the west by Tiber River; the Tiber Valley south part (TVS at 36 m a.s.l.), bordered to the west by the Tiber River between Monterotondo (MR at 95 m a.s.l) and Rome.
Industrial activities are also located close to these two towns (MR and Rome) and near to the Tiber River: these include the industrial area of Monterotondo Scalo (MR-I at 26 m a.s.l) as well as the industrial zone Prato della Corte in Fiano Romano (FR-I at 77 m a.s.l), along the A1 motorway. Moreover, major roads and motorways (Salaria, Tiberina, Nomentana, Flaminia State roads), as well as railways (line FL1 Orte-Fara in Sabina-Fiumicino), were developed to connect the city of Rome with peripheral and extra-urban areas.
The last of the selected sites is the “A. Liberti” Research Observatory (LIB at 48 m a.s.l) at the National Research Council—Institute of Atmospheric Pollution Research (CNR-IIA) located in the CNR Research Area of Montelibretti (Rome). The Liberti Observatory collects atmospheric and meteorological data to study and monitor air pollution in a rural environment often exposed to local emissions (biomass heating, traffic and agricultural sources). These often include pollutant transport from the nearby city of Rome, because of the onset of the sea-land breeze regime [23]. Furthermore, the Liberti Observatory belongs to the EMEP network, designed to monitor the long-range transport of air pollutants, consequently, providing high-quality-assured data [22].
Moreover, the Observatory has been selected as representative of the rural environment of the BAQUNIN supersite, the latter also including urban and semi-rural components [21]. The Observatory is equipped with a Pandora 2S spectrometer (P138) belonging to PGN for the calibration and validation of satellite air quality products. Pandora P138 has been operating continuously from 28 January 2022, allowing for the preliminary analysis of the temporal behavior of the NO2 surface concentration at the Observatory and in its surroundings. The dataset considered in the present work ranges between 1 March 2022 and 28 February 2023.

2.2. TROPOMI

TROPOMI (TROPOspheric Monitoring Instrument) is a hyperspectral nadir-viewing instrument on board the Sentinel 5 Precursor (S5P) satellite with sun-synchronous orbit and a global daily overpass approximately at 13:30 local time [24]. This time of day corresponds to a low daily level of NO2 in the atmosphere for the minor impact of the local sources and for the highest lighting conditions affecting the photochemistry of this pollutant. TROPOMI splits the light using four spectrometers operating in the ultraviolet (UV), visible (VIS), near-infrared (NIR) and shortwave infrared (SWIR) spectral regions with a resolution of 0.5 nm. Specifically, for tropospheric vertical column density (VCD) of NO2, the procedure consists of three steps [25,26,27,28]. Firstly, a differential optical absorption spectroscopy (DOAS) technique [29] is applied to the acquired upwelling radiance and to the solar irradiance in the 405–465 nm spectral range for the retrieval of slant amount along sensor-Sun direction. Secondly, the stratospheric and tropospheric slant amounts are obtained by the assimilation of the total slant amount into the Tracer Model version 5 Massive Parallel (TM5-MP), chemical transport model gridded at 1 × 1° [30]. Finally, the slant tropospheric column is converted into tropospheric VCD by applying the air mass function (AMF) depending on climatology surface albedo gridded at 0.5 × 0.5° [31] and the NO2 vertical profile is obtained by TM5-MP simulations [29].
The tropospheric VCD product is available within 3 h (near-real-time, NRT) and within a few days after the acquisition (offline, OFFL). In addition, historical data reprocessed using the latest processor’s version are also available (RPRO). In this work, the TROPOMI products updated for version 2.4.0 of the Level-2 processor (available from the second half of 2022) are used to ensure consistent data through the examined period [26].
The reliability of the TROPOMI tropospheric VCD product was guaranteed by applying the filtering threshold to quality value (qa_value = 0.75), usually used for satellite applications. Hence, the analysis was carried out following the requirements recommended for all applications a data quality value (0.75 < qa_value < 1) restricted to cloud-free observations (cloud radiance fraction < 0.5) [25].

2.3. Instruments at the Liberti Observatory

2.3.1. Pandora 2S

Pandora-2S is an ultraviolet-visible (UV-VIS) system composed of 2 spectrometers, operating in the spectral ranges 280–530 nm (0.6 nm spectral resolution) and 380–900 nm (1.1 nm resolution), respectively. The Pandora-2S instrument can operate in three observation modes: direct sun, direct moon or zenith-sky. A more detailed technical description of the Pandora 2S can be found in [18] and [32].
In particular, the zenith-sky measurements are carried out with MAX-DOAS technique designed by the L2 Air-Ratio Sky Algorithm [18] involving acquisition of sky radiance at 5 pointing zenith angles (0, 60, 75, 88, 89 degrees) and a fixed azimuth direction including cloudy cases [17]. The tropospheric VCD and the near-surface concentration products are finally retrieved with a simple, robust, and fast approach, and do not require any external data and radiative transfer calculations, as all the algorithms developed for the PGN and included in the Algorithm Theoretical Basis Document (ATBD) [18]. In our case, the azimuth direction for P138 sky scans is 182° North pointing towards the MR site—i.e., one of the largest villages of the study area and the closest to the Observatory (about 4.5 km). Such conditions ensure that the resulting surface concentration includes the primary urban emission source of the valley.
P138 provides products with a temporal resolution of about 20 min.
In this study, the Pandora near-surface concentrations were screened based on the quality flag, removing data with an unusable low quality, uncertainty higher than 40% of the measurement and acquisitions carried out at solar zenith angles > 80 degrees.

2.3.2. Chemiluminescence NOx Analyzer

The NOx concentrations were measured every 1 min using a commercial chemiluminescence analyzer (Model 200E Teledyne API, Teledyne Instruments, San Diego, CA, USA). These data were subsequently quality-screened, and the 5 min average concentration was computed. The measurements are based on the chemiluminescence effect produced by the oxidation of NO by O3 molecules, which peaks at 630 nm. NO2 is obtained indirectly by converting it into NO using the thermal conversion method (molybdenum converter), which gives the total concentration of NOx. The difference between NOx and NO determines the NO2 concentrations. This technique is the standard reference method described in the European Air Quality Standard methods for measuring atmospheric nitrogen oxides [33]. The lowest detection limit of the instrument is 0.4 ppb, and the measurement precision is 0.5%. However, positive interferences from other nitrogen compounds (such as nitric acid, alkyl nitrates and peroxyacetyl nitrate) in the chemiluminescence method are possible and well documented [34,35]. The relative contributions of the interfering species depend on the reactive nitrogen containing compounds, the emission sources and the meteorological conditions [36].
Data quality for the analyzer was guaranteed by discarding concentrations lower than the detection limit (0.4 ppb) and single data higher than 100 ppb. Thus, noisy data, as well as sharp spikes, were removed keeping measurements with sustained increases lasting more than 5 min [37].

2.3.3. Meteorological Station

Meteorological measurements were carried out by a conventional meteorological station consisting of a two-meter height mast hosting sensors for air temperature and relative humidity (DMA672.5, Lsi Lastem s.r.l., Milan, Italy), global solar radiation (DPA154, Lsi Lastem s.r.l., Milan, Italy), UVA (DPA817, Lsi Lastem s.r.l., Milan, Italy), and UVB (DPA822, Lsi Lastem s.r.l., Milan, Italy). The mast is mounted on the top of a structure located within the Liberti Observatory, reaching a measurement height of about 5.5 m a.g.l. Wind speed and wind direction were measured by a sonic anemometer (DMB305, Lsi Lastem s.r.l., Milan, Italy) installed on a ten-meter mast located within the Observatory, close to the meteorological station.
All sensors were connected to a datalogger (e-log Lsi Lastem s.r.l., Milan, Italy) acquiring and storing the collected data in real time into a 1 min average period. These data were subsequently converted into 5 min averages.

2.4. The Weather Research and Forecasting Model

The Weather Research and Forecasting model (WRF) is an atmospheric modelling system designed for both research and numerical weather prediction, with application potential ranging from scales of meters up to thousands of kilometers [38]. Its dynamic solver is based on fully compressible Eulerian nonhydrostatic equations with terrain-following and -stretched vertical coordinates. The top of the model is a constant pressure surface and different types of nesting between computational domains are allowed. For a detailed description of the model the reader is referred to [38] and the user manual.
For this study, version 4.3 of WRF was employed to simulate wind speed in the Tiber Valley. In particular, the wind speed at 10 m above the ground and at different vertical levels is simulated at the seven sites considered. Initial and global boundary conditions are the final operational global analysis data of the National Center for Environmental Prediction, with a spatial resolution of 0.25 × 0.25° and a temporal resolution of 6 h (NCEP, 2015) [39]. The time resolution of the WRF output is hourly.
The computational domain configuration and numerical setup designed for this study are briefly described in Appendix A.

2.5. Methods

The investigation of the NO2 spatial–temporal variability in the Tiber Valley was carried out by exploiting data provided by different instruments in the period of 1 March 2022–28 February 2023. The surface concentration was investigated with a statistical approach applied to the simultaneous data within 5 min of the P138 and the analyzer. The tropospheric VCD was analyzed at the Liberti Observatory accounting for ground-based (P138) and satellite (TROPOMI) products and in the valley by monitoring specific pixels and by mapping the entire area. The results of seasonal, monthly, diurnal, and weekday/weekend NO2 concentrations are presented in box plots, showing the minimum value, the first quartile (the 25th percentile), the median (appears as a solid line in the box), the third quartile (the 75th percentile), and the maximum value.
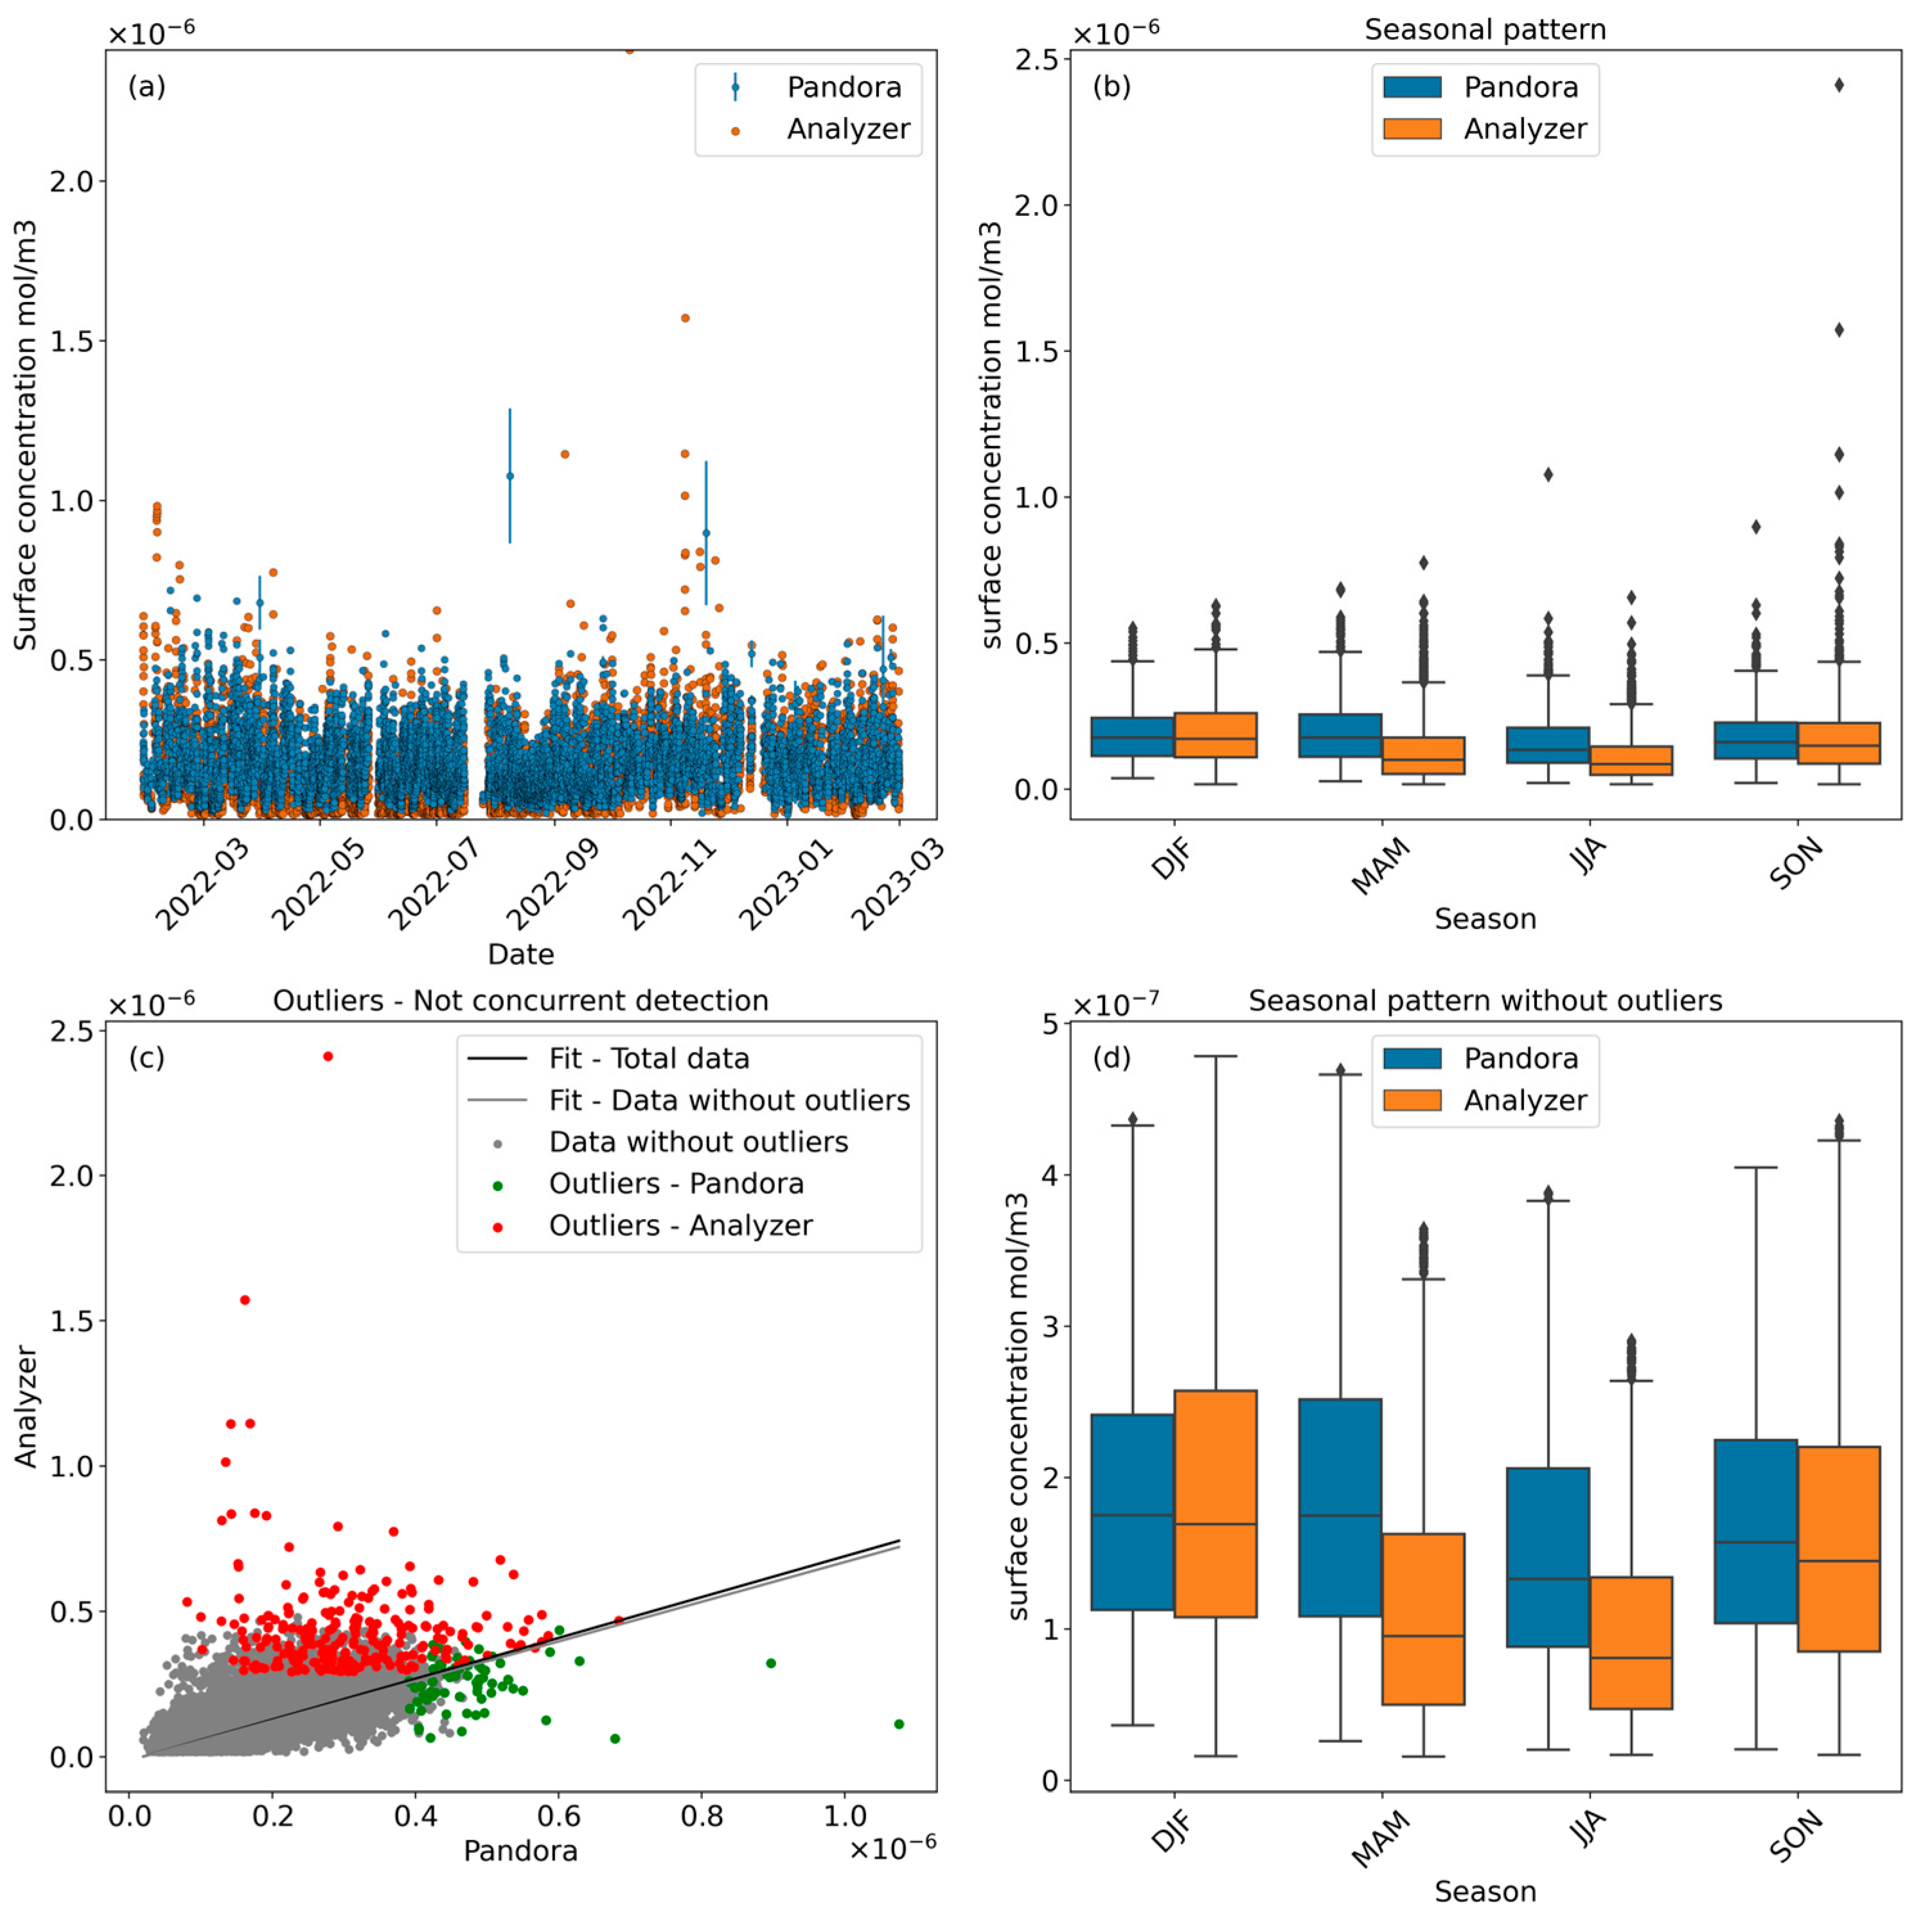
Moreover, events identified as outliers—i.e., characterized by higher-than-average NO2 concentration measured simultaneously by Pandora and analyzer (see Figure 2)—were subjected to further anemological investigation through WRF simulations, as explained in Section 3.2.3.

2.5.1. Pre-Processing

The available data were pre-processed to make robust and reliable datasets to explore atmospheric pollution in the Tiber Valley by tropospheric VCD and by surface concentration specifically at the Liberti Observatory and in its surroundings.
To evaluate the datasets of both P138 and analyzer for a real monitoring with data concurrent within 5 min, the surface concentration of the analyzer (NO2_an) expressed in ppb, were converted to the Pandora unit (mol/m3) following equation (1):
NO2_an[mol/m3] = NO2_an[ppb] × 4.0898 × (10−8) × (P_atm/P_0)/(T_0/T_K)
where P_atm and T_K are the pressure and temperature measured simultaneously by the meteorological station available in the Liberti observatory, and P_0 and T_0 are the pressure and temperature at standard conditions (P_0 = 1atm and T_0 = 25° = 298K).

2.5.2. Spatial–Temporal Variation of NO2 Surface Concentration

The NO2 surface concentrations were measured at the Liberti Observatory by the analyzer, operating routinely, and by the Pandora P138, collecting measurements when the sunlight was available along the path towards the operating zenith-sky measurements. Thus, the NO2 concentration at ground level could be monitored at the measurement site and its surroundings. Generally, NO2 tends to be present in high concentrations within urban areas due to the large presence of emitting sources, such as road traffic and stationary combustion plants. In comparison, unpolluted and rural areas with low occurrence of anthropogenic sources show significantly reduced NO2 concentrations, close to background levels [40,41,42]. Indeed, the significant amount of reliable data collected during the time-frame of interest allows us to analyze both general trends and specific events. Overall, the time-series showed outliers with a higher-than-average surface concentration. This aspect could significantly affect descriptive statistics, leading to deviation in behavior of the temporal trends. Accordingly, these anomalies (i.e., outliers) were removed from the seasonal pattern of both datasets, following the Inter Quartile Range (IQR) procedure.
The Pandora near-surface concentration represents the concentration integrated along the lowest elevation of the MaxDOAS scan—i.e., in the direction of the main emission sources close to the Liberti Observatory (South and South–West). Thus, the Pandora product must be considered for NO2 monitoring at ground level in the Tiber Valley extending the punctual analyzer measurements to the surroundings, fully exploiting the single measuring location of the Tiber Valley.
Temporal patterns of surface concentration provided by both instruments were analyzed and the complementary role of the analyzer and remote data for pollution information was highlighted. The daily, weekly, and monthly patterns reported to investigate the performance of a coupled system allow for a complete monitoring of the nitrogen dioxide concentration at ground level in a rural domain.

2.5.3. TROPOMI and Pandora Tropospheric VCD Products

The monitoring of the tropospheric NO2 by remote sensing techniques can help to investigate the vertical and horizontal variability of the pollutant chosen as proxy for the atmospheric pollution within the rural area lacking monitoring station networks. We are interested in investigating the spatial variability also considering the low atmosphere; hence, the VCD can provide useful information.
The TROPOMI and Pandora VCD were used to assess the possibility to extend the temporal analysis of the satellite product over the observatory to the overall study area. The pixels of satellite VCD with Liberti Observatory were extracted from all the TROPOMI data available in the period under investigation.
Due to the TROPOMI overpass time, the limited temporal window does not allow for the analysis of data on an hourly basis.

2.5.4. Spatial–Temporal Variation of the Tropospheric TROPOMI VCD in the Tiber Valley

The tropospheric VCD in the seven sites was used to evaluate the temporal trends of different environments identified in the Tiber Valley—i.e., rural, urbanized, and industrial sites, as shown in Figure 1. Up to seven pixels were extracted from the daily TROPOMI Level 2 files to determine the spatial and temporal heterogeneity of the atmospheric pollution over the Valley. This is particularly relevant due to the pressure of pollutants coming from local emissions and transported from Rome.
Finally, the spatial and temporal distributions of NO2 are shown considering the area, including Rome, within the boundaries with coordinates (Lat [41.50°N; 42.54°N]; Lon [12.00°E; 13.04°E]). The temporal snapshots of the TROPOMI tropospheric VCD over the entire Tiber Valley are generated by combining the daily multiple orbits into a single regular lat/lon grid with a resolution of 0.023 × 0.023° (≈2.5 × 1.9 km2 at 42°N) and, later, by averaging all the daily grids to produce weekly and seasonal maps, each one composed of 43 × 43 pixels. It should be kept in mind that the time of satellite overpass (about 13:30 local time) occurs during the maximum of solar radiation, corresponding to the highest reduction of the daily NO2 in the lowermost troposphere due to the photolytic decomposition of NO2 by solar radiation.

3. Results and Discussion

3.1. NO2 Surface Concentration at Ground Level

3.1.1. Seasonal Variations

Figure 2 showed the statistical analysis of the seasonal datasets of Pandora and the analyzer. In Figure 2a, the temporal pattern of both datasets was shown for the entire investigation time-frame consisting of 7604 samples. Measurements collected during Christmas holidays (from 25 December 2022 to 8 January 2023) were discarded to avoid emission reduction due to vacation inactivity influencing temporal variability. The upper and lower thresholds were defined by the lower (Q1) and the upper (Q3) quartiles of the two box plots, respectively. The Inter Quartile Range (IQR) procedure for the outlier detection and removal was applied to remove the outliers: the admissible range was defined by lower (Q1 − 1.5 × IQR) and upper (Q3 + 1.5 × IQR) thresholds, where IQR = Q3 − Q1. In Figure 2b, the seasonal patterns showed a non-negligible number of outliers in both datasets, 102 for P138 and 238 for the analyzer, respectively. In Figure 2c, Pandora outliers (green) were in the lower section of the graph, meaning the concurrent analyzer retrievals were lower than the Pandora ones. On the other hand, the analyzer outliers (red) were in the upper section of the graph with a symmetric situation: high analyzer retrievals corresponded to low simultaneous Pandora products. For this reason, we could assume that P138 and analyzer were able to detect separate pollution events. The seasonal dataset was screened by removing all the outliers: the datasets consisted of 7502 for P138 and 7366 for the analyzer in total. These were used to detect monthly, weekly and hourly patterns of the nitrogen dioxide. The correlation between the two datasets could be assumed as unchanged after the outliers’ removal. Indeed, linear fits before (black line) and after (grey line) the outliers’ screening reveal the same intercept (2.0 × 10⁻⁸), a weak slope variation (from 0.69 to 0.67) and a negligible increase of the correlation coefficient (around 0.60). Finally, the seasonal variations of average NO2 concentrations were shown in Figure 2d. The NO2 concentration decreased moving from winter (December, January and February, DJF) to summer (June, July and August, JJA), especially for the analyzer measurements at the Liberti Observatory. This difference might be due to high anthropogenic emissions during the winter because of domestic heating and transport sector as well as meteorological and climatic factors affecting atmospheric NO2 lifetime (e.g., daylight duration, solar radiation) [43]. On the other hand, during the summer and spring (March, April and May, MAM), Pandora concentrations were higher than those measured by the analyzer; this is possibly owing to its capability to monitor both local and non-local emission sources. These increases in average NO2 during the spring and summer also coincided with the onset of the growing season and an enhancement in agricultural activity (fertilizer application periods and agricultural product periods with increases in agricultural traffic, such as tractors and transport trucks), which could impact the seasonal NO2 levels in rural areas where anthropogenic emissions can be assumed as quite low [44,45,46]. These results highlight the peculiar seasonal variations of the study area not retrieved in Rome. In fact, the typical cycle showing high levels in the winter and low levels in the summer was detected by the Pandora spectrometer, which was installed in the urban location of the BAQUNIN supersite [47].
Figure 3 shows the seasonal wind roses of the wind speed and direction at LIB. A prevailing moderate breeze (wind speed less than 6 m/s) blowing from North and Northwest was observed in the winter and autumn, whereas a predominant southwesterly component occurred during the summer and spring months. The occurrence of periodic winds along the path of MR and its surrounding rural areas could explain the enhanced NO2 levels observed by the Pandora spectrometer during the spring and summer seasons.
In Table 2, statistical indicators of both ground-level instruments are reported with concurrent Pandora and analyzer measurements, available for the investigated time-frame (before screening) and the final datasets (after screening). The final seasonal averages highlighted the capability of the P138 to capture the increase in surface concentration during MAM (1.8686 × 10⁻⁷ mol/m3), as well as the expected high level during DJF (1.8563 × 10⁻⁷ mol/m3) also detectable from the analyzer (1.8341 × 10⁻⁷ mol/m3). The minimum concentration was reached during JJA for both datasets (1.5205 × 10⁻⁷ mol/m3 for P138 and 9.6749 × 10⁻⁸ mol/m3 for analyzer), confirming the lowest surface concentration during the summertime. The autumn datasets (September, October and November, SON) showed a similar behavior with values close to those experienced during the winter, as expected for autumn.

3.1.2. Monthly Variations

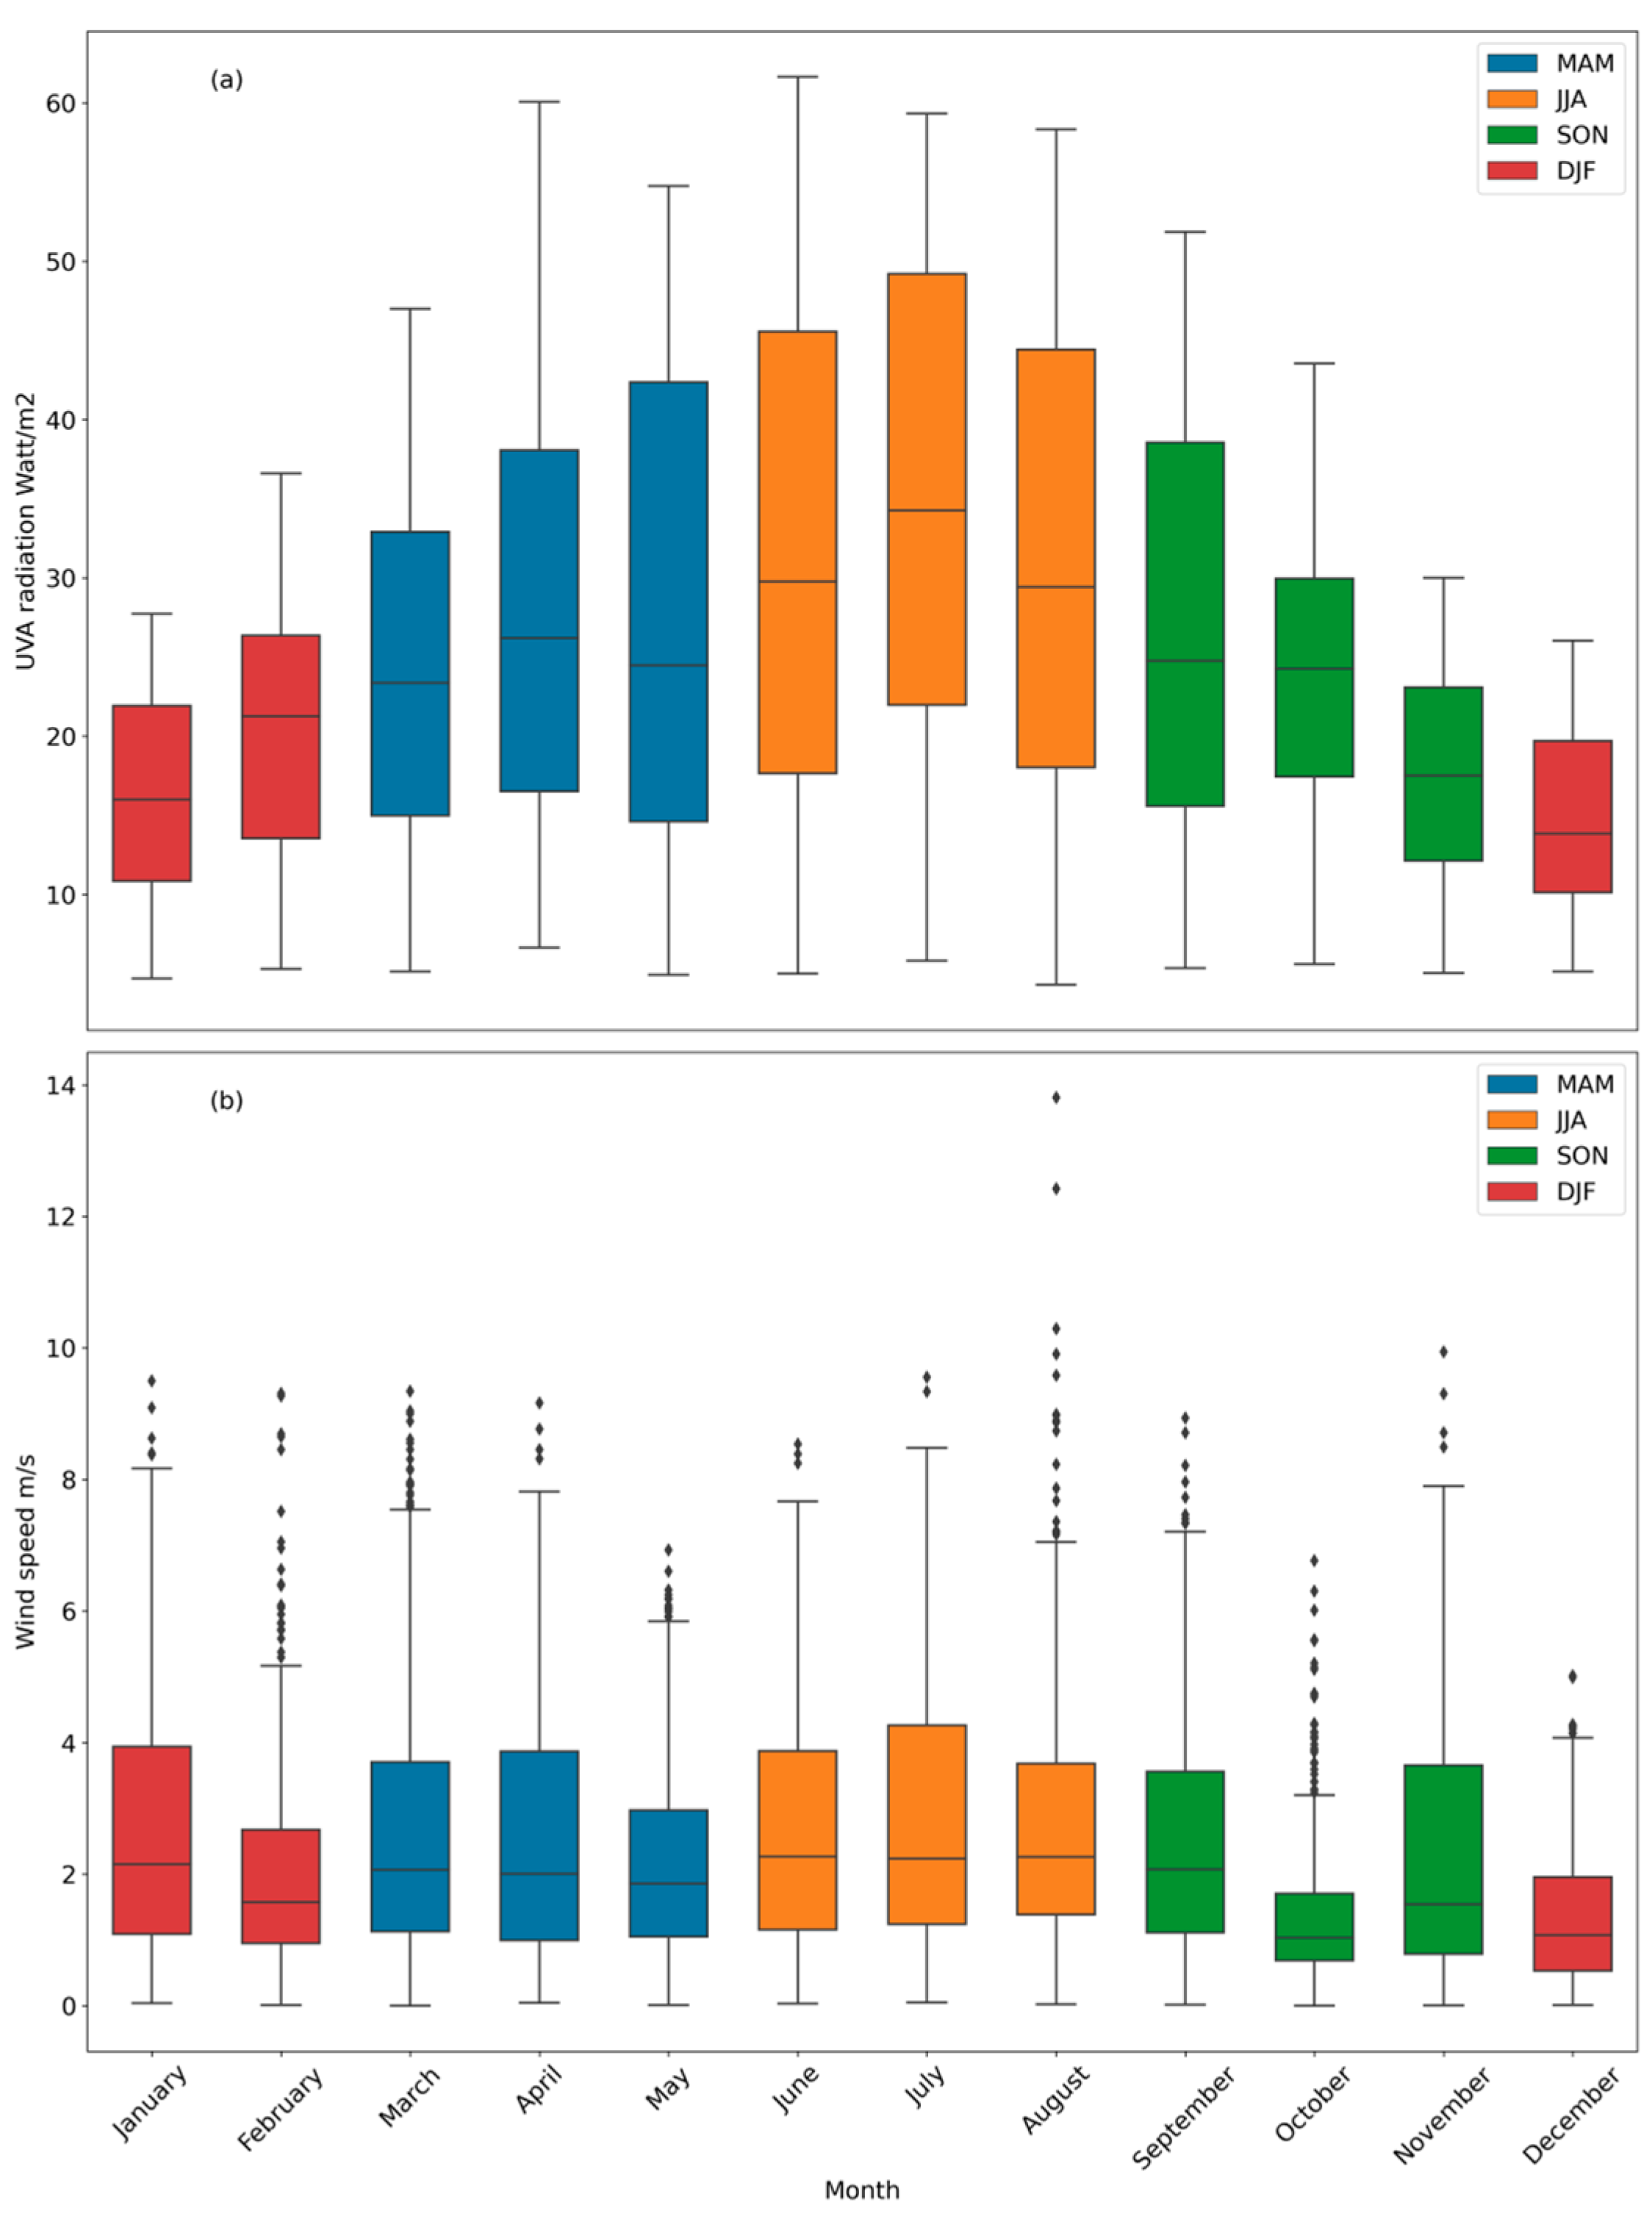
Figure 4 shows the monthly patterns of the NO2 surface concentration, which increase from September to December. On the contrary, NO2 minima are mostly observed in late spring and summer. The decrease of NO2 concentrations during these months was consistent with the increase in solar radiation (Figure 5). However, the difference between months of the same season can be associated with changes in meteorological conditions. For instance, a slight increase of the NO2 levels during May and August compared to those observed in April and July can be attributed to pollutant accumulation due to weak advection (Figure 5). On the other hand, as seen for the seasonal variations, rural sites were affected by agricultural activities during the warm period. Combined with unfavorable meteorological conditions, these can contribute to the increase of pollutant concentrations during the spring and summer. This was more evident from remote sensing measurements, able to capture the local or non-local emission sources more easily detectable than punctual measurements carried out by the analyzer.
Conversely, the two patterns seemed to agree when dealing with cases of moderate pollution, which appeared in the October to March seasons. Indeed, within this time span, the pollutant spreads homogeneously over the entire area.

3.1.3. Diurnal Variations

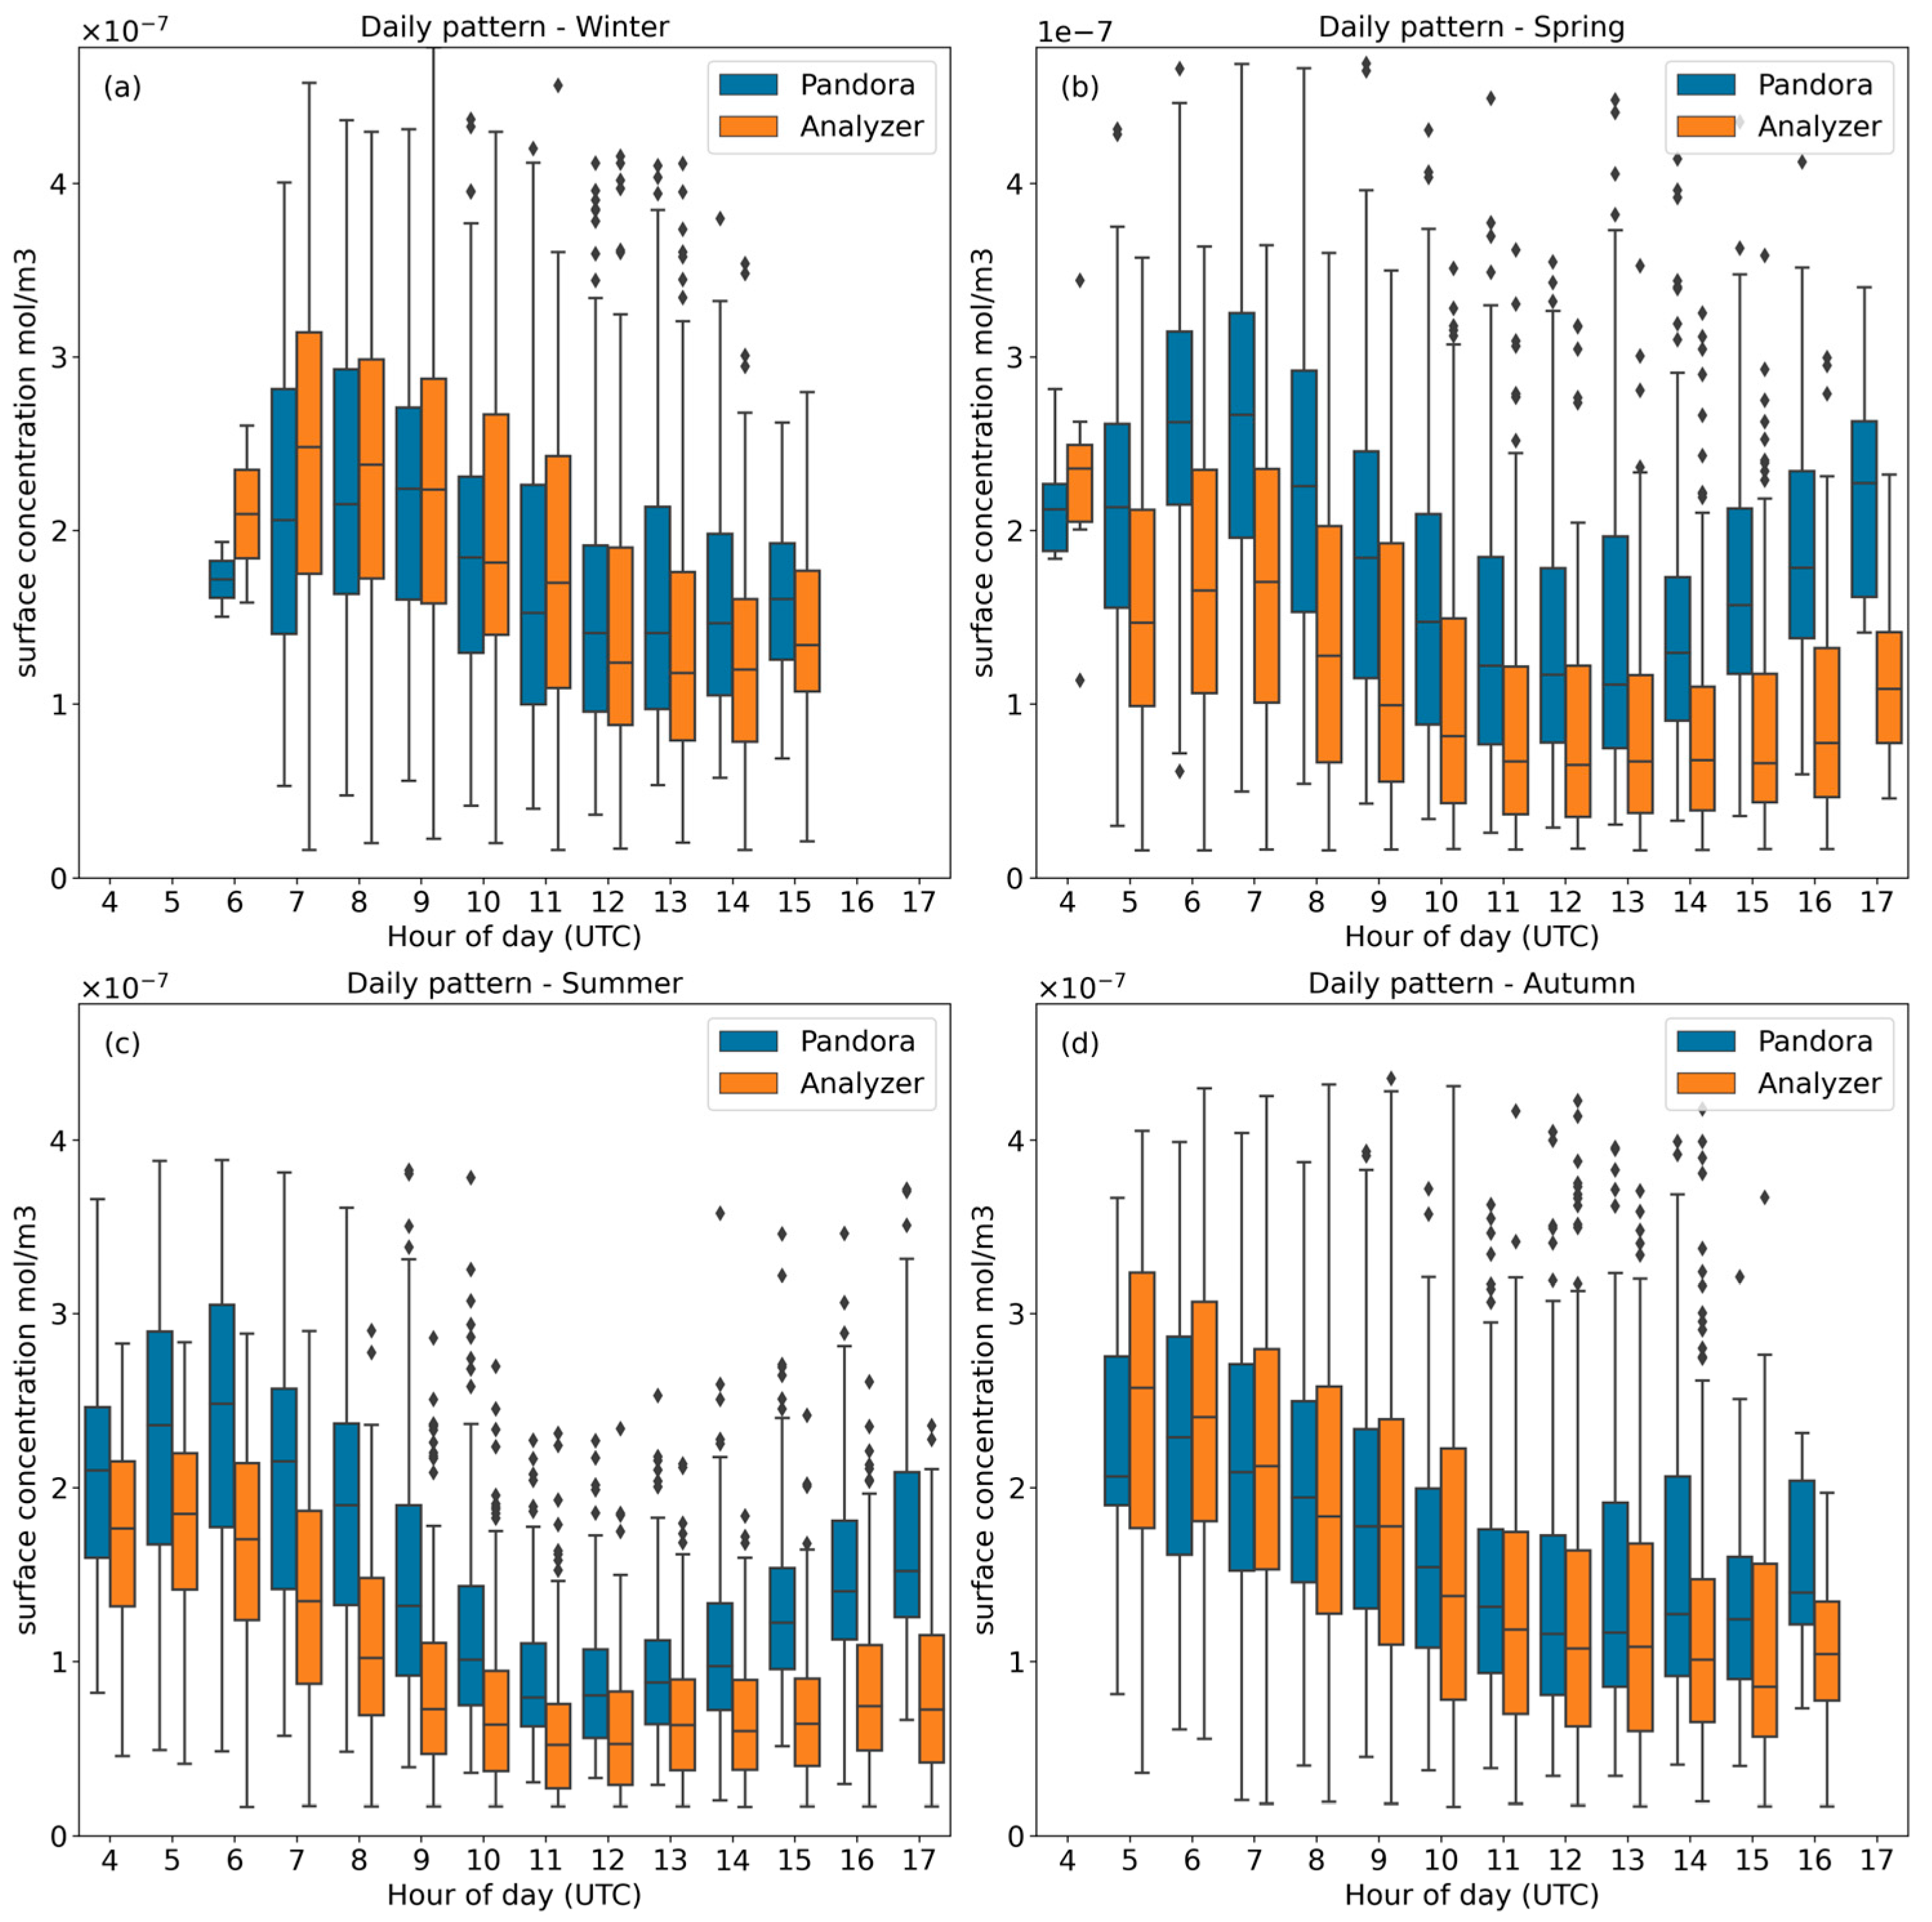
Figure 6 shows the daily patterns of the P138 (blue) and analyzer (orange) datasets in the different seasons. The usual diurnal cycle of NO2 was followed from all the subsets. The observed average diurnal cycle consisted of a bimodal distribution related to the morning (06:00–09:00 UTC) and evening (the increase begins around 15:00 UTC) rush hours. This was when NO2 concentrations reached their maxima, as demonstrated in a previous work in the same sampling site [19]. After that, NO2 concentrations decreased around midday due to solar radiation. Such dynamics led to the photochemical loss of this pollutant and the regeneration of O3, according to the following reactions:
NO2 + hn (<420 nm) → NO + O(3P)
O(3P) + O2 + M → O3 + M
O3 + NO → NO2 + O2
The morning peak was mainly imputable to the photochemical formation (reaction 3), emission, and meteorological conditions, which significantly contributed to the diurnal NO2 variation. Indeed, the morning peak for each season happened at sunrise (06:00 UTC in summer, 07:00 UTC in spring, and 09:00 UTC in winter).
Conversely, the evening peak was almost not visible, showing only a gradual increase in the afternoon. This happened because Pandora products were obtained from sunlight measurements—i.e., from sunrise to sunset (around 16:00 UTC in winter and autumn, 17:00 UTC in spring, and 18:00 UTC in summer).
During the spring and summer, Pandora detects the afternoon peak better than the analyzer for its ability to monitor the surroundings influenced by emission sources and air masses transported along the Tiber Valley. During the winter and autumn, the similarity of the temporal patterns of in situ data and remote sensing product may be explained by conditions of moderate atmospheric pollution, leading to a more homogeneous spatial distribution of NO2 than in the other seasons (i.e., spring and summer).
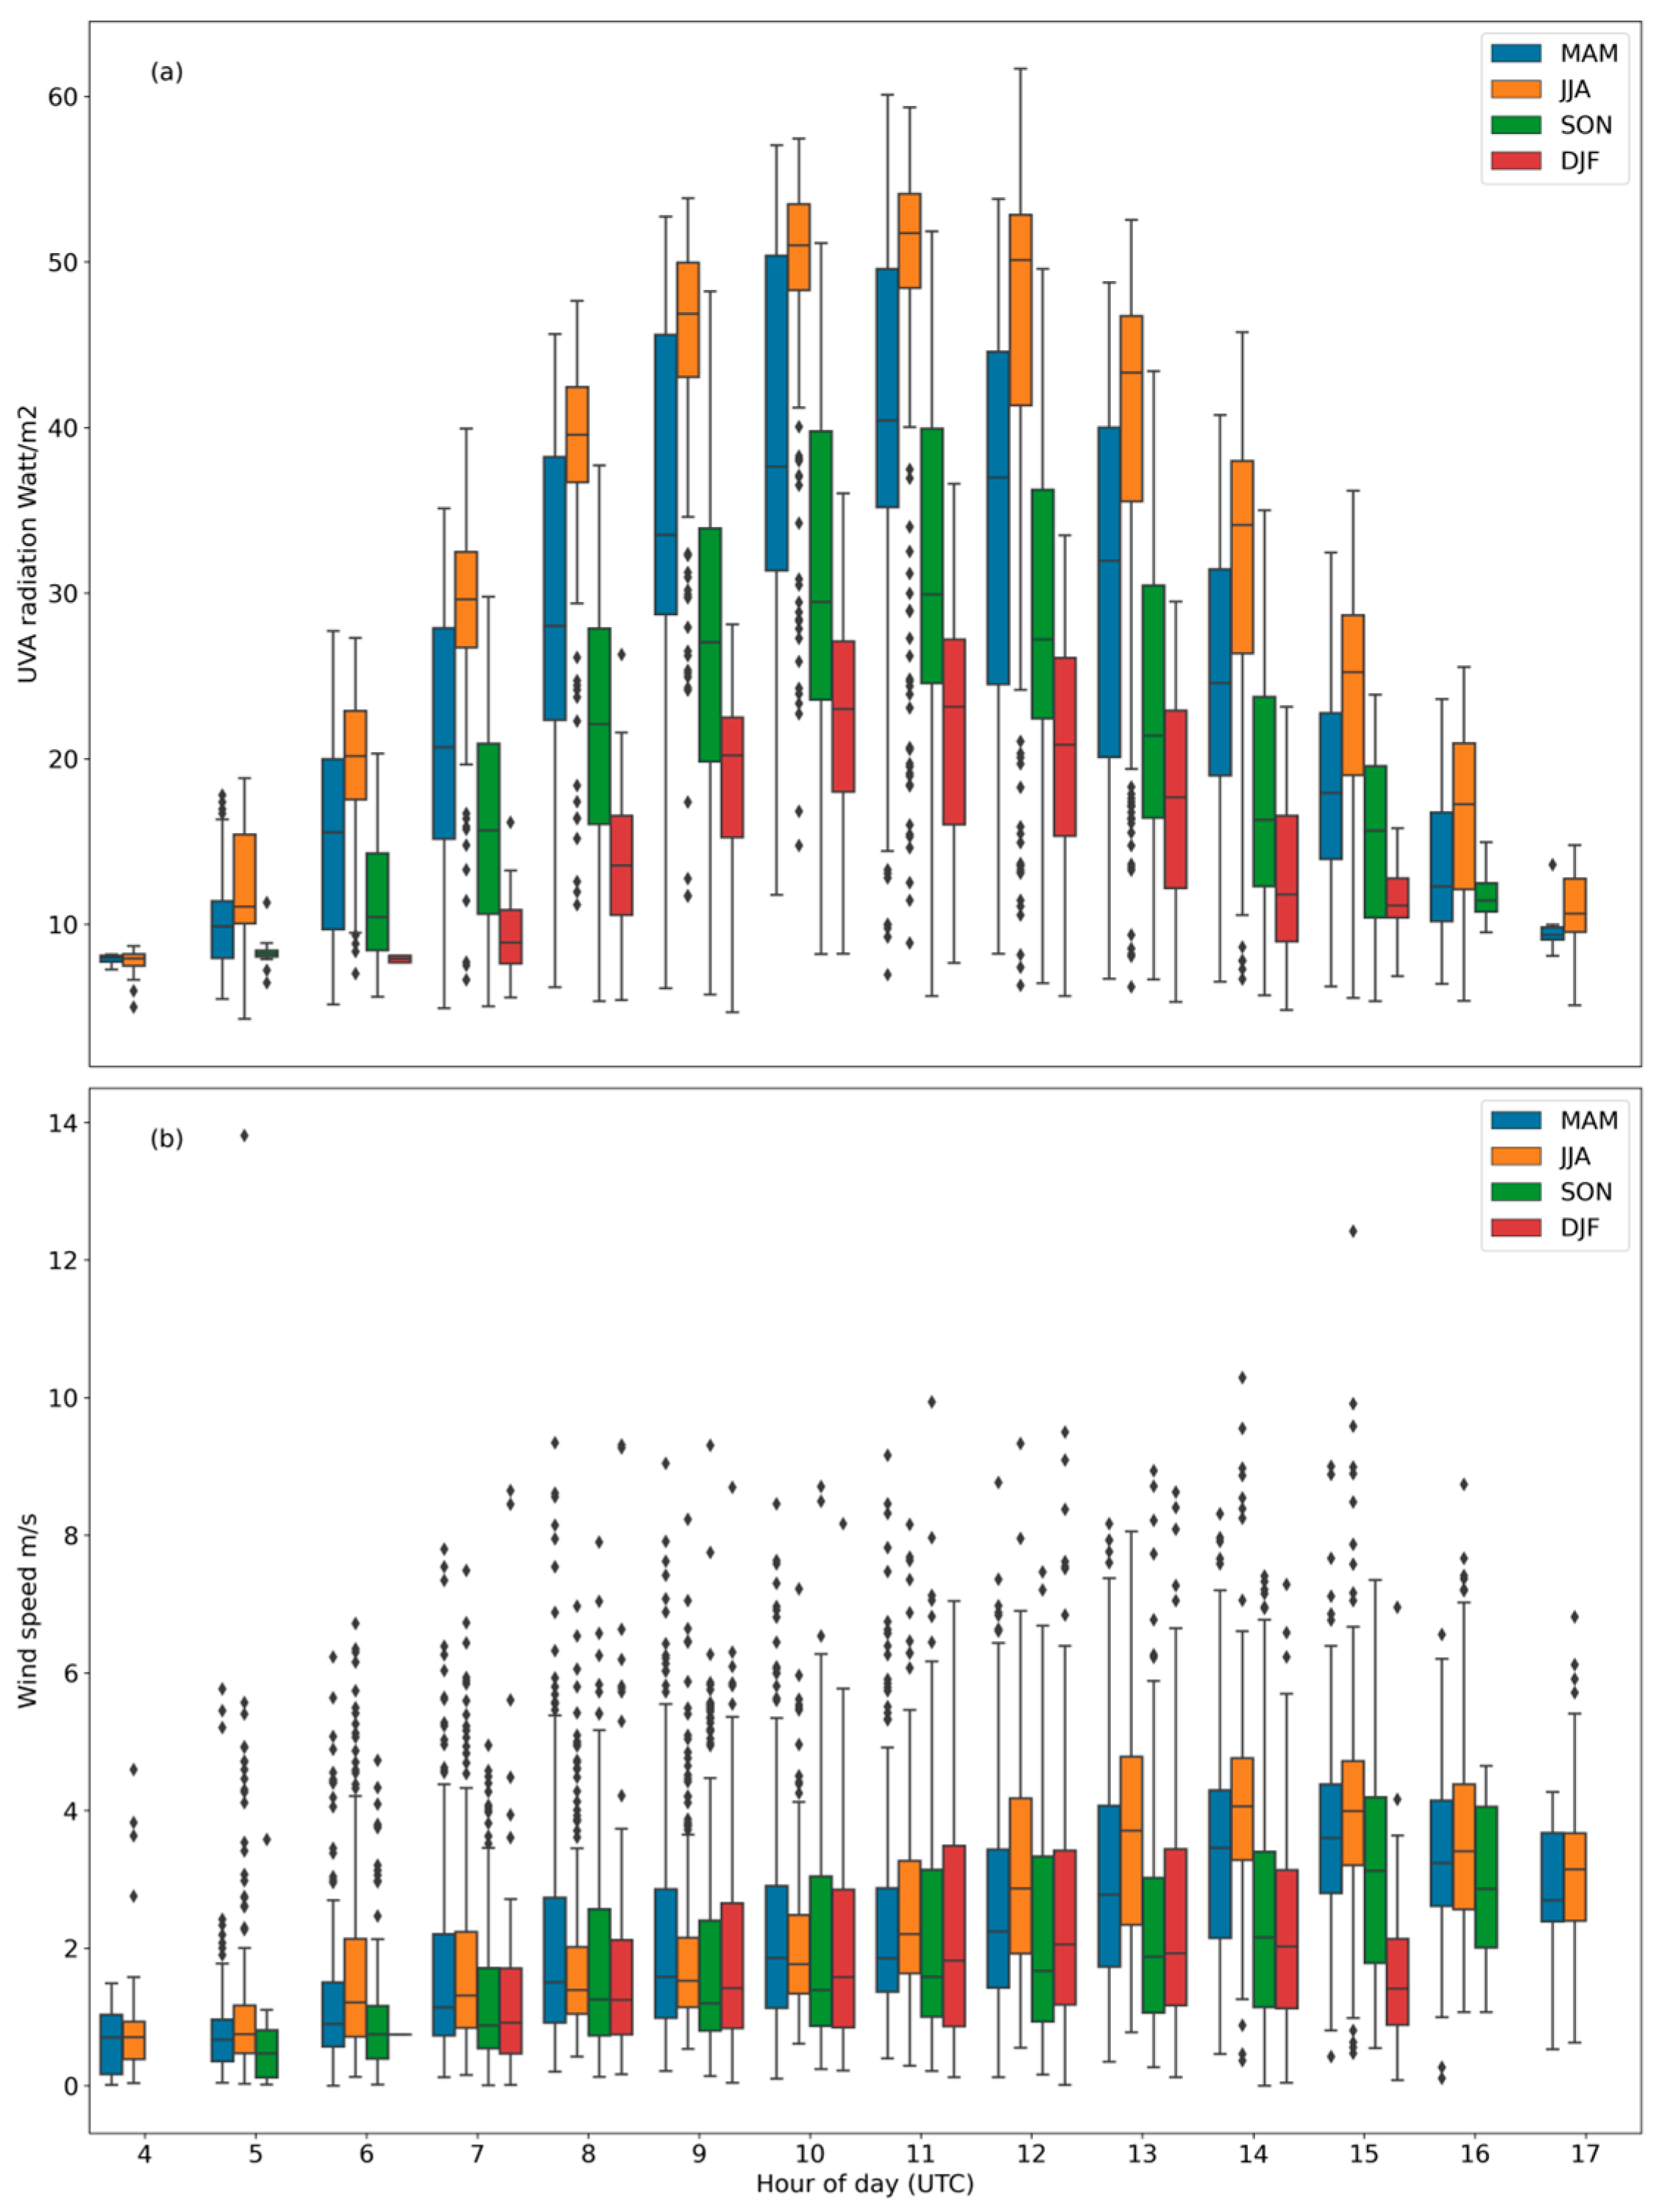
Daily patterns are confirmed by the meteorological conditions shown in Figure 7, limited to the time of availability of Pandora products. During the spring and summer, the dominant South–Southwest (about 200°N) wind in the afternoon confirmed that Pandora detected local emission sources. On the other hand, no contribution was expected from the urban site (Rome) because of the low wind speed and almost constant wind direction at ground level. In addition, the increase in solar radiation during the summer and spring caused the reduction of nitrogen dioxide because of its photolysis. Although, the insolation (Figure 7a) is more variable in springtime at 12:00–13:00 UTC, with respect to the usual spring regime. Moreover, a slight delay in the daily NO2 reduction was expected.
In the autumn, low solar radiation and a weak rising trend of the near-surface wind speed without a prevalent direction contribute to the gradual accumulation of NO2 distributed homogeneously in the area. This aspect was in line with the similarity of the autumnal NO2 surface concentration measured at the Liberti Observatory by the analyzer and retrieved from Pandora towards the emission sources already discussed.
In winter, the prevailing low wind speed and lowest solar radiation determined the enhancement of the observed NO2 levels, especially during the early morning (07:00–09:00 UTC). This result confirmed the daily NO2 pattern during winter, as presented in Figure 6.

3.1.4. Weekday/Weekend Variations

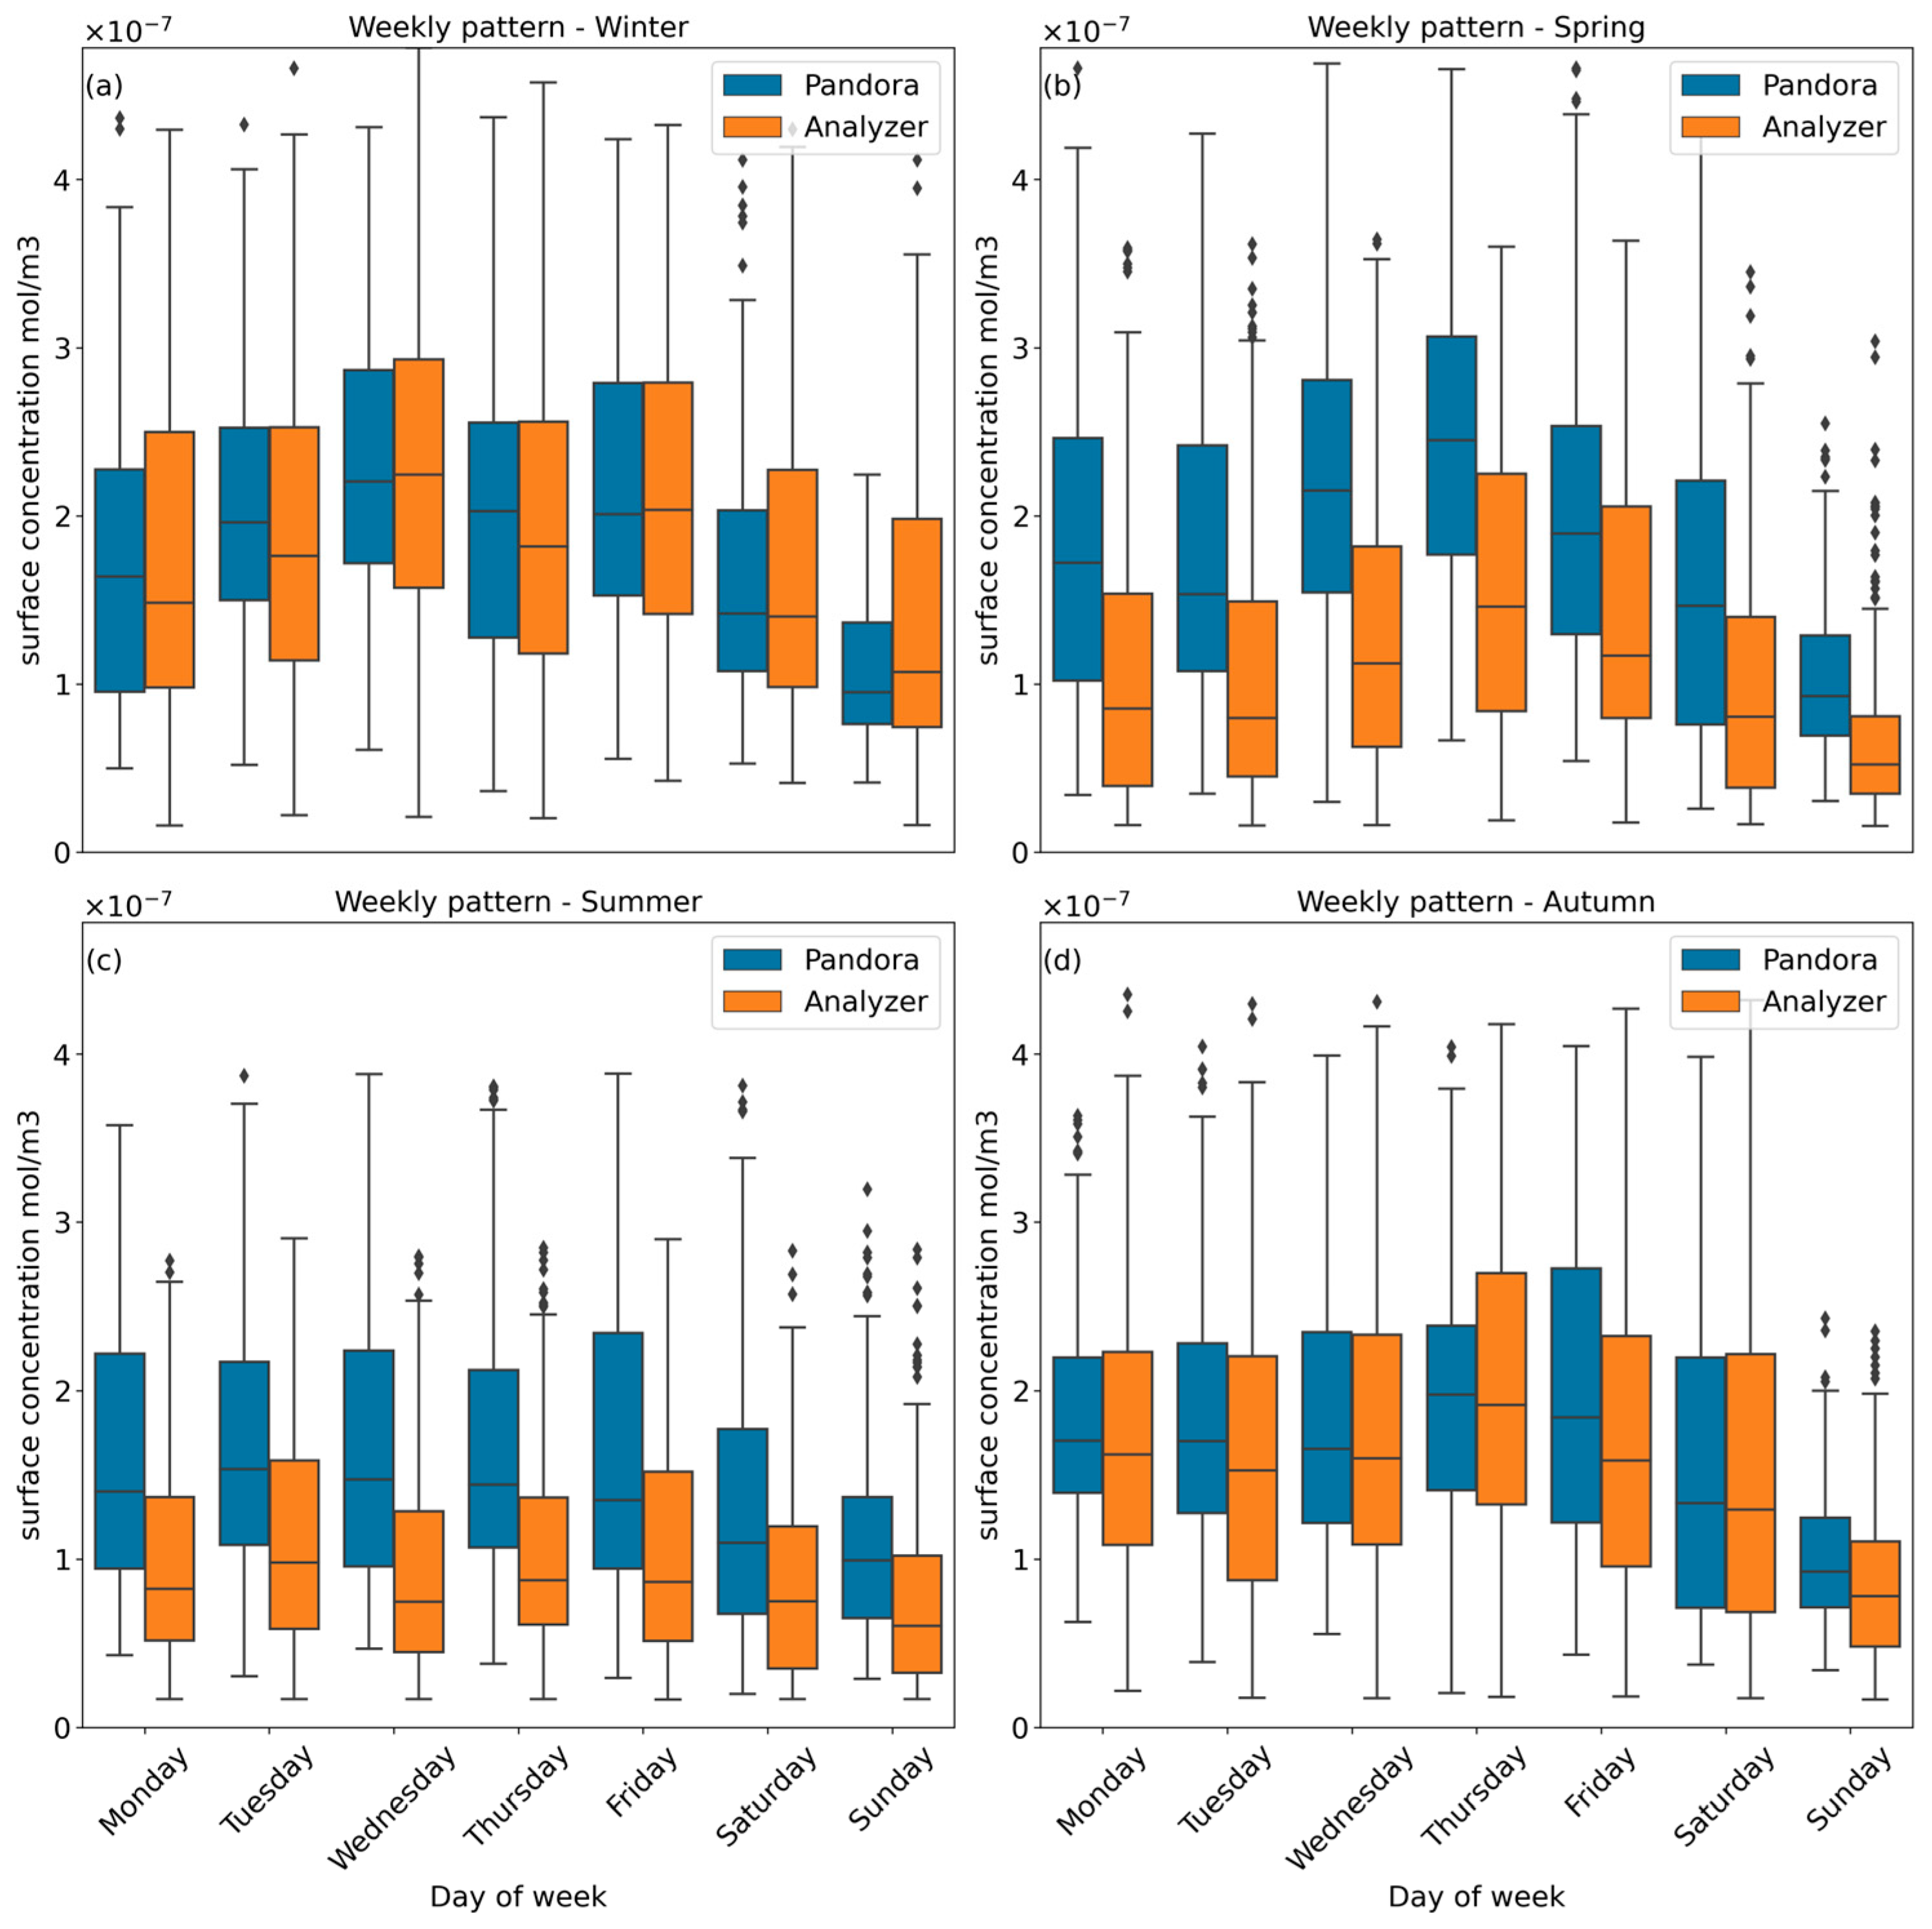
Seasonal trends of weekdays and weekends NO2 concentrations are shown in Figure 8. Consistent with previous studies, NO2 concentrations were lower during weekends (Saturday and Sunday) than weekdays (from Monday to Friday) due to reduced NOx emissions from the road transport sector [48,49].
According to the findings from the hourly pattern, the summer and spring are characterized by different NO2 concentrations measured by the analyzer located at the Liberti Observatory, and retrieved by P138 along the horizontal direction of acquisition. During the summer, the weekend effect is relatively less evident, with a slight difference between the weekday and weekend NO2 concentrations, as shown by both datasets, especially for analyzer measurements.
Regarding the moderate polluted seasons (winter and autumn), the analyzer and P138 were characterized by similar values and trends, as previously discussed also for the hourly patterns. Domestic heating, a local emission source distributed over the study area and not strictly confined to the villages, can also be assumed as responsible for the winter increase.
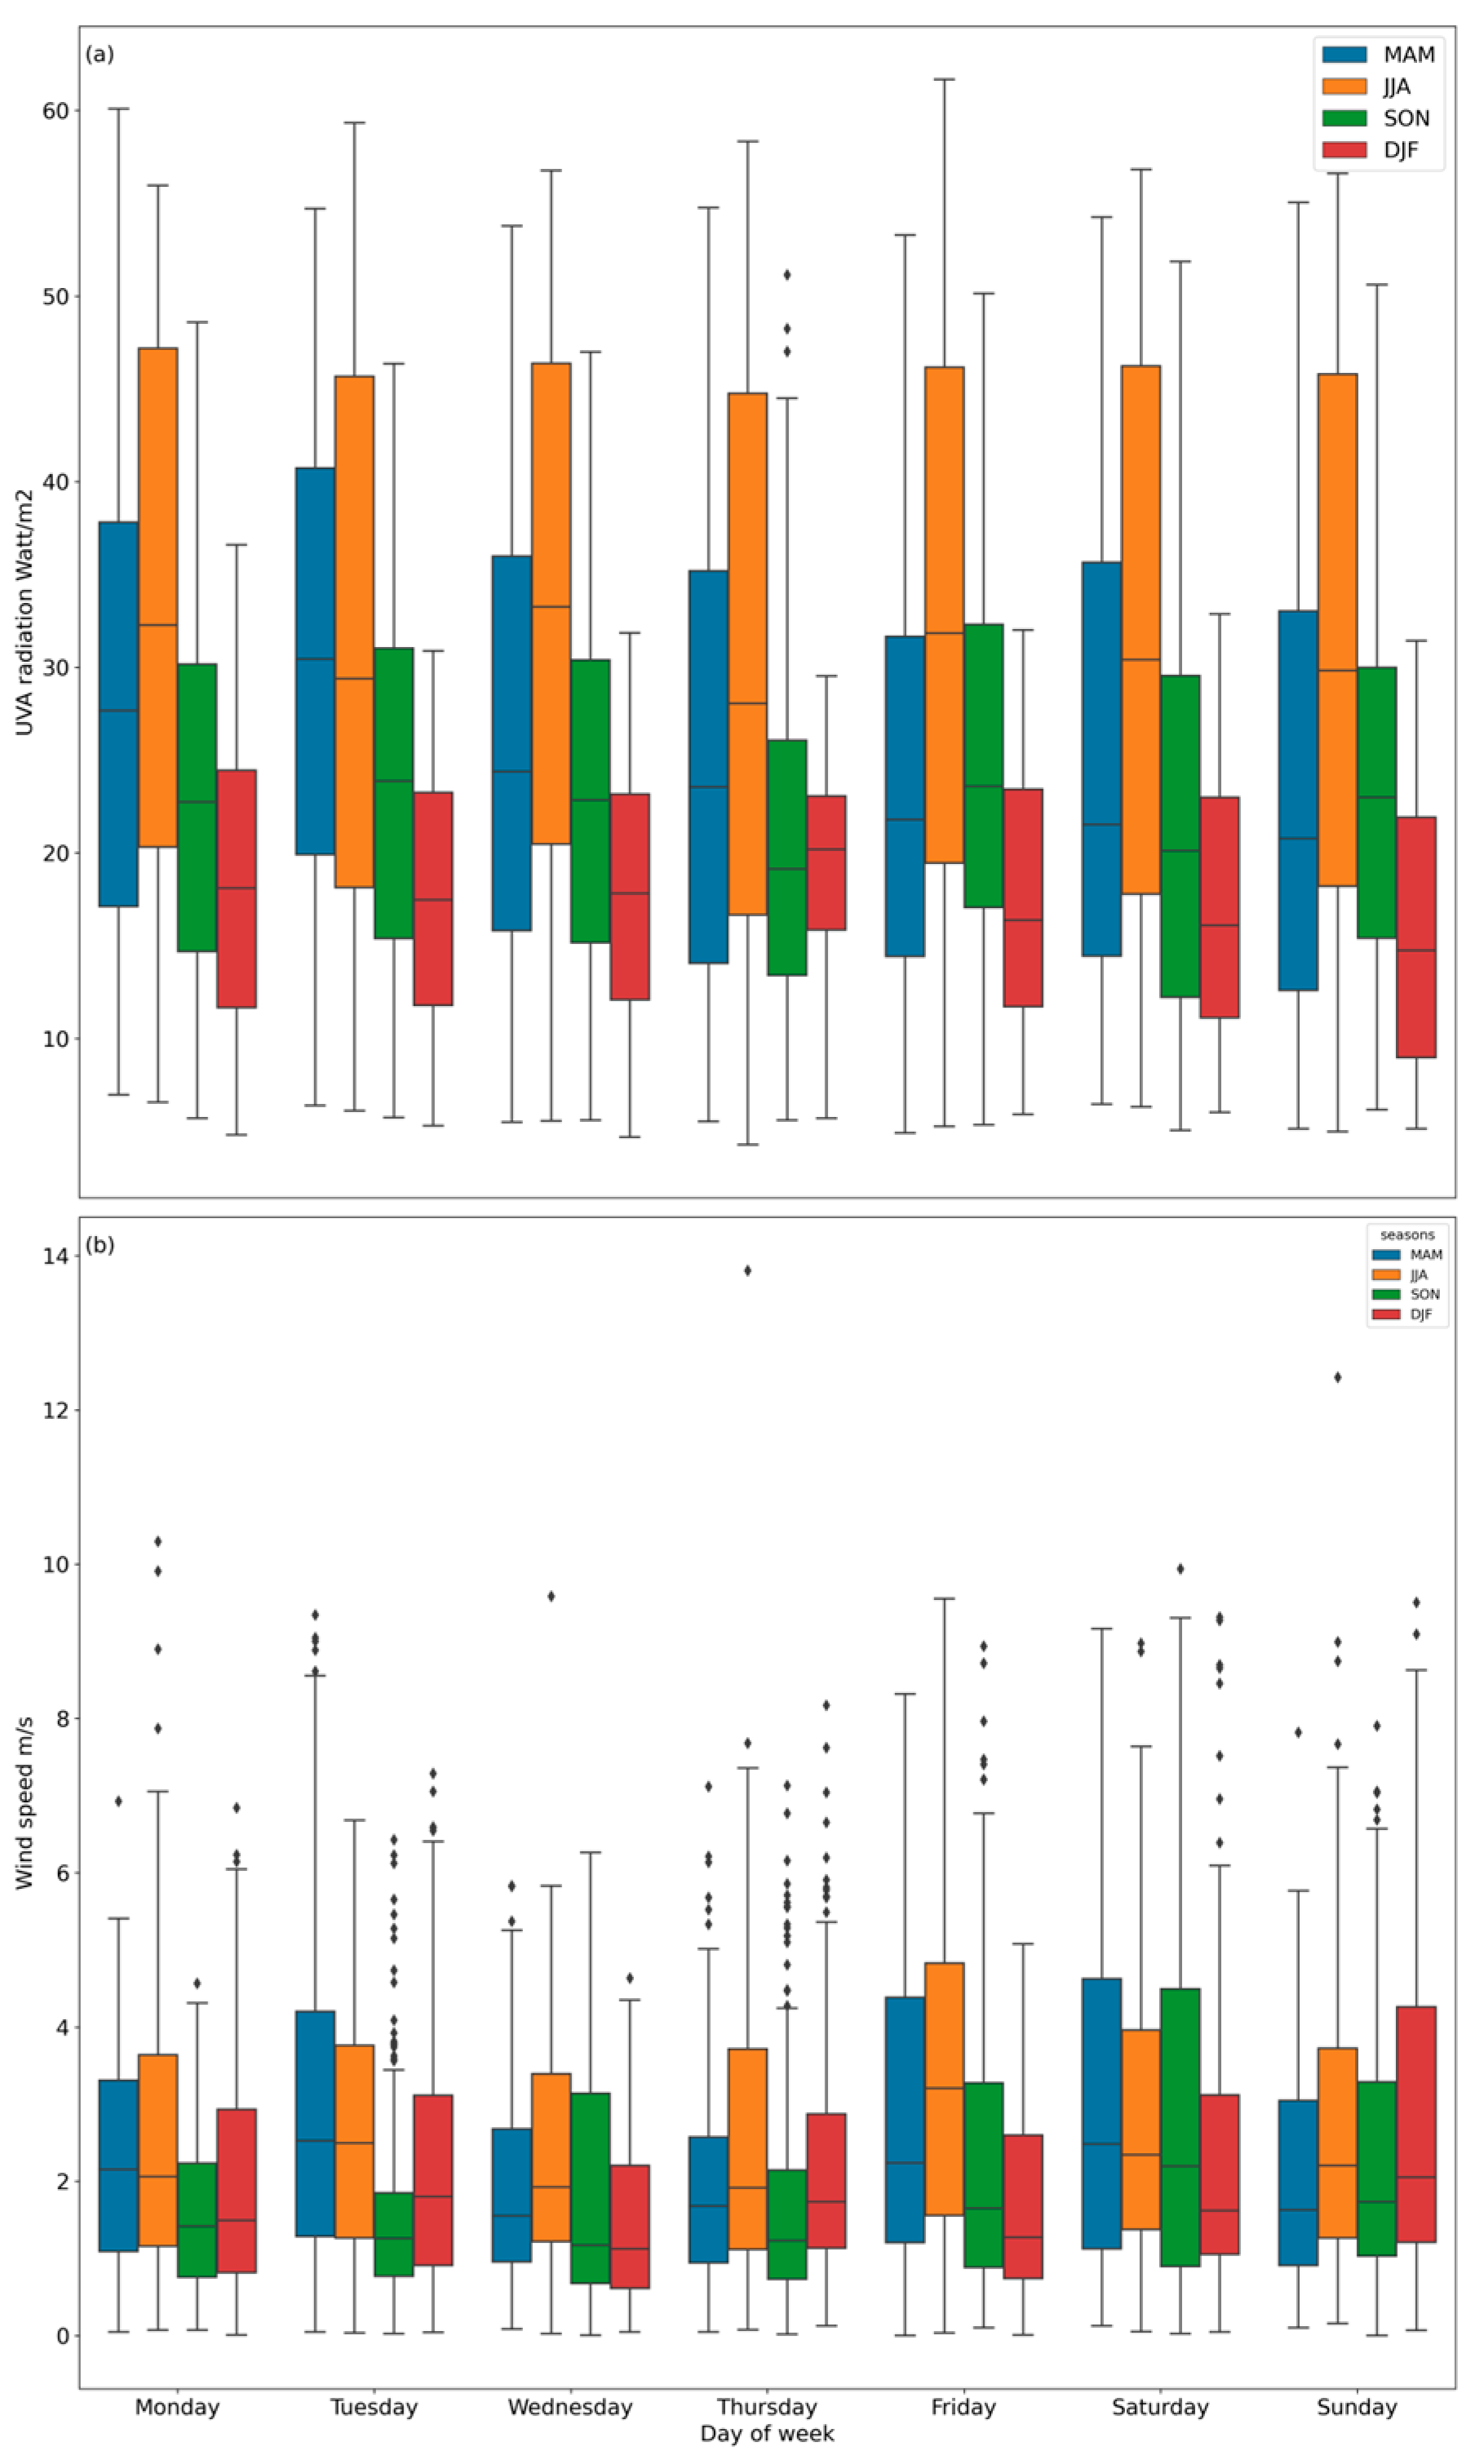
The winter and spring weekly patterns showed a particular trend during the weekdays for punctual and integrated surface concentrations. Monday and Tuesday were remarkably similar, whereas Wednesday, Thursday, and Friday displayed higher NO2 concentrations, probably caused by a weekly routine of human activities [48,49]. Besides, the contribution of meteorological parameters, which overlaps with weekday modulation of pollutant emissions, must be accounted for. Figure 9 shows how the slight decrease of solar radiation during Wednesdays in the spring season can contribute to the accumulation of NO2. Although, it was less evident in the punctual measurements at the Liberti Observatory. On the other hand, the high wind speed on Mondays and Tuesdays in the winter season could lead to horizontal dispersion with a more homogeneous spatial distribution producing a dilution of the NO2 concentration.

3.2. Tropospheric NO2

3.2.1. P138 and TROPOMI Products at the Liberti Observatory

Figure 10a shows concurrent (30 min) VCD products available from the TROPOMI and Pandora P138 datasets (N = 274). Slight discrepancies between both products could be addressed to different area coverage. Indeed, the P138 product was based on the sky measurement throughout the fixed azimuth and, therefore, the ground-based product may have not been suitable to represent the tropospheric VCD for the whole TROPOMI pixel area, as explained in [50,51].
The expected underestimation of the TROPOMI product [52] could be further addressed to the systematic errors recognized in the TROPOMI inversion. The main systematic errors included the cloud-fraction not completely removed from the parameter of quality assurance (qa > 0.75) and the surface albedo. The latter was represented by a monthly climatological value with a coarser spatial resolution (0.5 × 0.5°) compared to the TROPOMI. Lastly, the possibly most relevant issue came from the a priori NO2 profile shape used as the auxiliary product for the nitrogen dioxide densities retrievals. A rural area with local and non-local emission sources, such as the one under investigation, was characterized by a non-negligible spatial tropospheric VCD gradient. Consequently, it may not be well-represented by the spatial resolution of the profile provided by the TM5-MP chemistry-transport model, which was about 100 × 100 km2.
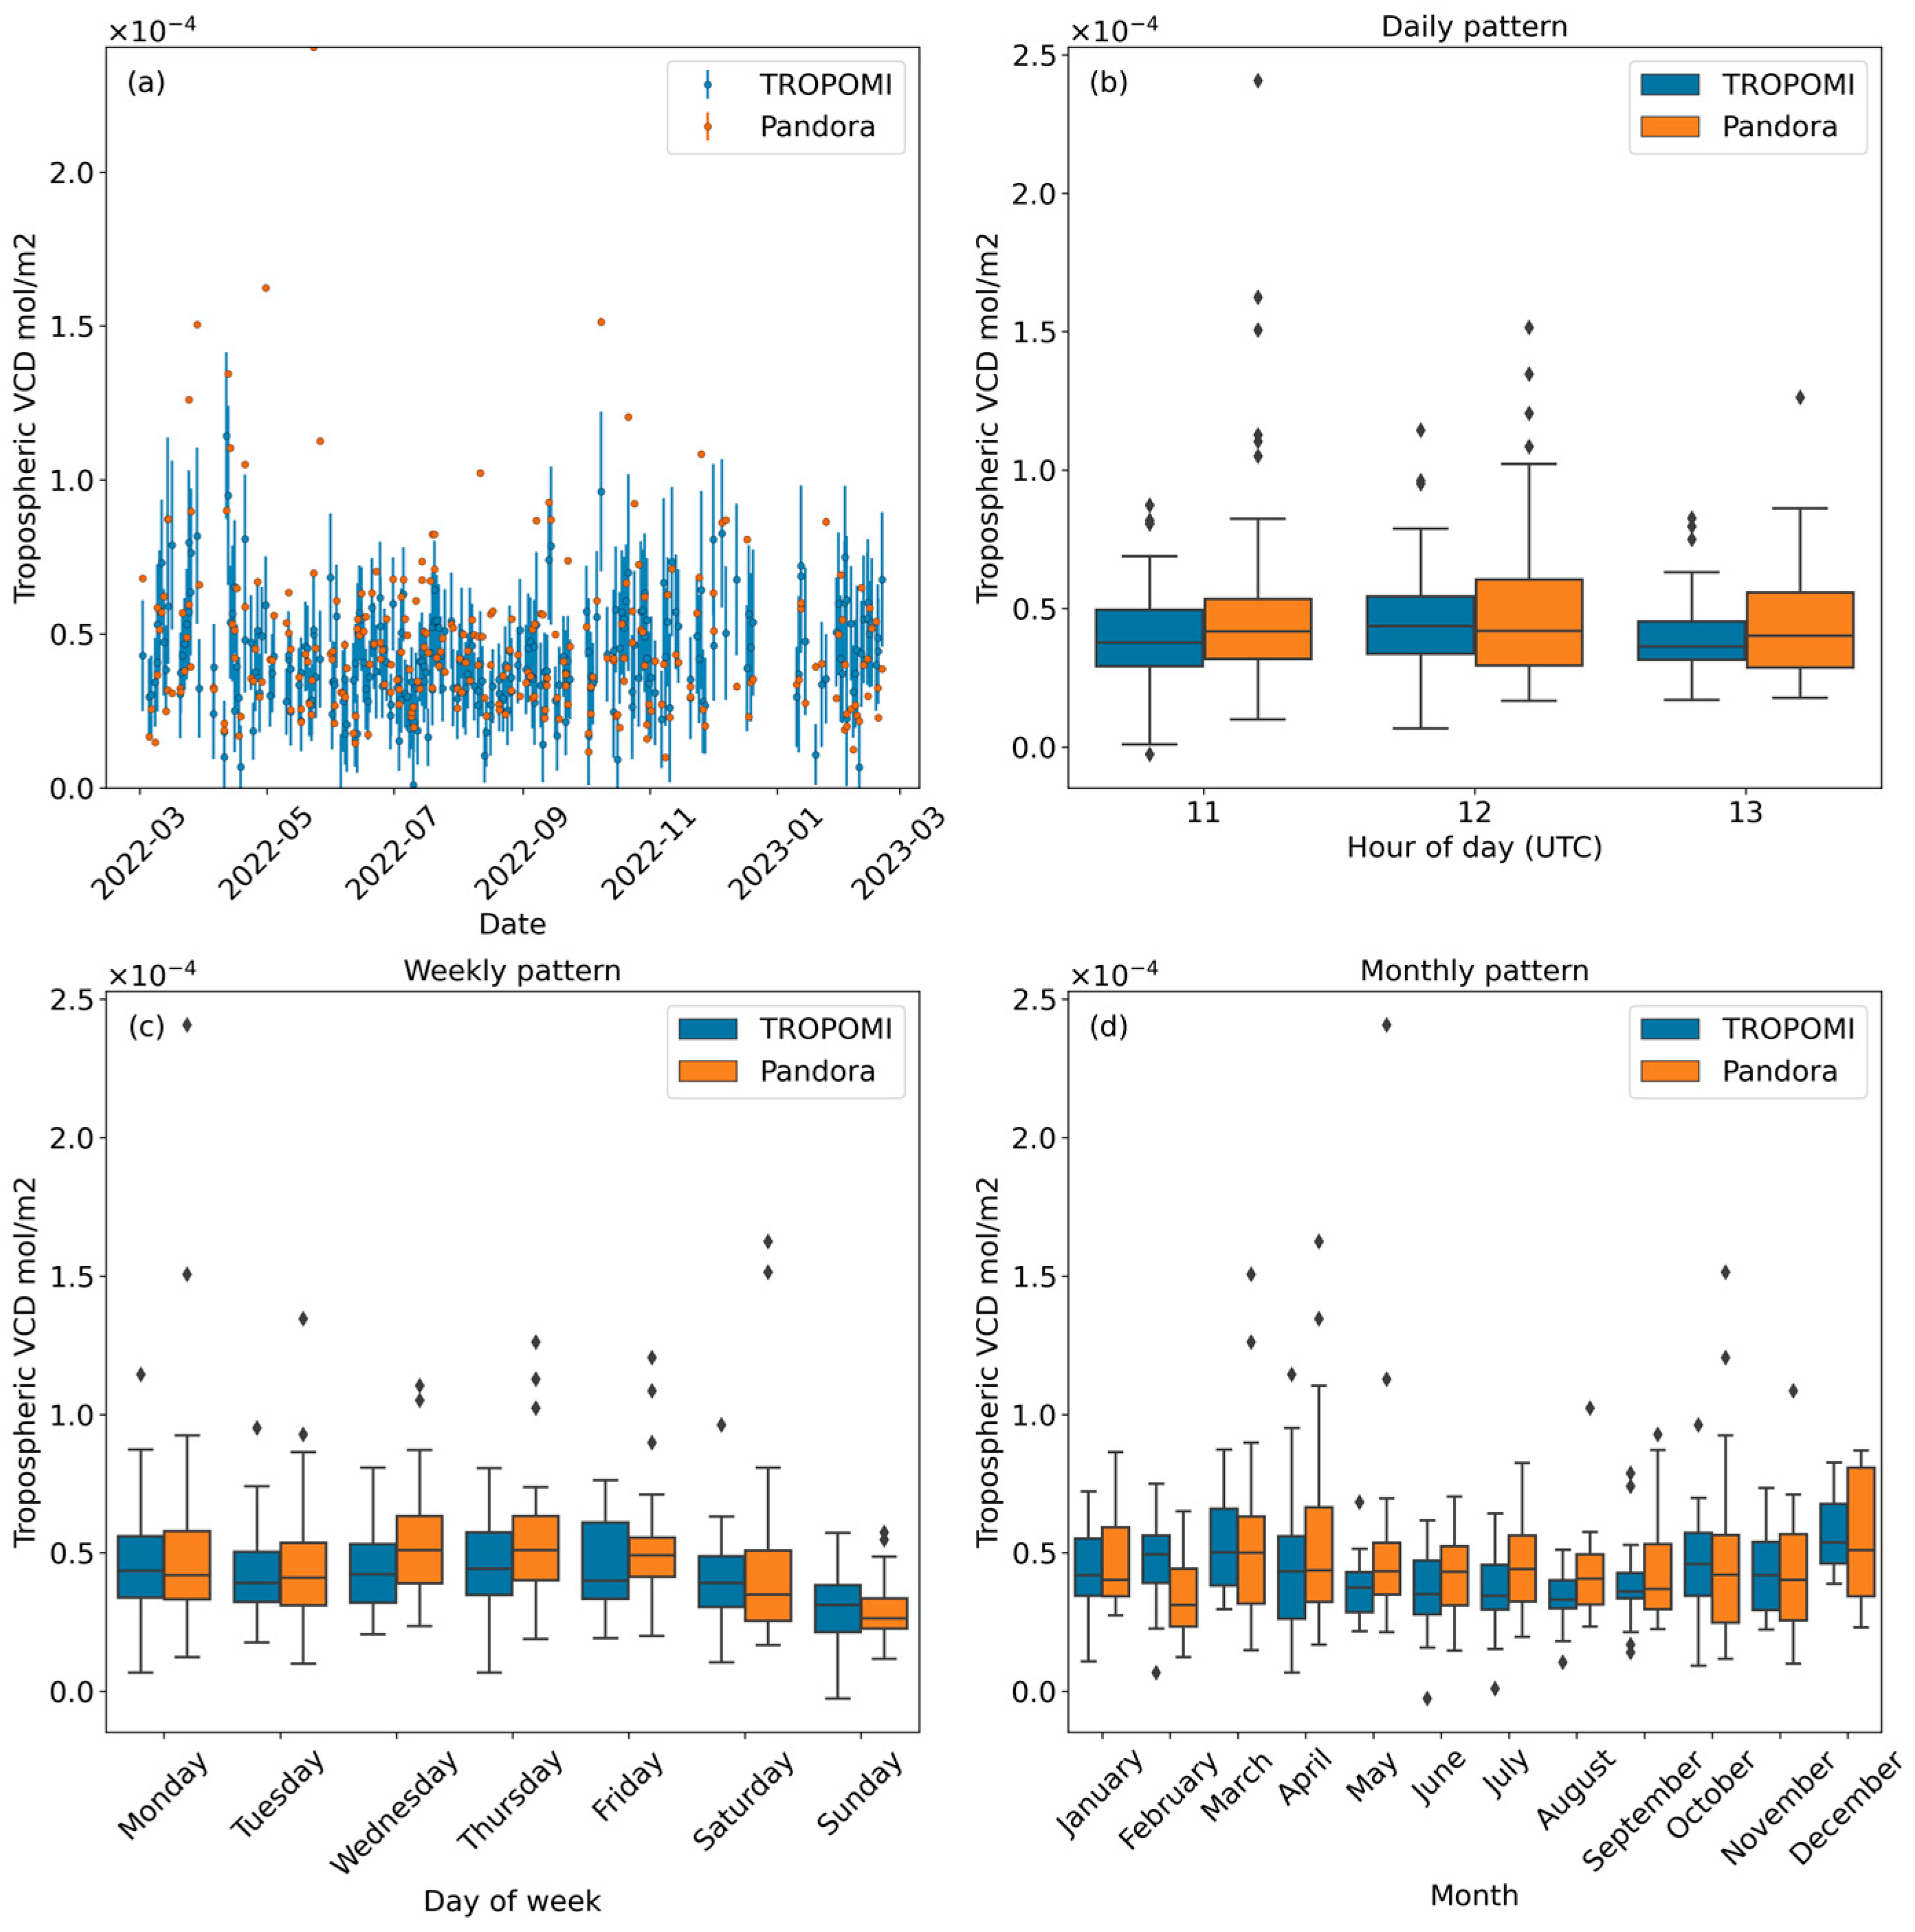
The daily pattern was limited to the TROPOMI overpass time, which varied between 11:00 and 13:00 UTC (Figure 10b). This limited temporal resolution would be overcome with the new missions (Sentinel 4, [53] https://sentinels.copernicus.eu/web/sentinel/missions/sentinel-4, accessed on 9 May 2023) where an hourly acquisition was expected.
Weekly patterns (Figure 10c) behaved as the expected cycle with an increasing trend during the weekdays and a reduction during the weekends. Furthermore, the vertical density also showed a peak in the central days of the week (Wednesday and Thursday), as retrieved from the surface concentration analysis. Figure 10d showed the monthly pattern characterized by the reduction during the summertime (JJA), with respect to the winter months (DJF).
The effects of the agricultural activities were also easily visible on the tropospheric VCD provided by both datasets, showing peaks during the spring season (March and April). The results obtained from independent remote sensing techniques confirmed the findings of surface concentration and extended to the vertical density the specific temporal behavior of NO2 in this area. Furthermore, the retrievals were consistent with the results obtained in [54], where the same NO2 temporal trends were retrieved from remote sensing and in situ measurements in rural areas.

3.2.2. Tropospheric NO2 in the Tiber Valley

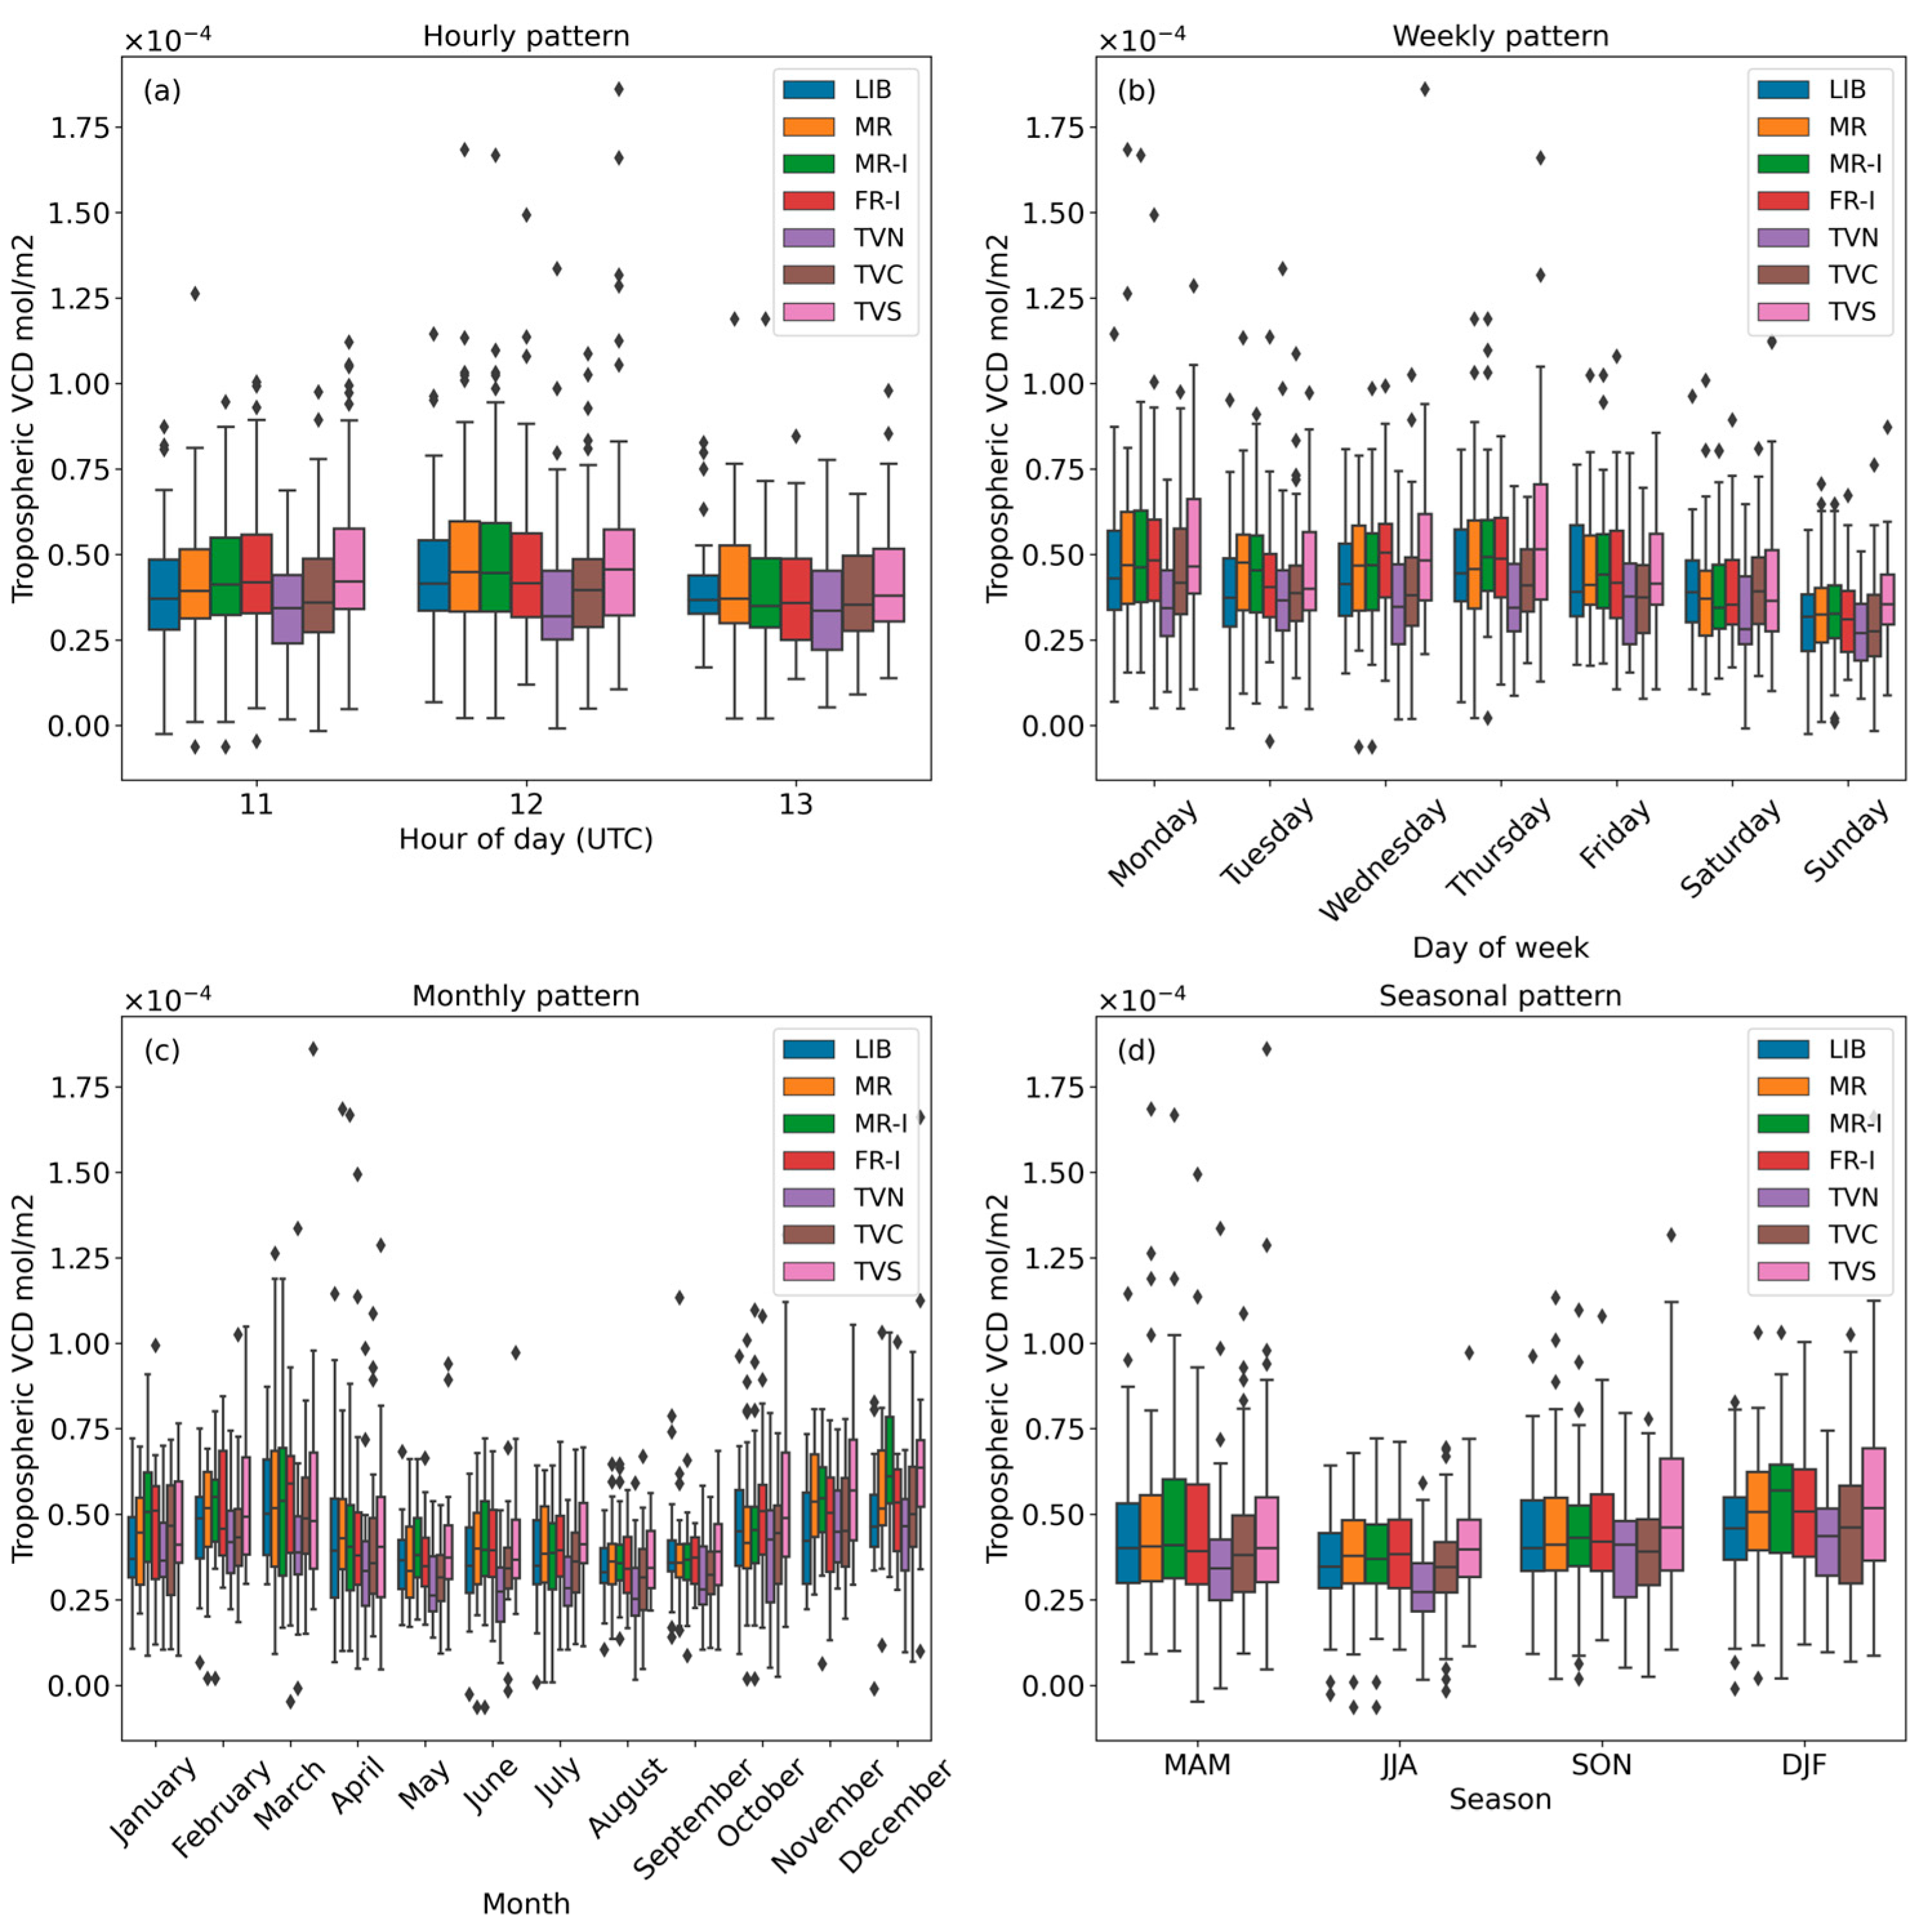
Figure 11 shows the hourly, weekly, and seasonal box plot of the seven sites identified in rural, urbanized, and industrial environments. The hourly pattern (Figure 11a) was limited to the Sentinel 5P overpasses that corresponded to a low NO2 daily level. The tropospheric VCD at TBC and TBN sites showed an extremely low impact of the pollution in the Northern part of the Valley where the weekly cycle seemed to almost disappear within both the sites (Figure 11b). The third agricultural site (TBS) confirmed the results obtained from the integrated surface concentration provided by the P138 measuring toward the emission sources located at the East and Southeast of the study area. Regarding the principal local emission sources ascribed to the selected urban and industrial sites, the tropospheric NO2 VCD showed a high variability during the central days of the week, even if the weekly cycle was still evident. The monthly pattern (Figure 11c) showed a decrease of the VCD values from January to August with a high variability, especially in the winter and for the sites located in the southern part of the study area. This confirmed that the South of Tiber Valley was exposed to moderate air pollution during the autumn and winter months.
The tropospheric VCD in the southernmost moderately polluted site (TBC) was well detectable and distinguished from the near local emission source (FR-I) for high spatial resolution, as introduced with TROPOMI. Indeed, the agricultural and industrial sites were only 7 km apart. The high spatial resolution was completely exploited to characterize the spatial variability at a local scale. This had not yet been investigated in most works on air pollution dealing with TROPOMI products, as reported in [11].
The seasonal patterns (Figure 11d) revealed a temporal trend like the ones of the surface concentration. In particular, spring values were close to the autumn ones also for the agricultural sites far from the emission sources (TBC and TBN). The agreement between the surface concentration and tropospheric VCD obtained with independent techniques underlines the capability of this integrated system to draw detailed temporal and spatial description of pollution in the investigated area.
Since strategies for a sustainable coexistence of agricultural and non-agricultural activities need high-resolution and local-scale maps, TROPOMI products meet these requirements revealing fine details and detecting the local emission sources (MR, MR-I, FR-I).
Figure 12 shows the weekly maps of the spatial distribution of the VCD obtained by TROPOMI. The maps agree with the surface concentration discussed above. The emission-reduction during the weekend was clearly reported with the disappearance of the highest values of VCD (hot-spot) due to the urban site of Rome. Furthermore, VCD seemed to increase during the weekday reaching high values in the Northern part of the Tiber Valley in the central days of the week. Reference [12] ascribed the increase in the weekdays, for some studied cities in the United States, to high standard errors. These were assumed to be reduced once more data would be available. Instead, we could attribute this behavior to the weekly trend since it was retrieved from the TROPOMI VCD, consistently with the tropospheric VCD and surface concentration of Pandora and chemiluminescence analyzer.
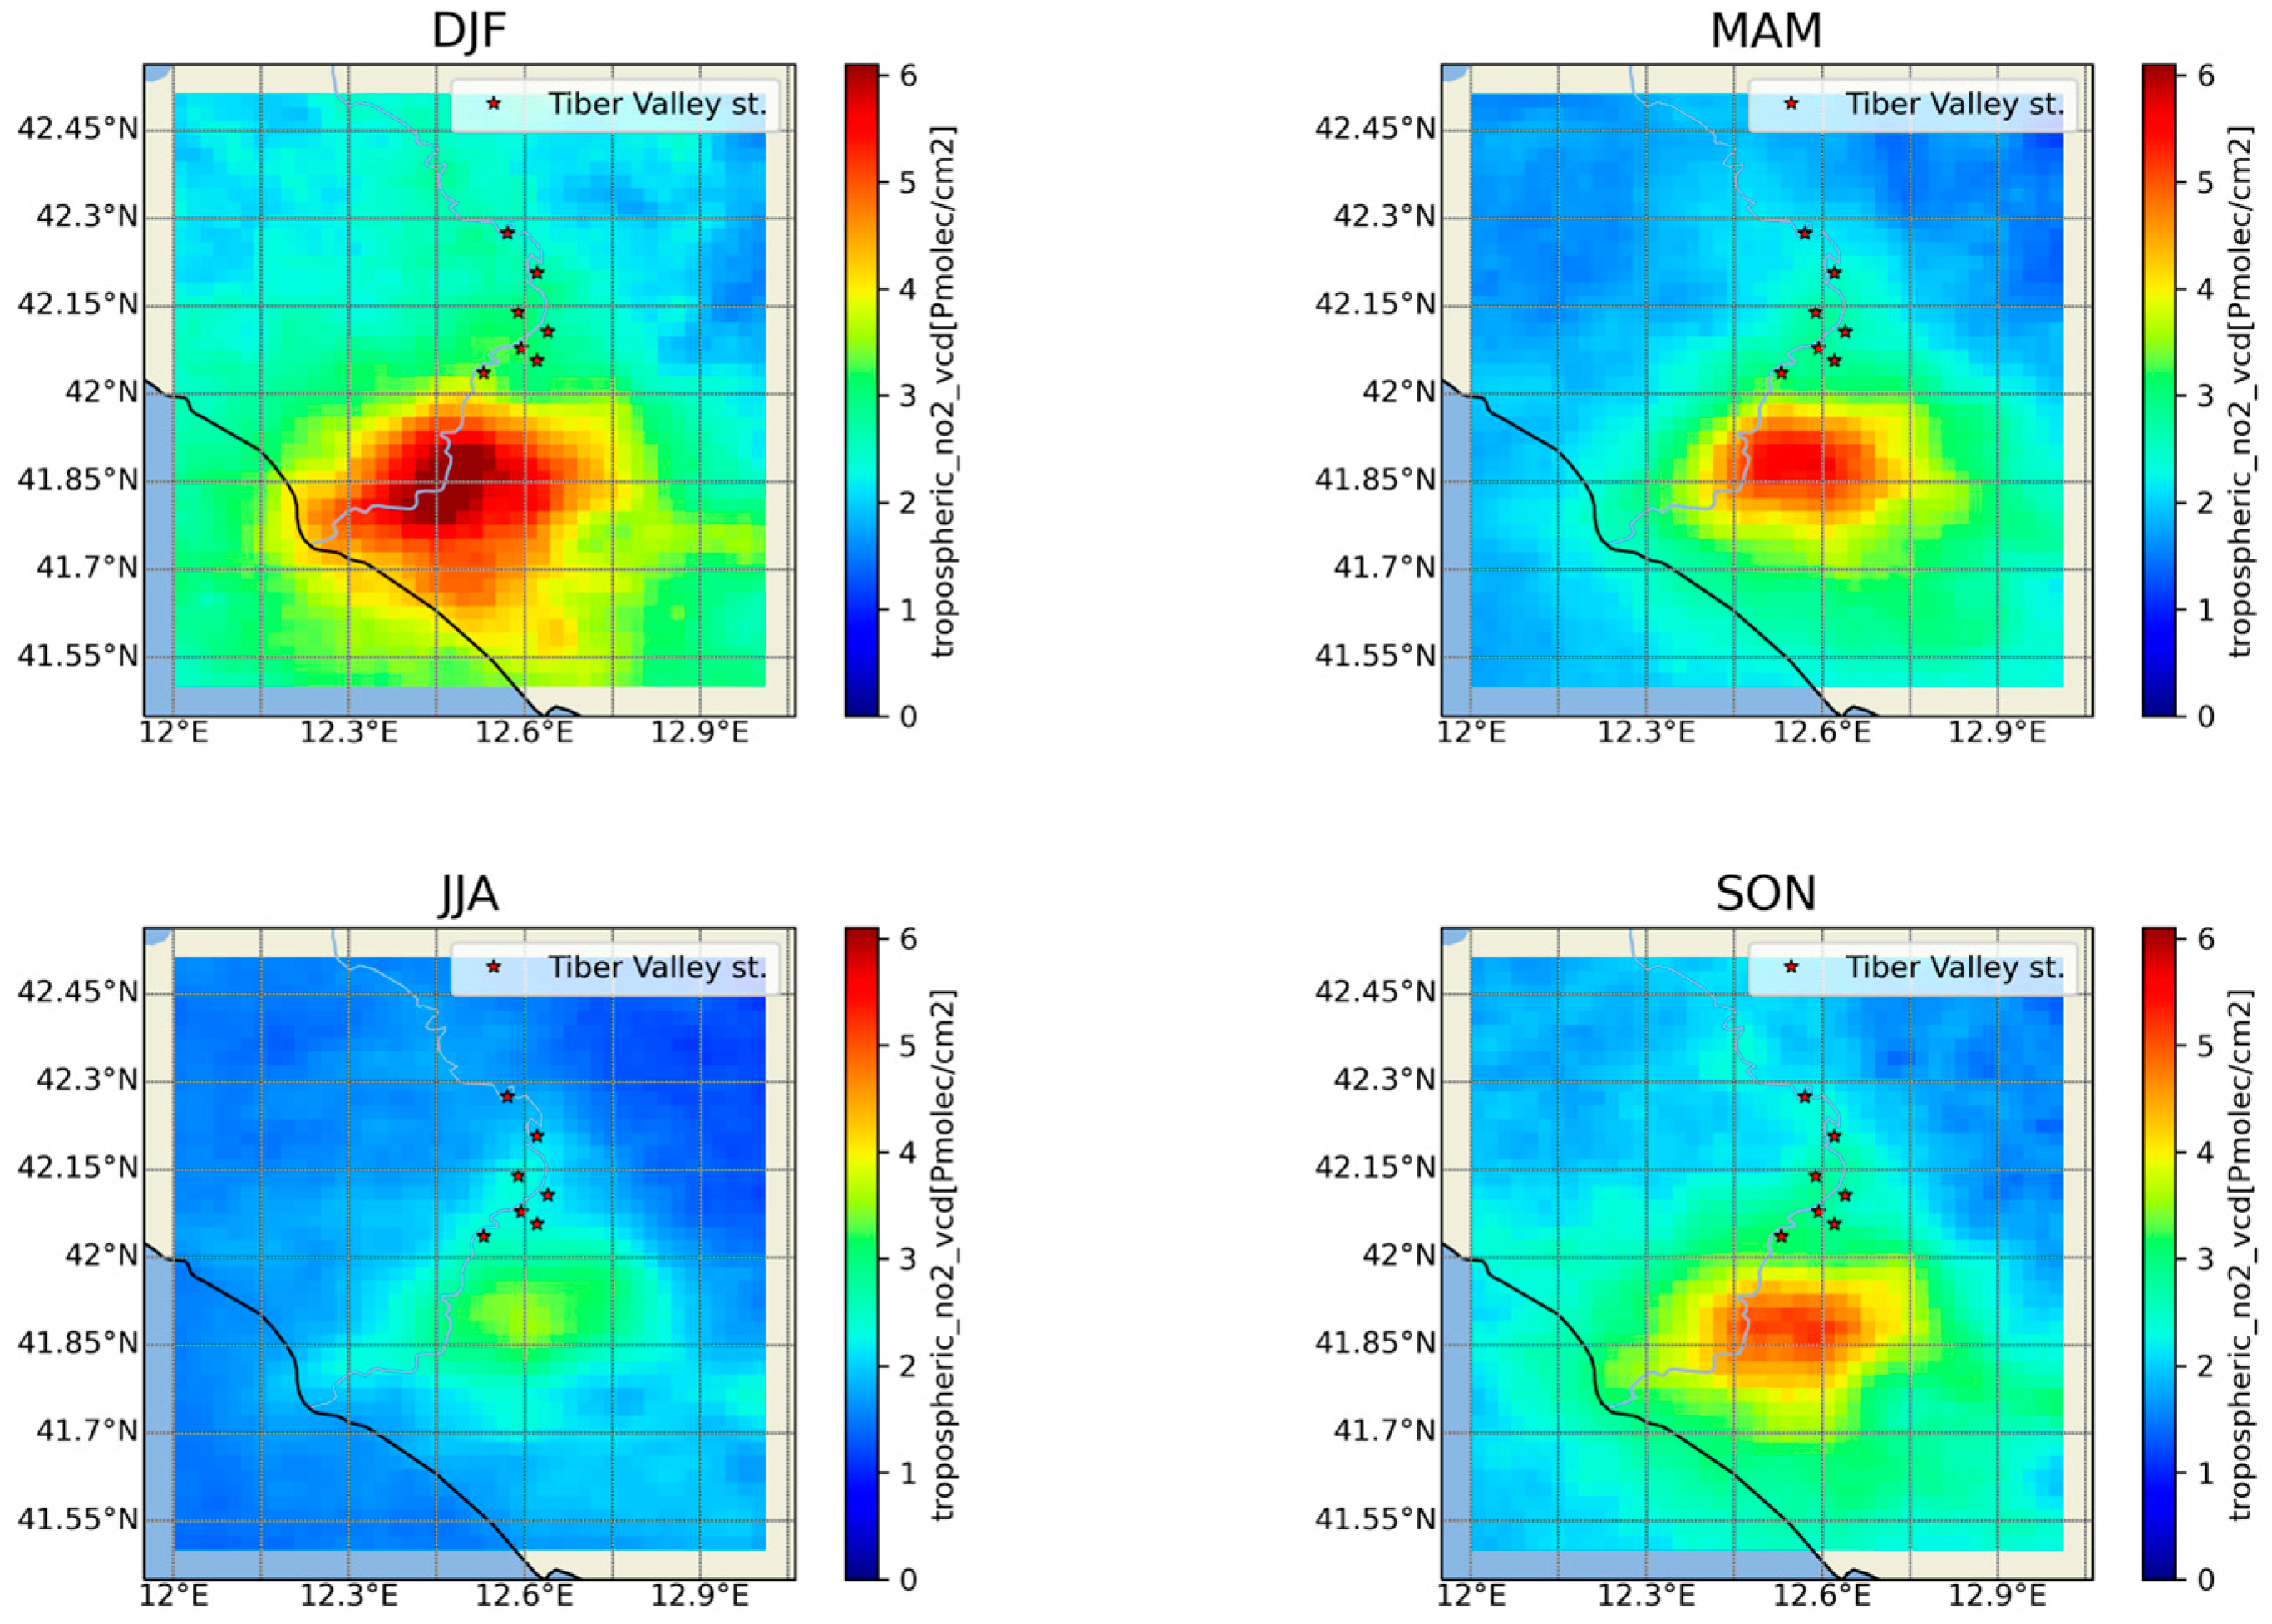
Figure 13 shows the seasonal maps of the nitrogen dioxide in the low atmosphere obtained by TROPOMI. In the winter, the values were high and spread in the entire study area. Conversely, in the spring and summer, density remained significant in the South part of the Valley, while low density in the area nearby the TVN revealed that the northernmost part was not affected by air pollution. This happened despite pollution not being completely negligible, as retrieved from the previous results. These results were consistent with the seasonal wind direction (Figure 3), in which dominant northerly winds throughout DJF and SON and a prevalence of southerly winds during MAM and JJA were found. Consequently, the Tiber Valley in the spring and summer was under the influence of anthropic emission due to local sources, agricultural activities, as well as the natural weak enhancements expected for cropland soil NOx emissions in the late spring and early summer [45,55].

3.2.3. Tropospheric NO2 during Selected Events

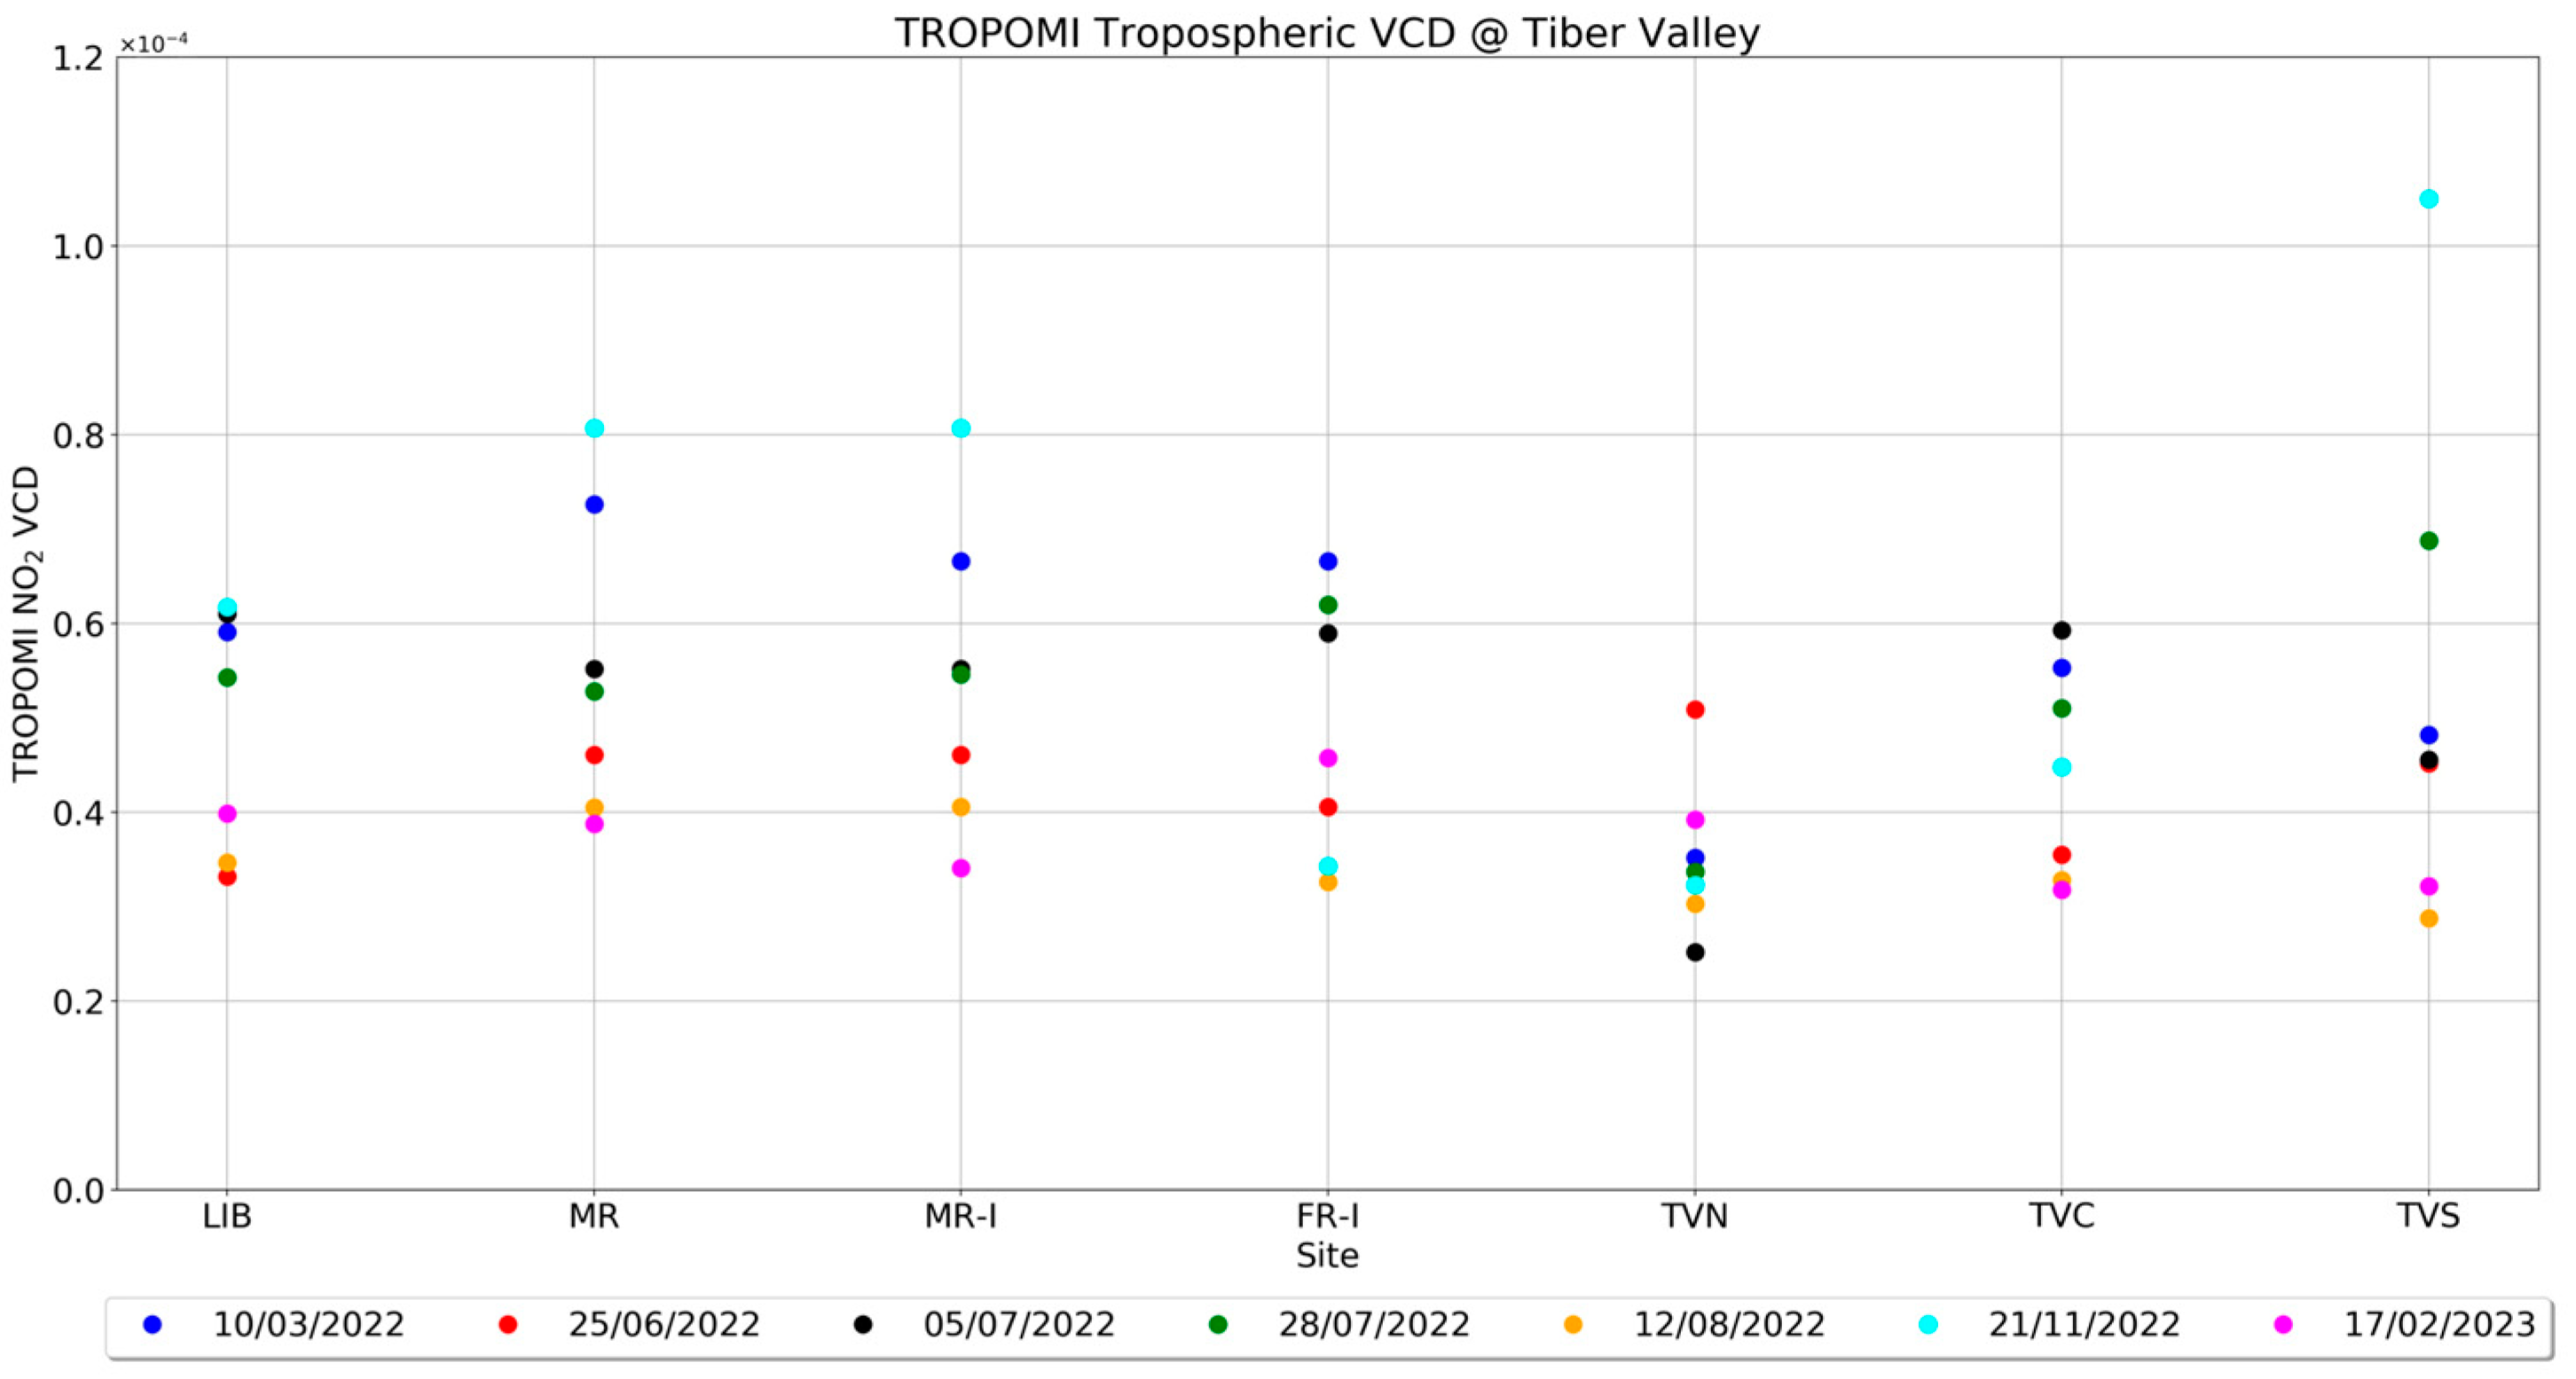
Table 3 shows the NO2 outliers measured simultaneously by the Pandora P138 and analyzer, as well as the available TROPOMI tropospheric VCD product. The Table also shows data for the wind speed and direction values measured by the meteorological station at the Liberti Observatory. Moreover, the TROPOMI tropospheric VCD during the events reported in Table 3 are shown in Figure 14.
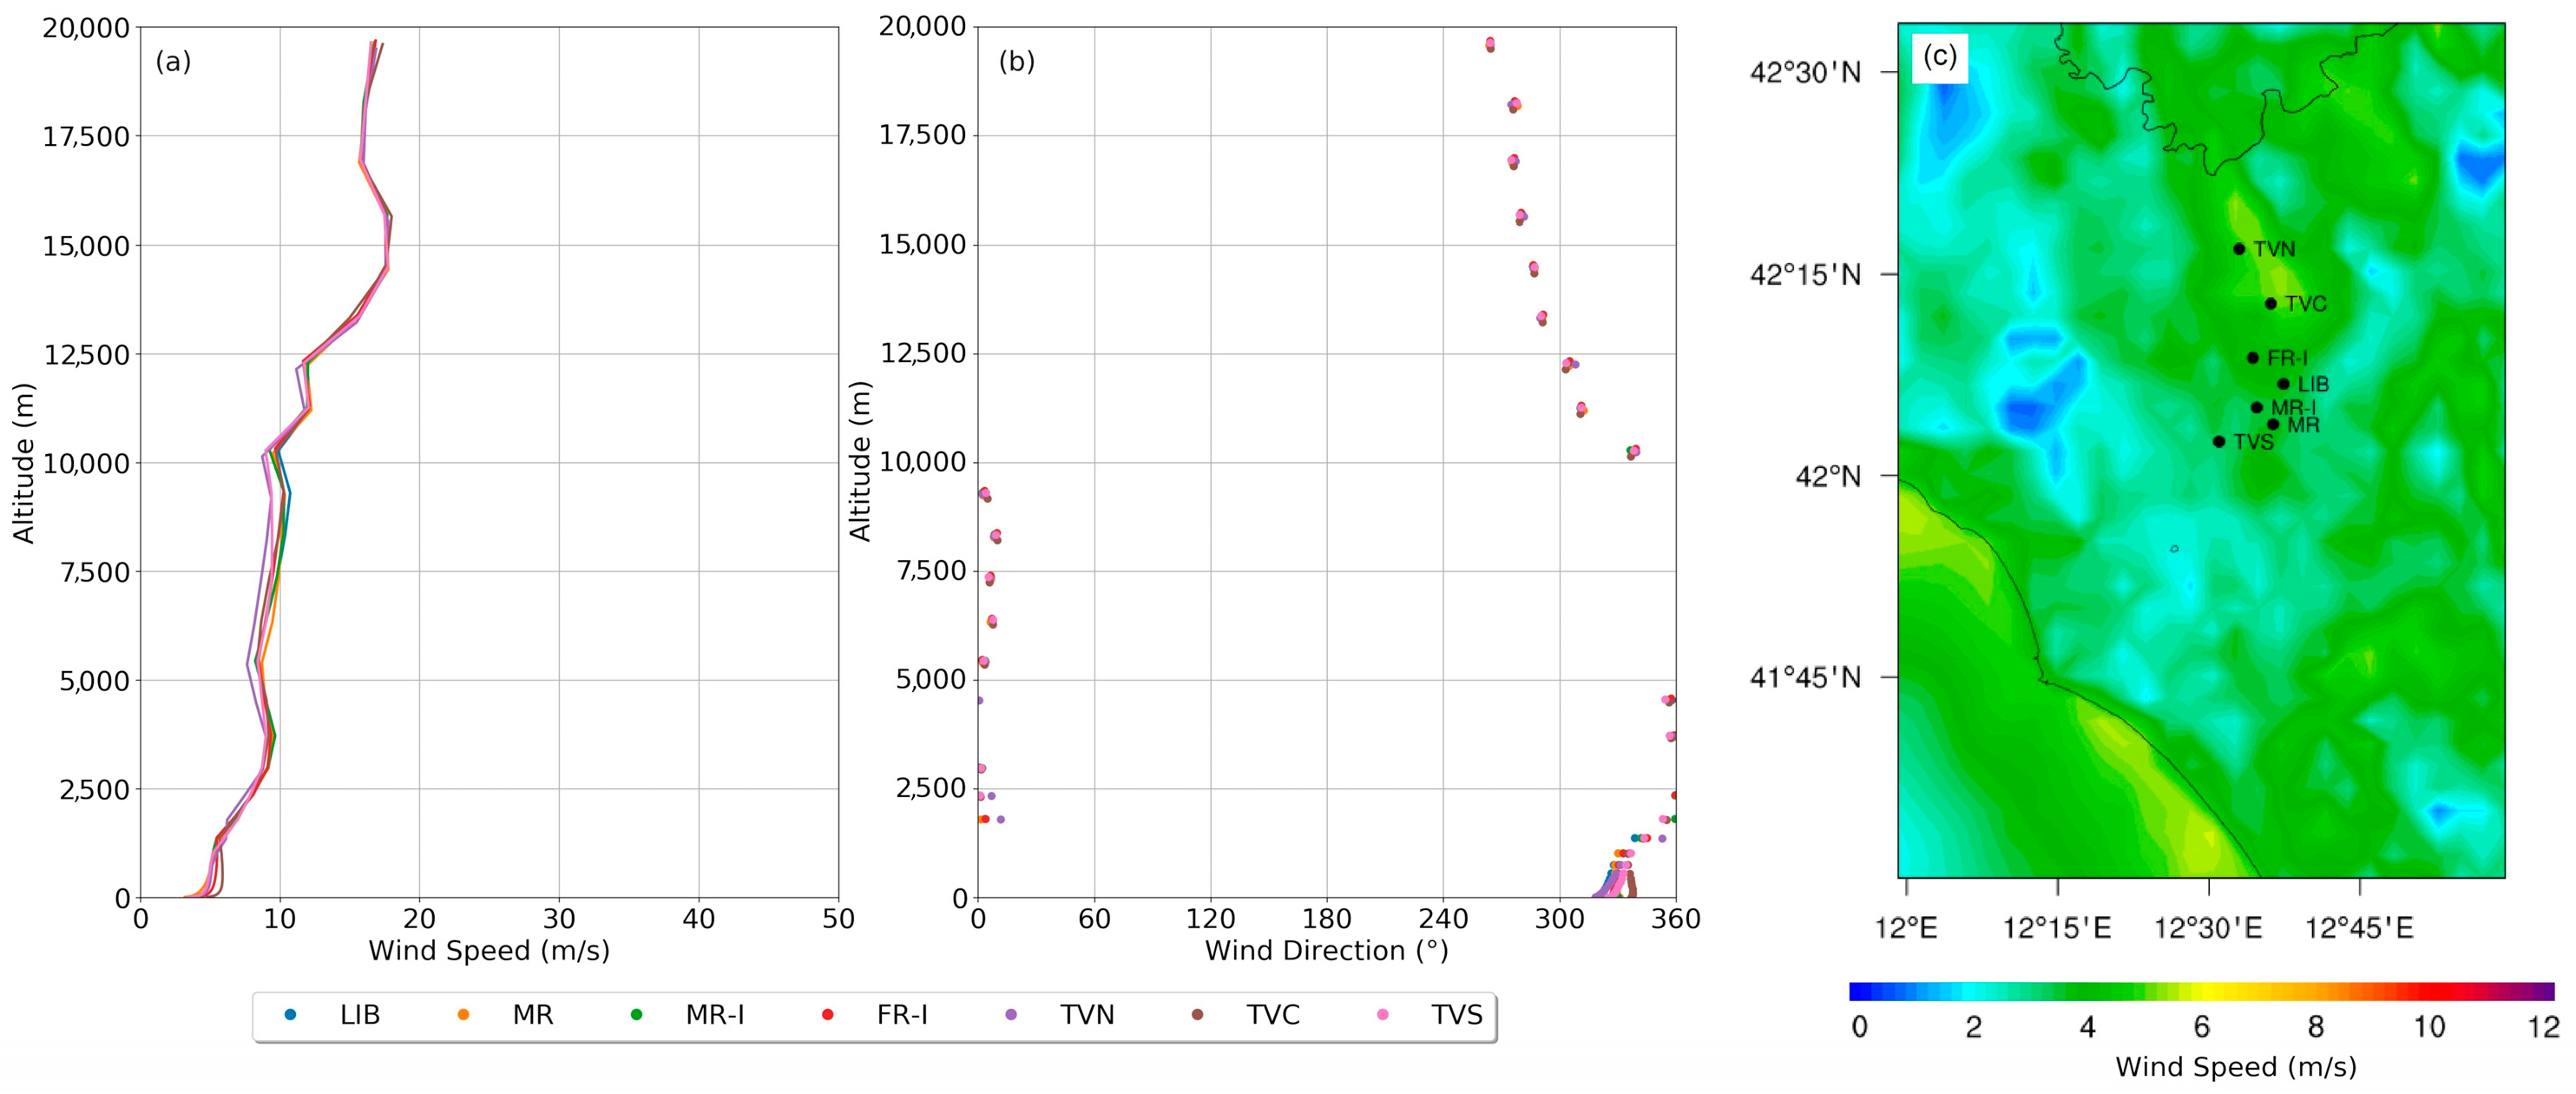
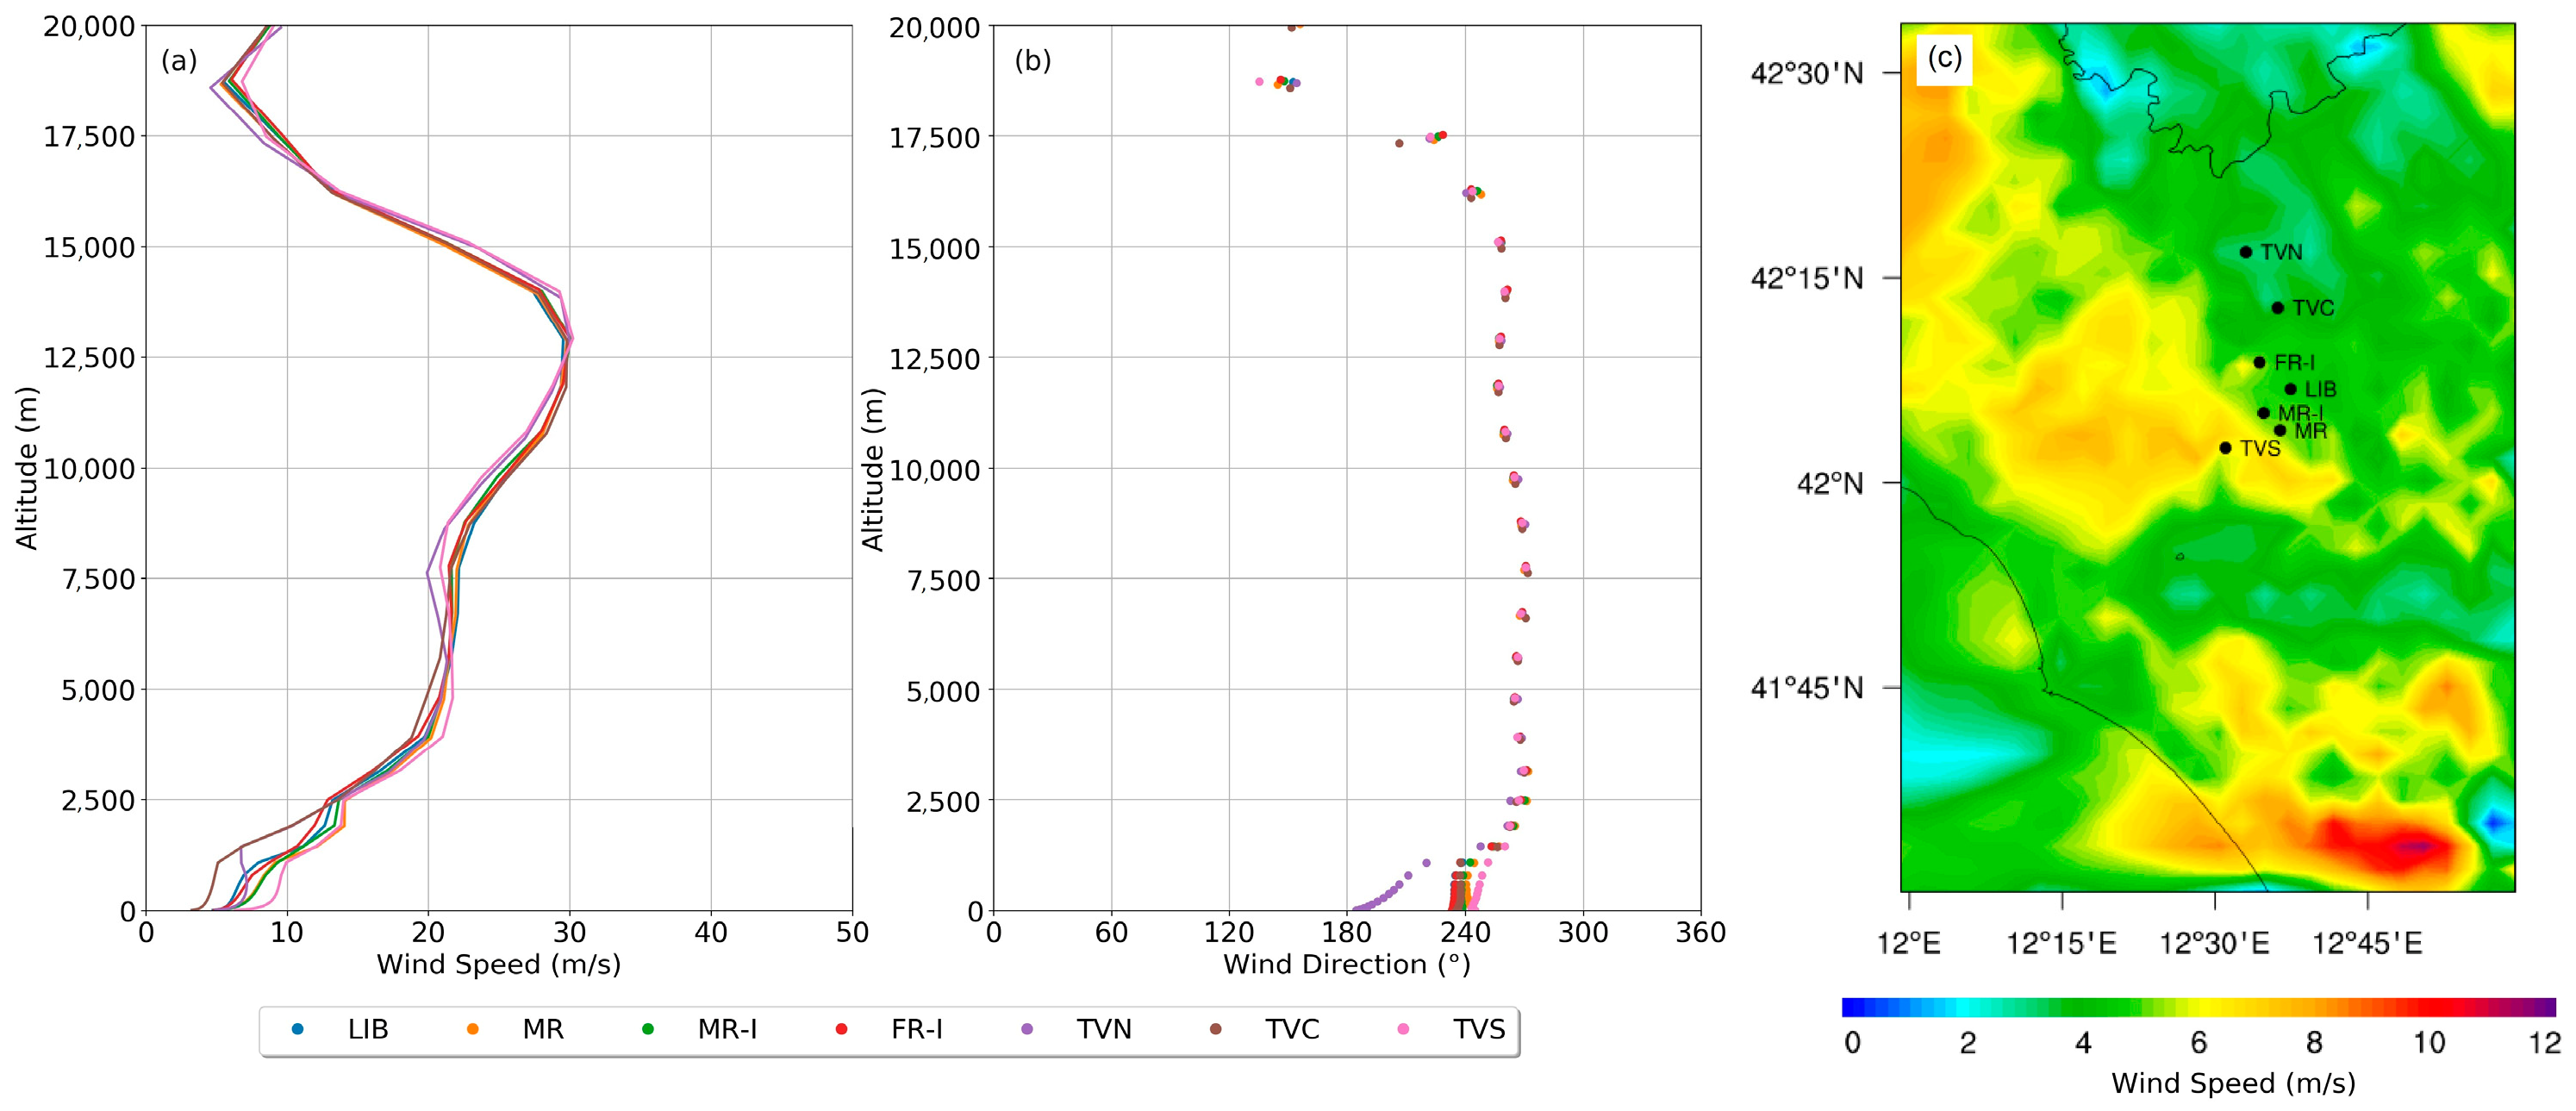
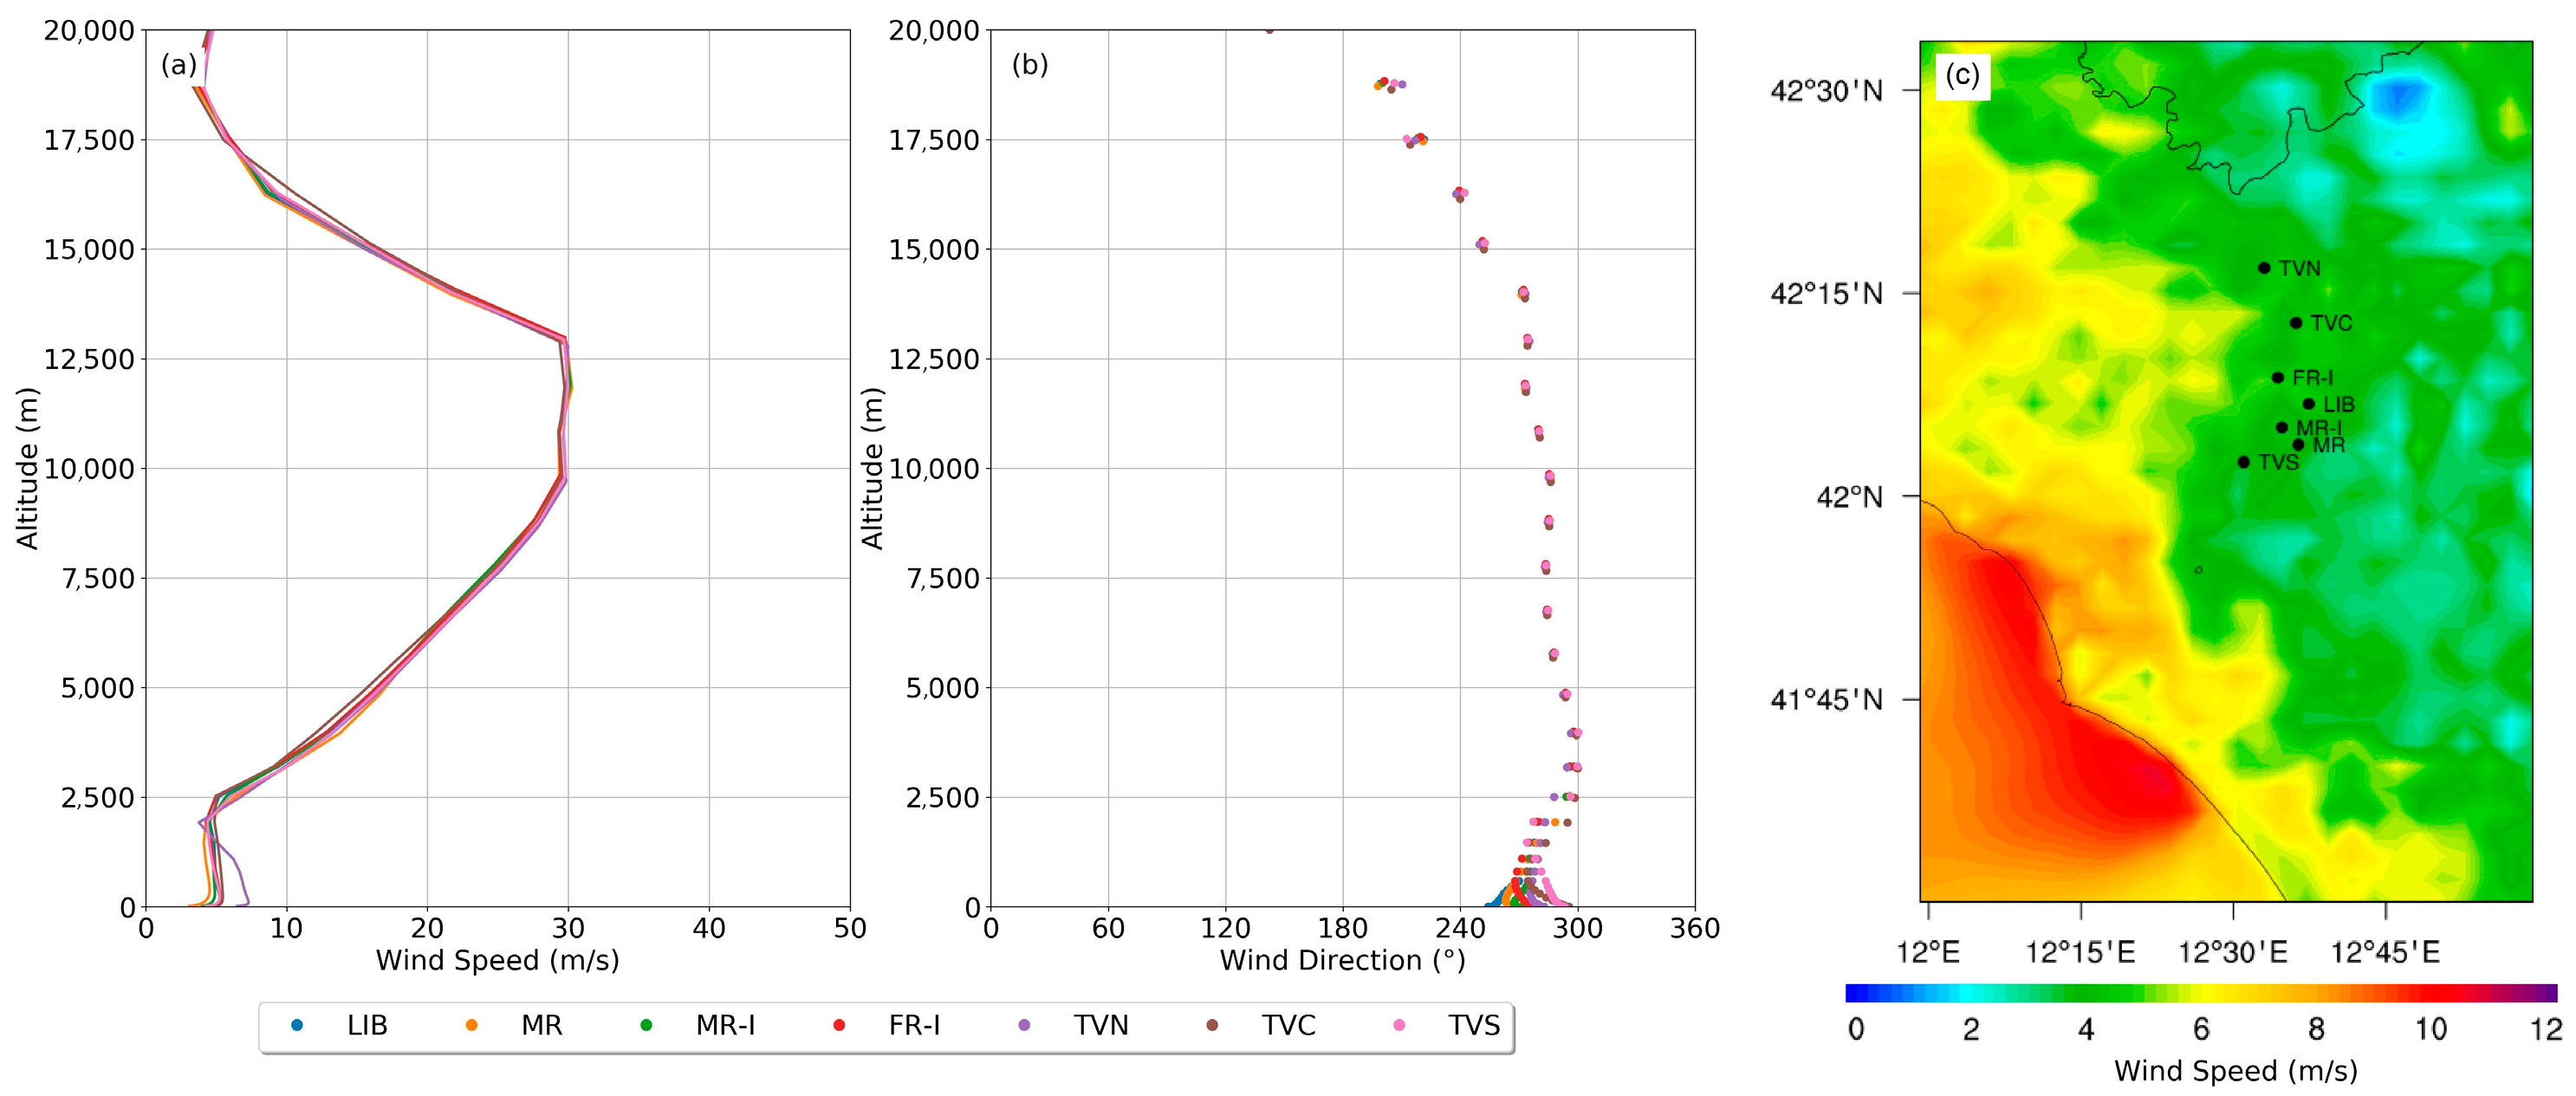
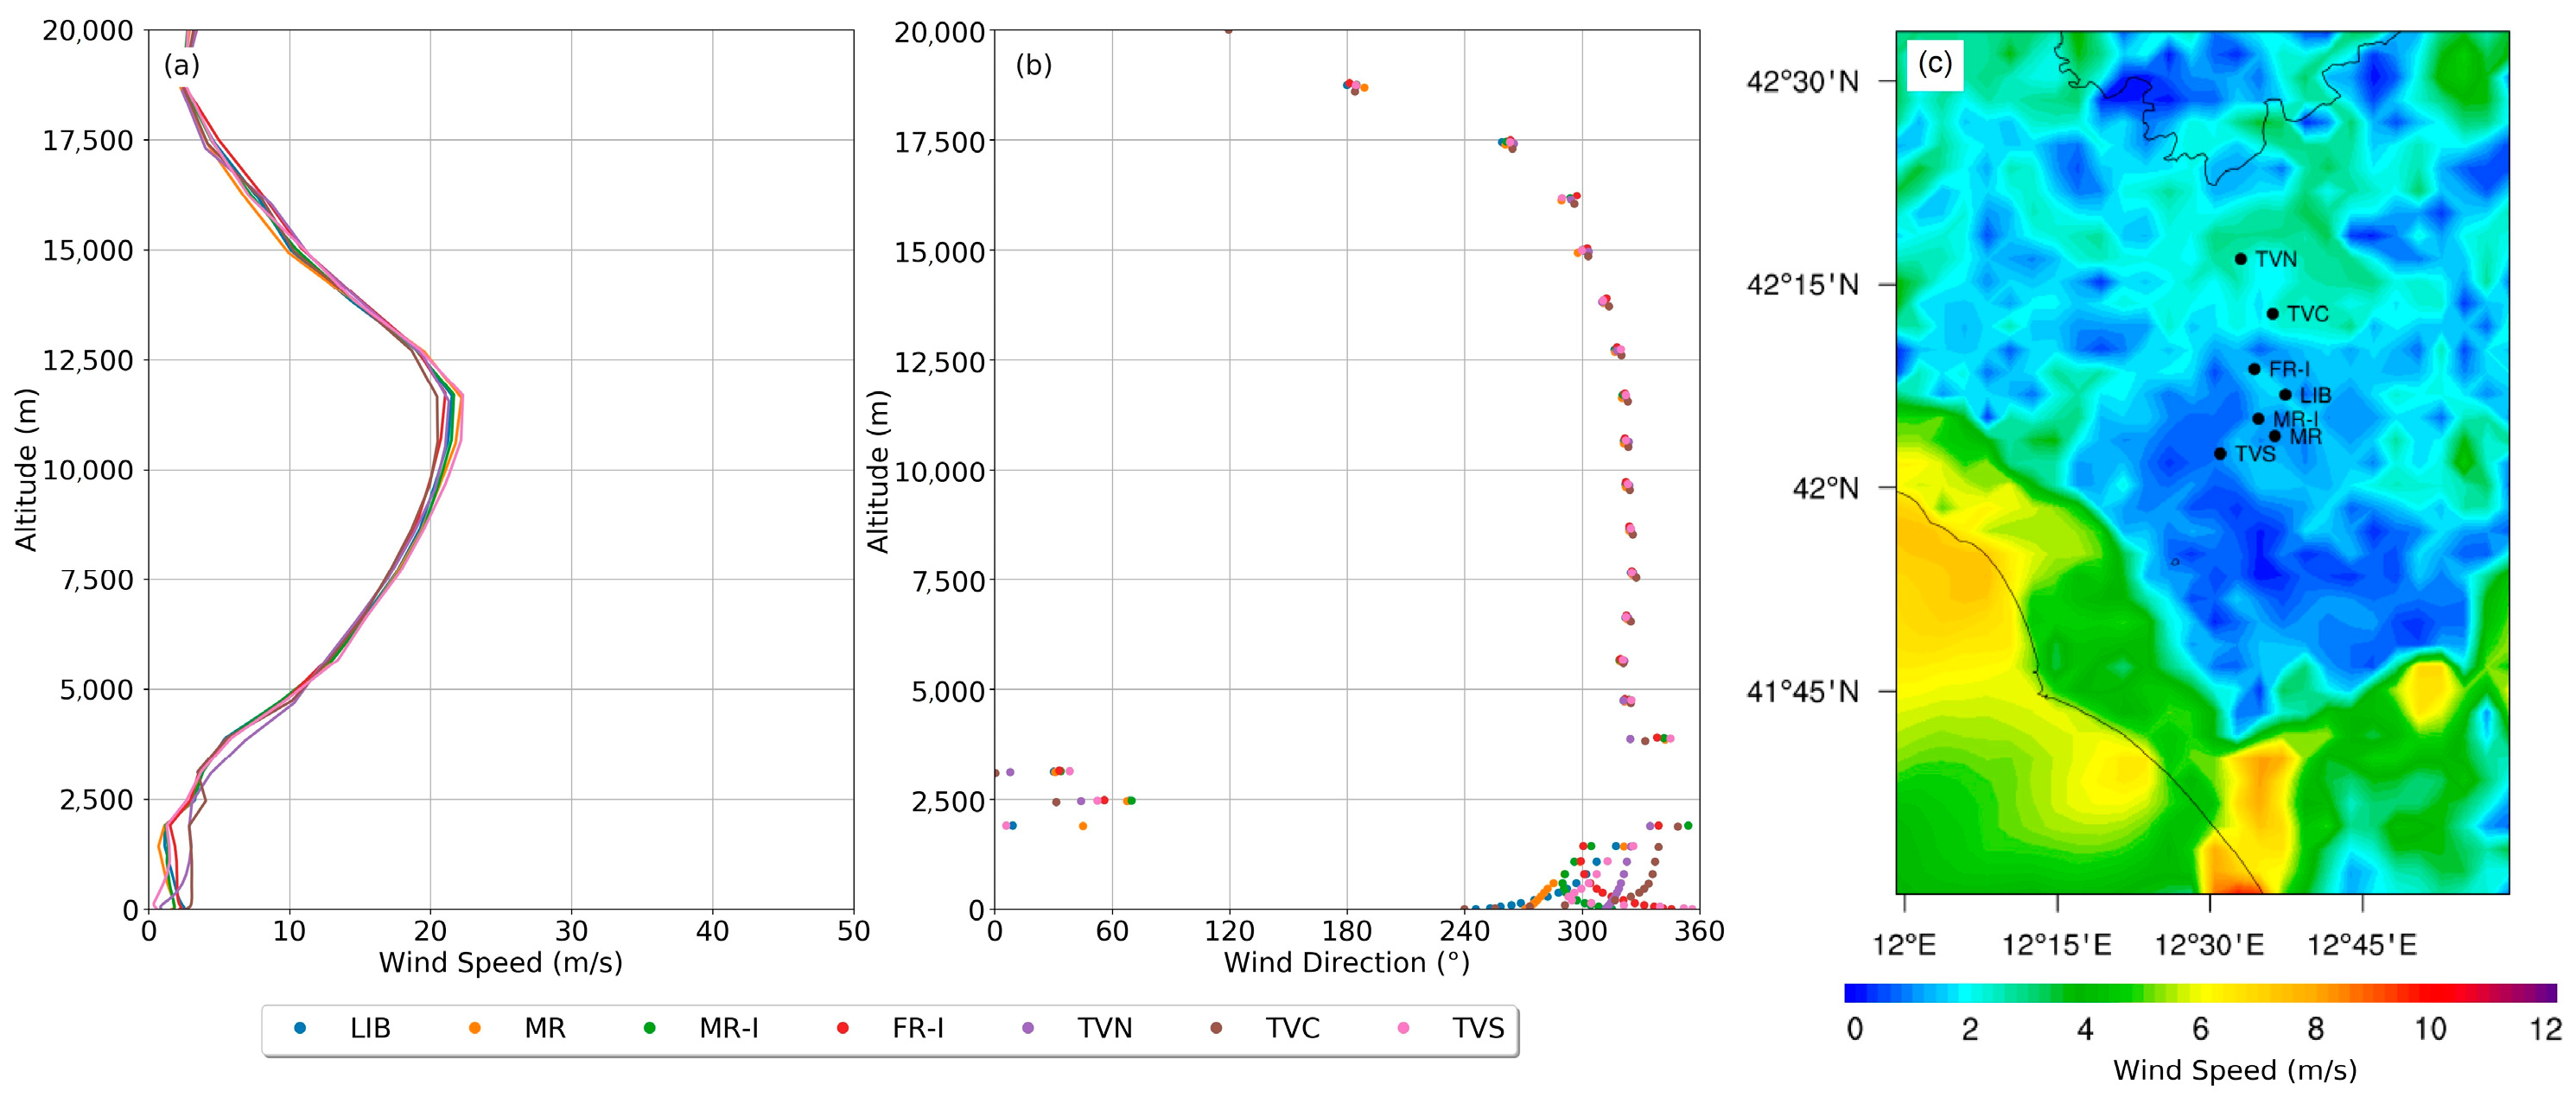
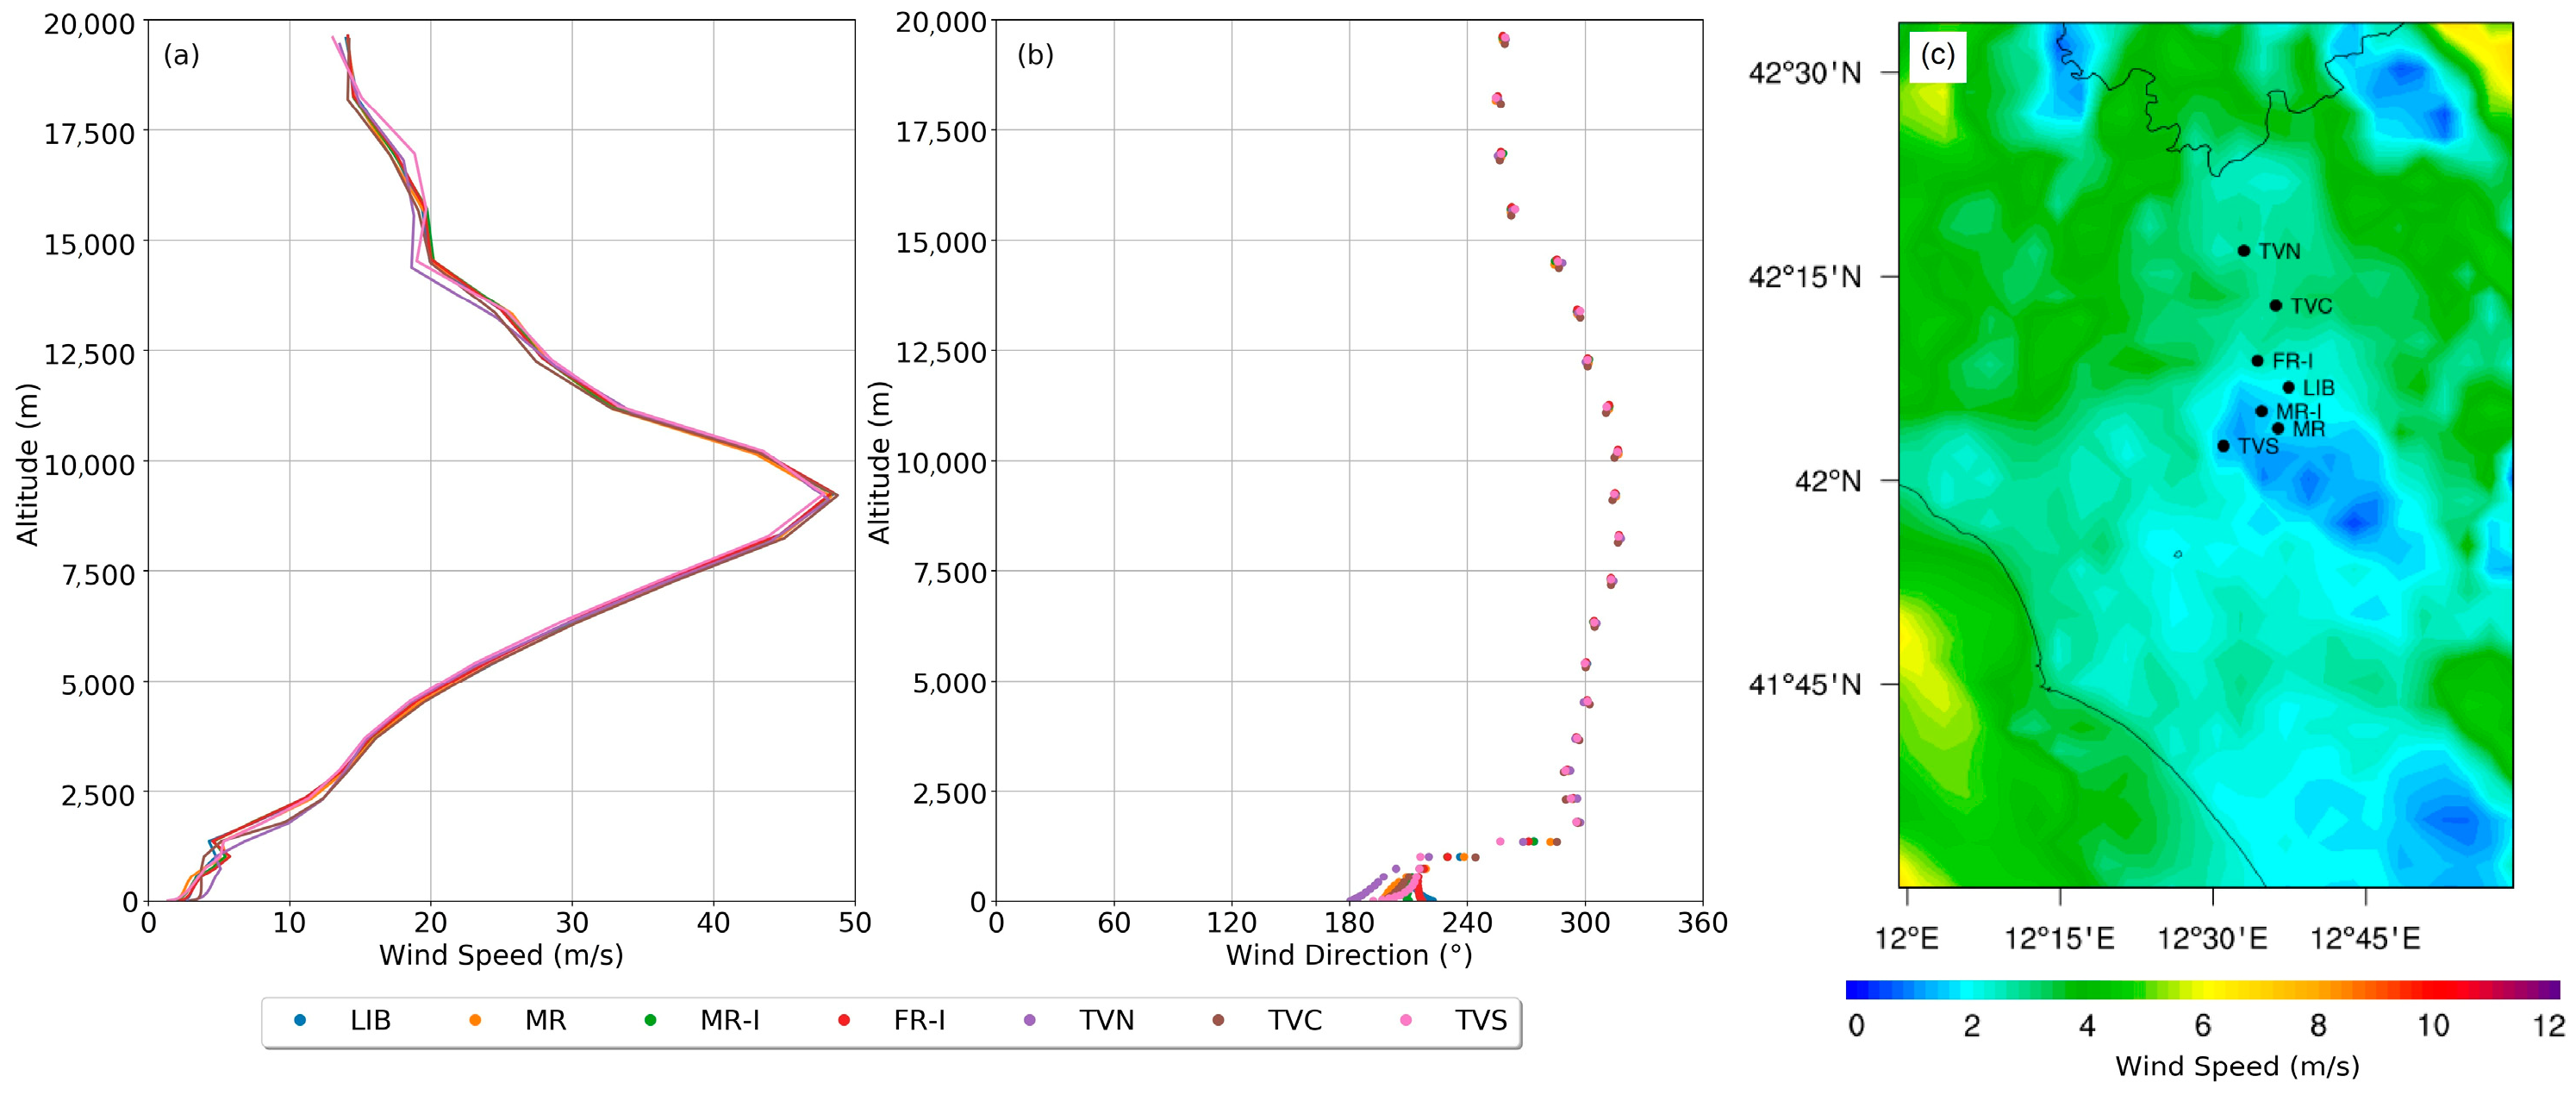
The seven events identified by the concurrent outliers were subjected to further anemological investigation through WRF simulations. Wind vertical profiles at the seven sites and spatial distributions of wind speed at 10 m above the ground are discussed in this section and are presented in Figure A2, Figure A3, Figure A4, Figure A5, Figure A6, Figure A7 and Figure A8.
As shown by the WRF maps, the wind speed was usually low in the Tiber Valley during high-pollution events, reaching maximum values of about 4 m/s. During the spring and summer in the analyzed time span, the Tiber Valley experienced wind velocity lower than the neighboring coastal areas (located southwest of the valley). For instance, on the 5 July 2022, the wind speed in the Tiber Valley was about 4 m/s, while it doubled near the coast. This suggested that all of the days of concurrent outliers from both Pandora and the analyzer were characterized by low ventilation close to the ground, thus favoring the accumulation of the pollutants emitted by local sources. Nonetheless, differences in wind intensity and direction among the seven sites depend on the day. As suggested by the vertical profiles, on 10 March 2022 (Figure A3) the seven profiles were nearly superimposed, and the wind reached 10 m/s from about 3500–4000 m up to 10,000 m coming from the North. The results suggested that moderately polluted conditions might be attributable to a significant contribution of local sources to the tropospheric VCD. Indeed, Figure 14 shows the higher VCDs in the sites affected by local sources (MR, MR-I and FR-I), with respect to the other sites. Differently, on the 21 November 2022 (Figure A7), the wind blew from the Southwest up to about 1500 m.a.g.l., then rotating and blowing from the Northwest with intensities reaching 50 m/s at about 9000 m.a.g.l. In this case, the high NO2 values were attributable to the overlapping of emission from local sources and moderate advection from the urban center of Rome. These results were supported by the highest TROPOMI VCD of the southernmost site, TVS, reported in Figure 14.
Considering all the simulated events, the normalized mean absolute bias ranged between 0.2 and 0.6 for both the wind speed at 10 m.a.g.l. and for the lowest portion of the wind speed vertical profiles, assumed as representative of the planetary boundary layer over complex terrain (up to approximately 1900 m.a.g.l.). Moreover, for the vertical profiles of wind intensity, the correlation coefficient and the root mean square error ranged from 0.6 up to 0.8 and from 0.9 up to 1.8, respectively. These values could be indicative of a satisfactory agreement between numerical outputs and observations and were in line with previous literature studies (e.g., [56,57]).
The results obtained for the events with high-level surface concentration and available satellite VCDs in a rural area suggested that the synergy of three techniques, supported by an atmospheric modelling system (e.g., WRF), can be likely useful for identifying local or not emission sources.

4. Conclusions

The aim of this work was to investigate the temporal and spatial distribution of NO2 over the southernmost edge of the Tiber Valley, a near-urban countryside area including agricultural, residential, and industrial land uses. A complete year (1 March 2022–28 February 2023) of satellite, ground-based remote sensing products and analyzer measurements were employed. NO2 has been selected as a robust proxy for the air quality analysis and monitoring.
The ground-based and surface NO2 concentrations were obtained at the Liberti Observatory, where NO2 was directly provided by the analyzer and estimated along the line of sight at a fixed azimuthal angle by a Pandora spectrometer. The tropospheric TROPOMI VCD were firstly investigated at the observatory (LIB) by the Pandora and TROPOMI products, and then the satellite product was considered in specific sites selected as representative of the local land uses (agricultural, urban, and industrial).
The surface NO2 concentration of Pandora showed high levels during the spring. This suggested a non-negligible contribution from agricultural activities not detectable by the analyzer, as attested by the mean values reported in Table 2 (1.87 × 10⁻⁷ mol/m3 and 1.17 × 10⁻⁷ mol/m3, respectively). Furthermore, this high value of the Pandora in spring was similar to that obtained in winter (1.86 × 10⁻⁷ mol/m3), while the NO2 analyzer concentrations followed the usual seasonal cycle with maxima in winter (1.83 × 10⁻⁷ mol/m3). The novel findings of the seasonal surface concentration for this rural environment with different land uses were confirmed by the hourly patterns. Indeed, a daily emission peak in spring, as well as in winter with comparable values, was revealed by the Pandora and not by the analyzer. It should be underlined that during the coldest seasons (winter and autumn), local emission sources, due to residential zones, were spread over the entire study area, making the surface concentration homogeneous in the surroundings. On the other hand, seasons with lower pollution (spring and summer) brought out the spatial heterogeneity of NO2 distribution with discrepancies between the datasets. This suggested that the pollution was mainly confined near the emission sources, not reaching the observatory site. An interesting peak in the central days of the week was detected by both the instruments. Synergy between ground-based and in situ surface concentrations was therefore oriented to guarantee air pollution monitoring of a location comprehensive of its surroundings at the lowest level of the atmosphere.
The concurrent Pandora and TROPOMI VCDs exhibited similar weekly and seasonal behavior, with respect to those of surface concentrations, although the VCDs covered the area contained in a pixel for TROPOMI and a long line of sight for the Pandora. The techniques allowed us to investigate the tropospheric columns over the local primary emission source by ground-based instrument and in the area around the site observed by the satellite. It should be noted that higher levels in March and April (springtime) were observed in the vertical column component as well as at the surface (LIB).
The seasonal variability of VCD in the selected sites with agricultural land use showed lower levels at the northernmost site (TVN). Conversely, a higher level was obtained at the southernmost station (TVS), which was mostly affected by atmospheric pollution, since it was closer to the emission sources. The variability in the urban and industrial sites showed a similar behavior during the entire period. The peculiar high VCD level observed at LIB in March and April was detectable in all the sites with distinct values of each one. The discrimination of the VCD and the identification of local features in each selected site was made possible by the high spatial resolution.
Finally, the TROPOMI tropospheric VCD was mapped to evaluate the seasonal and weekly variations over all the study areas corresponding to the Tiber Valley. These results showed the high potential of the TROPOMI sensor to be able to map the spatial–temporal variability of tropospheric NO2 over rural areas.
In addition, seven days with simultaneous outliers by the Pandora and analyzer were identified. The seven events were further studied through WRF numerical simulations in order to investigate the vertical and horizontal variability of wind speed and wind direction. The numerical results suggested that, during the selected days, surface wind speeds had always been lower than 5 m/s, suggesting that the high measured concentrations were mainly due to local emissions and, only to a lesser extent, to the transport of pollutants from the urban center of Rome.
In conclusion, our study showed that a combined use of in situ, ground-based, and satellite remote sensing techniques offered a powerful tool for an efficient monitoring the atmospheric pollutants, also of short-lived trace gas, such as nitrogen dioxide, in a rural site exposed to low and moderate emission sources.
Overall, a detailed spatial and temporal distribution of air pollution by using independent source of information provided data to support local planning and decision making on sustainable policies and actions required in areas interested by rural, urban, and industrialized land uses.

Author Contributions

Conceptualization and planning of the presented idea, C.B.; methodology, C.B., F.V., A.I., S.F. and A.D.B.; software, C.B., G.E., S.F. and A.D.B.; validation, C.B. and G.E.; investigation, C.B., F.V. and A.I.; data curation, C.B. and G.E.; Principal Investigator of the PGN site (Rome-IIA), S.C.; writing—original draft preparation, C.B.; writing—review and editing, C.B., F.V., A.I., F.B., S.F., A.D.B., S.C. and A.M.I.; project administration, F.B.; funding acquisition, C.B. All authors have read and agreed to the published version of the manuscript.

Funding

This research was funded by subcontract CNR-IIA and Serco in the framework of BAQUNIN-2 contract (No. 4000138460/22/I-NS) funded by ESA (European Space Agency) and led by Serco Italia. The research was supported by the project team of BAQUNIN-2 (www.baqunin.eu, accessed on 24 April 2023) and also utilized the scientific data they produced. The PGN was a bilateral project supported with funding from NASA and ESA. Serena Falasca was funded by MUR (Ministero dell’Università e della Ricerca of Italy) under PON “Ricerca e Innovazione” 2014–2020 (D.M. 1062/2021).

Data Availability Statement

The Pandora PGN datasets are available at https://www.pandonia-global-network.org/ (accessed on 5 May 2023). TROPOMI https://s5phub.copernicus.eu/dhus/#/home (accessed on 4 May 2023) analyzer datasets are available upon request to the authors.

Acknowledgments

The authors gratefully acknowledge Alexander Cede (LuftBlick) and Martin Tiefengraber (LuftBlick) for the maintenance of the PGN network and Leonie Haunold (LuftBlick) for calibrating the Pandora 138 time series. The authors wish to thank Mauro Montagnoli (CNR-IIA) and Marco Giusto (CNR-IIA) for helping to provide the raw analyzer and meteorological data in Liberti Observatory. The computational resources for WRF runs were provided by CINECA. We acknowledge the CINECA award, under the ISCRA initiative, for the availability of high-performance computing resources and support. We are grateful to the anonymous reviewers for their valuable suggestions and helpful comments, and Alice Cuzzucoli (CNR-IIA) for checking the manuscript.

Conflicts of Interest

The authors declare no conflict of interest.

Appendix A

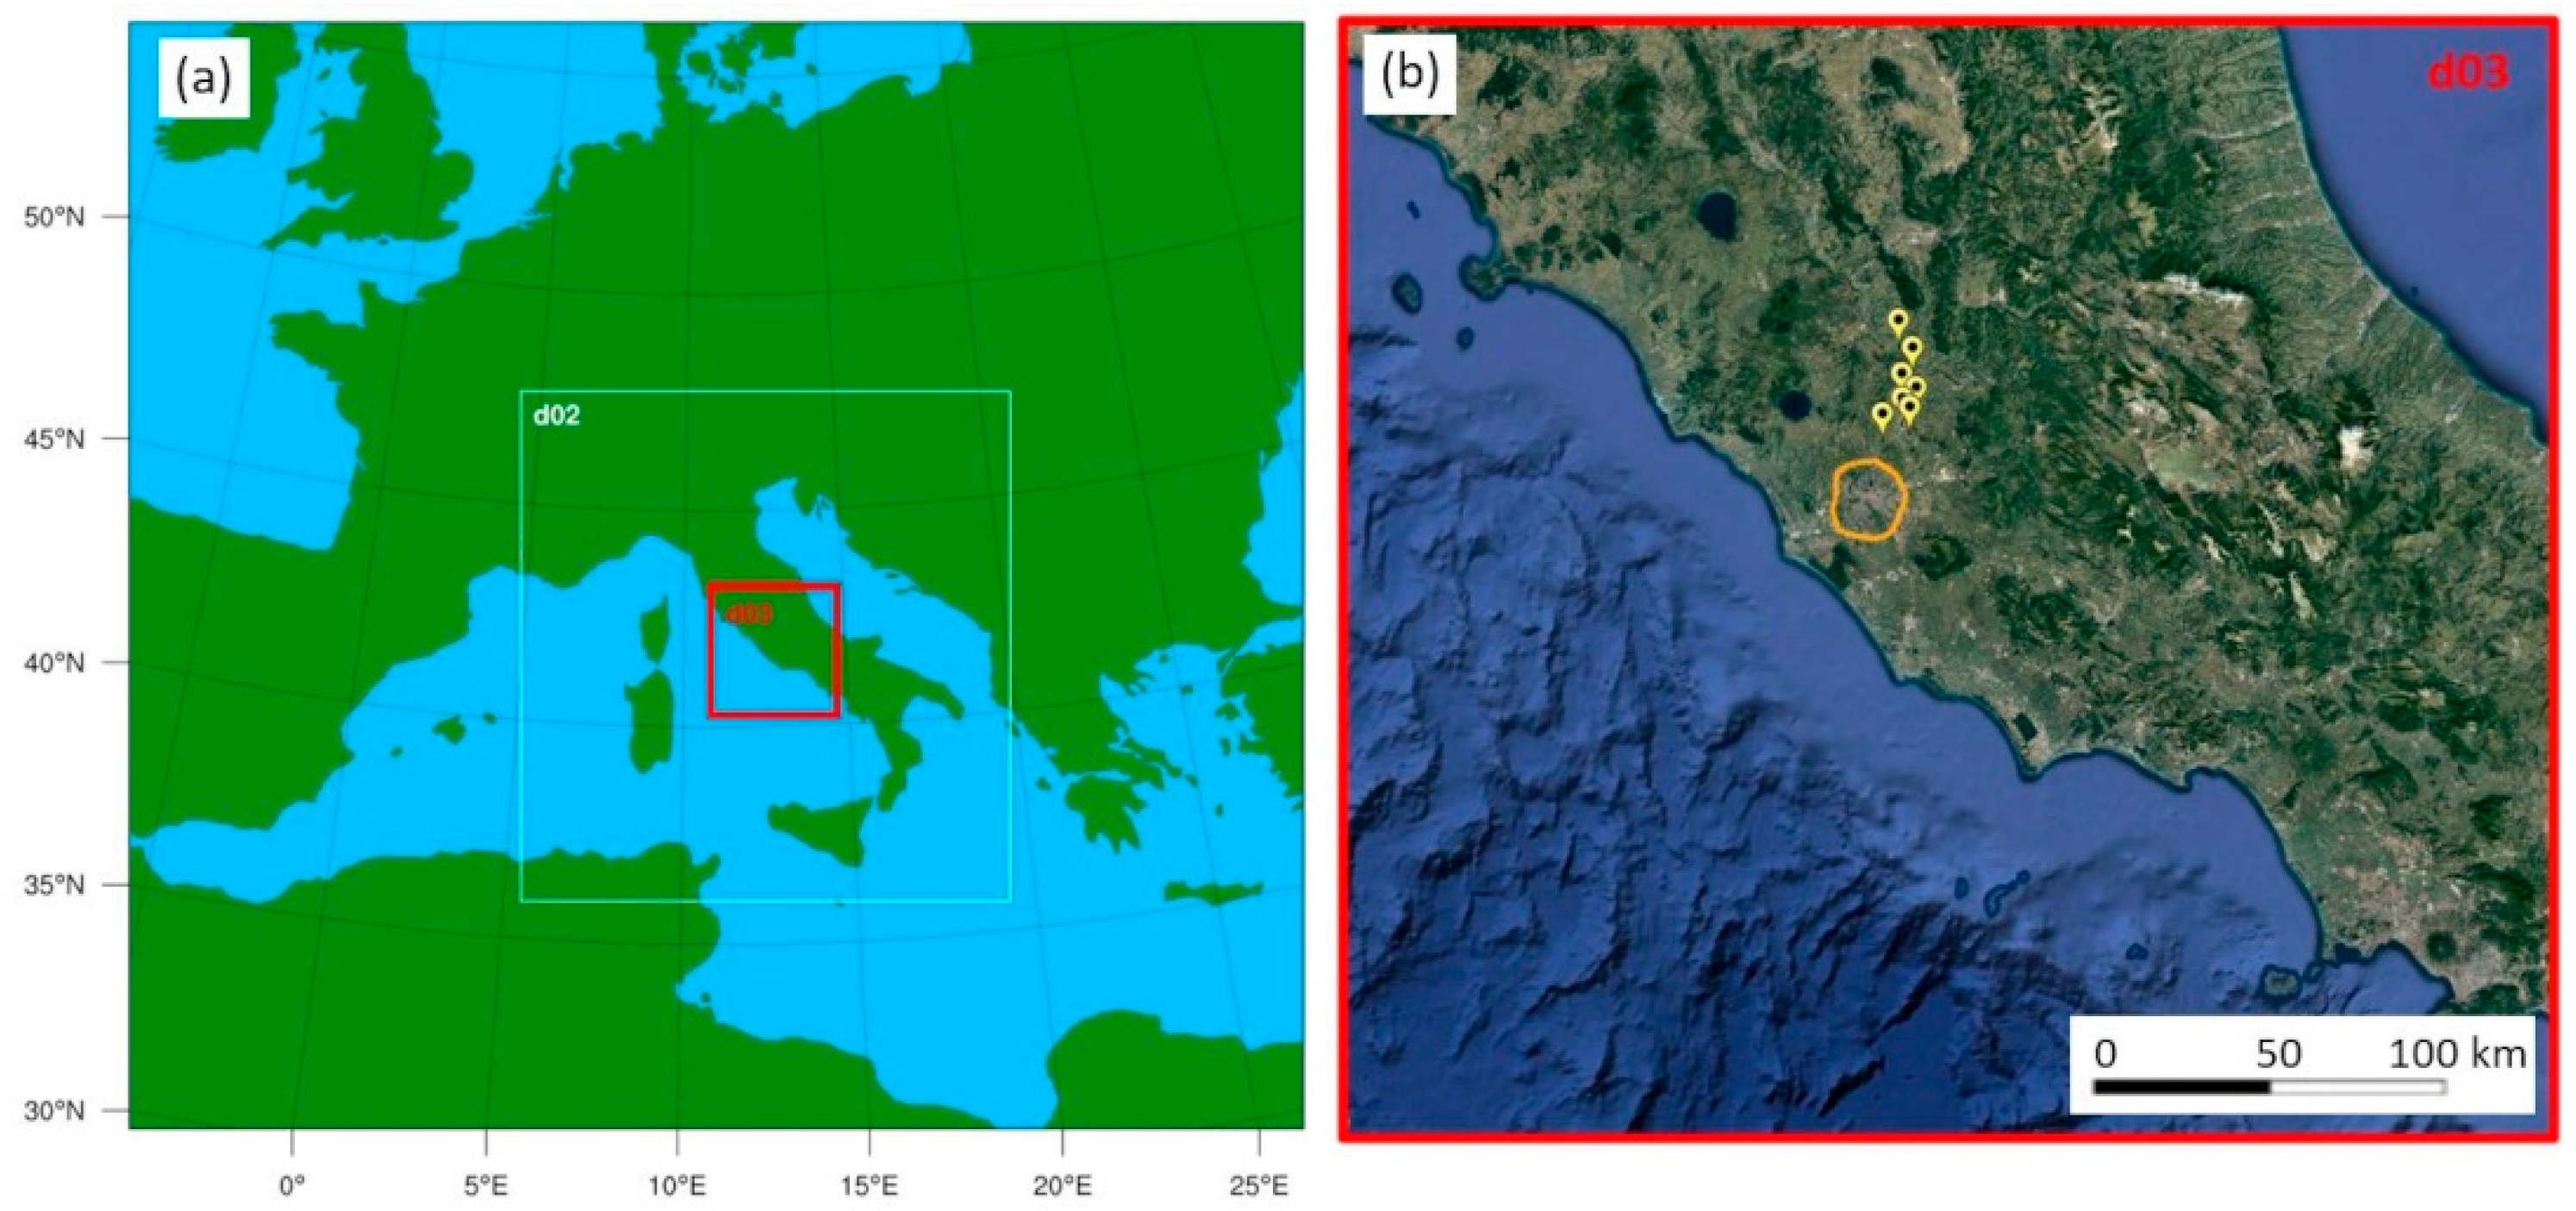
The WRF domain configuration includes three 3-D domains covering Europe, Italy, and Central Italy with horizontal dimensions of 108 × 102, 135 × 141 and 102 × 102 cells in the West–East and South–North directions and a horizontal resolution equal to 27, 9, and 3 km, respectively (Figure A1). The common vertical grid consists of 33 levels, with the lowest at 12 m from the ground. The highest horizontal resolution of 3 km is consistent with that of the pixels of satellite data. The three domains are nested with the two-way technique. The setup of the runs consists of the physical options listed in Table A1. Furthermore, a multilayer urban scheme, namely the Building Effect Parameterization (BEP, [58]) is included because of the presence of Rome in the innermost domain, not far from the considered sites. The land use classification is based on the MODIS dataset, including 21 categories, 1 of which corresponds to the urban texture. Although the setup in Table A1 has been already tested and evaluated in several previous studies (e.g., [59]), in this study, WRF results are compared with wind speed and direction provided by the meteorological station at the Liberti Observatory and by radio soundings at the Pratica di Mare air base site (ICAO code: LIRE, Lat. 41.654, Lon. 12.445). Satisfactory performances of WRF are confirmed both for values at a 10 m height and at higher altitudes (Figure A2, Figure A3, Figure A4, Figure A5, Figure A6, Figure A7 and Figure A8), as discussed in Section 3.2.3. Additional tests (not shown here) prove that an increase of the horizontal resolution up to 1 km here does not benefit the reliability of the WRF results.
Figure A1. (a) WRF model domains and (b) aerial photo of the innermost domain d03. Rome city center (orange line) and the seven sites (orange and yellow placemarks) considered in this study are also shown.
Remotesensing 15 03703 g0a1
Table A1. Set of physics options selected for this application of the WRF model.
Physics CategoryOption
PBL schemeBougeault–Lacarrere
Urban schemeBuilding Effect Parameterization (BEP)
Land-surfaceNoah Land-Surface Model
surface-layerMonin-Obukhov Similarity scheme
MicrophysicsWSM 6-class graupel scheme
Longwave radiationRRTM scheme
Shortwave radiationDudhia scheme
Land use datasetMODIS
Figure A2. Vertical profiles of (a) wind speed and (b) wind direction in the seven sites considered, and (c) map of the wind speed at 10 m.a.g.l. obtained by WRF on 10 March 2022. All plots refer to 12:00 UTC. In panel (c), the black dots depict the location of seven sites considered in this study.
Remotesensing 15 03703 g0a2
Figure A3. Vertical profiles of (a) wind speed and (b) wind direction in the seven sites considered, and (c) map of the wind speed at 10 m.a.g.l. obtained by WRF on 25 June 2022. All plots refer to 12:00 UTC. In panel (c), the black dots depict the location of seven sites considered in this study.
Remotesensing 15 03703 g0a3
Figure A4. Vertical profiles of (a) wind speed and (b) wind direction in the seven sites considered, and (c) map of the wind speed at 10 m.a.g.l. obtained by WRF on 5 July 2022. All plots refer to 12:00 UTC. In panel (c), the black dots depict the location of seven sites considered in this study.
Remotesensing 15 03703 g0a4
Figure A5. Vertical profiles of (a) wind speed and (b) wind direction in the seven sites considered, and (c) map of the wind speed at 10 m.a.g.l. obtained by WRF on 28 July 2022. All plots refer to 12:00 UTC. In panel (c), the black dots depict the location of seven sites considered in this study.
Remotesensing 15 03703 g0a5
Figure A6. Vertical profiles of (a) wind speed and (b) wind direction in the seven sites considered, and (c) map of the wind speed at 10 m.a.g.l. obtained by WRF on 12 August 2022. All plots refer to 12:00 UTC. In panel (c), the black dots depict the location of seven sites considered in this study.
Remotesensing 15 03703 g0a6
Figure A7. Vertical profiles of (a) wind speed and (b) wind direction in the seven sites considered, and (c) map of the wind speed at 10 m.a.g.l. obtained by WRF on 21 November 2022. All plots refer to 12:00 UTC. In panel (c), the black dots depict the location of seven sites considered in this study.
Remotesensing 15 03703 g0a7
Figure A8. Vertical profiles of (a) wind speed and (b) wind direction in the seven sites considered, and (c) map of the wind speed at 10 m.a.g.l. obtained by WRF on 17 February 2023. All plots refer to 12:00 UTC. In panel (c), the black dots depict the location of seven sites considered in this study.
Remotesensing 15 03703 g0a8

References

  1. Seinfeld, J.H.; Pandis, S.N. Atmospheric Chemistry and Physics: From Air Pollution to Climate Change, 3rd ed.; John Wiley and Son: Hoboken, NJ, USA, 2016; ISBN 978-1-118-94740-1. [Google Scholar]
  2. World Health Organization (WHO). WHO Global Air Quality Guidelines: Particulate Matter (PM2.5 and PM10), Ozone, Nitrogen Dioxide, Sulfur Dioxide and Carbon Monoxide; World Health Organization, Regional Office for Europe: Geneva, Switzerland, 2021; Available online: https://apps.who.int/iris/handle/10665/345329 (accessed on 24 April 2023).
  3. Huangfu, P.; Atkinson, R. Long-term exposure to NO2 and O3 and all-cause and respiratory mortality: A systematic review and meta-analysis. Environ. Int. 2020, 144, 105998. [Google Scholar] [CrossRef]
  4. Orellano, P.; Reynoso, J.; Quaranta, N.; Bardach, A.; Ciapponi, A. Short-term exposure to particulate matter (PM10 and PM2.5), nitrogen dioxide (NO2), and ozone (O3) and all-cause and cause-specific mortality: Systematic review and meta-analysis. Environ. Int. 2020, 142, 105876. [Google Scholar] [CrossRef] [PubMed]
  5. Zheng, X.-Y.; Orellano, P.; Lin, H.-L.; Jiang, M.; Guan, W.-J. Short-term exposure to ozone, nitrogen dioxide, and sulphur dioxide and emergency department visits and hospital admissions due to asthma: A systematic review and meta-analysis. Environ. Int. 2021, 150, 106435. [Google Scholar] [CrossRef] [PubMed]
  6. Velasco, R.P.; Jarosińska, D. Update of the WHO global air quality guidelines: Systematic reviews—An introduction. Environ. Int. 2022, 170, 107556. [Google Scholar] [CrossRef]
  7. European Environmental Agency (EEA). Air Quality in Europe 2023. In Europe’s Air Quality Status 2023—European Environment Agency; Report no. 05/2023; European Environmental Agency: Copenhagen, Denmark, 2023. Available online: europa.eu (accessed on 24 April 2023). [CrossRef]
  8. European Commission (EU). Communication from the Commission to the European Parliament, the Council, the European Economic and Social Committee and the Committee of the Regions. A Long-Term Vision for the EU’s Rural Areas—towards Stronger, Connected, Resilient and Prosperous Rural Areas by 2040. Brussels; 30.6.2021 COM (2021) 345 Final. Available online: https://eur-lex.europa.eu/legal-content/EN/TXT/?uri=CELEX:52021DC0345 (accessed on 24 April 2023).
  9. Griffin, D.; Zhao, X.; McLinden, C.A.; Boersma, F.; Bourassa, A.; Dammers, E.; Degenstein, D.; Eskes, H.; Fehr, L.; Fioletov, V.; et al. High-resolution mapping of nitrogen dioxide with TROPOMI: First results and validation over the Canadian oil sands. Geophys. Res. Lett. 2019, 46, 1049–1060. [Google Scholar] [CrossRef] [Green Version]
  10. Pseftogkas, A.; Koukouli, M.-E.; Segers, A.; Manders, A.; Geffen, J.V.; Balis, D.; Meleti, C.; Stavrakou, T.; Eskes, H. Comparison of S5P/TROPOMI Inferred NO2 Surface Concentrations with In Situ Measurements over Central Europe. Remote Sens. 2022, 14, 4886. [Google Scholar] [CrossRef]
  11. Müller, I.; Erbertseder, T.; Taubenböck, H. Tropospheric NO2: Explorative analyses of spatial variability and impact factors. Remote Sens. Environ. 2022, 270, 112839. [Google Scholar] [CrossRef]
  12. Goldberg, D.L.; Anenberg, S.C.; Kerr, G.H.; Mohegh, A.; Lu, Z.; Streets, D.G. TROPOMI NO2 in the United States: A detailed look at the annual averages, weekly cycles, effects of temperature, and correlation with surface NO2 concentrations. Earth’s Future 2021, 9, e2020EF001665. [Google Scholar] [CrossRef]
  13. Jeong, U.; Hong, H. Assessment of Tropospheric Concentrations of NO2 from the TROPOMI/Sentinel-5 Precursor for the Estimation of Long-Term Exposure to Surface NO2 over South Korea. Remote Sens. 2021, 13, 1877. [Google Scholar] [CrossRef]
  14. Pandonia Global Network (PGN). Available online: https://www.pandonia-global-network.org/ (accessed on 24 April 2023).
  15. Verhoelst, T.; Compernolle, S.; Pinardi, G.; Lambert, J.-C.; Eskes, H.J.; Eichmann, K.-U.; Fjæraa, A.M.; Granville, J.; Niemeijer, S.; Cede, A.; et al. Ground-based validation of the Copernicus Sentinel-5P TROPOMI NO2 measurements with the NDACC ZSL-DOAS, MAX-DOAS and Pandonia global networks. Atmos. Meas. Tech. 2021, 14, 481–510. [Google Scholar] [CrossRef]
  16. Ialongo, I.; Virta, H.; Eskes, H.; Hovila, J.; Douros, J. Comparison of TROPOMI/Sentinel-5 Precursor NO2 observations with ground-based measurements in Helsinki. Atmos. Meas. Tech. 2020, 13, 205–218. [Google Scholar] [CrossRef] [Green Version]
  17. Zhao, X.; Griffin, D.; Fioletov, V.; McLinden, C.; Davies, J.; Ogyu, A.; Lee, S.C.; Lupu, A.; Moran, M.D.; Cede, A.; et al. Retrieval of total column and surface NO2 from Pandora zenith-sky measurements. Atmos. Chem. Phys. 2019, 19, 10619–10642. [Google Scholar] [CrossRef]
  18. Cede, A. Manual for Blick Software Suite 1.8; Version 1-8-4; Luftblick: Innsbruck, Austria, 2021; pp. 183–185. Available online: https://www.pandonia-global-network.org/wp-content/uploads/2021/09/BlickSoftwareSuite_Manual_v1-8-4.pdf (accessed on 24 April 2023).
  19. Bassani, C.; Vichi, F.; Esposito, G.; Montagnoli, M.; Giusto, M.; Ianniello, A. Nitrogen dioxide reductions from satellite and surface observations during COVID-19 mitigation in Rome (Italy). Environ. Sci. Pollut. Res. 2021, 28, 22981–23004. [Google Scholar] [CrossRef]
  20. Boundary-Layer Air Quality-Analysis Using Network of Instruments (BAQUNIN) Super-Site. Available online: https://www.baqunin.eu/ (accessed on 24 April 2023).
  21. Iannarelli, A.M.; Di Bernardino, A.; Casadio, S.; Bassani, C.; Cacciani, M.; Campanelli, M.; Casasanta, G.; Cadau, E.; Diémoz, H.; Mevi, G.; et al. The Boundary Layer Air Quality-Analysis Using Network of Instruments (BAQUNIN) Supersite for Atmospheric Research and Satellite Validation over Rome Area. Bull. Am. Meteorol. Soc. 2022, 103, E599–E618. [Google Scholar] [CrossRef]
  22. Yttri, K.E.; Simpson, D.; Bergström, R.; Kiss, G.; Szidat, S.; Ceburnis, D.; Eckhardt, S.; Hueglin, C.; Nøjgaard, J.K.; Perrino, C.; et al. The EMEP Intensive Measurement Period campaign, 2008–2009: Characterizing carbonaceous aerosol at nine rural sites in Europe. Atmos. Chem. Phys. 2019, 19, 4211–4233. [Google Scholar] [CrossRef] [Green Version]
  23. Ciccioli, P.; Brancaleoni, E.; Frattoni, M. Chapter 5—Reactive Hydrocarbons in the Atmosphere at Urban and Regional Scales. In Reactive Hydrocarbons in the Atmosphere; Hewitt, C.N., Ed.; Academic Press: Cambridge, MA, USA, 1999; pp. 159–207. [Google Scholar] [CrossRef]
  24. Veefkind, J.P.; Aben, I.; McMullan, K.; Forster, H.; de Vries, J.; Otter, G.; Claas, J.; Eskes, H.J.; de Haan, J.F.; Kleipool, Q.; et al. TROPOMI on the ESA Sentinel-5 Precursor: A GMES mission for global observations of the atmospheric composition for climate, 30 air quality and ozone layer applications. Remote Sens. Environ. 2012, 120, 70–83. [Google Scholar] [CrossRef]
  25. van Geffen, J.H.G.M.; Eskes, H.J.; Boersma, K.F.; Veefkind, J.P. TROPOMI ATBD of the Total and Tropospheric NO2 Data Products; Tech Rep S5P-KNMI-L2-0005-RP; CI-7430-ATBD, Issue 2.4.0; Koninklijk Nederlands Meteorologisch Instituut (KNMI): De Bilt, The Netherlands, 2022; Available online: https://sentinel.esa.int/documents/247904/2476257/sentinel-5p-tropomi-atbd-no2-data-products (accessed on 24 April 2023).
  26. Eskes, H.; van Geffen, J.; Boersma, F.; Eichmann, K.-U.; Apituley, A.; Pedergnana, M.; Sneep, M.; Veefkind, J.P.; Loyola, D. Sentinel-5 Precursor/TROPOMI Level 2 Product User Manual Nitrogen Dioxide, V.4.1.0 (S5P-KNMI-L2-0021-MA). 2022. Available online: https://sentinel.esa.int/documents/247904/2474726/Sentinel-5P-Level-2-Product-User-Manual-Nitrogen-Dioxide.pdf (accessed on 24 April 2023).
  27. van Geffen, J.; Boersma, F.K.; Eskes, H.; Sneep, M.; Linden, T.M.; Zara, M.; Veefkind, P.J. S5P TROPOMI NO2 slant column retrieval: Method, stability, uncertainties and comparisons with OMI. Atmos. Meas. Tech. 2020, 13, 1315–1335. [Google Scholar] [CrossRef] [Green Version]
  28. Boersma, K.F.; Eskes, H.J.; Brinksma, E.J. Error analysis for tropospheric NO2 retrieval from space. J. Geophys. Res. 2004, 109, D0431. [Google Scholar] [CrossRef]
  29. Platt, U.; Stutz, J. Differential Optical Absorption Spectroscopy—Principles and Application, 1st ed.; Springer: Berlin/Heidelberg, Germany, 2008. [Google Scholar] [CrossRef] [Green Version]
  30. Williams, J.E.; Boersma, K.F.; Le Sager, P.; Verstraeten, W.W. The high-resolution version of TM5-MP for optimized satellite retrievals: Description and validation. Geosci. Model Dev. 2017, 10, 721–750. [Google Scholar] [CrossRef] [Green Version]
  31. Kleipool, Q.L.; Dobber, M.R.; de Haan, J.F.; Levelt, P.F. Earth surface reflectance climatology from 3 years of OMI data. J. Geophys. Res. Atmos. 2008, 113, D18308. [Google Scholar] [CrossRef] [Green Version]
  32. Herman, J.; Cede, A.; Spinei, E.; Mount, G.; Tzortziou, M.; Abuhassan, N. NO2 column amounts from ground-based Pandora and MFDOAS spectrometers using the direct-sun DOAS technique: Intercomparisons and application to OMI validation. J. Geophys. Res. 2009, 114, D13307. [Google Scholar] [CrossRef] [Green Version]
  33. EN 14211:2012; Ambient Air Standard Method for the Measurement of the Concentration of Nitrogen Dioxide and Nitrogen Monoxide by Chemiluminescence. European Committee for Standardization: Brussels, Belgium, 2012.
  34. Winer, A.M.; Peters, J.W.; Smith, J.P.; Pitts, J.N. Response of commercial chemiluminescent nitric oxide-nitrogen dioxide analyzers to other nitrogen-containing compounds. Environ. Sci. Technol. 1974, 8, 1118–1121. [Google Scholar] [CrossRef]
  35. Steinbacher, M.; Zellweger, C.; Schwarzenbach, B.; Bugmann, S.; Buchmann, B.; Ordonez, C.; Prévot, A.S.H.; Hueglin, C. Nitrogen oxide measurements at rural sites in Switzerland: Bias of conventional measurement techniques. J. Geophys. Res. 2007, 112, D11307. [Google Scholar] [CrossRef] [Green Version]
  36. Gerboles, M.; Lagler, F.; Rembges, D.; Brun, C. Assessment of uncertainty of NO2 measurements by the chemiluminescence method and discussion of the quality objective of the NO2 European Directive. J. Environ. Monit. 2003, 5, 529–540. [Google Scholar] [CrossRef]
  37. Andersen, S.T.; Carpenter, L.J.; Nelson, B.S.; Neves, L.; Read, K.A.; Reed, C.; Ward, M.; Rowlinson, M.J.; Lee, J.D. Long-term NOx measurements in the remote marine tropical troposphere. Atmos. Meas. Tech. 2021, 14, 3071–3085. [Google Scholar] [CrossRef]
  38. Skamarock, W.C.; Klemp, J.B.; Dudhia, J.; Gill, D.O.; Liu, Z.; Berner, J.; Wang, W.; Powers, J.G.; Duda, M.G.; Barker, D.M.; et al. A Description of the Advanced Research WRF Model Version 4.3 (No. NCAR/TN-556+STR). 2021. Available online: https://opensky.ucar.edu/islandora/object/opensky:2898 (accessed on 28 March 2023).
  39. National Centers for Environmental Prediction/National Weather Service/NOAA/U.S. Department of Commerce. NCEP GDAS/FNL 0.25 Degree Global Tropospheric Analyses and Forecast Grids. Research Data Archive at the National Center for Atmospheric Research, Computational and Information Systems Laboratory. 2015. Available online: https://rda.ucar.edu/datasets/ds083.3/ (accessed on 28 March 2023).
  40. Ashenden, T.W.; Bell, S.A. Rural concentrations of nitrogen dioxide pollution throughout Wales. Environ. Pollut. 1989, 58, 179–193. [Google Scholar] [CrossRef]
  41. Ashenden, T.W.; Edge, C.P. Increasing concentrations of nitrogen dioxide pollution in rural Wales. Environ. Pollut. 1995, 87, 11–16. [Google Scholar] [CrossRef]
  42. Bell, S.; Ashenden, T.W. Spatial and temporal variation in nitrogen dioxide pollution adjacent to rural roads. Water Air Soil Pollut. 1997, 95, 87–98. [Google Scholar] [CrossRef]
  43. Kenagy, H.S.; Sparks, T.L.; Ebben, C.J.; Wooldrige, P.J.; Lopez-Hilfiker, F.D.; Lee, B.H.; Thornton, J.A.; McDuffie, E.E.; Fibiger, D.L.; Brown, S.S.; et al. NOx lifetime and NOy partitioning during WINTER. J. Geophys. Res. Atmos. 2018, 123, 9813–9827. [Google Scholar] [CrossRef]
  44. Potter, P.; Ramankutty, N.; Bennett, E.M.; Donner, S.D. Characterizing the Spatial Patterns of Global Fertilizer Application and Manure Production. Earth Interact. 2010, 14, 1–22. [Google Scholar] [CrossRef]
  45. Huber, D.E.; Steiner, A.L.; Kort, E.A. Daily cropland soil NOx emissions identified by TROPOMI and SMAP. Geophys. Res. Lett. 2020, 47, e2020GL089949. [Google Scholar] [CrossRef]
  46. Luo, L.; Ran, L.; Rasool, Q.Z.; Cohan, D.S. Integrated Modeling of U.S. Agricultural Soil Emissions of Reactive Nitrogen and Associated Impacts on Air Pollution, Health, and Climate. Environ. Sci. Technol. 2022, 56, 9265–9276. [Google Scholar] [CrossRef]
  47. Di Bernardino, A.; Mevi, G.; Iannarelli, A.M.; Falasca, S.; Cede, A.; Tiefengraber, M.; Casadio, S. Temporal Variation of NO2 and O3 in Rome (Italy) from Pandora and In Situ Measurements. Atmosphere 2023, 14, 594. [Google Scholar] [CrossRef]
  48. Stavrakou, T.; Müller, J.F.; Bauwens, M.; Boersma, K.F.; van Geffen, J. Satellite evidence for changes in the NO2 weekly cycle over large cities. Sci. Rep. 2020, 10, 10066. [Google Scholar] [CrossRef]
  49. Beirle, S.; Platt, U.; Wenig, M.; Wagner, T. Weekly cycle of NO2 by GOME measurements: A signature of anthropogenic sources. Atmos. Chem. Phys. 2003, 3, 2225–2232. [Google Scholar] [CrossRef] [Green Version]
  50. Dimitropoulou, E.; Hendrick, F.; Pinardi, G.; Friedrich, M.M.; Merlaud, A.; Tack, F.; De Longueville, H.; Fayt, C.; Hermans, C.; Laffineur, Q.; et al. Validation of TROPOMI tropospheric NO2 columns using dual-scan multi-axis differential optical absorption spectroscopy (MAX-DOAS) measurements in Uccle, Brussels. Atmos. Meas. Tech. 2020, 13, 5165–5191. [Google Scholar] [CrossRef]
  51. Judd, L.M.; Al-Saadi, J.A.; Szykman, J.J.; Valin, L.C.; Janz, S.J.; Kowalewski, M.G.; Eskes, H.J.; Veefkind, J.P.; Cede, A.; Mueller, M.; et al. Evaluating Sentinel-5P TROPOMI tropospheric NO2 column densities with airborne and Pandora spectrometers near New York City and Long Island Sound. Atmos. Meas. Tech. 2020, 13, 6113–6140. [Google Scholar] [CrossRef] [PubMed]
  52. Herman, J.; Abuhassan, N.; Kim, J.; Kim, J.; Dubey, M.; Raponi, M.; Tzortziou, M. Underestimation of column NO2 amounts from the OMI satellite compared to diurnally varying ground-based retrievals from multiple PANDORA spectrometer instruments. Atmos. Meas. Tech. 2019, 12, 5593–5612. [Google Scholar] [CrossRef] [Green Version]
  53. Sentinel-4 Mission. Sentinel-4—Missions—Sentinel Online—Sentinel Online. Available online: copernicus.eu (accessed on 9 May 2023).
  54. Rudke, A.P.; Martins, J.A.; Hallak, R.; Martins, L.D.; de Almeida, D.S.; Beal, A.; Freitas, E.D.; Andrade, M.F.; Koutrakis, P.; Albuquerque, T.T.A. Evaluating TROPOMI and MODIS performance to capture the dynamic of air pollution in São Paulo state: A case study during the COVID-19 outbreak. Remote Sens. Environ. 2023, 289, 113514. [Google Scholar] [CrossRef]
  55. Petetin, H.; Guevara, M.; Compernolle, S.; Bowdalo, D.; Bretonnière, P.-A.; Enciso, S.; Jorba, O.; Lopez, F.; Soret, A.; Pérez García-Pando, C. Potential of TROPOMI for understanding spatio-temporal variations in surface NO2 and their dependencies upon land use over the Iberian Peninsula. Atmos. Chem. Phys. 2023, 23, 3905–3935. [Google Scholar] [CrossRef]
  56. Hu, X.-M.; Klein, P.M.; Xue, M. Evaluation of the updated YSU planetary boundary layer scheme within WRF for wind resource and air quality assessments. J. Geophys. Res. Atmos. 2013, 118, 10,490–10,505. [Google Scholar] [CrossRef]
  57. Falasca, S.; Gandolfi, I.; Argentini, S.; Barnaba, F.; Casasanta, G.; Di Liberto, L.; Petenko, I.; Curci, G. Sensitivity of near-surface meteorology to PBL schemes in WRF simulations in a port-industrial area with complex terrain. Atmos. Res. 2021, 264, 105824. [Google Scholar] [CrossRef]
  58. Martilli, A.; Clappier, A.; Rotach, M.W. An urban surface exchange parameterisation for mesoscale models. Bound. Layer Meteorol. 2002, 104, 261–304. [Google Scholar] [CrossRef]
  59. Falasca, S.; Zinzi, M.; Ding, L.; Curci, G.; Santamouris, M. On the mitigation potential of higher urban albedo in a temperate oceanic metropolis. Sustain. Cities Soc. 2022, 81, 103850. [Google Scholar] [CrossRef]
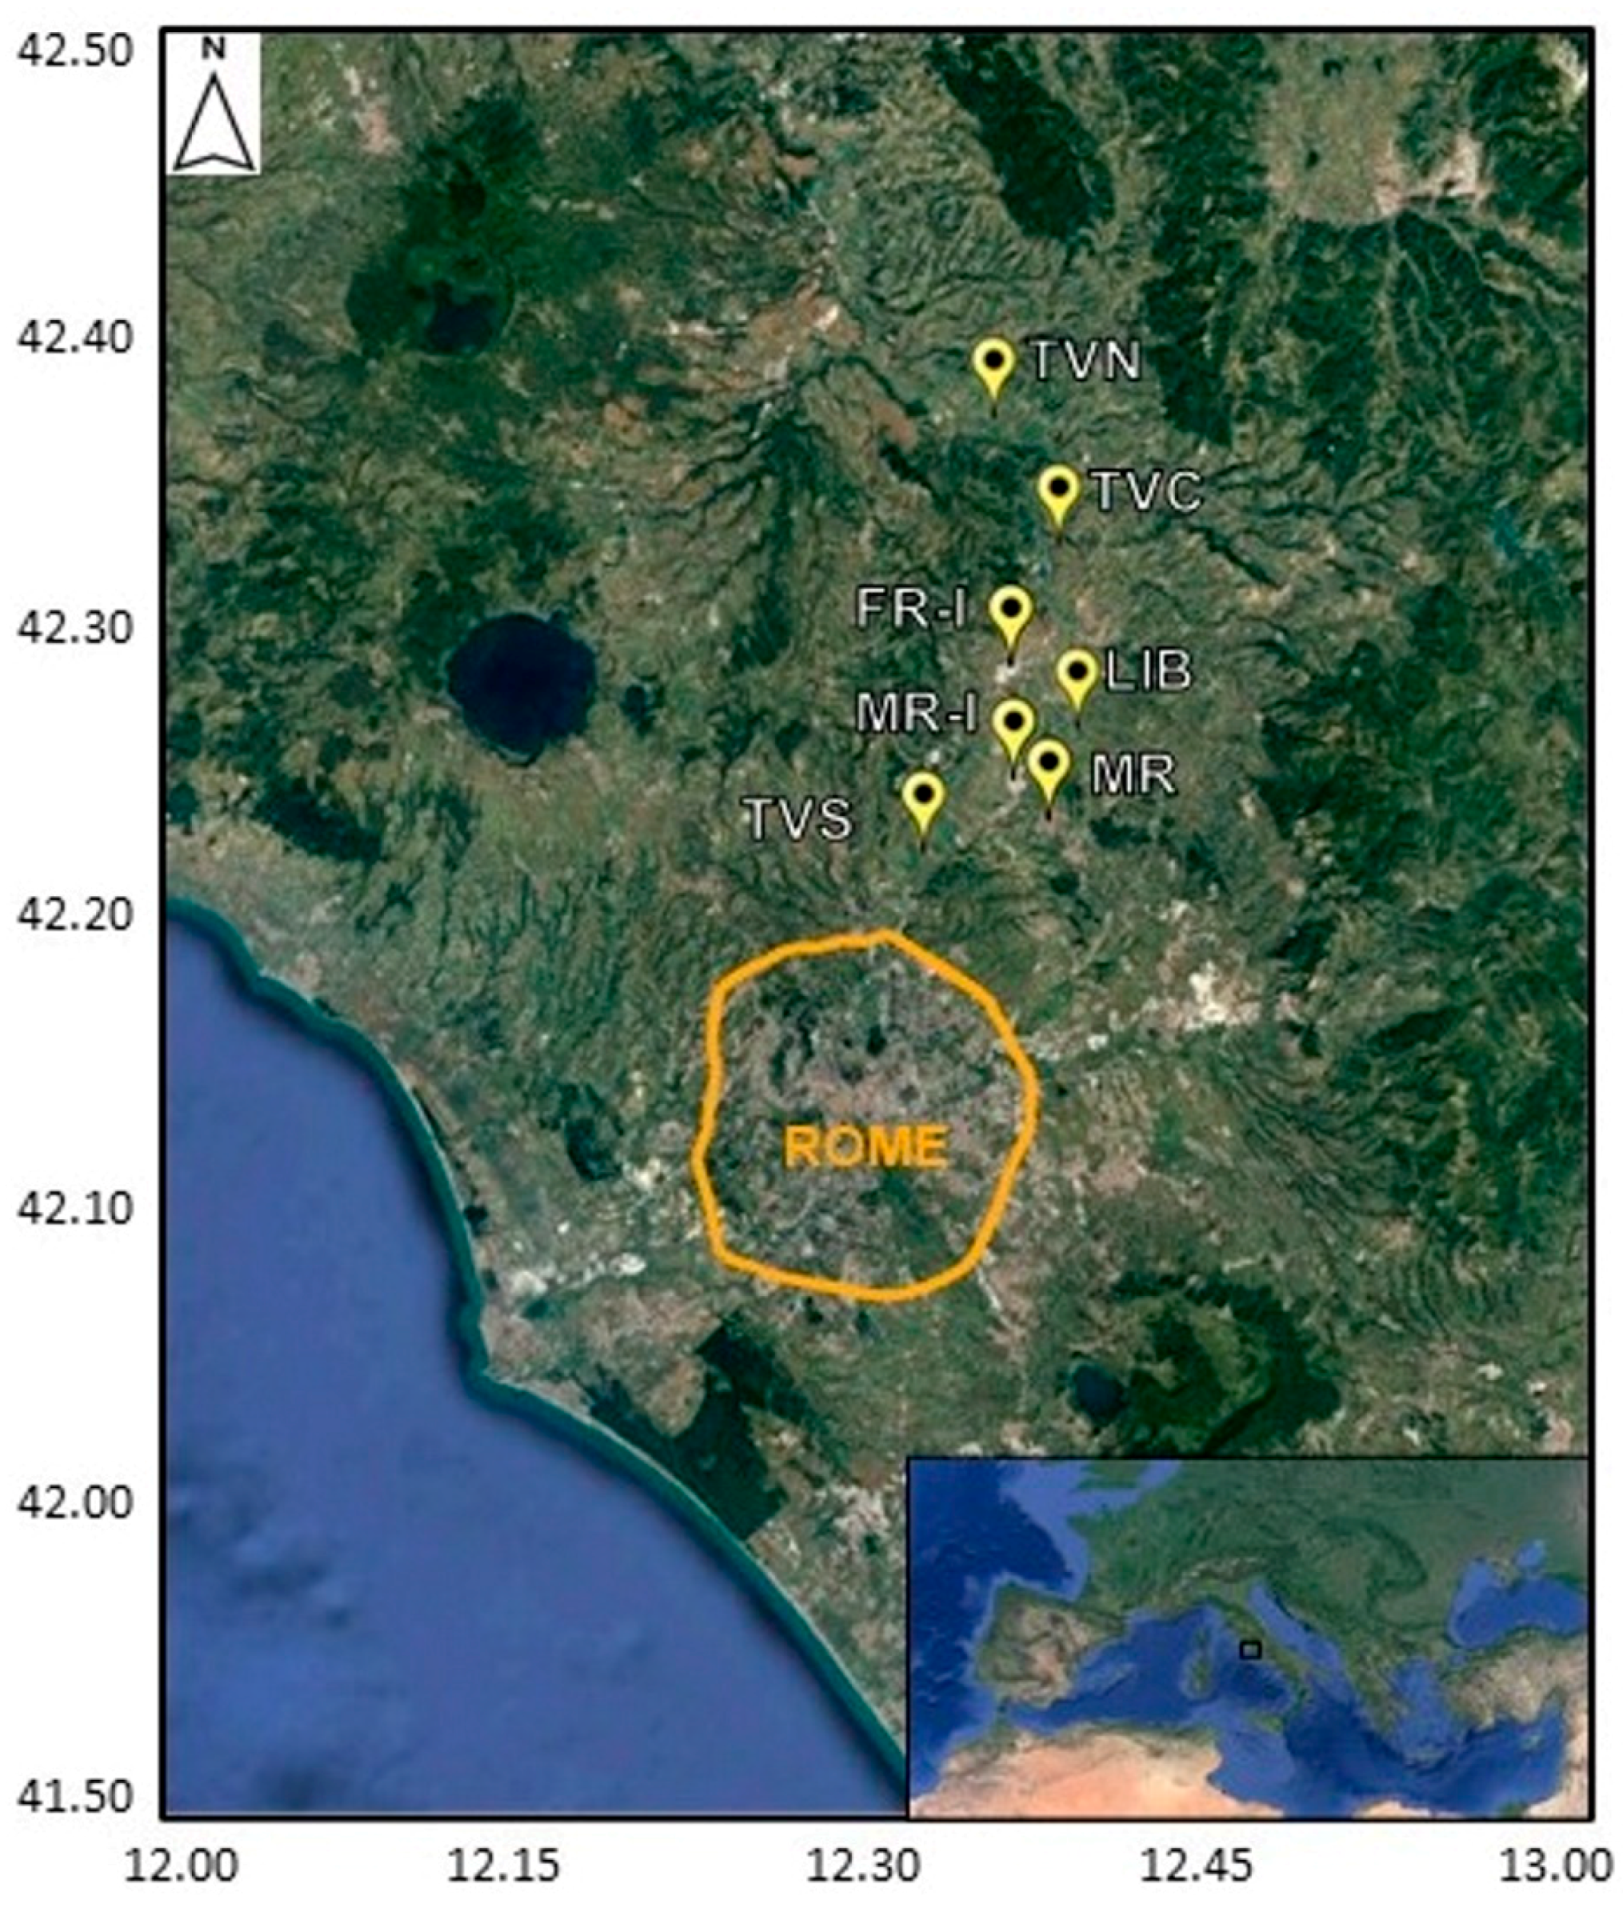
Figure 1. Study area: Rome city (area included into the orange line) and the seven sites (yellow placemarks) along the Tiber Valley chosen to consider cultivated fields and the local emissions sources in urban and industrial sites. The labels represent the sampling sites’ abbreviated names explained in the Section 2.1.
Remotesensing 15 03703 g001
Figure 2. (a) seasonal patterns in NO2 concentrations from the complete dataset of the two instruments combined; (b) seasonal patterns in NO2 concentrations of both instruments with the outliers; (c) surface NO2 concentration analyzer vs. Pandora with colored outliers, green for Pandora and red for analyzer; (d) final seasonal patterns in NO2 concentrations of both instruments screened by the outliers.
Remotesensing 15 03703 g002
Figure 3. Wind roses showing the frequency distributions of wind directions (cardinal direction) and speeds (color scale) at LIB divided by season: (a) winter season; (b) spring season; (c) summer season; (d) autumn season. The radius axis represents the occurrence from 0 to 25% for each season period.
Remotesensing 15 03703 g003
Figure 4. Monthly patterns of NO2 surface concentrations as provided by P138 and by the analyzer for (a) December, January, and February (DJJ); (b) March, April, and May (MAM); (c) June, July, and August (JJA); (d) September, October, and November (SON).
Remotesensing 15 03703 g004
Figure 5. Monthly patterns of (a) UVA radiation; (b) wind speed.
Remotesensing 15 03703 g005
Figure 6. Daily patterns in NO2 concentrations of both instruments for (a) winter season; (b) spring season; (c) summer season; (d) autumn season.
Remotesensing 15 03703 g006
Figure 7. Daily patterns of (a) UVA radiation; (b) wind speed divided by season.
Remotesensing 15 03703 g007
Figure 8. Weekly patterns in NO2 concentrations of both instruments for (a) winter season; (b) spring season; (c) summer season; (d) autumn season.
Remotesensing 15 03703 g008
Figure 9. Weekly patterns of (a) UVA radiation; (b) wind speed divided by season.
Remotesensing 15 03703 g009
Figure 10. Temporal patterns in tropospheric NO2 VCD products from TROPOMI and Pandora at the Liberti Observatory: (a) annual pattern; (b) daily pattern; (c) weekly pattern; (d) monthly pattern.
Remotesensing 15 03703 g010
Figure 11. Temporal patterns in tropospheric NO2 VCD products from TROPOMI for the seven sites selected in the study area: (a) hourly pattern; (b) weekly pattern; (c) monthly pattern; (d) seasonal pattern.
Remotesensing 15 03703 g011
Figure 12. Mapping of the weekly tropospheric VCD over Tiber Valley and Rome by using the TROPOMI product available through the first year of Pandora 138 measurements. The red stars are the seven sites selected for the analysis.
Remotesensing 15 03703 g012
Figure 13. Mapping of the seasonal tropospheric VCD over Tiber Valley and Rome by using TROPOMI product available through the first year of Pandora 138 measurements. The red stars are the seven sites selected for the analysis.
Remotesensing 15 03703 g013
Figure 14. The TROPOMI tropospheric VCD on the seven sites during the events reported in Table 3.
Remotesensing 15 03703 g014
Table 1. Locations of the seven sampling sites and relative labels.
StationLatitude (°) ELongitude (°) N Label
Liberti Observatory (rural)42.1112.64LIB
Monterotondo (residential)42.0612.62MR
Monterotondo (Industrial)42.0812.60MR-I
Fiano Romano (industrial)42.1412.59FR-I
Tiber Valley North (rural)42.2712.57TVN
Tiber Valley Center (rural)42.2112.62TVC
Tiber Valley South (rural)42.0412.53TVS
Table 2. Parameters of the statistical analysis of NO2 concentrations (mol/m3) during the winter, summer, spring, and autumn seasons at the Liberti Observatory.
Before ScreeningAfter Screening
SeasonalParameterPandoraAnalyzerPandoraAnalyzer
DJFCount 11150115011381138
Mean 21.89 × 10−71.87 × 10−71.86 × 10−71.83 × 10−7
Std 39.31 × 10−81.04 × 10−78.82 × 10−89.77 × 10−8
Min 43.62 × 10−81.59 × 10−83.62 × 10−81.59 × 10−8
Max 55.50 × 10−76.27 × 10−74.37 × 10−74.78 × 10−7
MAMCount2051205120251970
Mean1.91 × 10−71.30 × 10−71.87 × 10−71.17 × 10⁻⁷
Std1.04 × 10−71.05 × 10−79.63 × 10−88.34 × 10⁻⁸
Min2.59 × 10−81.57 × 10−82.59 × 10−81.57 × 10−8
Max6.85 × 10−77.74 × 10−74.69 × 10−73.64 × 10⁻⁷
JJACount2525252524912424
Mean1.56 × 10−71.07 × 10−71.52 × 10−79.67 × 10⁻⁸
Std8.87 × 10−88.02 × 10−88.08 × 10−86.38 × 10⁻⁸
Min2.01 × 10−81.66 × 10−82.01 × 10−81.66 × 10−8
Max1.08 × 10−66.55 × 10−73.88 × 10−72.90 × 10⁻⁷
SONCount1878187818481834
Mean1.74 × 10−71.71 × 10−71.69 × 10−71.60 × 10⁻⁷
Std9.05 × 10−81.31 × 10−78.14 × 10−89.40 × 10⁻⁸
Min2.04 × 10−81.66 × 10−82.04 × 10−81.66 × 10−8
Max8.97 × 10−72.41 × 10−64.05 × 10−74.35 × 10⁻⁷
1 number of available data. 2 average of available data. 3 standard deviation of available data. 4 minimum value of data distribution. 5 maximum value of data distribution.
Table 3. Outliers retrieved from the Pandora (P) and analyzer (A) datasets with the daily available TROPOMI tropospheric VCD products and in situ wind speed (WS) and direction (WD) at the Liberti Observatory.
Date (DD/MM/YYYY)Time P (HH:MM)P (mol/m3)Time A (HH:MM)A (mol/m3)Time VCD (HH:MM)VCD (mol/m2)WS(m/s)WD(°)
10 March 202208:375.52 × 10−708:354.32 × 10−712:29:445.91 × 10−51.09326.6
25 June 202207:563.94 × 10−707:553.12 × 10−712:22:343.32 × 10−51.3164.2
5 July 202205:563.96 × 10−705:553.51 × 10−712:35:166.10 × 10−50.26194.4
07:184.31 × 10−707:154.08 × 10⁻⁷ 1.80229.2
07:354.69 × 10−707:353.31 × 10⁻⁷ 1.35283.1
07:525.01 × 10−707:503.48 × 10⁻⁷ 1.43222.7
08:224.09 × 10−708:203.38 × 10⁻⁷ 2.20226.7
28 July 202205:243.98 × 10−705:203.08 × 10−712:03:595.43 × 10⁻⁵
05:554.60 × 10−705:553.14 × 10⁻⁷
06:124.44 × 10−706:103.37 × 10⁻⁷
12 August 202205:364.42 × 10−705:353.48 × 10−712:22:523.47 × 10−51.98356.4
21 November 202213:295.29 × 10−713:254.46 × 10−712:29:566.17 × 10−52.35215.3
17 February 202308:335.37 × 10−708:306.27 × 10−711:40:513.99 × 10−50.80294.9
Disclaimer/Publisher’s Note: The statements, opinions and data contained in all publications are solely those of the individual author(s) and contributor(s) and not of MDPI and/or the editor(s). MDPI and/or the editor(s) disclaim responsibility for any injury to people or property resulting from any ideas, methods, instructions or products referred to in the content.