Abstract
Statistically homogeneous pixel (SHP) selection is an important process in the distributed scatterer interferometric synthetic aperture radar (DS-InSAR) approach. However, prevalent methods struggle to appropriately balance the efficiency and accuracy of selection. To solve this problem, the authors of this study improved the Hypothesis Test of Confidence Interval (HTCI) to propose an adaptive method to select the level of saliency and confidence interval for the HTCI, called Adp-HTCI. The proposed method can accurately select homogeneous pixels while inheriting the high efficiency of the HTCI. Once homogeneous pixels have been chosen, the eigenvalue decomposition of the covariance matrix is used to optimize their phase and perform temporal processing. We used the proposed method along with data on 31 scenes from the Sentinel-1 satellite from 2 June 2021 to 28 May 2022 to monitor the deformation of the surface of the fire zone in the Sikeshu coalfield. The selection results of homogeneous pixels indicate that the proposed Adp-HTCI algorithm can increase the number of selected homogeneous pixels while ensuring the accuracy of the selection results, thereby enhancing the estimation accuracy and reliability of subsequent parameter solving. The DS-InSAR results showed that the cumulative maximum subsidence in the study area within a year reached—138 mm and the point density used by the DS-InSAR approach was 17.28 times higher than that used by the StaMPS approach. The results of cross-analysis with the results of StaMPS verified the accuracy of the DS-InSAR-based approach.
1. Introduction
Coal-seam fire generally refers to underground and near-surface fires in coal mines as well as conflagrations of coal piles and coal gangue dumps [1]. As a global environmental problem, coal fires have a significant negative impact on the ecological environment, infrastructure, and the safety of coal mining [2]. The combustion caused by such fires consumes a large amount of coal. It can lead to the formation of an underground combustion goaf that renders the area susceptible to geological accidents, such as landslides, structural collapse, and fissures [3,4]. The combustion of coal releases toxic gases and emits a large amount of heat that degrades the ecological environment [5,6].
The current common methods for coal fire detection mainly include field surveys, drilling, geophysical exploration, geochemical exploration, and remote sensing detection. Geophysical exploration methods mainly include transient electromagnetic, resistivity detection, radio waves, and ground-penetrating radar detection. Geochemical exploration methods mainly include dual-element tracer methods and radon gas detection. Remote sensing methods are mainly divided into thermal infrared remote sensing detection, multispectral remote sensing detection, and synthetic aperture radar interferometry. The first four methods often require manual carrying of related equipment for on-site surveys, which consumes significant manpower and resources. Additionally, there is a certain level of risk involved in the detection process. The remote sensing method possesses advantages such as a large monitoring area and short cycle, which compensates for the shortcomings of traditional coal fire detection techniques. Coal fire hazards can cause surface subsidence and cracks that cannot be captured by thermal infrared remote sensing. Interferometric synthetic aperture radar (InSAR) technology can calculate the subsidence in coal fire areas and provide data support for subsequent coal fire management. InSAR technology has the advantages of wide coverage, a short duration, and all-day and all-weather monitoring [7,8], which effectively compensates for the limitations of traditional measurement methods (leveling, GPS, total station measurement, etc.) in terms of high workload, high cost, and sparse measurement points [9]. As an advanced earth observation technique, differential InSAR (D-InSAR) technology has been widely used to monitor surface deformations [10,11]. However, this technology is susceptible to spatio-temporal decorrelation and atmospheric delay and thus struggles to obtain highly precise surface deformations in a long time series [12]. DS-InSAR technology has been developed to solve the problem of the sparseness of the monitoring points caused by the spatio-temporal decoherence of the area of interest [13].
In contrast to the physical attributes of Persistent Scatterer (PS) targets, Distributed Scatterer (DS) targets are susceptible to factors such as temporal and spatial decorrelation, leading to inconsistent quality of interferograms. Therefore, prior to deformation analysis, DS targets need to be screened and optimized to improve signal-to-noise ratio and reduce error propagation probability. Unlike traditional time-series InSAR methods, DS-InSAR introduces two additional steps: homogeneous pixel selection and phase optimization. The former serves as a guarantee for the latter and is the core of DS-InSAR technology. Homogeneous pixel selection is an algorithm that employs statistical inference to measure the similarity between neighboring pixels and a central pixel. Under the assumption that pixels belonging to the same type of land cover exhibit similar backscattering properties and share the same phase scattering center, gathering similar pixels for parameter estimation can enhance the signal-to-noise ratio and maintain image resolution. This approach is particularly suitable for precise deformation monitoring in complex scenes. Therefore, the correct selection of homogeneous pixels is crucial in the DS-InSAR method. Numerous researchers have conducted studies on DS-InSAR techniques. In the backdrop of the problem whereby the KS test incurs a large error when only a small number of samples are available, Goel and Adam proposed the Anderson–Darling (AD) test to identify homogeneous pixels [14]. Jiang et al. applied the BWS test to homogeneous pixel recognition in 2014 and used the KS, BWS, and CM tests to propose the fast, homogeneous pixel recognition (FaSHP) and the HTCI in 2015 and 2018, respectively. The core of the algorithm is to transform the hypothesis test problem into estimating the confidence interval and to identify homogeneous pixel points based on the similarity between data on pixels of the given image and the reference points in the time series [15,16]. Fan et al. improved the HTCI by using the Moravec operator to calculate the squared sum of the mean difference between the intensities of the time series of the central pixels in the vertical, horizontal, diagonal, and anti-diagonal directions to determine the confidence interval [17]. Such methods of phase optimization, such as maximum likelihood estimation [18], eigenvalue decomposition [19], and filtering, are used to reduce noise and improve the quality of the phase.
Coal fire areas usually experience significant changes in overlying rock structure, surface cover, and soil characteristics due to high-temperature combustion. The lack of coherence in coal fire areas makes it challenging for traditional time-series InSAR techniques to comprehensively and accurately characterize surface deformation. However, DS-InSAR technology effectively addresses the issue of insufficient monitoring point density in low-coherence areas over long periods. DS-InSAR technology has been used to monitor surface deformation in areas with coal fires. Liu et al. used it to process data on 38 scenes of the fire zone in Xinjiang Miquan from the Sentinel-1 satellite from 2015 to 2017 and obtained information on long-term surface deformation. Their results showed that the density of monitoring points of the DS-InSAR was 124 times higher than that of the PS-InSAR, and it could be used to accurately characterize details of the trend of settlement in the fire zone [20]. In 2022, Li et al. used the DS-InSAR to process 63 scenes of the fire zone in the Wuda coalfield area obtained from Sentinel-1 from 2017 to 2019 and calculated the long-term surface deformation of the area. The density of monitoring points, in this case, was 1.24 times higher than that of the temporarily coherent point InSAR (TCP-InSAR) [21].
Although DS-InSAR technology provides accurate monitoring, it is affected by changes in objects on the ground and their temporal decoherence. For example, fixed confidence intervals are unsuitable for distinguishing between objects on the ground when selecting homogeneous pixels. Therefore, the authors of this paper propose an improved HTCI method to adaptively select the confidence interval, called Adp-HTCI, that makes full use of information on the intensity of each pixel in a fixed window to adaptively construct the confidence interval and thus improve the accuracy of selection of homogeneous pixels. The eigenvalue decomposition of the covariance matrix is used to optimize the phase and improve its quality. The results of experiments showed that the improved DS-InSAR approach could accurately reflect the surface deformation in areas with coal fires, which is important for determining their spatial distribution, state of combustion, and evolution. It can also provide technical support for the early warning and prevention of coal fires.
The structure of this article is as follows: after the introduction, Section 2 presents the study area. Section 3 introduces the existing methods for SHPs selection as well as the improved method proposed in this paper. Section 4 showcases the results of SHPs selection and surface deformation monitoring in the coal fire area. Section 5 and Section 6 are discussion and conclusion, respectively.
2. Study Area and Datasets
2.1. Study Area
As is shown in Figure 1, the Sikeshu coal mine in Wusu is located at the northern foot of the Tianshan Mountains and the southern margin of the Junggar Basin in Xinjiang, China. It is 32 km south of Wusu City. The mining area belongs to the Junggar–North Tianshan coal-bearing area, which is the main base of coal production in the Wusu–Kuitun–Dushanzi Golden Triangle. The center of the area of the coalfield on fire is located at 84°32′12″E and 44°10′16″N. A fire broke out on the surface of the mine as early as the 1990s. It has gradually spread since, and the scale of the area on fire has been expanding in recent years such that a large area of the coalfield is now on fire.
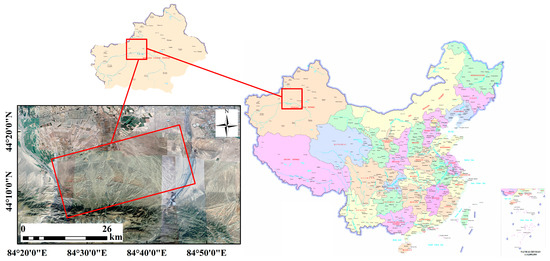
Figure 1.
Geographic location of the study area.
2.2. Experimental Data
We used data on a total of 31 single-polarization (VV) scenes captured by Sentinel-1 from 2 June 2021 to 28 May 2022 to monitor the deformation of the surface of the area of the Sikeshu coalfield on fire. Each image had a size of 5500 × 1000 pixels. The image obtained on 11 December 2021 was selected as the main image and was combined with other images to form 30 pairs of interference images. The SRTM digital elevation model (DEM) with a resolution of 30 m was used as the external DEM data.
3. Methods
3.1. Approach to SHP Selection
3.1.1. KS Test
The KS test is used to determine whether acquired samples are similar by calculating the maximum difference between cumulative probability distribution functions [22]. Assuming that the cumulative probabilistic distribution functions of information on the intensities of the reference pixel and its neighborhood pixel in the temporal dimension are and , respectively, the null hypothesis and the alternative hypothesis of the KS test can then be given as
Then, the maximum distance between the intensities of the sample pixels can be calculated as follows:
The value of D thus obtained is used as the supremum of the hypothesis test. The regions of rejection at different levels of significance can then be expressed as
is the quantile of the distribution obtained by the KS test and N is the number of samples of the time series of SAR images. When D falls within the region of rejection, the null hypothesis is rejected, and the two samples are considered to be statistically significant. Otherwise, the original hypothesis that there is no significant difference between the pixels is accepted, and the relevant points are identified as homogeneous.
3.1.2. BWS Test
Based on the KS test, the BWS test uses the square of the difference in the cumulative empirical distribution and the weight. Because the real distribution of the sample is unknown, the rank approximation is used to weigh it [17]. The reference pixel and a pixel in its neighborhood can be expressed as
and represent the corresponding ranks of the merged reference pixel and the pixel in its neighborhood to be estimated, respectively, and B is a new sample statistic.
3.1.3. GLRT Test
Assuming that the single-look complex image of the radar satisfies the complex circular Gaussian distribution [23], the amplitude of the temporal information of any pixel P satisfies the Rayleigh distribution:
The analysis of the significance of the variances of the two sample data, P1 and P2, can be used to identify the homogeneous pixels. The null hypothesis is and the alternative hypothesis is . In the framework of the generalized likelihood ratio, the test statistic G can be expressed as
where and correspond to the variances in the amplitudes of the two time-series samples P1 and P2, respectively, represents the variance after they have been merged into a single sample, and the length of this sample is N.
3.1.4. HTCI
The HTCI method [22,24] assumes that the intensity I of a pixel obeys an exponential distribution. Under this premise, the similarity between the reference pixel and other pixels to be estimated in the window is compared one by one through hypothesis testing.
The method first averages the intensity values in the temporal dimension of the time-series SAR images and then sets the average value as the true value of the intensity of the pixel at this position. The unbiasedness of the likelihood ratio test is then used to control for Type-I errors. We should try to use a small window in the test to obtain the set of initial values of the homogeneous points while reducing Type-II errors. Assuming that there are N scenes of time-series data on SAR images, the default number of samples is set to N. Then, the intensities of the reference pixel and the pixel to be estimated in the window are independent random variables that obey an exponential distribution: and . The null hypothesis and the alternative hypothesis can then be expressed as
According to the relationship between the exponential distribution and the chi-square distribution, we can obtain and . It has 2N degrees of freedom and yields the following further derivation:
The above formula shows that assuming that H0 has been established, the ratio of the mean intensity of the reference pixel to those of other pixels to be estimated in the window in the temporal dimension satisfies the distribution F, with (2N, 2N) degrees of freedom. Its estimated interval can then be expressed as
Having obtained the initial value of the SHP, the values in the set are averaged to obtain the estimated value of the reference pixel. When only a medium or small number of samples of time-series SAR images are available, the Gaussian hypothesis cannot be used to approximate the true distribution. However, the cumulative sum satisfies the gamma distribution G according to the exponential distribution of the intensity of the SAR images, and the HTCI can be used to obtain a more accurate interval based on it to further control Type II errors:
In the above formula, is the quantile of the gamma distribution, is replaced by the estimated value of the reference pixel, and is the mean intensity of other pixels in the window in the temporal dimension.
3.2. HTCI with Adaptive Selection of the Confidence Interval
Although the HTCI method can improve computational efficiency and reduce the occurrence of Type II errors, it chooses a smaller number of homogeneous pixels than otherwise and cannot reduce Type I errors. The level of significance is directly given when the HTCI is tested and is usually set to =0.05. However, the level of significance directly determines the size of the confidence interval. It reflects the reliability of interval estimation, which plays a very important role in the selection of homogeneous pixels. When selecting homogeneous pixels one by one from SAR images, the strength of the scattering signal of each pixel, the corresponding ground-related feature, and the homogeneity between the pixel in each neighborhood and the reference pixel in a fixed window may be different. It is thus unreasonable to use the given level of significance at this time. The key to solving the problem is to select the most appropriate confidence interval according to each pixel.
To solve the above problem, Fan et al. proposed a dynamic confidence interval-based HTCI, but this algorithm considers only pixels in the 45° interval around the central pixel and does not fully use information on pixel intensity in the fixed window. We propose an HTCI method that adaptively chooses the confidence interval and uses a small window to utilize information on the intensities of all pixels in a fixed window.
As is shown in Figure 2, the size of the fixed window used for pixel selection is . The red square denotes the central pixel, and its intensity is assumed to be . The average intensities of pixels in the window are added:

Figure 2.
Diagram of window for pixel selection (eight windows are shown by blue or yellow box, the red box is reference point).
In the above, is the sum of intensities of pixels in the eight windows, represents the center pixel in the th row and the th column, and the maximum weight of the sum of intensities of the eight windows is used as the level of significance. The range of weights of the maximum value is . The significance level is typically set to . We multiply the range of weights by a constant so that the range of the final significance level is :
The significance level of the HTCI is fixed in the interval using the improved HTCI method. Changes in the objects on the ground can be preliminarily judged according to the intensities and weights of pixels around each central pixel, and a more appropriate level of significance and confidence interval can then be selected. The D-HTCI calculates the level of significance by calculating the sum of the square of differences in the mean intensities of pixels in the four directions. However, the central pixel is used as the reference point for the vertical, horizontal, diagonal, and anti-diagonal directions in the fixed window. The pixels contained in the window are reciprocally directed such that their orientation is not sufficiently clear. Adjacent pixels are likely to be heterogeneous objects. At this time, the sum of the square of the difference in pixel intensity cannot reasonably be used to represent the true distribution of the heterogeneous pixels. The method proposed in this paper is based on the sum of the intensities of all pixels in a fixed window that also contains the central pixel oriented in a certain direction. This method emphasizes direction and can thus reflect the changes in a small range of objects such that reasonable values of the level of significance and the confidence interval can be selected. When the weight of a small window in a fixed window is large, this reflects significant changes in the types of objects on the ground around the central pixel in the given direction. Selecting a reasonable level of saliency here can improve the accuracy of the selection of the homogeneous pixels.
3.3. Phase Optimization Using Eigenvalue Decomposition
According to the characteristics of the spatial correlation among objects on the ground, N scenes of time-series SAR images are often assumed to obey the complex circular Gaussian distribution with a zero mean. The probability density function of the observation vector of any pixel p in the time-series SAR images can then be expressed as [25]:
where is the covariance matrix of any pixel p in the observation vector of the SAR image, represents the determinant operation of the matrix, and H is the Hermitian conjugate transpose. The complex covariance matrix obtained by the maximum likelihood estimation of the sample is defined as follows:
where denotes the set of homogeneous pixels in a window of a certain size that is centered on any pixel p, and M represents the number of homogeneous pixels. The complex covariance matrix is obtained by the conjugate multiplication of the observation vectors of the set of selected homogeneous pixels, and taking the mean value yields information on phase interference in all interference pairs. Information on the signals representing different characteristics of scattering is separated by the eigenvalue decomposition of the covariance matrix of each pixel, and different eigenvalues correspond to scattering signals with different intensities. The maximum eigenvalue and its corresponding eigenvector are taken as the dominant scatterer, and the remaining phases are directly filtered out as noise to optimize the phase.
3.4. Data Processing
The experiments in this study were based on the steps below. Figure 3 shows the flowchart.
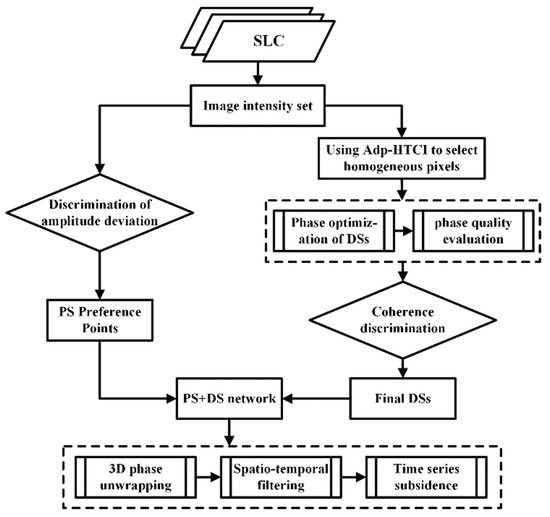
Figure 3.
Flowchart of data processing.
- (1)
- The sequence of intensities of SAR images was obtained by GAMMA software, and the PS points were selected beforehand by setting a threshold for the deviations in their amplitudes.
- (2)
- We used the proposed Adp-HTCI method to identify homogeneous pixels and used those with values greater than 20 as the pre-selected DS points.
- (3)
- The covariance matrix of the pixels was obtained from the selected homogeneous pixels, and the optimized differential interference phase was obtained by its eigenvalue decomposition.
- (4)
- Following phase optimization, the quality of the optimization was evaluated to determine the temporal coherence of the DS points and a threshold of coherence was set to select the final DS points.
- (5)
- The final PS points were combined with the DS points to obtain the joint set of PS and DS points.
- (6)
- The rate and results of the time series of deformation of the study area were calculated by using the processing flow of StaMPS.
4. Results and Analysis
4.1. Results of SHP Selection
The Xuzhuang mining area in Peixian, Xuzhou, China and the Sikeshu coalfield fire area in Wusu, Xinjiang, China, were selected as research areas for SHP selection. Once the image had been geographically registered, the window to choose the SHPs was set to , and the BWS test, KS test, GLRT test, HTCI method, D-HTCI method, and the Adp-HTCI method proposed in this paper were used in the experiments.
Figure 4a shows the map of the time series of the average intensity of pixels in the image of the Xuzhuang mining area, and Figure 4b shows that of the fire zone in the Sikeshu coalfield in Wusu. Figure 5 and Figure 6 show the number distribution of homogeneous pixels selected using the above-mentioned six methods in the neighborhood of each pixel.
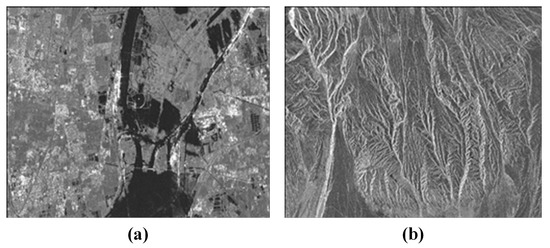
Figure 4.
Diagram of the time series of the average intensity of the pixels: (a) Xuzhuang mining area in Xuzhou. (b) Fire zone in the Sikeshu coalfield in Wusu.
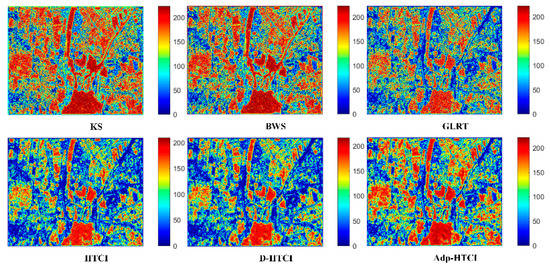
Figure 5.
SHP selection results of the mining area.
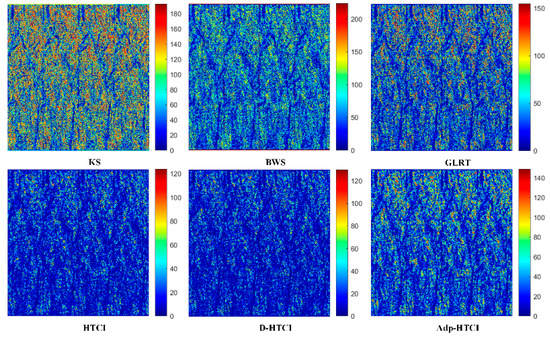
Figure 6.
SHP selection results of the coal fire area.
Figure 7a shows farmland or bare land, where a significant number of homogeneous pixels can be selected. Figure 7b shows buildings where the count of selected homogeneous pixels is relatively low. Figure 7d depicts water bodies where a higher number of homogeneous pixels can be selected. Figure 7e displays the bridge’s road; the corresponding selection result indicates a lower count of homogeneous pixels in that location. According to the analysis, the following conclusions can be drawn: the number of chosen homogeneous pixels was small in images with more buildings, such as urban and rural settlements, while more homogeneous pixels were chosen in images of areas such as farmland and bare land. This is because there were more persistent scatterers in images of the former, resulting in a small number of homogeneous pixels, while areas such as the latter had weaker scattering and more distributed targets and, therefore, more homogeneous pixels. Figure 8 shows that because the area with ongoing coal fire was located in a desert containing bare rocks that led to strong scattering, only a small number of homogeneous pixels could be selected. The KS and BWS methods selected more homogeneous points than both HTCI methods, but their results were rough. The HTCI method had a high rejection ratio. The incidence of Type II errors was reduced to improve the accuracy of the selection of homogeneous pixels, but this came at the cost of fewer selected pixels. The BWS and KS methods chose a large number of homogeneous pixels but incurred large values of the Type II error. The set of the selected homogeneous pixels thus contained heterogeneous samples.
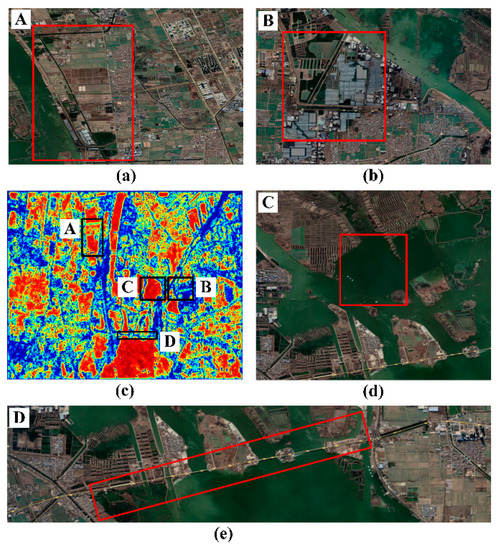
Figure 7.
Selection of homogeneous pixels for different land cover types in mining area (the red-black box with same capital letters represent a one-to-one amplification relationship): (a) Farmland. (b) Buildings. (c) SHP selection results. (d) Water. (e) Bridge road.
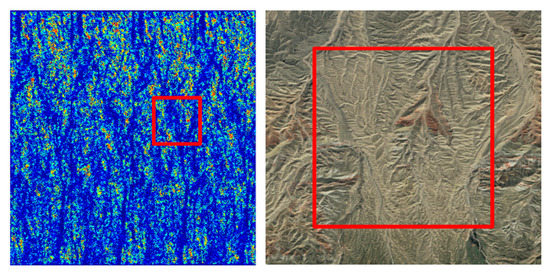
Figure 8.
Selection of homogeneous pixels for land cover type in coal fire are.
4.2. Comparison of Approaches to SHP Selection
In this section, we compare and analyze the six methods of choosing homogeneous pixels: the KS test, BWS test, GLRT test, HTCI method, D-HTCI method, and the proposed Adp-HTCI method.
In the table, Time(s) refers to the runtime of the program. SHP > 20 refers to the total number of reference pixels with more than 20 homogeneous pixels. The mean value refers to the sum of the number of homogeneous pixels for all pixels in the image divided by the total number of image pixels.
Table 1 and Table 2 compare the performance of the six methods on images of two regions. When extracting homogeneous pixels from the same area, the KS and BWS tests incurred a long execution time and had poor efficiency, while the GLRT test and the HTCI method had a higher efficiency of calculation. Because the HTCI method could more easily identify heterogeneous pixels, it had the lowest mean value of homogeneous pixels in the entire image. The KS and BWS tests had a large number of mean homogeneous pixels. This also verifies the results of the distribution shown in Figure 5, 6. The results of statistical comparisons showed that the selection made by the D-HTCI method was unstable. Compared with the HTCI and D-HTCI methods, the proposed Adp-HTCI method obtained a significantly larger number of homogeneous pixels while maintaining the Type II error.

Table 1.
Statistical comparison of algorithms to choose homogeneous pixels from images of the mining area. (1000 × 800 pixels).

Table 2.
Statistical comparison of algorithms to choose homogeneous pixels from images in the coal fire area. (1100 × 1000 pixels).
To more intuitively examine the advantages and disadvantages of the six methods for choosing homogeneous pixels, we chose pixels for visualization-based analysis. The pixels at (774, 138) and (702, 745) in Figure 4a and at (865, 271) in Figure 4b were selected as the reference points, and the window size was set. The results of the six methods are shown in Figure 9, Figure 10, Figure 11 and Figure 12:
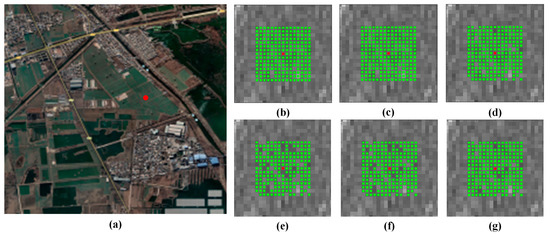
Figure 9.
The results of SHP selection at reference point (702, 745) in Figure 4a (the red dots represent reference pixels, the green dots represent the statistically homogeneous pixels): (a) The location of reference point. (b) KS. (c) BWS. (d) GLRT. (e) HTCI. (f) D-HTCI. (g) Adp-HTCI.
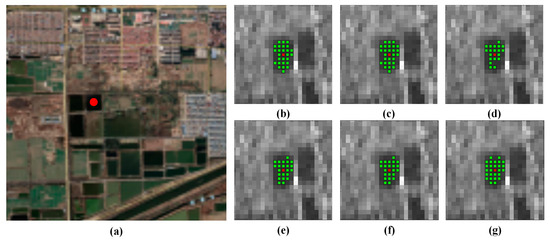
Figure 10.
The results of SHP selection at reference point (774, 138) in Figure 4a (the red dots represent reference pixels, the green dots represent the statistically homogeneous pixels): (a) The location of reference point. (b) KS. (c) BWS. (d) GLRT. (e) HTCI. (f) D-HTCI. (g) Adp-HTCI.
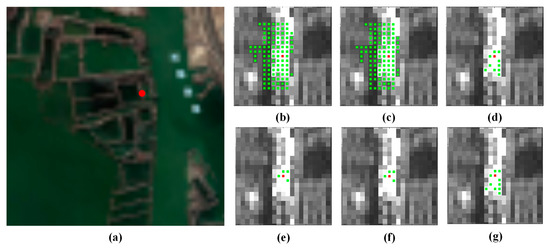
Figure 11.
The results of SHP selection at reference point (650, 446) in Figure 4a (the red dots represent reference pixels, the green dots represent the statistically homogeneous pixels): (a) The location of reference point. (b) KS. (c) BWS. (d) GLRT. (e) HTCI. (f) D-HTCI. (g) Adp-HTCI.
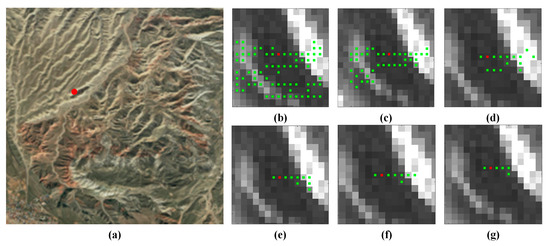
Figure 12.
The results of SHP selection at reference point (139, 77) in Figure 4b (the red dots represent reference pixels, the green dots represent the statistically homogeneous pixels): (a) The location of reference point. (b) KS. (c) BWS. (d) GLRT. (e) HTCI. (f) D-HTCI. (g) Adp-HTCI.
Figure 9 shows the homogeneous pixel selection results for the farmland area. Due to the weak scattering characteristics of farmland regions, which are mostly distributed scatterers, a higher number of homogeneous pixels can be selected. It is clear that all six methods selected a significant number of homogeneous samples. Because the HTCI method incurred a large Type I error, it chose a slightly smaller number of homogeneous pixels than the non-parametric KS and BWS tests. Figure 10 shows the homogeneous pixels selection results for the water. It can be seen that the proposed Adp-HTCI method outperforms the other five methods, as it is capable of capturing the complete outline of the water. Figure 11 and Figure 12 show the homogeneous pixels selection results for the road adjacent to the fishpond and the desert area, respectively. When the heterogeneity was significant, the KS and BWS tests generated incorrect selections, and the Type II error was large. Although the HTCI method was better able to identify heterogeneity, this came at the cost of the rejection of a large number of homogeneous pixels such that its Type I error was large. The proposed Adp-HTCI method was able to avoid incorrect selection to a greater extent than the other methods and chose a larger number of homogeneous pixels while maintaining the computational efficiency of the original HTCI method.
In summary, the Adp-HTCI method used information on the intensity of pixels around the central pixel to adaptively change the level of significance and the confidence interval to reduce the Type I error and improve the number of homogeneous pixels.
4.3. Analysis of the Results of the Subsidence of the Fire Area in Sikeshu Coalfield
4.3.1. Subsidence
The experiments were carried out according to the process described in Section 3.4. Homogeneous pixels were selected using the proposed Adp-HTCI. Following the construction of the coherence matrix, the phase was optimized by its eigenvalue decomposition. Finally, the noise and the deformation phases were separated based on the principle of StaMPS technology, and three-dimensional (3D) phase unwrapping was carried out to obtain the cumulative settlement of the surface in the study area.
Figure 13 and Figure 14 show the cumulative subsidence of the surface of the area with a coal fire in the Sikeshu coalfield in Wusu from June 2021 to May 2022, as obtained by the StaMPS and the DS-InSAR method, respectively. The StaMPS method selected 29,606 PS points, and the DS-InSAR method selected 511,712 DS points. There was thus prominent subsidence in the surface of the area. These observations, when combined with past reports, led us to conclude that the center of the area on fire had significant subsidence.
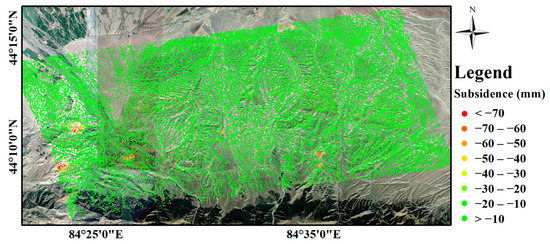
Figure 13.
Subsidence in the study area (StaMPS).
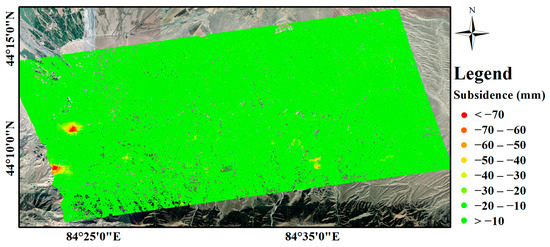
Figure 14.
Subv bsidence in the study area (DS-InSAR).
4.3.2. Comparison and Verification of Results of StaMPS-Based Monitoring
To compare the results of monitoring the DS-InSAR and the StaMPS methods in more detail, we set the same monitoring points obtained by the two techniques as homonymous points and compared them in terms of the cumulative deformation of these points. A total of 4101 pairs of homonymous point targets were selected in the experiment. The correlation and distribution of errors and their results of deformation are shown in Figure 15.
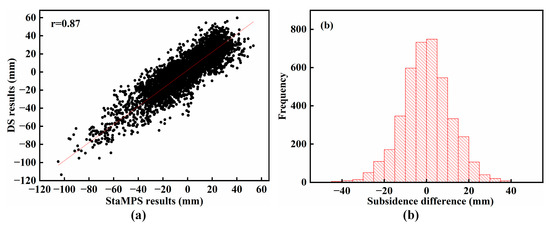
Figure 15.
Comparison of results of subsidence using homonymous points: (a) correlations in the results of subsidence; (b) histogram of error distribution.
Figure 15a shows that the results of deformation obtained by the two methods at the same point were consistent with a Pearson’s correlation coefficient of 0.87, which indirectly proves the reliability of the results of DS-InSAR. It is clear from Figure 15b that the difference between the methods in terms of the cumulative deformation at the same point obeyed the normal distribution and thus conformed to the characteristics of accidental error. The results of the deformation of 2616 homonymous points were smaller than ±10 mm, accounting for 63.7% of the total. A total of 3756 homonymous points had deformations smaller than ±20 mm, accounting for 91.4% of the total. These results show that the deformations obtained using StaMPS were generally consistent with the results of monitoring obtained by DS-InSAR. However, combining these results shows that DS-InSAR obtained 17.28 times more monitoring points than StaMPS, which significantly improved the density of monitoring points in the area with ongoing coal fire that had undergone subsidence. Its results of deformation were thus theoretically more reliable.
4.3.3. Subsidence of the Surface at the Center of the Coal Fire
The center of the area of the coal fire in the Sikeshu coalfield was located at 84°32′12″E and 44°10′16″N, corresponding to the red box in Figure 16. The right side shows an enlarged map of the area with subsidence.
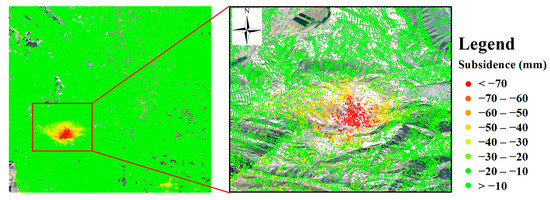
Figure 16.
Location of the center of the area on fire with subsidence.
To analyze the trend of change in the subsidence of the surface at the center of the area with coal fire, we constructed three profiles—A1A2, B1B2, and C1C2—as shown in Figure 17a,b. The PS points and DS points selected along the same profile line are displayed in the same plot. From Figure 17c–e, it can be observed that the trends of PS points and DS points are largely consistent, and the maximum subsidence values are similar, further validating the reliability of the improved DS-InSAR method. However, the low monitoring point density obtained by the StaMPS method cannot fully characterize the subsidence at the center of the coal fire area. Therefore, the following analysis will be based on the DS-InSAR monitoring results.
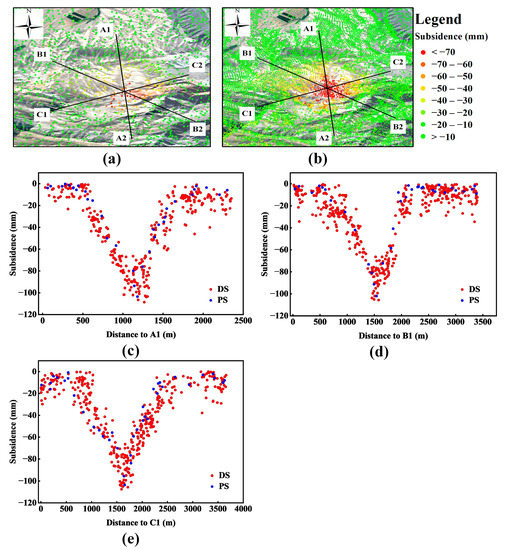
Figure 17.
The characteristics of subsidence of the center of the fire area: (a) The location of profiles in StaMPS results. (b) The location of profiles in DS-InSAR results. (c) The comparison of StaMPS and DS-InSAR in profile A1A2. (d) The comparison of StaMPS and DS-InSAR in profile B1B2. (e) The comparison of StaMPS and DS-InSAR in profile C1C2.
Figure 17c–e shows the cumulative distribution of settlement in a 100 m buffer zone along A1A2, B1B2, and C1C2. The image shows a symmetrical distribution on the A1A2 profile line, and starting at a distance of 600 m from point A1, the settlement increased uniformly with the distance to A1. The cumulative settlement reached its maximum value of −108.6 mm at a distance of 1266 m from point A1 and subsequently decreased uniformly with a further increase in the distance. The settlement area was roughly in the range of 600–1800 m from A1. The cumulative settlement reached its maximum value of −105.6 mm when it was 1578 m from point B1 on the line of profile B1B2, and its characteristics of distribution were similar to those of A1A2. The settlement area was roughly in the range of 800–2000 m from B1. The cumulative settlement reached its maximum value of −107.4 mm at a distance of 1590 m from point C1 on the line of profile C1C2, and its characteristics of distribution were similar to those of A1A2 and B1B2. The subsidence area was roughly in the range of 800–2600 m from C1. It is clear that the distribution of points on the three profiles was similar. The settlement area had a standard elliptical conic distribution. Its long axis was about 1800 m, and its short axis was about 1200 m. The settlement was the largest in the center, reaching −108.6 mm. Owing to the continuous combustion of underground coal seams, a combustion space was formed below the surface of the center of the area with the coal fire that caused the overlying stratum to slip and collapse, leading to the formation of a large number of cracks on the surface. Contact between the underground coal seams and air increased and promoted the development and spread of coal fires deep underground, resulting in long-term subsidence of the surface in the area.
5. Discussion
This paper proposes improvements to the DS-InSAR approach, focusing on the SHP selection. The authors introduce an adaptive confidence interval selection algorithm called Adp-HTCI and apply the improved DS-InSAR approach to monitor surface subsidence in Sikeshu coal fire areas. To demonstrate the universality of the proposed algorithm, the study areas include a mining area in an urban region and a coal fire area in a desert region with different geological conditions. The results of six different homogeneous pixel selection methods are compared. To provide a visual representation of the homogeneous pixel selection results, selected farmland areas, bridge roads, water and mountain areas are shown in local enlargements. The DS-InSAR approach is utilized to obtain the surface subsidence information for the Sikeshu coal fire areas from June 2021 to May 2022, and a correlation analysis is performed on the subsidence at the center of the coal fire area. The reliability of the improved DS-InSAR approach is validated by comparing it with the monitoring results obtained using the StaMPS method.
The paper presents six homogeneous pixel selection methods, five being existing methods and one the proposed method. KS and BWS tests are non-parametric methods that do not require assumptions about the distribution of samples. They have a distinct advantage when significant temporal variations exist in the study area. However, these methods have lower efficiency and larger Type II errors in homogeneous pixel selection. GLRT, HTCI, D-HTCI, and Adp-HTCI are parametric test methods that have higher efficiency and require assumptions about the distribution of samples. When the assumptions are satisfied, these methods perform well in homogeneous pixel selection and can effectively distinguish the heterogeneity of pixels. However, the HTCI method is greatly influenced by the accuracy of reference pixel values, and errors can occur when the estimated values of reference pixels are inaccurate. The results of homogeneous pixel selection indicate that for the four different types of land cover—roads or buildings, agricultural fields, water areas, and mountain areas—both the KS test and BWS test have significant Type II errors, often selecting pixels outside the homogeneous regions and yielding large errors in the selection results. The results of the GLRT and HTCI-based algorithms are similar, but the proposed Adp-HTCI algorithm has two advantages based on the number of selected homogeneous pixels: (1) lower probability of misselection compared to other algorithms for homogeneous pixel selection, (2) In homogeneous regions, the Adp-HTCI algorithm can select more homogeneous pixels to facilitate subsequent coherence matrix construction and phase optimization.
Although the Adp-HTCI algorithm proposed in this paper can somewhat reduce the misselection rate and increase the number of selected homogeneous pixels, there are still some limitations: (1) although HTCI algorithms are capable of effectively characterizing the heterogeneity of pixels, they reduce the number of SHP selection, leading to a larger Type I error, (2) HTCI test results are greatly influenced by the estimated values of reference pixel ground truths, and errors will increase if the estimates are inaccurate. These two deficiencies are also inevitable for the Adp-HTCI algorithm.
Regarding the two issues raised above, we currently have some directions. Firstly, the proposed method in this paper constructs dynamic confidence intervals by multiplying a constant with weights, and the selection process for weights is relatively simple. In future work, we will conduct more in-depth research on weight selection. Secondly, although non-parametric tests have a higher Type II error, they have a smaller Type I error. In future work, we will attempt to combine non-parametric tests (such as KS) with parametric tests (such as HTCI).
6. Conclusions
In this paper, the authors optimized the method of SHP selection to propose the Adp-HTCI. The proposed method was tested in experiments involving the selection of homogeneous pixels from images of an area with an ongoing coal-seam fire in the Sikeshu coalfield in Wusu in the Xinjiang Province of China. It uses the eigenvalue decomposition of the covariance matrix to optimize the phase and then performs temporal processing to obtain the results of the deformation of the surface. The following conclusions can be drawn:
- (1)
- The proposed method makes full use of information on the intensity of all pixels in a fixed window of the image, uses weights to represent the differences among objects on the ground, and adaptively selects the level of significance and the confidence interval. It has a higher computational efficiency and accuracy in the selection of homogeneous pixels than prevalent methods. In particular, it can identify a significantly larger number of homogeneous pixels than other HTCI methods to facilitate subsequent processing while ensuring high accuracy.
- (2)
- We used the improved DS-InSAR method to obtain the subsidence of the surface of an area with a coal fire in the Sikeshu coalfield in Wusu from June 2021 to May 2022, and in particular, analyzed the subsidence of the ground at the center of this area. The results of DS-InSAR were highly consistent with those of the monitoring of the StaMPS method, which indirectly proves its accuracy.
- (3)
- Although the proposed method can identify a larger number of homogeneous pixels than prevalent methods, it still yields large Type I errors in certain cases. We intend to address this issue in future work.
Author Contributions
Conceptualization, Z.T. and H.F.; methodology, Z.T. and H.F.; software, Z.T. and L.H.; validation, Z.T., H.F. and F.C.; investigation, H.F.; resources, H.F. and F.C.; writing—original draft preparation, Z.T. and H.F.; writing—review and editing, Z.T. and H.F.; supervision, H.F.; project administration, H.F.; All authors have read and agreed to the published version of the manuscript.
Funding
This work was supported by the Key Laboratory of Land satellite Remote sensing Application, Ministry of Natural Resources of the People’s Republic of China (Grant No. KLSMNR-G202218); and the National Natural Science Foundation of China (No. 42274054, No. 51774270).
Data Availability Statement
Data sharing is not applicable.
Acknowledgments
The authors would like to thank the European Space Agency for providing Sentinel-1 data at https://search.asf.alaska.edu/ (accessed on 3 March 2023).
Conflicts of Interest
The authors declare no conflict of interest.
References
- Song, Z.Y.; Kuenzer, C.; Zhu, H.Q.; Zhang, H.Q.; Zhang, Z.; Jia, Y.R.; Sun, Y.L.; Zhang, J.Z. Analysis of coal fire dynamics in the Wuda syncline impacted by fire-fighting activities based on in-situ observations and Landsat-8 remote sensing data. Int. J. Coal Geol. 2015, 141–142, 91–102. [Google Scholar] [CrossRef]
- Kuenzer, C.; Zhang, J.Z.; Sun, Y.L.; Jia, Y.L.; Dech, S. Coal fires revisited: The Wuda coal field in the aftermath of extensive coal fire research and accelerating extinguishing activities. Int. J. Coal Geol. 2012, 102, 75–86. [Google Scholar] [CrossRef]
- Zhou, L.F.; Zhang, D.R.; Wang, J.; Huang, Z.Q.; Pan, D.L. Mapping land subsidence related to underground coal fires in the Wuda Coalfield (Northern China) using a small stack of ALOS PALSAR differential interferograms. Remote Sens. 2013, 5, 1152–1176. [Google Scholar] [CrossRef]
- Riyas, M.J.; Syed, T.H.; Kumar, H.; Kuenzer, C. Detecting and analyzing the evolution of subsidence due to coal fires in Jharia Coalfield, India using Sentinel-1 SAR data. Remote Sens. 2021, 13, 1521. [Google Scholar] [CrossRef]
- Liang, Y.; Liang, H.; Zhu, S. Mercury emission from coal seam fire at Wuda, Inner Mongolia, China. Atmos. Environ. 2014, 83, 176–184. [Google Scholar] [CrossRef]
- Zeng, Q.; Teyibay, T.P.; Wuttke, W.M. Distribution characteristics and pollution assessment of heavy metals in underground coal fire soil. J. China Univ. Min. Technol. 2014, 43, 695–700. [Google Scholar]
- Graham, L.C. Synthetic interferometer radar for topographic mapping. Proc. IEEE 1974, 62, 763–768. [Google Scholar] [CrossRef]
- Zebker, H.A.; Goldstein, R.M. Topographic mapping from interferometric SAR observations. J. Geophys. Res Sol. Ea. 1986, 91, 4993–4999. [Google Scholar] [CrossRef]
- Fan, H.D.; Wang, L.; Wen, B.F.; Du, S. A new model for three-dimensional deformation extraction with single-track InSAR based on mining subsidence characteristics. Int. J. Appl. Earth. Obs. Geoinf. 2021, 94, 102223. [Google Scholar] [CrossRef]
- Gabriel, A.K.; Goldstein, R.M.; Zebker, H.A. Mapping small elevation changes over large areas: Differential radar interferometry. Geophys. Res. Lett. 1989, 94, 9183–9191. [Google Scholar] [CrossRef]
- Massonnet, D.; Rossi, M.; Carmona, C.; Adragna, F.; Peltzer, G.; Feigl, K.; Rabaute, T. The displacement field of the landers earthquake mapped by radar interferometry. Nature 1993, 364, 138–142. [Google Scholar] [CrossRef]
- Hooper, A.; Bekaert, D.; Spaans, K.; Arikan, M. Recent advances in SAR interferometry time series analysis for measuring crustal deformation. Tectonophysics 2011, 514, 1–13. [Google Scholar] [CrossRef]
- Ferretti, A.; Fumagalli, A.; Novali, F.; Prati, C.; Rocca, F.; Rucci, A. A new algorithm for processing interferometric datastacks: SqueeSAR. IEEE Trans. Geosci. Remote Sens. 2011, 49, 3460–3470. [Google Scholar] [CrossRef]
- Goel, K.; Adam, N. A distributed scatterer interferometry approach for precision monitoring of known surface deformation phenomena. IEEE Trans. Geosci. Remote Sens. 2014, 52, 5454–5468. [Google Scholar] [CrossRef]
- Jiang, M.; Ding, X.L.; Hanssen, R.F.; Malhotra, R.; Chang, L. Fast statistically homogeneous pixel selection for covariance matrix estimation for multitemporal InSAR. IEEE Trans. Geosci. Remote Sens. 2015, 53, 1213–1224. [Google Scholar] [CrossRef]
- Jiang, M.; Ding, X.L.; Li, Z.W. Homogeneous pixel selection algorithm for multitemporal InSAR. China J. Geophys. China Ed. 2018, 61, 4767–4776. [Google Scholar]
- Fan, H.D.; Liu, Y.F.; Xu, Y.Z.; Yang, H.L. Surface subsidence monitoring with an improved distributed scatterer interferometric SAR time series method in a filling mining area. Geocarto Int. 2022, 37, 8979–9001. [Google Scholar] [CrossRef]
- Guarnieri, A.M.; Tebaldini, S. On the exploitation of target statistics for SAR interferometry applications. IEEE Trans. Geosci. Remote Sens. 2008, 46, 3436–3443. [Google Scholar] [CrossRef]
- Fornaro, G.; Verde, S.; Reale, D.; Pauciullo, A. CAESAR: An approach based on covariance matrix decomposition to improve multibaseline-multitemporal interferometric SAR processing. IEEE Trans. Geosci. Remote Sens. 2015, 53, 2050–2065. [Google Scholar] [CrossRef]
- Liu, J.L.; Wang, Y.J.; Li, Y.; Dang, L.B.; Liu, X.X.; Zhao, H.F.; Yan, S.Y. Underground coal fires identification and monitoring using time-series InSAR with persistent and distributed scatterers: A case study of Miquan coal fire zone in Xinjiang, China. IEEE Access 2019, 7, 164492–164506. [Google Scholar] [CrossRef]
- Li, Z.; Fan, H.D.; Gao, Y.T.; Xu, Y.Z. Long-term surface deformation monitoring and analysis of Wuda coalfield fire area based on DS-InSAR. Remote Sens. Nat. Res. 2022, 34, 138–145. [Google Scholar]
- Jiang, M.; Ding, X.L.; Li, Z.W. Research on homogeneous sample selection algorithm for time series InSAR. Geophys. J. 2018, 61, 4767–4776. [Google Scholar]
- Oliver, C.; Quegan, S. Understanding Synthetic Aperture Radar Images; SciTech Publishing: Anaheim, CA, USA, 2004. [Google Scholar]
- Jiang, M.; Yong, B.; Tian, X.; Malhotra, R.; Hu, R.; Li, Z.W.; Yu, Z.B.; Zhang, X.X. The potential of more accurate InSAR covariance matrix estimation for land cover mapping. ISPRS J. Photogramm. Remote Sens. 2017, 126, 120–128. [Google Scholar] [CrossRef]
- Cao, N.; Lee, H.; Jung, H.C. Mathematical framework for phase-triangulation algorithms in distributed-scatterer interferometry. IEEE Geosci. Remote Sens. Lett. 2015, 12, 1838–1842. [Google Scholar]
Disclaimer/Publisher’s Note: The statements, opinions and data contained in all publications are solely those of the individual author(s) and contributor(s) and not of MDPI and/or the editor(s). MDPI and/or the editor(s) disclaim responsibility for any injury to people or property resulting from any ideas, methods, instructions or products referred to in the content. |
© 2023 by the authors. Licensee MDPI, Basel, Switzerland. This article is an open access article distributed under the terms and conditions of the Creative Commons Attribution (CC BY) license (https://creativecommons.org/licenses/by/4.0/).