Article

Variations of Remote-Sensed Forel-Ule Index in the Bohai and Yellow Seas during 1997–2019

1
Frontier Science Center for Deep Ocean Multispheres and Earth System (FDOMES) and Physical Oceanography Laboratory, Ocean University of China, Qingdao 266100, China
2
Laboratory for Regional Oceanography and Numerical Modeling, Pilot National Laboratory for Marine Science and Technology, Qingdao 266237, China
*
Author to whom correspondence should be addressed.
Remote Sens. 2023, 15(14), 3487; https://doi.org/10.3390/rs15143487
Submission received: 12 June 2023 / Revised: 6 July 2023 / Accepted: 10 July 2023 / Published: 11 July 2023

Abstract

:
Water color, often quantified using the Forel-Ule Index (FUI), is a crucial parameter for assessing the water quality and ecological health of coastal waters. However, there is limited research on the spatiotemporal variations of FUI and the associated influencing factors in the Bohai and Yellow Seas. In this study, we utilized multi-sensor satellite datasets to retrieve monthly FUI products for the Bohai and Yellow Seas spanning the period from September 1997 to December 2019. Subsequently, we examined significant spatial disparities and variations across multiple timescales in the remotely sensed FUI time series. The climatological annual mean FUI map reveals a decreasing trend from nearshore to offshore regions, with similar spatial patterns observed in terms of overall and interannual FUI variability. The annual variations in wind field, sea surface temperature (SST), and ocean stratification play a key role in the seasonal dynamics of FUI by modulating the sediment resuspension process, resulting in low FUI values in summer and high FUI values in winter. Linear regression analysis of FUI anomaly indicates a long-term decreasing trend in FUI for the three bays of the Bohai Sea, while upward trends in FUI predominantly prevail in the central Yellow Sea. Factors related to interannual FUI variations, such as surface winds, SST, river outflow, rainfall, and anthropogenic activities, are qualitatively discussed. The findings of this study provide the first comprehensive evaluation of water color variations and their underlying mechanisms in the Bohai and Yellow Seas.

1. Introduction

Water color, often quantified as the Forel-Ule Index (FUI), is a key variable of water quality, and it plays a significant role in assessing and monitoring the condition of marine ecosystems [1,2,3]. The FUI, specifically developed by Forel and Ule [4,5], is a qualitative and visual scale that allows for the classification of water color. It ranges from 1 (indigo-blue) to 21 (cola brown), with various shades of blue, green, yellow, and brown in between [6]. Due to its cost-effectiveness and ease of field measurements, extensive historical FUI databases spanning the past century exist for global waters [7,8]. FUI values are directly linked to optically active components [9,10], such as chlorophyll-a (Chl-a), inorganic suspended sediment, and colored dissolved organic matter. Thus, such historical databases of water color are useful to reveal the long-term trends of Chl-a for the global oceans [1,11,12], to identify the classification of water masses [8,13], and to monitor water quality and eutrophication of aquatic ecosystems [9,14,15,16]. However, the discrete and sparse nature of field measurements limits the provision of continuous and comprehensive evaluation of water color variations.
With the advancement of remote sensing technology, publicly available satellite observations offer large-scale and repetitive measurements for estimating FUI in inland, coastal, and oceanic waters (e.g., [2,3,7,8,9,15,16,17,18]). Wernand et al. [18] proposed an innovative mechanistic algorithm to estimate FUI from MERIS remote-sensing reflectance (Rrs). Previous studies have demonstrated the low uncertainties of satellite-derived FUI products for global waters and the applicability of the FUI algorithm to various satellite sensors [10,17,18,19,20]. Wang et al. [9] assessed the trophic states of global lakes based on MODIS-derived FUI. Pitarch et al. [7] investigated the relationships between FUI and other optical variables in the global oceans, including Chl-a, water transparency, and diffuse attenuation coefficient. In terms of public data in FUI, Wang et al. [17] published the MODIS-derived FUI datasets for global inland waters over the period of 2000–2018. Additionally, Pitarch et al. [8] presented monthly FUI time series for the global oceans spanning 1997 to 2018 using multi-sensor satellite datasets. These datasets are valuable for exploring the spatiotemporal distribution and variations of FUI in global waters. However, only a limited number of studies have focused on the variations of FUI and related influencing factors in marginal seas (e.g., [2,21]).
The Bohai and Yellow Seas, located in the northwest Pacific, are two important marginal seas (Figure 1). The Bohai Sea, situated in northeastern China, is an inland sea connected to the Yellow Sea through the Bohai Strait. It covers an area of approximately 78,000 square kilometers and is known for its economic significance, hosting major ports and industrial centers [22]. The Yellow Sea is renowned for its rich fishing grounds, serves as a crucial habitat for marine species, and spans around 380,000 square kilometers [23,24]. Both seas suffer environmental challenges such as pollution, eutrophication, and overfishing, highlighting the need for sustainable management and conservation efforts [25]. Furthermore, the hydrological and meteorological conditions of the Bohai and Yellow Seas are influenced by various factors such as the East Asian Monsoon, rainfall, river outflow, solar radiation, and water column stratification [26]. These natural and anthropogenic driving factors inevitably contribute to significant spatiotemporal variations in FUI. By monitoring changes in FUI across multiple timescales, scientists and environmental managers can gain valuable insights into the water quality and ecological health of the Bohai and Yellow Seas, as well as the response of marginal seas to natural and anthropogenic influences. To the best of our knowledge, there is limited analysis regarding satellite-derived FUI variations in the Bohai and Yellow Seas. Based on 2390 matchups, Nie et al. [3] reported a good agreement between FUI derived from the European Space Agency’s Ocean Color Climate Change Initiative (ESA OC CCI) Rrs and in situ FUI measurements in China’s offshore waters. However, they did not investigate the spatiotemporal variations of satellite-derived FUI products. Wang et al. [21] concluded that the East Asian monsoon was the primary driver of seasonal variations in water color in the Bohai Sea. Using MODIS FUI products, Xiang et al. [27] examined changes in water quality in the Bohai Sea from 2011 to 2022.
The FUI variations over multiple timescales and the underlying mechanisms in the Bohai and Yellow Seas, as well as their spatial discrepancies, remain largely unknown. This study aims to address these gaps by pursuing three main objectives. Firstly, we aim to retrieve monthly FUI time series in the Bohai and Yellow Seas during the period of 1997–2019 using the OC CCI data. Secondly, we seek to present the annual FUI climatology and analyze the variations of FUI on seasonal, interannual, and long-term timescales at a pixel-by-pixel resolution. Lastly, we aim to reveal the underlying mechanisms that contribute to the seasonal and interannual variations of FUI. Through these objectives, we aim to enhance our understanding of FUI dynamics and provide valuable insights into the spatiotemporal patterns and mechanisms influencing water color in the Bohai and Yellow Seas.

2. Materials and Methods

2.1. Data

The primary satellite data source used in this study are the ESA OC CCI v4.2 monthly mean Rrs datasets at a spatial resolution of 4 km, available through the ESA OC CCI website. Rrs is a fundamental parameter used to derive a range of biogeochemical and physical properties of the ocean, such as water transparency, Chl-a, and FUI. From 1997–2019, the OC CCI Rrs products merged multiple ocean color sensors, including SeaWiFS, MERIS, MODIS, and VIIRS, to ensure long-term consistency and accuracy. Another unique feature of the OC CCI Rrs products is that each data file includes a pixel-by-pixel bias in Rrs, which allows for the calculation of unbiased monthly Rrs estimates and enhances the precision of satellite-derived products [8,28]. Additional information on the OC CCI Rrs datasets can be found in the Product User Guide [29].
For sea surface temperature (SST) data, monthly MODIS/Aqua-derived datasets at a 4 km resolution for the years 2002–2019 have been acquired from the NASA Ocean Color website. Additionally, the 4 km monthly AVHRR-derived SST datasets covering the period from September 1997 to December 2002 are obtained from NOAA. The consistency between the MODIS and AVHRR SST measurements allows for their combination in continuous time series analysis [30]. Surface wind vectors are sourced from the European Centre for Medium-Range Weather Forecasts, providing monthly data during 1997–2019 with a horizontal resolution of 0.25°. Annual runoff and sediment discharge of the Yellow River measured at the Lijin station during 2002–2019 are obtained from the China River Sediment Bulletin.

2.2. Algorithm to Retrieve FUI

To obtain monthly FUI values for the Bohai and Yellow Seas, we have employed unbiased monthly Rrs products spanning from September 1997 to December 2019. The hue angle was calculated from these unbiased Rrs products using the methodologies outlined by Van Der Woerd and Wernand [19,20]. Subsequently, the FUI values were assigned by matching the hue angle to the nearest Forel-Ule class, as described by Novoa et al. [6]. A brief description of the algorithm that derives FUI from Rrs is presented in this section, and detailed derivation can be found in several previous studies [6,7,19,20].
The conversion of Rrs to FUI starts with calculating tristimulus values X, Y, and Z as follows:
X = R r s ( λ ) x ¯ ( λ ) d λ , Y = R r s ( λ ) y ¯ ( λ ) d λ ,   Z = R r s ( λ ) z ¯ ( λ ) d λ ,
where x ¯ ( λ ) , y ¯ ( λ ) , and z ¯ ( λ ) are the standard CIE color matching functions. Since Rrs is not a continuous spectrum in the practical application of satellite data, a discretization of Equation (1) was proposed [19,20]. For Rrs at the SeaWiFS bands, the tristimulus values can be calculated as
( X Y Z ) = ( 2.957 10.861 3.744 3.455 52.304 32.825 0.112 1.711 5.672 21.929 59.454 17.810 14.354 58.356 28.227 3.967 0.682 0.018 ) R r s , s w ,
where Rrs,sw is a column vector containing Rrs at six SeaWiFS bands.
Based on the normalization of (X, Y, Z), the tristimulus values are transformed into chromaticity coordinates:
( x , y ) = ( X X + Y + Z ,   Y X + Y + Z ) ,
which can be displayed as two-dimensional plots called chromaticity diagrams. The chromaticity coordinates of the FUI scale are available in Novoa et al. [6].
Then, the coordinates are converted to polar coordinates with respect to the white point, which has the coordinates of x = y = 1 / 3 . The hue angle (α) is derived as
α = ARCTAN 2 ( y 1 / 3 , x 1 / 3 ) 180 / π ,
where the ARCTAN2 function is a four-quadrant inverse tangent function that returns a value between π and π . Moreover, in order to be consistent with Van der Woerd and Wernand [19] and obtain the α in the range of [ 0 ,   360 ] , 360 is added to the α that is less than zero.
Nonetheless, due to the discontinuous band setting of satellite sensors, the discrete integration of Equation (1) will lead to a partially random uncertainty. Van der Woerd and Wernand [19] proposed a polynomial fitting method to remove the systematic deviation between the estimated hue angle and calculated hyperspectral hue angle, and the corrected hue angles α c o r are calculated as
α c o r = α ' + i = 0 5 p i ( α ' / 100 ) i ,
where α ' is the “biased” estimate, and p i , i = 1 , 2 , , 5 are fitting coefficients.
Lastly, by using Equations (2)–(5) in turn, the unbiased hue angle of every observation point will be obtained, and the FU number of each point is determined by matching with the hue angle of the nearest FU class.
Nie et al. [3] evaluated the accuracy of the OC CCI v4.2 Rrs-derived FUI products by using 3893 in situ FUI observations in the China seas from July 2006 to April 2007. For the in situ FUI measurements in their study, the apparent color of seawater was compared to a standard handheld FUI, which was composed of a series of numerically designated vials (between 1 and 21) filled with mixtures of colored chemical solutions. Comparisons between the OC CCI v4.2 Rrs-derived FUI and in situ FUI measurements in the Bohai and Yellow Seas have indicated good agreement [3], enabling us to investigate the spatiotemporal variability of water color based on the OC CCI FUI time series.

2.3. Calculation of Linear Trend

To assess the linear trends of monthly variables, we computed monthly anomalies by subtracting the monthly climatology from the original monthly means. Subsequently, we employed the least-squares method to perform linear regression on the monthly anomalies, enabling us to obtain the linear slopes. In order to evaluate the significance of the trends observed in the OC CCI FUI time series, we applied a statistical F-test. This test allowed us to determine whether the trends exhibited a significant increase or decrease.

2.4. Empirical Orthogonal Function Decomposition

Empirical Orthogonal Function (EOF) decomposition, also known as Principal Component Analysis or Karhunen–Loève Transform, is a statistical technique used for analyzing spatial or temporal patterns in multidimensional datasets [31]. It is commonly employed in various fields, such as climate science, oceanography, and image processing. EOF decomposition seeks to identify the dominant modes of variability in a dataset by expressing the data as a linear combination of orthogonal spatial patterns, known as empirical orthogonal functions or principal components. These spatial patterns are obtained from the eigenvectors of the covariance or correlation matrix of the dataset.
In this study, EOF decomposition was applied to obtain the dominant mode of FUI variability in the Bohai and Yellow Seas during 1997–2019. Due to the fact that EOF decomposition can only be applied to gap-free matrices, the Data Interpolation Empirical Orthogonal Function was performed on the OC CCI products to fill missing values prior to the EOF decomposition [32,33].

3. Results

3.1. Climatological Annual Mean FUI

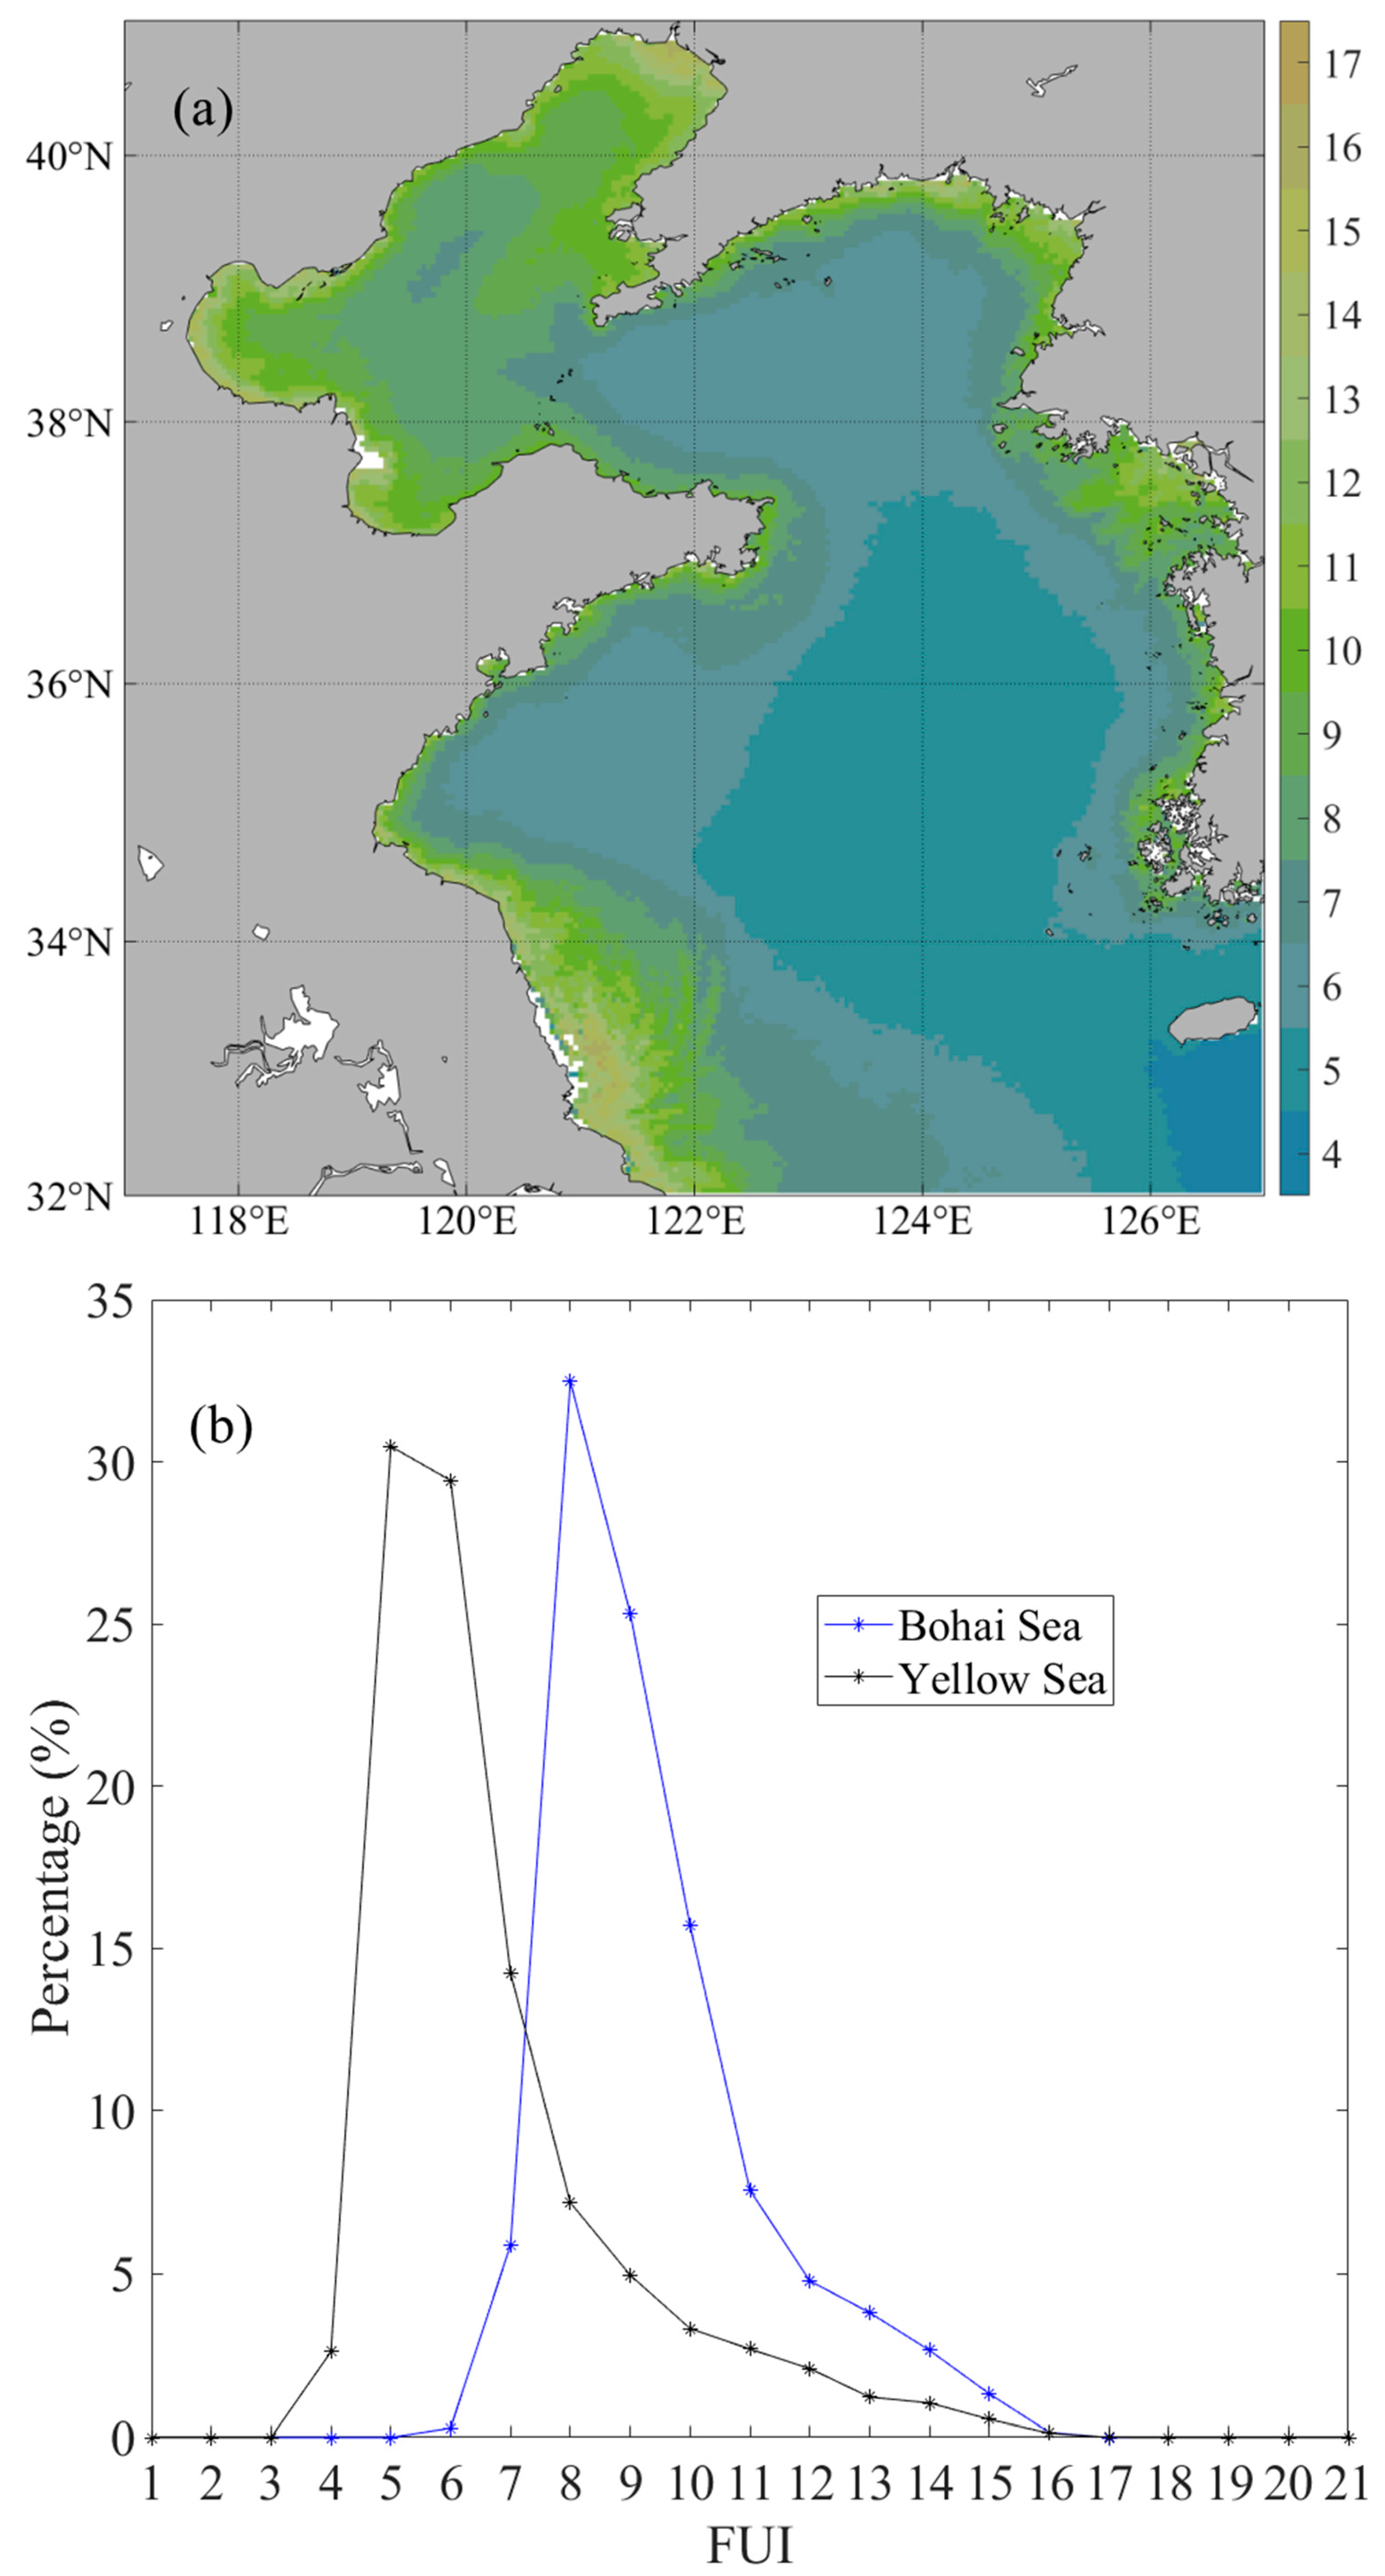
Based on the monthly OC CCI FUI products from September 1997 to December 2019 in the Bohai and Yellow Seas, the climatology of FUI distribution is presented in Figure 2a, with FUI values ranging from 4 to 17. Generally, the annual FUI climatology exhibits higher values in nearshore waters and lower values in offshore waters, resulting in distinct visibility of the FUI isoline. Furthermore, the central Bohai Sea exhibits higher FUI values compared to the central Yellow Sea. Regions of significantly elevated FUI are primarily found in Laizhou Bay, Bohai Bay, Liaodong Bay, and Subei Shoal, which can be attributed to high concentrations of inorganic suspended sediment resulting from active mixing and river outflow [34,35]. Among these, Subei Shoal records the highest FUI values, reaching 17 and indicating the most turbid water, while FUI values drop to 4 near southern Jeju Island, indicating the clearest water. In the central Yellow Sea, FUI typically falls within the range of 4–6, displaying a clear gradual decrease seaward. Further statistical analysis (Figure 2b) reveals that the annual FUI climatology undergoes changes within the range of 6–16 in the Bohai Sea, with the percentage of area covered by each FUI value initially increasing and then decreasing from 6 to 16. The maximum percentage (exceeding 32%) is observed when FUI = 8. For the Yellow Sea, FUI values range from 4 to 17, and the percentage curve also increases at first and then decreases, with FUI = 5 and FUI = 6 dominating most of the water bodies.

3.2. Overall Variability of FUI

The overall variability of FUI, encompassing seasonal, interannual, and long-term timescales, is quantified using the standard deviation (SD, Figure 3a) and coefficient of variation (CV, Figure 3b). Notably, the maps of SD and CV are primarily influenced by the seasonal cycle of FUI (Figure 3c), with the CV patterns being more pronounced. As depicted in Figure 3a, the SD map demonstrates a spatial pattern similar to that of the multiyear mean FUI pattern (r = 0.70, p < 0.01), with a decreasing trend from nearshore to offshore regions. The Subei Shoal exhibits the highest variability (SD > 3.5). Additionally, areas with relatively high variability (SD > 2) are identified in coastal zones characterized by bathymetry less than 20 m, while lower variability is primarily observed in the central Bohai and Yellow Seas. Notably, a region of high SD in the northern Bohai Sea is possibly attributed to strong seasonal cycles of FUI and sediment resuspension (Figure 3c). However, due to consistently high FUI values throughout the year, some coastal water patches in the Subei Shoal exhibit low degrees of variability. Figure 3b illustrates that the distribution of CV is consistent with the SD map, but the CV pattern in the central Yellow Sea exhibits a systematic increase. This high CV region is formed due to the combination of strong seasonal variability of FUI (Figure 3c) and relatively low FUI climatology.

3.3. Seasonal Variations of FUI

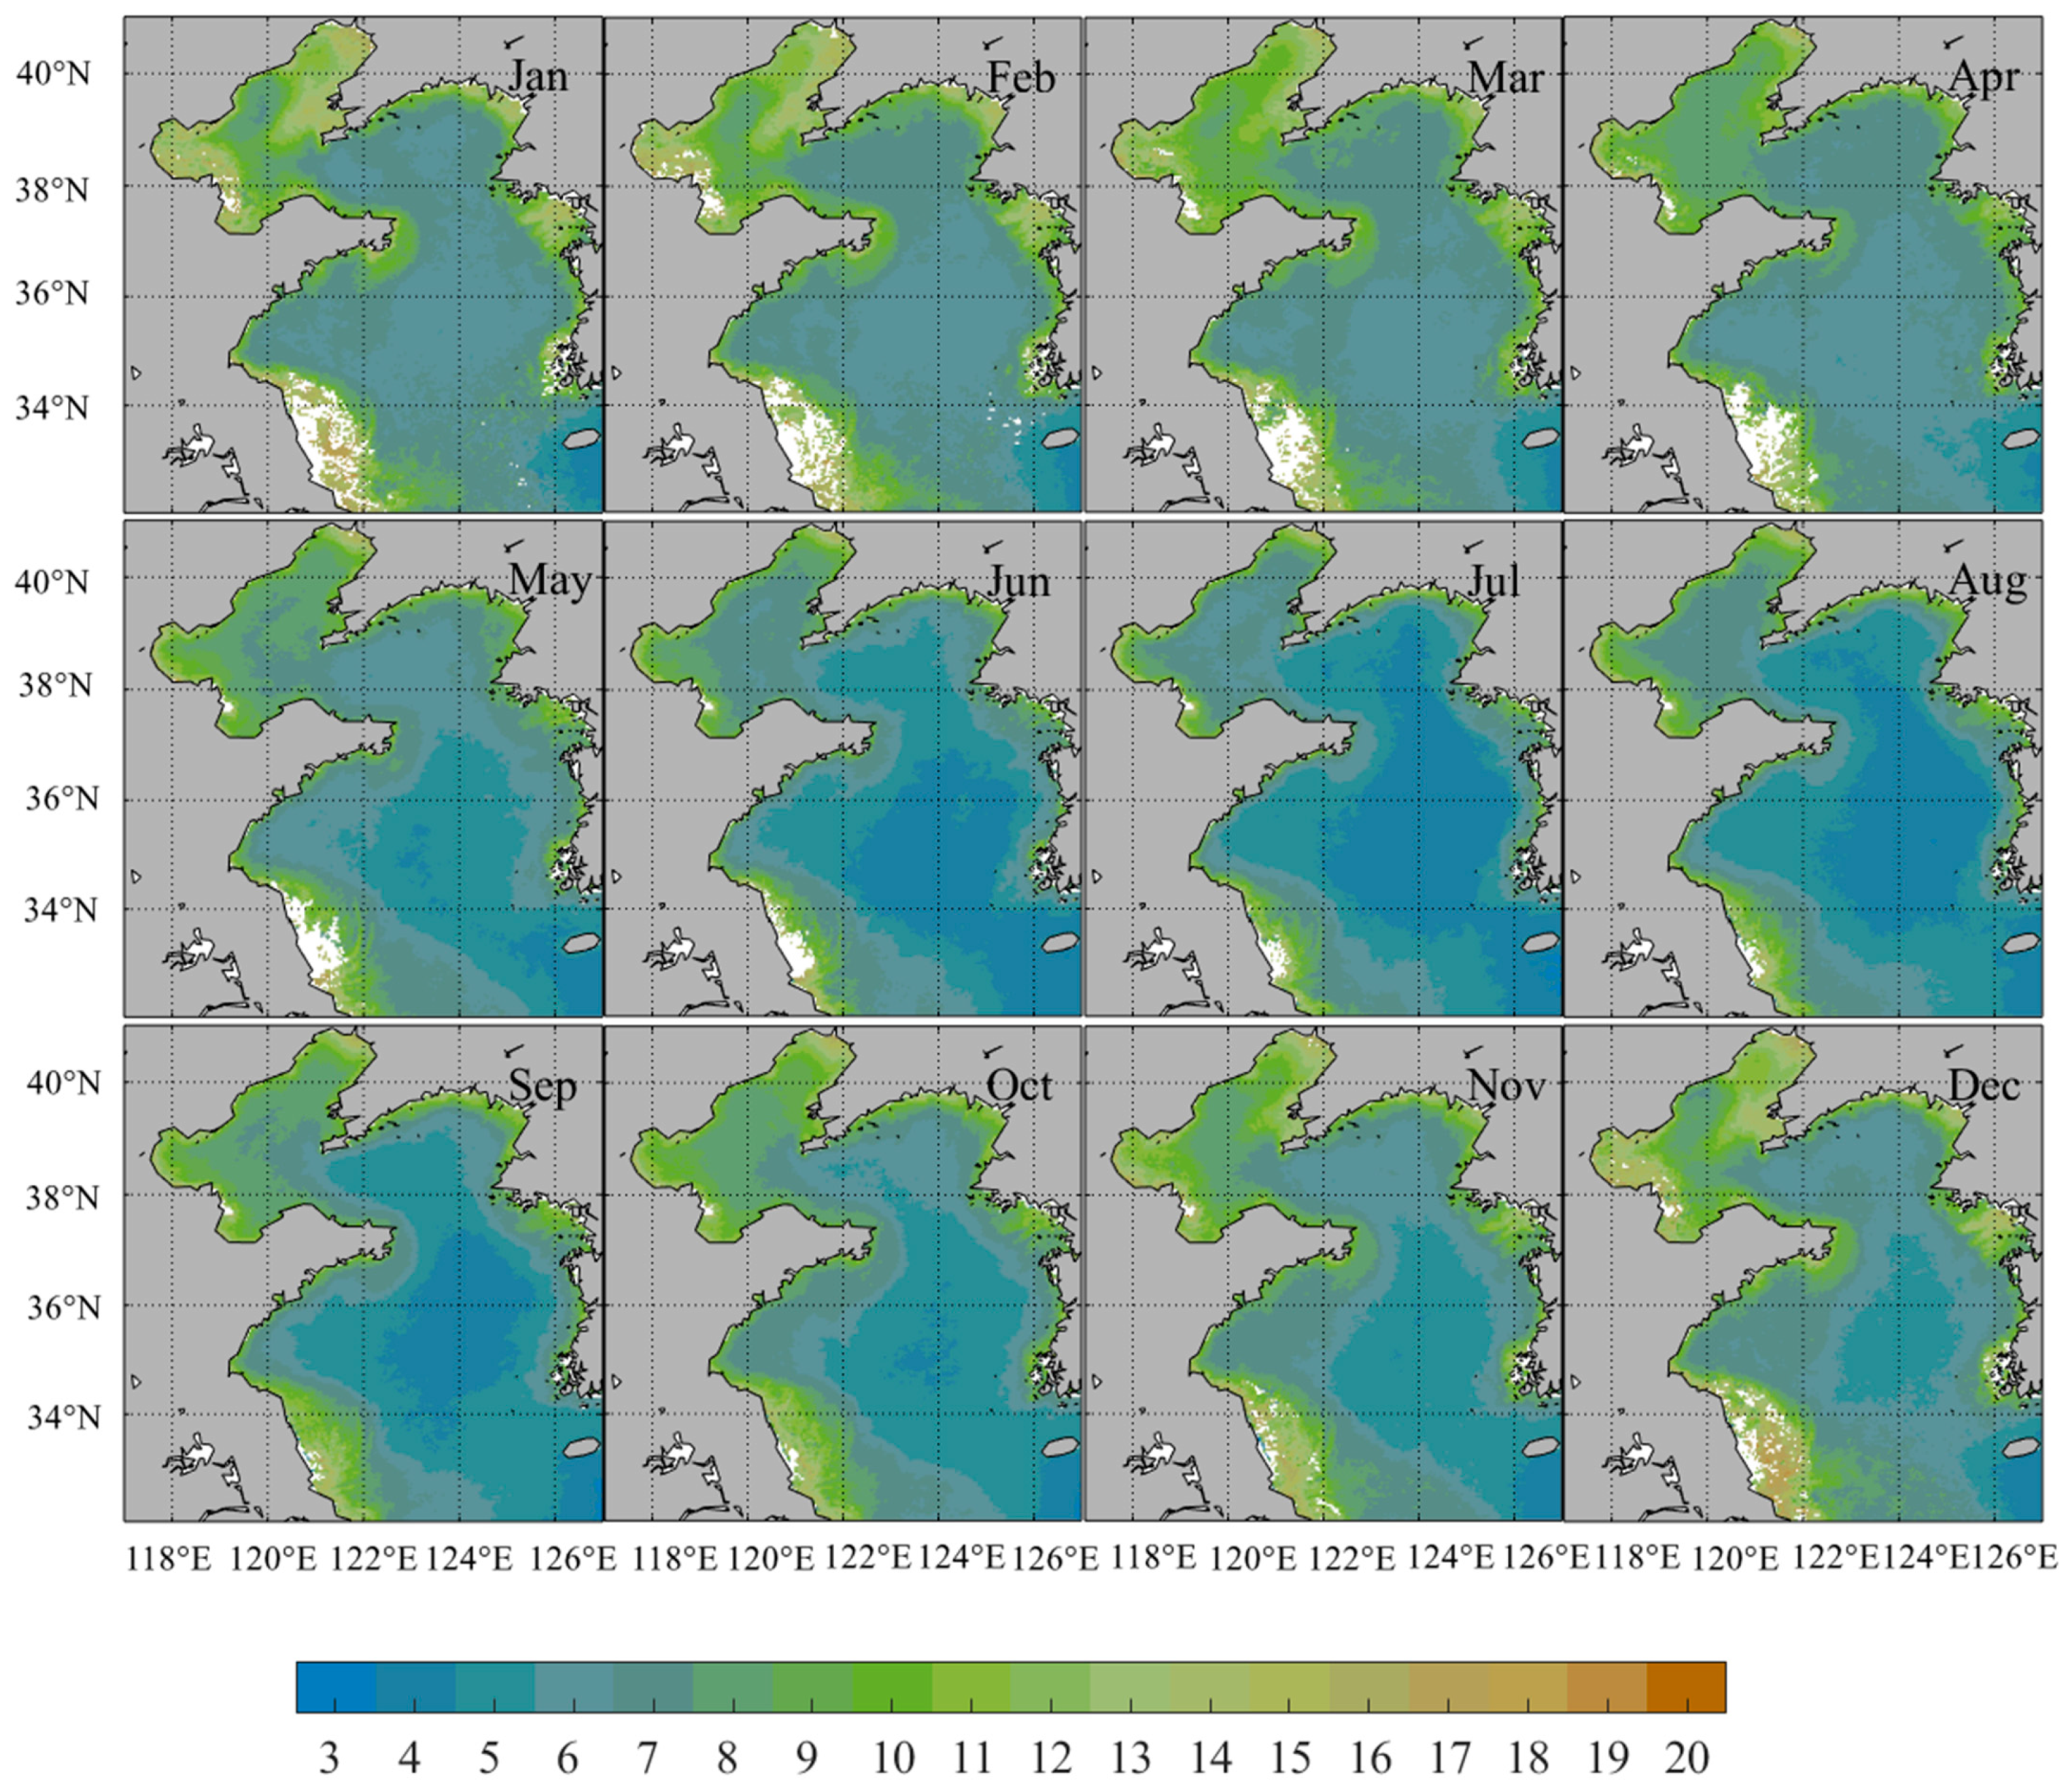
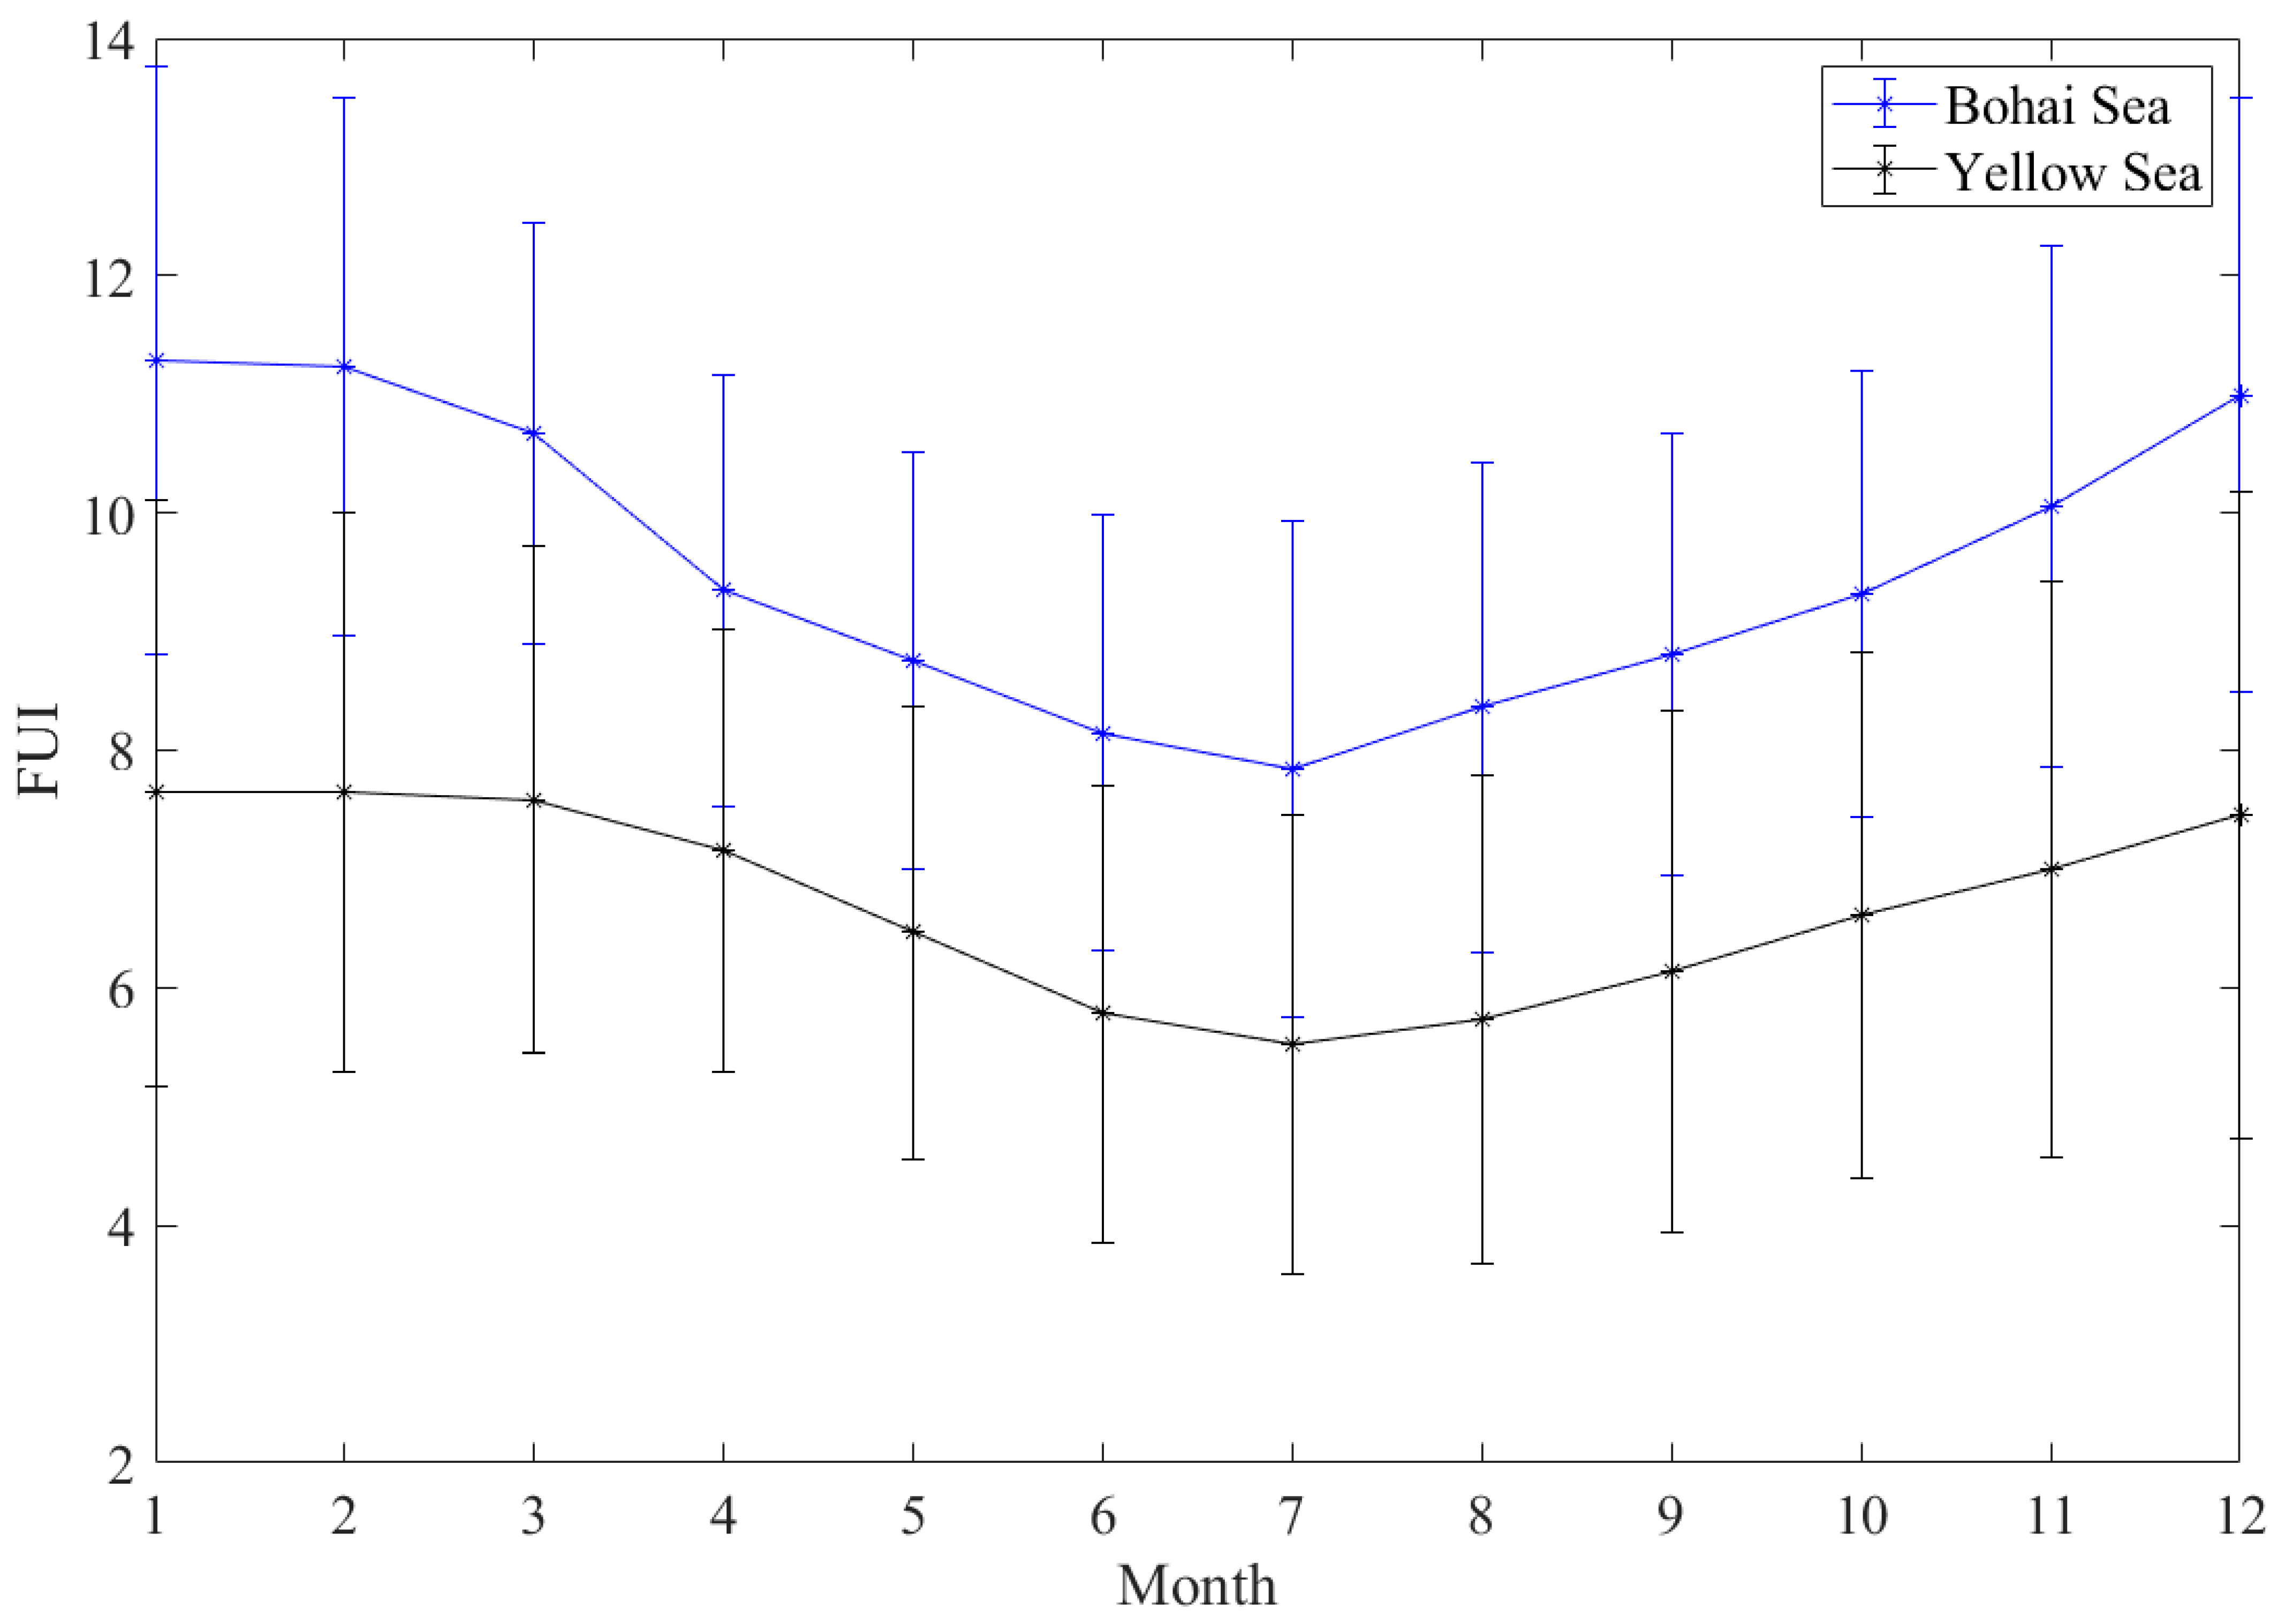
Monthly climatology images of FUI from September 1997 to December 2019 reveal distinct seasonal patterns of water color in the Bohai and Yellow Seas (Figure 4). Similar to the spatial distribution observed in the annual FUI climatology, the seasonal variations of FUI generally exhibit low values in summer and high values in winter on a pixel-by-pixel basis, indicating that the water color changes from turbid to clear and then back to turbid conditions. In summer, the central Yellow Sea exhibits a low FUI structure with values of 4, while FUI values exceed 7 in the Subei Shoal and the three bays of the Bohai Sea. In winter, the region with FUI = 4 contracts to the southern Jeju Island, and high FUI values extend to 125°E in the southern Yellow Sea. Figure 5 illustrates the clear seasonal cycle of regionally averaged FUI in the Bohai and Yellow Seas. Overall, the seasonal variations of FUI in the Bohai Sea are similar to those in the Yellow Sea, but the difference in FUI between the two ranges from 2.2 to 3.6, peaking in winter. In July, the Bohai and Yellow Seas exhibit the best water color conditions with FU values of 7.85 ± 2.09 and 5.52 ± 1.93, respectively. In contrast, the highest FUI values are 11.29 ± 2.47 and 7.66 ± 2.35 for the Bohai Sea (January) and Yellow Sea (February), respectively, indicating the most turbid waters. This seasonal FUI cycle cannot be attributed to phytoplankton blooms, which would typically increase FUI values in spring or summer [37,38]. Instead, sediment resuspension processes associated with seasonal climate changes emerge as the primary factor driving the seasonal color dynamics, as will be elaborated in Section 4.1.

3.4. Long-Term Trends and Interannual Variations of FUI

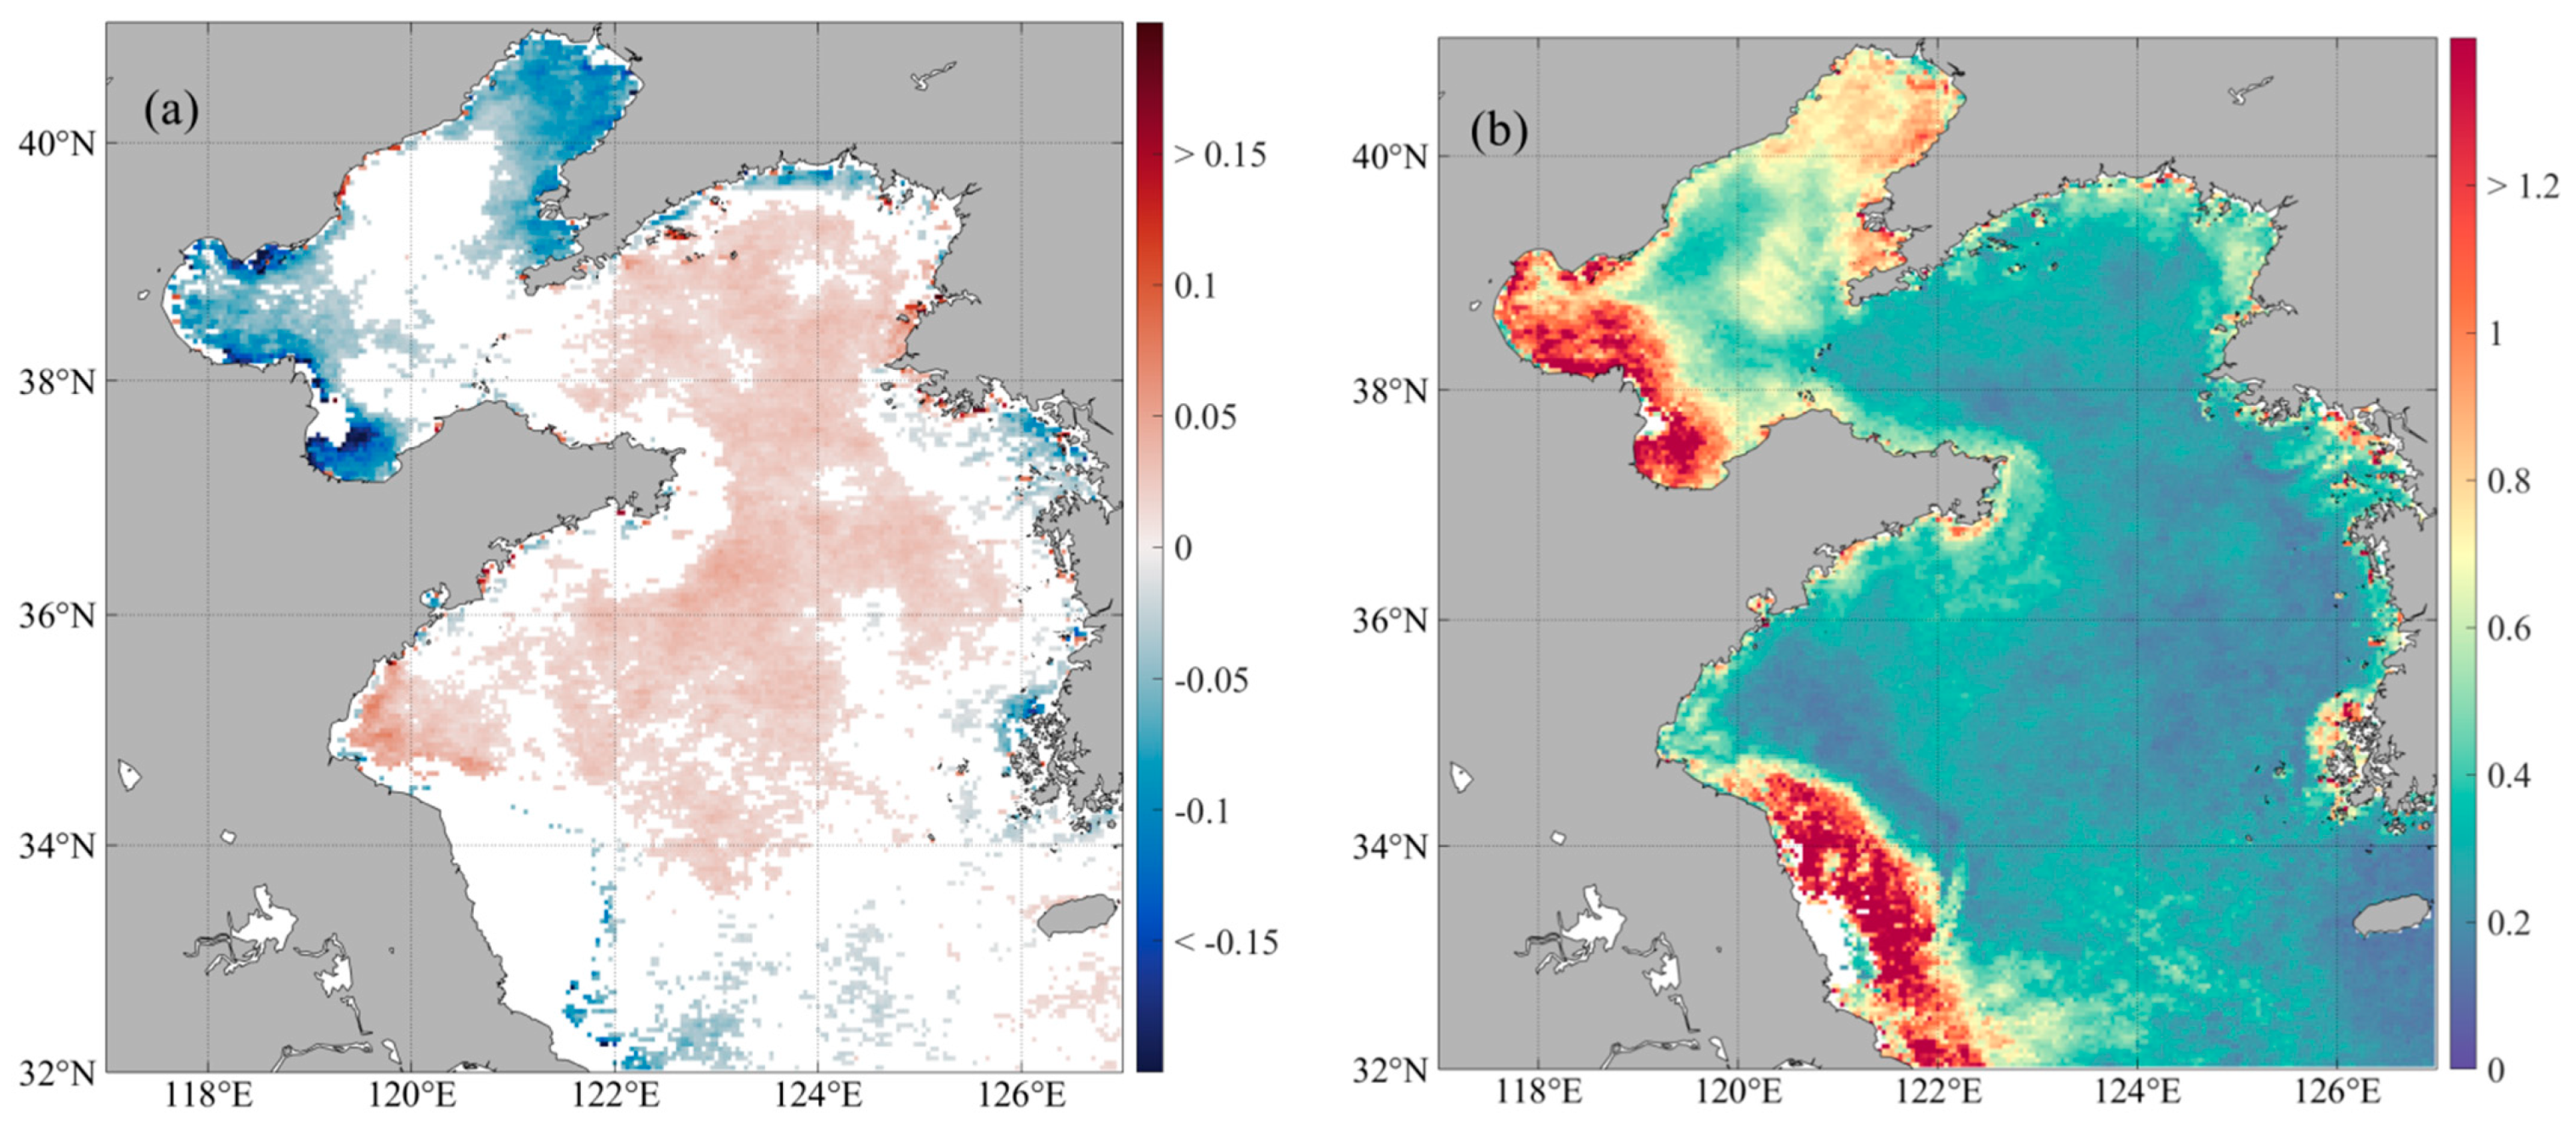
Figure 6a presents the long-term trends of FUI from September 1997 to December 2019. Laizhou Bay, Bohai Bay, and Liaodong Bay exhibit a consistent decreasing trend in FUI, indicating an improvement in water quality in the three bays of the Bohai Sea over the past two decades. The FUI trends in the Bohai and Yellow Seas are heterogeneous, with the largest decrease in FUI (<0.2 year−1) observed in Liaodong Bay. In the Yellow Sea, upward trends in FUI are predominantly observed in the central region, while negative FUI slopes are observed in some coastal areas.
Figure 6b illustrates the SD of FUI anomaly during the period of interest, as a measure of the strength of interannual FUI variability. Similar to Figure 2a and Figure 3a, the SD of FUI also exhibits a decreasing trend from nearshore to offshore. The largest interannual variations in FUI (SD > 1.2) are predominantly found in Laizhou Bay, Bohai Bay, and Subei Shoal, whereas the Yellow Sea as a whole exhibits low variability (SD < 0.6). Additionally, relatively high SD values (0.6 < SD < 1.2) are observed in Liaodong Bay. Unlike the seasonal changes in FUI, the interannual variations are complex and likely influenced by multiple physical and environmental factors [39], including the East Asian Monsoon, SST, rainfall, eutrophication, human activities, and others.
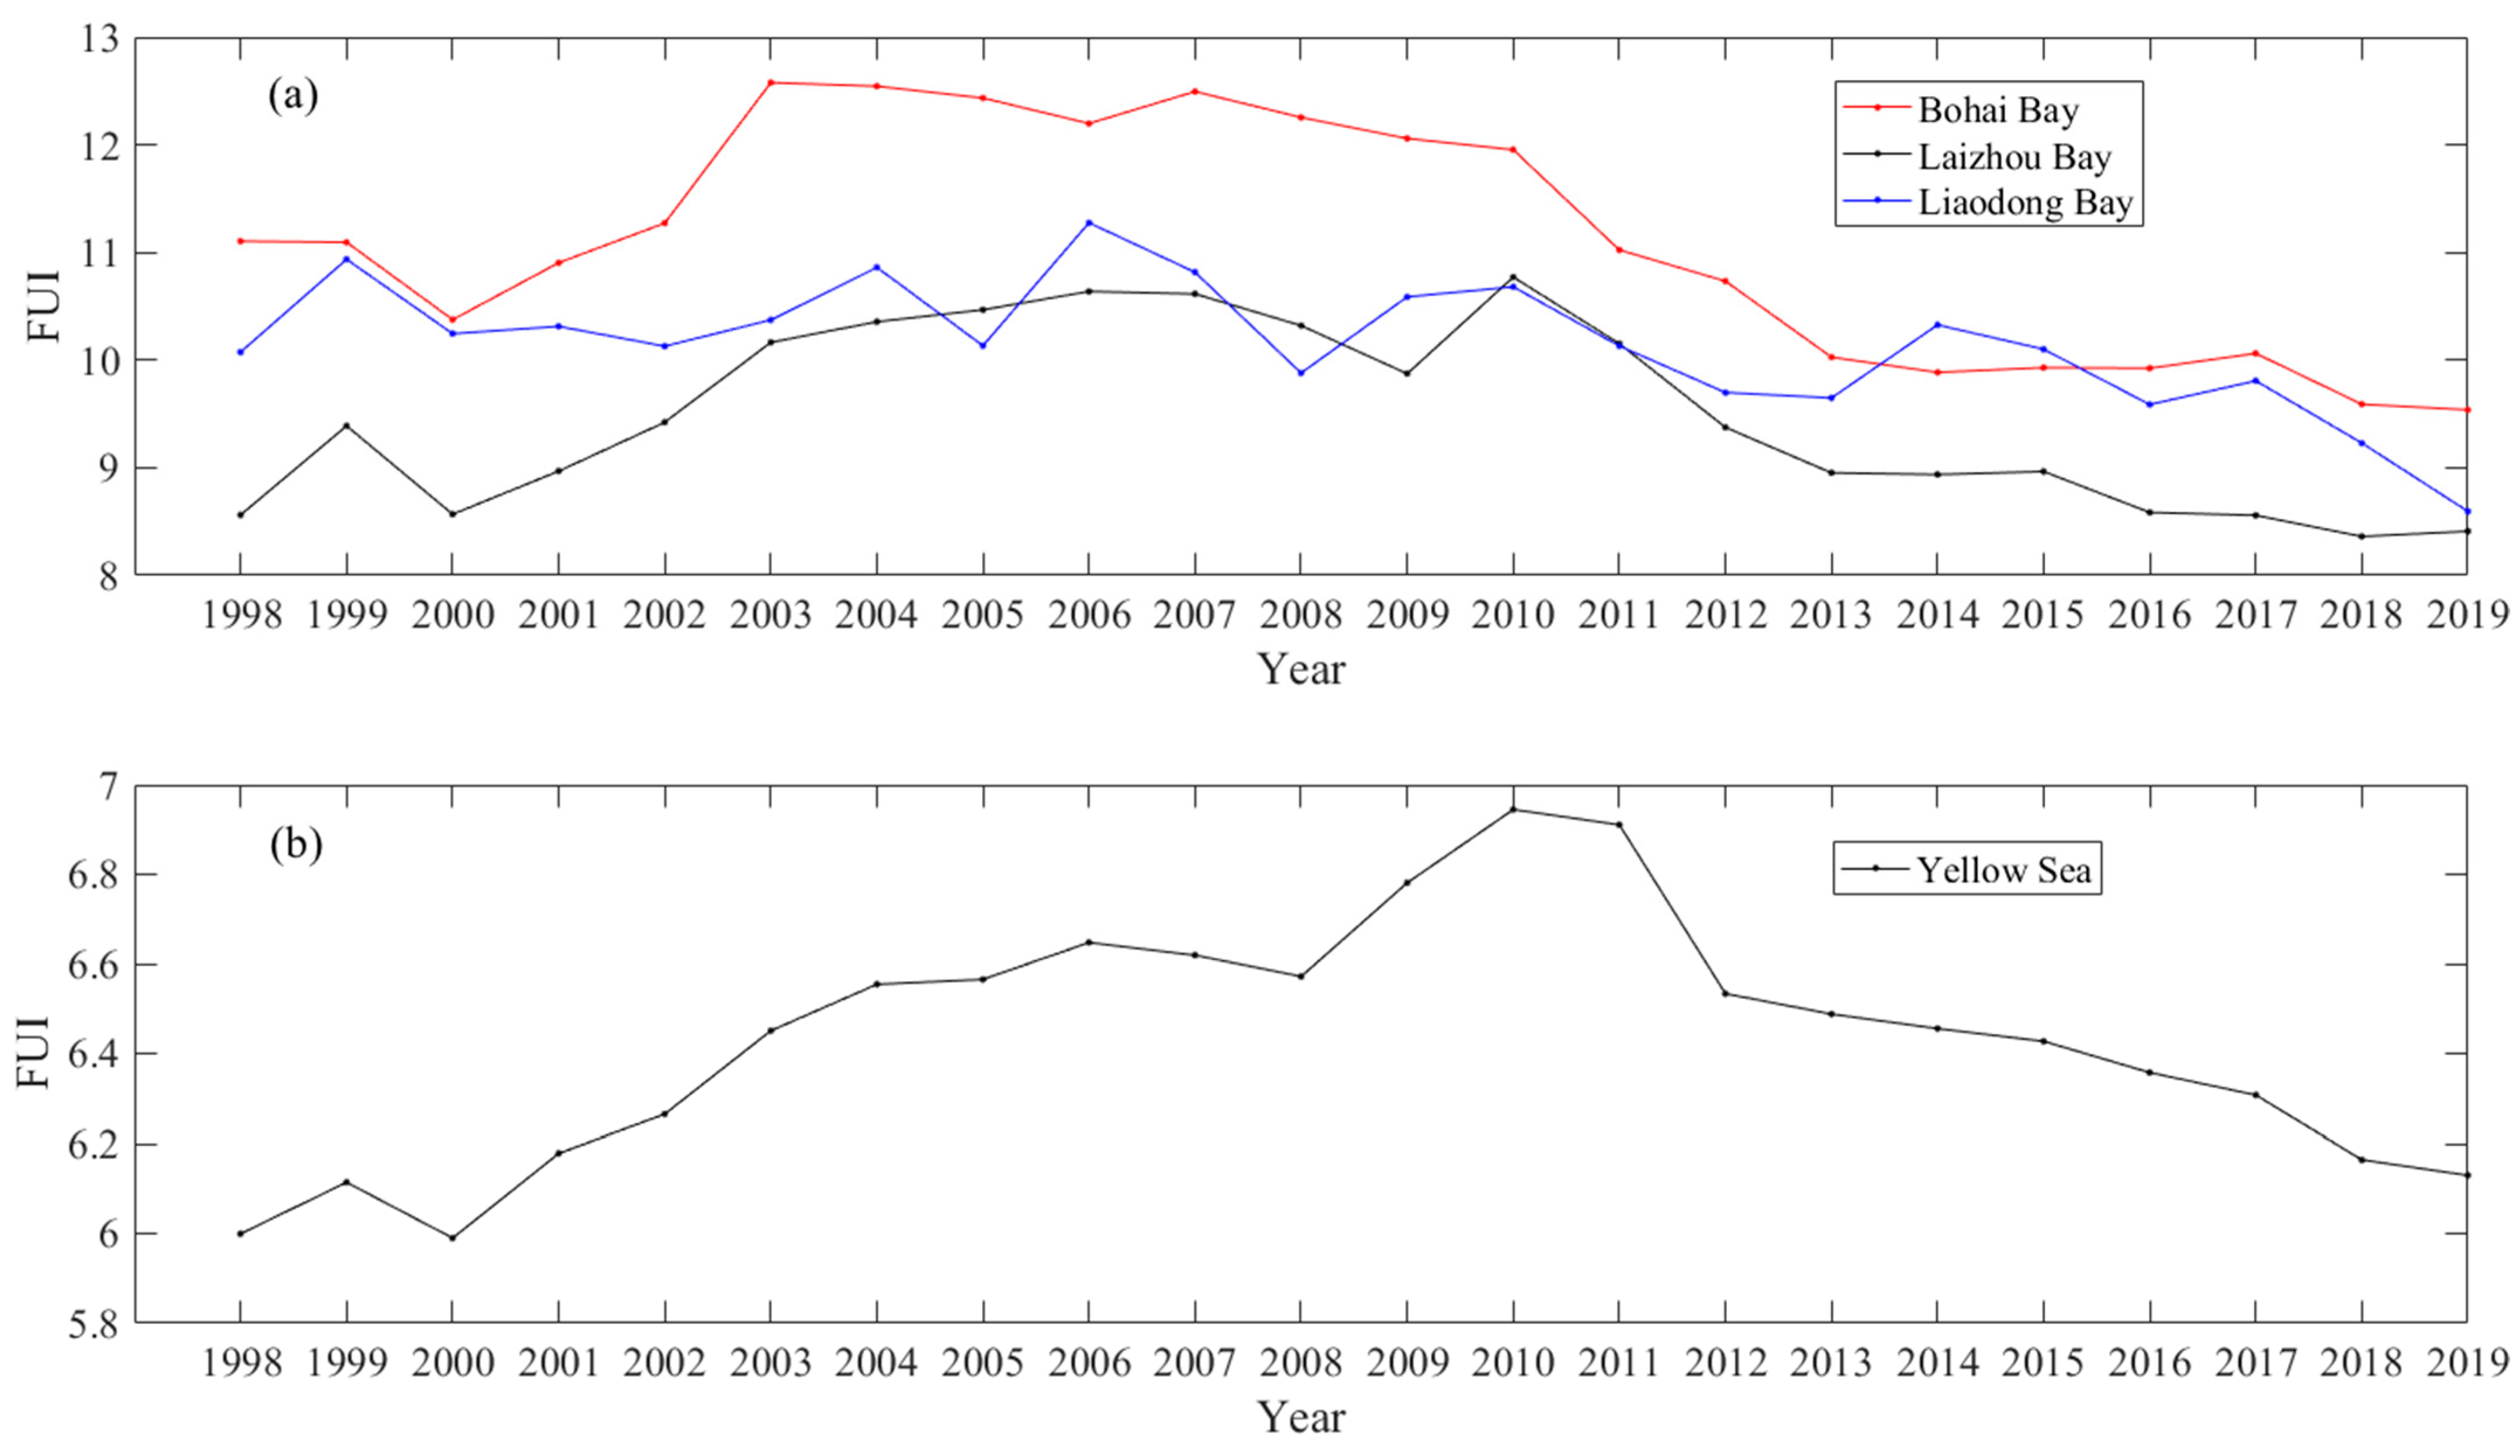
To investigate the relationship between long-term trends and interannual variations of FUI, we focused on Laizhou Bay, Bohai Bay, Liaodong Bay, and the central Yellow Sea to analyze the annual mean FUI changes from 1998 to 2019 (Figure 7). Since the FUI time series has been available since September 1997, the first 4 months of the FUI products are excluded from the annual mean analysis. The three bays in the Bohai Sea exhibit similar trends in annual mean FUI. From 1998 to 2003, the annual mean FUI values increased, followed by a significant decrease from 2010 to 2019, resulting in an overall negative trend, as depicted in Figure 6a. Notably, during the period of 2003–2010, the annual mean FUI remained relatively stable in these three bays, and the deterioration of aquatic ecosystems did not continue. In the central Yellow Sea, the annual mean FUI series displayed a significant upward trend from 1998 to 2010, followed by a significant downward trend thereafter, resulting in a slight overall increase, as shown in Figure 6a. Coincidentally, the interannual variations of FUI in the central Yellow Sea are consistent with those of Chl-a during the study period [26,40].

4. Discussion

4.1. Mechanisms for the Seasonal Variations of FUI

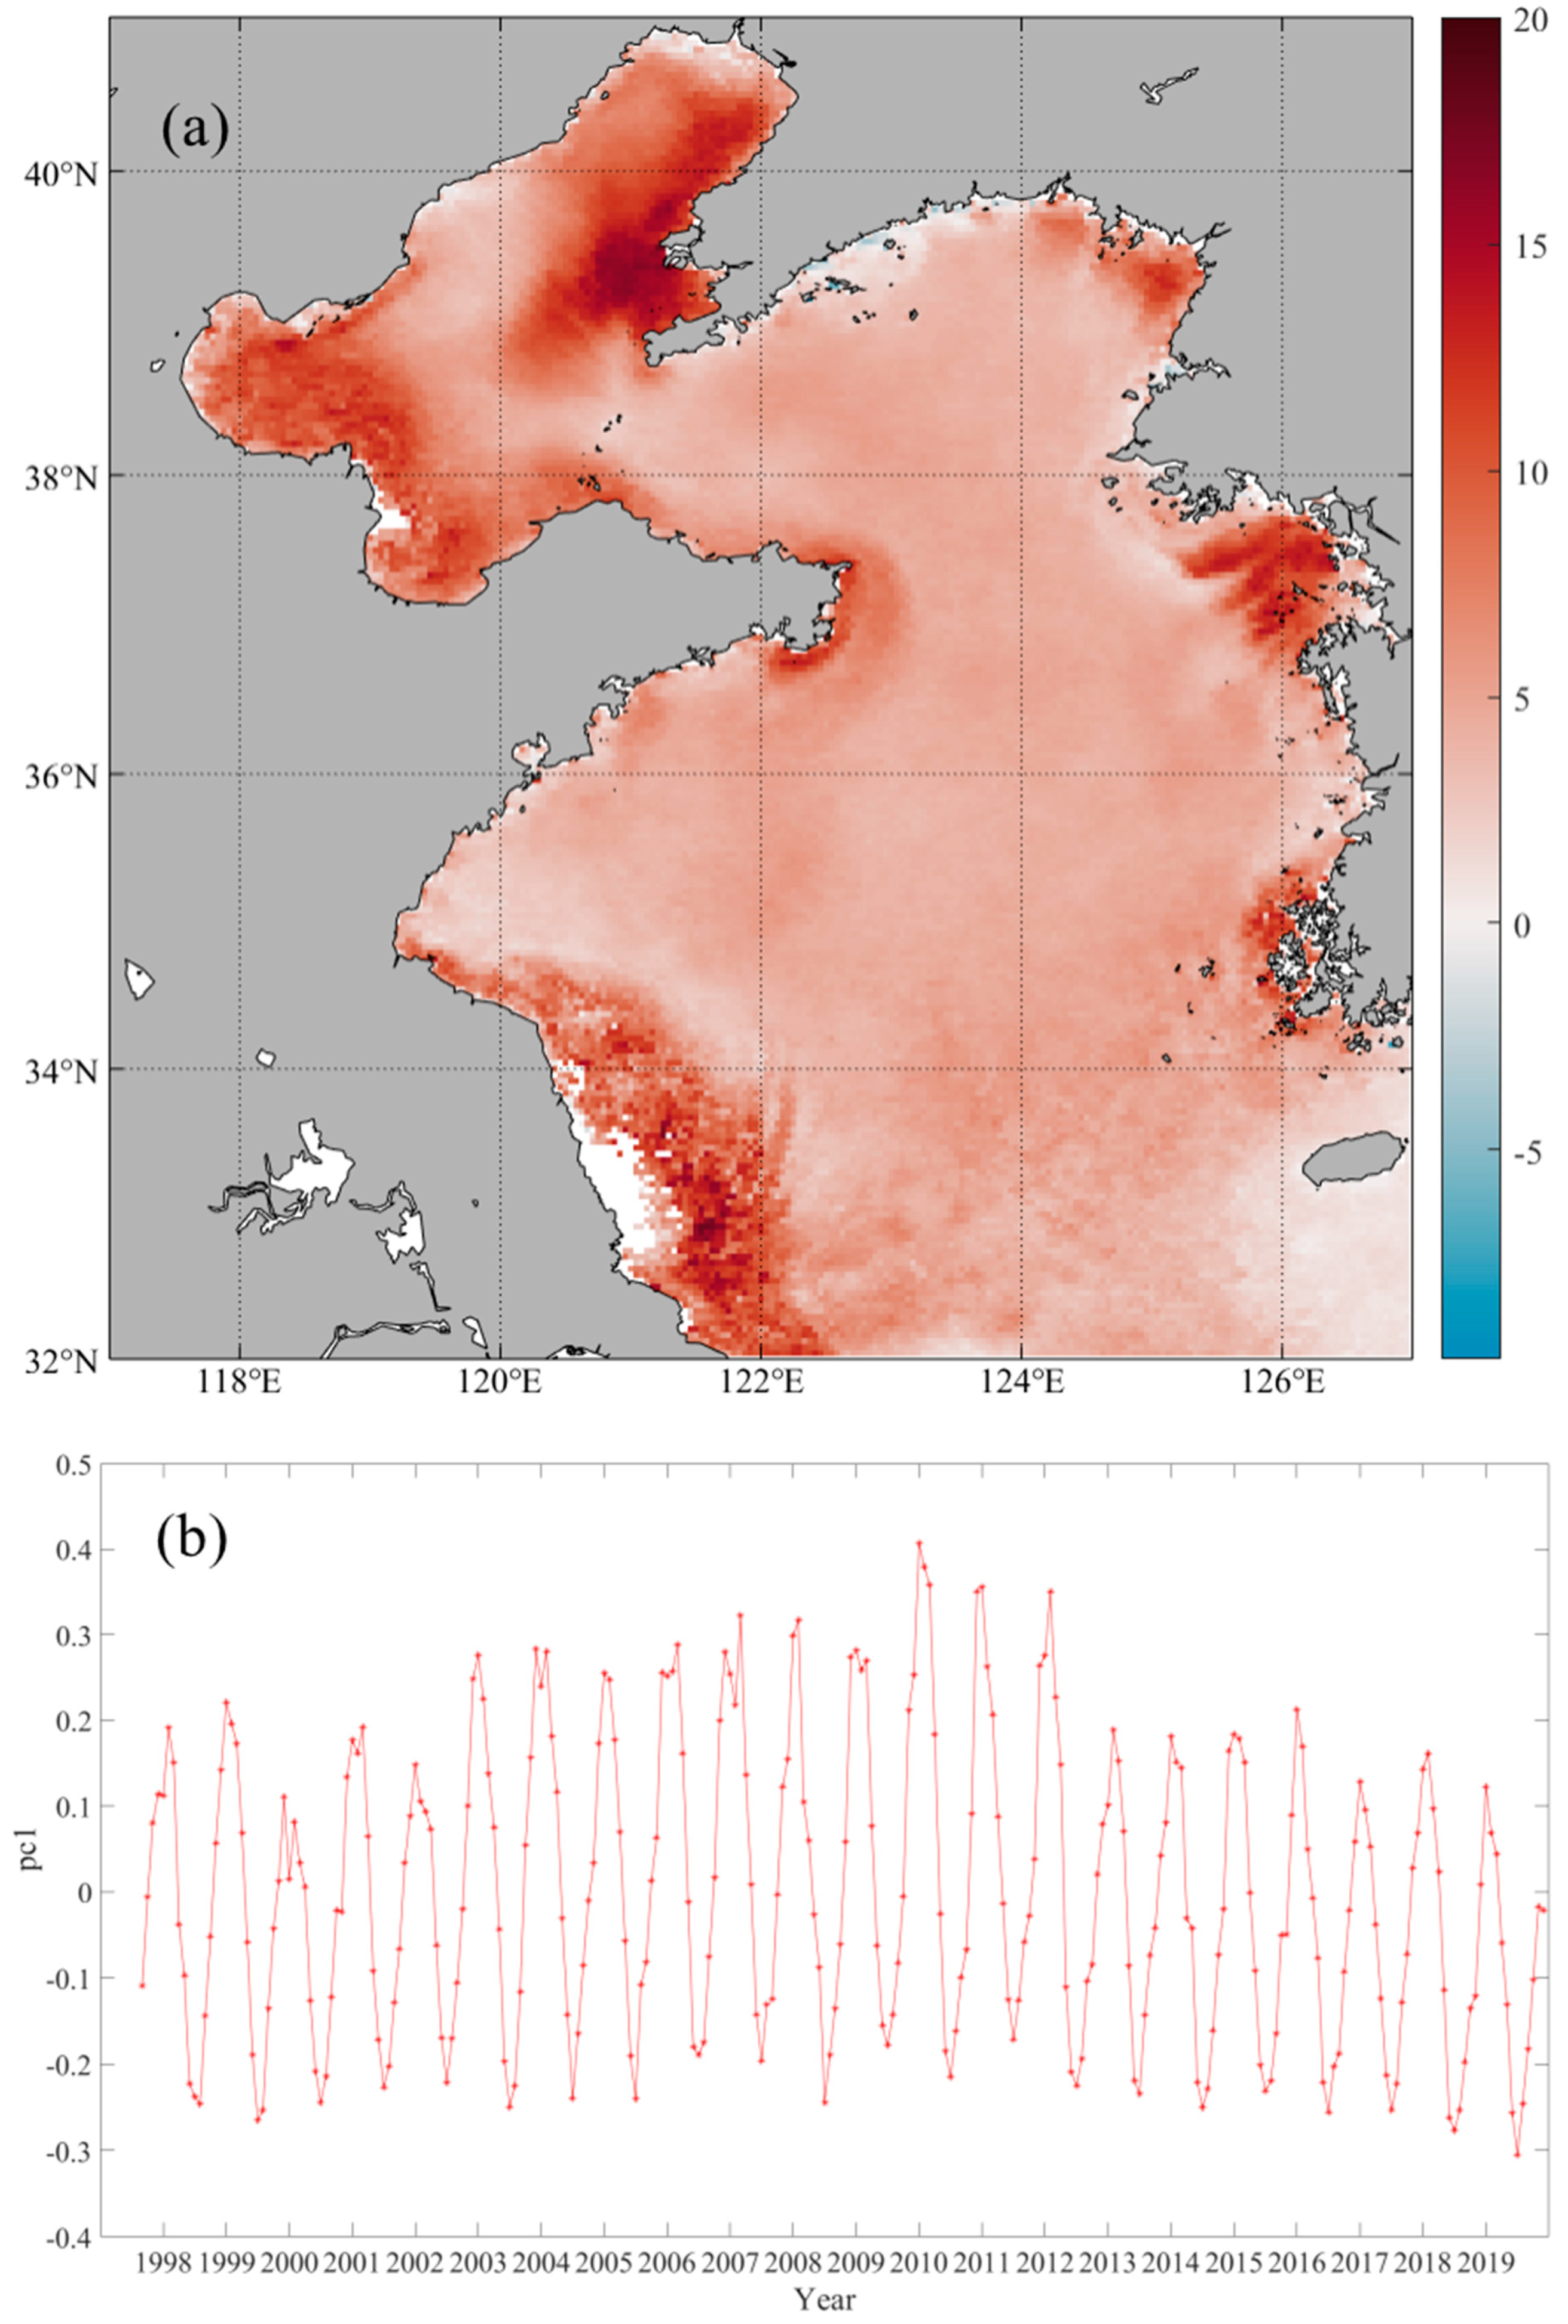
An Empirical Orthogonal Function (EOF) analysis has been conducted to enhance our understanding of FUI variability in the Bohai and Yellow Seas. The first three EOF modes of monthly FUI in the Bohai and Yellow Seas explain approximately 47.51%, 6.13%, and 4.27% of the total variance, respectively. Given the low variance explained by the second and third EOF modes, we thus conclude that the first EOF mode is the most meaningful. Figure 8 displays the first EOF mode of monthly FUI, which accounts for nearly half of the total variance of the FUI datasets. The spatial pattern of the first mode exhibits a consistent positive phase, indicating a nearly uniform temporal variation of FUI in the Bohai and Yellow Seas. The principal component of the first EOF mode (PC1) reveals a robust seasonal signal in FUI variability, with peak values occurring in winter and trough values in summer. Additionally, PC1 demonstrates a strong negative correlation with the regionally averaged SST series (r = −0.87, p < 0.01) and a strong positive correlation with the regionally averaged wind speed series (r = 0.80, p < 0.01).
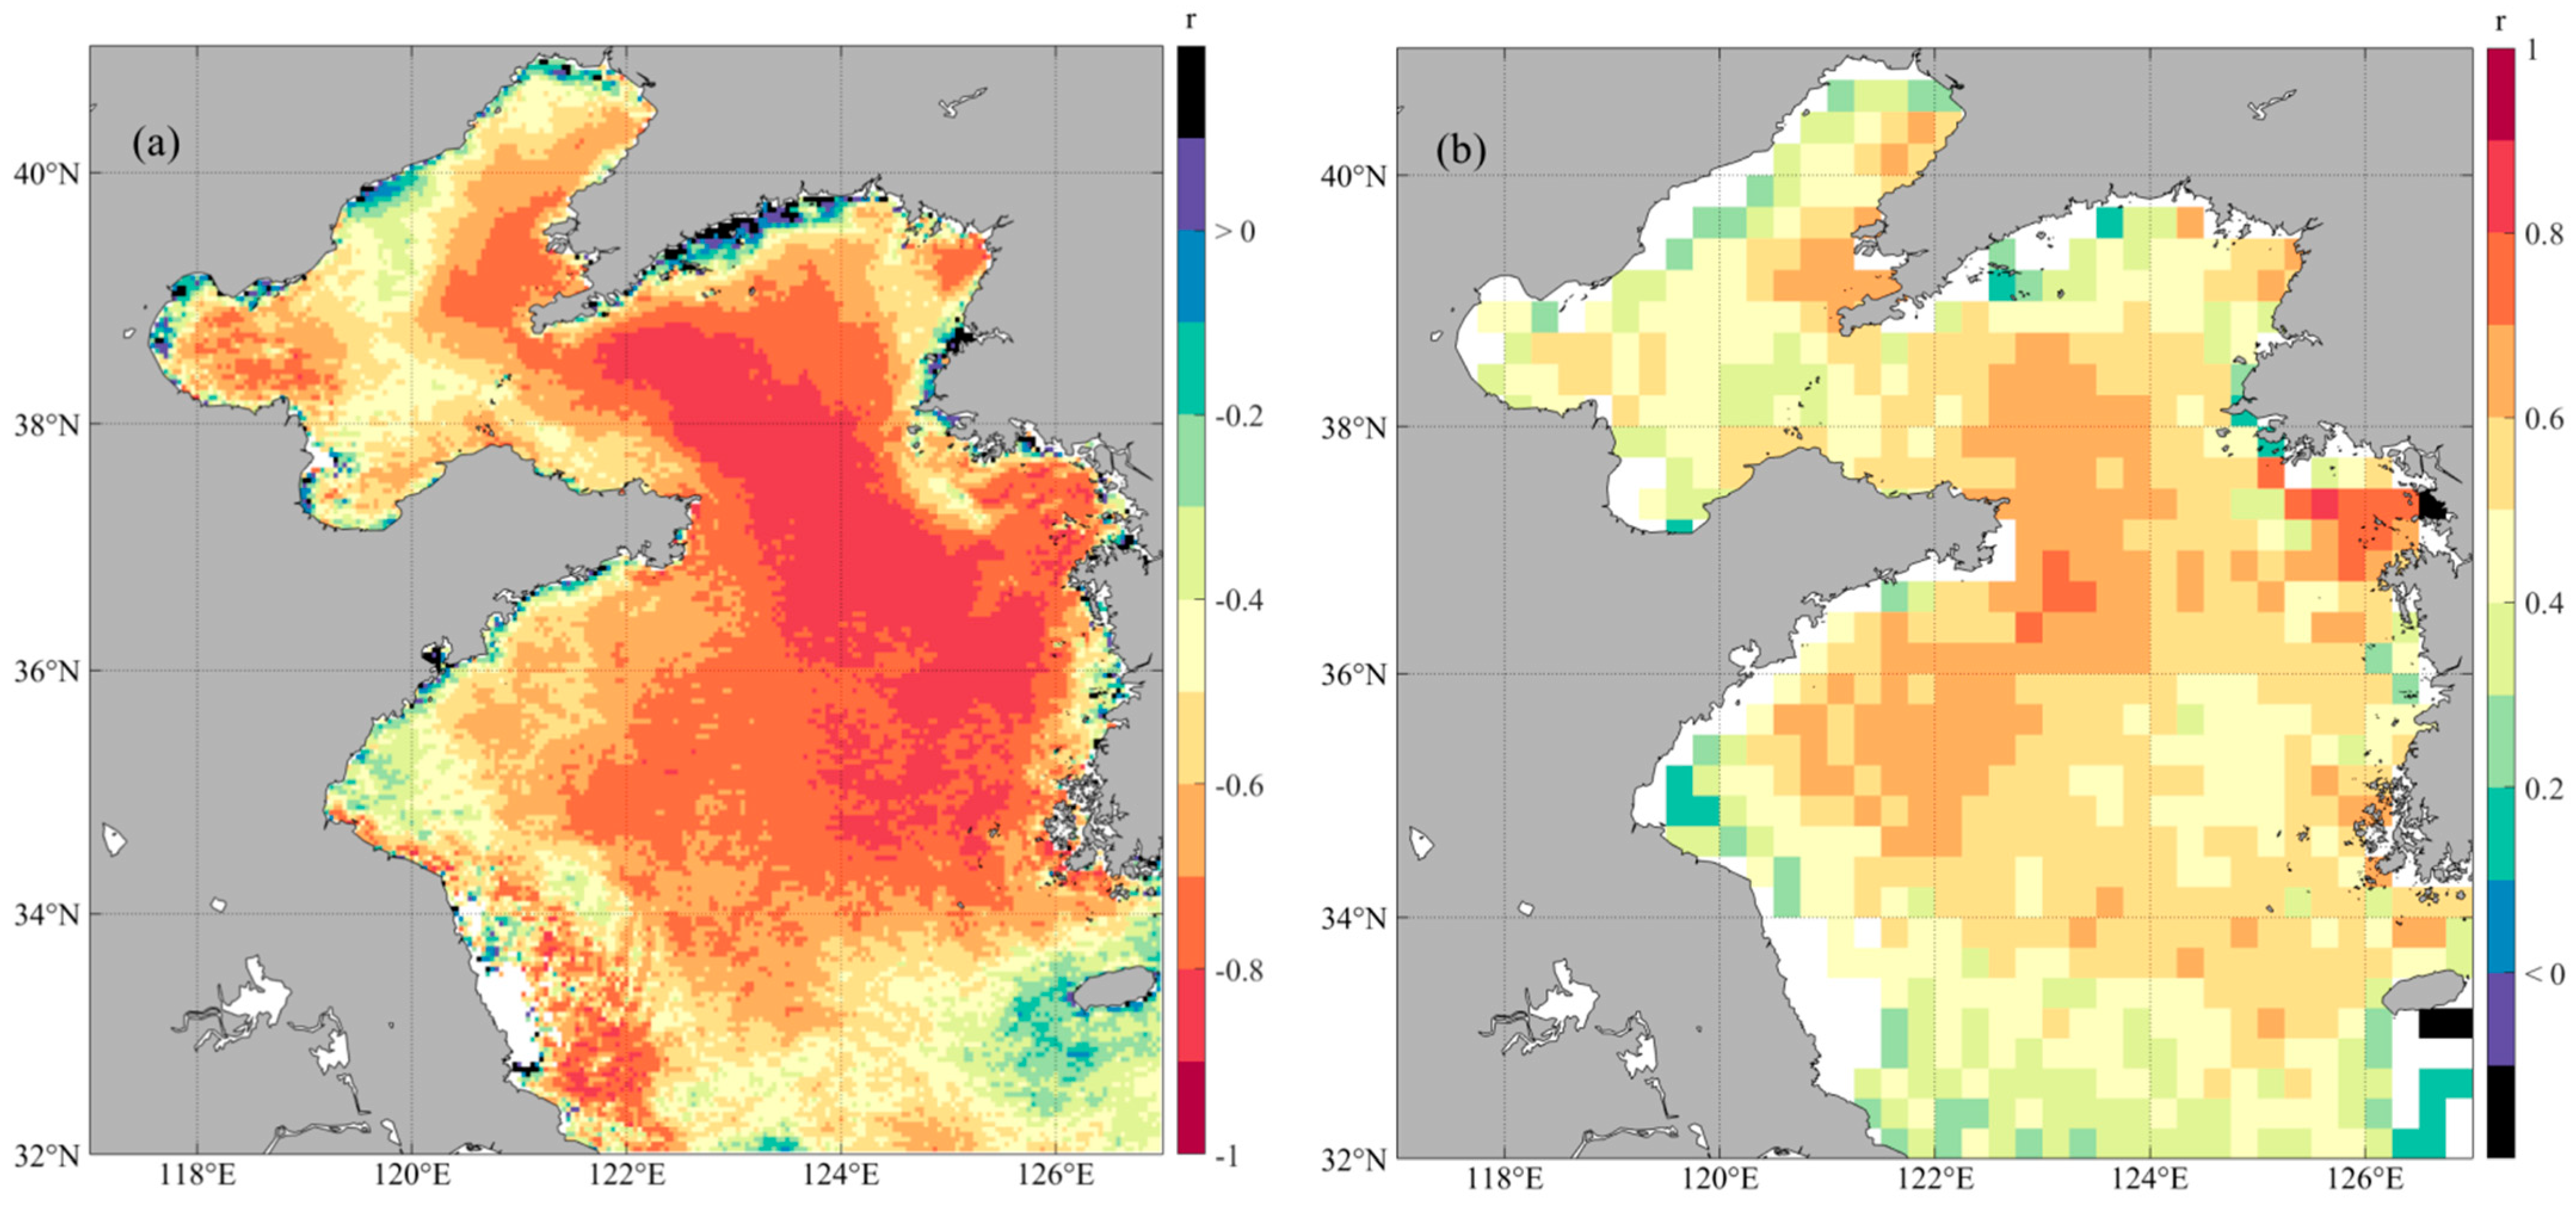
In the shallow waters of the Bohai and Yellow Seas, inorganic suspended sediment is the most significant optically active constituent [41]. Disturbances caused by winds and tides lead to the resuspension of benthonic sediments to the surface [41,42,43,44]. Seasonal variations in the wind field, SST, and ocean stratification, under the influence of the East Asian Monsoon, act as the primary driving forces behind sediment resuspension in the Bohai and Yellow Seas. These factors contribute to the PC1 series and seasonal variations of FUI. During winter, intensified northerly winds and cooling ocean conditions promote strong vertical mixing of the water column in the Bohai and Yellow Seas, facilitating the resuspension of benthonic sediments and resulting in elevated FUI values. Conversely, reduced wind speeds and higher SST during summer create a stable ocean stratification that inhibits sediment resuspension from the bottom to the surface. Consequently, FUI reaches its minimum value in summer. Consistent with expectations, Figure 9 demonstrates significant negative correlations between monthly FUI and SST across the entire Bohai and Yellow Seas, while positive correlations are observed between monthly FUI and wind speed on a pixel-by-pixel basis. These correlations are particularly significant in the central Yellow Sea and northern Bohai Sea, which is consistent with the spatial distribution of a high proportion of seasonal components (Figure 3c). Based on these findings, we thus conclude that the seasonal variations of FUI in the Bohai and Yellow Seas are primarily driven by sediment resuspension processes associated with annual variations in the wind field, SST, and ocean stratification.

4.2. Factors Affecting the Interannual Variations of FUI

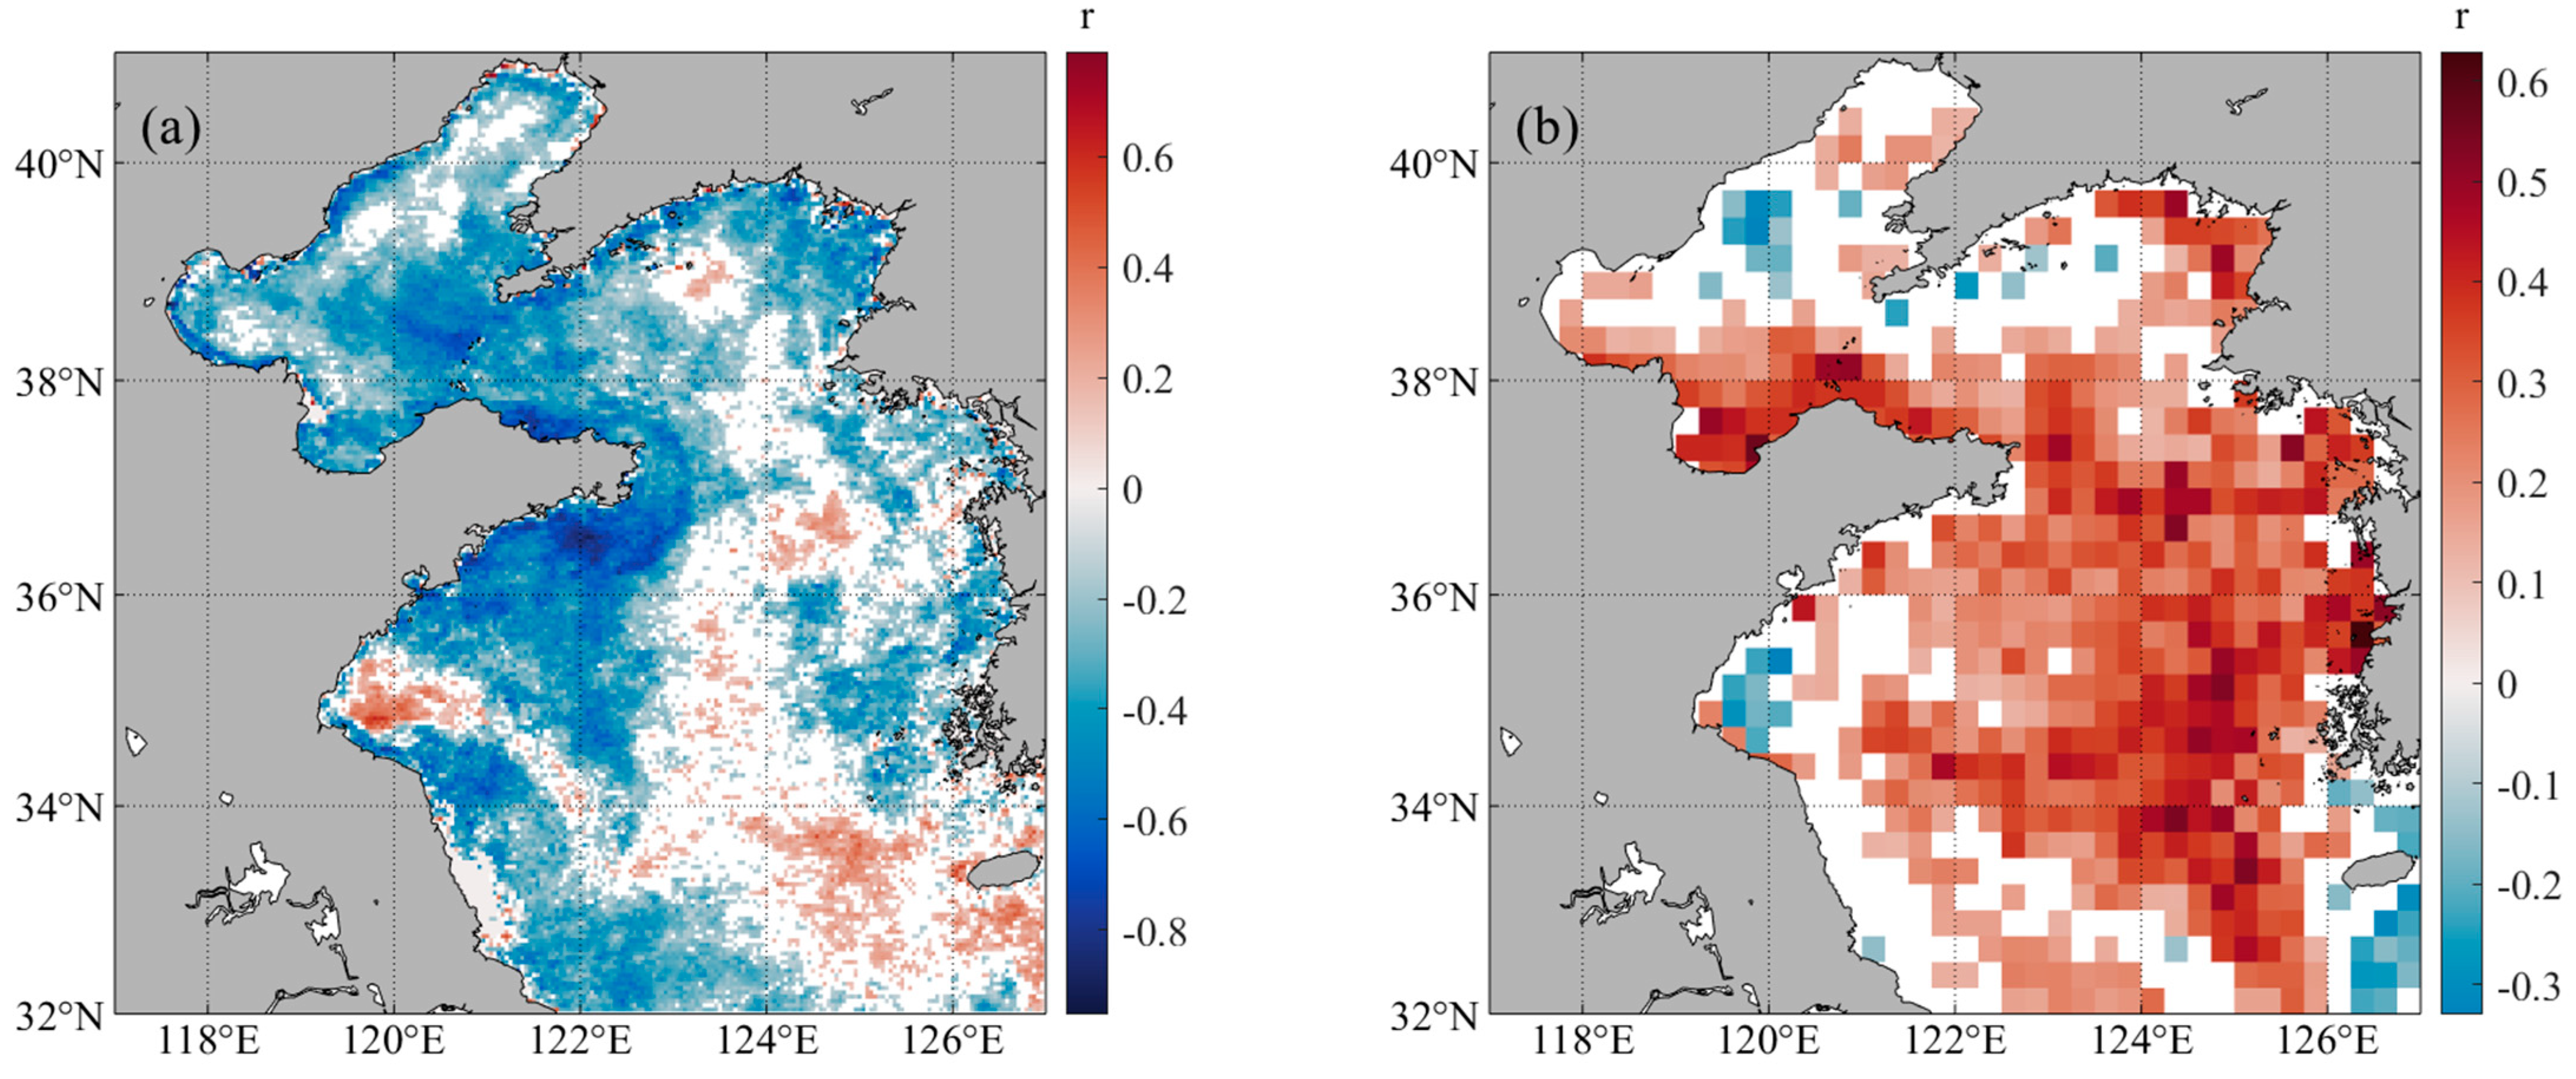
The interannual variations in ocean color conditions are mostly attributable to a combination of natural and anthropogenic factors. At the interannual timescale, a 13-month running mean was applied to monthly anomalies to remove seasonal signals. Correlation analysis reveals that the PC1 anomaly is negatively correlated with the SST anomaly (r = −0.57, p < 0.01) and positively correlated with the wind speed anomaly (r = 0.34, p < 0.01). Such correlations suggest that exceptionally high (low) SST and weakened (strong) winds may lead to reduced (enhanced) vertical mixing in the Bohai and Yellow Seas, thereby suppressing (promoting) the resuspension of bottom sediments and resulting in decreased (increased) FUI values. Figure 10a reveals significantly negative correlation coefficients between monthly FUI anomalies and SST in the Bohai Sea and coastal waters of the Yellow Sea, with the strongest negative correlations observed around the Shandong Peninsula (r < 0.80, p < 0.01). Recent research by Wang et al. [21] reported that, at the interannual timescale, the regionally averaged wind speed series showed no significant correlation with the regionally averaged FUI series in the Bohai Sea. However, the correlations between FUI and wind speed are highly heterogeneous and depend on the region at the interannual timescale. Notably, significant positive correlations between monthly anomalies of FUI and wind speed are primarily observed in the central Yellow Sea and Laizhou Bay (Figure 10b). To conclude, changes in SST and wind speed likely play an important role in influencing the interannual variations of FUI during the study period, and the effects are highly heterogeneous and regional-dependent.
The transport of sediment from the Yellow River plays a crucial role in supplying suspended sediment to the Bohai Sea, potentially influencing the variability of FUI. However, on a pixel-by-pixel basis, there is no significant correlation between the annual mean FUI in the Bohai Sea and the annual runoff or sediment discharge. Supporting this finding, Zhao et al. [35] reported that the direct impact of sediment discharge from the Yellow River on the concentrations of inorganic suspended sediment is limited and is confined to the vicinity of the estuary. Essentially, the majority of sediment discharge tends to accumulate near the mouth of the Yellow River. Consequently, it can be concluded that the interannual variations of FUI in the Bohai Sea are not directly linked to changes in runoff and sediment discharge from the Yellow River.
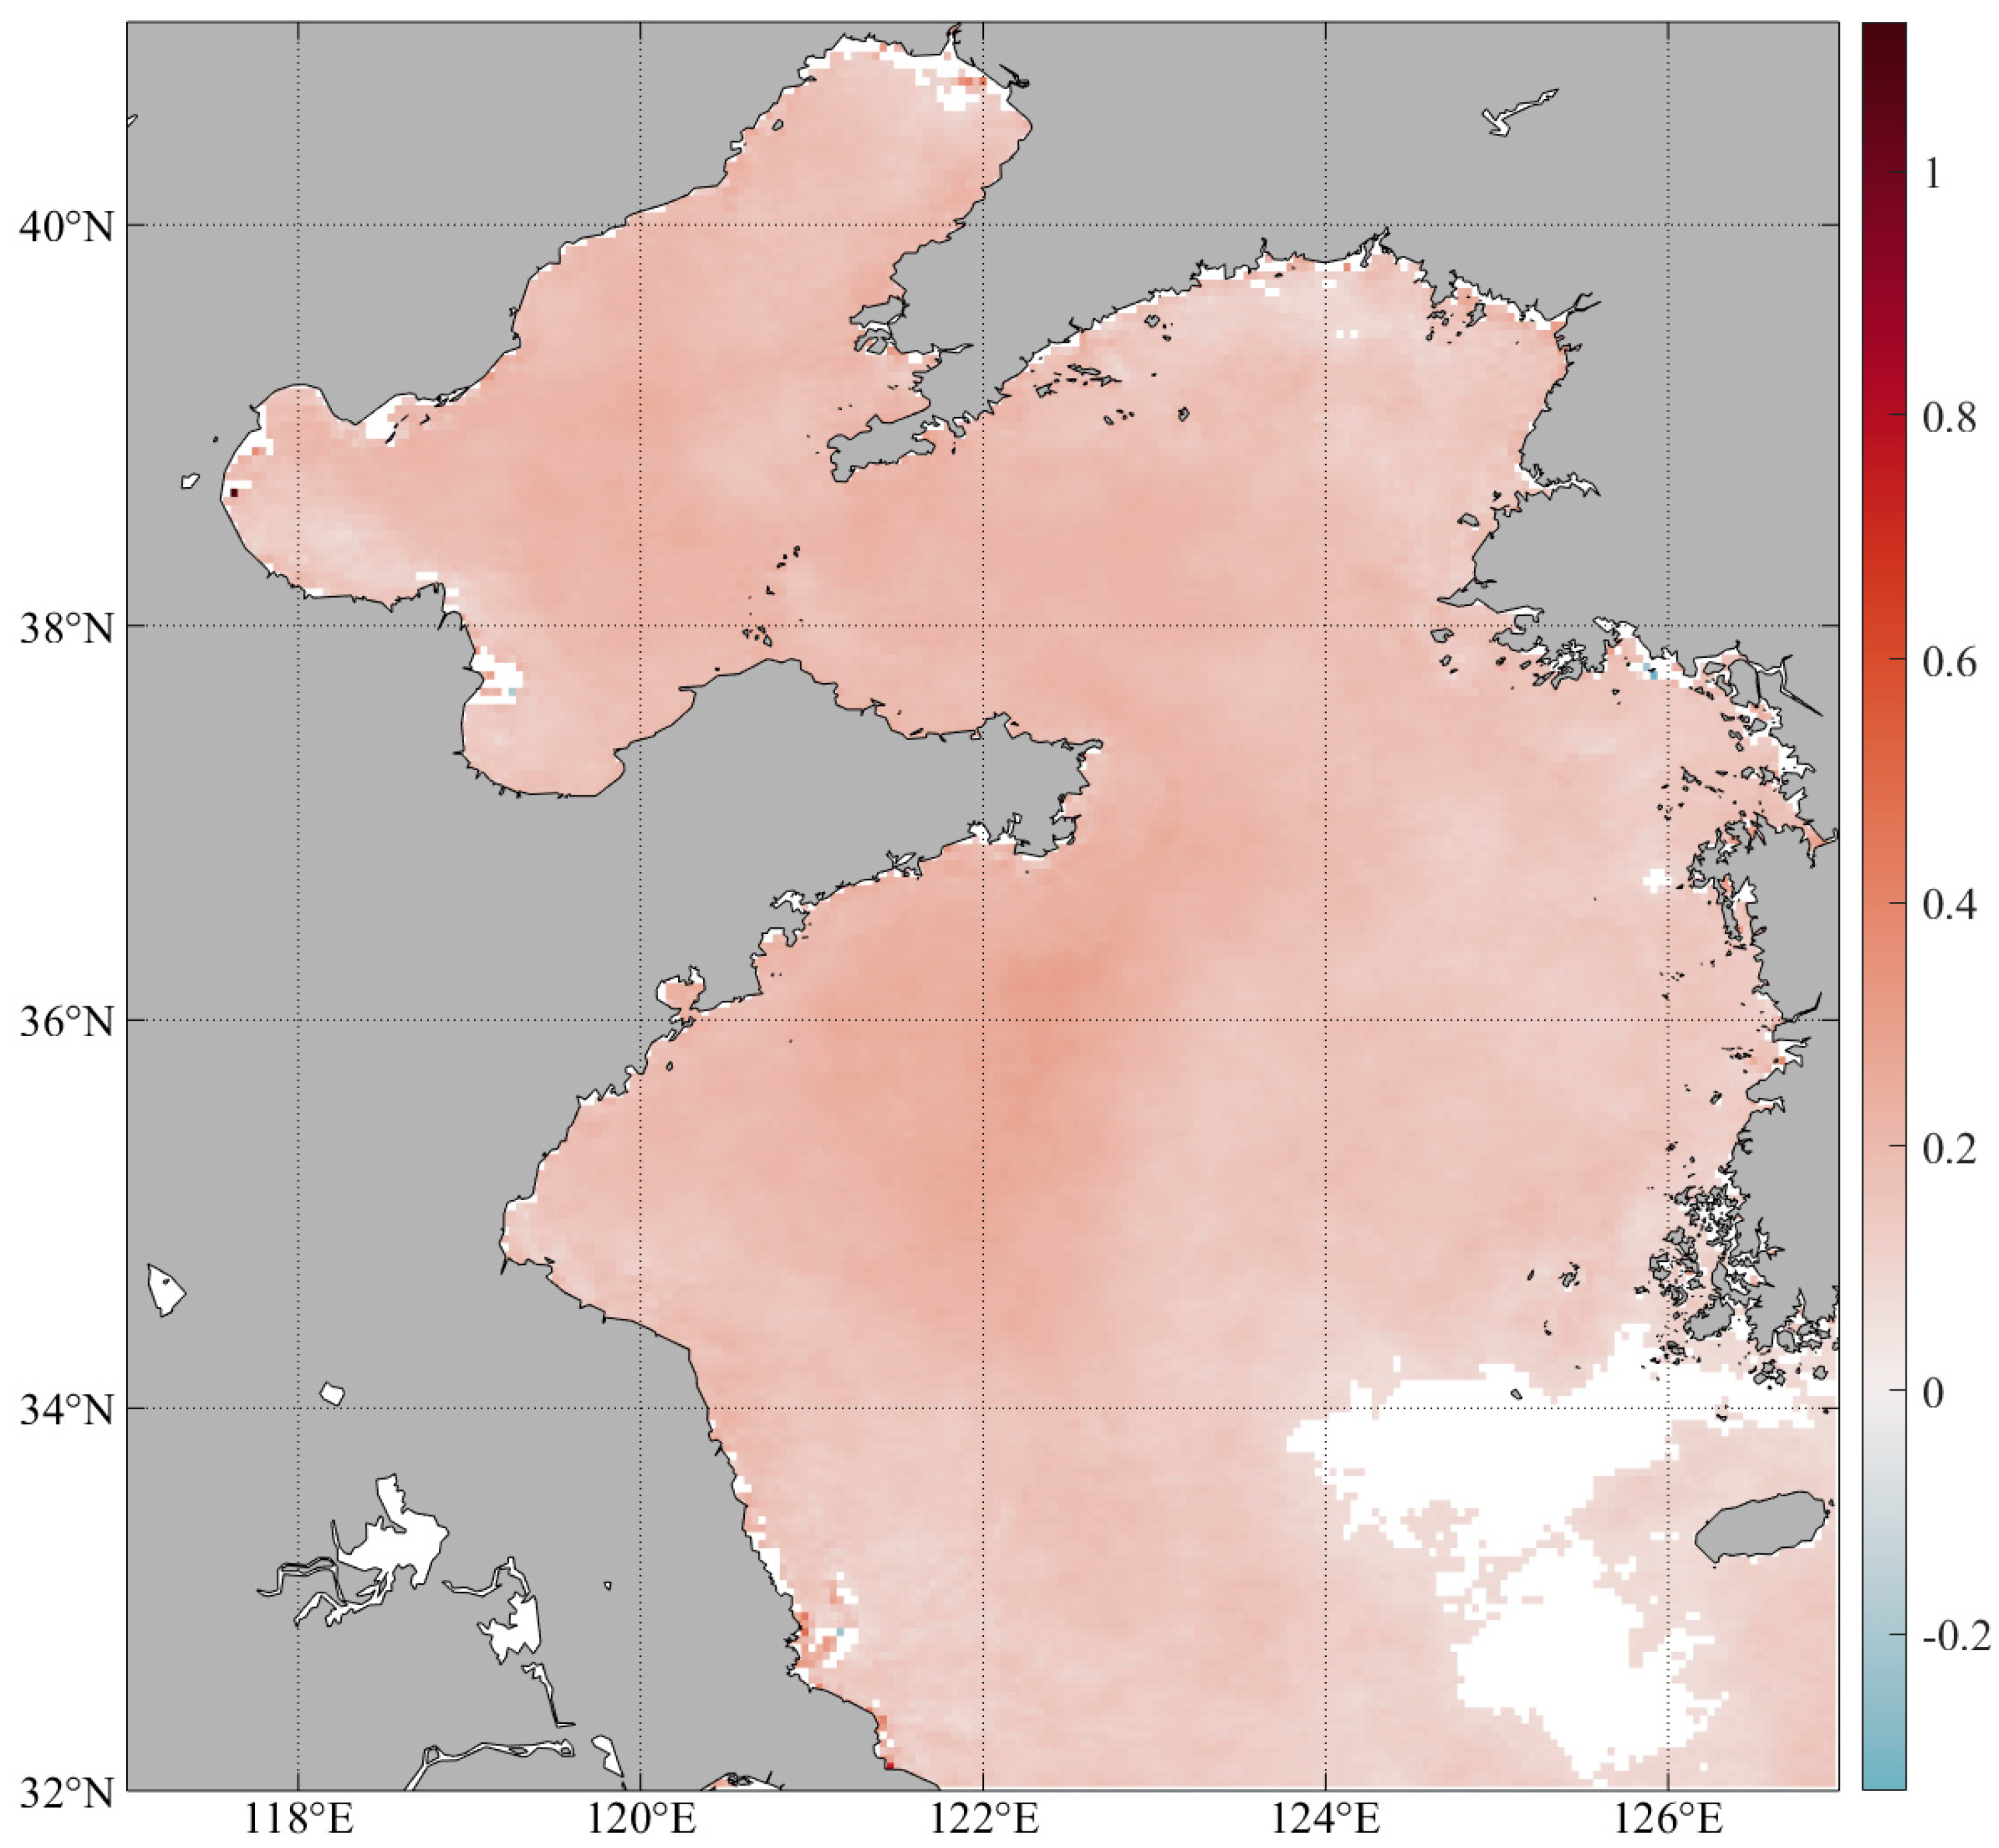
In addition to natural factors, anthropogenic activities play a significant role in influencing the interannual variations of FUI. The degradation of the ecosystem and water quality in the Bohai Sea, caused by the discharge of large amounts of sewage water and the damming of surrounding rivers, has been extensively documented in the last century [22,27,45,46]. However, since 2001, the Chinese government has implemented a series of measures to reduce river damming and solid waste discharge, resulting in a halt in the deterioration of ocean color conditions in the Bohai Sea (Figure 6a and Figure 7a). Over the past decade, the Chinese government has taken more stringent pollution reduction measures to safeguard the Bohai Sea, including the “Bohai Sea Environmental Protection General Plan” and the “Uphill Battle for Integrated Bohai Sea Management.” These comprehensive pollution control initiatives likely contributed to the significant decline in FUI during 2010–2019 (Figure 7a) and the negative FUI slopes observed in the three bays of the Bohai Sea (Figure 6a). Wang et al. [21] also noted a decreasing trend in the area with non-excellent water quality, which exhibited a positive correlation with the annual mean FUI in the Bohai Sea over the past decade. Interestingly, Figure 11 reveals a significant positive trend in SST anomaly across the entire Bohai Sea during 2010–2019, which is associated with the Pacific Decadal Oscillation [47]. The rise in SST can strengthen stratification in the Bohai Sea, impeding the resuspension of bottom sediment to the surface. These processes potentially act as secondary drivers contributing to the decline in FUI in the three bays. In conclusion, the improvement in ocean color conditions in the Bohai Sea is likely attributed to the combined effects of rigorous pollution abatement measures and climate-induced increased SST.
In the central Yellow Sea, the optical properties of water bodies are primarily dominated by Chl-a, except during winter. Satellite-derived Chl-a products indicate an increasing trend during 1998–2010, followed by a decreasing trend during 2011–2019 in the central Yellow Sea [26]. These Chl-a trends are mainly attributed to a combination of rainfall and anthropogenic nutrient emissions. The observed variations in Chl-a are consistent with the interannual variations of FUI presented in Figure 7b, with more pronounced increasing trends resulting in overall positive FUI slopes, as depicted in Figure 6a. From 1998 to 2010, increased rainfall and anthropogenic nutrient emissions led to a rise in land-sourced nutrient accumulation, contributing to the increasing trends in Chl-a and FUI [26]. Conversely, during the period of 2010–2019, the opposite processes occurred. Based on the aforementioned results, we can conclude that the interannual variations of FUI in the central Yellow Sea are primarily driven by fluctuations in rainfall and land-sourced nutrient emissions.

5. Conclusions

In this study, we utilize the Monthly OC CCI Rrs data to retrieve the FUI in the Bohai and Yellow Seas from 1997 to 2019. By analyzing satellite-derived FUI products, we reveal significant ocean color dynamics at various timescales and identify their underlying mechanisms. The key findings of this research are summarized as follows:
(1)
The climatological annual mean FUI shows a decreasing trend from nearshore to offshore waters. Meanwhile, the patterns of overall FUI variability are similar to the multiyear mean FUI map and primarily dominated by the strength of seasonal components;
(2)
The seasonal patterns of FUI in the Bohai and Yellow Seas demonstrate lower values in summer and higher values in winter. These seasonal variations in color can be attributed to the sediment resuspension process, which responds to the annual cycles of wind field, SST, and ocean stratification;
(3)
Based on linear regression analysis, we observe a decreasing trend in the FUI series within the three bays of the Bohai Sea, while the central Yellow Sea experiences an increase in FUI during the study period. The interannual FUI variability is more pronounced in nearshore areas and less prominent in offshore regions. It is influenced by multiple physical and environmental factors, including surface winds, SST, rainfall, and anthropogenic activities. In addition, the interannual variations of FUI in the Bohai Sea are not directly related to the changes in runoff and sediment discharge of the Yellow River;
(4)
At the interannual timescale, a significant decline in the annual mean FUI is identified in the three bays of the Bohai Sea during 2010–2019, and is likely attributed to the marine conservation strategy implemented by the Chinese government and the influence of climate-driven increased SST. In the central Yellow Sea, the interannual variations of FUI are primarily controlled by fluctuations in rainfall and land-sourced nutrient emissions.
To conclude, this study highlights the value of satellite-derived FUI products in assessing seawater quality and monitoring the responses of coastal seas to both natural and human-induced factors.

Author Contributions

Conceptualization, X.L. and Z.R.; methodology, J.G.; software, B.Z.; validation, B.Z., J.G. and Z.R.; formal analysis, Z.R.; investigation, B.Z.; resources, J.G.; data curation, B.Z.; writing—original draft preparation, B.Z.; writing—review and editing, J.G. and Z.R.; visualization, B.Z.; supervision, B.Z.; project administration, Z.R. and X.L.; funding acquisition, B.Z. and X.L. All authors have read and agreed to the published version of the manuscript.

Funding

This work was financially supported by the Laoshan Laboratory (No. LSKJ202202203), the Major Scientific and Technological Innovation Project (MSTIP) of Shandong (2021CXGC010705), the National Natural Science Foundation of China (No. U1806214 and No. 2006210), the National Key Research and Development Program of China (Grant No. 2019YFC1408405).

Data Availability Statement

The monthly Rrs data are downloaded from the ESA-OC-CCI website (https://esa-oceancolour-cci.org/, accessed on 10 May 2023). The monthly SST data from 2002 to 2009 are downloaded from the NASA Ocean-Color website (https://oceancolor.gsfc.nasa.gov/, accessed on 10 May 2023). The monthly SST data from 1997 to 2002 are downloaded from the NOAA (https://data.nodc.noaa.gov/pathfinder/Version5.0/Monthly/, accessed on 10 May 2023). The monthly wind vectors are downloaded from the European Centre for Medium-Range Weather Forecasts (https://cds.climate.copernicus.eu/cdsapp#!/home/, accessed on 10 May 2023). The annual runoff and sediment discharge of the Yellow River is downloaded from the China River Sediment Bulletin (http://www.mwr.gov.cn/, accessed on 10 May 2023).

Acknowledgments

The authors thank the ESA OC CCI project for providing monthly Rrs data, the NASA for providing monthly SST data, the NOAA for providing monthly SST, the European Center for Medium-Range Weather Forecasts for providing monthly wind data, and the China River Sediment Bulletin for providing the annual runoff and sediment discharge of the Yellow River.

Conflicts of Interest

The authors declare no conflict of interest.

References

  1. Wernand, M.R.; van der Woerd, H.J.; Gieskes, W.W.C. Trends in Ocean Colour and Chlorophyll Concentration from 1889 to 2000, Worldwide. PLoS ONE 2013, 8, e63766. [Google Scholar] [CrossRef] [PubMed]
  2. Jafar-Sidik, M.; Bowers, D.G.; Griffiths, J.W. Remote Sensing Observations of Ocean Colour Using the Traditional Forel-Ule Scale. Estuar. Coast. Shelf Sci. 2018, 215, 52–58. [Google Scholar] [CrossRef]
  3. Nie, Y.; Guo, J.; Sun, B.; Lv, X. An Evaluation of Apparent Color of Seawater Based on the In-Situ and Satellite-Derived Forel-Ule Color Scale. Estuar. Coast. Shelf Sci. 2020, 246, 107032. [Google Scholar] [CrossRef]
  4. Forel, F.A. Une nouvelle forme de la gamme de couleur pour l'étude de l'eau Des Lacs. Arch. Sci. Phys. Nat./Soc. Phys. D'histoire Nat. Geneve 1890, 6, 25. [Google Scholar]
  5. Ule, W. Die Bestimmung der Wasserfarbe in den Seen, Kleinere Mittheilungen, A. Petermanns Mittheilungen aus Justin Perthes Geographischer Anstalt; Forschungsbibliothek Gotha der Universität Erfurt: Gotha, Germany, 1892; pp. 70–71. [Google Scholar]
  6. Novoa, S.; Wernand, M.R.; Van der Woerd, H.J. The Forel-Ule Scale Revisited Spectrally: Preparation Protocol, Transmission Measurements and Chromaticity. J. Eur. Opt. Soc. 2013, 8, 13057. [Google Scholar] [CrossRef] [Green Version]
  7. Pitarch, J.; van der Woerd, H.J.; Brewin, R.J.W.; Zielinski, O. Optical Properties of Forel-Ule Water Types Deduced from 15 years of Global Satellite Ocean Color Observations. Remote Sens. Environ. 2019, 231, 111249. [Google Scholar] [CrossRef]
  8. Pitarch, J.; Bellacicco, M.; Marullo, S.; Van Der Woerd, H.J. Global Maps of Forel-Ule Index, Hue Angle and Secchi Disk Depth Derived from 21 Years of Monthly ESA Ocean Colour Climate Change Initiative Data. Earth Syst. Sci. Data 2021, 13, 481–490. [Google Scholar] [CrossRef]
  9. Wang, S.; Li, J.; Zhang, B.; Spyrakos, E.; Tyler, A.N.; Shen, Q.; Zhang, F.; Kuster, T.; Lehmann, M.K.; Wu, Y.; et al. Trophic State Assessment of Global Inland Waters Using a MODIS-Derived Forel-Ule Index. Remote Sens. Environ. 2018, 217, 444–460. [Google Scholar] [CrossRef] [Green Version]
  10. Ye, M.; Sun, Y. Review of the Forel–Ule Index Based on in Situ and Remote Sensing Methods and Application in Water Quality Assessment. Environ. Sci. Pollut. Res. 2022, 29, 13024–13041. [Google Scholar] [CrossRef]
  11. Wernand, M.R.; Van der Woerd, H.J. Ocean Colour Changes in the North Pacific since 1930. J. Eur. Opt. Soc. 2010, 5, 10015s. [Google Scholar] [CrossRef]
  12. Boyce, D.G.; Lewis, M.; Worm, B. Integrating Global Chlorophyll Data from 1890 to 2010. Limnol. Oceanogr. Methods 2012, 10, 840–852. [Google Scholar] [CrossRef]
  13. Garaba, S.P.; Friedrichs, A.; Voß, D.; Zielinski, O. Classifying Natural Waters with the Forel-Ule Colour Index System: Results, Applications, Correlations and Crowdsourcing. Int. J. Environ. Res. Public Health 2015, 12, 16096–16109. [Google Scholar] [CrossRef] [PubMed] [Green Version]
  14. Zhang, W.; Wang, S.; Zhang, B.; Zhang, F.; Shen, Q.; Wu, Y.; Mei, Y.; Qiu, R.; Li, J. Analysis of the Water Color Transitional Change in Qinghai Lake during the Past 35 Years Observed from Landsat and MODIS. J. Hydrol. Reg. Stud. 2022, 42, 101154. [Google Scholar] [CrossRef]
  15. Liu, Y.; Wu, H.; Wang, S.; Chen, X.; Kimball, J.S.; Zhang, C.; Gao, H.; Guo, P. Evaluation of Trophic State for Inland Waters through Combining Forel-Ule Index and Inherent Optical Properties. Sci. Total Environ. 2022, 820, 153316. [Google Scholar] [CrossRef]
  16. Zhao, Y.; Wang, S.; Zhang, F.; Shen, Q.; Li, J.; Yang, F. Remote Sensing-Based Analysis of Spatial and Temporal Water Colour Variations in Baiyangdian Lake after the Establishment of the Xiong’an New Area. Remote Sens. 2021, 13, 1729. [Google Scholar] [CrossRef]
  17. Wang, S.; Li, J.; Zhang, W.; Cao, C.; Zhang, F.; Shen, Q.; Zhang, X.; Zhang, B. A Dataset of Remote-Sensed Forel-Ule Index for Global Inland Waters during 2000–2018. Sci. Data 2021, 8, 26. [Google Scholar] [CrossRef]
  18. Wernand, M.R.; Hommersom, A.; Van Der Woerd, H.J. MERIS-Based Ocean Colour Classification with the Discrete Forel-Ule Scale. Ocean Sci. 2013, 9, 477–487. [Google Scholar] [CrossRef] [Green Version]
  19. van der Woerd, H.J.; Wernand, M.R. True Colour Classification of Natural Waters with Medium-Spectral Resolution Satellites: SeaWiFS, MODIS, MERIS and OLCI. Sensors 2015, 15, 25663–25680. [Google Scholar] [CrossRef] [Green Version]
  20. van der Woerd, H.J.; Wernand, M.R. Hue-Angle Product for Low to Medium Spatial Resolution Optical Satellite Sensors. Remote Sens. 2018, 10, 180. [Google Scholar] [CrossRef] [Green Version]
  21. Wang, L.; Meng, Q.; Wang, X.; Chen, Y.; Zhao, S.; Wang, X. Forel-Ule Index Extraction and Spatiotemporal Variation from MODIS Imagery in the Bohai Sea of China. Optics Express 2023, 31, 17861–17877. [Google Scholar] [CrossRef]
  22. Shang, S.; Lee, Z.; Shi, L.; Lin, G.; Wei, G.; Li, X. Changes in Water Clarity of the Bohai Sea: Observations from MODIS. Remote Sens. Environ. 2016, 186, 22–31. [Google Scholar] [CrossRef] [Green Version]
  23. Yu, H.; Yu, H.; Ito, S.-i.; Tian, Y.; Wang, H.; Liu, Y.; Xing, Q.; Bakun, A.; Kelly, R.M. Potential Environmental Drivers of Japanese Anchovy (Engraulis japonicus) Recruitment in the Yellow Sea. J. Mar. Syst. 2020, 212, 103431. [Google Scholar] [CrossRef]
  24. Yu, D.; Yang, L.; Li, Y.; Xiang, J.; Zhao, C. Spatiotemporal Changes and Influencing Factors of Water Clarity in the Yellow Sea over the Past 20 Years. Mar. Pollut. Bull. 2023, 191, 114904. [Google Scholar] [CrossRef] [PubMed]
  25. Mao, Y.; Wang, S.; Qiu, Z.; Sun, D.; Bilal, M. Variations of Transparency Derived from GOCI in the Bohai Sea and the Yellow Sea. Opt. Express 2018, 26, 12191. [Google Scholar] [CrossRef]
  26. Zhai, F.; Liu, Z.; Gu, Y.; He, S.; Hao, Q.; Li, P. Satellite-Observed Interannual Variations in Sea Surface Chlorophyll-a Concentration in the Yellow Sea Over the Past Two Decades. J. Geophys. Res. Ocean. 2023, 128, e2022JC019528. [Google Scholar] [CrossRef]
  27. Xiang, J.; Cui, T.; Li, X.; Zhang, Q.; Mu, B.; Liu, R.; Zhao, W. Evaluating the Effectiveness of Coastal Environmental Management Policies in China: The Case of Bohai Sea. J. Environ. Manag. 2023, 338, 117812. [Google Scholar] [CrossRef]
  28. Pitarch, J.; Bellacicco, M.; Organelli, E.; Volpe, G.; Colella, S.; Vellucci, V.; Marullo, S. Retrieval of Particulate Backscattering Using Field and Satellite Radiometry: Assessment of the QAA Algorithm. Remote Sens. 2020, 12, 77. [Google Scholar] [CrossRef] [Green Version]
  29. Jackson, T.; Chuprin, A.; Sathyendranath, S.; Grant, M.; Zühlke, M.; Dingle, J.; Storm, T.; Boettcher, M.; Jackson, T.; Groom, S.; et al. Ocean Colour Climate Change Initiative (OC_CCI)—Interim Phase, Product User Guide, D3.4 PUG; European Space Agency: Paris, France, 2020. [Google Scholar]
  30. Ma, C.; Zhao, J.; Ai, B.; Sun, S. Two-Decade Variability of Sea Surface Temperature and Chlorophyll-a in the Northern South China Sea as Revealed by Reconstructed Cloud-Free Satellite Data. IEEE Trans. Geosci. Remote Sens. 2021, 59, 9033–9046. [Google Scholar] [CrossRef]
  31. Manatsa, D.; Chingombe, W.; Matarira, C.H. The Impact of the Positive Indian Ocean Dipole on Zimbabwe Droughts Tropical Climate Is Understood to Be Dominated By. Int. J. Climatol. 2008, 2029, 2011–2029. [Google Scholar] [CrossRef]
  32. Beckers, J.M.; Rixen, M. EOF Calculations and Data Filling from Incomplete Oceanographic Datasets. J. Atmos. Ocean. Technol. 2003, 20, 1839–1856. [Google Scholar] [CrossRef]
  33. Alvera-Azcárate, A.; Barth, A.; Rixen, M.; Beckers, J.M. Reconstruction of Incomplete Oceanographic Data Sets Using Empirical Orthogonal Functions: Application to the Adriatic Sea Surface Temperature. Ocean Model. 2005, 9, 325–346. [Google Scholar] [CrossRef] [Green Version]
  34. Kim, S.H.; Yang, C.S.; Ouchi, K. Spatio-Temporal Patterns of Secchi Depth in the Waters around the Korean Peninsula Using MODIS Data. Estuar. Coast. Shelf Sci. 2015, 164, 172–182. [Google Scholar] [CrossRef]
  35. Zhao, G.; Jiang, W.; Wang, T.; Chen, S.; Bian, C. Decadal Variation and Regulation Mechanisms of the Suspended Sediment Concentration in the Bohai Sea, China. J. Geophys. Res. Ocean. 2022, 127, e2021JC017699. [Google Scholar] [CrossRef]
  36. Lim, H.G.; Dunne, J.P.; Stock, C.A.; Kwon, M. Attribution and Predictability of Climate-Driven Variability in Global Ocean Color. J. Geophys. Res. Ocean. 2022, 127, e2022JC019121. [Google Scholar] [CrossRef]
  37. Zhang, H.; Qiu, Z.; Sun, D.; Wang, S.; He, Y. Seasonal and Interannual Variability of Satellite-Derived Chlorophyll-a (2000–2012) in the Bohai Sea, China. Remote Sens. 2017, 9, 582. [Google Scholar] [CrossRef] [Green Version]
  38. Hao, Q.; Chai, F.; Xiu, P.; Bai, Y.; Chen, J.; Liu, C.; Le, F.; Zhou, F. Spatial and Temporal Variation in Chlorophyll a Concentration in the Eastern China Seas Based on a Locally Modified Satellite Dataset. Estuar. Coast. Shelf Sci. 2019, 220, 220–231. [Google Scholar] [CrossRef]
  39. Chen, J.; Han, Q.; Chen, Y.; Li, Y. A Secchi Depth Algorithm Considering the Residual Error in Satellite Remote Sensing Reflectance Data. Remote Sens. 2019, 11, 1948. [Google Scholar] [CrossRef] [Green Version]
  40. Wang, Y.; Tian, X.; Gao, Z. Evolution of Satellite Derived Chlorophyll-a Trends in the Bohai and Yellow Seas during 2002–2018: Comparison between Linear and Nonlinear Trends. Estuar. Coast. Shelf Sci. 2021, 259, 107449. [Google Scholar] [CrossRef]
  41. Chen, S.; Zhang, T.; Hu, L.; Xue, C.; Wu, X. Vertical Variations in Optical Properties of the Waters in the Yellow Sea and Bohai Sea at Seasonal Scales and Their Influencing Mechanisms. Opt. Express 2018, 26, 4112. [Google Scholar] [CrossRef]
  42. Shi, W.; Wang, M. Satellite Views of the Bohai Sea, Yellow Sea, and East China Sea. Prog. Oceanogr. 2012, 104, 30–45. [Google Scholar] [CrossRef]
  43. Guo, J.; Pan, H.; Cao, R.; Wang, J.; Lv, X. Multiple Timescale Variations in Water Transparency in the Eastern China Seas over the Period 1997–2019. J. Geophys. Res. Ocean. 2023, 128, e2022JC019170. [Google Scholar] [CrossRef]
  44. Zhou, Z.; Bian, C.; Chen, S.; Li, Z.; Jiang, W.; Wang, T.; Bi, R. Sediment Concentration Variations in the East China Seas over Multiple Timescales Indicated by Satellite Observations. J. Mar. Syst. 2020, 212, 103430. [Google Scholar] [CrossRef]
  45. Gao, X.; Zhou, F.; Chen, C.-T.A. Pollution Status of the Bohai Sea: An Overview of the Environmental Quality Assessment Related Trace Metals. Environ. Int. 2014, 62, 12–30. [Google Scholar] [CrossRef] [PubMed]
  46. Guo, J.; Lu, J.; Zhang, Y.; Zhou, C.; Zhang, S.; Wang, D.; Lv, X. Variability of Chlorophyll-a and Secchi Disk Depth (1997–2019) in the Bohai Sea Based on Monthly Cloud-Free Satellite Data Reconstructions. Remote Sens. 2022, 14, 639. [Google Scholar] [CrossRef]
  47. Zhai, F.; Wu, W.; Gu, Y.; Li, P.; Song, X.; Liu, P.; Liu, Z.; Chen, Y.; He, J. Interannual-Decadal Variation in Satellite-Derived Surface Chlorophyll-a Concentration in the Bohai Sea over the Past 16 Years. J. Mar. Syst. 2021, 215, 103496. [Google Scholar] [CrossRef]
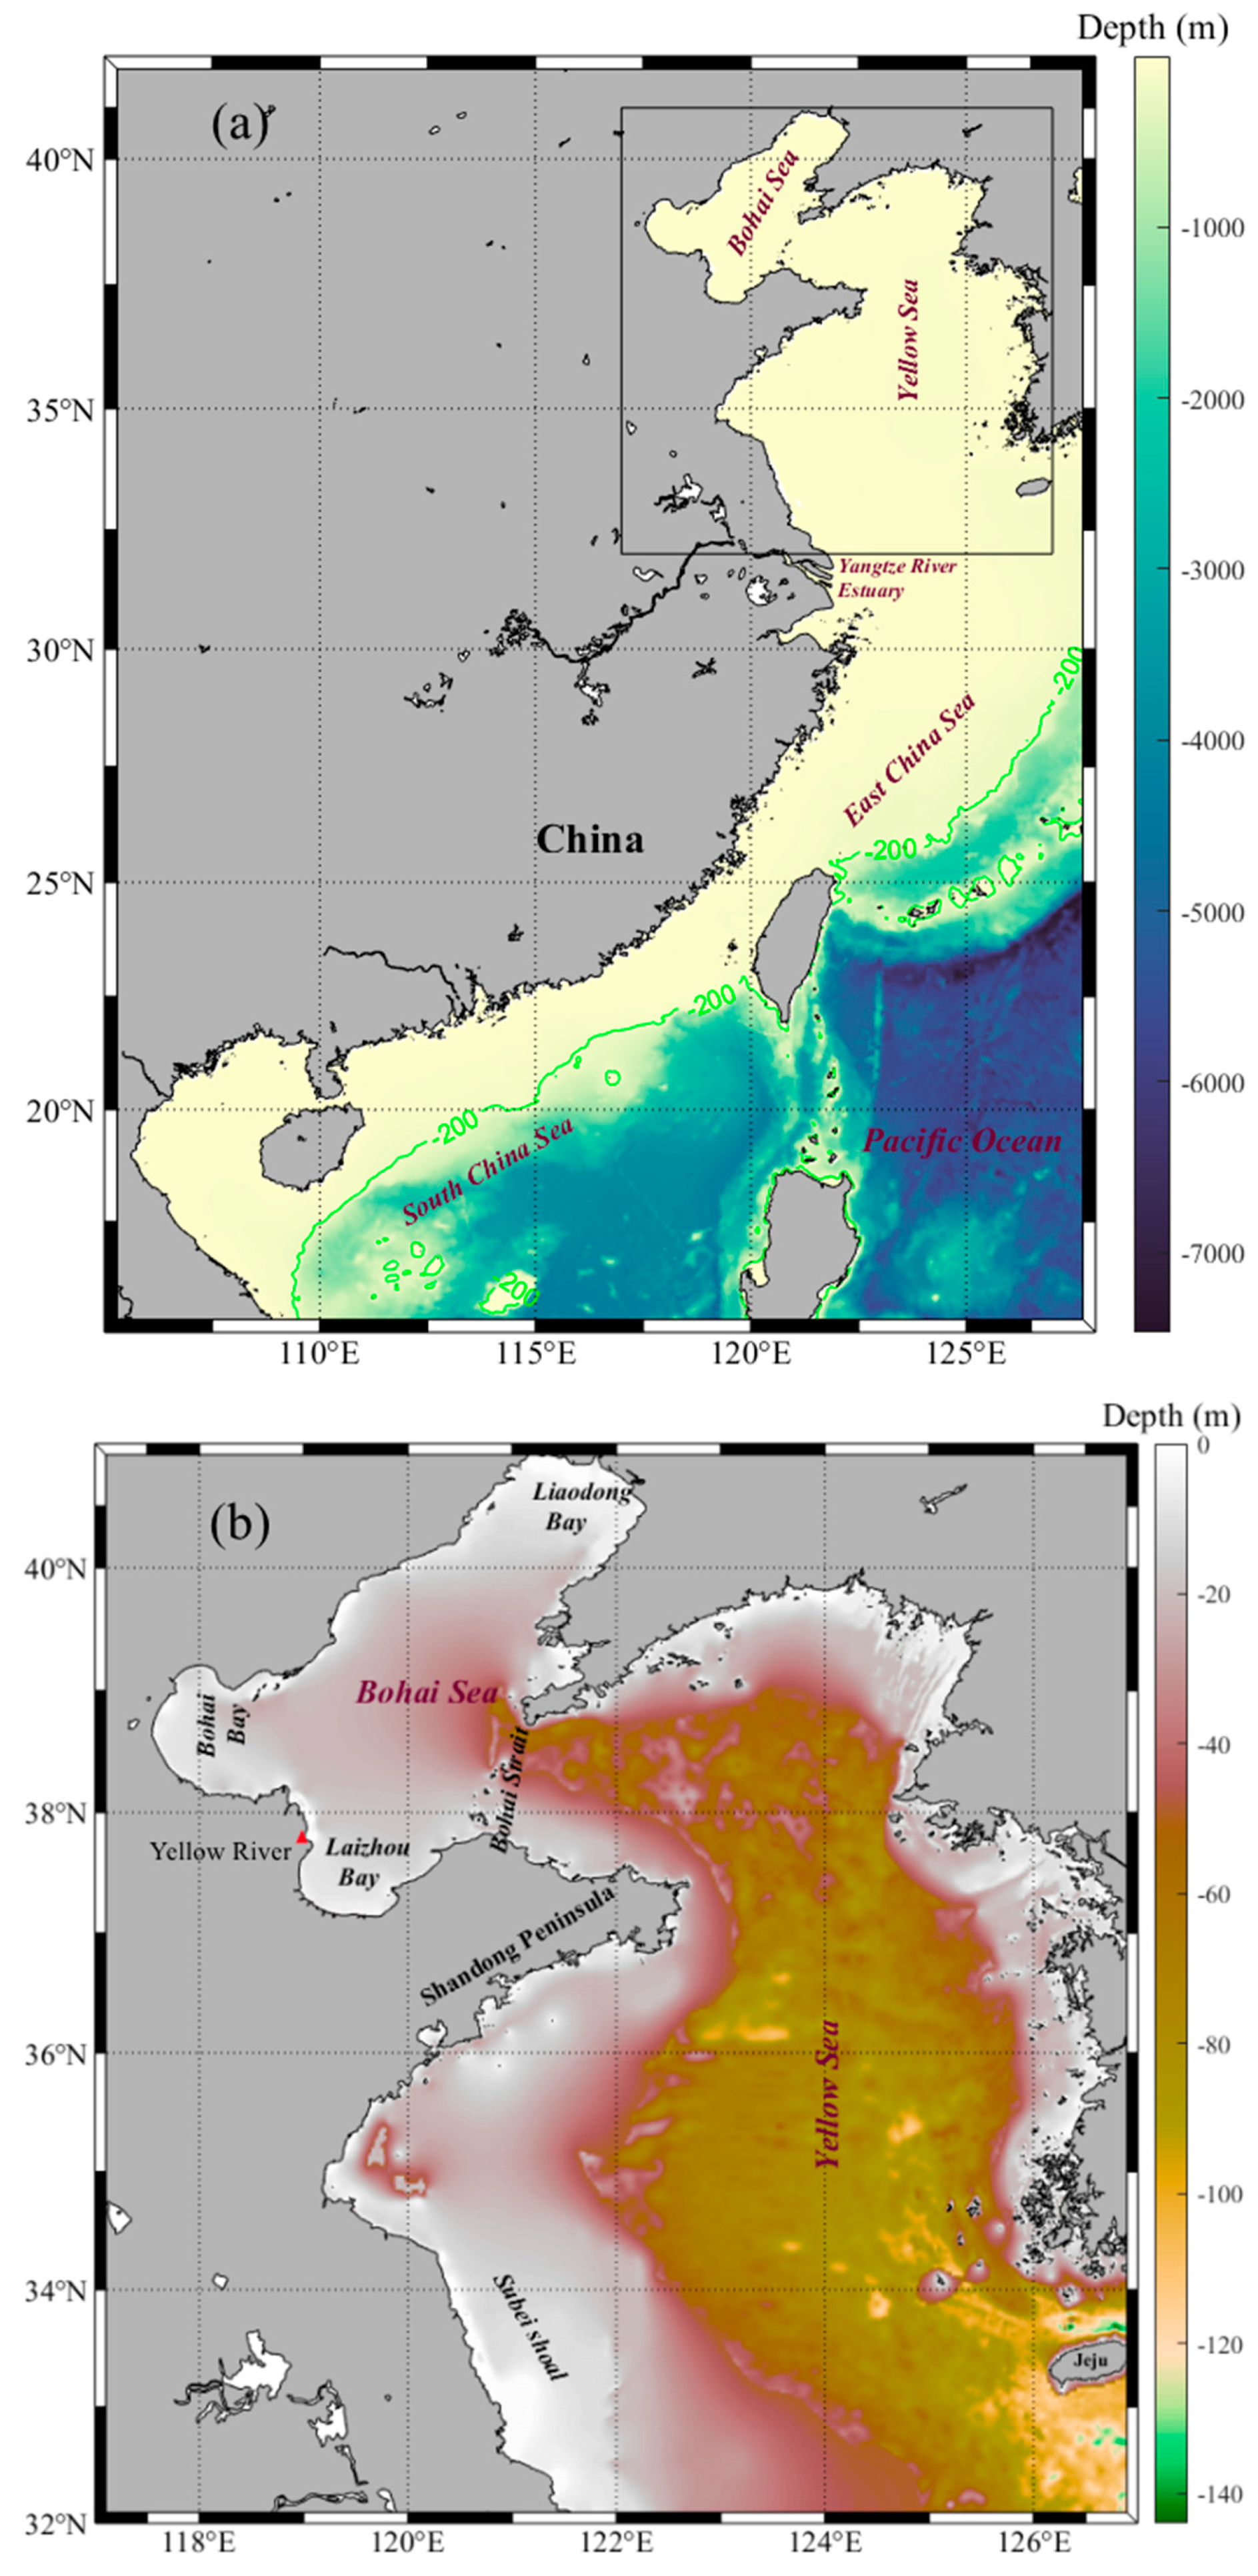
Figure 1. Location (a) and bathymetry (b) of the Bohai and Yellow Seas.
Remotesensing 15 03487 g001
Figure 2. Climatological annual mean FUI (a) and area percentage of 21-level FUI (b) for the Bohai and Yellow Seas.
Remotesensing 15 03487 g002
Figure 3. Maps of the SD (a) and CV (b) of satellite-derived FUI during 1997–2019. (c) Explained total variance of FUI by seasonal cycle (%), which is calculated following the description of Lim et al. [36].
Remotesensing 15 03487 g003
Figure 4. Monthly climatological FUI maps in the Bohai and Yellow Seas.
Remotesensing 15 03487 g004
Figure 5. Climatological seasonal patterns of the regionally averaged FUI in the Bohai and Yellow Seas. The vertical bars represent SD .
Remotesensing 15 03487 g005
Figure 6. Long-term trends ((a), year−1, p < 0.05) and SD (b) of monthly FUI anomaly for the Bohai and Yellow Seas during 1997–2019.
Remotesensing 15 03487 g006
Figure 7. Annual mean FUI changes for Laizhou Bay, Bohai Bay, Liaodong Bay (a) and central Yellow Sea ((b), 34°N–36°N, 122°E–124°E) during 1998–2019.
Remotesensing 15 03487 g007
Figure 8. Spatial pattern (a) and principal component (b) of the first EOF mode of monthly FUI.
Remotesensing 15 03487 g008
Figure 9. Correlation maps between monthly FUI and SST (a) and wind speed (b) during the study period (p < 0.05).
Remotesensing 15 03487 g009
Figure 10. Correlation maps between monthly FUI anomaly and SST anomaly (a) and wind speed anomaly (b) during the study period (p < 0.05).
Remotesensing 15 03487 g010
Figure 11. Linear trends of SST anomaly (°C/year) for the Bohai and Yellow Seas during 2010–2019.
Remotesensing 15 03487 g011
Disclaimer/Publisher’s Note: The statements, opinions and data contained in all publications are solely those of the individual author(s) and contributor(s) and not of MDPI and/or the editor(s). MDPI and/or the editor(s) disclaim responsibility for any injury to people or property resulting from any ideas, methods, instructions or products referred to in the content.