Abstract
Freezing/thawing indices are important indicators of the dynamics of frozen ground on the Qinghai-Tibet Plateau (QTP), especially in areas with limited observations. Based on the numerical outputs of Community Land Surface Model version 4.5 (CLM4.5) from 1961 to 2010, this study compared the spatial and temporal variations between air freezing/thawing indices (2 m above the ground) and ground surface freezing/thawing indices in permafrost and seasonally frozen ground (SFG) across the QTP after presenting changes in frozen ground distribution in each decade in the context of warming and wetting. The results indicate that an area of 0.60 × 10⁶ km2 of permafrost in the QTP degraded to SFG in the 1960s–2000s, and the primary shrinkage period occurred in the 2000s. The air freezing index (AFI) and ground freezing index (GFI) decreased dramatically at rates of 71.00 °C·d/decade and 34.33 °C·d/decade from 1961 to 2010, respectively. In contrast, the air thawing index (ATI) and ground thawing index (GTI) increased strikingly, with values of 48.13 °C·d/decade and 40.37 °C·d/decade in the past five decades, respectively. Permafrost showed more pronounced changes in freezing/thawing indices since the 1990s compared to SFG. The changes in thermal regimes in frozen ground showed close relations to air warming until the late 1990s, especially in 1998, when the QTP underwent the most progressive warming. However, a sharp increase in the annual precipitation from 1998 began to play a more controlling role in thermal degradation in frozen ground than the air warming in the 2000s. Meanwhile, the following vegetation expansion hiatus further promotes the thermal instability of frozen ground in this highly wet period.
1. Introduction
The Qinghai-Tibet Plateau (QTP) ranks as the highest plateau in low-latitude areas around the world. It has also been called the “third pole” for its high average elevation [1,2,3,4]. In terms of the global mid-latitude area, the QTP has the largest distribution of permafrost (~1.06 million km2), which is defined as the rock or soil that remains at or below 0 °C for two or more consecutive years and is a key component in the cryosphere [5,6,7]. Due to its lower latitude and higher elevation, the permafrost on the QTP is more sensitive to climate change compared with permafrost in high-altitude areas such as Canada and Russia [8,9]. The dynamic change of the frozen ground distribution under the background of global warming is of great importance for hydrology cycles, ecosystems, engineering infrastructure, and climate change [10,11,12,13].
Previous studies have reported that, as a result of global warming, the frozen ground on the QTP had warmed up in recent decades and the warming is more intense than the Arctic and similar mid-latitude regions [14,15]. Wu and Zhang [16] monitored 10 boreholes in permafrost areas along the Qinghai-Tibetan Highway up to 10.7 m depth half-monthly from 1996 to 2006. They reported that the mean annual temperatures at 6.0 m depth have increased from 0.12 °C to 0.67 °C, with an average value of 0.43 °C. Simultaneously, they conducted a further investigation on the active layer thickness and found that it increased sharply (about 39 cm) from 1983 to 2005 [17]. To characterize the freezing and thawing states of the frozen ground, changes in near-surface air freezing/thawing indices (AFI/ATI) and ground-surface freezing/thawing indices (GFI/GTI) on the QTP have also been analyzed using in situ observations [18]. The results show that the QTP has undergone a prominent increasing trend in the thawing index and a decreasing trend in the freezing index since 1998 [19]. It is consistent with the pivotal year of 1998, when the QTP experienced dramatic wetting and warming thereafter [20]. Climate warming also benefits vegetation growth [21,22,23,24] and can induce an earlier start date of freezing through feedbacks to regional climates [25]. Furthermore, observational analysis has shown that the greening QTP can amplify the warming impact of spring snow cover on surface seasonally frozen ground (SFG) and can also intensify the warming effect of summer rainfall on top permafrost [26]. These studies have demonstrated the uneven thermal responses of frozen ground to the accelerating climate change and the related vegetation growth on the QTP, serving as a potential connection. Due to the complex terrain and harsh natural conditions, the monitoring sites on the QTP are relatively sparse, and there are uncertainties in the satellite products, especially in the western high-altitude region [27]. Consequently, studies on the changes in the thermal state of the frozen ground on the wetting and warming QTP are still spatially and temporally confined and need further investigations.
Numerical simulation can be an appropriate method for expanding a site study to regional and long-term time scales. Recently, considerable studies regarding the thermal dynamics of frozen ground on the QTP have been conducted employing numerical model simulations [28,29,30,31]. Guo and Wang [32] investigated the extent of permafrost degradation on the QTP using the Community Land Surface Model (CLM). The results indicated that the near-surface permafrost area decreased at a rate of 0.09 × 10⁶ km2/decade, and the average active layer thickness increased by 0.15 m/decade from 1981 to 2010. It was projected that the shrinkage of permafrost area will exceed 58% by the end of the 21st century, and the most sustainable permafrost may only exist in the northwestern QTP [9,33]. Actually, the total area of thermally degraded permafrost was about 1.54 × 10⁶ km2 in the past, and the key period of degradation was from the 1960s to the 1970s and from the 1990s to the 2000s [14]. A recent numerical experiment further reveals that winter warming has amplified the thermal degradation of permafrost since 2000 [34]. These works have extended our understanding of the thermal responses of frozen ground to climate warming, whereas the temperature gradient transition between near-surface atmosphere and frozen ground in long-term time series and the associated thermal dynamics in the context of climate change still need further investigation. It is of great importance to reasonably project the changes in the frozen ground on the QTP in the foreseeable future. For this purpose, Liu et al. [6] analyzed the spatial and temporal variations of the air freezing/thawing indices and the ground surface freezing/thawing indices in the southwestern QTP from 1900 to 2017. Their results suggest that these indices consistently experienced abrupt changes around the 2000s. It has been recognized that these thermal changes in permafrost were influenced by air warming. Nonetheless, it should also be noted that the QTP has undergone prominent wetting process since the late 1990s [20,35,36], where super-heavy precipitation can cause dramatic rises in soil temperatures by 0.3 to 0.5 °C at shallow depths and advancement thawing of the active layer by half a month in permafrost regions on the northeastern QTP [37]. However, there still exist some uncertainties regarding the thermal responses of permafrost and SFG to intensified wetting and warming conditions, especially with the occurrence of vegetation cover expansion across the QTP in the long run.
This study aims to characterize the thermal dynamics in both permafrost and SFG regions on the QTP from 1961 to 2010 by investigating the differences in freezing/thawing indices between the near-surface atmosphere and the ground surface. In terms of temporal and spatial changes, the analysis is based on a high-resolution (0.05° × 0.05°) simulation conducted by the Community Land Surface Model version 4.5 (CLM4.5). The reminder in this paper is organized as follows: Section 2 describes the data and methods; Section 3 presents the spatial transitions between permafrost and SFG distribution in each decade and the variations of freezing/thawing indices between atmosphere and ground surface in permafrost and SFG regions, respectively; Section 4 provides a discussion of the ground surface freezing/thawing index anomalies and the air freezing/thawing index anomalies and their relation to precipitation and the vegetation cover conditions in the permafrost and SFG areas on the QTP; conclusions and an outlook are presented in Section 5.
2. Materials and Methods
2.1. Data
2.1.1. Land Surface Model Data
An atmospheric forcing dataset at a temporal-spatial resolution of 3 h and 5 km from 1961 to 2010 was used to force the land surface model (http://globalchange.bnu.edu.cn/research/forcing (accessed on 3 January 2020)). It includes seven meteorological factors, including gridded near-surface temperature, relative humidity, wind speed, surface pressure, precipitation, and downward shortwave (longwave) radiation. The forcing fields are generated through a recently proposed approach based on observations collected at approximately 700 stations on mainland China. Before it was released by the Beijing Normal University (China, hereafter BNU), the reasonability of the dataset was validated through comparisons of the corresponding components with the National Centers for Environmental Prediction Climate Forecast System Reanalysis dataset and the Princeton meteorological forcing dataset [38]. Moreover, the reliabilities of the air temperature and precipitation components of the dataset have also been confirmed using the observational records on the QTP prior to the numerical simulation [39]. The precipitation amount across the QTP utilized in this study was also derived from the BNU dataset. Additionally, the in-situ observations across the QTP also confirmed the simulation ability of the CLM4.5 to reproduce the soil temperature values in a long run [36,39], which were used to calculate the ground freezing/thawing indices (GFI/GTI) in this study. The air freezing/thawing indices (AFI/ATI) presented in this study were also calculated using the near-surface (2 m above the ground) air temperatures derived from this data set.
2.1.2. Remote Sensing Data
The Normalized Difference Vegetation Index (NDVI) from July 1981 to December 2015 was used to characterize vegetation cover conditions across the QTP. It is the latest release of the long-sequence product of the NOAA Global Inventory Monitoring and Modeling System (GIMMS), version 3g.v1. The temporal resolution of the NDVI is half a month, and the spatial resolution is 0.08° × 0.08°, respectively. It is the classic dataset used to detect vegetation dynamics, and their influences on the thermal regimes of frozen ground across the QTP [40]. The data set is available from the National Tibetan Plateau Data Center (https://data.tpdc.ac.cn (accessed on 12 June 2022)).
2.2. Methods
2.2.1. Freezing/Thawing Indices
Freezing/thawing indices were calculated using the accumulated monthly air temperature or ground surface temperature of numerical outputs [41,42]. The AFI and GFI can be conceptualized as the accumulated near-surface air temperature (2 m above the ground) and ground surface temperature (4.51 cm under the ground) to avoid the potential impact of random weather processes on the movement from one soil phase to the next when determining the onset of freezing or thawing in the whole freezing period from 1 July to 30 June in the next year. Similarly, the ATI and GTI are the sum of the air and ground surface temperatures with positive monthly mean values in a whole thawing period from 1 January to 31 December within a calendar year [6,19,36]. Specific equations are shown as follows:
where FI and TI (°C·d) are freezing and thawing indices calculated by mean monthly temperatures (Ti, near-surface atmosphere, or ground surface), respectively; Di is the number of days of the ith month; MF and MT represent months with negative and positive mean monthly values of near-surface air temperature or ground surface temperature, respectively.
2.2.2. Surface Frost Index
To estimate the frozen ground distribution in each decade, the surface frost index, which has been validated to capture permafrost distribution reasonably on the QTP [36,43,44], was calculated and used to diagnose permafrost. In this study, the boundary of permafrost is determined by the ground surface freezing index and thawing index:
where F is a parameter to diagnose permafrost. Using a negative exponential function depending on snow density, depth, heat capacity, and thermal conductivity, the effects of snow cover were adjusted while evaluating the ground freezing index. As a result, the GFI with a superscript (+) represents the underlying ground freezing index under snow cover [45]. The value of F ranging from 0.50 to 0.60 indicates sporadic permafrost, 0.60 to 0.67 indicates extensive permafrost, and above 0.67 indicates continuous permafrost [46]. A threshold value of 0.58 was taken to estimate the absence or presence of permafrost in this study because a minimum frost index value of 0.58 has been confirmed by Slater and Lawrence [46], matching the observed permafrost area. The simulated permafrost and SFG distribution in the 2000s (Figure 1e) were very similar to the new map of the Plateau’s frozen ground from 2009–2014 (Figure 1f). It covers a total area of 1.02 × 10⁶ km2 (excluding glaciers and lakes) in the 2000s, which is similar to but slightly lower than the value of 1.06 × 10⁶ km2 presented in the new map [5]. Less permafrost was simulated in the northeastern parts and southern regions of the QTP. The discrepancies between the simulations and the new frozen ground map could be partially attributed to possible inaccuracies in the permafrost parameterization schemes in the model and could also be due to possible inaccuracies in the frozen ground map.
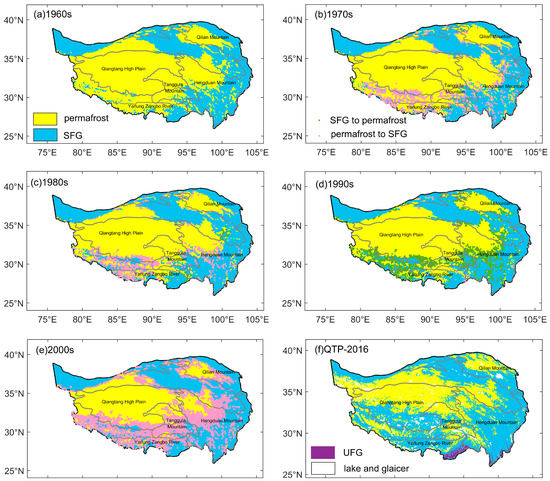
Figure 1.
Simulated spatial distribution of frozen ground types in (a) the 1960s, (b) the 1970s, (c) the 1980s, (d) the 1990s, and (e) the 2000s, against the (f) new map of permafrost distribution on the QTP (QTP-2016). The yellow, navy blue, purple, and white colors represent the areas of permafrost, seasonally frozen ground (SFG), unfrozen ground (UFG), glaciers, and lakes, respectively. The spatial distribution pattern of permafrost in the current decade served as the benchmark for determining the type of transition between permafrost and SFG in the next one.
2.2.3. Statistical Analysis Method
The modified Mann–Kendall (MMK) trend and Sen’s slope estimator methods were applied in this study to detect the tendencies and estimate the trends of variations in freezing and thawing indices across the QTP. The two nonparametric methods have been widely used to conduct statistical diagnosis in climate analysis studies, and a detailed description of these methods can be found in the previous study [47].
2.2.4. Model and Numerical Simulation Design
The Community Land Surface Model version 4.5 (CLM 4.5) was used in this study to obtain the essential monthly air and ground surface temperatures to calculate freezing/thawing indices across the QTP. As the land component of the Community Climate System Model and the Community Earth System Model, CLM 4.5 simulates the partitioning of mass and energy from the atmosphere, redistributes the mass and energy of the land surface, and then exports the fresh water and heat to the oceans [48]. It explicitly considers the coupling interaction between water and heat flows in the frozen soil by modifying the snow cover setting and hydraulic properties parameterization, which reflect the hysteresis of snow between accumulation and melt phases at a given depth [48] during the freezing and thawing processes of frozen ground on the QTP. Previous studies have proven CLM is effective for thermal dynamics research on the QTP at different spatial scales [49,50]. In this study, the CLM4.5 was driven by the BNU dataset, and the numerical simulation was conducted at a spatial resolution of 0.05° × 0.05° across the QTP. The outputs were set to a monthly time step from 1961 to 2010. It is important to state that the reliabilities of the simulated soil temperature and moisture have been validated with station records and in situ observations across the QTP in preceding works [36,39].
3. Results
3.1. Decadal Changes of Permafrost Distribution on the QTP from 1961 to 2010
The spatial patterns of frozen ground distribution in each decade from 1961 to 2010 across the QTP are presented in Figure 1. A new presentation of permafrost distribution on the QTP, mapping permafrost, SFG, and unfrozen ground based on remote sensing land surface temperature products from 2009 to 2014 (Figure 1f, hereafter as QTP-2016), is also included to provide a contrast benchmark [5]. It is obvious that the conversion between permafrost and SFG occurred mostly around the rims of mountainous permafrost areas on the southwestern QTP and the sporadic permafrost regions on the eastern QTP during the 1970s and 1980s (Figure 1b,c). Statistically, the permafrost area shrank from 1.62 × 10⁶ km2 to 1.40 × 10⁶ km2 in the 1960s–1980s (Table 1), broadly consistent with previous studies. A remote sensing-based study estimated that the total area of permafrost was 1.74 × 10⁶ km2 in the 1960s and turned to 1.58 × 10⁶ km2 in the 1980s [14]. The significant decreases in the AFI occurred in the 1980s, which implies the occurrence of dramatic warming of air temperature over the entire QTP in the freezing period during this decade. The air warming over the permafrost region was also detected during the thawing period, as evidenced by the increased rate of 0.65 °C·d/decade in the ATI. The prominent atmospheric warming should have exerted important effects on the permafrost degradation (6.67% reduction in area) and the thermal instability in SFG, where the GFI decreased significantly (11.73 °C·d/decade). Furthermore, we noticed that the GTI showed an opposite decreasing trend in permafrost areas, even though the ATI increased (as did air warming in the thawing period) in the 1980s. It suggests that the top permafrost showed fewer thermal responses within the active layer to the rise in air temperature during the thawing process in the 1980s. While the intensified air warming in the cold season (from November to March) [26] was more favorable for the remarkable shrinkage of permafrost areas during this period.

Table 1.
Decadal permafrost areas (km2) and the trends of AFI, GFI, and ATI, GTI (°C·d/decade) in permafrost, SFG, and the entire QTP from 1961 to 2010.
The QTP has experienced obvious permafrost expansion in the 1990s (0.13 × 10⁶ km2) after the pronounced shrinkage of permafrost area in the 1980s. Ran et al. [14] also claimed similar thermal condition improvement in a specific permafrost area located primarily east of Lhasa in the southeastern part of QTP, where there are numerous marine glaciers and substantial snow cover. Figure 1d shows that the conversions from SFG to permafrost mostly occurred in the south of the Qiangtang High Plain, including the Yarlung Zangbo River, as well as the Hengduan Mountains in the southeastern QTP. However, the AFI and the ATI in permafrost areas show decreasing and increasing trends with rates of 6.93 °C·d/decade and 1.17 °C·d/decade, respectively (Table 1), implying that the atmosphere over permafrost regions exhibited warming changes in both freezing and thawing periods in the 1990s. These results indicate that air warming does not always decrease the permafrost area because the active layer shortens in freezing (5.55 °C·d/decade) and thawing (4.09 °C·d/decade) periods. Zhang et al. [20] reported that the Qiangtang High Plain has experienced the most intensive precipitation increase since 1998, and it has exerted a cooling effect on the top permafrost regions by reducing their thermal responses to climate change. Numerical tests showed that an increase of 100 mm in summer precipitation causes a mean reduction of 0.35 m in active layer thickness and 0.36 °C in the top of permafrost [20]. More precipitation increases soil wetness and soil moisture, so surface ground heat loss occurs inevitably. It will reduce the heat transferred to the deeper layer while rainfall with higher temperatures percolates into the frozen soil column [36]. Furthermore, abundant heat will also be absorbed by increased liquid water in soil pores due to its higher specific heat capacity than ice, thus diminishing heat transfer to the deeper layer. Intensified rainfall will have a cooling effect on permafrost when heat is consumed more by evaporating and percolating liquid water than by transferring to soils [20]. This phenomenon is more prominent in permafrost regions, which belong to the arid zone on the QTP, as evidenced by the remarkable positive and negative correlation coefficients between the annual precipitation and the GFI and GTI, respectively, since the 1990s [36]. Based on these results, we can conclude that precipitation has played an important role in favoring permafrost development in the 1990s, despite the background of air warming.
Table 1 shows that the permafrost area grew in the 1990s and dropped to a new low in the 2000s, attaining a minimum value of 1.02 × 10⁶ km2, which is also comparable but slightly lower than the observational-based value of 1.33 × 10⁶ km2 in the same period [14]. Figure 1e shows that the conversions from permafrost into SFG prevailed across the entire QTP, especially in the southern QTP. The reduction of the freezing and thawing durations in the active layer in the 1990s is likely to cause permafrost to be more vulnerable to climate change, which coincides with previous results [51]. Permafrost monitoring through 10 boreholes on the QTP shows that mean annual temperatures at 6.0 m depth have increased by 0.12 °C to 0.67 °C, with an average increase of 0.43 °C from the mid-1990s to the late 2000s [16]. The increase in active layer thickness was driven mainly by increases in the thawing index and annual precipitation [52]. Meanwhile, a field investigation conducted in the permafrost region from 2005 to 2009 in the interior QTP demonstrated that declines in vegetation cover in alpine meadows led to an increase in the thawing and an advance in the onset of seasonal changes within the active layer [53]. Our results further indicated that, in contrast to the 1990s, a permafrost area of 33.33% thawed into SFG in the 2000s over the entire QTP. While the AFI increased and the ATI decreased at rates of 13.37 °C·d/decade and 6.41 °C·d/decade, respectively, in permafrost regions during this decade (Table 1). It illustrates that the QTP has undergone a warming hiatus during the 2000s as the period of air temperature below (above) 0 °C extended (shortened). SFG also exhibited an increasing trend in GFI and a decreasing one in GTI, following the variations in AFI and ATI. However, the variations in ATI and GTI have shown an opposite direction in the permafrost parts since the 2000s. The temperature of top permafrost above 0 °C lasted longer while the atmospheric temperature exceeding 0 °C lasted shorter, as evidenced by the increasing rate of 10.98 °C·d/decade in the GTI and the decreasing rate of 6.41 °C·d/decade in the ATI (Table 1). It is reported that dramatic wetting over cold and arid permafrost zones tends to induce a cooling of the atmosphere [36], because the surface energy balance responds to variations in annul precipitation by influencing the surface radiation components, which alter the near-surface air temperature [54]. However, the warming hiatus during thawing duration has not restrained the thermal degradation in permafrost regions in the 2000s. Persistent wetting and more heavy rainfall events in summer are favorable for liquid water to rapidly reach and accumulate at the bottom of the active layer, which will serve to warm the permafrost body during the subsequent freezing period [20,37].
As a whole, the QTP witnessed prominent permafrost shrinkage in the 1960s–2000s, accounting for 37.04% of the permafrost area in the 1960s. The most pronounced decline in permafrost area took place in the 2000s, when QTP was undergoing a warming hiatus. From the perspective of the surface freeing/thawing processes, the ratios of the AFI and the ATI fell in the 1970s and decreased again in the 1990s–2000s from 4.31 to 3.36. However, the ratios of the GFI and the GTI rose in the 1990s and dropped sharply to a minimum of 0.98 in the 2000s in response to the atmospheric warming during the freezing period over the permafrost (Table 1). It signifies the QTP has presented more complicated permafrost responses to climate warming and wetting since the 1990s. The frozen ground was thermally unstable in the 1980s owing to the strikingly atmospheric warming in the cold season. The dramatic thermal degradation in the 2000s, which might be due to the accelerated wetting process over the QTP, mainly occurred in permafrost regions in the warm season (from May to October) [26]. This differs from the 1980s. Although recent studies have confirmed that intensified summer precipitation has exerted an important warming effect on permafrost bodies [20,36,37], our results further reveal that thermal degradation also terminated in SFG in the 2000s. Relatively warmer and wetter conditions in SFG regions might experience more heat loss via evaporation when gradually plentiful water occupies soil pores, which alters the thermal regimes of surface ground [36].
3.2. Comparisons of Thermal States between Near-Surface Atmosphere and Ground Surface in Climatology
The mean values of GFI and GTI from 1961 to 2010 across the QTP show spatial patterns similar to the AFI and ATI, respectively (Figure 2). From the perspective of value, the climatology of the GTI (GFI) is higher (lower) than that of the ATI (AFI), especially in the permafrost regions. The maximum value of the ATI is 1505.80 °C·d, which is substantially lower than that of the GTI (2485.06 °C·d). The maximum AFI reaching the value of 2042.24 °C·d is higher than that of the GFI (1463.06 °C·d) for the entire QTP. This implies that, in general, the period of ground temperature above 0 °C lasted longer than air temperature in the thawing period, while air temperature below 0 °C retained longer than ground surface temperature in the freezing period in past decades. The maximum value of the averaged annual ground surface temperature is 3.44 °C, which is more than five times the value of the air temperature (−0.61 °C, Figure 2c,f).
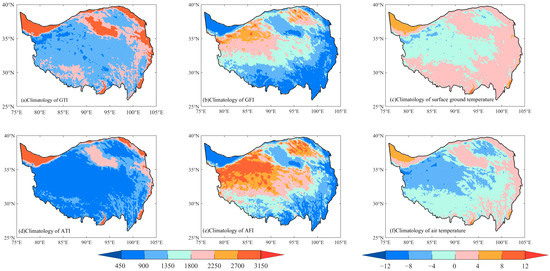
Figure 2.
Spatial patterns of climatology of freezing/thawing indices (a) GTI, (b) GFI, (c) surface ground temperature, (d) ATI, (e) AFI, and (f) air temperature from 1961 to 2010 across the QTP.
The spatial patterns for the AFI and GFI, ATI, and GTI climatology show distinctive regional differences (Figure 2). In contrast to the GFI, permafrost and SFG tend to show more pronounced distinctions in the GTI from 1961 to 2010, with a value of 1267.83 °C·d. However, the difference between the AFI in permafrost and SFG is 1298.38 °C·d, which is comparable to the ATI value of 1222.01 °C·d. It shows apparent distinctions between permafrost and SFG responses to climate change in terms of thawing intensities. Dramatic higher differences between the AFI and the GFI in permafrost regions suggest more pronounced freezing intensity. Conversely, the differences between the ATI and GTI are more remarkable in SFG parts, which illustrate that SFG regions are more vulnerable to thawing when air temperature increases. However, owing to the wetting and warming conditions over the QTP, the decreased cold stress in high altitude parts of the QTP encouraged an expansion of climatically suitable areas for plant growth [55]. Air temperature and precipitation changes over time appear to exert substantial impacts on regulating the thermal regimes of the surface permafrost. As one of the typical characteristics of land surface processes at high altitudes in the QTP, alpine permafrost is also not immune to these impacts. The vegetation expansion and snow cover reduction in high-altitude areas can produce positive feedback on permafrost degradation when the underlying snow with high albedo is replaced by vegetation with a lower albedo [26,56].
3.3. Spatial Changes of Freezing and Thawing Indices in Permafrost and Seasonally Frozen Ground
As the 1990s represent the pivotal period of permafrost area variations and freezing/thawing indices dynamics, the spatial patterns of changes in the AFI and GFI, the ATI, and the GTI in permafrost and SFG regions before and after the 1990s are shown in Figure 3 and Figure 4, respectively. Before the 1990s, the changes in AFI in permafrost regions were dominated by negative values, which illustrates the air warming during the freezing period (Figure 3a). Persistent negative trends of the GFI in the Qilian Mountains, Tanggula Mountains, and parts of Qiangtang High Plain in the interior QTP, which indicate these surface permafrost areas have warmed substantially, are broadly consistent with the dynamics of permafrost distribution during these decades (Figure 1b,c). It can be well explained that the increased air temperature, which has been widely recognized to control thermal regime changes in recent studies [19,34,35], has triggered the thermal regime changes of the underlying permafrost. However, it should also be emphasized that the major Qiangtang High Plain in the western QTP exhibited prominent increases in the GFI, where the freezing duration was maintained longer within the surface active layer. It appears that the air warming before the 1990s in the cold season only induced thermally unstable conditions in some small portions of surface permafrost. Statistically, in contrast to the decreasing trend of the AFI (13.59 °C·d/decade) from 1961 to 1990, the annual GFI in permafrost regions was growing at a rate of 67.59 °C·d/decade (Table 2). Meanwhile, positive-dominated changes in the ATI before the 1990s have consistently shown that the QTP has experienced a prevalent warming process in thawing duration, except for some portions in the sporadic permafrost regions in the Hengduan Mountains and Qilian Mountains where negative trends were present (Figure 3c). Table 2 demonstrates that the ATI increased significantly at a rate of 39.86 °C·d/decade during 1961–1990, while the GTI shows pronounced spatial distinctions in terms of permafrost responses to warming. The eastern parts of the Qiangtang High Plain in the interior QTP exhibited decreasing changes in the GTI, which implies that the thawed duration has a tendency to decline to some extent even through an accelerated warming process over the permafrost body. However, the western parts exhibit an extended thawing duration as a response to the warming. Being different from the freezing process, which releases heat to the surroundings, the extension of the thawing process to the surface of the ground should be accompanied by a certain amount of heat input from the surroundings. Positive changes in the GTI and the GFI took place consistently in the western parts of the Qiangtang High Plain (Figure 3b,d). The longer freezing duration and extended thawing times that occurred in the top continuous permafrost regions tend to deepen the active layer, although the permafrost in these areas remained relatively stable in type before the 1990s (Figure 1c).
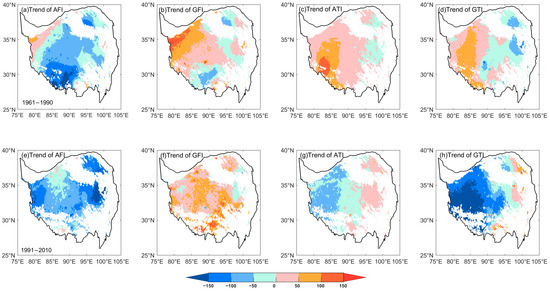
Figure 3.
Spatial changes of freezing and thawing indices in permafrost regions between 1961–1990 and 1991–2010. (a,e) AFI, (b,f) GFI, (c,g) ATI, and (d,h) GTI on the QTP.
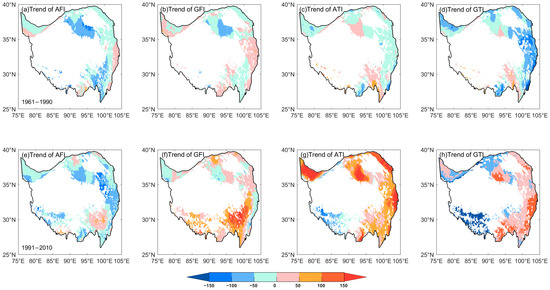
Figure 4.
The same as Figure 3, but for seasonally frozen ground on the QTP. (a,e) AFI, (b,f) GFI, (c,g) ATI, and (d,h) GTI on the QTP.
Table 2.
Comparison of the annual mean (°C·d) and trends (°C·d/decade) of the AFI, GFI, ATI, and GTI over the QTP in permafrost and SFG regions from 1961 to 1990 and 1991 to 2010.
In contrast to the slight decrease at a rate of 13.59 °C·d/decade before the 1990s, the AFI started to decrease dramatically since the 1990s and reached a magnified value of 202.57 °C·d/decade (Table 2). However, the freezing duration within the surface active layer extended intensively, as evident by the prevalent GFI increase in permafrost regions (Figure 3f). This is in contrast to the changes in AFI (Figure 3e). The warming effect of increased air temperature shows less control over thermal regimes in permafrost in the cold season from 1991 to 2010. Furthermore, spatial changes in the ATI also presented a reverse pattern after 1990. Most areas of the Qiangtang High Plain experienced a warming hiatus during the thawing period. From the perspective of magnitude, the increasing rate of the ATI is 16.94 °C·d/decade after 1990, which is substantially lower than that before 1990 (39.86 °C·d/decade). It is shown that air warming in the cold season eventually exceeded that in the warm season after 1990. This corroborates the findings of previous numerical experiments, which reported that summer warming has slowed and winter warming has begun to accelerate over the QTP around 1998 [34]. Meanwhile, the ground surface, however, presented shortened thawing periods in the active layer of permafrost regions (Figure 3h), with a rate of 83.58 °C·d/decade in the GTI (Table 2). Considering the relative milder increase in the ATI (16.94 °C·d/decade), it can be reasonably concluded that the top permafrost has not been particularly sensitive to the air warming in warm seasons since the 1990s. That is, pronounced air warming in the warm season had only marginal effects on thermal regime changes in permafrost on the western QTP.
Nevertheless, the QTP has also experienced a dramatic wetting process around 1998 and a remarkable greening process after 2000, which was favored by substantial climate change [20,26,57]. Permafrost monitoring has indicated that intensified rainfall imposed a cooling effect in the freezing duration and a warming effect in the thawing duration in the active layer [58], which has a pivotal impact on deepening the active layer thickness [59]. Meanwhile, an expansion of climatically suitable areas for plant growth might favor the increasing impact of vegetation on regulating the current thermal regimes of permafrost over the QTP [26]. From these results, it can be inferred that variations in freezing/thawing indices after 1990 might also be related to local variations in precipitation and to vegetation cover dynamics in permafrost ranges.
In SFG areas, the changes in AFI decreased significantly with rates of 44.27 °C·d/decade and 148.97 °C·d/decade during the two subperiods of 1961–1990 and 1991–2010 (Table 2). Spatially, the largest decreasing areas of the AFI expanded from the Qaidam Basin to the eastern parts of the QTP (Figure 4a,e). These remarkable declines in the AFI indicate the near-surface atmosphere over the SFG has warmed substantially in the freezing period during the study period. Figure 4b shows that the Qaidam Basin presented a prominent decreasing tendency in the GFI as responses to air temperature increased. However, some portions of the eastern QTP underwent cooling processes where the GFI decreased. As a whole, the significant air temperature rise over the SFG has not exerted prominent warming effects on frozen surface ground before the 1990s because the GFI was increasing at a rate of 1.48 °C·d/decade (Table 2).
From 1991, the ground surface underwent an obvious GFI decrease at a rate of 42.39 °C·d/decade (Table 2). Spatial patterns also indicate that SFG in the southeastern parts of the QTP also presented increasing GFI trends (Figure 4f). It is suggestive of diminishing thermal responses of SFG in these areas to air warming during the freezing period since the 1990s. Moreover, distinct from freezing indices changes, the changing thawing indices show reversed patterns before and after the 1990s. It is clear that the SFG experienced progressive increases in the ATI after 1990 (Figure 4g). Correspondingly, prominent increases in the GTI occurred in the eastern QTP (Figure 4h). While the southwestern QTP, where belong the rims of the transitional areas between permafrost and SFG in the 1990s–2000s (Figure 1d,e), showed strikingly decreasing tendencies in the ATI and GTI (Figure 4g,h). These results suggest that atmospheric warming over SFG after 1990 mainly occurred in the warm season, which differs from that in permafrost parts. The SFG degraded from permafrost in transitional areas shows fewer thermal responses to air warming in the cold season. A warming hiatus in the warm season was also favorable for permafrost development in these regions, as it occurred in the 1990s (Figure 1d).
4. Discussion
To characterize the effects of seasonal warming on frozen ground, we compared the freezing/thawing indices between the near-surface atmosphere and frozen ground surface after presenting the changes in frozen ground distribution in each decade. Air warming, which has shifted between freezing and thawing processes since the 1990s, shows a diminished control role on thermal regimes in both permafrost and SFG areas since the 1990s. More specifically, after 1990, air temperature rise over permafrost was more pronounced in the freezing period, while in the thawing period, air warming over SFG exhibited more intensive increase. The warming hiatus over permafrost in thawing period and the prominent shrinkage of permafrost area in the 2000s implies that air warming appears to play only a marginal controlling role in thermal regime changes, especially in western QTP.
As the occurrence of annual precipitation increases and the vegetation cover extends, especially in the 2000s [6,20,26,55], it is essential to investigate the effects on reregulating surface thermal regimes of frozen ground. Focused on a single precipitation event on the QTP, Li et al. [58] reported that increased rainfall created a heating effect on active layers in the thawing period, which led to a cooling effect in the freezing period. Similar warming effects of rainfall on the thermal regimes of permafrost have also been concluded over the Russian Arctic drainage basin [60]. Moreover, vegetation expansion in the warmer and wetter Arctic coincides with that on the QTP [55,61]. It will partially reduce permafrost degradation in the Siberian tundra [62]. Furthermore, on the QTP, recent observational results reveal that increases in vegetation greenness since the 2000s promote the role of SFG in responding to the intensified wetting process [18]. In this study, we more deeply investigate the changes in ground freezing and thawing indices responding to the atmospheric freezing and thawing indices on the entire QTP. To state this conclusion more reasonably, we also presented the relations between freezing/thawing indices and precipitation, the NDVI, respectively (Figure 5).
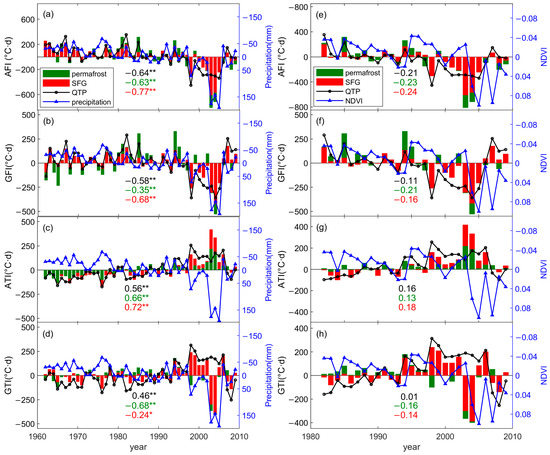
Figure 5.
The time series of anomaly comparisons between precipitation (left panels), NDVI (right panels), and freezing/thawing indices during 1961–2010, respectively. (a,e) AFI; (b,f) GFI; (c,g) ATI; and (d,h) GTI. Two colors of green (red) bars represent index anomalies in permafrost (SFG), and the black lines with circles indicate those across the whole QTP. The blue lines with triangles represent the anomalies in the precipitation and the NDVI. Figures in the same colors as permafrost, SFG, and the entire QTP indices shown in the plots represent their correlation coefficients with precipitation and NDVI anomalies. One asterisk (*) denotes p < 0.10 and two asterisks (**) denote p < 0.05.
It is obvious that the precipitation anomaly over the QTP experienced a first peak in 1998 and rose to a new high of 191.10 mm in 2005. This corroborates the findings of the previous numerical study [20]. A similar breakpoint was also detected in northern Canada [63]. Permafrost borehole records from Canadian stations indicate that air temperatures have generally been higher since the 1980s and then decreased since the peak temperature in 1998. In this study, it was found that the negative AFI and positive ATI anomalies reach the maxima of 453.72 °C·d/decade and 255.90 °C·d/decade, suggesting that the QTP also underwent the most progressive atmospheric warming in 1998. The GFI anomaly generally followed the evolution of the AFI anomaly until 2001. After that, the GFI reaches a new minimum anomaly of 359.79 °C·d/decade in 2004, whereas the AFI anomaly remains stable. Furthermore, the ATI showed weakening but stable positive anomalies during 2001–2005, while the GTI presented strikingly negative ones during this period, especially in the permafrost regions (Figure 5c,d). These results suggest that the ground thawing duration shortened sharply even though the air temperature rose. Instead, the intensified precipitation began to act as a control mechanism for regulating surface thermal regimes. Statistical results indicate that precipitation anomalies yield significant negative correlation relationships with the AFI, GFI, and GTI (p < 0.05, Figure 5a,b,d) but a positive one with the ATI (p < 0.05, Figure 5c). The increased rainfall has a tendency to promote air temperature rise but restrain freezing and thawing cycles within the active layer of permafrost. This conclusion is coincident with the work of Luo et al. [37], who reported that increased summer precipitation amounts tend to reduce ground thawing indices and exert an obvious cooling effect on top permafrost, based on permafrost monitoring in the northeastern QTP. However, when a large amount of rainfall percolates into the deeper soils, it may cause an opposite warming effect on permafrost [20]. It can be explained that the liquid rainfall that commonly comes with a higher temperature than that in deep soils will effectively transfer heat to the surroundings after percolating through the soil quickly and, as a result, warm the permafrost body.
It is important to note that the NDVI started to increase in 2004 and reached a maximum value of a positive anomaly (0.10) in 2005. As shown in Figure 5, the NDVI anomaly yields a negative correlation relationship with the AFI anomaly and a positive one with the ATI anomaly, although they are not statistically significant. It implies that the shortened periods of air temperature below zero in the freezing process and the extended ones above zero in the thawing process are favorable for vegetation cover expansion. For top permafrost, a positive anomaly in the NDVI will also reduce its thermal response to climate warming because of its negative correlation relationship with the GFI and the GTI, respectively. Similar conclusions have also been drawn in a recent study [25]. However, the hiatus in vegetation greening after 2006 (Figure 5) mainly showed warming effects due to nighttime warming [64]. It could accelerate permafrost thawing [64], as evidenced by the increased GFI and GTI (Figure 5f,h). The vegetation dynamics coincide with the persistent wetting over the QTP in the 2000s, which intensified thermal instability in permafrost. As a result, these results suggest that the dramatic permafrost shrinkage and thermal degradation across the QTP are not always only induced by air warming; intensive wetting and greening dynamics over the QTP also play important roles. Further research into the influences of vegetation growth and precipitation anomalies on the thermal regime changes of frozen ground at different altitude levels of the QTP is also required in the near future.
5. Conclusions
Based on the numerical simulation results, this study analyzed the thermal dynamics of frozen ground on the QTP from a new perspective. Freezing and thawing indices between frozen ground and near-surface atmosphere are analyzed in five decades from 1961 to 2010 and related to the changes in frozen ground distribution in each decade. The main conclusions are the following:
The net shrinkage of permafrost area in the 2000s was 37.04% relative to the 1960s across the QTP. The permafrost area rose in the 1990s and dropped to a new low value of 1.02 × 10⁶ km2 in the 2000s. Decadal permafrost distribution patterns indicate the first occurrence of degradation in the 1970s–1980s lies in the Tanggula Mountain areas on the southwestern QTP, followed by the pronounced permafrost reduction in areas of the Qilian Mountain in the northwestern QTP and the Hengduan Mountain in the interior QTP in the 2000s.
The ratios of the AFI and the ATI presented a steady decrease from 1.57 to 1.44 in the 1960s–1980s, in contrast to the slight decrease in the ratios of the GFI and the GTI from 0.57 to 0.56 during this period. Atmospheric warming over the QTP played a more controlling role in the thermal dynamics of frozen ground before the 1990s. The air temperature reached a peak in 1998 in both freezing and thawing periods. The ratios of the GFI and the GTI in permafrost and SFG also reached their maximum in the 1990s, with values of 1.44 and 0.36, respectively. The ratio of the GFI and the GTI was <1 in the 2000s, indicating their prominent thermal responses to intensified wetting and warming processes.
A warming hiatus was detected in the 2000s, especially for the permafrost regions in the cold season, which favorably restrained the permafrost degradation. In this decade, the QTP has been under the influence of prominently thermally unstable conditions, with the permafrost area shrinking by 33.33%. The occurrence of increasing precipitation over the QTP began to play a more controlling role in permafrost degradation. The hiatus in vegetation greening after 2006 could promote the thermal responses of frozen ground to climate change.
Author Contributions
Conceptualization, X.F.; methodology, X.F.; software, A.W.; validation, X.F.; formal analysis, X.F. and A.W.; investigation, X.F.; resources, X.F. and S.L.; data curation, X.F.; writing—original draft preparation, X.F.; writing—review and editing, X.F. and K.F., visualization, A.W.; supervision, X.F.; project administration, X.F. and S.L.; funding acquisition, S.L. and X.F. All authors have read and agreed to the published version of the manuscript.
Funding
This research was funded jointly by the National Natural Science Foundation of China (41905008, 41975007, 42275080) and the Innovation and Entrepreneurship Training Program for College Students of Chengdu University of Information Technology (202210621006, 202210621003).
Data Availability Statement
The China Dataset of Meteorological Forcing for Land Surface Modeling can be obtained online (http://globalchange.bnu.edu.cn/research/ (accessed on 3 January 2020)). The NDVI product of NOAA Global Inventory Monitoring and Modeling System (GIMMS), version 3g.v1 is accessible on website (https://data.tpdc.ac.cn/en/data/9775f2b4-7370-4e5e-a537-3482c9a83d88/ (accessed on 12 June 2022)).
Acknowledgments
Thanks are due to the reviewers who provide valuable suggestions and supportive comments which are favored to improve the quality of the manuscript. We also thank the Max Planck Institute of Meteorology (Atmosphere in the Earth System) for providing hospitality combined with an excellent working environment.
Conflicts of Interest
The authors declare no conflict of interest.
References
- Zhang, T.; Zhou, Y.; Guo, D.; Qiu, G.; Li, S. Geocryology in China. Arct. Antarct. Alp. Res. 2001, 33, 245. [Google Scholar]
- Yang, K.; Ye, B.; Zhou, D.; Wu, B.; Foken, T.; Qin, J.; Zhou, Z.; Oppenheimer, M.; Yohe, G. Response of hydrological cycle to recent climate changes in the Tibetan Plateau. Clim. Chang. 2011, 109, 517–534. [Google Scholar] [CrossRef]
- Yao, T.; Thompson, L.; Mosbrugger, V.; Zhang, F.; Ma, Y.; Luo, T.; Xu, B.; Yang, X.; Joswiak, D.; Wang, W.; et al. Third Pole Environment (TPE). Environ. Dev. 2012, 3, 52–64. [Google Scholar] [CrossRef]
- Pan, X.; Guo, X.; Li, X.; Niu, X.; Yang, X.; Feng, M.; Che, T.; Jin, R.; Ran, Y.; Guo, J.; et al. National Tibetan Plateau Data Center: Promoting Earth System Science on the Third Pole. Bull. Am. Meteorol. Soc. 2021, 102, E2062–E2078. [Google Scholar]
- Zou, D.; Zhao, L.; Sheng, Y.; Chen, J.; Hu, G.; Wu, T.; Wu, J.; Xie, C.; Wu, X.; Pang, Q.; et al. A new map of permafrost distribution on the Tibetan Plateau. Cryosphere 2017, 11, 2527–2542. [Google Scholar] [CrossRef]
- Liu, L.; Luo, D.L.; Wang, L.; Huang, Y.D.; Chen, F.F. Dynamics of freezing/thawing indices and frozen ground from 1900 to 2017 in the upper Brahmaputra River Basin, Tibetan Plateau. Adv. Clim. Chang. Res. 2021, 12, 6–17. [Google Scholar] [CrossRef]
- Dobinski, W. Permafrost. Earth Sci. Rev. 2011, 108, 158–169. [Google Scholar] [CrossRef]
- Li, X.; Cheng, G. A GIS-aided response model of high-altitude permafrost to global change. Sci. China Earth Sci. 1999, 42, 72–79. [Google Scholar] [CrossRef]
- Guo, D.; Wang, H. CMIP5 permafrost degradation projection:A comparison among different regions. J. Geophys. Res. Atmos. 2016, 121, 4499–4517. [Google Scholar] [CrossRef]
- Schuur, E.; Vogel, J.G.; Crummer, K.G.; Lee, H.; Sickman, J.O.; Osterkamp, T.E. The effect of permafrost thaw on old carbon release and net carbon exchange from tundra. Nature 2009, 459, 556–559. [Google Scholar] [CrossRef]
- Cheng, G.; Jin, H. Permafrost and groundwater on the Qinghai-Tibet Plateau and in northeast China. Hydrogeol. J. 2012, 21, 5–23. [Google Scholar] [CrossRef]
- Cheng, G.; Wu, T. Responses of permafrost to climate change and their environmental significance, Qinghai-Tibet Plateau. Geophys. Res. Earth Surf. 2007, 112, F2. [Google Scholar] [CrossRef]
- Xue, X.; Guo, J.; Han, B.; Sun, Q.; Liu, L. The effect of climate warming and permafrost thaw on desertification in the Qinghai-Tibetan Plateau. Gepmorphology 2009, 108, 182–190. [Google Scholar] [CrossRef]
- Ran, Y.; Li, X.; Cheng, G. Climate warming over the past half century has led to thermal degradation of permafrost on the Qinghai-Tibet Plateau. Cryosphere 2018, 12, 595–608. [Google Scholar] [CrossRef]
- Wang, B.; Bao, Q.; Hoskins, B.; Wu, G.; Liu, Y. Tibetan Plateau warming and precipitation changes in East Asia. Geophys. Res. Lett. 2008, 35, L14702. [Google Scholar] [CrossRef]
- Wu, Q.; Zhang, T. Recent permafrost warming on the Qinghai-Tibetan Plateau. J. Geophys. Res. Atmos. 2008, 113, D13108. [Google Scholar] [CrossRef]
- Wu, Q.; Zhang, T. Changes in active layer thickness over the Qinghai-Tibetan Plateau from 1995 to 2007. J. Geophys. Res. Atmos. 2010, 115, D09107. [Google Scholar] [CrossRef]
- Frauenfeld, O.W.; Zhang, T.; Mccreight, J.L. Northern Hemisphere freezing/thawing index variations over the twentieth century. Int. J. Climatol. 2010, 27, 47–63. [Google Scholar] [CrossRef]
- Wu, T.; Qin, Y.; Wu, X.; Li, R.; Zou, D.; Xie, C. Spatiotemporal changes of freezing/thawing indices and their response to recent climate change on the Qinghai-Tibet Plateau from 1980 to 2013. Theor. Appl. Climatol. 2018, 132, 1187–1199. [Google Scholar] [CrossRef]
- Zhang, G.; Nan, Z.; Zhao, L.; Liang, Y.; Cheng, G. Qinghai-Tibet Plateau wetting reduces permafrost thermal responses to climate warming. Earth Planet. Sci. Lett. 2021, 31, 916–930. [Google Scholar] [CrossRef]
- Bai, Y.; Guo, C.; Degen, A.A.; Ahmad, A.A.; Wang, W.; Zhang, T.; Li, W.; Ma, L.; Huang, M.; Zeng, H. Climate Warming Benefits Alpine Vegetation Growth in Three-River Headwater Region, China. Sci. Total Environ. 2020, 742, 140574. [Google Scholar] [CrossRef]
- Cai, D.; Fraedrich, K.; Sielmann, F.; Zhang, L.; Zhu, X.; Guo, S.; Guan, Y. Vegetation Dynamics on the Tibetan Plateau (1982–2006); An Attribution by Ecohydrological Diagnostics. J. Clim. 2015, 28, 4576–4584. [Google Scholar] [CrossRef]
- Li, J.; Chen, F.; Zhang, G.; Barlage, M.; Gan, Y.; Xin, X.; Wang, C. Impacts of Land Cover and Soil Texture Uncertainty on Land Model Simulations Over the Central Tibetan Plateau. J. Adv. Model. Earth Syst. 2018, 10, 2121–2146. [Google Scholar] [CrossRef]
- Zhong, L.; Ma, Y.; Salama, M.S.; Su, Z. Assessment of vegetation dynamics and their response to variations in precipitation and temperature in the Tibetan Plateau. Clim. Chang. 2010, 103, 519–535. [Google Scholar] [CrossRef]
- Li, J.; Wu, C.; Wu, M.; Zhang, Y.; Ran, Y. Modeling the start of frozen dates with leaf senescence over Tibetan Plateau. Remote Sens. Environ. 2022, 281, 113258. [Google Scholar] [CrossRef]
- Fang, X.; Chen, Y.; Cheng, C.; Wang, Z.; Lyu, S.; Fraedrich, K. Changes of timing and duration of the ground surface freeze on the Tibetan Plateau in the highly wetting period from 1998 to 2021. Clim. Chang. 2023, 176, 59. [Google Scholar] [CrossRef]
- Meng, X.; Li, R.; Luan, L.; Lyu, S.; Zhang, T.; Ao, Y.; Han, B.; Zhao, L.; Ma, Y. Detecting hydrological consistency between soil moisture and precipitation and changes of soil moisture in summer over the Tibetan Plateau. Clim. Dyn. 2018, 51, 4157–4168. [Google Scholar] [CrossRef]
- Qin, Y.; Wu, T.; Zhao, L.; Wu, X.; Li, R.; Xie, C.; Pang, Q.; Hu, G.; Qiao, Y.; Zhao, G.; et al. Numerical Modeling of the Active Layer Thickness and Permafrost Thermal State Across Qinghai-Tibetan Plateau. J. Geophys. Res. Atmos. 2017, 122, 11604–11620. [Google Scholar] [CrossRef]
- Li, D.; Chen, J.; Meng, Q.; Liu, D.; Fang, J.; Liu, J. Numeric simulation of permafrost degradation in the eastern Tibetan Plateau. Permafr. Periglac. Process. 2008, 19, 93–99. [Google Scholar] [CrossRef]
- Yang, M.; Nelson, F.E.; Shiklomanov, N.I.; Guo, D.; Wan, G. Permafrost degradation and its environmental effects on the Tibetan Plateau: A review of recent research. Earth Sci. Rev. 2010, 103, 31–44. [Google Scholar] [CrossRef]
- Yang, M.; Wang, X.; Pang, G.; Wan, G.; Liu, Z. The Tibetan Plateau cryosphere: Observations and model simulations for current status and recent changes. Earth Sci. Rev. 2019, 190, 353–369. [Google Scholar] [CrossRef]
- Guo, D.; Wang, H. Simulation of permafrost and seasonally frozen ground conditions on the Tibetan Plateau, 1981–2010. J. Geophys. Res. Atmos. 2013, 118, 5216–5230. [Google Scholar] [CrossRef]
- Yin, G.; Niu, F.; Lin, Z.; Luo, J.; Liu, M. Data-driven spatiotemporal projections of shallow permafrost based on CMIP6 across the Qinghai-Tibet Plateau at 1 km2 scale. Adv. Clim. Chang. Res. 2021, 12, 814–827. [Google Scholar] [CrossRef]
- Zhang, G.; Nan, Z.; Wu, X.; Ji, H.; Zhao, S. The Role of Warming in Permafrost Change over the Qinghai-Tibet Plateau. Geophys. Res. Lett. 2019, 46, 11261–11269. [Google Scholar] [CrossRef]
- Zhao, L.; Hu, G.; Zou, D.; Wu, X.; Ma, L.; Sun, Z.; Yuan, L.; Zhou, H.; Liu, S. Permafrost changes and its effects on hydrological processes on Qinghai-Tibet Plateau. Bull. Chin. Acad. Sci. 2019, 34, 1233–1246. (In Chinese) [Google Scholar]
- Fang, X.; Li, Z.; Cheng, C.; Fraedrich, K.; Wang, A.; Chen, Y.; Xu, Y.; Lyu, S. Response of freezing/thawing indexes to the wetting trend under warming climate conditions over the Qinghai-Tibetan Plateau during 1961–2010: A Numerical Simulations. Adv. Atmos. Sci. 2023, 40, 211–222. [Google Scholar] [CrossRef]
- Luo, D.; Jin, H.; Bense, V.F.; Jin, X.; Li, X. Hydrothermal processes of near-surface warm permafrost in response to strong precipitation events in the Headwater Area of the Yellow River, Tibetan Plateau. Geoderma 2020, 376, 114531. [Google Scholar] [CrossRef]
- Li, T.; Zheng, X.; Dai, Y.; Yang, C.; Chen, Z.; Zhang, S.; Wu, G.; Wang, Z.; Huang, C.; Shen, Y.; et al. Mapping near-surface air temperature, pressure, relative humidity and wind speed over Mainland China with high spatiotemporal resolution. Adv. Atmos. Sci. 2014, 31, 1127–1135. [Google Scholar] [CrossRef]
- Fang, X.; Luo, S.; Lyu, S.; Cheng, C.; Li, Z.; Zhang, S. Numerical modeling of the responses of soil temperature and soil moisture to climate change over the Tibetan Plateau. 1961–2010. Int. J. Climatol. 2021, 41, 4134–4150. [Google Scholar] [CrossRef]
- Pinzon, J.E.; Tucker, C.J. A Non-Stationary 1981–2012 AVHRR NDVI3g Time Series. Remote Sens. 2014, 6, 6929–6960. [Google Scholar] [CrossRef]
- Klene, A.E.; Nelson, F.E.; Shiklomanov, N.I.; Hinkel, K.M. The N-factor in natural landscapes: Variability of air and soil-surface temperatures, Kuparuk River Basin, Alaska, USA. Arct. Antarct. Alp. Res. 2001, 38, 140–148. [Google Scholar] [CrossRef]
- Luo, D.; Jin, H.; Marchenko, S.S.; Romanovsky, V.E. Difference between near-surface air, land surface and ground surface temperatures and their influences on the frozen ground on the Qinghai-Tibe Plateau. Geoderma 2018, 312, 74–85. [Google Scholar] [CrossRef]
- Wang, C.; Jin, S.; Wu, Z.; Cui, Y. Evaluation and Application of the Estimation Methods of Frozen (Thawing) Depth over China. Adv. Earth Sci. 2009, 24, 132–140. [Google Scholar]
- Change, Y.; Lyu, S.; Luo, S.; Li, Z.; Fang, X.; Chen, B.; Li, R.; Chen, S. Estimation of permafrost on the Tibetan Plateau under current and future climate conditions using the CMIP5 data. Int. J. Climatol. 2018, 38, 5659–5676. [Google Scholar] [CrossRef]
- Anisinov, O.A.; Nelson, F.E. Permafrost distribution in the Northern Hemishpere under scenarios of climatic change. Glob. Planet. Chang. 1996, 14, 59–72. [Google Scholar] [CrossRef]
- Slater, A.G.; Lawrence, D.M. Diagnosing Present and Future Permafrost from Climate Models. J. Clim. 2013, 26, 5608–5623. [Google Scholar] [CrossRef]
- Fang, X.; Luo, S.; Lyu, S. Observed soil temperature trends associated with climate change in the Tibetan Plateau, 1960–2014. Theor. Appl. Climatol. 2019, 135, 169–181. [Google Scholar] [CrossRef]
- Swenson, S.; Lawrence, D. A new fractional snow-covered area parameterization for the Community Land Model and its effect on the surface energy balance. J. Geophys. Res. Atmos. 2012, 117, D21107. [Google Scholar] [CrossRef]
- Guo, D.; Wang, H. Simulated change in the near-surface soil freeze/thaw cycle on the Tibetan Plateau from 1981 to 2010. Chin. Sci. Bull. 2014, 59, 2439–2448. [Google Scholar] [CrossRef]
- Fang, X.; Luo, S.; Lyu, S.; Chen, B.; Zhang, Y.; Ma, D.; Chang, Y. A Simulation and Validation of CLM during Freeze-Thaw on the Tibetan Plateau. Adv. Meteorol. 2016, 2016, 9476098. [Google Scholar] [CrossRef]
- Yang, K.; Wang, C. Water storage effect of soil freeze-thaw process and its impacts on soil hydro-thermal regime variations. Agric. For. Meteorol. 2019, 265, 280–294. [Google Scholar] [CrossRef]
- Wu, Q.; Hou, Y.; Yun, H.; Liu, Y. Changes in active-layer thickness and near-surface permafrost between 2002 and 2012 in alpine ecosystems, Qinghai-Xizang (Tibet) Plateau, China. Glob. Planet. Chang. 2015, 124, 149–155. [Google Scholar] [CrossRef]
- Wang, G.; Liu, G.; Li, C.; Yang, Y. The variability of soil thermal and hydrological dynamics with vegetation cover in a permafrost region. Agric. For. Meteorol. 2012, 162–163, 44–57. [Google Scholar]
- Yin, D.; Roderick, M.L. A framework to quantify the inter-annual variation in near-surface air temperature due to change in precipitation in snow-free regions. Environ. Res. Lett. 2020, 15, 114028. [Google Scholar] [CrossRef]
- Lamsal, P.; Kumar, L.; Shabani, F.; Atreya, K. The greening of the Himalayas and Tibetan Plateau under climate change. Glob. Planet. Chang. 2017, 159, 77–92. [Google Scholar] [CrossRef]
- Alessandri, A.; Catalano, F.; Felice, M.D.; Hurk, B.; Balsamo, G. Varying snow and vegetation signatures of surface-albedo feedback on the Northern Hemisphere land warming. Environ. Res. Lett. 2021, 16, 034023. [Google Scholar] [CrossRef]
- Gao, Y.; Li, X.; Leung, L.R.; Chen, D.; Xu, J. Aridity changes in the Tibetan Plateau in a warming climate. Environ. Res. Lett. 2015, 10, 034013. [Google Scholar] [CrossRef]
- Li, D.; Wen, Z.; Cheng, Q.; Xing, A.; Zhang, M.; Li, A. Thermal dynamics of the permafrost active layer under increased precipitation at the Qinghai-Tibet Plateau. J. Mt. Sci. 2019, 16, 309–322. [Google Scholar] [CrossRef]
- Wu, T.; Zhao, L.; Li, R.; Wang, Q.; Xie, C.; Pang, Q. Recent ground surface warming and its effects on permafrost on the central Qinghai-Tibet Plateau. Int. J. Climatol. 2013, 33, 920–930. [Google Scholar] [CrossRef]
- Wang, K.; Zhang, T.; Yang, D. Permafrost dynamics and their hydrologic impacts over the Russian Arctic drainage basin. Adv. Clim. Chang. Res. 2021, 12, 482–498. [Google Scholar] [CrossRef]
- Pattison, R.R.; Jorgenson, J.C.; Raynolds, M.K.; Welker, J.M. Trend in NDVI and tundra community composition in the arctic of NE Alaska between 1984 and 2009. Ecosystems 2015, 18, 707–719. [Google Scholar] [CrossRef]
- Blok, D.; Heijmans, M.M.P.D.; Schaepman-Strub, G.; Kononov, A.V.; Maximov, T.C.; Berendse, F. Shrub expansion may reduce summer permafrost thaw in Siberian tundra. Glob. Chang. Biol. 2010, 16, 1296–1305. [Google Scholar] [CrossRef]
- Smith, S.L.; Lewkowicz, A.G.; Duchesne, C.; Ednie, M. Variability and change in permafrost thermal state in northern Canada. In Proceedings of the 68th Canadian Geotechnical Conference and Seventh Canadian Conference on Permafrost, Québec, QC, Canada, 20–23 September 2015. [Google Scholar]
- Lu, Y.; Yang, Y.; Wang, L.; Liu, J. Recent hiatus of Tibetan Plateau vegetation greening and the consequence impact on climate. In Proceedings of the EGU General Assembly 2023, Vienna, Austria, 24–28 April 2023. [Google Scholar]
Disclaimer/Publisher’s Note: The statements, opinions and data contained in all publications are solely those of the individual author(s) and contributor(s) and not of MDPI and/or the editor(s). MDPI and/or the editor(s) disclaim responsibility for any injury to people or property resulting from any ideas, methods, instructions or products referred to in the content. |
© 2023 by the authors. Licensee MDPI, Basel, Switzerland. This article is an open access article distributed under the terms and conditions of the Creative Commons Attribution (CC BY) license (https://creativecommons.org/licenses/by/4.0/).