Technical Note

Validation of Landsat-9 and Landsat-8 Surface Temperature and Reflectance during the Underfly Event

Rochester Institute of Technology, 54 Lomb Memorial Drive, Rochester, NY 14623, USA
*
Author to whom correspondence should be addressed.
Remote Sens. 2023, 15(13), 3370; https://doi.org/10.3390/rs15133370
Submission received: 3 May 2023 / Revised: 28 June 2023 / Accepted: 30 June 2023 / Published: 30 June 2023

Abstract

:
With the launch of Landsat-9 on 27 September 2021, Landsat continues its fifty-year continuity mission of providing users with calibrated Earth observations. It has become a requirement that an underflight experiment be performed during commissioning to support sensor cross-calibration. In this most recent experiment, Landsat-9 flew under Landsat-8 for nearly three days with over 50% ground overlap, from 13 to 15 November 2021. To address the scarcity of reference data that are available to support calibration and validation early-on in the mission, a ground campaign was planned and executed by the Rochester Institute of Technology (RIT) on 14 November 2021 to provide full spectrum measurements for early mission comparisons. The primary experiment was conducted in the Outer Banks, North Carolina at Jockey’s Ridge Sand Dunes. Full-spectrum ground-based measurements were acquired with calibrated reference equipment, while a novel Unmanned Aircraft System (UAS)-based platforms acquired hyperspectral visible and near-infrared (VNIR)/Short-wave infrared (SWIR) imagery data and coincident broadband cooled thermal infrared (TIR) imagery. Results of satellite/UAS/ground comparisons were an indicator, during the commissioning phase, that Landsat-9 is behaving consistently with Landsat-8, ground reference, and UAS measurements. In the thermal infrared, all measurements agree to be within 1 K over water and to within 2 K over sand, which represents the most challenging material for estimating surface temperature. For the surface reflectance product(s), Landsat-8 and -9 are in good agreement and only deviate slightly from ground reference in the SWIR bands; a deviation of 2% in the VNIR and 5–8% in the SWIR regime. Subsequent longer-term studies indicate that Landsat 9 continues to perform as expected. The behavior of Thermal Infrared Sensor-2 (TIRS-2) against reference is also shown for the first year of the mission to illustrate its consistent performance.

1. Introduction

Landsat-9 (L9) was launched on 27 September 2021 and continues the 50 year mission of continuous Earth observations from space. With the inclusion of the Thermal Infrared Sensor-2 (TIRS-2) instrument, Landsat-9 is now contributing to over 40 years of continuous thermal observations. The Rochester Institute of Technology (RIT) has provided thermal infrared (TIR) reference data for Landsat thermal sensor calibration since 1999 and has become increasingly involved in validation of their corresponding products. In addition, RIT’s ground and airborne assets can also provide visible and near-infrared (VNIR)/Short-wave infrared (SWIR) reference datasets for the Operational Land Imager (OLI) instrument.
During L9 commissioning, an underflight experiment was performed where L9 was maneuvered into the field-of-view of Landsat-8’s (L8) instruments for an extended period to support cross-comparison studies. Note that underflights were also performed for Landsat-7 (L7) and L8, and have become a mission requirement [1]. An orbital model, developed and periodically refined by Flight Dynamics [1], was used to identify dates and drive the corresponding locations of ground efforts for when and where L8/L9 would image with the most overlap. Based on the orbital model, the three days targeted for this experiment were 13 to 15 November 2021.
Considering the scarcity of thermal reference data, RIT’s alignment with thermal image validation [2], and the maturity of its drone program with respect to science applicability [3,4], a ground campaign to support L9/L8 cross-comparisons was planned and executed on 14 November 2021 (primarily) at Jockey’s Ridge State Park in the Outer Banks, NC. The Jockey’s Ridge State Park (35 57 45.29 N, 75 38 14.50 W) spans a 1.73 km 2 area and includes the tallest active sand dune system in the eastern United States. During this ground campaign, multi-modal data were acquired using ground- and Unmanned Aircraft System (UAS)-based sensors to validate the surface reflectance and temperature products derived from L8 and L9 OLI and TIRS instruments, respectively. The dunes provided a near-uniform scene for performing validation of higher level science products, and was ideal due to its similarity to pseudoinvariant calibration sites (PICS), such as Libya-4 [5,6]. The sand dunes represent a challenging material for the estimation of surface temperature for spaceborne thermal infrared data while the adjacent water represents an ideal material. Figure 1 highlights the primary ground-campaign location where data were collected with full-spectrum ground and airborne (UAS-based) platforms.
Full spectrum ground-based reference measurements were acquired with a Spectra Vista Corporation (SVC) Spectroradiometer (350 nm to 2500 nm) and a Fourier transform infrared (FTIR) longwave spectroradiometer (2 μ m to 16 μ m). Full spectrum image data were acquired from UAS-based platforms to assess the feasibility of using the onboard instrumentation for validation of satellite-based measurements. Additionally, to expand calibration opportunities beyond this site, TidBit dataloggers [7] were placed in water bodies across the continental United States (CONUS), see Figure 2, to measure water temperature and assess the potential utility of these sensors for validation of Landsat’s thermal products.
The underfly event provides an opportunity to perform a radiometric and geometric assessment on the performance of Landsat-9 early on-orbit. In this paper, the methodologies required to provide an initial performance characterization of the TIRS-2 (and OLI-2) instrument(s) is discussed. A year of buoy water reference measurements compared to Landsat Surface Temperature (ST) products indicate the TIRS-2 continues to behave nominally with the ground-based calibration derived by NASA Goddard [8].

2. Methodologies

This section provides an overview of the ground and UAS-based equipment used throughout the underfly campaign to validate the surface reflectance and (primarily) temperature products from the L8/L9 image data. We report the precision and accuracy of each of the thermal instruments that were used throughout the experiment.

2.1. Ground Instrumentation

2.1.1. Designs and Prototypes (D&P) FTIR

A Fourier transform infrared (FTIR) spectroradiometer, called the μ FTIR (developed by Designs and Prototypes), was used to acquire spectral emissivity measurements throughout the ground campaign. The μ FTIR is designed to collect spectral measurements from 2 to 16 μ m at a resolution of 6 cm 1 . Figure 3 shows the μ FTIR instrument, as well as an example of the spectral data acquired for each sample.
A lab experiment was performed to assess the quality of the data acquired from the spectroradiometer. The NE Δ T and the absolute radiometric uncertainty of the instrument were estimated from data acquired from thirty-minute blackbody (BB) acquisitions at 288 K, 303 K and 318 K, which spans the (approximate) operational range of the instrument. Note that this μ FTIR does have a small operational range (approx. 285–315 K) due to power limitations, so the BB-stares were confined to this range.
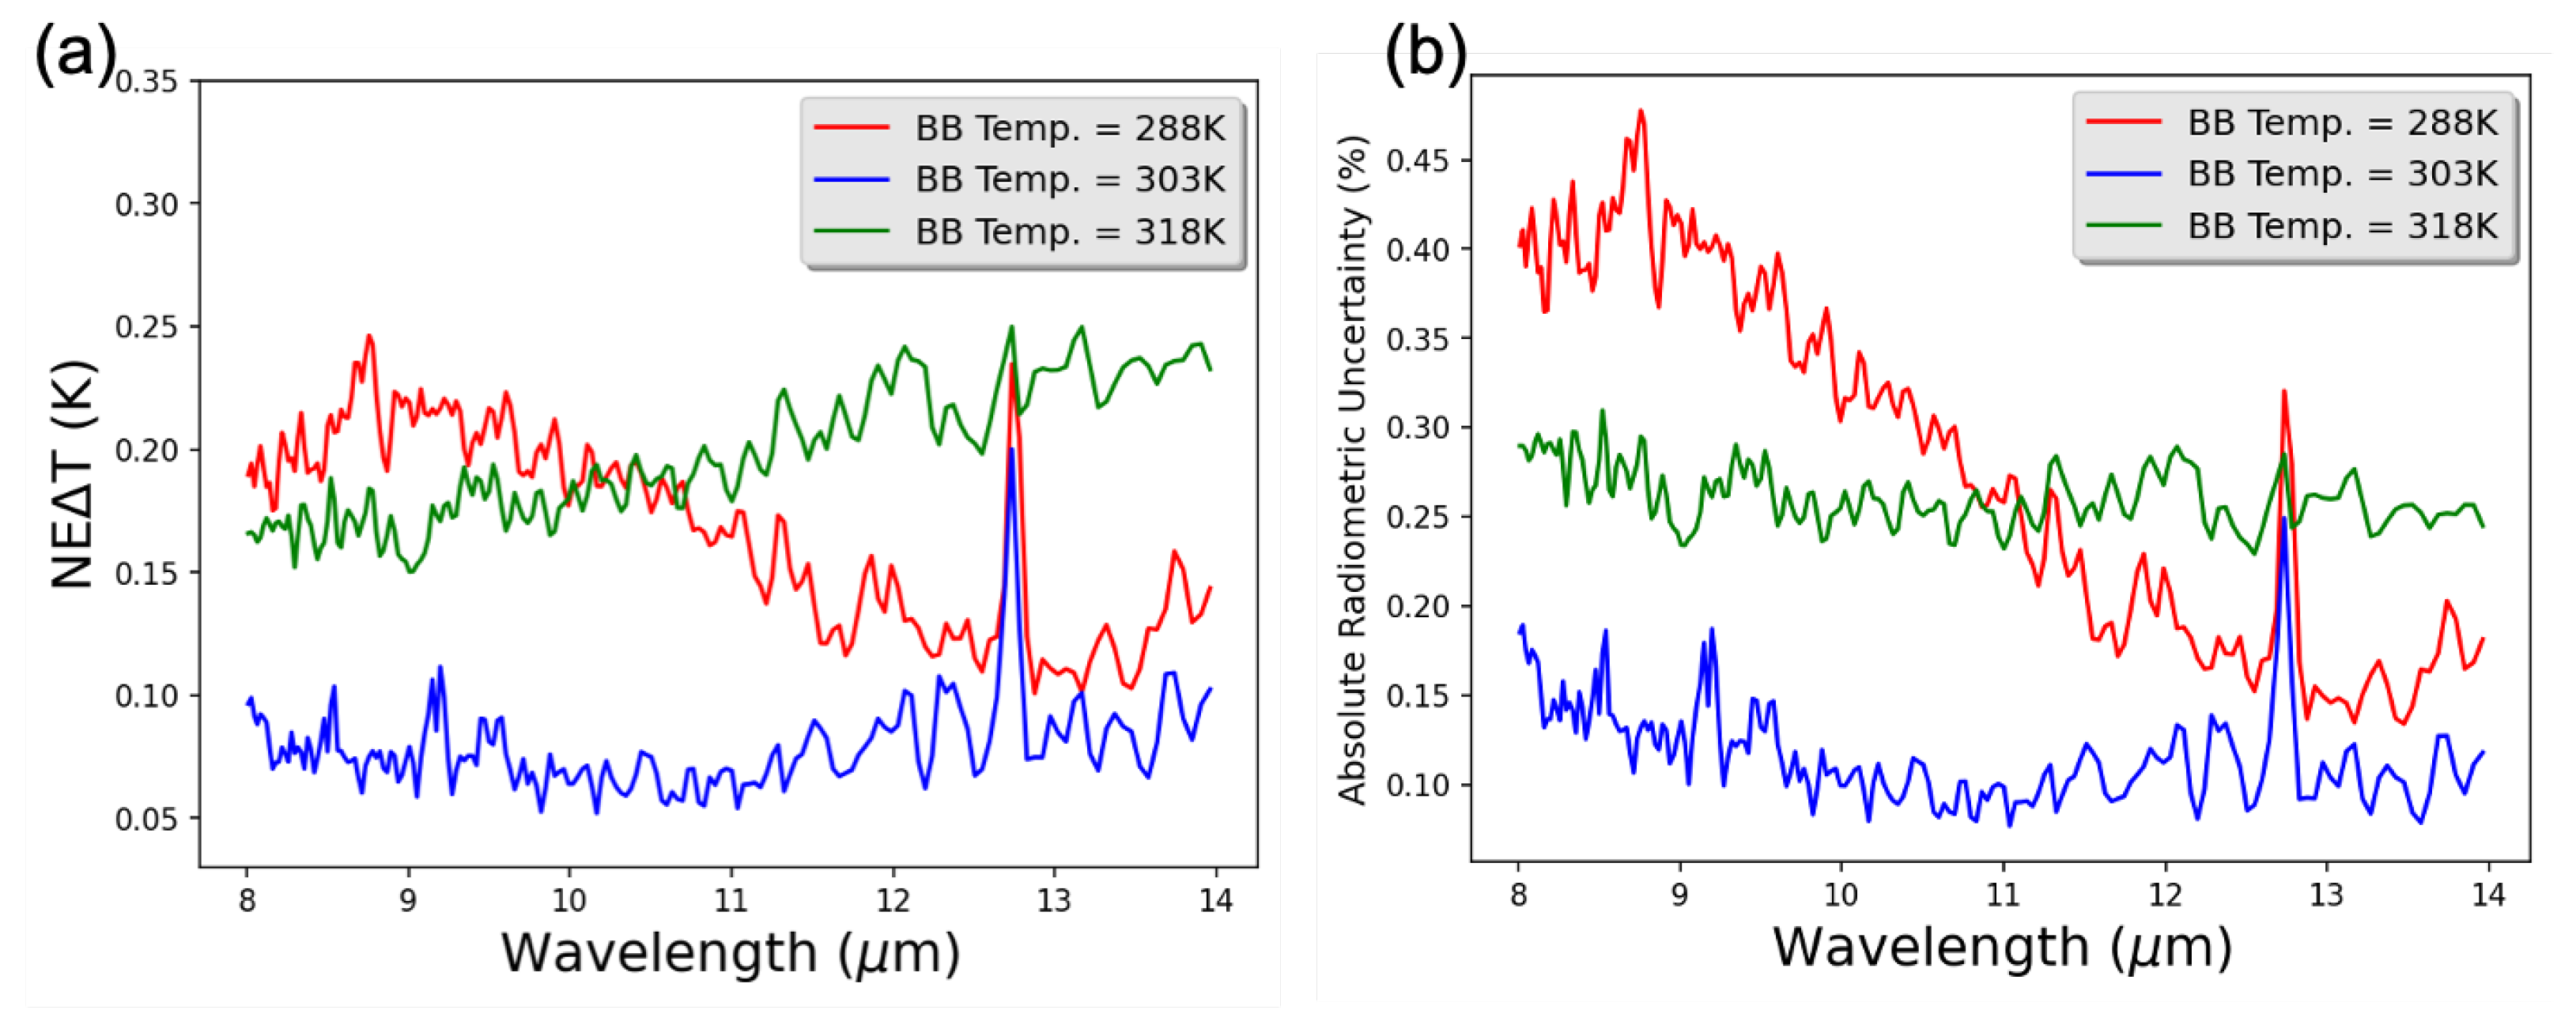
The NE Δ T and the absolute radiometric uncertainty of the μ FTIR is shown in Figure 4. The NE Δ T is less than 0.25 K between 8 and 14 μ m, while the absolute radiometric uncertainty is less than 0.5% for the same wavelength range. This illustrates the high fidelity of the μ FTIR in measuring radiance, and why it is ultimately used as reference by RIT for surface temperature product validation.
Ground-based spectral reference measurements from the μ FTIR were acquired over several points across the dunes. The surface temperatures are derived from these data using the Temperature/Emissivity Separation (TES) algorithm first developed by Gillespie et al. (1998) [9] for the 5-band ASTER thermal instrument. The measurement protocol for the μ FTIR is further detailed by Gerace et al. (2022) [2].

2.1.2. Onset HOBO TidBit Temperature Loggers

Water represents a favorable target for sensor characterization due to its high thermal inertia and well-behaved emissivity [10,11]. As such, Onset HOBO TidBit temperature dataloggers (Onset Computer Corporation) have proven to be attractive instruments for acquiring thermal reference data. Several of these instruments were submerged in targeted water bodies throughout the underfly campaign (Figure 2).
The TidBit specification manual claims to be accurate within ±0.2 C over the operational range 0–70 C [7]. A modified lab experiment was conducted to confirm the fidelity of the TidBit temperature dataloggers. The (six) TidBit sensors were placed in a water bath at three different temperatures (288 K, 303 K, and 318 K) to characterize their accuracy. Note that once the water bath achieved the desired temperature, 60 min of measurements were acquired with 1 Hz sampling frequency. The average NE Δ T, drift and absolute uncertainty of the TidBit sensors are shown in Table 1. The NE Δ T on average is less than 0.04 K for the TidBit dataloggers, which shows the fidelity of the sensor in monitoring water temperature. As such, these TidBit sensors provide an inexpensive mechanism for long-term characterization of spaceborne surface temperature products.
The TidBit dataloggers were configured to acquire temperature measurements every 5 min in the field, enabling (approximately) a full year of battery life at that sampling rate. With this capability, the TidBit dataloggers were left deployed in the Arizona inland lakes (Figure 2-left zoom) for continual validation of surface temperature products from Landsat-8 and -9. The measured water temperature for Canyon Lake, AZ over a period of 30 days is shown in Figure 5.

2.1.3. Spectra Vista Corporation (SVC) Spectroradiometer

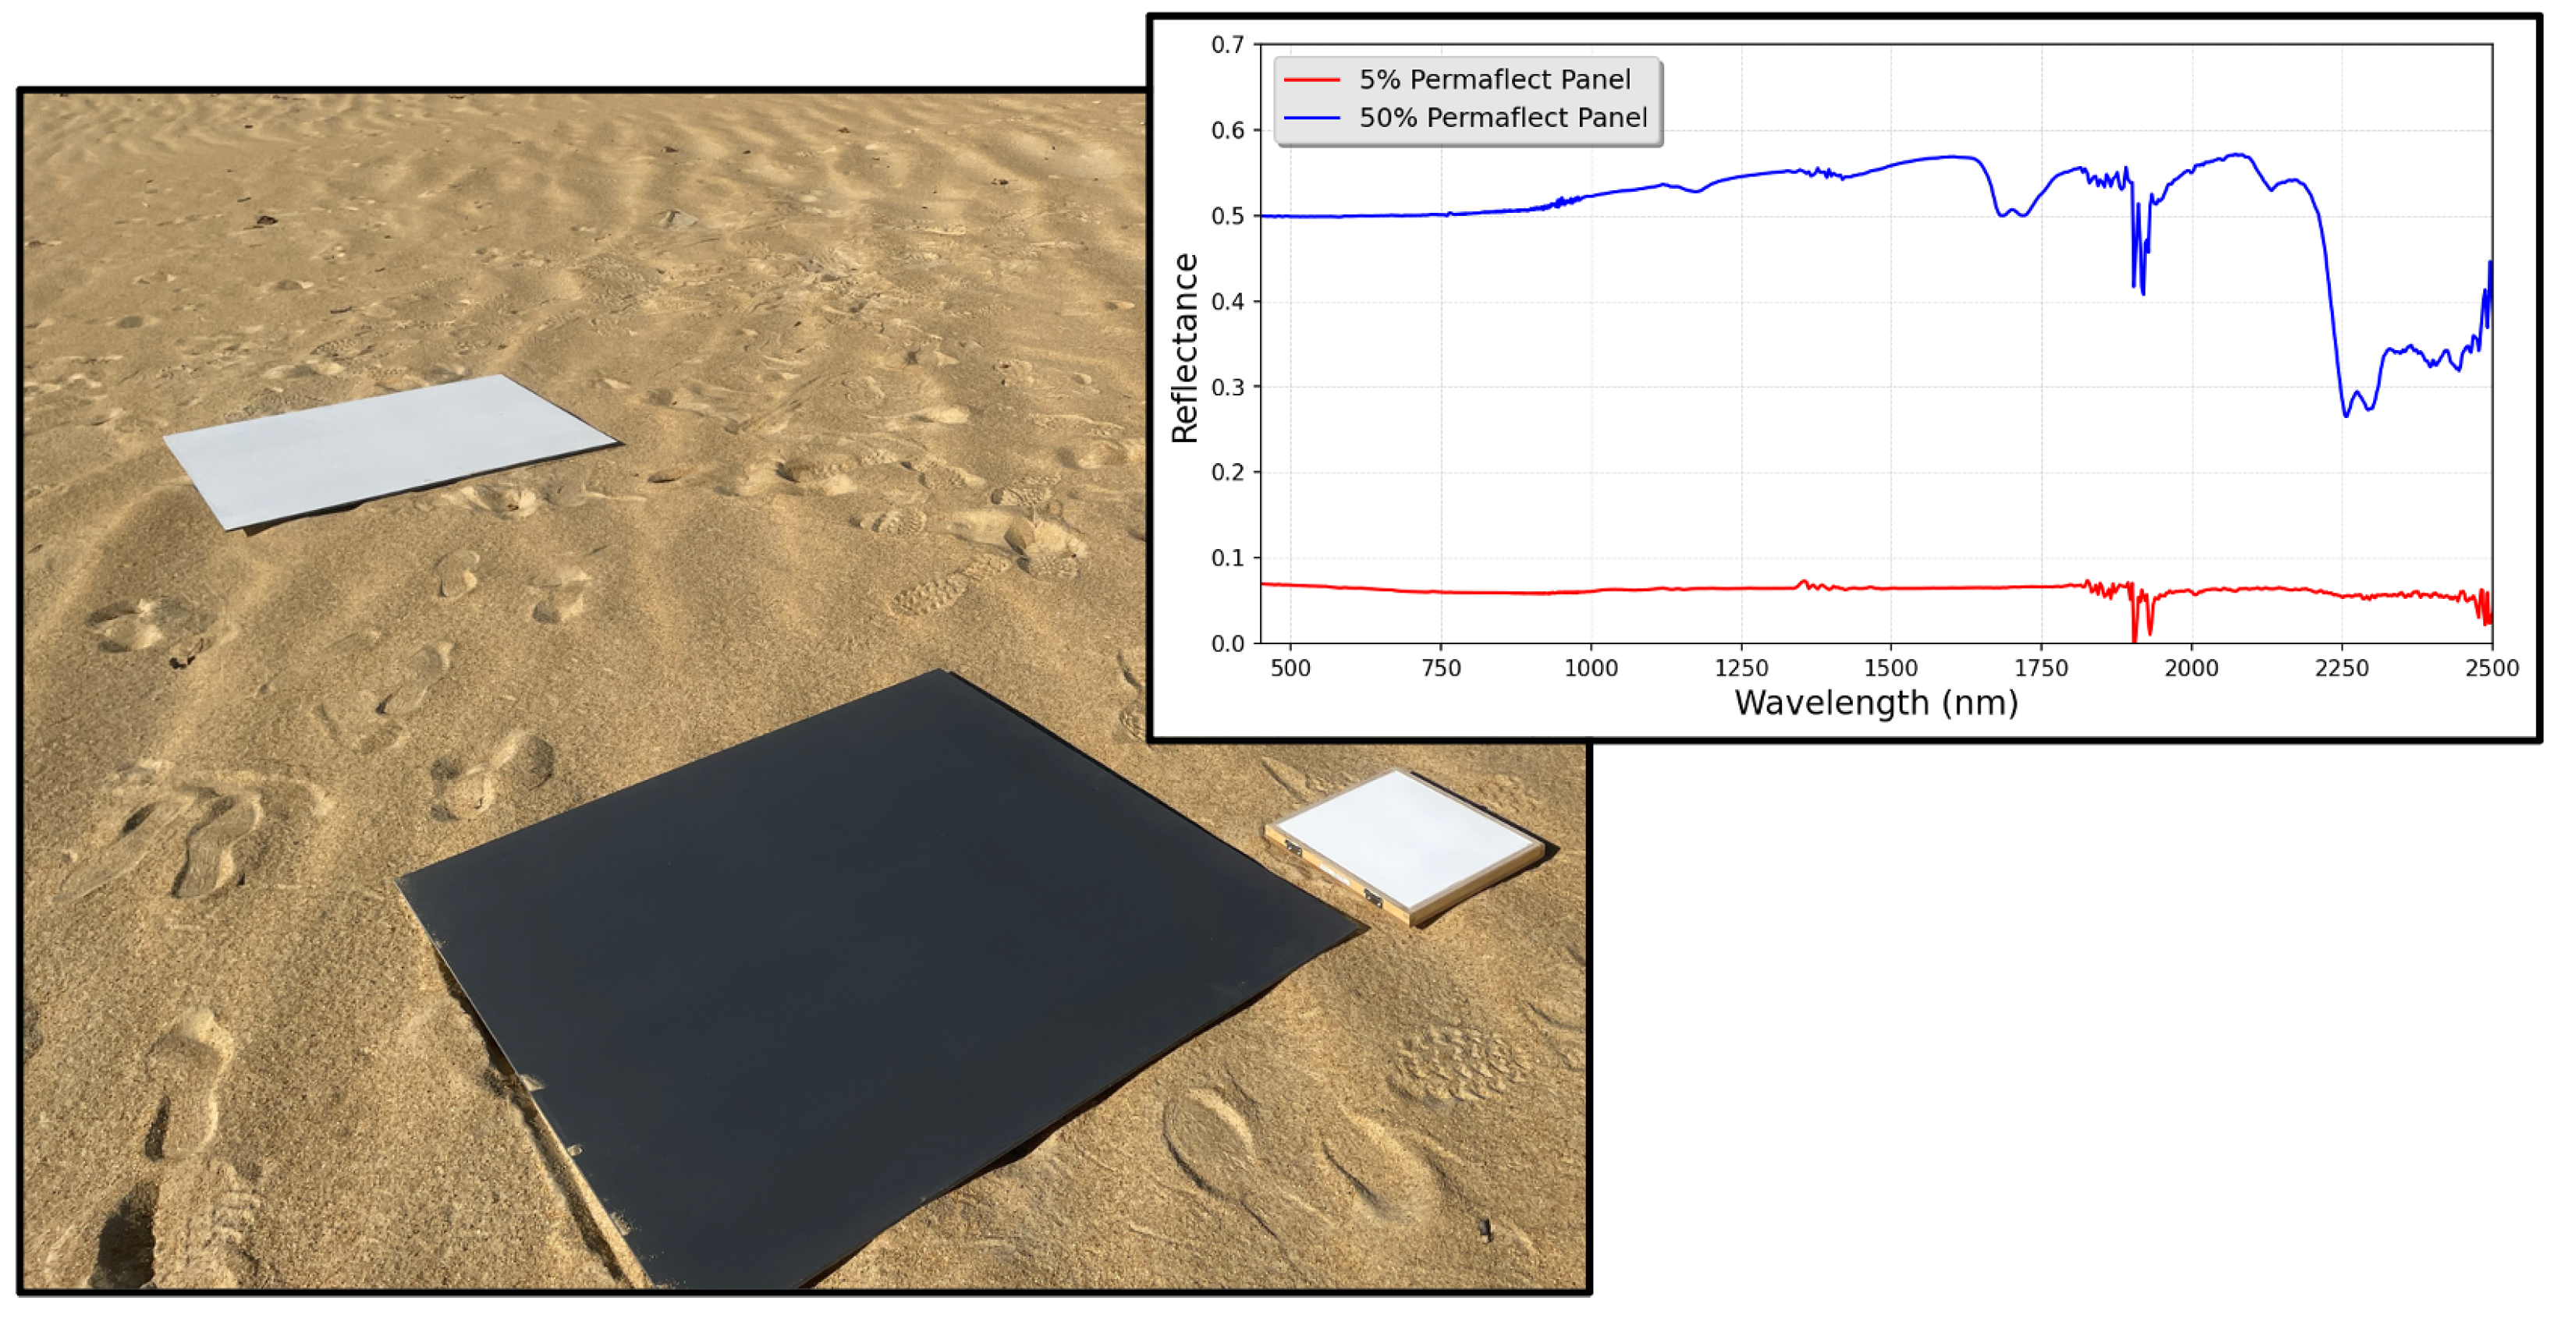
The Empirical Line Method (ELM) provides a simple means of estimating surface reflectance, and remove atmospheric effects, for image data acquired from UAS-based sensors [12]. This method requires one or more calibrated targets of known reflectance within the UAS flight plan. During the field survey, two (1 m by 1 m) Permaflect® panels developed by Labsphere Inc. of known reflectance (5% and 50%) were placed within our field survey at Jockey’s Ridge. The Permaflect® diffuse reflectance coating is capable of maintaining a relatively uniform spectral response under a wide variety of environmental conditions, and has negligible effects of gloss, polarization, and fluorescence (Permaflect®, Labsphere Inc., North Sutton, NH, USA).
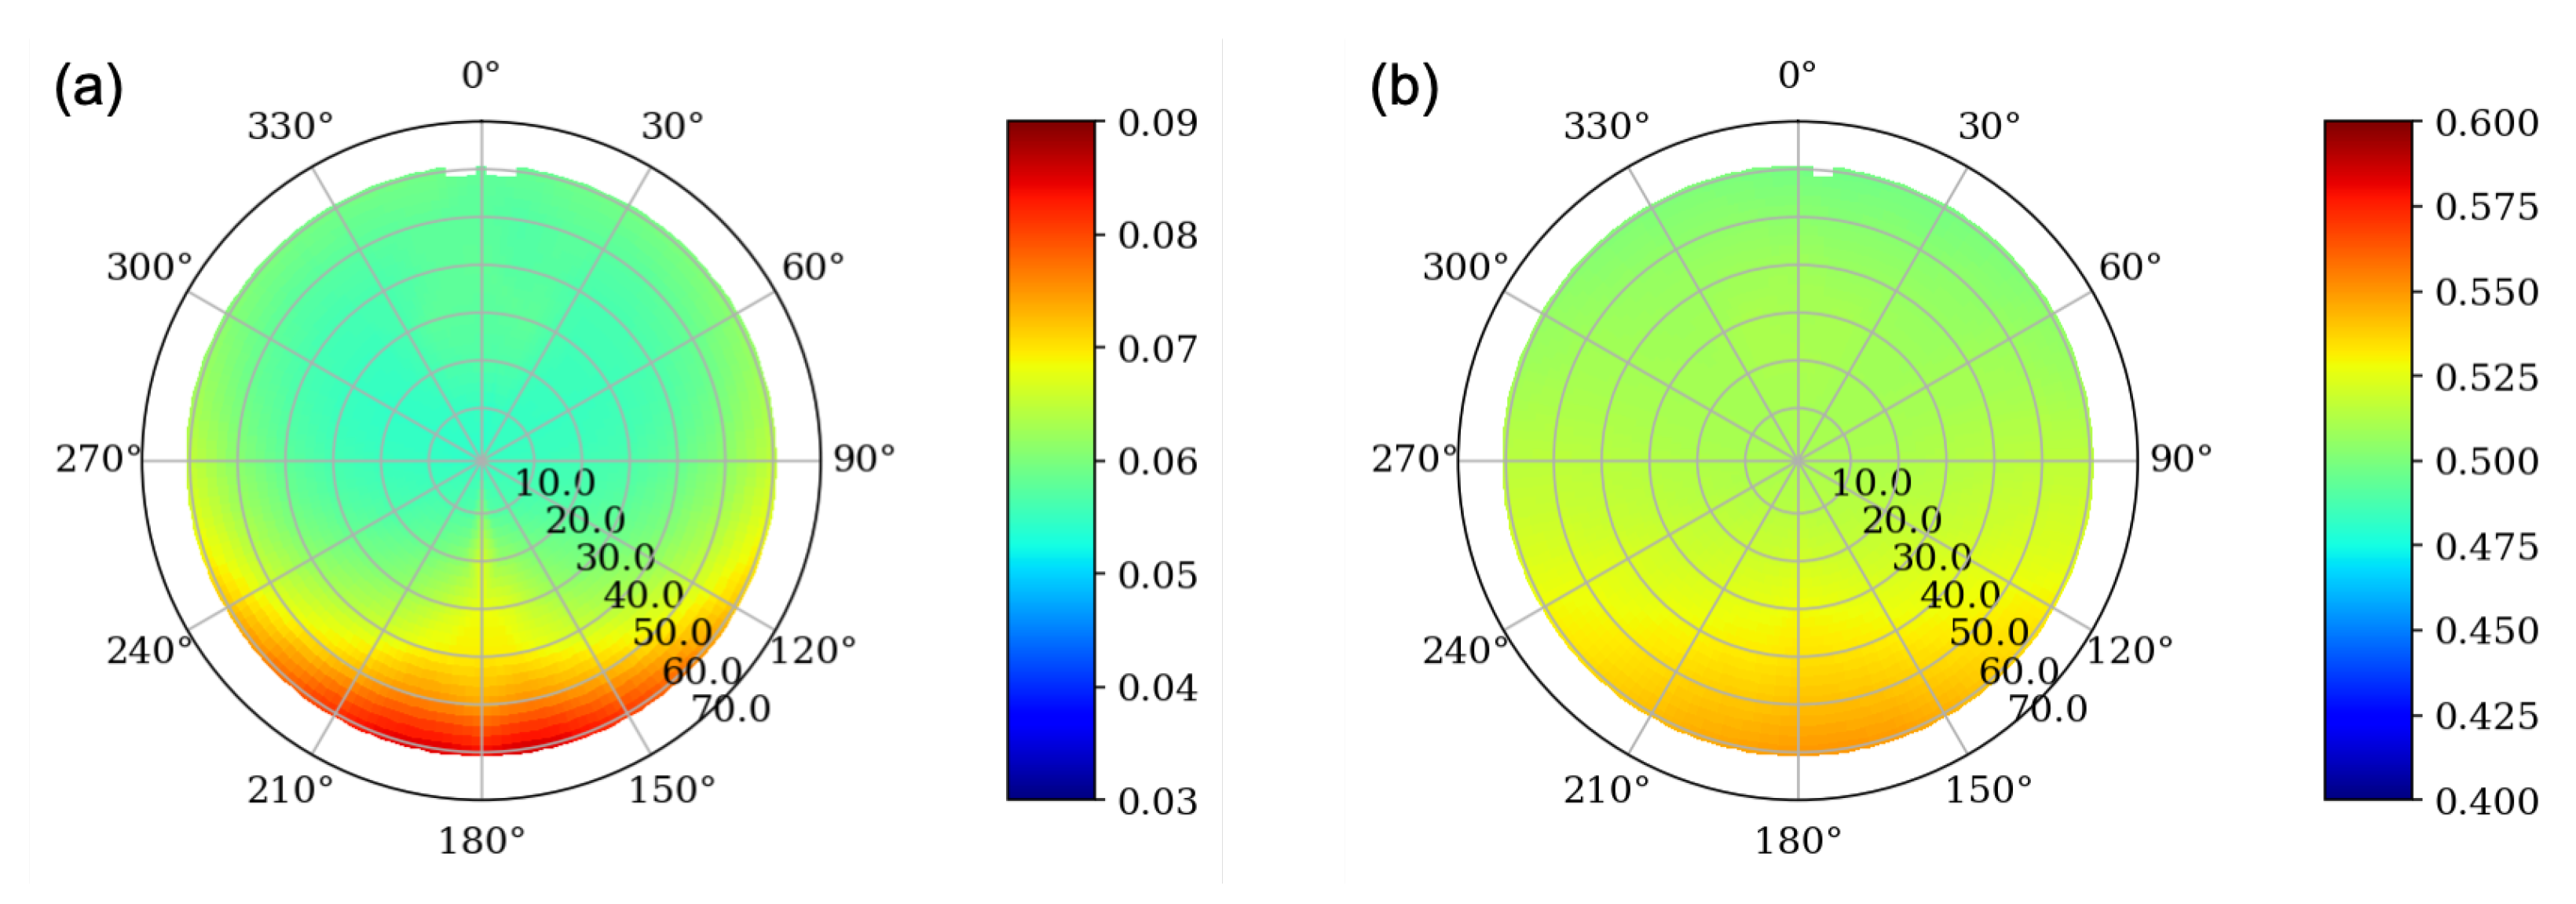
The Bidirectional Reflectance Distribution Function (BRDF) of the reference panels were characterized in the lab using the Goniometer of the Rochester Institute of Technology-Two (GRIT-T) instrument [13]. The BRDF plots for the 5% and 50% panel for Landsat band 4 (640–670 nm) is shown in Figure 6. These BRDF plots are similar to what is observed for Spectralon® panels measured in the lab, which shows the diffuse nature of the Permaflect®. Thus, these reference panels have become preferable for calibrating UAS imagery to surface reflectance, particularly in the VNIR.
In the field, the reflectance of each of the calibration targets was measured on the ground using a handheld spectra vista corporation (SVC) spectroradiometer, which has a spectral range from 350 to 2500 nm (Figure 7) covering the wavelength range of the sensors onboard the UAS platforms. The calibration panels were measured before and after each UAS flight. The recorded radiance of the calibration targets from the UAS-based sensors are related to the measured reflectance from the SVC spectroradiometer of the targets for each wavelength. The predicted linear equation from this relationship is then used to calibrate the imagery from the UAS based sensor to surface reflectance.

2.2. UAS-Based Instrumentation

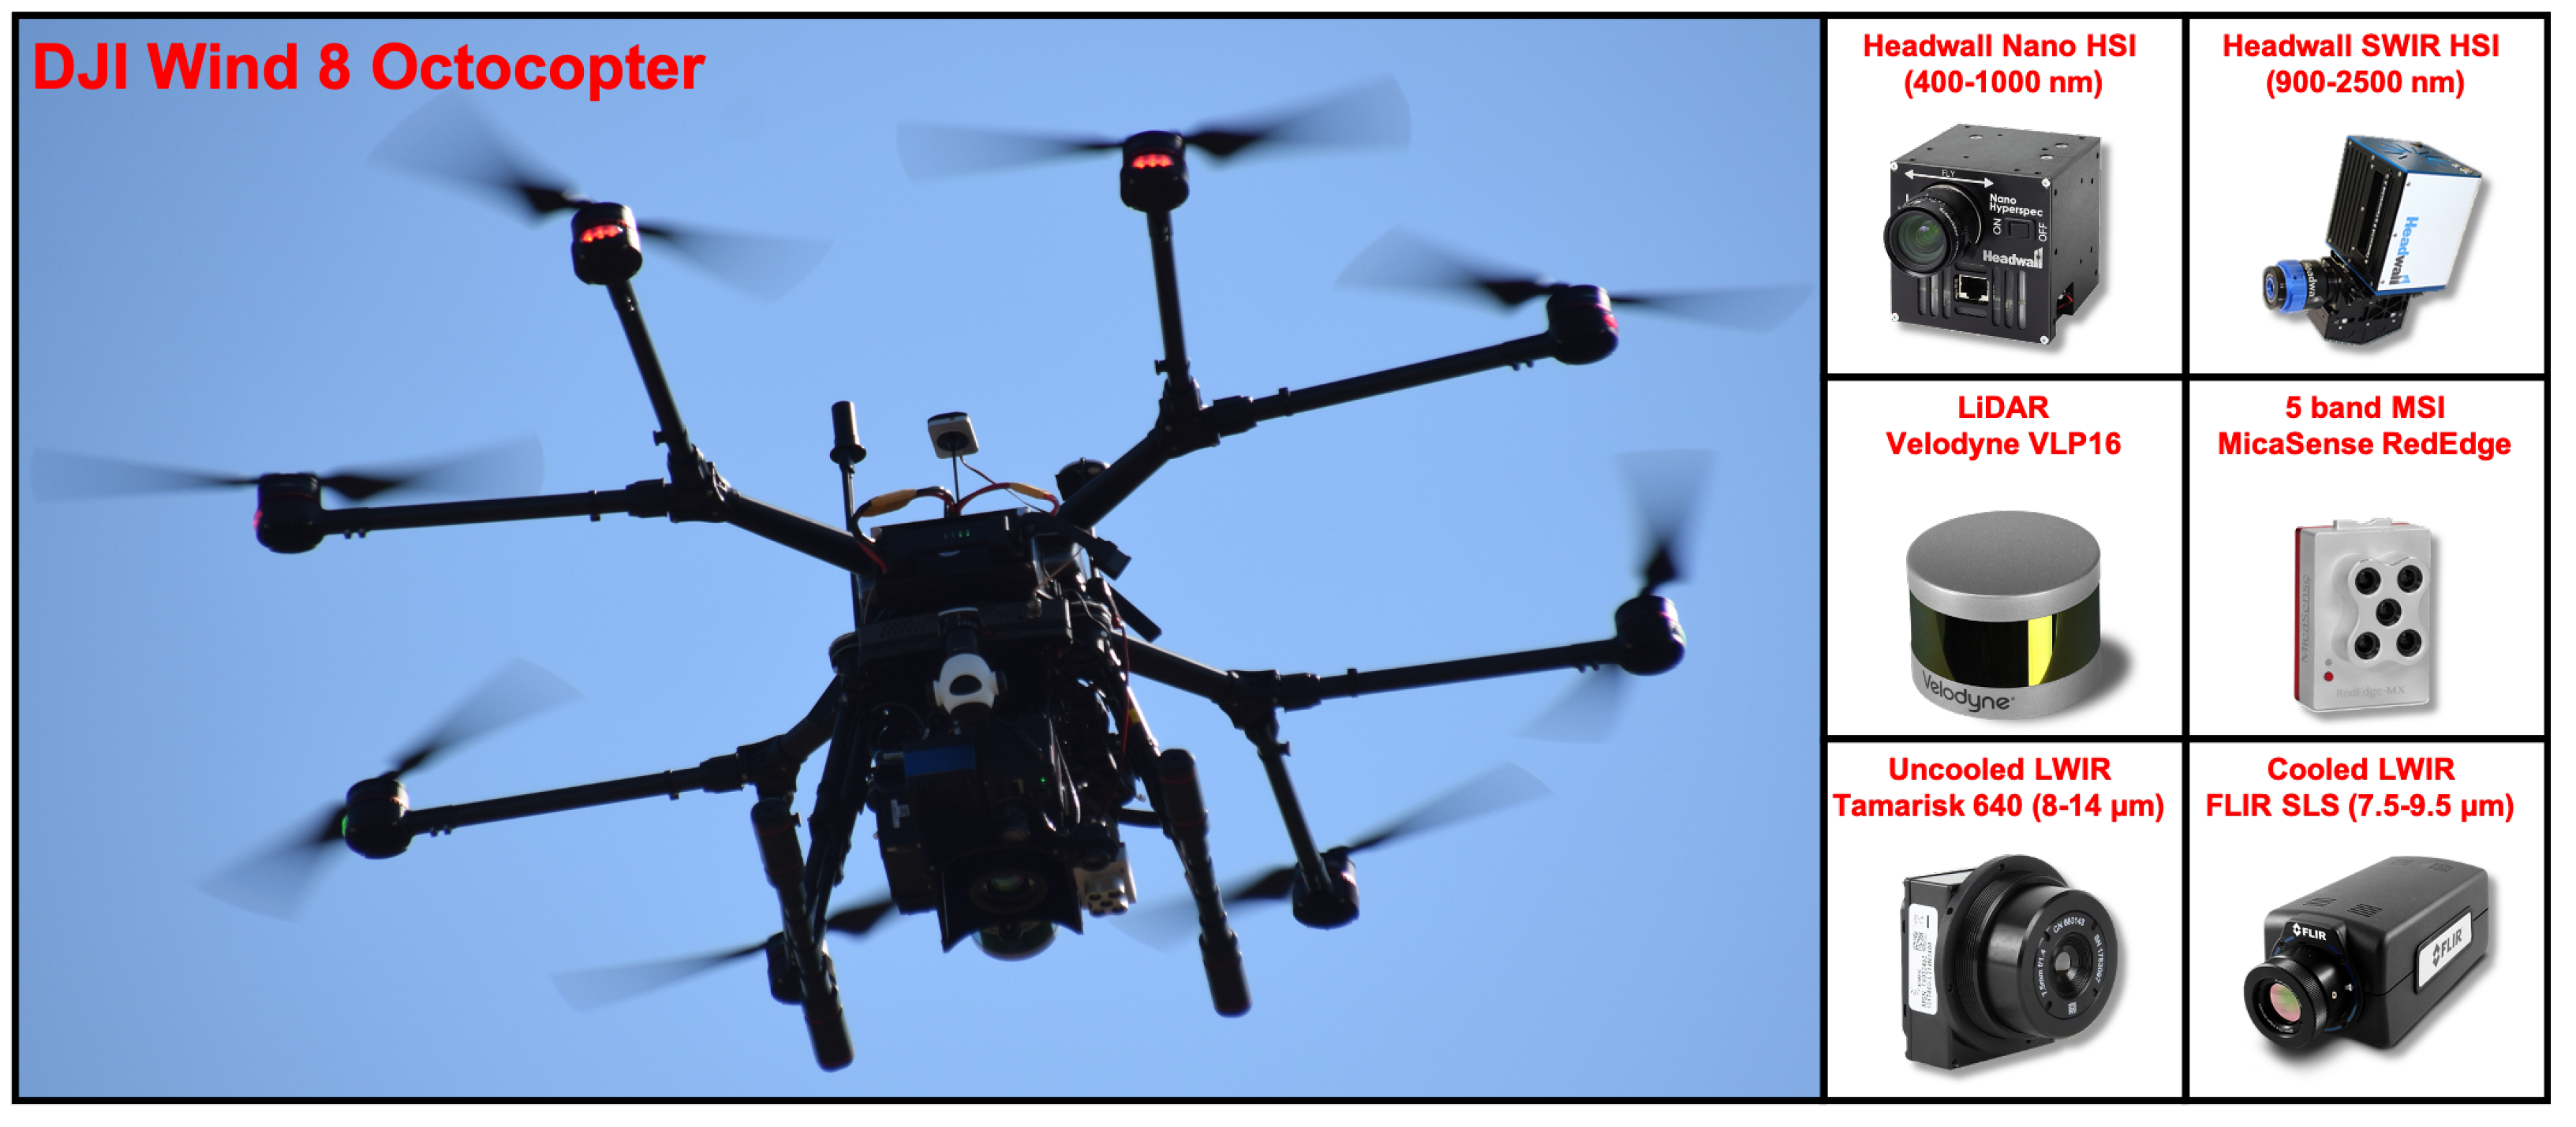
Two separate UAS platforms were flown over the dunes to support the cross-calibration goals of the underfly campaign, the MX-2 and a dedicated SWIR. The MX-2 is a novel multi-modal UAS payload (see Figure 8) consisting of four different sensors, (1) a cooled-longwave imager (Forward Looking Infrared or FLIR), (2) a VNIR hyperspectral nano-imaging sensor, (3) a Velodyne LiDAR, and (4) a five-band MicaSense Red-Edge VNIR Multispectral imaging sensor. The MX-2 platform is also integrated with the Applanix APX15 GPS/IMU to provide high geospatial accuracy. MX-2 is a second generation platform, a replica of the MX-1 UAS payload, integrated with a cooled FLIR (replacing an uncooled Tamarisk), see Kaputa et al. (2019) [4]. A spectrometer to measure downwelling radiance will also be integrated onto the MX-2 payload in the near future, which may provide an alternative methodology to derive surface reflectance. The SWIR hyperspectral imager used for this campaign is on-board a stand-alone UAS platform, which is typically flown in tandem with the MX-2 platform. The work described in this paper demonstrates the capability of the RIT drone program in providing UAS-based reference data in the VNIR, SWIR and LWIR for the purpose of validating imagery from optical space-borne sensors.
Considering RIT’s contributions to Landsat thermal calibration and validation, our primary task for this experiment was to acquire thermal reference data with the cooled longwave infrared (LWIR) sensor to validate Landsat’s surface temperature products. The cooled LWIR onboard MX-2 is a FLIR A6750sc SLS, which incorporates a cooled Strained Layer Superlattice (SLS) detector that operates in the spectral range of 7.5 to 9.5 μ m.
The VNIR hyperspectral imager (HSI) sensor onboard the UAS platform is a Headwall Nano-Hyperspec, which is a pushbroom system providing spectral measurements from 400 to 1000 nm with 270 spectral bands and 640 detectors in the cross-track direction. The (dedicated) SWIR platform is equipped with a Headwall Hyperspec-SWIR, also a pushbroom system providing spectral measurements from 900 to 2500 nm with 267 spectral bands and 384 detectors in the cross-track.
A lab experiment was performed to assess the quality of the data acquired from the FLIR sensor. The NE Δ T and the absolute radiometric uncertainty of the instrument was estimated using BB-stares acquired at 288 K, 303 K, and 318 K for 30 min, see Figure 9 and Figure 10, respectively. The maximum NE Δ T and absolute radiometric uncertainty observed in the lab is less than 0.1 K and 0.17%, respectively. Note that the Headwall instruments undergo radiometric calibration annually by the manufacturer, and verified in-house with an integrating sphere.

3. Results and Discussions

3.1. The Underfly Event

Surface temperature (ST) was measured for each of the thermal sensors (detailed in Section 2) used during the underfly field survey. To support the comparison of TidBit reference to satellite measurements, the split-window algorithm [11] was applied to the corresponding L8/L9 underflight image data over the various water-sites (Figure 2). The split-window algorithm and its associated uncertainties in deriving surface temperature for Landsat is detailed by Gerace et al. [11]. Note that all Western NY image data and most of the Atlantic Coast image data were contaminated by clouds. In fact, only 10 (of 20) comparison opportunities with cloud-free conditions were observed.
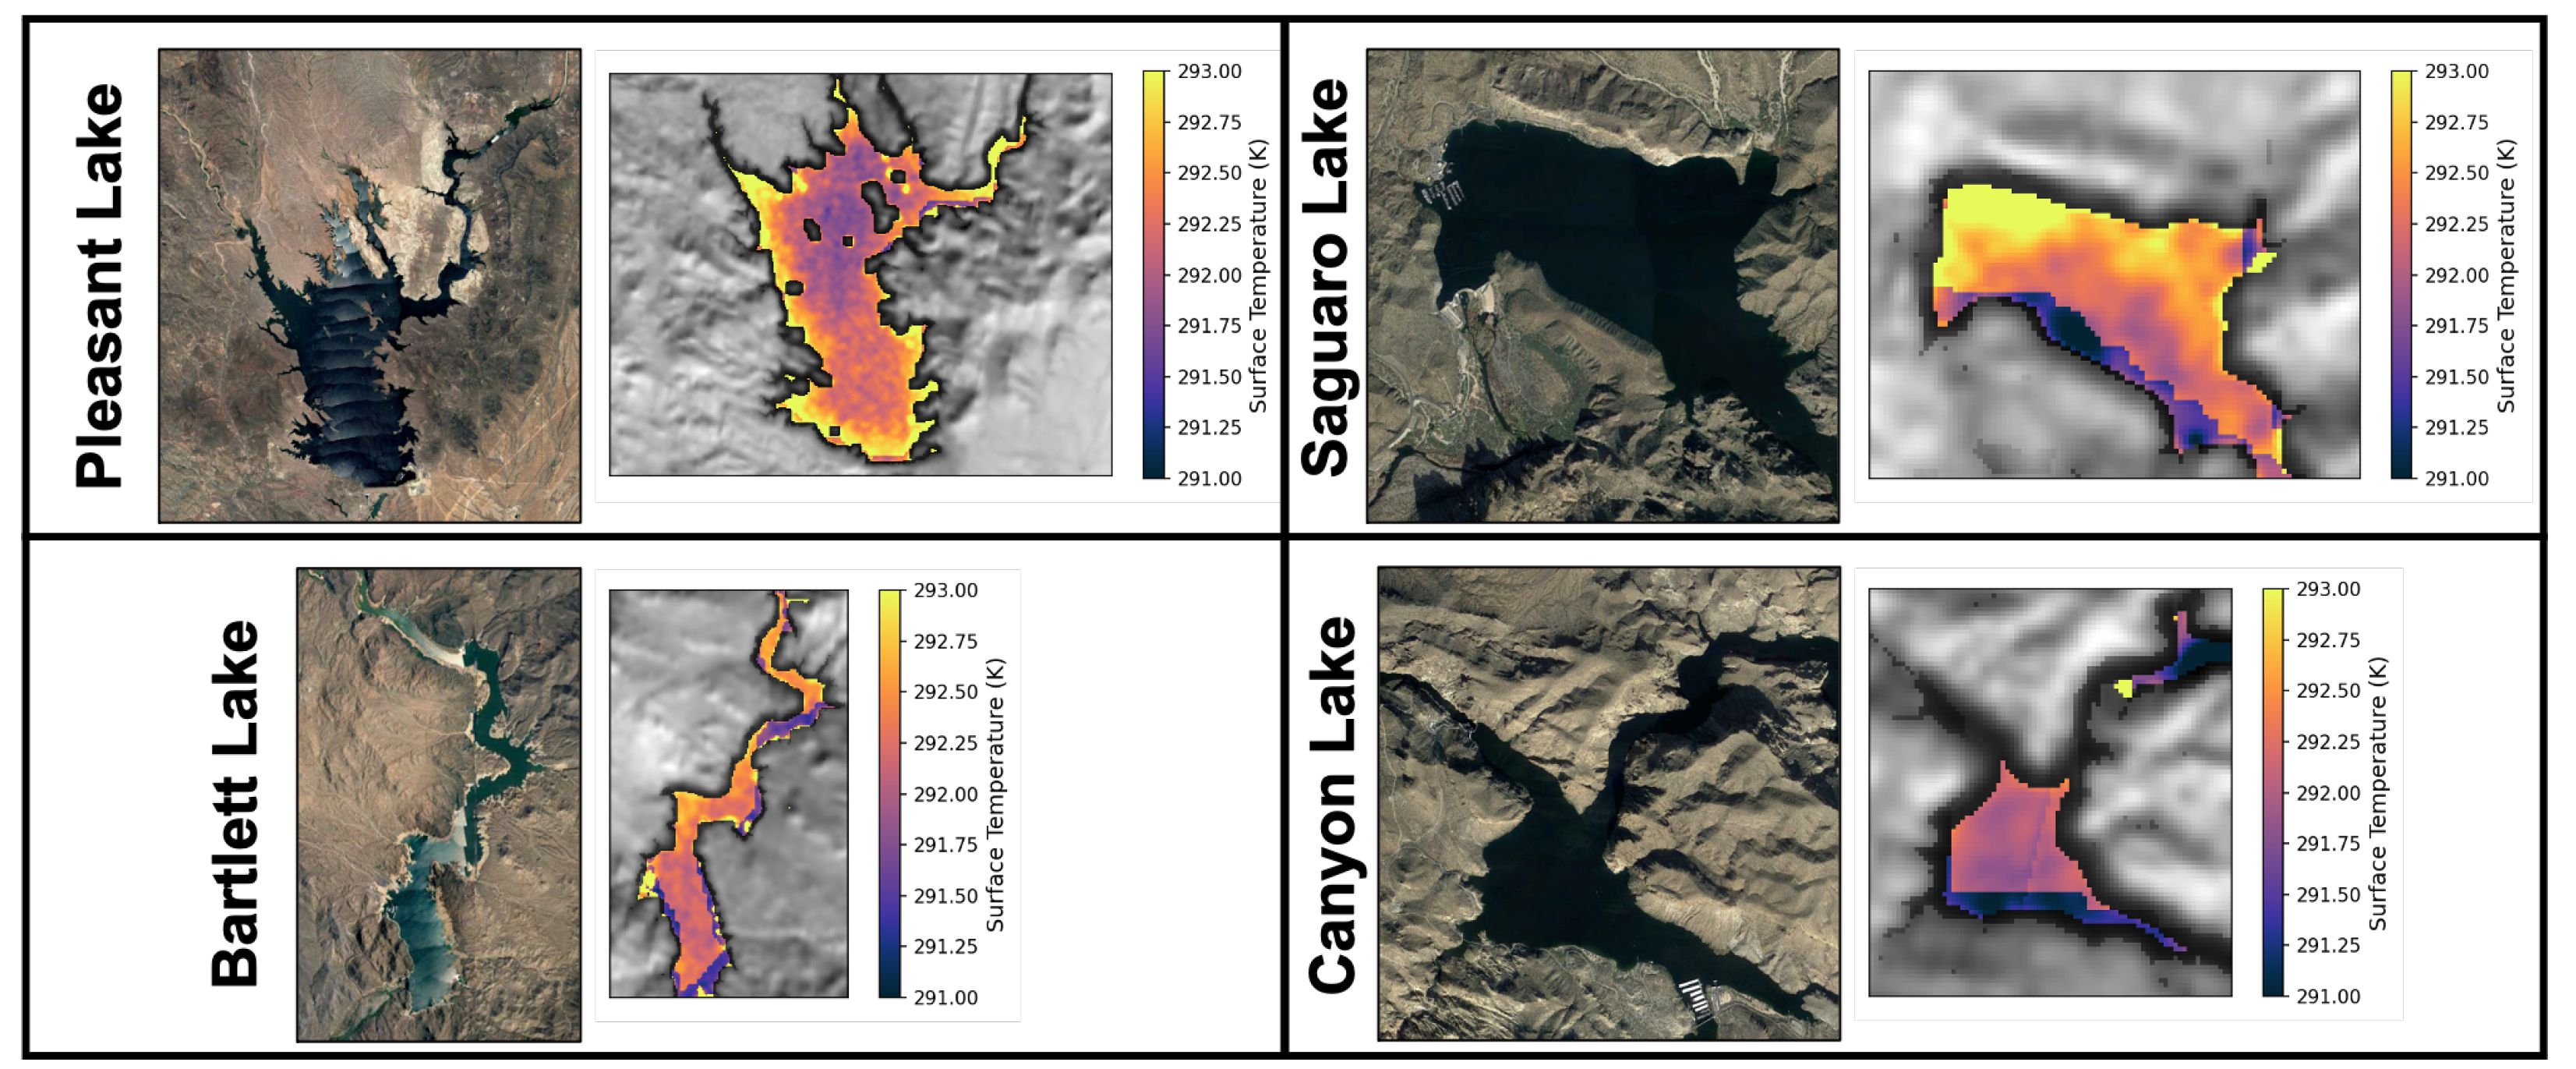
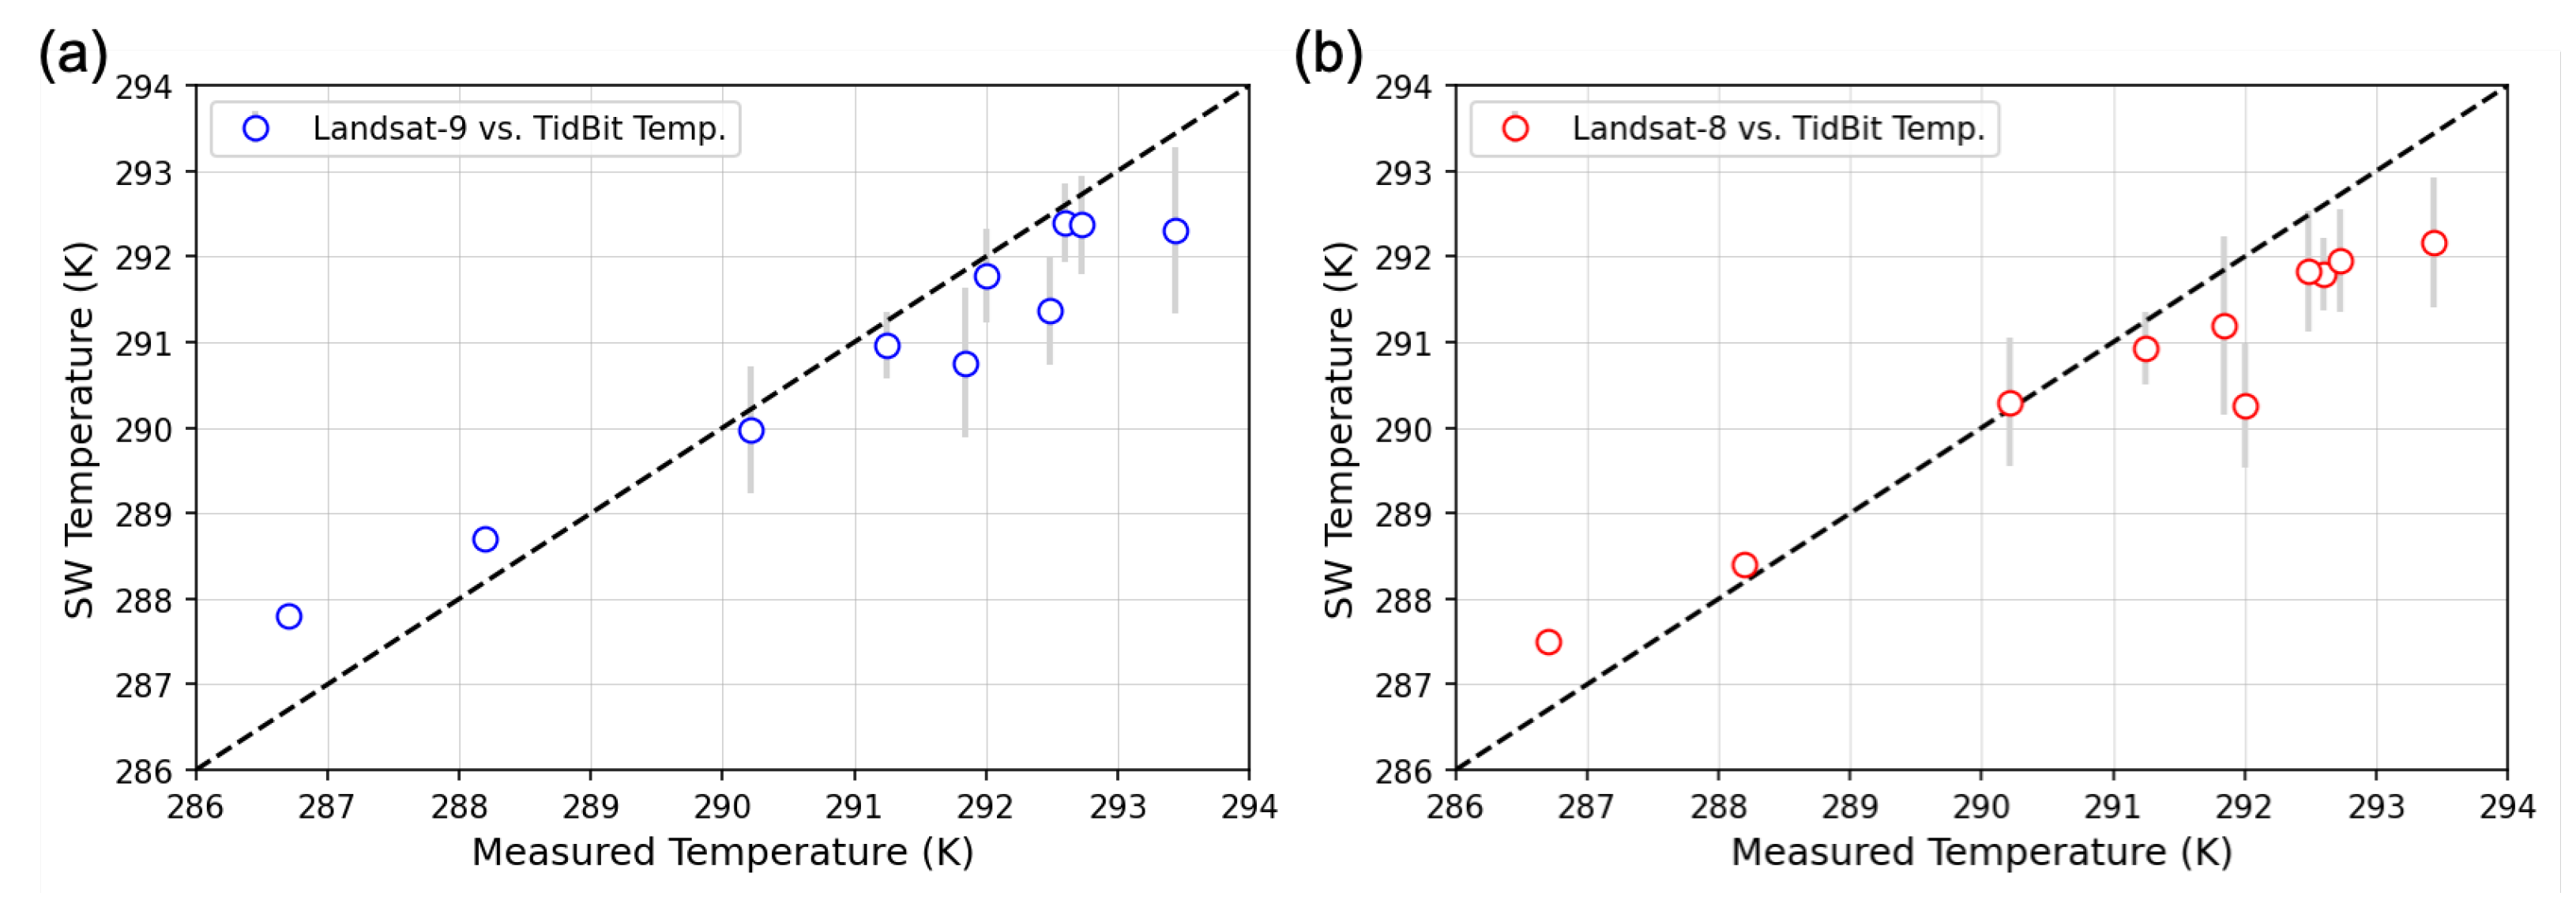
Figure 11 shows a reference image along-side the L9 ST maps for each of the fours lakes in Arizona (Pleasant, Bartlett, Saguaro, and Canyon) acquired during the underflight. The ST product for the lakes show that they are fairly uniform, with approximately a variation of 2 K across the water-body. Figure 12 shows the measured temperature from the TidBits vs. SW-derived ST for the all cloud-free scenes (10 of 20) acquired during the underfly period. Table 2 reports the mean difference, standard deviation and Root Mean Square Error (RMSE) for both L8 and L9 compared to the ground-based measurement. In general, these cloud-free comparisons show that the satellite-derived temperature products are within 0.5 K of in situ water measurements, which is consistent with previous validation efforts [11].
In addition to the various water sites, L8/L9 surface temperature was validated over the main experiment site at Jockey’s Ridge Dune using both ground and UAS-based thermal sensors. The ST product from L8/L9, derived using RIT’s split window workflow, was validated over the dunes using the μ FTIR and the FLIR onboard the MX-2 UAS platform. Figure 13a shows the ST map from L9, (b) the measured emissivity spectra from the μ FTIR, and (c) the ST map from the FLIR over the dunes. The ST measurements from the ground instrumentation, UAS-based sensor and L8/L9 are all within 1 K of each other across the water targets and within 2 K over the sand target in the experimental site in Jockey’s Ridge (see Table 3).
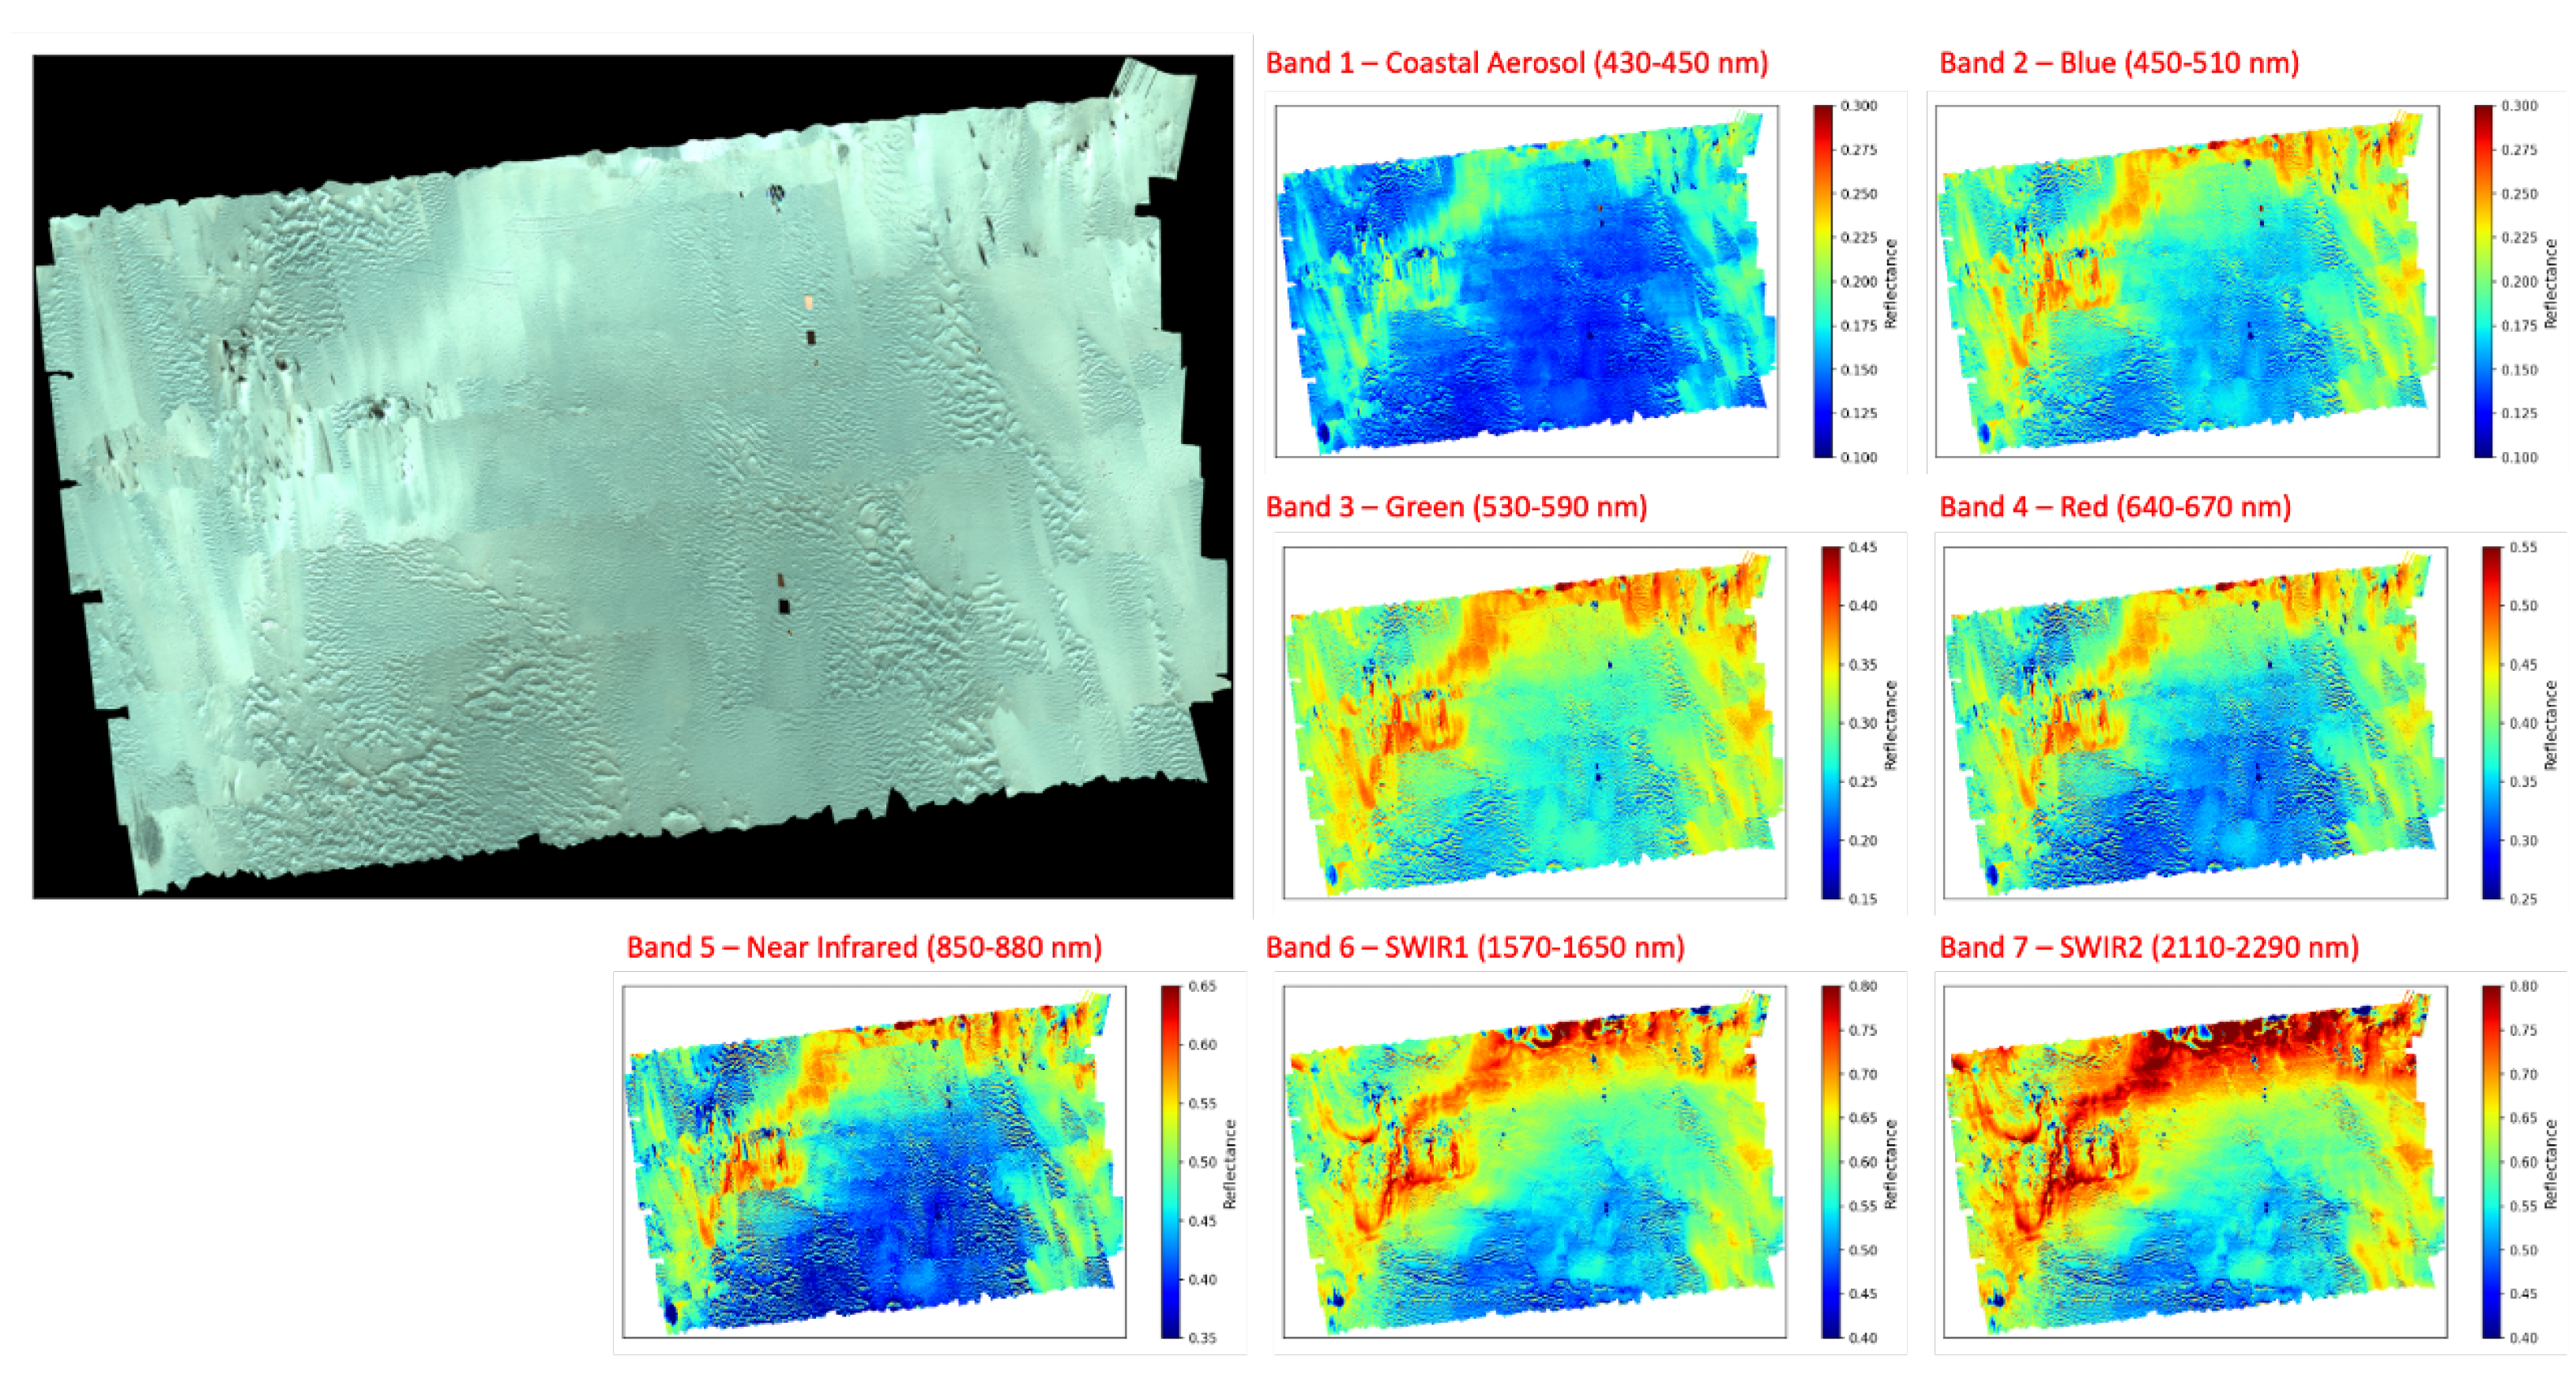
Hyperspectral imagery data were collected over the dunes from the VNIR (400–1000 nm) and SWIR (900–2500 nm) sensors onboard the UAS platforms. The images from both airborne sensors are converted to surface reflectance (SR) using calibration panels placed within the scene (see Figure 7). The imagery from both sensors are then mosaicked and georeferenced to the same spatial location and resolution. Finally, they are spectrally sampled to the Landsat-OLI bands and the resulting band-effective SR products compared to the L8/L9 SR products. The band-effective and mosaicked image data of the dunes derived from the VNIR/SWIR UAS sensors are shown in Figure 14.
The surface reflectance values derived from L8, L9, and the UAS image data acquired over the dune experiment site are shown in Figure 15. The L8/L9 SR values are in good agreement and deviate from the UAS measurements by only 2% in the VNIR and 5–8% in the SWIR regime. The likely source of difference in SR, especially in the SWIR regime, is non-uniformity of the calibration panels (Permaflect®) used for ELM. Referring again to the panels reflectance spectra in Figure 7, the uniformity of the 50% Permaflect® panel drops significantly for the SWIR wavelengths. Inherent system noise of the VNIR/SWIR pushbroom sensor used in the experiment is also likely contributing to the errors shown in Figure 15. Nevertheless, the results in Figure 15 show that L8 and L9 are in good agreement and trend nicely with reference.

3.2. TIRS-2 Performance since Launch

RIT continues to monitor the behavior of TIRS-2 onboard Landsat-9. More than a year since launch, the thermal instrument continues to behave nominally (using the lab-based calibration conducted at NASA-Goddard [8]). One such indication of its high performance can be observed when comparing L9’s ST products to reference.
The National Oceanic and Atmospheric Administration (NOAA) buoy network were used to provide reference data over several near-shore and inland water sites across CONUS [14]. Water remains a desirable target to monitor long term performance of TIRS-2, due to its emissivity being spectrally stable and well-defined [10,11]. These instrumented buoys, maintained by NOAA, are operated worldwide, and among other variables, provides water bulk temperature measurements. The temperature measurements from the buoys are adjusted to water surface temperature or “skin temperature” based on the methodology developed by Padula (2008) [15]. Measurements from 26 buoys in the near-shore coastline of CONUS were used as reference in this work, with the data being collected between 13 November 2021 and 23 September 2022.
Figure 16 shows the measured temperature from the NOAA buoys vs. SW-derived ST over the current mission life of Landsat-9, while Table 4 reports the mean difference, standard deviation and RMSE for L9 compared to the ground-based measurement. In general, the comparisons show that the satellite-derived temperature products are within approximately 1 K of in situ water measurements, which is consistent with previous validation efforts for L8 [11].

4. Conclusions and Summary

An underflight experiment was conducted to support cross-comparison studies for L8/L9. Considering RIT’s contributions to Landsat thermal calibration and validation, the primary focus of the campaign discussed here was to assess the initial performance of TIRS-2. Due to its drone program, RIT was also able to make initial comparisons of L9 (and L8) to ground measurements in the VNIR/SWIR.
All initial findings from this experiment indicated that TIRS-2 (and OLI-2) were performing nominally early-on in the mission. Comparisons of TIRS-2 split window-derived surface temperature products to buoy reference indicate that it continues to perform nominally more than a year after launch. Longitudinal studies by other authors indicate a similar performance for OLI-2 [16]. In general, the extensive lab-based calibrations conducted by NASA-Goddard for TIRS-2 (and by Ball Aerospace for OLI-2) were effective in providing initial characterizations of these two well-behaved instruments.

Author Contributions

Conceptualization, R.E. and A.G.; methodology, R.E. and A.G.; lab data collection, R.E., L.F. and E.P.; field data collection, R.E., A.G., L.F., E.P., T.K., N.R. and T.B.; validation, R.E., A.G., L.F., E.P., T.K., N.R. and T.B.; formal analysis, R.E.; writing—original draft preparation, R.E.; writing—review and editing, R.E. and A.G.; funding acquisition, A.G. All authors have read and agreed to the published version of the manuscript.

Funding

This material is based upon work supported by the U.S. Geological Survey under Cooperative Agreement Number G19AC00176. The views and conclusions contained in this document are those of the authors and should not be interpreted as representing the opinions or policies of the U.S. Geological Survey. Mention of trade names or commercial products does not constitute their endorsement by the U.S. Geological Survey. This manuscript is submitted for publication with the understanding that the United States Government is authorized to reproduce and distribute reprints for Governmental purposes.

Data Availability Statement

Data available on request.

Conflicts of Interest

The authors declare no conflict of interest.

References

  1. Kaita, E.; Markham, B.; Haque, M.O.; Dichmann, D.; Gerace, A.; Leigh, L.; Good, S.; Schmidt, M.; Crawford, C.J. Landsat 9 Cross Calibration Under-Fly of Landsat 8: Planning, and Execution. Remote Sens. 2022, 14, 5414. [Google Scholar] [CrossRef]
  2. Gerace, A.; Eon, R.; Kleynhans, T.; Raqueño, N.; Webber, C.M.; Ely, P.; Ventresco, S. In-flight performance of the Multi-band Uncooled Radiometer Instrument (MURI) thermal sensor. Remote Sens. Environ. 2022, 279, 113086. [Google Scholar] [CrossRef]
  3. Eon, R.S.; Bachmann, C.M. Mapping barrier island soil moisture using a radiative transfer model of hyperspectral imagery from an unmanned aerial system. Sci. Rep. 2021, 11, 3270. [Google Scholar] [CrossRef] [PubMed]
  4. Kaputa, D.S.; Bauch, T.; Roberts, C.; McKeown, D.; Foote, M.; Salvaggio, C. Mx-1: A new multi-modal remote sensing UAS payload with high accuracy GPS and IMU. In Proceedings of the 2019 IEEE Systems and Technologies for Remote Sensing Applications Through Unmanned Aerial Systems (STRATUS), Rochester, NY, USA, 25–27 February 2019; IEEE: Piscataway, NJ, USA, 2019; pp. 1–4. [Google Scholar]
  5. Helder, D.; Thome, K.J.; Mishra, N.; Chander, G.; Xiong, X.; Angal, A.; Choi, T. Absolute radiometric calibration of Landsat using a pseudo invariant calibration site. IEEE Trans. Geosci. Remote Sens. 2013, 51, 1360–1369. [Google Scholar] [CrossRef]
  6. Eon, R.S.; Bachmann, C.M.; Gerace, A.D. Retrieval of sediment fill factor by inversion of a modified Hapke model applied to sampled HCRF from airborne and satellite imagery. Remote Sens. 2018, 10, 1758. [Google Scholar] [CrossRef] [Green Version]
  7. HOBO MX2204 Data Logger. 2021. Available online: https://www.onsetcomp.com/datasheet/MX2204 (accessed on 1 April 2022).
  8. Pearlman, A.; Efremova, B.; Montanaro, M.; Lunsford, A.; Reuter, D.; McCorkel, J. Landsat 9 Thermal Infrared Sensor 2 On-Orbit Calibration and Initial Performance. IEEE Trans. Geosci. Remote Sens. 2022, 60, 1–8. [Google Scholar] [CrossRef]
  9. Gillespie, A.; Rokugawa, S.; Matsunaga, T.; Cothern, J.S.; Hook, S.; Kahle, A.B. A temperature and emissivity separation algorithm for Advanced Spaceborne Thermal Emission and Reflection Radiometer (ASTER) images. IEEE Trans. Geosci. Remote Sens. 1998, 36, 1113–1126. [Google Scholar] [CrossRef]
  10. Masuda, K.; Takashima, T.; Takayama, Y. Emissivity of pure and sea waters for the model sea surface in the infrared window regions. Remote Sens. Environ. 1988, 24, 313–329. [Google Scholar] [CrossRef]
  11. Gerace, A.; Kleynhans, T.; Eon, R.; Montanaro, M. Towards an operational, split window-derived surface temperature product for the thermal infrared sensors onboard Landsat 8 and 9. Remote Sens. 2020, 12, 224. [Google Scholar] [CrossRef] [Green Version]
  12. Smith, G.M.; Milton, E.J. The use of the empirical line method to calibrate remotely sensed data to reflectance. Int. J. Remote Sens. 1999, 20, 2653–2662. [Google Scholar] [CrossRef]
  13. Eon, R.S. The Characterization of Earth Sediments Using Radiative Transfer Models from Directional Hyperspectral Reflectance; Rochester Institute of Technology: Rochester, NY, USA, 2019. [Google Scholar]
  14. National Data Buoy Center. Available online: https://www.ndbc.noaa.gov/ (accessed on 22 October 2019).
  15. Padula, F.P. Historic Thermal Calibration of Landsat 5 TM through an Improved Physics Based Approach; Rochester Institute of Technology: Rochester, NY, USA, 2008. [Google Scholar]
  16. Gross, G.; Helder, D.; Begeman, C.; Leigh, L.; Kaewmanee, M.; Shah, R. Initial Cross-Calibration of Landsat 8 and Landsat 9 Using the Simultaneous Underfly Event. Remote Sens. 2022, 14, 2418. [Google Scholar] [CrossRef]
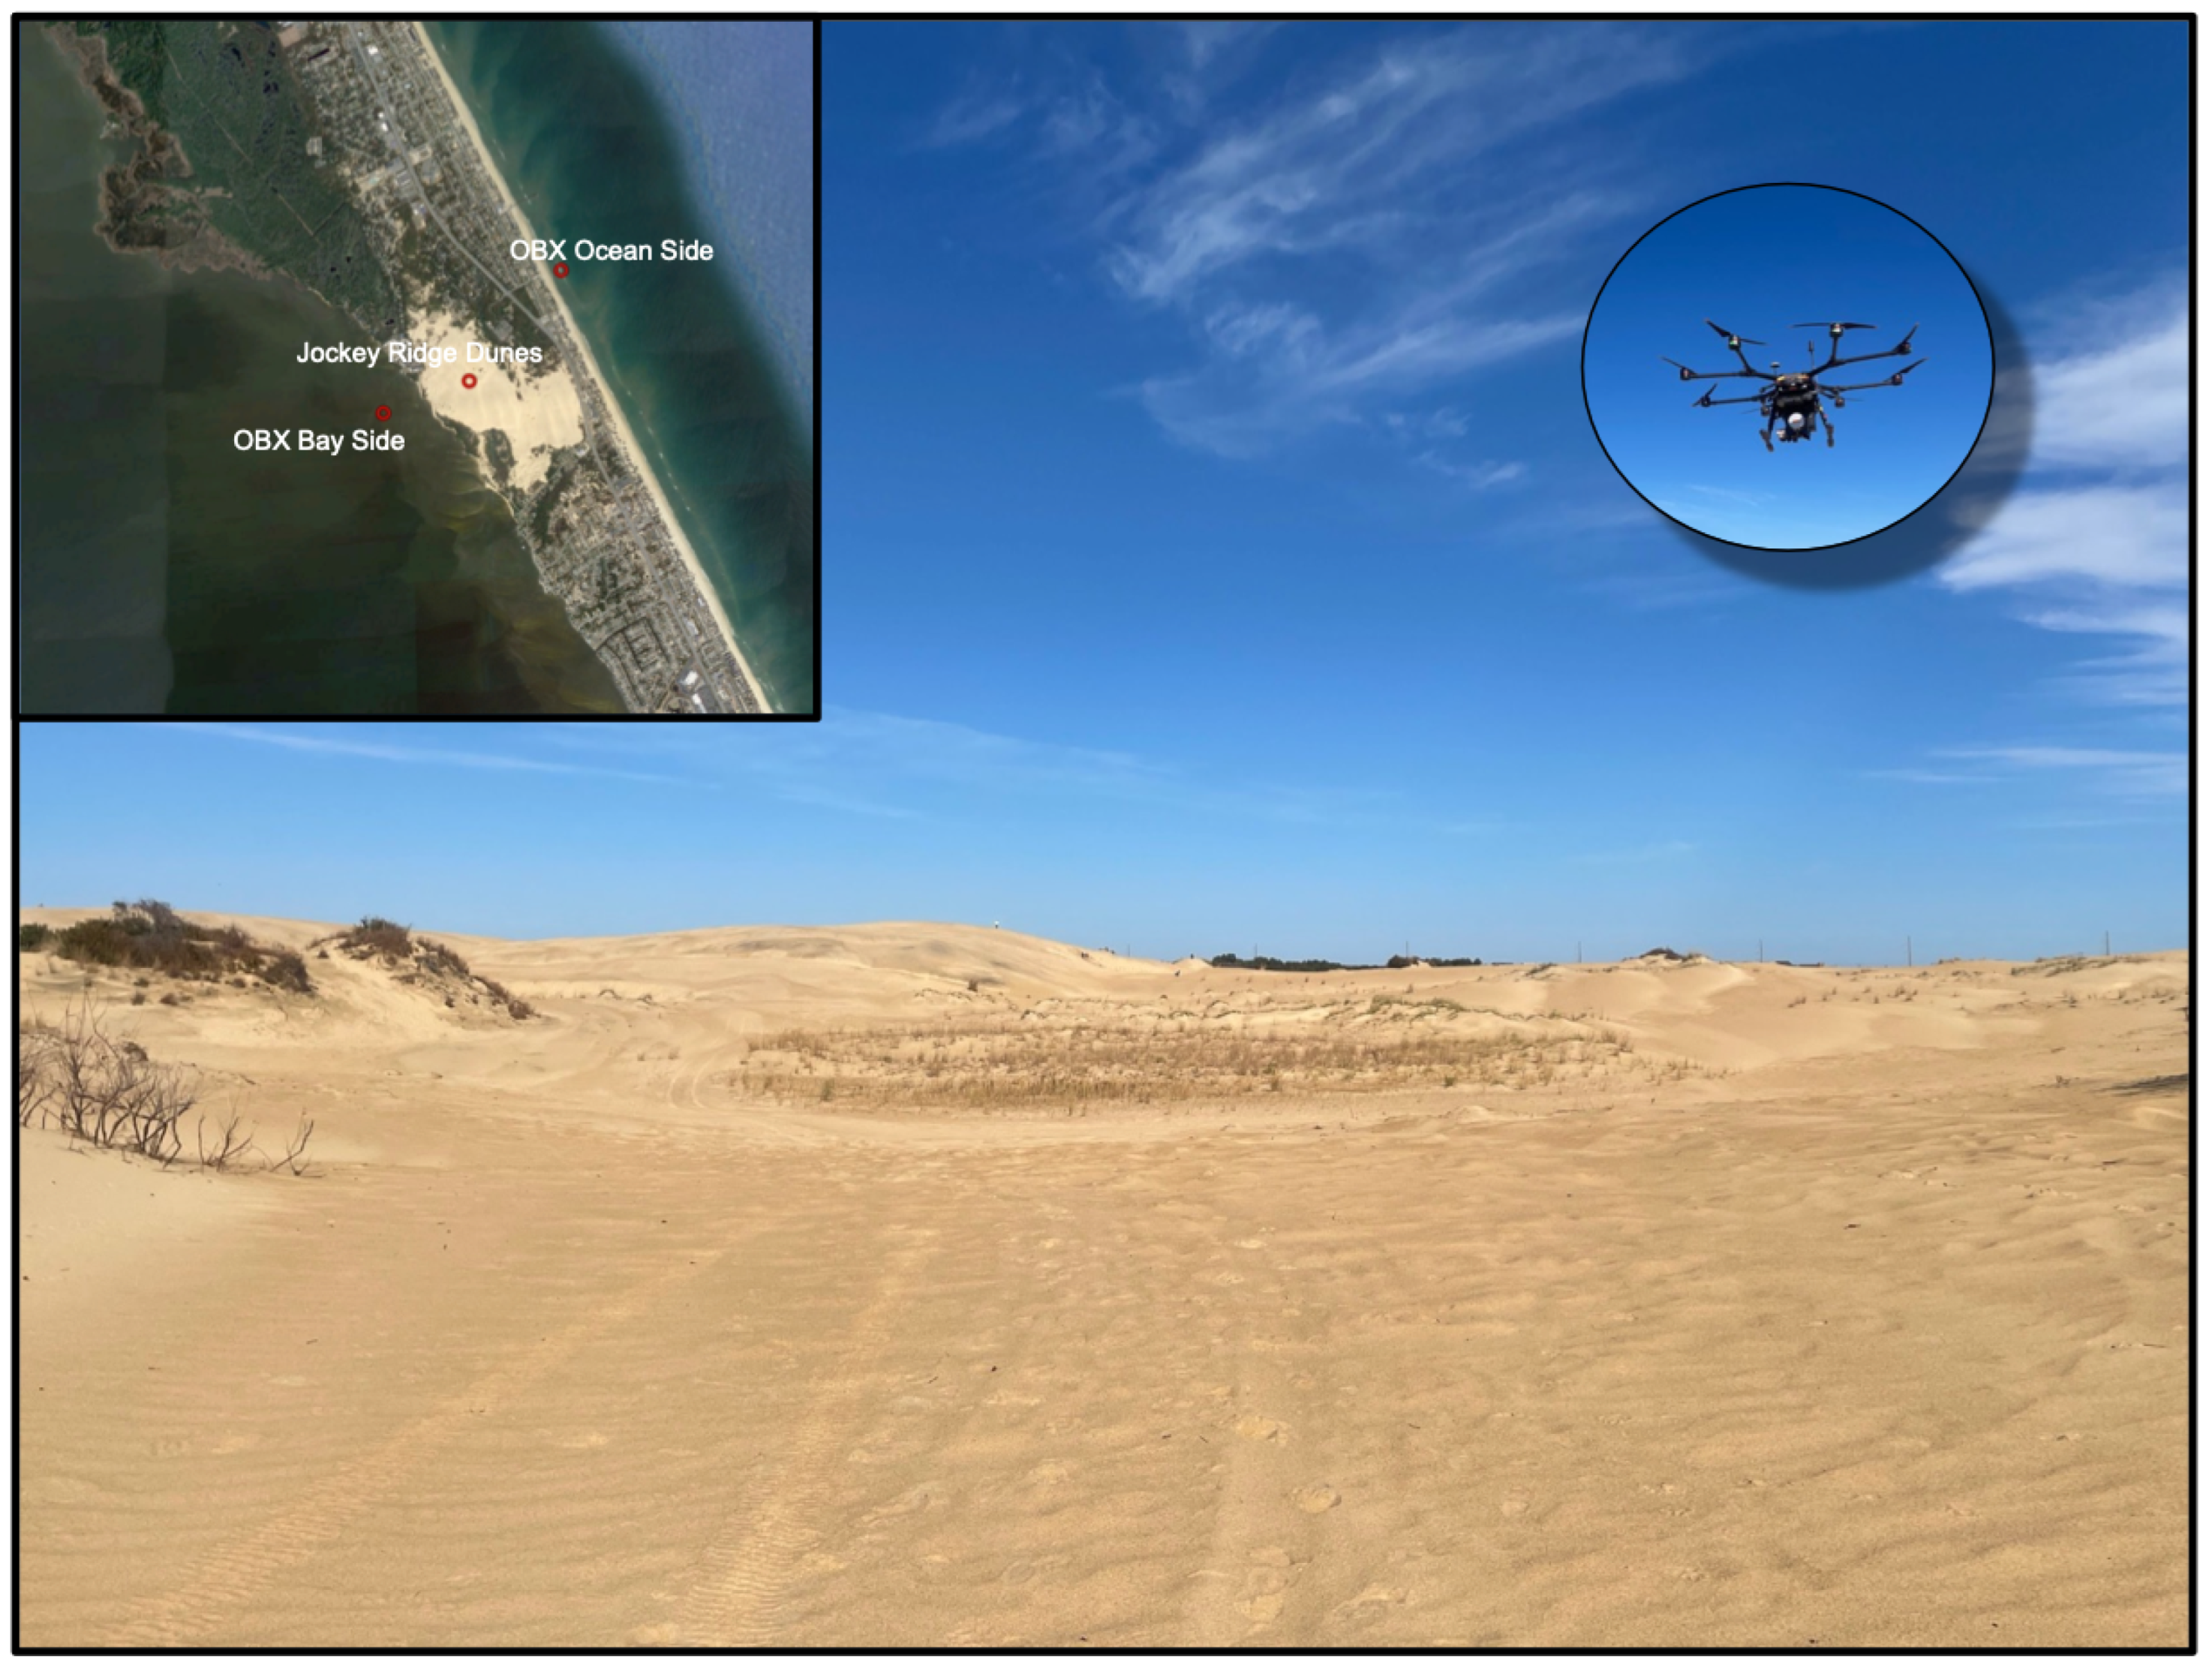
Figure 1. The Jockey’s Ridge Sand Dune System. This site was chosen to support thermal calibration and validation due to its 1.73 km 2 area and material endpoints, i.e., water and sand. RIT’s MX-2 UAS-platform is equipped with full-spectrum sensors including a cooled thermal.
Remotesensing 15 03370 g001
Figure 2. The four different experiment regions during the underflight; Western New York, Phoenix Arizona, the Atlantic Coast, including the primary ground campaign site in the Outer Banks, North Carolina.
Remotesensing 15 03370 g002
Figure 3. (a) Image of the μ FTIR, (b) the measured downwell and sample radiance from the μ FTIR, and (c) the derived emissivity spectra using the temperature/emissivity separation algorithm. The placement of the two TIRS thermal bands is highlighted.
Remotesensing 15 03370 g003
Figure 4. (a) The measured NE Δ T and (b) absolute radiometric uncertainty of the μ FTIR between 8 and 14 μ m at three different temperatures (288 K, 303 K, and 318 K). These data illustrate the high fidelity of the μ FTIR in measuring radiance.
Remotesensing 15 03370 g004
Figure 5. The bulk temperature of Canyon Lake, Arizona measured by the TidBit datalogger.
Remotesensing 15 03370 g005
Figure 6. BRDF measurements of the (a) 5% and (b) 50% Permaflect® panels using GRIT-T for Landsat band 4 (640–670 nm).
Remotesensing 15 03370 g006
Figure 7. The Permaflect® panels used during the underfly campaign to calibrate the UAS data to surface reflectance, and the spectra of the panels measured by the SVC spectroradiometer.
Remotesensing 15 03370 g007
Figure 8. The MX-2 multi-modal UAS payload consisting of five different imaging sensors on-board a DJI Wind 8 Octocopter, while the SWIR HSI in on-board a DJI Matrice 600.
Remotesensing 15 03370 g008
Figure 9. The NE Δ T of the FLIR at three different temperatures.
Remotesensing 15 03370 g009
Figure 10. The absolute radiometric uncertainty of the FLIR at three different temperatures.
Remotesensing 15 03370 g010
Figure 11. The surface temperature map of the four different lakes derived from Landsat-9 using SW. TidBit dataloggers were deployed in each lake to monitor surface temperature for validating the ST product from L8/L9.
Remotesensing 15 03370 g011
Figure 12. The derived SW surface temperature for (a) Landsat-9 and (b) Landsat-8 versus the measured surface temperature using the TidBit dataloggers for water sites during the underfly event.
Remotesensing 15 03370 g012
Figure 13. (a) The derived SW surface temperature for Landsat-9 over the primary experiment site during the underfly event. (b) The measured emissivity spectra from the μ FTIR of the dunes, and (c) the mosaic ST map of the dune from the FLIR and the corresponding RGB map of the dunes captured by the same UAS payload.
Remotesensing 15 03370 g013
Figure 14. The spectrally sampled image, to the Landsat VNIR/SWIR bands, of the Jockey’s Ridge experiment site collected from the VNIR/SWIR sensors on-board the UAS platform.
Remotesensing 15 03370 g014
Figure 15. The measured mean surface reflectance from L8, L9, and the UAS imagery acquired over the dune experiment site.
Remotesensing 15 03370 g015
Figure 16. The derived SW surface temperature for Landsat-9 versus the measured surface temperature using 26 NOAA buoys across the near-shore coastline of CONUS over the current mission life of Landsat-9.
Remotesensing 15 03370 g016
Table 1. The NE Δ T, drift and absolute uncertainty for the TidBit dataloggers at three different temperatures.
Temperature (K)NE Δ T (K)Drift (%)Absolute Uncertainty (%)
2880.0110.0700.032
3030.0170.0580.437
3180.0320.4371.019
Table 2. The mean difference, standard deviation and rmse for both L8 and L9 ST (derived using SW) compared to the ground-based measurement over the various lakes across CONUS.
Error MetricL8 SW (K)L9 SW (K)
Mean Diff. (K)0.510.30
Std. Dev. (K)0.700.67
RMSE (K)0.870.74
Table 3. The ST measurements from the ground instrumentation, UAS-based sensor and L8/L9 at Jockey’s Ridge during the underfly event.
SiteUAS FLIR (K) μ FTIR (K)TidBit (K)L8 SW (K)L9 SW (K)
OBX Dunes289.9290.3-291.8291.9
OBX Bay-side Water287.5-286.7287.5287.8
OBX Ocean-side Water--288.2288.4288.7
Table 4. The mean difference, standard deviation and rmse for L9 ST (derived using SW) compared to the ground-based measurement from NOAA buoys since launch.
Mean Diff. (K)Std. Dev. (K)RMSE (K)
0.381.081.13
Disclaimer/Publisher’s Note: The statements, opinions and data contained in all publications are solely those of the individual author(s) and contributor(s) and not of MDPI and/or the editor(s). MDPI and/or the editor(s) disclaim responsibility for any injury to people or property resulting from any ideas, methods, instructions or products referred to in the content.