Article

Exploring the Best-Matching Precipitation Traits in Four Long-Term Mainstream Products over China from 1981 to 2020

1
Shaanxi Key Laboratory of Land Reclamation Engineering, Key Laboratory of Degraded and Unused Land Consolidation Engineering, The Ministry of Land and Resources, School of Land Engineering, Chang’an University, Xi’an 710054, China
2
Key Laboratory of Ecological Safety and Sustainable Development in Arid Lands, Key Laboratory of Ecohydrology of Inland River Basin, Qilian Mountains Eco-Environment Research Center in Gansu Province, Northwest Institute of Eco-Environment and Resources, Chinese Academy of Sciences, Lanzhou 730000, China
*
Author to whom correspondence should be addressed.
These authors contributed equally to this work.
Remote Sens. 2023, 15(13), 3355; https://doi.org/10.3390/rs15133355
Submission received: 6 April 2023 / Revised: 18 May 2023 / Accepted: 27 June 2023 / Published: 30 June 2023

Abstract

:
As a major component of water cycle, the accuracy quantification of different precipitation products is critical for evaluating climate change and ecosystem functions. However, a lack of evidence is available to choose a precise precipitation product in relative applications. Here, to solve this limit, we analyze the spatiotemporal pattern and accuracy of four precipitation products, including CHIRPS V2.0, PERSIANN-CDR, ECMWF ERA5-Land, and GLDAS_NOAH025_3H, over China during the period of 1981–2020, based on the five precipitation traits (i.e., spatial pattern of multi-year average, annual trend, seasonality, frequency, and intensity), and meteorological gauge observations are taken as the benchmark. Our results show that, compared to other products, CHIRPS data has the strongest ability to present spatial pattern of multi-year average precipitation, especially in most parts of northeastern and southern China, and ERA5 has the weakest ability to simulate the multi-year average precipitation. All four precipitation products can accurately depict the spatial pattern of seasonality, among which CHIRPS and ERA5 have the highest and lowest fitting ability, respectively, but four products poorly describe the spatial pattern of precipitation intensity and frequency at a daily scale. These products only correctly predict the interannual precipitation trend in some local areas. Our findings provide evidences to select high-quality precipitation data, and could help to improve the accuracy of relative geophysical models.

1. Introduction

Hydrological cycle processes are enhanced due to anthropogenic-induced global warming, which significantly changes spatial and temporal precipitation [1,2,3]. These variations in precipitation have a profound impact on natural ecosystems and human society, such as influencing vegetation growth [4,5,6], changing various types of terrestrial ecosystems [7,8,9,10], and impeding social progress [11]. Therefore, understanding precipitation change is of great significance to further understand climate change and could help policy makers to formulate effective policies and regulations.
Precipitation variations are multifaceted and can be unfolded from many perspectives, such as the multi-year average spatial pattern, interannual trend, seasonality, frequency, and intensity. The interannual variation of precipitation can be represented by the annual trend and anomaly values [12]. Intra-annual precipitation variation can be composed of precipitation seasonality, intensity and frequency [13,14,15]. The precipitation seasonality is important to agricultural production, vegetation growth, ecological and socio-economic development [16,17,18]. The frequency and intensity of heavy precipitation events are increasing globally and regionally with global warming [19,20,21]. The amount of daily precipitation could considerably alter evapotranspiration and runoff related to river discharges and ecosystems. [22]. Driven by nature and human beings [23], precipitation will have a profound impact on ecosystem services and socio-economic development [24,25,26].
Precipitation datasets are generally derived from gauge-based observations, remote sensing retrieval, model reanalysis, and above combinations [27]. Different precipitation datasets have different spatiotemporal resolutions and coverages. Data sources, methods and model selection are different in the production processes of precipitation products, which causes large differences in the quality of datasets and influences the correctness of research results. Accurate precipitation information is essential for hydrological modelling, climate change modelling, agricultural management and disaster monitoring, especially in areas with few meteorological stations [28,29,30]. Therefore, it is essential to study the accuracy of different precipitation datasets. Based on the existing technology, the accuracy of precipitation products can be evaluated from different perspectives by various indicators [31], such as the Bias (Bias), the correlation coefficient (r), the relative bias (RB), and the root mean square error (RMSE). The r describes the correlation of precipitation products with meteorological stations. Bias, RB and RMSE can account for differences between two datasets. The above statistical methods have been used to evaluate the accuracy of precipitation products over the world and different regions; however, it can be seen that the matching capabilities of products vary greatly [32]. According to previous studies in parts of China [33], products usually show different simulation capabilities for different precipitation traits in different regions, seasons, altitudes, etc. There is a lack of research on the ability of precipitation products to simulate the above traits in the whole of China at present. In this study, four long-term and high-resolution precipitation products are selected to explore the differences of precipitation traits among these products and meteorological station observations over China at the multi-year, annual, monthly and daily scales. The goal of this study is to identify the bast-matching ability of these precipitation products to depict the actual precipitation traits, so that researchers can choose the best precipitation data for different regions and contents.

2. Materials and Methods

2.1. Study Area

China covers a land area of about 9.6 million km2. The complex and diverse landforms in China can influence the atmospheric cycle, producing a variety of climate types (especially the large variation of precipitation), and forming different types of zonal vegetation. In order to better understanding precipitation traits in various areas, eight regions across the China were divided based on the precipitation gradient, comprehensive temperature zone and vegetation type (Figure 1) [34]. These regions are as follows: Northeastern China 1 (short as NE1) with an average annual precipitation of 600–800 mm and severely cold temperate climate, where vegetation is mainly coniferous forest; Northeastern China 2 (NE2) has the similar magnitude of precipitation to NE1, located in the temperate zone, and characterized by temperate coniferous and deciduous broadleaved mixed forest; Northern China 1 (NC1) with a precipitation of 200–600 mm, situated in temperate zones, and mainly covered by a temperate steppe; Northern China 2 (NC2) with a precipitation of 600–800 mm like NE1, belonging to the warm temperate zone, and owning warm temperate deciduous broadleaf forests; Southern China 1 (SC1) with a precipitation of 800–1600 mm, attached to the subtropical climate zone, and represented by an evergreen broadleaf forest; Southern China 2 (SC2), which has a precipitation of more than 1600 mm located in the tropics, and is covered by rainforest or monsoon rainforest; Northwestern China (NW) receives a precipitation less than 200 mm, has a temperate climate, and widely distributed temperate desert; and Qinghai–Tibet Plateau (QT), mainly in the plateau mountain climate zone and preserving diversiform alpine vegetation. NE1, NE2 and NC2 are approximately distinguished by a 600 mm equivalent precipitation line, and the isohyet precipitation line of 800 mm is the boundary among SC1, NC2 and QT. The positions of above-mentioned isohyets of 200, 600, 800, and 1600 mm are approximate positions, due to consideration of the physical geographic boundaries.

2.2. Datasets and Preprocessing

Daily precipitation data during the period of 1981–2020 at 840 meteorological stations (referred to as SID) were used as the actual precipitation, which was derived from the Daily Value Dataset of China surface Climate Data provided by the China Meteorological Data Center (http://data.cma.cn, accessed on 18 May 2021). In order to ensure the quality stability of precipitation data, outliers were eliminated by using the 3σ principle [35]. The 3σ principle is also known as the standard deviation method. Outliers are defined as values that deviate more than three times of the standard deviation of the mean when data follow a normal distribution. The probability of the mean value falling outside the range from μ − 3σ to μ + 3σ is less than 0.3% in normal distribution, where σ represents the standard deviation and μ is the mean value. The abnormal precipitation in meteorological stations is removed via this way. Considering the spatiotemporal error caused by the missing data, 12 meteorological stations with the annual time series missing time greater than 10% [36] were excluded, and finally the remaining 828 stations were used for study. The spatial range of these meteorological stations covers mainland China. Meteorological station data was lacking for Taiwan Province.
Four popular gridded precipitation products were used and their details briefly introduced as follows: Climate Hazards Infrared Precipitation with Stations Data (hereinafter referred to as CHIRPS) version 2.0 (https://www.chc.ucsb.edu/data/chirps, accessed on 9 August 2022) is a global land precipitation dataset that combines satellite imagery with in situ site data and estimates precipitation based on global infrared CCD, calibrated by TMPA 3B42 v7, and interpolated using a modified inverse distance-weighting algorithm [37]; Precipitation Estimation from Remotely Sensed Information using Artificial Neural Networks-Climate Data Record (PERSIANN-CDR) uses the PERSIANN algorithm to estimate precipitation on GridSat-B1 infrared satellite brightness temperature data and the artificial neural network is trained on the fourth stage hourly precipitation data of NCEP [38] (https://www.ncei.noaa.gov/products/climate-data-records/precipitation-persiann/, accessed on 10 August 2022); European Centre for Medium-Range Weather Forecasts ReAnalysis 5 (ERA5) is generated using IFS cycle 41r2 and 4D-Var data assimilation [39] and uses more historical observations, especially satellite data, to estimate more accurate atmospheric conditions in advanced data assimilation and modeling systems [40]. ERA5-Land hourly data used in this study was produced by replaying the land component of the ECMWF ERA5 climate reanalysis (https://www.ecmwf.int/en/forecasts/dataset/ecmwf-reanalysis-v5/, accessed on 12 August 2022); Global Terrestrial Data Assimilation System (GLDAS) is a global, high-resolution, off-line ground modeling system that combines satellite and ground observations to produce optimal ground states and flux fields in near real time [41]. GLDAS_NOAH025_3H 2.0 and GLDAS_NOAH025_3H 2.1 are used and can be downloaded in https://ldas.gsfc.nasa.gov/gldas/, accessed on 12 August 2022.
Time ranges and spatiotemporal resolutions of four products (CHIRPS, PERSIANN-CDR, ERA5, and GLDAS) are summarized in Table 1. We unify the temporal resolution of four precipitation products to a daily scale from 1981 to 2020. In order to maintain the value authenticity and the spatial resolution consistency among these precipitation products, the tool of “extraction by mask” in the Spatial Analyst toolbox of ArcGIS 10.8 is used to downscale the low-resolution products to 0.05° × 0.05°. PERSIANN-CDR has been available since 1983 with two years of precipitation missing. To maintain time series consistency, we compare the accuracy of precipitation traits among four products from 1983 and use the unbiased estimator formula for calculating the multi-year average. The spatial range of CHIRPS is 50°S–50°N, which cannot completely cover the region NE1 of China. In order to deal with the missing data in northeastern China, precipitation values of other products in this area are removed when compared with the performances of precipitation traits. The time series of GLDAS data is combined between GLDAS_NOAH025_3H 2.0 and 2.1, and its consistency is checked by the RHtest homogenization system (“hydroTSM” package in R 4.1.3). The combined GLDAS data passes the homogeneity test. The preprocessing of all precipitation products is conducted based on the Google Earth Engine platform. Furthermore, we synthesize diurnal resolution precipitation products into monthly and annual scales to extract four precipitation traits.
The elevation was measured by using digital elevation model (DEM) data obtained from the 1 km × 1 km spatial resolution digital elevation model dataset GTOPO30 DEM data of China provided by the United States Geological Survey Earth Resources Observation and Science Center (https://earthexplorer.usgs.gov/, accessed on 5 September 2022). Slope and Aspect were calculated based on DEM using the Spatial Analyst toolbox of ArcGIS 10.8. The Normalized Difference Vegetation Index (NDVI) was used to represent vegetation greenness, which is obtained from the National Environmental Information Centre’s Normalized Difference Vegetation Index CDR dataset (https://www.ncei.noaa.gov/products/climate-data-records/normalized-difference-vegetation-index/, accessed on 5 September 2022). This dataset is made using the Advanced Very High-Resolution Radiometer (AVHRR) and the Visible Infrared Imaging Radiometer Suite (VIIRS) sensors, carried by National Oceanic and Atmospheric Administration’s (NOAA) polar orbiting satellites, and provided a gridded daily NDVI with a spatial resolution of 0.05° × 0.05° from 1981 to the present. The annual maximum NDVI was calculated by the Maximum Value Composite, which was used as the annual value data of NDVI. Meteorological stations precipitation and NDVI datasets are processed with “data.table”, “dplyr”, “raster”, “stats”, “terra”, and “tidyverse” packages in R 4.1.3.

2.3. Statistical Analysis

Annual accumulated precipitation (AAP) is defined as the total amount of daily precipitation in a year, which is used to calculate the trend of precipitation on an annual scale. Multi-year average precipitation (MAP) is used to describe the spatial patterns of precipitation on a multi-year scale.
Seasonality index (SI) was proposed by Walsh and Lawler [42] in order to quantify the variation degree of monthly precipitation throughout the year. SI was calculated as follows:
S I = 1 A A P n = 1 12 P s n A A P 12
where A A P is the total amount of daily precipitation (mm y e a r 1 ) per year from 1981 to 2020, P s n is a month total precipitation (mm m o n t h 1 ), and n (n = 1, 2, …, 12) is a month sequence. SI is used to describe the temporal patterns of precipitation on a monthly scale. A mean SI for a certain month was calculated as follows:
S I ¯ = 1 M A P n = 1 12 P s n ¯ M A P 12
where M A P is the mean annual precipitation for a period (mm y e a r 1 ) and P s n ¯ is the mean precipitation of month n (mm m o n t h 1 ) [18]. S I ¯ stands for multi-year average SI (SIMA), which is used to describe the spatial patterns of precipitation on a monthly scale. The index of SI can vary from zero (if all months have equal precipitation amount) to 1.83 (if all annual accumulated precipitation occurs only in a single month). Precipitation has strong seasonality when SI is equal to 0.6. More degrees of seasonality could be found in Table 2.
Precipitation frequency and intensity are used to measure precipitation traits on a daily scale [43]. Daily precipitation frequency (fP) is defined as the number of precipitation days in a year and the daily precipitation of 0.1 mm or more is considered as a precipitation day. Daily precipitation intensity (IP) is defined as the precipitation per a rainy or snowy day. The multi-year average of daily precipitation frequency and multi-year average of daily precipitation intensity are short as fPMA, IPMA, respectively. fP and IP are used to explore trend of precipitation frequency and intensity, and fPMA and IPMA are used to characterize spatial patterns.
In order to compare with grid precipitation products, meteorological station precipitation was interpolated (referred to as IMS) by Regression Kriging with stepwise regression after calculating the above-mentioned trait indexes using all station precipitation data for different time scales, and the interpolated precipitation is consistent with the spatial resolution of the formed precipitation products (0.05° × 0.05°). The interpolation accuracy is above 0.95 (R > 0.95). Elevation, slope, aspect, and NDVI were selected as auxiliary variables in these interpolations [44]. Interpolation results are obtained by extrapolation of auxiliary variables; thus, Taiwan Province has precipitation after interpolation (with large errors).
The different spatial pattern of precipitation traits is analyzed through qualitative description, in order to grasp the overall variation trend in China. To analyze the interannual variation of precipitation traits, the trend was calculated by Theil-Sen’s Slope Estimator. It is a nonparametric statistical method commonly used to calculate the trend of long-term series data. Then, A modified Mann–Kendall trend significance test (MMK) was used to explore the statistical significance of trend in precipitation traits. The Mann–Kendall test is a nonparametric, monotone trend-test method [45], which is widely used in the fields of meteorology, hydrology and environment. The MMK test could more robustly estimate the significance of trend [46]. All trend and significance tests are based on the “trend” package in R 4.1.3.
The accuracy of precipitation products is evaluated on two scales: regional and point-to-pixel. The regional comparison mainly analyzes the accuracy of the multi-year average precipitation traits between products and interpolation data, and firstly calculates the average value in each region. Secondly, the bias (Bias) is selected to calculate the error of products and interpolated precipitation in different regions, which reflects the simulation ability of products on the precipitation traits of different regions. The calculation of precipitation traits in relevant regions does not involve Taiwan Province. When analyzing MAP and SIMA, all datasets are calculated at 0.05° spatial resolution. The calculation of frequency and intensity is highly dependent on the resolution of the datasets. For comparison, when analyzing fPMA and IPMA, the interpolated station precipitation with a spatial resolution of 0.05° was resampled to that of 0.1° and 0.25°, corresponding to the resolution of different products, respectively. The point-to-pixel comparison is to analyze the four precipitation traits of annual precipitation, SI, frequency and intensity between products and meteorological station data. At first, precipitation traits among four products corresponding to the location of the meteorological station are extracted by the tool of “Extract Multi Values To Points” in ArcGIS 10.8. Secondly, the correlation coefficient (r), the relative bias (RB) and the root mean square error (RMSE) are used to calculate the correlation and error between products and station data in different regions, which reflects the authenticity of products fitting the station’s precipitation. Pixel values of the station’s location are extracted directly.
Some information of the four statistical metrics is displayed in Table 3.

3. Results

3.1. Spatial Patterns of Multi-Year Average Precipitation

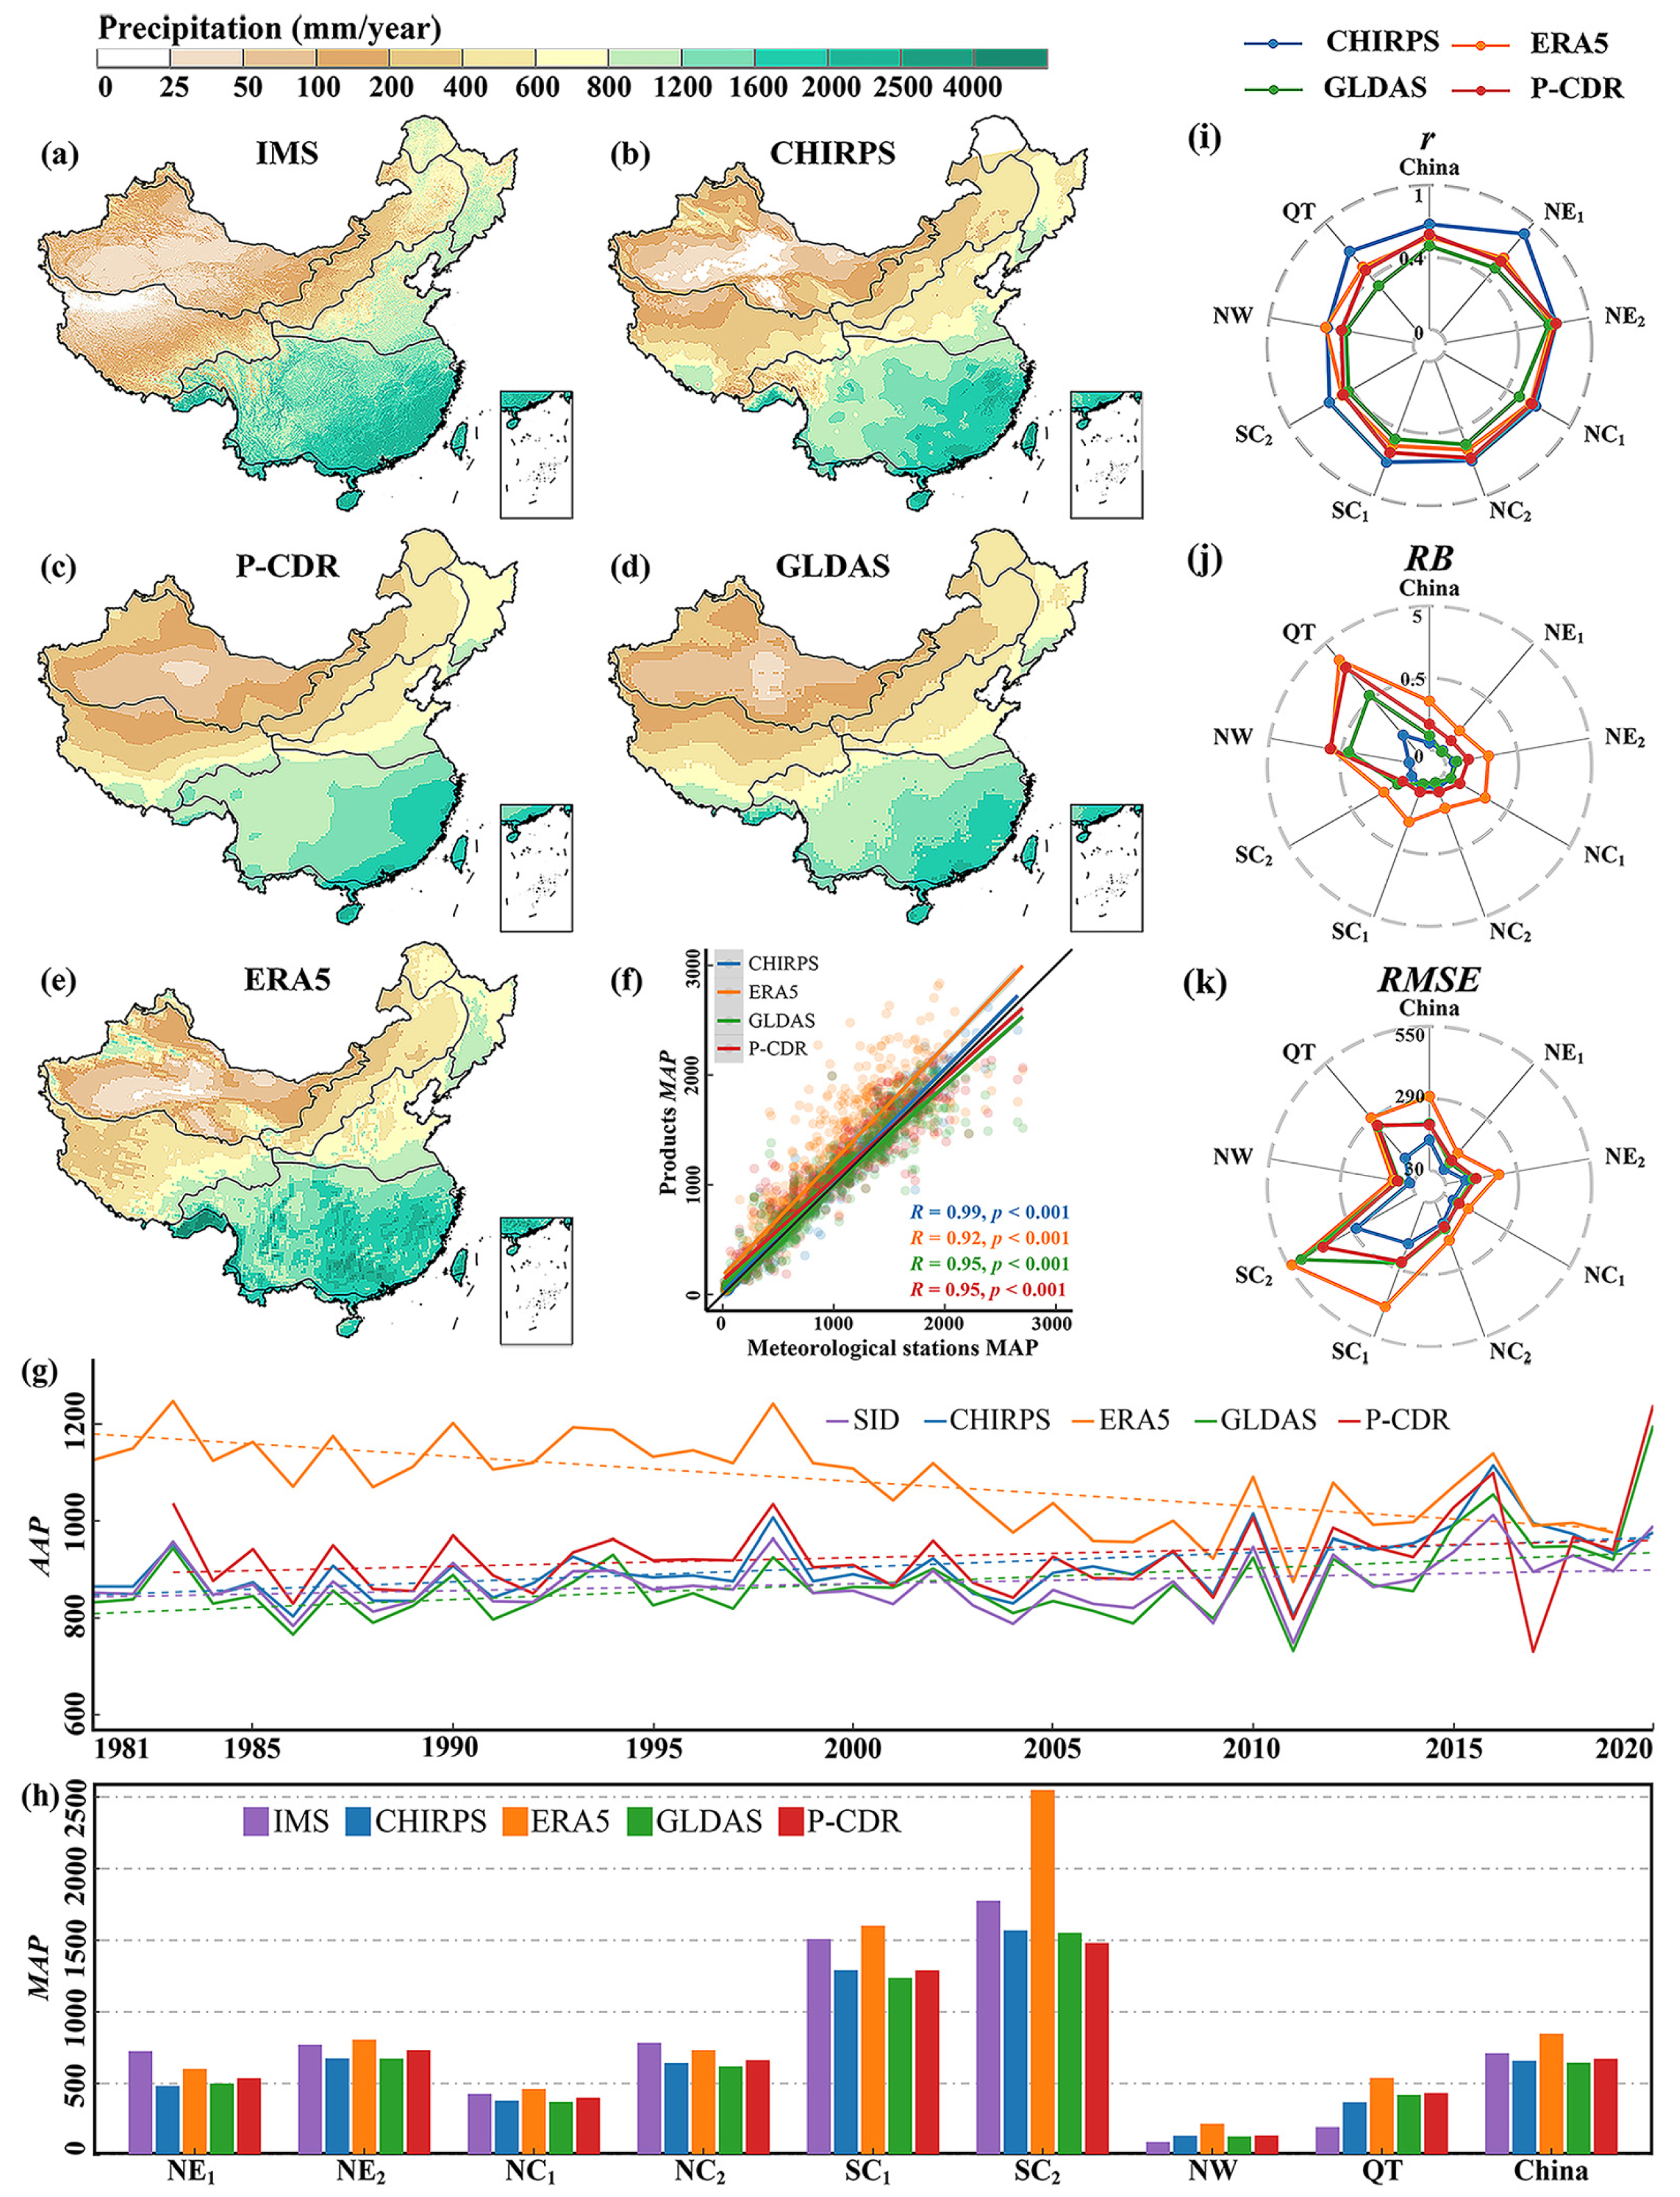
MAP during the period of 1981–2020 over China, among meteorological data and four precipitation products, have the similar spatial patterns, decreasing from the southeast to northwest of China (Figure 2a–e). The southeast SC1 and SC2 have a higher MAP (≥2000 mm) and NW have a lower MAP (≤100 mm). Using the meteorological station precipitation as a benchmark, four products usually slightly overestimate values of low precipitation at a meteorological station, and then enlarge the matching errors with directionless followed by the increasing precipitation (Figure 2f). CHIRPS has the strongest correlation with the observed precipitation of a meteorological station. Correlations of PERSIANN-CDR and GLDAS related to meteorological precipitation are worse than that of CHIRPS, especially in rainy regions with large annual cumulative precipitation, such as in southeastern China. ERA5 has the weakest correlation to station precipitation and large positive errors in rainy regions.
In the aspect of MAP in the whole of China and eight regions (Figure 2h), there are three precipitation products (CHIRPS, PERSIANN, and GLDAS) underestimating precipitation in most regions of China but except in NW and QT. PERSIANN-CDR has the smallest error (approximately −5%) in the whole of China (Table S1). All datasets are greatly overestimated in QT, with the lowest overestimation being 88% (CHIRPS) and the highest overestimation being 175% (ERA5). Matching performances of all datasets in NW is better than that in QT, with largely positive errors of more than 40%, especially 138% of ERA5. All four products in NE1 seriously underestimate the precipitation magnitude and the corresponding negative errors range from −17% to −33%. The remaining five regions (NE2, NC1, NC2, SC1, and SC2) have small errors on estimated precipitation, among which is the estimated precipitation of PERSIANN-CDR. ERA5 in NE2 and SC1 are the closest to the actual precipitation.

3.2. Trends of Annual Precipitation

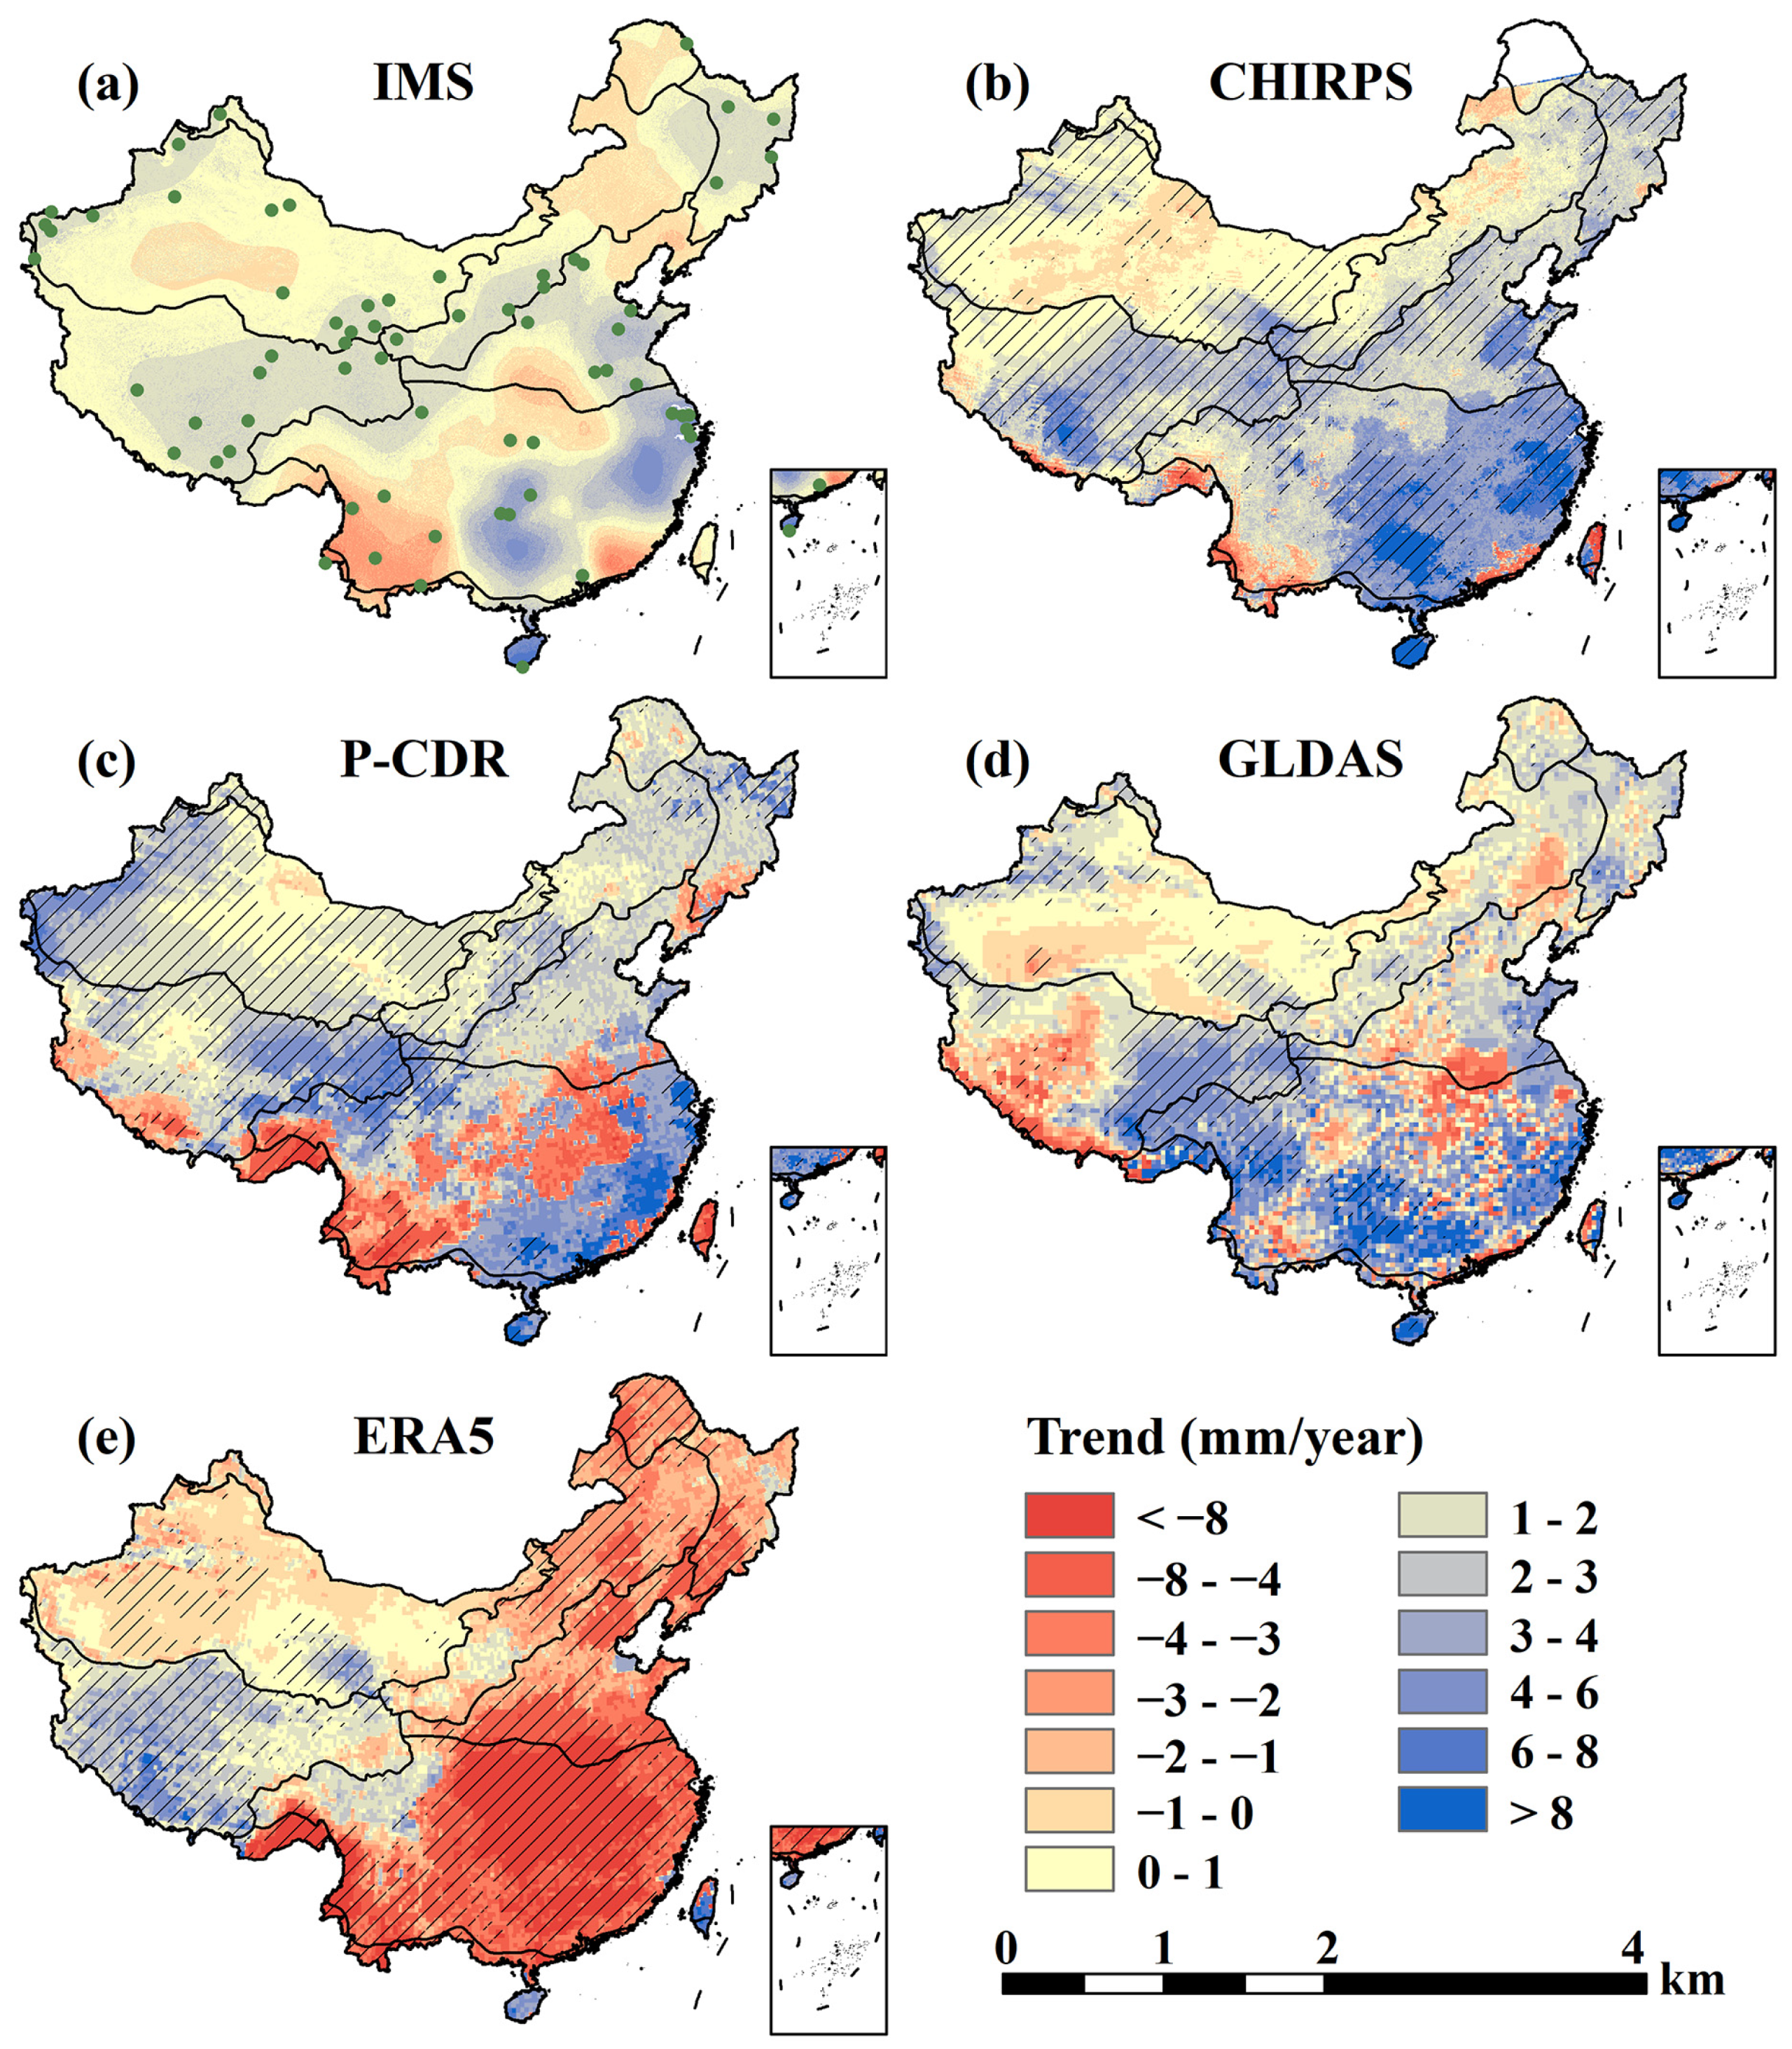
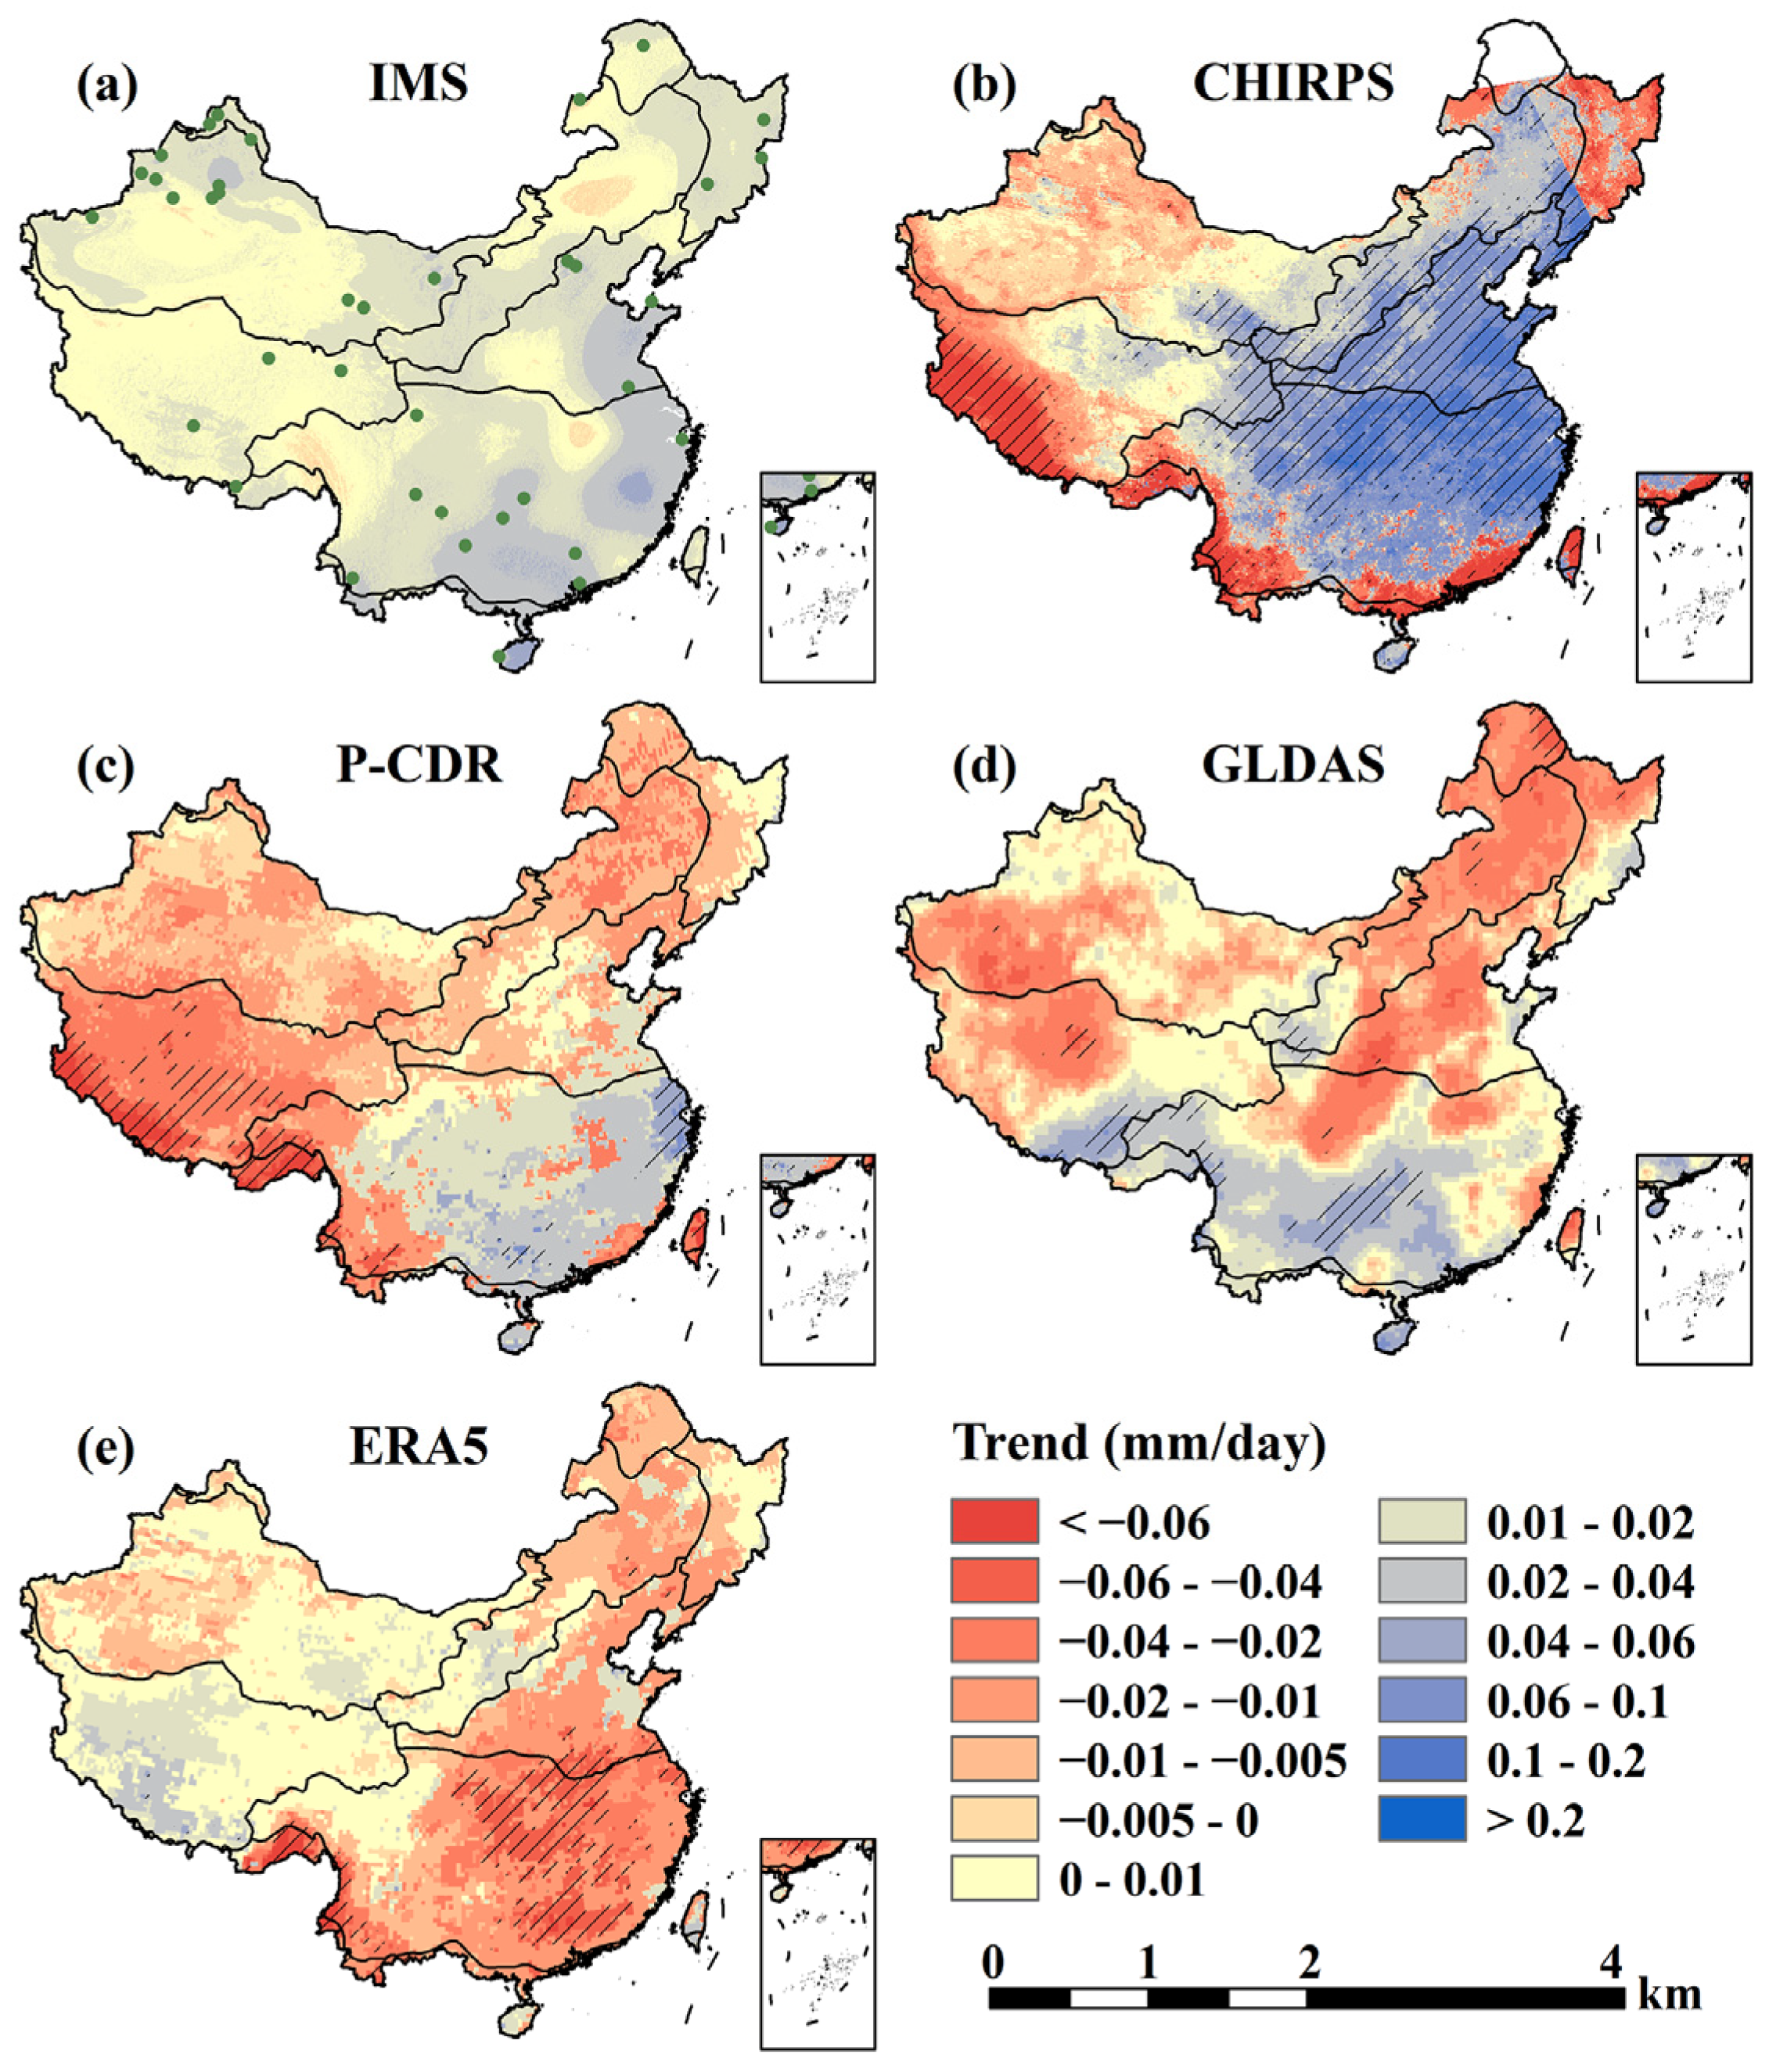
AAP in China from 1981 to 2020 shows a fluctuating upward trend of interannual variation among four products and meteorological station precipitation (Figure 2g). CHIRPS, PERSIANN-CDR and GLDAS can estimate AAP more accurately and have little difference with station precipitation. ERA5 significantly overestimates AAP, especially before 2010. Trends of AAP present inconsistent spatial distribution among four precipitation products and interpolated station precipitation (Figure 3). Basically, AAP reduces in NE1, northern NC1, and western SC1, especially, significantly decreasing (<−2 mm/year, p < 0.05) in southwestern SC1; and it notably increases in NE2, southern NC1, central NC2, eastern SC1, and QT (>1 mm/year, p < 0.05). In CHIRPS, AAP shows an increasing trend in western SC1, contrary to the interpolated station data. In PERSIANN-CDR, the trend of AAP in the southwestern and central areas of SC1 is consistent with the significantly decreasing trend of interpolated station data (p < 0.05), but more markedly decreases (<−3 mm/year). In GLDAS, there is an increasing AAP trend in most parts of China and a decreasing trend (p < 0.05) in western QT, which is inconsistent with the interpolated station data. An increasing AAP trend of ERA5 is consistent with that of the interpolated station data in QT and southeastern NW (p < 0.05), and a significant declining trend in eastern Chinese mainland (<−4 mm/year, p < 0.05).
In the aspect of AAP accuracy performances for four precipitation products at meteorological stations, CHIRPS has the highest correlation r (mean ± SE: 0.73 ± 0.00) related to the stations’ precipitation, and GLDAS has the lowest r (mean ± SE: 0.58 ± 0.01) (Figure 2i and Figure S1a). The index r of four precipitation products shows similar characteristics in the eight regions. Compared with other regions, all four products have the highest r value in NE2 (>0.7), and the lowest r value in NW (<0.61). CHIRPS has the lowest RB (mean ± SE: 0.05 ± 0.01), followed by GLDAS (mean ± SE: 0.10 ± 0.02), and ERA5 has the highest RB (mean ± SE: 0.34 ± 0.02) at a national scale (Figure 2j and Figure S1b). The RB of four products in the eight regions have similar patterns but with a large number of outlier points. Compared with other regions, all datasets have the highest absolute RB in NW and QT. In the remaining regions, the RB of all products performed well, allowing relatively accurate estimation of true precipitation. The smallest RMSE among four products across the whole China appeared in CHIRPS (mean ± SE: 140.55 ± 3.16 mm), and the largest in ERA5 (mean ± SE: 297.73 ± 8.10mm) (Figure 2k and Figure S1c). Among eight regions, SC2 has the highest RMSE (especially above 500 mm in ERA5) and NW’s RMSE is the lowest (such as only 44.01 mm in CHIRPS).

3.3. Seasonality of Monthly Precipitation

At a monthly scale during the period of 1981–2020, the spatial patterns of SIMA in four precipitation products are consistent with that in the interpolated station precipitation over most areas of China (Figure 4a–e). Roughly speaking, in eastern SC1, western SC2, and northwestern NW, SIMA is lower than 0.6, and higher than 0.6 in other regions. For the matching performance in SIMA of four precipitation products at all meteorological stations (Figure 4f), SIMA of CHIRPS has the highest correlation related to that of station precipitation, and that of ERA5 with the lowest correlation. Mostly products underestimated SIMA except CHIRPS in whole of China (e.g., −16% in ERA5) (Figure 4h and Table S2). SIMA means that China and eight regions in four products or in interpolated station precipitation are mostly greater than 0.6. The lowest SIMA of 0.53 appeared in SC1, and the highest SIMA of 1.01 occurred in QT. CHIRPS and GLDAS generally overestimated SIMA in most regions. ERA5 and PERSIANN-CDR mostly underestimated SIMA in eight regions. Four datasets have the best SIMA estimation in SC1 (error range from −12% to 5%), overestimation in SC2 (e.g., approximately 21% in CHIRPS), and underestimation in QT (e.g., −26% in TRMM).
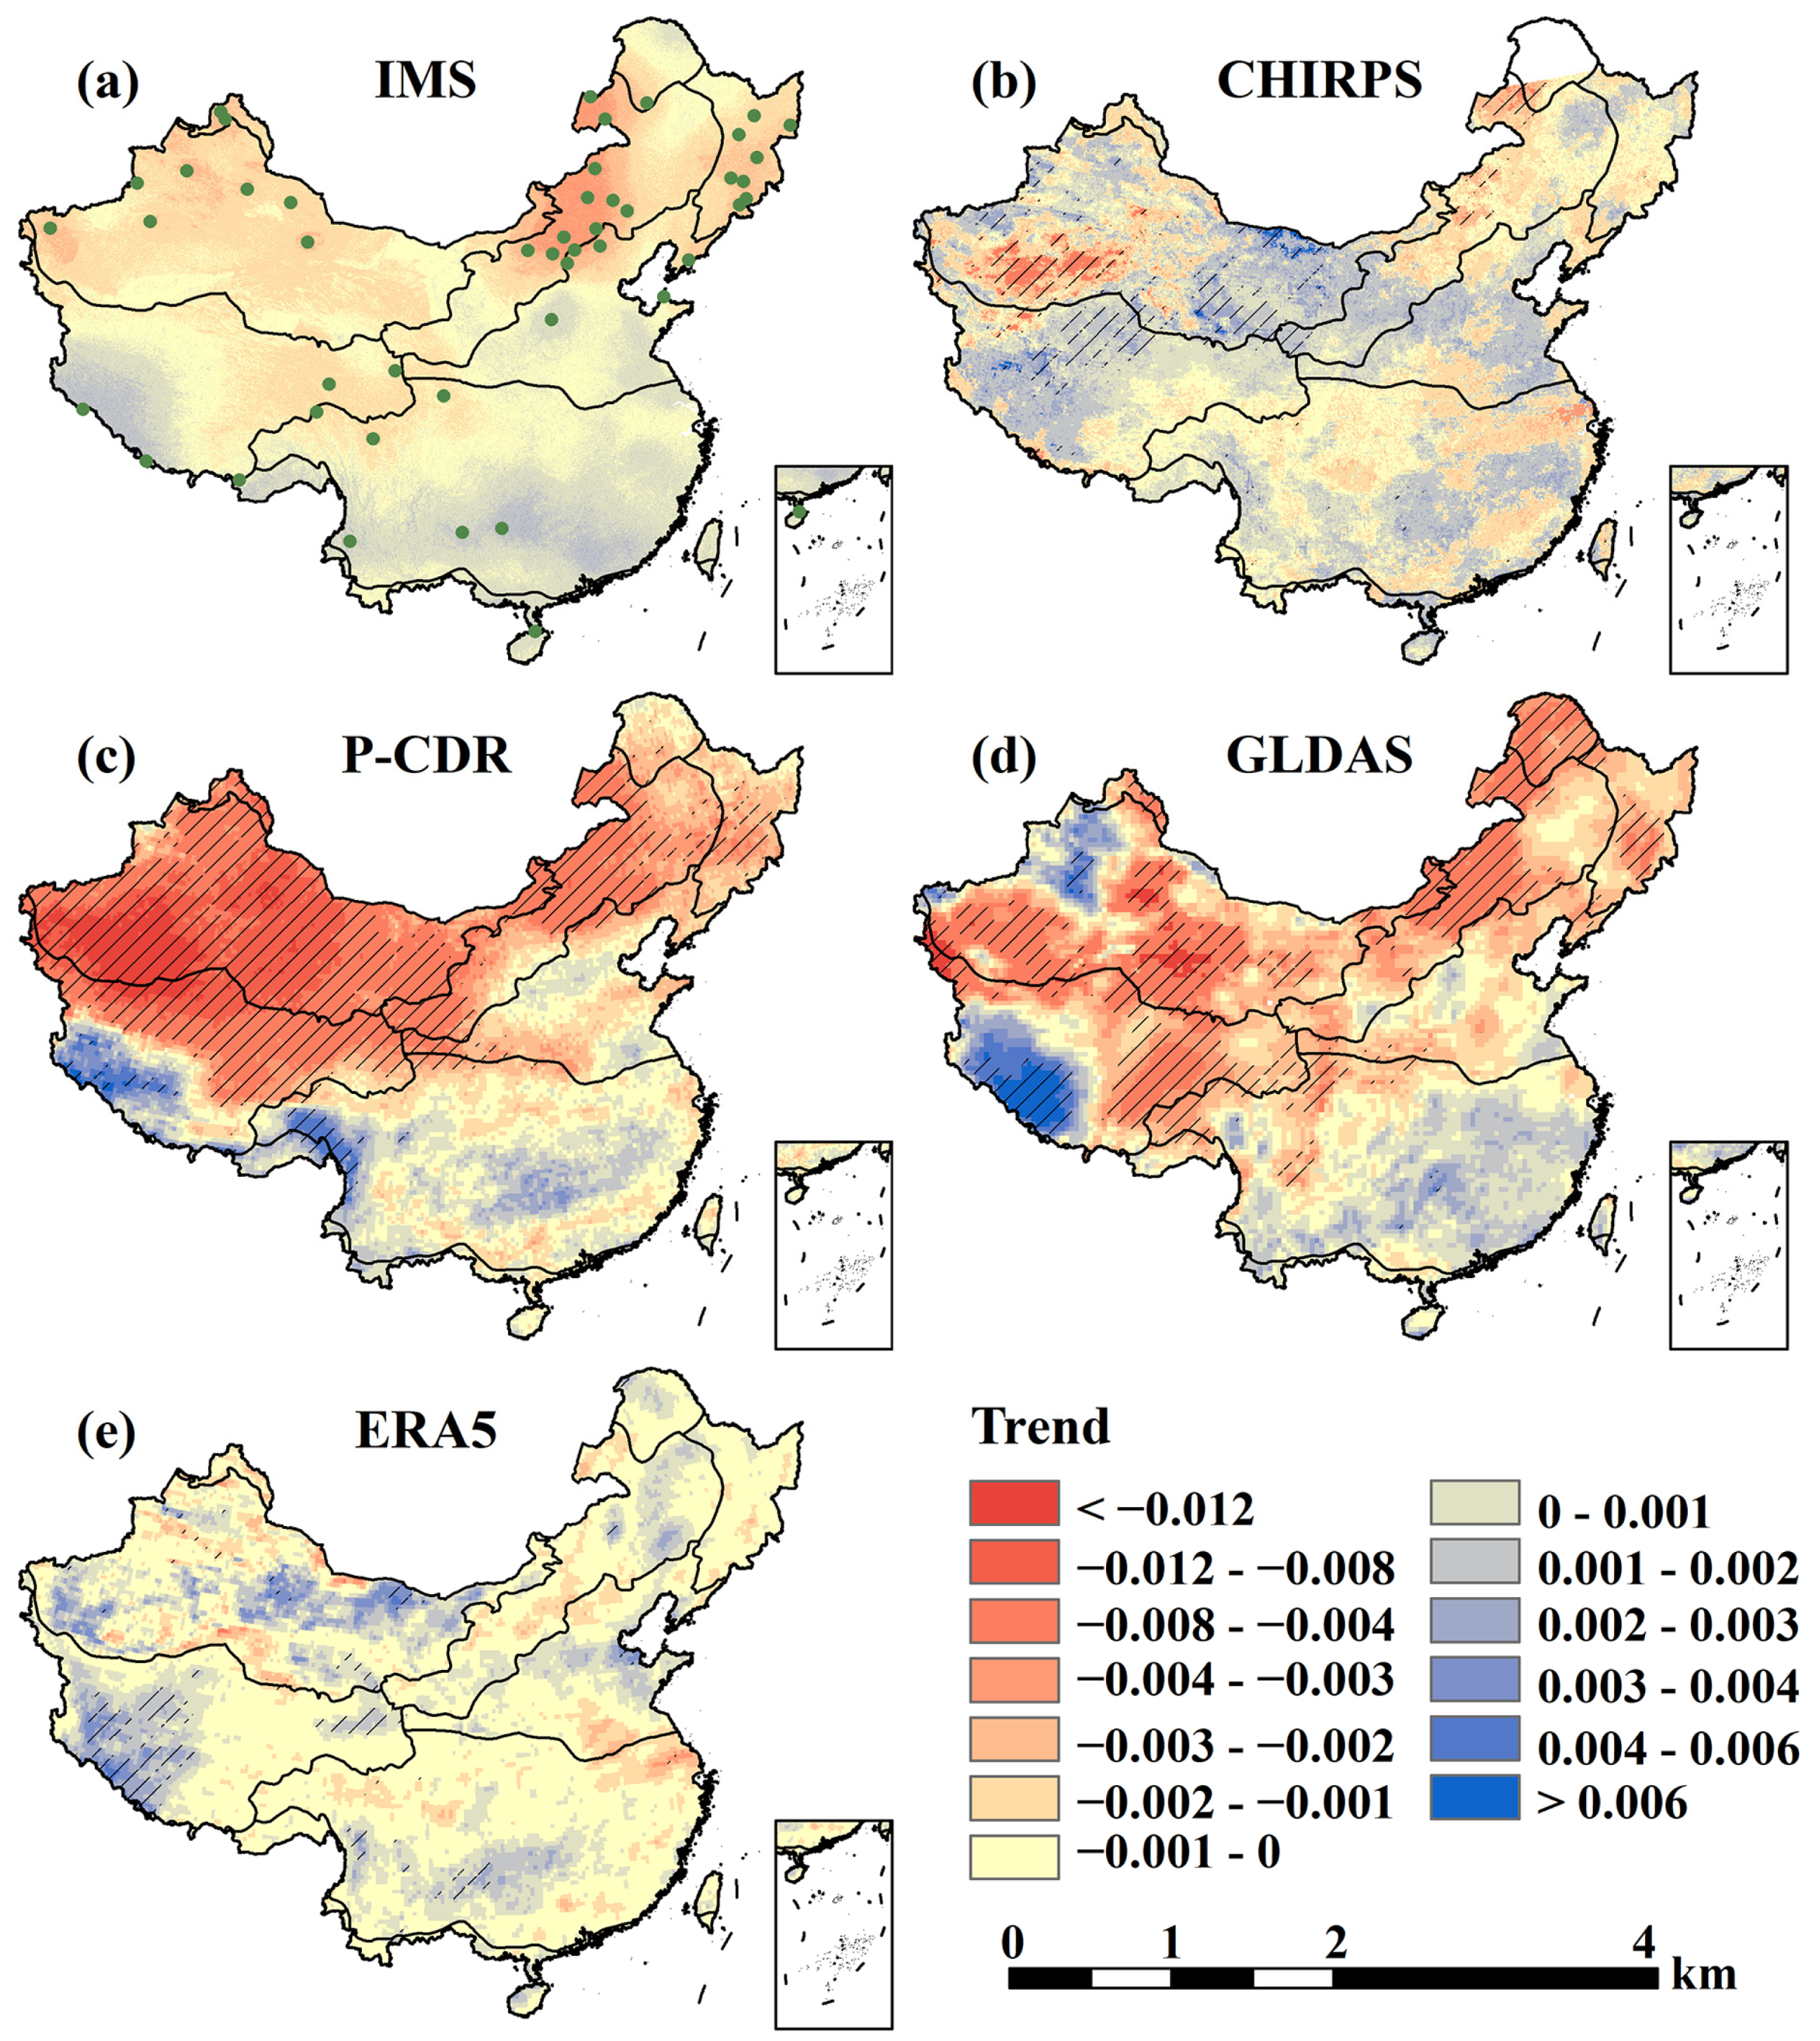
Annual SI of China from 1981 to 2020 appears similar to the interannual variations among four products and meteorological station precipitation (Figure 4g). All four products underestimate SI, especially ERA5’s estimate value, which is about 0.1 less than meteorological station precipitation. CHIRPS, PERSIANN-CDR, and GLDAS have the comparable ability to estimate SIs. Trends of annual SI of four precipitation products from 1981 to 2020 are extremely inconsistent with the interpolated station precipitation (Figure 5). Annual SI slightly decreased in NE2, NC1, northern NC2, NW, and eastern QT (slope < −0.001), but increased significantly in western NC2, southern SC1, SC2, and southwestern QT (slope > 0.001, p < 0.05). There is no obvious trend of annual SI in NE1, central NC2, and northern SC1 (−0.001 < slope < 0.001). The decreasing trend of annual SI of CHIRPS in southwestern NW (p < 0.05) is consistent with the interpolated precipitation, but its spatial distribution is small and the magnitude is large. Annual SI in PERSIANN-CDR and GLDAS shows a decreasing trend in NE1, NE2, NC1, NC2, northwestern NW, and eastern QT, which does match the decreasing trend of the interpolated precipitation, but the magnitude is still large. Annual SI trend of ERA5 shows a small and even spatial variation. In general, none of four products can accurately reveal the spatial distribution of annual SI trends in China but more accuracy in a certain region is needed.
In the aspect of SI accuracy performances among four precipitation products at meteorological stations, correlation r of annual SI between four products and stations precipitation are relatively high at the national scale (approximately r > 0.6, Figure 4i and Figure S2a). In all products, the r of CHIRPS is the highest among six regions except NE2 and NW, and the r of GLDAS is the lowest. In eight regions, all products have the highest r in NE1 (e.g., r = 0.8 in CHIRPS) and the lowest in NW (r < 0.45). RB of all products in the whole of China are mostly negative with the smallest error of −0.01 in CHIRPS and the largest error of −0.23 in ERA5 (Figure 4j and Figure S2b). In different regions, mostly four products have the worst performance (RB < −0.10) in NW and the best performance in NE1 (|RB| < 0.05) on RB. RMSE of CHIRPS is the lowest in China and all regions, while ERA5 is the highest. RMSE of four products are less than 0.2 at the national scale (Figure 4k and Figure S2c), with the highest value (RMSE > 0.2) in NW caused by a large number of outliers and the lowest value (RMSE < 0.15) in NC2. RMSE is mostly around 0.15 in the remaining regions.

3.4. Frequency of Daily Precipitation

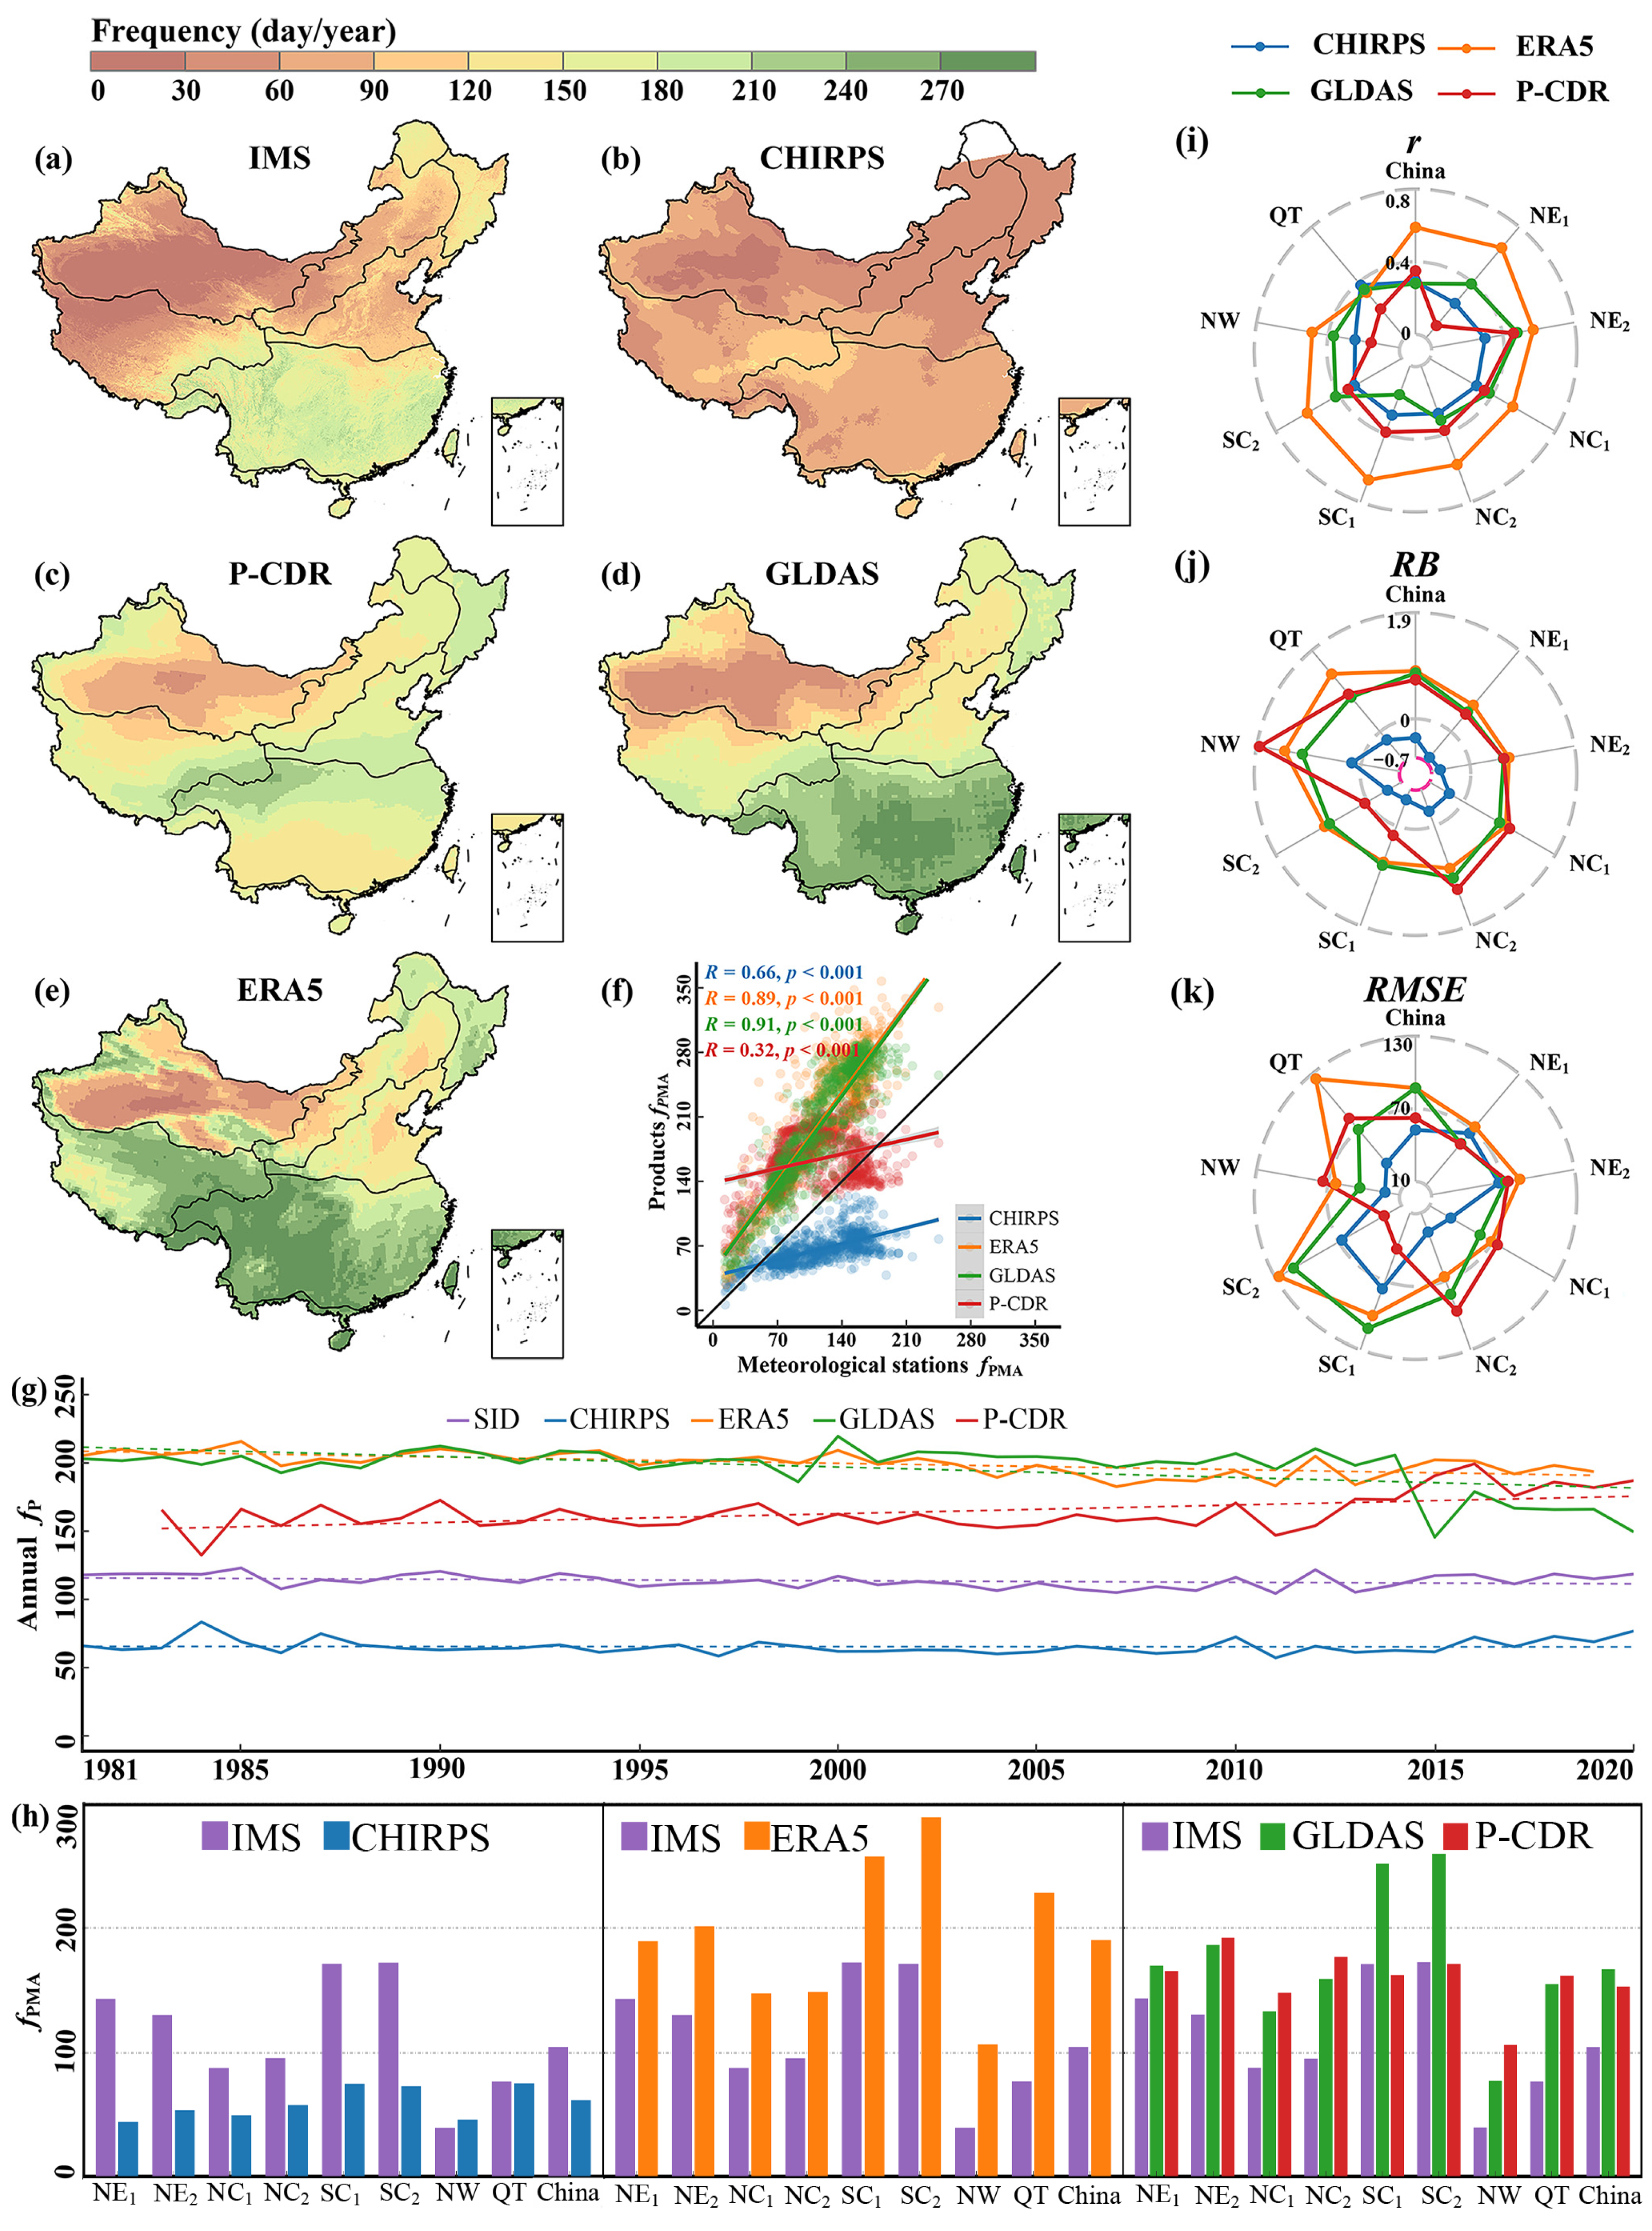
fPMA exhibits different spatial patterns in four products and interpolated precipitation (Figure 6a–e). In the interpolated station data, the spatial distribution of fPMA is similar with that of annual precipitation, i.e., decreasing from southeast (fPMA > 210 d) to northwest (fPMA < 30 d). fPMA in SC1 and SC2 is higher than 150 d, and in most areas of NW, lower than 50 d. CHIRPS critically underestimates fPMA at the national scale and in eight regions, especially for the large frequency of daily precipitation (e.g., fPMA > 60 d; Figure 6b,f). PERSIANN-CDR could severely overestimate fPMA when it is less than 180 d. ERA5 and GLDAS could overestimate fPMA in China at the national scale but be consistent with the spatial distribution of the interpolated precipitation. For eight regions, CHIRPS accurately estimates fPMA of NW and QT at 0.05° spatial resolution, but significantly underestimates in the other regions (Figure 6h and Table S3). ERA5 at 0.1° spatial resolution can severely overestimate fPMA in all regions, especially in QT, with bias of 195%. PERSIANN-CDR and GLDAS overestimate fPMA in most regions, except in SC2 with an underestimation of PERSIANN-CDR at 0.25°resolution. These products largely overestimate fPMA in NW and QT except CHIRPS. In general, errors of fPMA in four products are greater than 30% in most regions.
The interannual variation of fP in four precipitation products showed an out-of-sync feature with meteorological station precipitation in China from 1981 to 2020, and the ability to estimate fP on the diurnal scale is poor (Figure 6g). fP for meteorological station data is around 120 days, while in four products estimate range from 60 to 200 days, with a large margin of error. In addition to CHIRPS underestimate fP, ERA5, GLDAS and PERSIANN-CDR are all obviously overestimate. None of four products can accurately reveal the changing trend of annual fP in China during the period of 1981–2020 (Figure 7). Annual fP has a significantly decreasing trend in NE1, northern and southern NC2, SC1, SC2, and northwestern NW (p < 0.05), especially drastically decreases (<−0.2 days/year) in the southwestern and southeastern SC1. The trend of annual fP in southwestern and eastern NW, and QT slightly increase (p > 0.05). fP trend of CHIRPS in QT has a similar pattern but larger magnitude than that of interpolated precipitation (e.g., >0.4 days/year in QT, p < 0.05). The increasing fP trend of CHIRPS in the southern SC1 is contrary to the decreasing trend of interpolated precipitation. PERSIANN-CDR shows an increasing fP trend in northern China (p < 0.05), contrary to reality. Annual fP of ERA5 and GLDAS mainly increase in the QT (>0.2 days/year) and decrease in SC1 and SC2 (<−0.4 days/year, p < 0.05). This pattern is consistent within the interpolated precipitation but its magnitude is higher than that in the interpolated precipitation.
In the aspect of fP accuracy performances of four precipitation products at meteorological stations, the r index of all products is relatively low and mainly clustered around 0.5 (Figure 6i and Figure S3a). ERA5 has the highest r (mean ± SE: 0.59 ± 0.01) related to the station precipitation across China (especially 0.67 in SC1). CHIRPS and GLDAS have the lowest r (mean ± SE: 0.29 ± 0.01 and 0.28 ± 0.01, respectively). Different precipitation products in the same region have disparate correlations. ERA5 and GLDAS in the whole China (RE > 0.8) seriously overestimates the number of precipitation days (Figure 6j and Figure S3b). The RB of fP of CHIRPS is the lowest and negative among that of four products at the national scale and in all regions except NW. Four precipitation products could seriously overestimate fP in NW due to the largest difference of RB in this region. RMSE of ERA5 and GLDAS is huge (>80) throughout China (Figure 6k and Figure S3c). Compared with other products, CHIRPS has the smallest RMSE in China and in five regions (<77), except in NE1, SC1, and SC2. PERSIANN-CDR has the lowest RMSE in SC2 (mean ± SE: 26.66 ± 2.55) and the highest in NC2 (mean ± SE: 96.48 ± 1.01). RMSE of four products also varied notably in eight regions, especially in the SC1, SC2 and QT.

3.5. Intensity of Daily Precipitation

IPMA in four products and interpolated precipitation displays a decreasing trend from the southeast to the northwest of China (Figure 8a–e). IPMA in SC1 and SC2 is higher than 12 mm/day, and in most areas of NW lower than 4 mm/day. CHIRPS overestimates IPMA over all of China, especially in high values of IPMA with biases up to about two times reality (Figure 8b,f). CHIRPS overestimates by 22% in the NW and 118% in NE2 at 0.05° spatial resolution (Figure 8h and Table S4). ERA5 underestimates the IPMA of seven regions except QT at 0.1° resolution, ranging between −16% and −39%. PERSIANN-CDR and GLDAS exhibit similar simulation capabilities at 0.25° resolution, but the underestimation range is much larger than ERA5, from −6% to −54%. All precipitation products except ERA5 in QT overestimate IPMA and the corresponding positive errors range from 9% to 113%. In NE1, the IPMA errors of four products are the largest, ranging from −43% to 117%.
The interannual variation of IP of four precipitation products is extremely inconsistent with meteorological station precipitation in China from 1981 to 2020 (Figure 8g). Although the results are inconsistent, the correlation between four products and meteorological stations is very high (R ≥ 0.84, Figure 8f). The IP of meteorological station data is about 7 mm/day, and the estimates for ERA5, GLDAS and PERSIANN-CDR range from 4 to 6 mm/day, which is lower than the true IP. The estimated IP of CHIRPS is about 14 mm/day, which is twice as high as the true IP, and the difference is huge. Trends of annual IP from 1981 to 2020 present inconsistent spatial distributions among four products and interpolated station precipitation (Figure 9). Annual IP slightly increases in most of China, and significantly rises up (>0.01 mm/day, p < 0.05) in NE2, NC2, SC1, SC2, and northwestern NW. The increasing IP trend of CHIRPS in NC1, NC2, and SC1 shows a consistent spatial pattern but with a greater magnitude than that of interpolated precipitation (>0.04 mm/day, p < 0.05). The decreasing IP trend of CHIRPS in NE2, western NW, southwestern QT, southern SC1 and SC2 is contrary to the increasing IP trend of interpolated precipitation. PERSIANN-CDR has a decreasing IP trend in seven regions except SC1, contrary to the reality. The decreasing IP trend of GLDAS in NE1, northern NC1, NC2, southern NW, and western QT (<−0.01) is contrary to that of the interpolated precipitation. IP trend of ERA5 decreases in NE1, northern NC1, NC2, SC1, SC2, and western NW, especially, significantly reduces in SC1 (<−0.02 mm/day, p < 0.05).
In terms of IP accuracy performances in four precipitation products at meteorological stations, the r index is relatively low and mainly gathered around 0.5 (Figure 8i and Figure S4a). CHIRPS and GLDAS have the lowest r (mean of 0.36 and 0.37) at the national scale. In eight regions, most products, except CHIRPS, have the highest r (>0.5) in NE2. CHIRPS poorly overestimates IP (0.45 < RB < 1.69) in all regions, except in NW (Figure 8j and Figure S4b). Only the RB of IP in CHIRPS is positive, whether in the whole of China or in all regions, ranging from 0.04 in NW to 1.69 in NE1. RB of IP of ERA5, PERSIANN-CDR, and GLDAS in the whole China and all eight regions are negative with the smallest error of −0.06 in QT and the largest of −0.48 in NC2. RMSE of CHIRPS has a huge heterogeneity whether in China or in eight regions (e.g., 1.34 in NW and 10.59 in SC1) (Figure 8k and Figure S4c). RMSE of PERSIANN-CDR, GLDAS, and ERA5 is around two in five regions, except in NC2, SC1, and SC2. All four products in QT have the smallest error and are clustered around one region.

4. Discussion

We find that on the multi-year scales, the CHIRPS product could more accurately depict the magnitude and spatial patterns of precipitation in China than the other three products, which can be identified from their highest correlation and smallest error with meteorological station precipitation (Figure 2i–k). Our results identify that ERA5 has the lowest accuracy because of the weakest correlation to station precipitation and large positive errors in rainy regions. A small error means that a precipitation product in a specific region has a well-matching ability to the interpolated station precipitation, and vice versa. There is no necessary relationship between the magnitude of error and the amount of precipitation such as QT, which has both small precipitation and large errors (Figure 2a–e,k). Four precipitation products reflect trends of AAP at a regional scale, but the magnitude is obviously greater than that of interpolation station data (Figure 3). These results are in agreement with the previous findings which concluded that CHIRPS well captures prominent precipitation gradients in northern China [47], and that ERA5 can reveal the spatiotemporal pattern of precipitation in China, but slightly overestimated precipitation [40]. The overestimation phenomena may be related to inverse algorithms used for satellite products, inaccurate estimates of solid precipitation, altitude, and distribution density of meteorological stations [48]. The four products’ ability to fit multi-year average precipitation in different regions could be affected by the underlying surface [49]. Further detailed analysis can be made for different underlying surfaces within a region, such as the southwest and southeast in SC1.
Seasonality is one of the main components of annual precipitation. The contribution of seasonal variation to annual accumulated precipitation is greater than frequency and intensity [13]. Seasonality determines the intra-annual variation of precipitation and is one of the dominant factors in the intra-annual variability in the ecosystems’ water, carbon and energy fluxes [50,51,52]. Our results indicate that four precipitation products can more accurately capture the seasonal variations of precipitation, including magnitude and spatial distribution. The SIMA of four products have similar spatial patterns, even though it is overestimated when SIMA is low (Figure 2a–f). The value of SIMA ranged from 0.6 to 1.0, which means a high-seasonal variation of precipitation, like SIMA in NE1, NE2, NC1, and NW which could be caused by atmospheric circulation [13]. The SIMA of QT is more than 1.0 in IMS but approximately 0.8 in all products, which suggests that products failed to match the seasonality of QT. This phenomenon could be conducted by topographic effects with poorly estimated precipitation in mountainous areas [53]. Four precipitation products show obvious spatial heterogeneity in the annual SI trend (Figure 5). PERSIANN-CDR and GLDAS can represent the spatial pattern of the annual SI trend, but the magnitude varies greatly compared to interpolated station precipitation. CHIRPS and ERA5 only correctly show the spatial pattern in some areas, which highlights that it is very important and necessary to select the product with the best-matching regional precipitation at a seasonal scale. This result is similar to the study on global precipitation seasonality which concluded that the annual SI trend could not be described consistently across different datasets [18]. This inconsistency may be caused by various distributions of monthly mean precipitation, due to the different precipitation capturing abilities of products [18,50]. The interannual trend of SI represent the variation of precipitation distribution within the year, and it reflects that the intra-annual precipitation tends to be more concentrated or uniform. Analysis of the interannual trend of SI can provide a scientific basis for water resource utilization, ecological management and disaster prevention in different regions [54,55].
Our results highlight that the four products only have relative accuracy on spatial pattern of precipitation frequency and intensity but poorly match their magnitudes at different spatial resolutions (Figure 6a–e and Figure 8a–e). ERA5 and GLDAS underestimate IPMA in the whole of China, but CHIRPS seriously overestimates. This result is contrary to the previous results that CHIRPS underestimates precipitation frequency in southern China [56] and the Tibetan Plateau [57], which is probably caused by the different definitions of a rainy day. Different definitions of a rainy day led to differences in the frequency and intensity captured from precipitation products, which could make products show inconsistent fitting abilities to the precipitation traits in the same region [58]. Four precipitation products cannot reveal the interannual trend of fP and IP over China (Figure 7 and Figure 9), indicating that these products were not suitable for analyzing interannual trends of diurnal precipitation traits. The four products of IP have a high correlation with meteorological stations; the unsynchronized interannual variation may be due to systematic errors. This error could perhaps be fixed by integrating data from different sources through methods such as model simulation. With human-induced climate change, extreme precipitation events are frequent occurrences and precipitation tends to be concentrated in many places [59]. Enhancing precipitation intensity can lead to a high risk of flash floods and debris flows, and decreasing precipitation frequency generates overshoot drought and increases the severity of drought [60]. The occurrences of these disasters harm vegetation growth and ecosystem stability [61]. Therefore, it is necessary to consider matching the degree between the used precipitation data and real precipitation in terms of frequency and intensity when exploring the impact of short-term precipitation change on ecosystems and the environment, especially considering the impact of extreme precipitation.
Previous studies have only analyzed precipitation traits from an individual aspect, and not been able to form a comprehensive understanding of precipitation variation at the multi-year, annual, seasonal, and daily scales. In order to compensate for the shortcomings of previous researches, we have presented a wide-ranging technical framework to evaluate the matching ability of precipitation products for five precipitation traits, i.e., spatial pattern of multi-year average, annual trend, seasonality, frequency, and intensity. Seasonal variations in precipitation are essential for the stability of ecosystems and security of human societies. Previous studies have analyzed spatial patterns and trends of seasonal indices in different datasets [18,51], but did not compare the differences in the matching ability among different products to quantify precipitation seasonality. Our study analyzed it through multiple statistical indicators to increase the understanding of seasonality. There are some uncertainties in four precipitation products due to different sensors, various correction, diverse data-processing methods, mixed model simulation, inconsistent synthesis time, and assorted spatiotemporal resolution [62,63]. There are also systematic or accidental errors in obtaining meteorological station precipitation data, which are affected by the change of observation instruments and methods, station migration and other factors. The above limits lead to the uncertainty in our research results. Based on the quality of existing datasets, this study only selects a short time series for analysis to minimize the result uncertainty. In addition, the seasonal index used in this study only indicates precipitation concentration degree (PCD), but cannot specify the precipitation concentration period (PCP); thus, a more innovative index could be to be used to explore PCP in the seasonal variation of precipitation.

5. Conclusions

Our study explored the best-matching precipitation traits in four popular products (including CHIRPS, PERSIANN-CDR, ERA5, and GLDAS) during the period of 1980–2020 in China, based on analyzing the differences of spatial patterns and magnitudes compared to the meteorological station precipitation at multi-year, annual, seasonal, and daily time scales. CHIRPS has the highest accuracy in estimating the spatial pattern of multi-year average precipitation across China, especially in a majority of northeastern and southern China, but it cannot correctly measure the spatial pattern of annual precipitation trend, and the estimated trend magnitude is larger. These products can precisely assess the spatial pattern of the multi-year average seasonal index (e.g., the highest accuracy of CHIRPS in Northern China), but fails to detect the trend of the annual seasonal index. At the daily scale, these four products poorly quantify the spatiotemporal pattern of precipitation frequency and intensity. All of this suggests that different precipitation products have various matching performances compared to the reality in different regions at different time scales. Future research on exploring the influences of seasonal or short-term precipitation events, such as exploring the effects of extreme rainfall and the modeling ecohydrological process, should carefully select precipitation products with a higher accuracy in corresponding regions at their intrinsic time scales.

Supplementary Materials

The following supporting information can be downloaded at: https://www.mdpi.com/article/10.3390/rs15133355/s1, Figure S1: Comparisons of r, RB and RMSE for AAP among four precipitation products and meteorological precipitation in China from 1981 to 2020. AAP is annual accumulated precipitation; r, RB and RMSE represent the correlation coefficient, the relative bias and the root mean square error, respectively; Figure S2: Comparisons of r, RB and RMSE for annual SI among four precipitation products and meteorological precipitation in China from 1981 to 2020. SI is seasonality index; r, RB and RMSE represent the correlation coefficient, the relative bias and the root mean square error, respectively; Figure S3: Comparisons of r, RB and RMSE for annual fP among four precipitation products and meteorological precipitation in China from 1981 to 2020. fP is daily precipitation frequency; r, RB and RMSE represent the correlation coefficient, the relative bias and the root mean square error, respectively; Figure S4: Comparisons of r, RB and RMSE for annual IP among four precipitation products and meteorological precipitation in China from 1981 to 2020. IP is daily precipitation frequency; r, RB and RMSE represent the correlation coefficient, the relative bias and the root mean square error, respectively; Table S1: Multi-year average precipitation (MAP) of four precipitation products and interpolated meteorological station precipitation (IMS) in whole China and eight regions from 1981 to 2020; Table S2: SIMA of four precipitation products and interpolated meteorological station precipitation (IMS) in whole China and eight regions from 1981 to 2020. SIMA represents multi-year average seasonality index; Table S3: fPMA of four precipitation products and interpolated meteorological station precipitation (IMS) in whole China and eight regions from 1981 to 2020. fPMA represents multi-year average of daily precipitation frequency; Table S4: IPMA of five precipitation products and interpolated meteorological station precipitation (IMS) data in whole China and eight regions from 1981 to 2020. IPMA represents multi-year average of daily precipitation intensity.

Author Contributions

Conceptualization, X.L. and J.Z.; methodology, X.L. and J.Z.; software, X.L. and J.Z.; validation, W.L.; formal analysis, Y.A.; investigation, M.Z.; resources, L.Y.; data curation, X.Y.; writing—original draft preparation, X.L.; writing—review and editing, J.Z., Q.F. and Y.A.; visualization, X.L.; supervision, Y.L.; project administration, T.H.; funding acquisition, J.Z., Q.F., W.L., Y.A. and M.Z. All authors have read and agreed to the published version of the manuscript.

Funding

This research was funded by the National Natural Science Foundation of China (Grant No. 42101115, 52179026, 42201133), the National Key R&D Program of China (No. 2022YFF1303301), the Science and Technology Program of Gansu Province, China (Grant No. 22JR5RA068), the Key Laboratory of Degraded and Unused Land Consolidation Engineering, MNR (Grant No. SXDJ2019-8), and the Shaanxi Key Laboratory of Land Consolidation (Grant No. 2018-JC08).

Data Availability Statement

The data that support the findings of this study are available from the author upon reasonable request.

Acknowledgments

The authors appreciate the editors and anonymous reviewers for their valuable comments and suggestions.

Conflicts of Interest

The authors declare no conflict of interest.

References

  1. Burls, N.J.; Fedorov, A.V. Wetter subtropics in a warmer world: Contrasting past and future hydrological cycles. Proc. Natl. Acad. Sci. USA 2017, 114, 12888–12893. [Google Scholar] [CrossRef] [PubMed] [Green Version]
  2. Zhang, S.; Zhou, L.; Zhang, L.; Yang, Y.; Wei, Z.; Zhou, S.; Yang, D.; Yang, X.; Wu, X.; Zhang, Y.; et al. Reconciling disagreement on global river flood changes in a warming climate. Nat. Clim. Chang. 2022, 12, 1160–1167. [Google Scholar] [CrossRef]
  3. Zhang, W.; Furtado, K.; Wu, P.; Zhou, T.; Chadwick, R.; Marzin, C.; Rostron, J.; Sexton, D. Increasing precipitation variability on daily-to-multi-year time scales in a warmer world. Sci. Adv. 2021, 7, eabf8021. [Google Scholar] [CrossRef]
  4. Bell, C.W.; Tissue, D.T.; Loik, M.E.; Wallenstein, M.D.; Acosta-Martinez, V.; Erickson, R.A.; Zak, J.C. Soil microbial and nutrient responses to 7 years of seasonally altered precipitation in a Chihuahuan Desert grassland. Glob. Chang. Biol. 2014, 20, 1657–1673. [Google Scholar] [CrossRef]
  5. Guo, Q.; Hu, Z.; Li, S.; Yu, G.; Sun, X.; Zhang, L.; Mu, S.; Zhu, X.; Wang, Y.; Li, Y.; et al. Contrasting responses of gross primary productivity to precipitation events in a water-limited and a temperature-limited grassland ecosystem. Agric. For. Meteorol. 2015, 214–215, 169–177. [Google Scholar] [CrossRef]
  6. Zhao, W.; Lv, X.; Li, Y.; Wang, Z.; Zhang, W.; Zhuang, L. Future N deposition and precipitation changes will be beneficial for the growth of Haloxylon ammodendron in Gurbantunggut Desert, northwest China. Sci. Rep. 2019, 9, 4001. [Google Scholar] [CrossRef] [Green Version]
  7. He, B. Potentials of meteorological characteristics and synoptic conditions to mitigate urban heat island effects. Urban Clim. 2018, 24, 26–33. [Google Scholar] [CrossRef]
  8. Londe, D.W.; Dvorett, D.; Davis, C.A.; Loss, S.R.; Robertson, E.P. Inundation of depressional wetlands declines under a changing climate. Clim. Chang. 2022, 172, 27. [Google Scholar] [CrossRef]
  9. Niu, X.; Liu, S. Drought Affected Ecosystem Water Use Efficiency of a Natural Oak Forest in Central China. Forests 2021, 12, 839. [Google Scholar] [CrossRef]
  10. Xiang, J.; Zhang, W.; Song, X.; Li, J. Impacts of Precipitation and Temperature on Changes in the Terrestrial Ecosystem Pattern in the Yangtze River Economic Belt, China. Int. J. Environ. Res. Public Health 2019, 16, 4832. [Google Scholar] [CrossRef] [Green Version]
  11. Palagi, E.; Coronese, M.; Lamperti, F.; Roventini, A. Climate change and the nonlinear impact of precipitation anomalies on income inequality. Proc. Natl. Acad. Sci. USA 2022, 119, e2203595119. [Google Scholar] [CrossRef] [PubMed]
  12. Hu, Z.; Zhou, Q.; Chen, X.; Qian, C.; Wang, S.; Li, J. Variations and changes of annual precipitation in Central Asia over the last century. Int. J. Climatol. 2017, 37, 157–170. [Google Scholar] [CrossRef]
  13. Good, S.P.; Guan, K.; Caylor, K.K. Global Patterns of the Contributions of Storm Frequency, Intensity, and Seasonality to Interannual Variability of Precipitation. J. Clim. 2016, 29, 3–15. [Google Scholar] [CrossRef]
  14. Liu, J.; Ma, X.; Duan, Z.; Jiang, J.; Reichstein, M.; Jung, M. Impact of temporal precipitation variability on ecosystem productivity. WIREs Water 2020, 7, e1481. [Google Scholar] [CrossRef]
  15. Zhou, C.; Wang, K. Quantifying the Sensitivity of Precipitation to the Long-Term Warming Trend and Interannual–Decadal Variation of Surface Air Temperature over China. J. Clim. 2017, 30, 3687–3703. [Google Scholar] [CrossRef]
  16. Gou, Y.; Balling, J.; Sy, V.D.; Herold, M.; Keersmaecker, W.D.; Slagter, B.; Mullissa, A.; Shang, X.; Reiche, J. Intra-annual relationship between precipitation and forest disturbance in the African rainforest. Environ. Res. Lett. 2022, 17, 044. [Google Scholar] [CrossRef]
  17. Shaw, E.A.; White, C.T.; Silver, W.L.; Suding, K.N.; Hallett, L.M. Intra-annual precipitation effects on annual grassland productivity and phenology are moderated by community responses. J. Ecol. 2021, 110, 162–172. [Google Scholar] [CrossRef]
  18. Tan, X.; Wu, Y.; Liu, B.; Chen, S. Inconsistent changes in global precipitation seasonality in seven precipitation datasets. Clim. Dyn. 2020, 54, 3091–3108. [Google Scholar] [CrossRef]
  19. Cheng, R.; Novak, L.; Schneider, T. Predicting the Interannual Variability of California’s Total Annual Precipitation. Geophys. Res. Lett. 2021, 48, e2020GL091465. [Google Scholar] [CrossRef]
  20. Thackeray, C.W.; Hall, A.; Norris, J.; Chen, D. Constraining the increased frequency of global precipitation extremes under warming. Nat. Clim. Chang. 2022, 12, 441–448. [Google Scholar] [CrossRef]
  21. Wang, Z.; Sun, Y.; Zhang, X.; Li, T.; Li, C.; Min, S.-K.; Hu, T. Human influence on historical heaviest precipitation events in the Yangtze River Valley. Environ. Res. Lett. 2023, 18, 024044. [Google Scholar] [CrossRef]
  22. Groisman, P.Y.; Knight, R.W.; Karl, T.R.; Easterling, D.R.; Sun, B.; Lawrimore, J.H. Contemporary Changes of the Hydrological Cycle over the Contiguous United States: Trends Derived from In Situ Observations. J. Hydrometeorol. 2004, 5, 64–85. [Google Scholar] [CrossRef]
  23. Sun, B.; Wang, H. Interannual Variation of the Spring and Summer Precipitation over the Three River Source Region in China and the Associated Regimes. J. Clim. 2018, 31, 7441–7457. [Google Scholar] [CrossRef]
  24. Gherardi, L.A.; Sala, O.E. Effect of interannual precipitation variability on dryland productivity: A global synthesis. Glob. Chang. Biol. 2018, 25, 269–276. [Google Scholar] [CrossRef] [Green Version]
  25. Li, Y.; Liu, W.; Feng, Q.; Zhu, M.; Yang, L.; Zhang, J.; Yin, X. The role of land use change in affecting ecosystem services and the ecological security pattern of the Hexi Regions, Northwest China. Sci. Total Environ. 2023, 855, 158940. [Google Scholar] [CrossRef] [PubMed]
  26. Liu, W.; Li, L.; Biederman, J.A.; Hao, Y.; Zhang, H.; Kang, X.; Cui, X.; Wang, Y.; Li, M.; Xu, Z.; et al. Repackaging precipitation into fewer, larger storms reduces ecosystem exchanges of CO2 and H2O in a semiarid steppe. Atmos. Chem. Phys. 2017, 247, 356–364. [Google Scholar] [CrossRef]
  27. Sun, Q.; Miao, C.; Duan, Q.; Ashouri, H.; Sorooshian, S.; Hsu, K.-L. A Review of Global Precipitation Data Sets: Data Sources, Estimation, and Intercomparisons. Rev. Geophys. 2018, 56, 79–107. [Google Scholar] [CrossRef] [Green Version]
  28. Hendrawan, V.S.A.; Kim, W.; Touge, Y.; Ke, S.; Komori, D. A global-scale relationship between crop yield anomaly and multiscalar drought index based on multiple precipitation data. Environ. Res. Lett. 2022, 17, 014037. [Google Scholar] [CrossRef]
  29. Mazzoleni, M.; Brandimarte, L.; Amaranto, A. Evaluating precipitation datasets for large-scale distributed hydrological modelling. J. Hydrol. 2019, 578, 124076. [Google Scholar] [CrossRef] [Green Version]
  30. Tarek, M.; Brissette, F.; Arsenault, R. Uncertainty of gridded precipitation and temperature reference datasets in climate change impact studies. Hydrol. Earth Syst. Sci. 2021, 25, 3331–3350. [Google Scholar] [CrossRef]
  31. Zhang, L.; Chen, X.; Lai, R.; Zhu, Z. Performance of satellite-based and reanalysis precipitation products under multi-temporal scales and extreme weather in mainland China. J. Hydrol. 2022, 605, 127389. [Google Scholar] [CrossRef]
  32. Derin, Y.; Anagnostou, E.; Berne, A.; Borga, M.; Boudevillain, B.; Buytaert, W.; Chang, C.-H.; Chen, H.; Delrieu, G.; Hsu, Y.; et al. Evaluation of GPM-era Global Satellite Precipitation Products over Multiple Complex Terrain Regions. Remote Sens. 2019, 11, 2936. [Google Scholar] [CrossRef] [Green Version]
  33. Yu, C.; Hu, D.; Liu, M.; Wang, S.; Di, Y. Spatio-temporal accuracy evaluation of three high-resolution satellite precipitation products in China area. Atmos. Res. 2020, 241, 104952. [Google Scholar] [CrossRef]
  34. Fang, J.; Song, Y.; Liu, H.; Piao, S. Vegetation-Climate Relationship and Its Application in the Division of Vegetation Zone in China. Acta Bot. Sin. 2002, 44, 1105–1122. [Google Scholar]
  35. Sheng, Z.; Xie, S.; Pan, C. Probability and Statistics, 4th ed.; Higher Education Press: Beijing, China, 2008; pp. 112–114. [Google Scholar]
  36. Eischeid, J.K.; Pasteris, P.A.; Diaz, H.F.; Plantico, M.S.; Lott, N.J. Creating a Serially Complete, National Daily Time Series of Temperature and Precipitation for the Western United States. J. Appl. Meteorol. 2000, 39, 1580–1591. [Google Scholar] [CrossRef]
  37. Funk, C.; Peterson, P.; Landsfeld, M.; Pedreros, D.; Verdin, J.; Shukla, S.; Husak, G.; Rowland, J.; Harrison, L.; Hoell, A.; et al. The climate hazards infrared precipitation with stations-a new environmental record for monitoring extremes. Sci. Data 2015, 2, 150066. [Google Scholar] [CrossRef] [Green Version]
  38. Ashouri, H.; Hsu, K.-L.; Sorooshian, S.; Braithwaite, D.K.; Knapp, K.R.; Cecil, L.D.; Nelson, B.R.; Prat, O.P. PERSIANN-CDR: Daily Precipitation Climate Data Record from Multisatellite Observations for Hydrological and Climate Studies. Bull. Am. Meteorol. Soc. 2015, 96, 69–83. [Google Scholar] [CrossRef] [Green Version]
  39. Hoffmann, L.; Günther, G.; Li, D.; Stein, O.; Wu, X.; Griessbach, S.; Heng, Y.; Konopka, P.; Müller, R.; Vogel, B.; et al. From ERA-Interim to ERA5: The considerable impact of ECMWF’s next-generation reanalysis on Lagrangian transport simulations. Atmos. Chem. Phys. 2019, 19, 3097–3124. [Google Scholar] [CrossRef] [Green Version]
  40. Jiao, D.; Xu, N.; Yang, F.; Xu, K. Evaluation of spatial-temporal variation performance of ERA5 precipitation data in China. Sci. Rep. 2021, 11, 17956. [Google Scholar] [CrossRef]
  41. Rodell, M.; Houser, P.R.; Jambor, U.; Gottschalck, J.; Mitchell, K.; Meng, C.-J.; Arsenault, K.; Cosgrove, B.; Radakovich, J.; Bosilovich, M.; et al. The global land data assimilation system. Bull. Am. Meteorol. Soc. 2004, 85, 381–394. [Google Scholar] [CrossRef] [Green Version]
  42. Walsh, R.P.D.; Lawler, D.M. Rainfall Seasonality Description Spatial Patterns and Change Through Time. Weather Clim. Extrem. 1981, 36, 201–208. [Google Scholar] [CrossRef]
  43. Good, S.P.; Caylor, K.K. Climatological determinants of woody cover in Africa. Proc. Natl. Acad. Sci. USA 2011, 108, 4902–4907. [Google Scholar] [CrossRef] [Green Version]
  44. Sun, W.; Minasny, B.; McBratney, A. Analysis and prediction of soil properties using local regression-kriging. Geoderma 2012, 171–172, 16–23. [Google Scholar] [CrossRef]
  45. Mann, H.B. Nonparametric test against trend. Econometrica 1945, 13, 245–259. [Google Scholar] [CrossRef]
  46. Hamed, K.H.; Rao, A.R. A modified Mann-Kendall trend test for autocorrelated data. J. Hydrol. 1998, 204, 182–196. [Google Scholar] [CrossRef]
  47. Faiz, M.A.; Zhang, Y.; Baig, F.; Wrzesiński, D.; Naz, F. Identification and inter-comparison of appropriate long-term precipitation datasets using decision tree model and statistical matrix over China. Int. J. Climatol. 2021, 41, 5003–5021. [Google Scholar] [CrossRef]
  48. Jiang, Q.; Li, W.; Fan, Z.; He, X.; Sun, W.; Chen, S.; Wen, J.; Gao, J.; Wang, J. Evaluation of the ERA5 reanalysis precipitation dataset over Chinese Mainland. J. Hydrol. 2021, 595, 125660. [Google Scholar] [CrossRef]
  49. Wang, Y.; Zhao, N. Evaluation of Eight High-Resolution Gridded Precipitation Products in the Heihe River Basin, Northwest China. Remote Sens. 2022, 14, 1458. [Google Scholar] [CrossRef]
  50. Doyle, M.E. Observed and simulated changes in precipitation seasonality in Argentina. Int. J. Climatol. 2019, 40, 1716–1737. [Google Scholar] [CrossRef]
  51. Mao, Y.; Wu, G.; Xu, G.; Wang, K. Reduction in Precipitation Seasonality in China from 1960 to 2018. J. Clim. 2022, 35, 227–248. [Google Scholar] [CrossRef]
  52. Yang, L.; Feng, Q.; Wen, X.; Barzegar, R.; Adamowski, J.F.; Zhu, M.; Yin, Z. Contributions of climate, elevated atmospheric CO2 concentration and land surface changes to variation in water use efficiency in Northwest China. Catena 2022, 213, 106220. [Google Scholar] [CrossRef]
  53. Swain, S.; Mishra, S.K.; Pandey, A.; Dayal, D. Spatiotemporal assessment of precipitation variability, seasonality, and extreme characteristics over a Himalayan catchment. Theor. Appl. Climatol. 2021, 147, 817–833. [Google Scholar] [CrossRef]
  54. Koutroulis, A.G.; Tsanis, I.K.; Daliakopoulos, I.N. Seasonality of floods and their hydrometeorologic characteristics in the island of Crete. J. Hydrol. 2010, 394, 90–100. [Google Scholar] [CrossRef]
  55. Fenta, A.A.; Yasuda, H.; Shimizu, K.; Haregeweyn, N.; Kawai, T.; Sultan, D.; Ebabu, K.; Belay, A.S. Spatial distribution and temporal trends of rainfall and erosivity in the Eastern Africa region. Hydrol. Process. 2017, 31, 4555–4567. [Google Scholar] [CrossRef]
  56. Bai, L.; Shi, C.; Li, L.; Yang, Y.; Wu, J. Accuracy of CHIRPS Satellite-Rainfall Products over Mainland China. Remote Sens. 2018, 10, 362. [Google Scholar] [CrossRef] [Green Version]
  57. Liu, J.; Shangguan, D.; Liu, S.; Ding, Y.; Wang, S.; Wang, X. Evaluation and comparison of CHIRPS and MSWEP daily-precipitation products in the Qinghai-Tibet Plateau during the period of 1981–2015. Atmos. Res. 2019, 230, 104634. [Google Scholar] [CrossRef]
  58. Schmocker, J.; Liniger, H.P.; Ngeru, J.N.; Brugnara, Y.; Auchmann, R.; Brönnimann, S. Trends in mean and extreme precipitation in the Mount Kenya region from observations and reanalyses. Int. J. Climatol. 2016, 36, 1500–1514. [Google Scholar] [CrossRef] [Green Version]
  59. Marelle, L.; Myhre, G.; Steensen, B.M.; Hodnebrog, Ø.; Alterskjær, K.; Sillmann, J. Urbanization in megacities increases the frequency of extreme precipitation events far more than their intensity. Environ. Res. Lett. 2020, 15, 124072. [Google Scholar] [CrossRef]
  60. Shang, H.; Xu, M.; Zhao, F.; Tijjani, S.B. Spatial and Temporal Variations in Precipitation Amount, Frequency, Intensity, and Persistence in China, 1973–2016. J. Hydrometeorol. 2019, 20, 2215–2227. [Google Scholar] [CrossRef]
  61. Gimeno, L.; Sorí, R.; Vázquez, M.; Stojanovic, M.; Algarra, I.; Eiras-Barca, J.; Gimeno-Sotelo, L.; Nieto, R. Extreme precipitation events. WIREs Water 2022, 9, e1611. [Google Scholar] [CrossRef]
  62. Beck, H.E.; Pan, M.; Roy, T.; Weedon, G.P.; Pappenberger, F.; van Dijk, A.I.J.M.; Huffman, G.J.; Adler, R.F.; Wood, E.F. Daily evaluation of 26 precipitation datasets using Stage-IV gauge-radar data for the CONUS. Hydrol. Earth Syst. Sci. 2019, 23, 207–224. [Google Scholar] [CrossRef] [Green Version]
  63. Ma, M.; Wang, Q.; Liu, R.; Zhao, Y.; Zhang, D. Effects of climate change and human activities on vegetation coverage change in northern China considering extreme climate and time-lag and -accumulation effects. Sci. Total Environ. 2023, 860, 160527. [Google Scholar] [CrossRef] [PubMed]
Figure 1. Spatial patterns of 828 meteorological stations in eight regions and their topographic condition across the China.
Remotesensing 15 03355 g001
Figure 2. Spatiotemporal patterns and accuracy evaluations of annually accumulated precipitation (AAP) for five datasets in China from 1981 to 2020. (ae) shows spatial patterns of multi-year average precipitation (MAP) in interpolated data (IMS), CHIRPS, RERSIANN-CDR, GLDAS, and ERA5; (f) is a comparison of MAP between four products and meteorological stations. The black solid line is 1:1 line. The colored dots represent pixel values corresponding to meteorological stations. The colored solid lines represent linear regression fitting line and the gray area outside colored solid lines represents confidence interval of fitting value; (g) displays temporal variations of AAP for meteorological stations (SID), CHIRPS, RERSIANN-CDR, GLDAS, and ERA5; (h) reveals averages of MAP in China and eight regions for the interpolated data (IMS), CHIRPS, RERSIANN-CDR, GLDAS, and ERA5; r, RB, and RMSE of AAP for four precipitation products are exhibited in (ik), respectively.
Remotesensing 15 03355 g002
Figure 3. Spatial patterns of annual trends of annual accumulated precipitation (AAP) in interpolated data (IMS), CHIRPS, RERSIANN-CDR, GLDAS, and ERA5 in China from 1981 to 2020. The colored dots (a) for meteorological stations and black slash lines (be) for pixels indicate locations where trends are statistically significant at the 95% confidence level by the Mann–Kendall test.
Remotesensing 15 03355 g003
Figure 4. Spatiotemporal pattern and accuracy evaluation of seasonality index (SI) for five datasets in China from 1981 to 2020. (ae) shows spatial pattern of multi-year average SI (SIMA) in interpolated data (IMS), CHIRPS, RERSIANN-CDR, GLDAS, and ERA5; (f) is a comparison of SIMA between four products and meteorological stations. The black solid line is 1:1 line. The colored dots represent pixel values corresponding to meteorological stations. The colored solid lines represent linear regression fitting line and the gray area outside colored solid lines represent the confidence interval of fitting value; (g) displays temporal variation of SI for meteorological stations (SID), CHIRPS, RERSIANN-CDR, GLDAS, and ERA5; (h) reveals average of SIMA for interpolated data (IMS), CHIRPS, RERSIANN-CDR, GLDAS, and ERA5 in China and eight regions; r, RB, and RMSE of SI for four precipitation products are exhibited in (ik), respectively.
Remotesensing 15 03355 g004
Figure 5. Spatial patterns of seasonality index (SI) trends in interpolated data (IMS), CHIRPS, RERSIANN-CDR, GLDAS, and ERA5 in China from 1981 to 2020. The colored dots (a) for meteorological stations and black slash lines (b–e) for pixels indicate locations where trends are statistically significant at the 95% confidence level by Mann–Kendall test.
Remotesensing 15 03355 g005
Figure 6. Spatiotemporal pattern and accuracy evaluation of daily precipitation frequency (fP) for five datasets in China from 1981 to 2020. (ae) shows spatial pattern of multi-year average of daily precipitation frequency (fPMA) in interpolated data (IMS), CHIRPS, RERSIANN-CDR, GLDAS, and ERA5; (f) is comparison of fPMA between four products and meteorological stations. The black solid line is 1:1 line. The colored dots represent pixel values corresponding to meteorological stations. The colored solid lines represent linear regression fitting line and the gray area outside colored solid lines represent confidence interval of fitting value; (g) displays temporal variation of fP for meteorological stations (SID), CHIRPS, RERSIANN-CDR, GLDAS, and ERA5; (h) reveals average of fPMA for interpolated data (IMS), CHIRPS, RERSIANN-CDR, GLDAS, and ERA5 in China and eight regions; r, RB, and RMSE of fP for four precipitation products are exhibited in (ik), respectively.
Remotesensing 15 03355 g006
Figure 7. Spatial patterns of annual trends of daily precipitation frequency (fP) in interpolated data (IMS), CHIRPS, RERSIANN-CDR, GLDAS, and ERA5 in China from 1981 to 2020. The colored dots (a) for meteorological stations and black slash lines (be) for pixels indicating locations where trends are statistically significant at the 95% confidence level by the Mann–Kendall test.
Remotesensing 15 03355 g007
Figure 8. Spatiotemporal pattern and accuracy evaluation of daily precipitation intensity (IP) for five datasets in China from 1981 to 2020. (ae) shows spatial pattern of multi-year average of daily precipitation intensity (IPMA) in interpolated data (IMS), CHIRPS, RERSIANN-CDR, GLDAS, and ERA5; (f) is the comparison of IPMA between four products and meteorological stations. The black solid line is 1:1 line. The colored dots represent pixel values corresponding to meteorological stations. The colored solid lines represent linear regression fitting line and the gray area outside colored solid lines represent confidence interval of fitting value; (g) displays temporal variation of IP for meteorological stations (SID), CHIRPS, RERSIANN-CDR, GLDAS, and ERA5; (h) reveals average of IPMA for interpolated data (IMS), CHIRPS, RERSIANN-CDR, GLDAS, and ERA5 in China and eight regions; r, RB, and RMSE of IP for four precipitation products exhibit in (ik), respectively.
Remotesensing 15 03355 g008
Figure 9. Spatial patterns of annual trends of daily precipitation intensity (IP) in interpolated data (IMS), CHIRPS, RERSIANN-CDR, GLDAS, and ERA5 in China from 1981 to 2020. The colored dots (a) for meteorological stations and black slash lines (be) for pixels indicate locations where trends are statistically significant at the 95% confidence level by the Mann–Kendall test.
Remotesensing 15 03355 g009
Table 1. Characteristics of the used-gridded precipitation products.
DatasetCategoryPeriodResolutionFrequencyCoverage
CHIRPS V2.0Remote Sensing1981–present0.05 × 0.05Daily50°S–50°N, land
PERSIANN-CDRRemote Sensing1983–present0.25 × 0.25Daily60°S–60°N
ERA5-LAND HourlyReanalysis1950–present0.1 × 0.1HourlyGlobal
GLDAS_NOAH025_3H 2.0Reanalysis1948–20140.25 × 0.253HourGlobal, land
GLDAS_NOAH025_3H 2.1Reanalysis2000–present0.25 × 0.253HourGlobal, land
Table 2. Classification and connotation in seasonality index.
S I ¯ Class Range Rainfall Regime
[0–0.19)Very equable
[0.20–0.39)Equable but with a definite wetter season
[0.40–0.59)Rather seasonal with a short drier season
[0.60–0.79)Seasonal
[0.80–0.99)Markedly seasonal with a long drier season
[1.00–1.19)Most rain in 3 months or less
[1.20–1.83)Extreme, almost all rain in 1–2 months
Note: revised from [42].
Table 3. Formula and characteristic values of the used statistical indices.
Statistic MetricsFormulaValues RangePerfect ValueUnit
Bias B i a s = S G / G × 100 % [−∞,+∞]0%
r r = i = 1 n ( G i G ¯ ) ( S i S ¯ ) / i = 1 n ( G i G ¯ ) 2 i = 1 n ( S i S ¯ ) 2 [−1,1]1N/A
RE R E = i = 1 n S i G i / i = 1 n G i [−∞,+∞]0N/A
RMSE R M S E = i = 1 n ( S i G i ) 2 / n [0,+∞]0mm
Note: G and S are multi-year mean value of precipitation traits of interpolated precipitation and four products from 1981 to 2020, respectively; G i and S i represent value of annual precipitation traits from meteorological station data and precipitation products at station i ; G i ¯ and S i ¯ represent multi-year mean value of precipitation traits from meteorological station data and precipitation products during the period of 1981–2020, respectively; n is the total numbers of meteorological stations.
Disclaimer/Publisher’s Note: The statements, opinions and data contained in all publications are solely those of the individual author(s) and contributor(s) and not of MDPI and/or the editor(s). MDPI and/or the editor(s) disclaim responsibility for any injury to people or property resulting from any ideas, methods, instructions or products referred to in the content.