Article

Estimation of the Seawater Lidar Ratio by MODIS: Spatial–Temporal Characteristics and Ecological Significance

Ningbo Innovation Center, State Key Laboratory of Modern Optical Instrumentation, College of Optical Science and Engineering, Zhejiang University, Hangzhou 310027, China
*
Author to whom correspondence should be addressed.
Remote Sens. 2023, 15(13), 3328; https://doi.org/10.3390/rs15133328
Submission received: 17 May 2023 / Revised: 22 June 2023 / Accepted: 25 June 2023 / Published: 29 June 2023

Abstract

:
The lidar ratio of seawater is an essential quantity related to both lidar retrieval and water constituent. However, few studies discuss its spatial–temporal characteristics and ecological significance, which limits its applications in lidar remote sensing and marine science. This paper investigates the spatial–temporal characteristics and ecological significance of the lidar ratio of seawater using satellite passive remote sensing, which is validated by in situ measurements. Spatially, nearshore lidar ratio values are higher than offshore, mainly owing to the high concentration of colored dissolved organic matter in nearshore water. Temporally, the lidar ratio in each hemisphere exhibits lower values in summer than in winter due to the annual boom–bust cycle of phytoplankton. Furthermore, the variability patterns of the lidar ratio are nearly consistent with those of the chlorophyll-to-carbon ratio, implying the high ecological significance of phytoplankton physiology. These findings will provide the foundation for the application of lidar ratio in marine science and lidar remote sensing.

1. Introduction

As an active optical remote sensing technique, lidar can detect depth-resolved seawater optical properties day and night [1,2,3], offering distinct advantages for ocean observation [4]. Lidar remote sensing can obtain both backscatter and attenuation from seawater. Gradually, the seawater lidar attenuation-to-backscatter ratio except in pure water becomes an essential quantity, that is [5],
S p = α p β p ( π ) ,
where αp is the seawater lidar attenuation coefficient except in pure water, βp(π) is the particulate volume scattering function at a scattering angle of π radians. The importance of lidar ratio is mainly reflected in aspects of interpreting oceanic lidar signals and indicating water properties. Specifically, the ill-posed nature of elastic backscatter lidar retrievals that infer attenuation and backscatter from a single lidar equation needs an assumed lidar ratio [6]. Moreover, the lidar ratio could reveal water characteristics, inferring some important ecological proxies of chlorophyll-to-particulate backscattering [7] and chlorophyll-to-carbon ratio [8], which are important for assessing ocean productivity and classifying phytoplankton species [9]. Therefore, the estimation of the lidar ratio will provide benefits for both lidar remote sensing and marine science.
The lidar ratio has been extensively investigated and successfully applied in the atmosphere, such as in classifying atmospheric layers and offering layer information for lidar retrieval [10,11]. The research on the lidar ratio in the ocean is in its early stages. Churnside stated that the lidar ratio can be calculated using the chlorophyll concentration and well-known properties of pure seawater in Case 1 water [12]. High-spectral-resolution lidar (HSRL) can provide accurate measurements of the seawater lidar ratio [7,13,14,15]. Similarly, the chlorophyll-to-particulate backscattering ratio can be proxied by the lidar ratio, and variations in this ratio have been shown to be caused by changes in phytoplankton community composition [16]. Few studies, however, have explored the spatial–temporal distribution and ecological significance of the seawater lidar ratio, restricting its applications in lidar remote sensing and marine science.
Here we calculate the global seawater lidar ratio using satellite passive remote sensing data from the Moderate Resolution Imaging Spectroradiometer (MODIS). The MODIS lidar ratio is found to be highly correlated with in situ measurements. Furthermore, this paper explores the temporal–spatial distribution of lidar ratio and its ecological significance.

2. Data and Methods

2.1. Field and Satellite Data

The lidar ratios were calculated by both MODIS satellite ocean color products and field data. Products a and bb from MODIS Level 3 in the generalized inherent optical properties (GIOP) model were used. The implementation of algorithms for MODIS acquisition of a and bb products is quite specifically and clearly explained in a product manual on the OceanColor website (https://oceancolor.gsfc.nasa.gov/atbd/giop/ (accessed on 17 June 2022)).
The field data a and bb were from the SeaBass website (https://seabass.gsfc.nasa.gov/ (accessed on 11 December 2022)) gathered during the TaraPacific cruise (5 November 2016–16 February 2017, and 1 May–3 September 2017) [17], the Tara Microbiome cruise (26 December 2020–5 February 2021) [18], the North Atlantic Aerosols and Marine Ecosystems Study (NAAMES) cruise (6–30 November 2015) [19], and the EXport Processes in the Ocean from Remote Sensing (EXPORTS) cruise (2–31 May 2021) [20]. However, the various data sources utilized in this article have different spatial and temporal resolutions, which contributes to matchup discrepancies. As a result, the data match is regarded as successful when the discrepancy in latitude and longitude between MODIS and field data is less than 0.05°.

2.2. Calculation of the Lidar Ratio

In Equation (1), numerator αp and denominator βp(π) are needed to calculate the seawater lidar ratio Sp. αp can be approximated as the difference between diffuse attenuation coefficient Kd and water diffuse attenuation coefficient Kdw [21]. In this article, we considered the value of Kdw to be 0.0452 m−1 [12]. Kd can be estimated from total absorption coefficient a and backscattering coefficient bb [22], that is,
K d = a + 4.18 b b [ 1 0.52 exp ( 10.8 a ) ] .
The next step is to determine the value of the denominator βp(π), and it has the following relationship with bb [23]:
β p ( π ) = b b b bw 2 π χ ( π ) ,
where bbw is the backscattering of pure sea water and χ(π) is the conversion factor that relates to βp(π) and bbp [24]. The value of χ(π) in Equation (3) is uncertain. Some previous studies report it was approximately 1.43 [23,25], while others hold it was 1.06 [12,26,27,28,29]. In this essay, we utilize bbw of 8.5 × 10⁻⁴ m−1 [30] and χ(π) of 1 [7].

3. Results

3.1. Consistency Check

The MODIS lidar ratio values were compared with in situ measurements to assess their reliability. The ship tracks were scattered across the Pacific and Atlantic areas over the five in situ measurement missions (Figure 1a). Then, the results were analyzed in Figure 1b. Since error evaluations can improve the credibility, accuracy, and validity of data analysis, and multiple error evaluation methods can provide more criteria for better comparison than correlation analysis, error evaluation is chosen in this article to provide a realistic and comprehensive view of MODIS performance. RMSRE (root mean square relative error), MAPE (mean absolute percentage error), MAE (mean absolute error), and RMSE (root mean square error) are utilized here for error assessment. Generally, all matched results showed good agreement (Figure 1b, RMSRE = 47.0%, MAPE = 29.5%, MAE = 11.2 sr, RMSE = 16.3 sr). There are some outliers in both data sets, which could be attributed to the differences in spatial and temporal resolutions of MODIS and field data. However, the majority of the scatter points fall on both sides of the 1:1 line, indicating that there is a noteworthy linear association between the data sets. Simultaneously, low values of RMSRE and MAPE show that the deviation between in situ and MODIS results are within permissible limits. Lower values of MAE and RMSE also suggest a more concentrated spread of data sets with fewer outliers.
As shown in Figure 2a–e, the RMSRE of the lidar ratio between the MODIS and in situ measurements ranges from 15.1 to 59.3%. Among the five validations, the EXPORTS comparison has the lowest RMSRE at 15.1%, and its scatter plot is also evenly distributed on both sides of the 1:1 line (Figure 1b). In addition, the two TaraPacific cruises measurements are broadly consistent with MODIS products trending with longitude, with smaller RMSRE, at 38.8% and 38.5%. However, the RMSRE of the Tara Microbiome and NAAMES comparisons are much larger, and certain routes also show larger MODIS products. It is possible that some of the above routes are near shore, where small-scale marine biochemical reactions occur, resulting in an increase in colored dissolved organic matter (CDOM) and a drop in particulate matter. Overall, MODIS data is within an acceptable margin of error from field data across a significant temporal and spatial range, demonstrating the capacity of calculating the lidar ratio from the satellite passive remote sensing.

3.2. Spatial Distribution

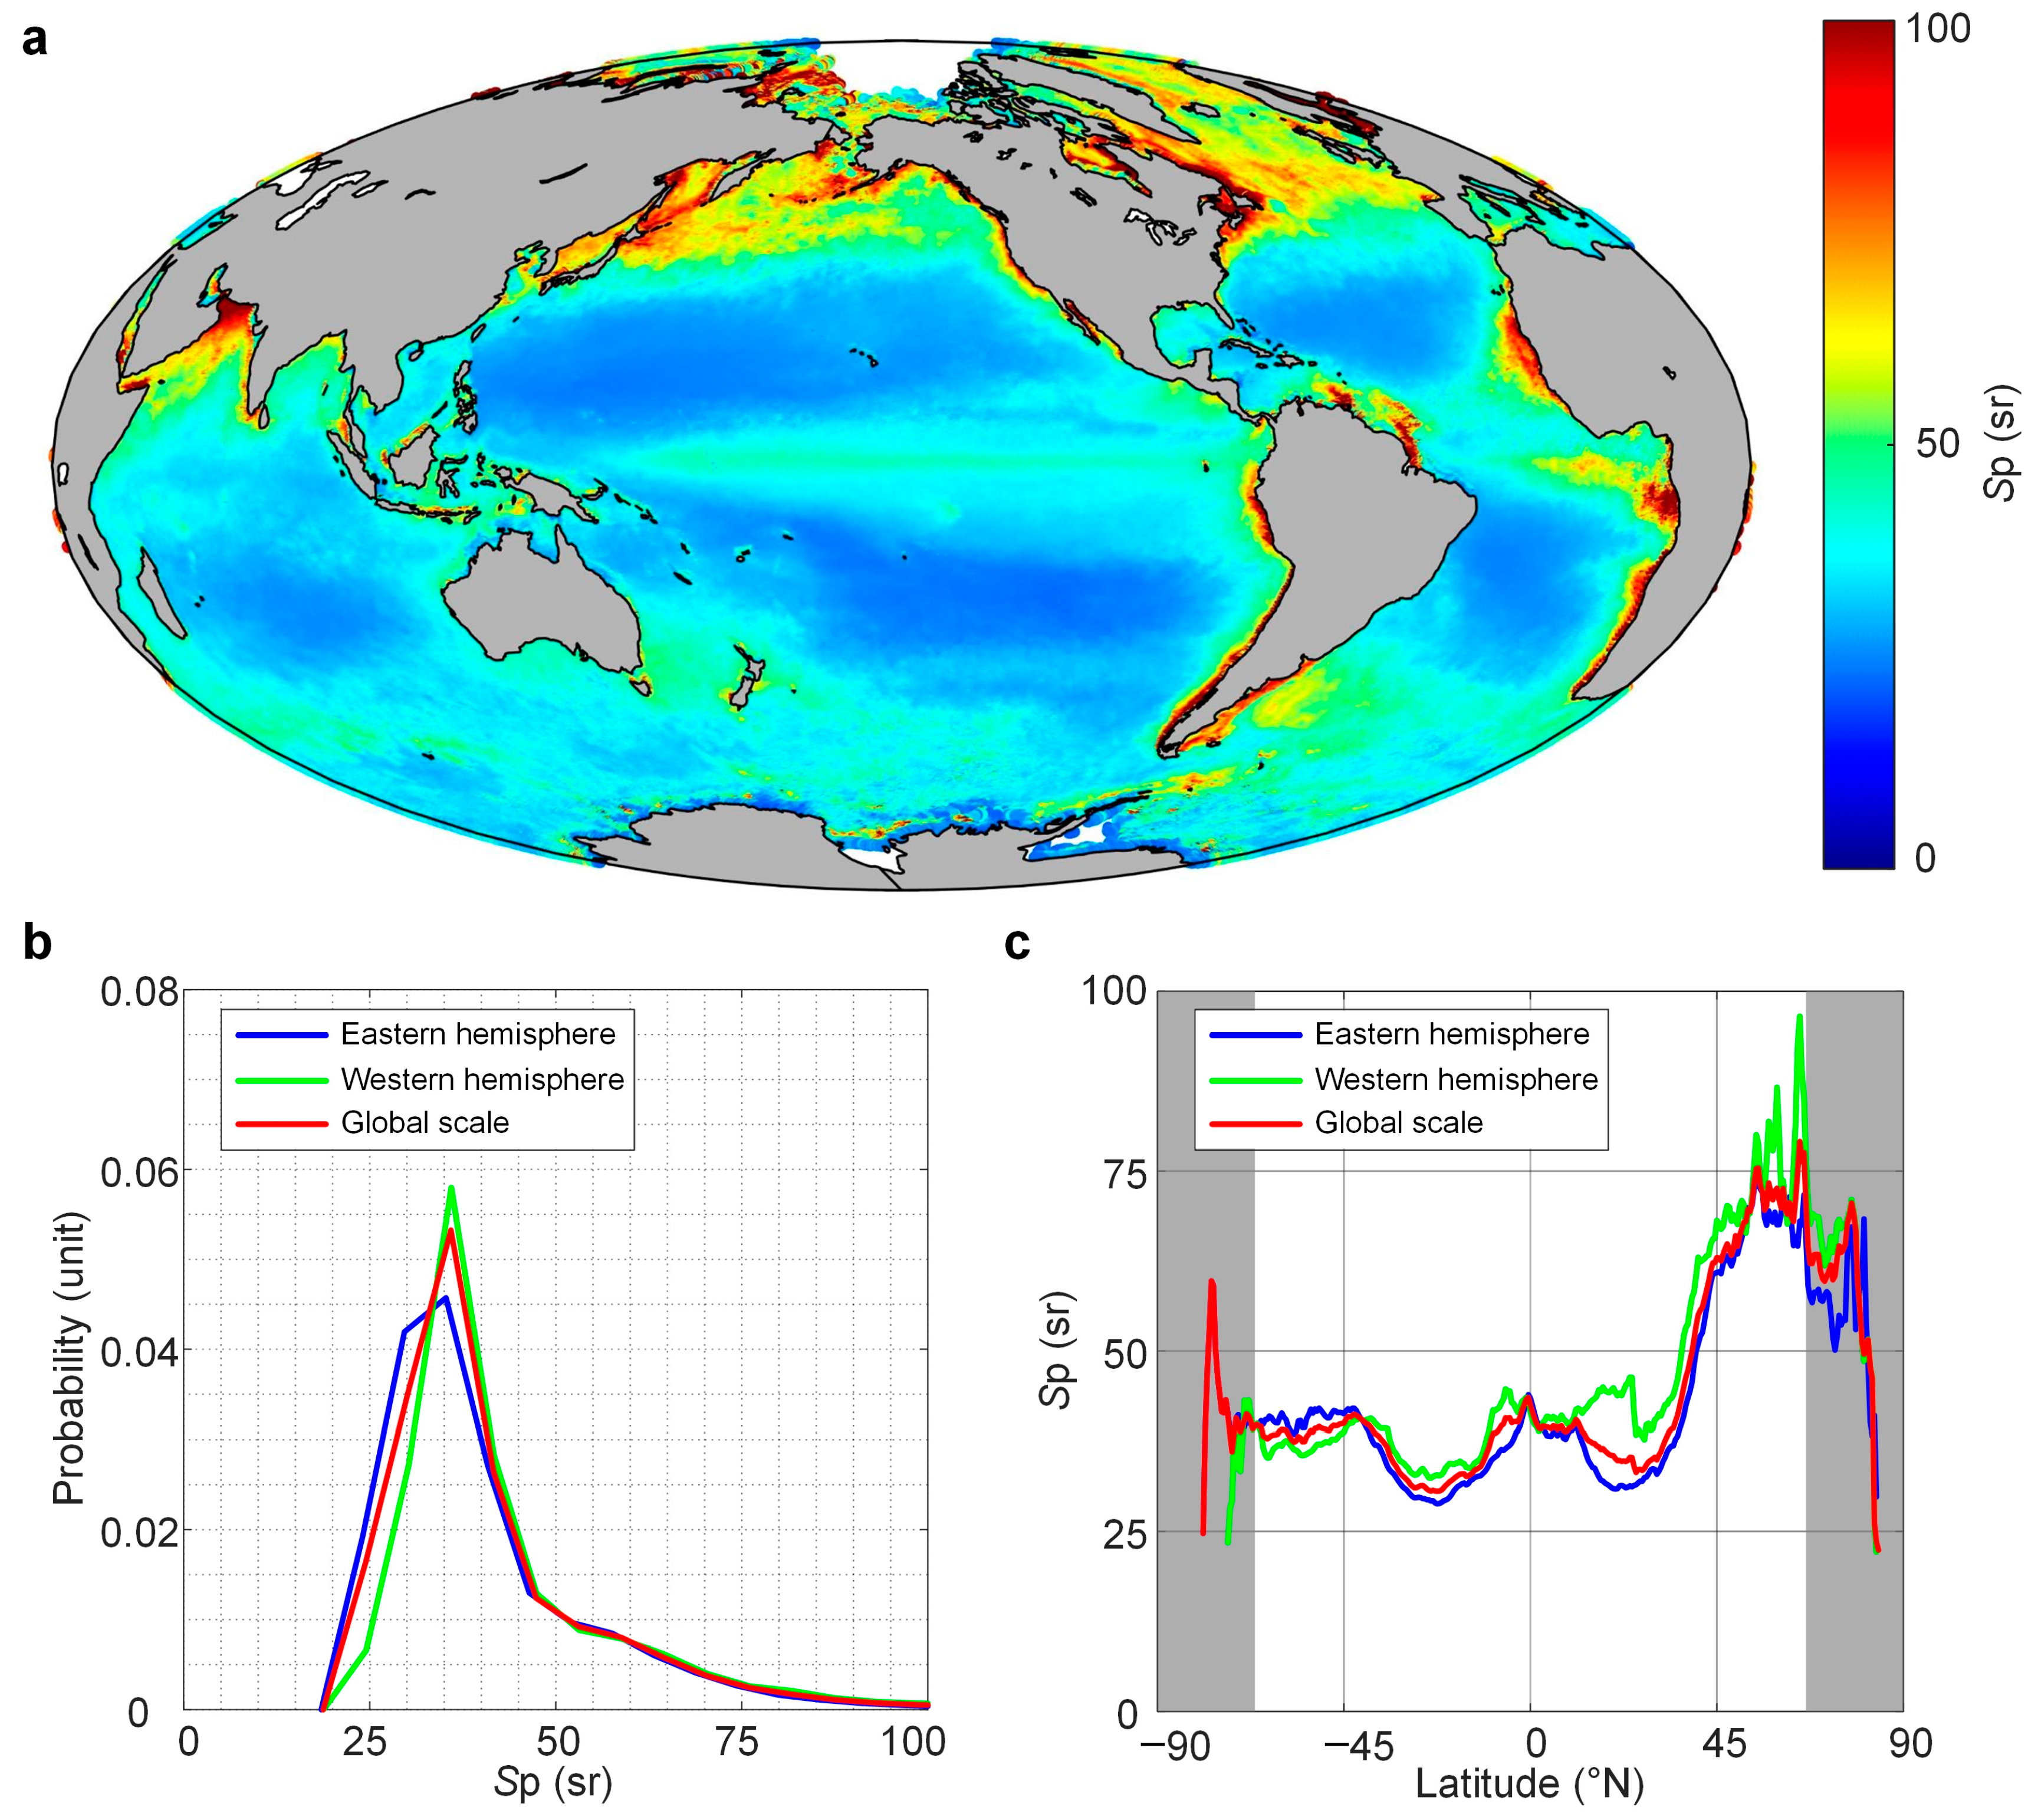
The global seawater lidar ratio was derived from MODIS in 2021, as shown in Figure 3a. The lidar ratio was mostly around 40 sr and tended to be stable (Figure 3a,b, red lines). The high values of the lidar ratio were typically found near shore due to the high concentration of CDOM. Nevertheless, there were other reasons that might contribute to this circumstance. For example, extremely low oxygen content within the seawater [31] and fewer phytoplankton lead to an elevated lidar ratio in the Arabian Sea region. Additionally, the Cape Verde basin and Angora basin areas have anomalously low values in phytoplankton biomass [32], resulting in an exceptionally high lidar ratio. However, several nearshore sites, such as the Arafura Sea and the Timor Sea, showed relatively low values of lidar ratio owing to the high concentration of suspended sediment caused by anthropogenic activities and river input. Furthermore, Figure 3 shows that the values of the lidar ratio were lower in the southern hemisphere than in the northern hemisphere, which could be driven on by a decrease in phytoplankton stocks [33,34] as a result of higher water temperatures in the northern hemisphere [35] and the presence of more coccolithophores zones in the Southern hemisphere [36].
Moreover, persistent cloud cover, periods of constant night [37], and large glaciers in polar regions severely limit MODIS measurements and leave large areas unobserved for many months. MODIS can only collect data during warmer months with more phytoplankton, resulting in lower values of the lidar ratio in polar regions (Figure 3c, shaded areas). Patchy blooms in the Southern Ocean were also reflected in the lidar ratio and correspond to varying sources of surface iron [38]. The distributions of lidar ratio in the eastern and western hemispheres were similar (Figure 3c, blue and green lines). Furthermore, due to warmer sea surface temperatures [39] and fewer phytoplankton [33,34] in the western oceans, the lidar ratio was slightly higher than those in the east (Figure 3b, blue and green lines, average values of the lidar ratio in the western and eastern hemispheres are 43.57 sr and 41.01 sr, respectively).
These findings indicated some distinct and intriguing characteristics in the world-wide distribution of the lidar ratio, which gives data support for the lidar ratio in areas of varying latitudes. Some variations in the distribution of the lidar ratio indirectly coincided with changes to the distribution of suspended sediment concentration, water oxygen [31], phytoplankton biomass [32], surface iron [38], and water surface temperature [39] in global waters.

3.3. Temporal Distribution

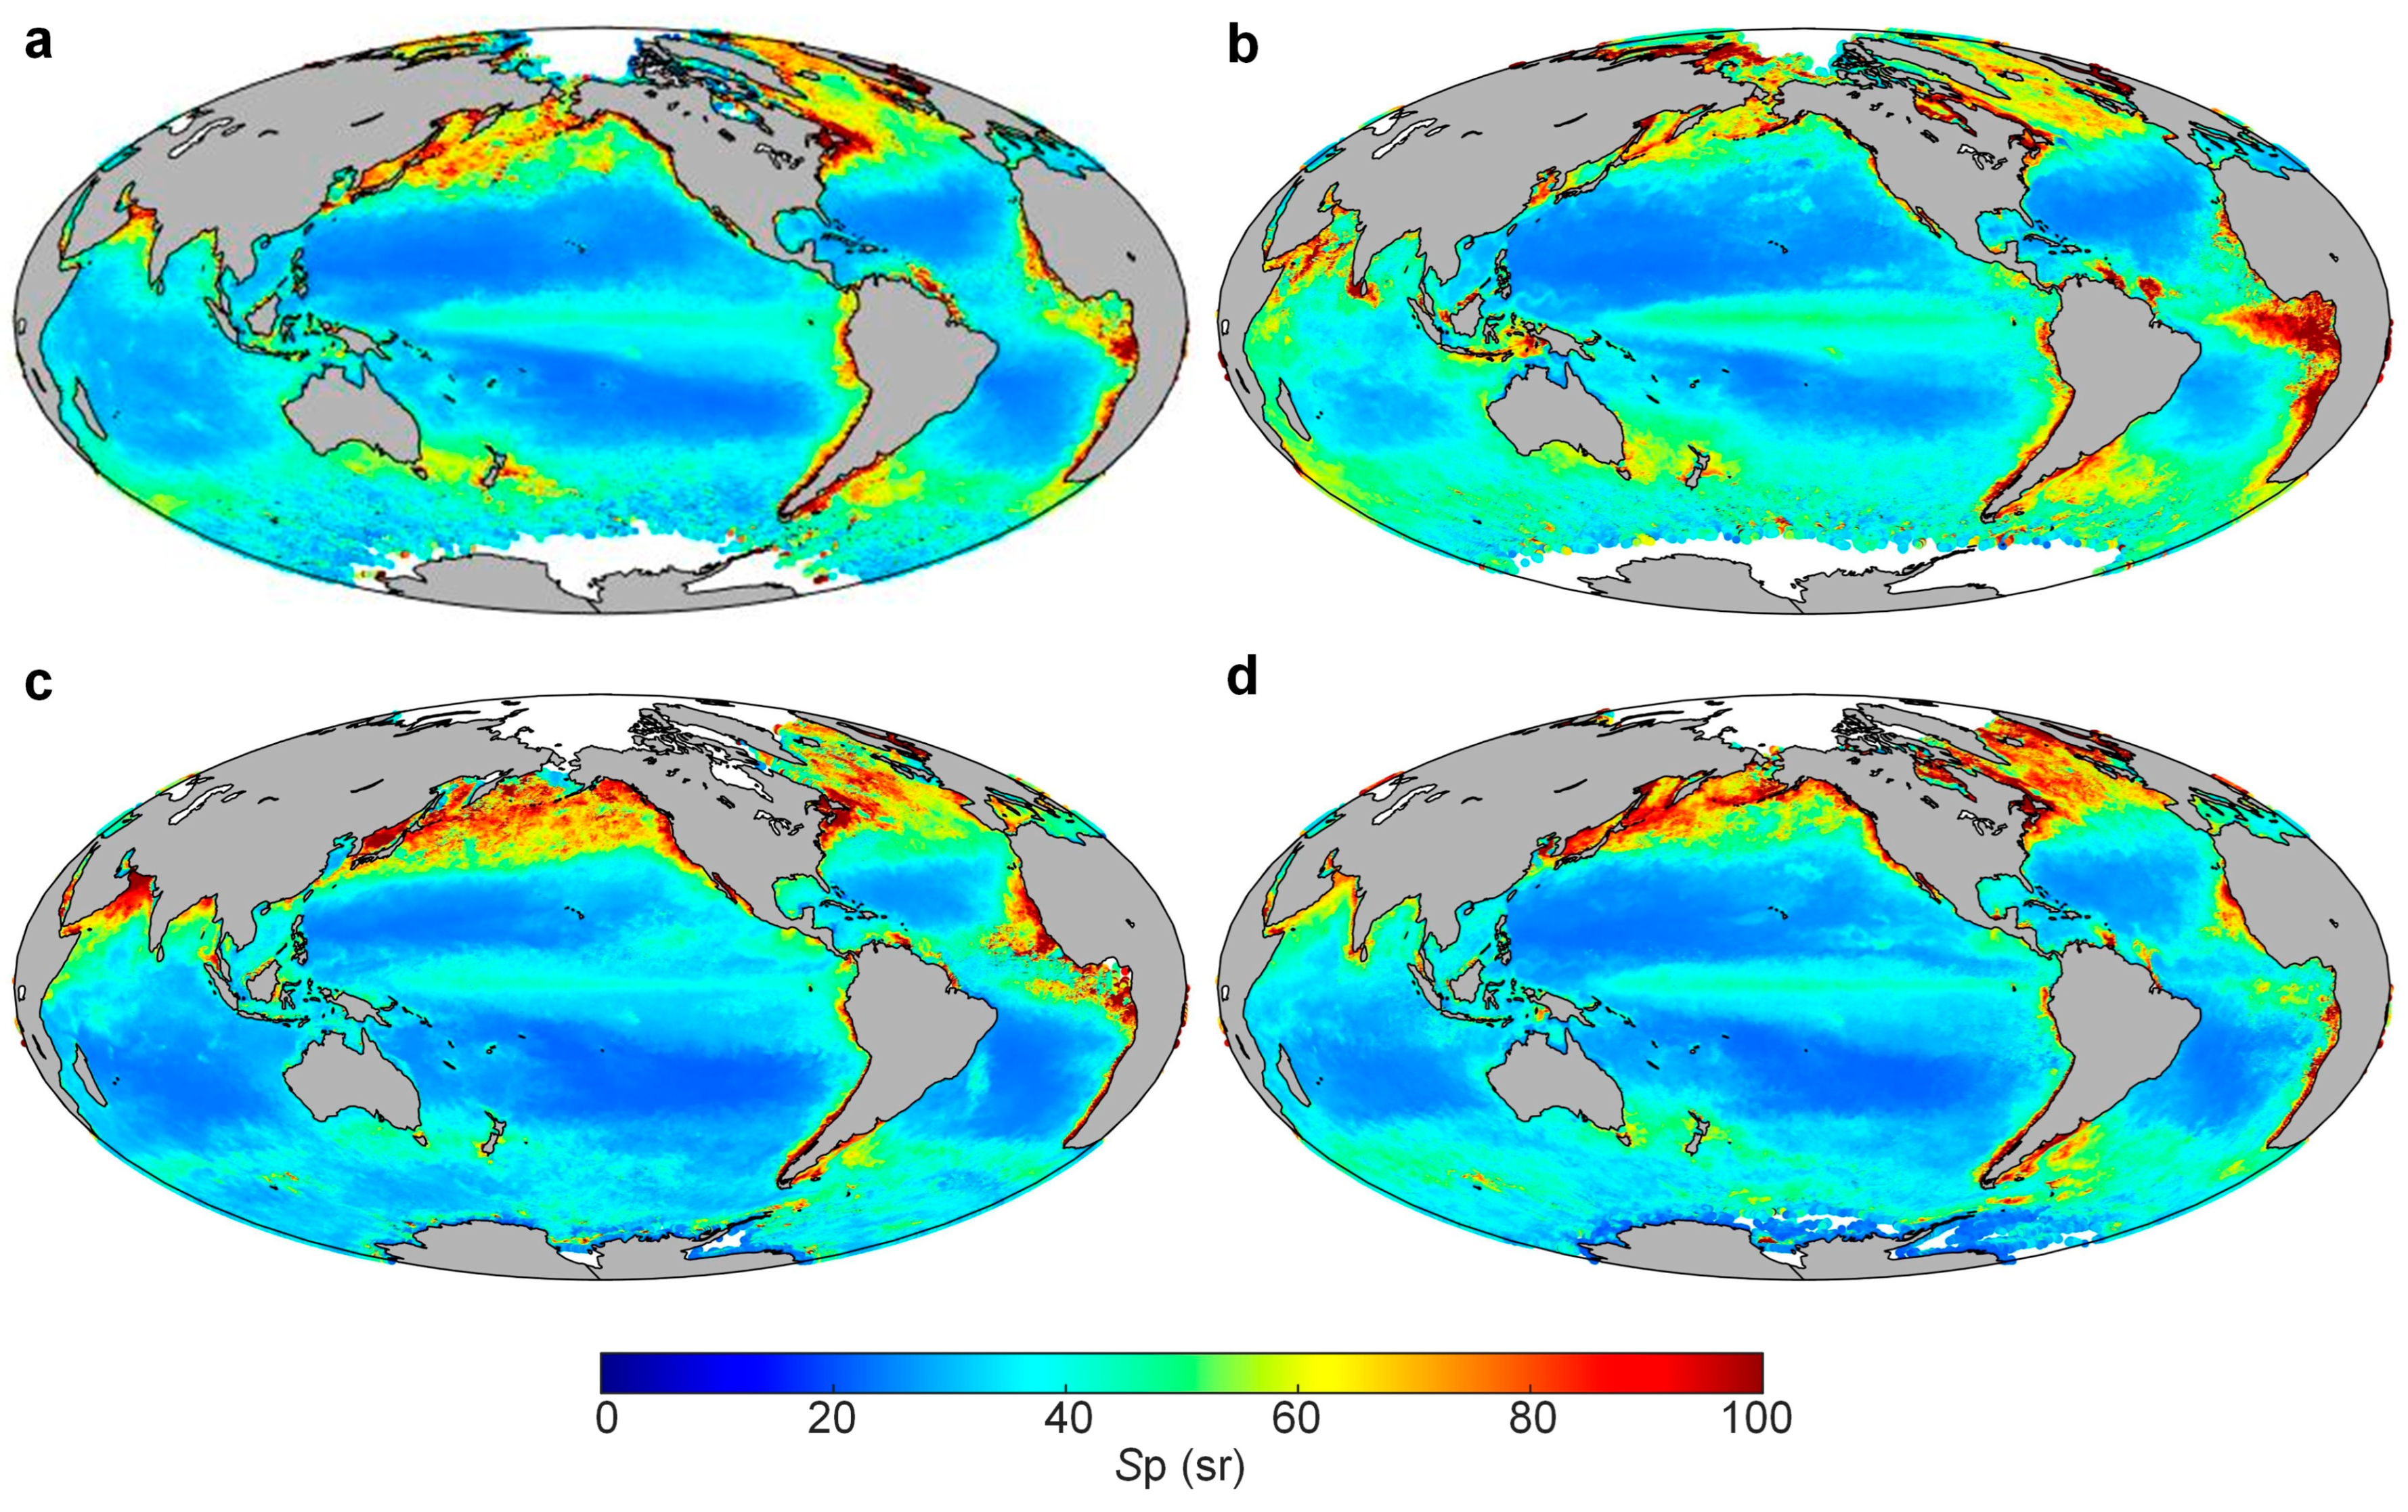
We showed the temporal distributions of the lidar ratio in Figure 4 using MODIS seasonal average data in 2021. Over most of the permanently stratified ocean (roughly between 40°N and 40°S latitudes) [37], the lidar ratio was relatively low and stable over the annual cycle. At high latitudes where physical processes significantly disturb ecosystem balances [37], strong seasonal cycles in the lidar ratio can be observed, such as high values during boreal winter in the northern hemisphere and high values during boreal summer in the southern hemisphere. Iron supply exerts control on the dynamics of plankton blooms in the Southern Ocean [40]; patchy blooms in this area were also reflected in the lidar ratio and correspond to varying sources of surface iron [38]. In the western subarctic Pacific, a mesoscale iron enrichment induced a large centric diatom bloom [41], which causes a decrease in the lidar ratio all year. With the massive sinking of centric diatom cells or resting spores at the end of the bloom [41], the lidar ratio consequently rose.
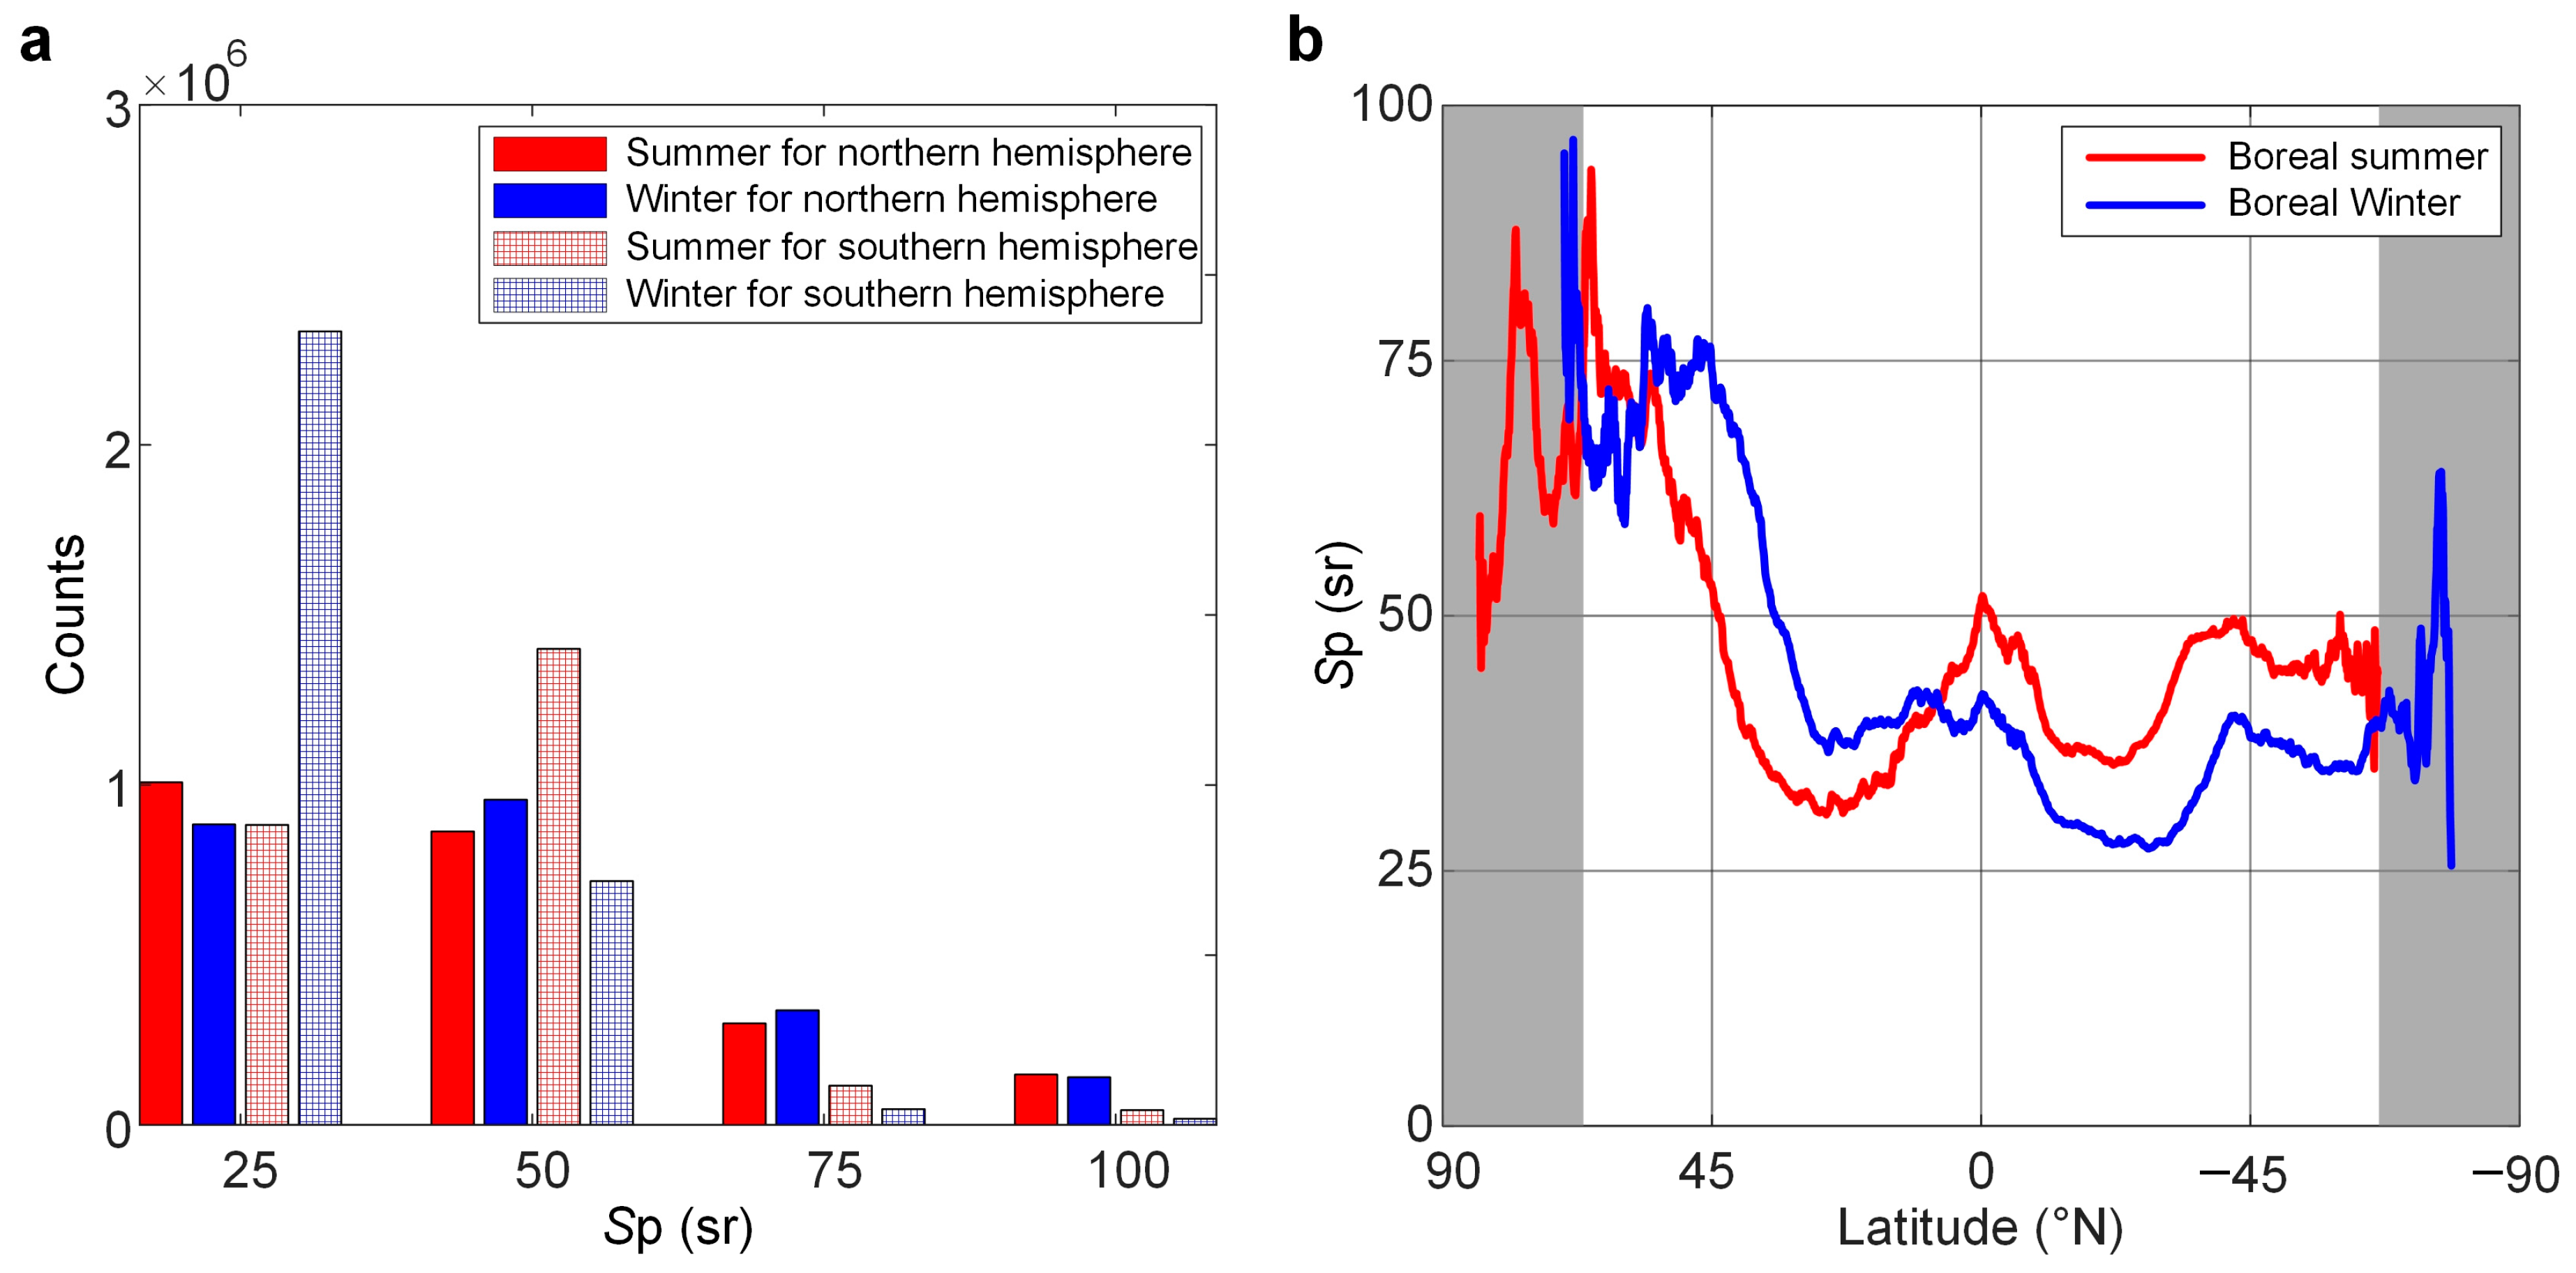
In the southern hemisphere, the lidar ratio decreased from boreal summer to winter, and its plurality changed from 50 to 25 (Figure 5a, red and blue dashed columns). The pattern of change in the southern hemisphere was different from that in the northern hemisphere (Figure 5a, red and blue columns), with a rising lidar ratio on one side and a falling lidar ratio on the other (Figure 5b, red and blue lines). The lidar ratio was seasonal at higher northern and southern latitudes (Figure 5b, the gray-shaded areas), similar to the mixed layer phytoplankton growth rates [32] and the plankton stocks [38]. At the same time, in the boreal winter and boreal summer at latitudes of 45°N to 45°S, the lidar ratio also varies greatly. This may be because when the summer weather becomes warmer and the sea surface temperature rises, the phytoplankton and lidar ratio decreases. Conversely, the phytoplankton and lidar ratio rose during the winter when sea surface temperatures were the coldest [33,34].

3.4. Lidar Ratio in the North Indian OceanIndian Ocean

The lidar ratio in the North Indian Ocean had distinctive temporal and spatial characteristics that are worth investigating due to the unique geo-climatic characteristics of this region. The findings of these studies may also be used in usual experiments. The following purposeful evaluation was carried out on the lidar ratio of the North Indian Ocean regions.
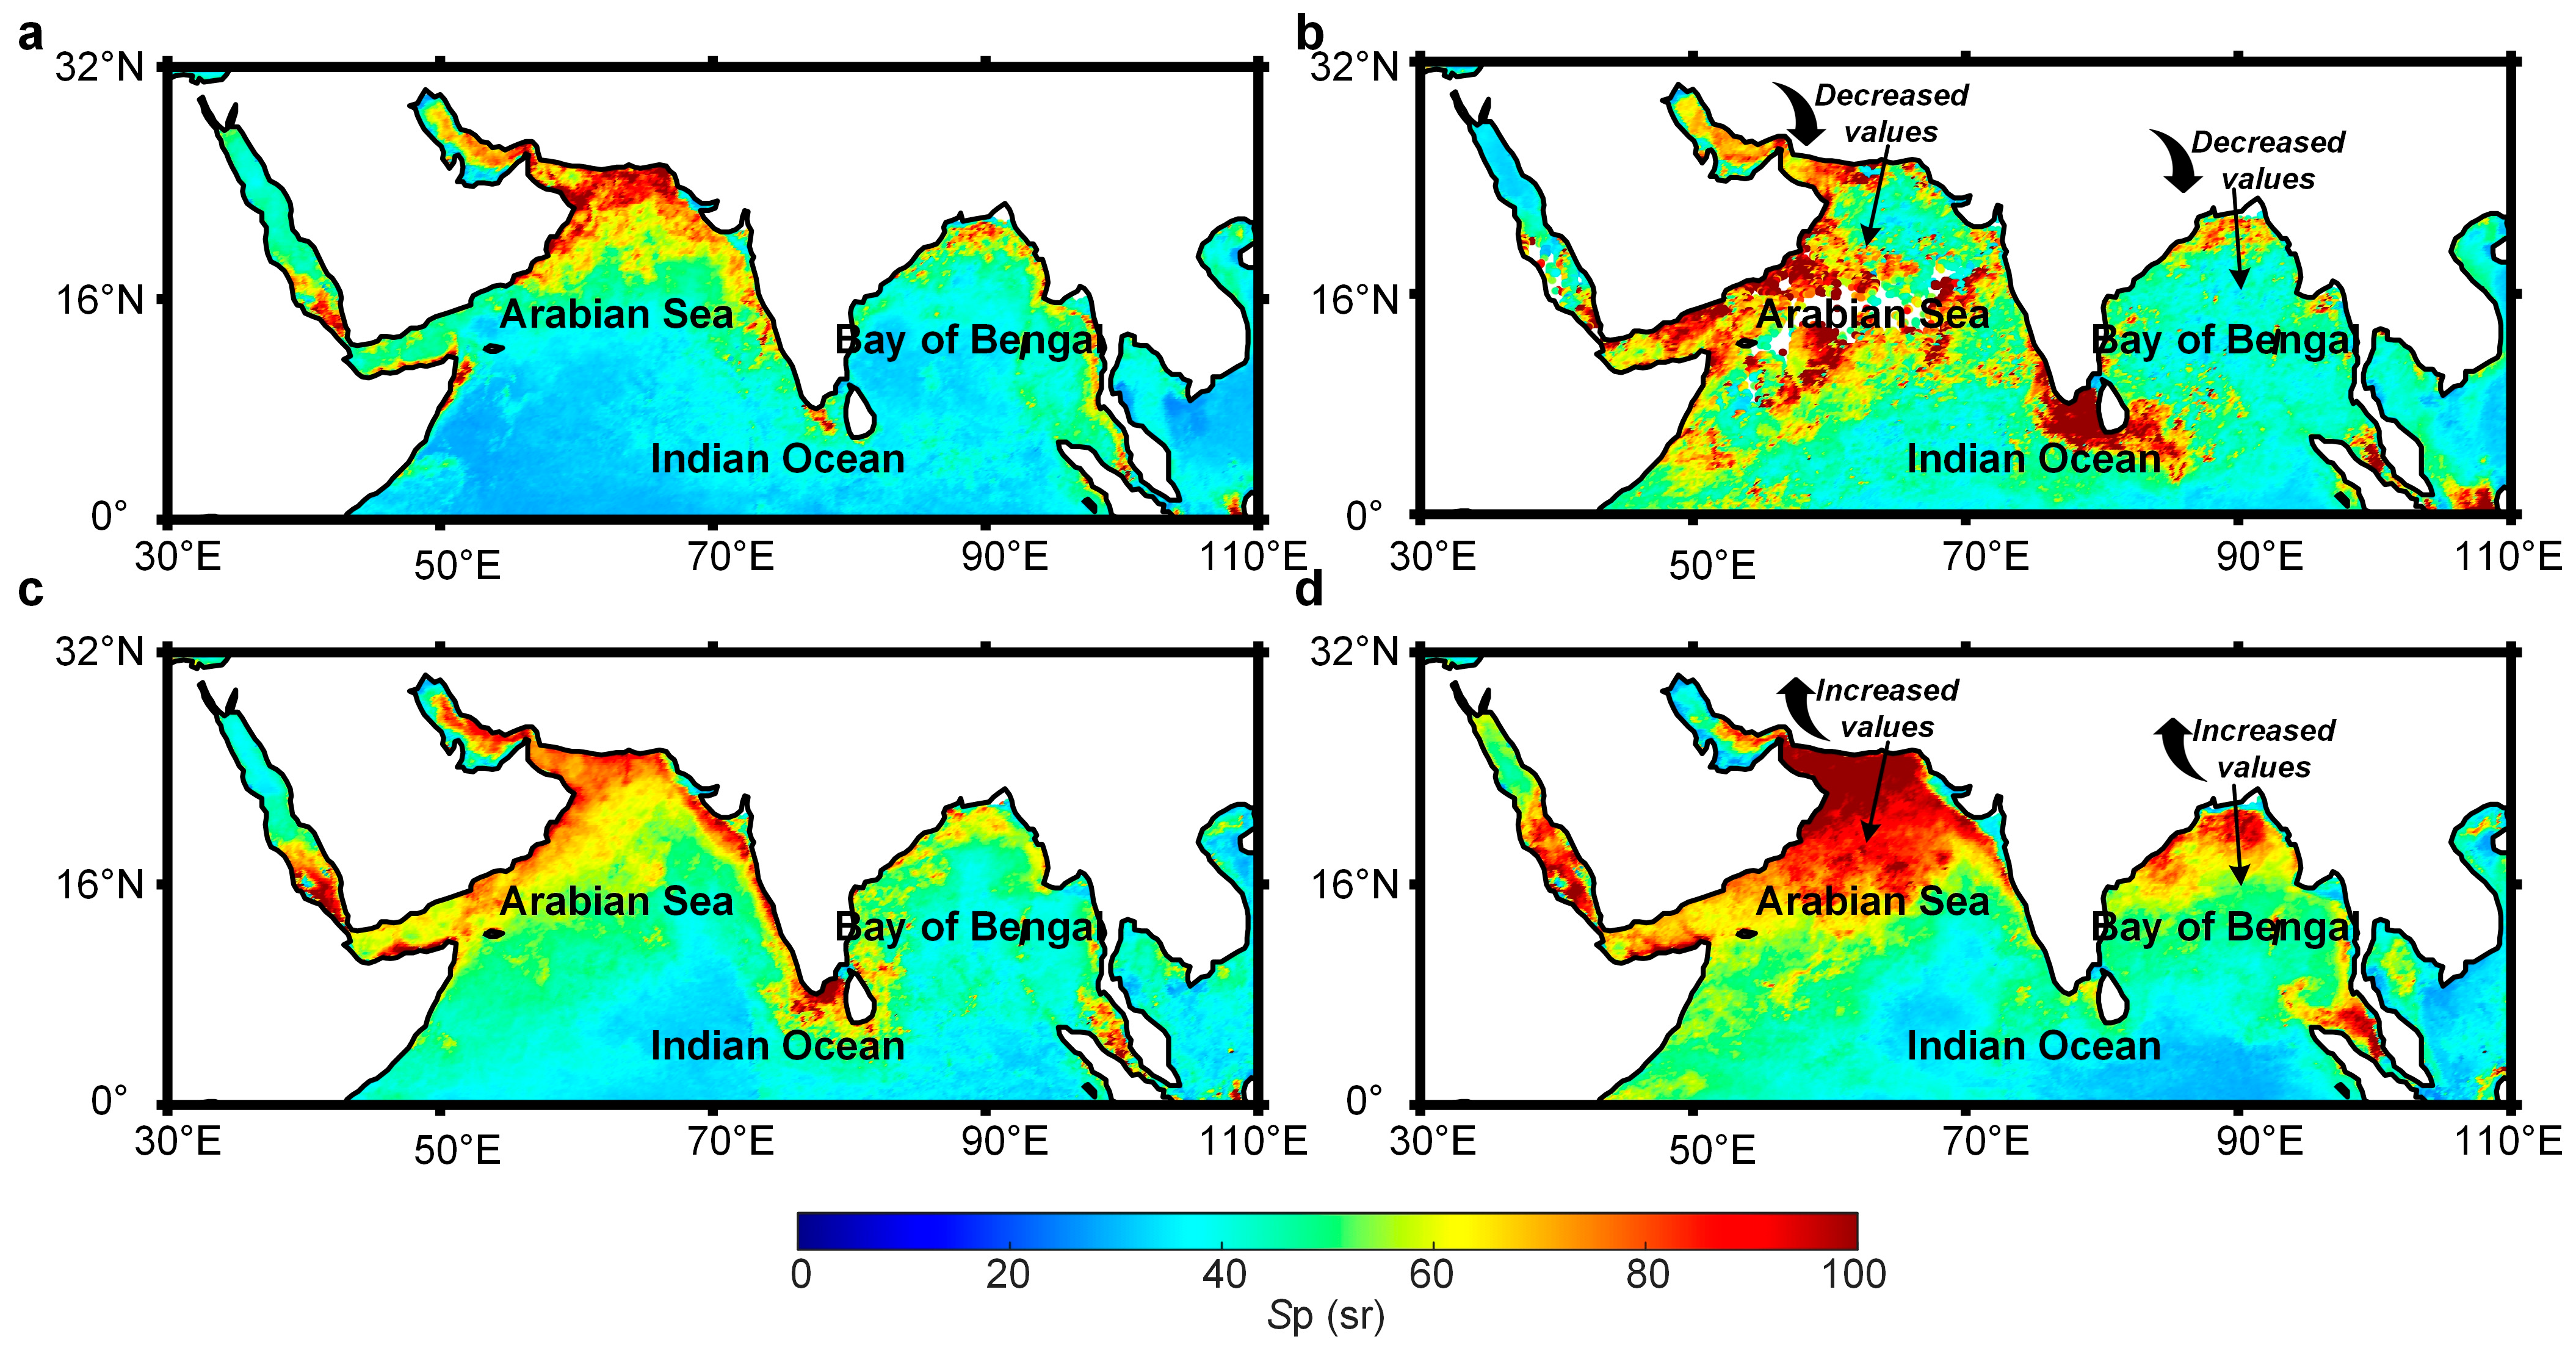
The seawater lidar ratio in the North Indian Ocean was derived from MODIS in 2021, as shown in Figure 6. In the general case, the nearshore values of lidar ratio in the North Indian Ocean were relatively high. Furthermore, the lidar ratio was higher in the western region than in the eastern region. On the one hand, the existence of the oxygen minimum zone in the Arabian Sea [31] led to a drop in phytoplankton and hence a higher lidar ratio. On the other hand, the biological productivity of the Arabian Sea was high due to upwelling caused by the semi-annual monsoons [42], which resulted in a large amount of marine CDOM [43] and increased values of the lidar ratio. Another factor was that the average surface biological production in the Bay of Bengal is higher than in the Arabian Sea [44], causing a lower lidar ratio.
The seasonal changes in lidar ratio in the Northern Indian Ocean area were mostly related to the opposing tendencies in surface circulation during the boreal summer (southwest) and boreal winter (northeast) monsoons [45]. In the northern Arabian Sea during the winter monsoon, high salinity surface waters sank due to the combination of the dry and cold northeast monsoon and Ekman pumping [46], causing a wide-spread maximum salinity of Arabian waters [47]. This could result in fewer phytoplankton and a higher lidar ratio in the region (Figure 6d). Because of the persistence of mesoscale eddies throughout the year, the Bay of Bengal maintained modest chlorophyll biomass and productivity [48]. When the summer weather became warmer and the sea surface temperature rose, the phytoplankton and lidar ratio decreased (Figure 6b). However, the phytoplankton and lidar ratio rose slightly (Figure 6d) during the winter when sea surface temperatures were the coldest [33,34].

3.5. Comparison with Chl/C

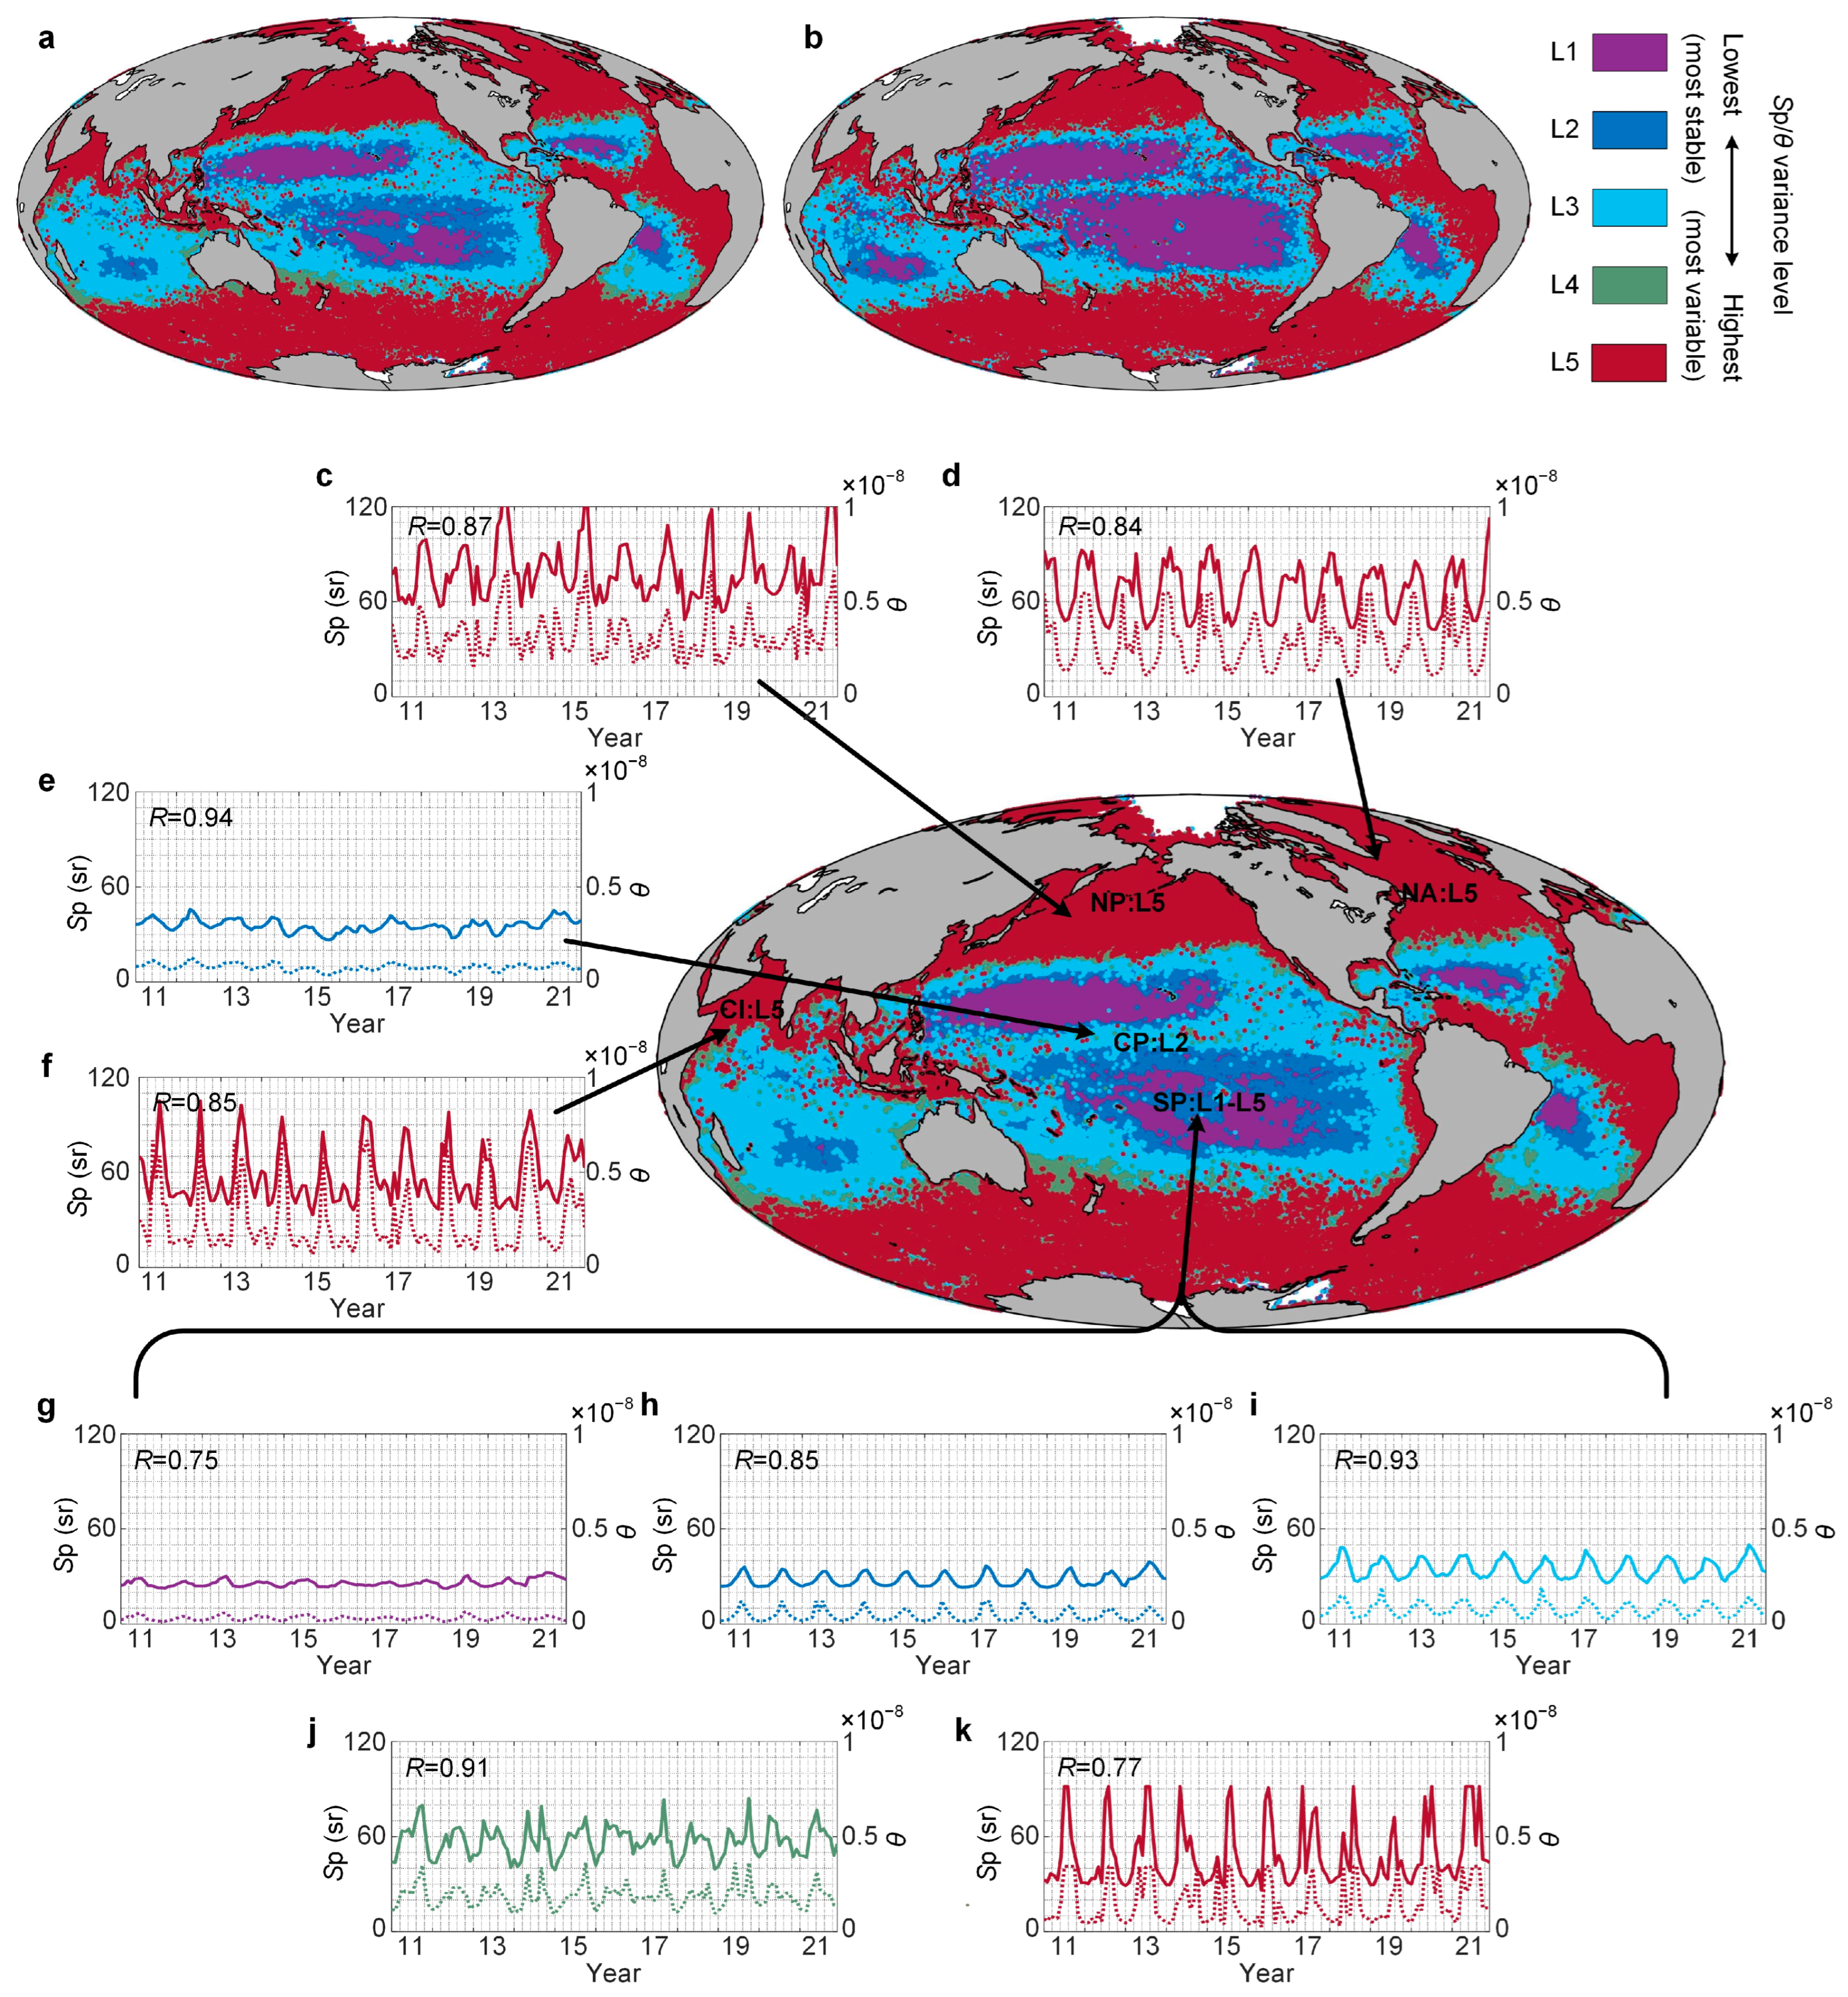
The 11-year record of MODIS monthly lidar ratio (Sp) and chlorophyll-to-carbon ratio (θ) data were divided into 5 variance bins based on variance values (Figure 7a,b). It was found that the correlation coefficients of the lidar ratio and chlorophyll-to-carbon ratio are high, and their variance patterns are essentially the same. In other words, L1-L5 bins are consistent with the fluctuating and stable performance of the lidar ratio. Over most of the permanently stratified oceans, both ratios were less variable, whereas at higher latitudes, they were more variable. At high latitudes in the northern hemisphere, the lidar ratio varied more dramatically in both the North Pacific and the North Atlantic, where the North Pacific exhibited a single-mode annual cycle (Figure 7c, R = 0.87), but the North Atlantic had a larger and more ambiguous amplitude and periodicity (Figure 7d, R = 0.84). This may be because blooms are a recurring annual feature in the subarctic North Atlantic, whereas in the East Asian Arctic Pacific, only slight changes in chlorophyll are observed during the annual cycle [49]. The North Atlantic algal bloom was more prevalent in waters with greater compositions of suspended sediment, and the lidar ratio values were generally higher for these waters. Over the broad Central Pacific region (the permanently stratified oceans), a single-mode annual cycle of lidar ratio with a low amplitude was seen (Figure 7e, R = 0.94). In the Central Indian Ocean, due to the biannual monsoon seasons [47], the lidar ratio exhibited a multiphase annual cycle (Figure 7f, R = 0.85). The five South Pacific bins, for instance, showed single-mode annual cycles in lidar ratio, with peak values always occurring in the summer but with amplitudes that rose from low to high productivity regions (Figure 7g–k, Rg = 0.75, Rh = 0.85, Ri = 0.93, Rj = 0.91, Rk = 0.77), corresponding to the chlorophyll-to-carbon ratio properties in the South Pacific [8]. Other regional variations in the lidar ratio were likewise identical to the chlorophyll-to-carbon ratio, and it can be evaluated against the photoacclimation model applicable to the dynamic light environment of the upper ocean [8].

4. Conclusions and Discussion

In this paper, we employed satellite passive remote sensing data to determine the lidar ratio on a worldwide basis. Overall, the lidar ratio calculated by MODIS presented good agreement with the in situ data (RMSRE = 47.0%, MAPE = 29.5%, MAE = 11.2 sr, RMSE = 16.3 sr). It was found that the lidar ratio from field experiments and MODIS cannot be always consistent, which may be mainly caused by the differences between them in spatial resolutions, temporal resolutions, and acquisition area. Simultaneously, further experiments in other areas of water can be performed in the future to confirm the accuracy and reliability of computing the lidar ratio utilizing satellite passive remote sensing data. In general, the value of the lidar ratio is higher in the nearshore zone, lower in polar regions, and symmetrical in the eastern and western hemispheres. However, the value of the lidar ratio in Case I water estimated in this article is around 40, which is not consistent with the theoretical value of 100 derived by Churnside using chlorophyll concentration [12]. On the one hand, it is possible that there exist errors between the in situ measurements and satellite measurements of ocean color [50]. On the other hand, the results of bio-optical models may be inaccurate owing to the impact of complicated nearshore water bodies [12]. The above requires attention in future relevant investigations, and the conclusions of lidar ratio in Case 1 water may need to be adjusted. Furthermore, the seasonal variations in the lidar ratio were the opposite in the northern and southern hemispheres. In boreal winter, the northern hemisphere presented a higher lidar ratio than the southern hemisphere, while the converse was true in boreal summer. The worldwide seawater surface lidar ratio, while largely consistent, fluctuated significantly with the seasons. The lidar ratio was relatively high in the North Indian Ocean region, but low in the eastern regions and high in the western regions. The seasonal fluctuations of the lidar ratio in the North Indian Ocean area were linked to opposing surface circulation trends. In the meantime, the variability patterns of the lidar ratio and chlorophyll-to-carbon ratio were quite constant. The variability of the lidar ratio can be classified into five variance bins ranging from steady to active. Furthermore, distributions of these variance bins were related to variations in ocean productivity, phytoplankton, and ocean climate.
The spatial and temporal distribution characteristics of the lidar ratio demonstrate its ability to reflect water properties. The lidar ratio can be a proxy for the chlorophyll-to-particulate backscattering ratio [7] and chlorophyll-to-carbon ratio [8] because chlorophyll is directly related to Kd in Case 1 waters and carbon can be calculated by bbp [51]. Meanwhile, the variability patterns of lidar ratio and chlorophyll-to-carbon ratio are very identical. The chlorophyll-to-particulate backscattering ratio can be used to detect changes in phytoplankton community composition [16]. Moreover, high values of this ratio are associated with diatom-dominated phytoplankton communities, whereas lower values are associated with nano-phytoplankton communities [52,53,54]. The photoacclimation model applicable to the dynamic light environment of the upper ocean can be evaluated against global phytoplankton chlorophyll-to-carbon ratio data [8]. Continuous mechanistic refinement of photoacclimation description is crucial not only for interpreting global chlorophyll changes, but also for assessing ocean productivity [55], organic carbon export from the surface ocean to depth [9,56], and performance evaluations of modern coupled ocean ecosystem models [57,58]. The optical ratio method provides a new set of tools for studying plankton patchiness in temporal and spatial dimensions essential to ecological and biogeochemical research. HSRL can directly measure the lidar ratio [3,59]. Future spaceborne HSRL will be able to obtain measurements throughout the majority of the global waters, improving our understanding of ocean ecosystem functioning [6,60].
Additionally, this study enables direct access to the lidar ratio for lidar experimental teams. For example, if the lidar experiment is conducted in the northern Pacific Ocean during the boreal winter, the assumed lidar ratio can be increased, while it can be decreased significantly if the experiment is performed near the shore. Moreover, if the approach and results are used to offer a real-time lidar ratio, experimental teams should be able to obtain better measurements. Compared with atmospheric lidar which has used many algorithms, the algorithm of layer recognition and classification based on oceanic lidar data is developed slowly. The Cloud–Aerosol Lidar with Orthogonal Polarization (CALIOP) unique algorithm is capable of obtaining aerosol profiles, layers, and vertical feature mask (VFM) products [10]. However, there is no similar method for oceanic lidar data processing at present. It is achievable to build a comparable set of algorithms and apply them to marine lidar based on the lidar ratio data in this article, whose products can reflect the state composition and structure of seawater.

Author Contributions

Conceptualization, Y.Z., D.L.; methodology, X.Z., Y.Z. and H.Z.; software, X.Z.; validation, X.Z.; data curation, X.Z.; writing—original draft preparation, X.Z.; writing—review and editing, X.Z., Y.Z., D.L., H.Z., E.H. and Y.G.; visualization, X.Z.; funding acquisition, D.L., Y.Z. All authors have read and agreed to the published version of the manuscript.

Funding

This study was supported by the National Key Research and Development Program of China (2022YFB3901704; 2021YFC2202001); the Excellent Young Scientist Program of Zhejiang Provincial Natural Science Foundation of China (LR19D050001); the Fundamental Research Funds for the Central Universities (2021XZZX019); the Scientific Research Foundation for Talent Introduction (20201203Z0175; 20201203Z0177) of Zhejiang University Ningbo Campus; Project of Hangzhou Institute of Environmental Protection Science; Ningbo Natural Science Foundation (2022J153; 2022J154); the National Natural Science Foundation of China (NSFC) (62205289); Zhejiang Provincial Natural Science Foundation of China (LQ23F050011); State Key Laboratory of Modern Optical Instrumentation Innovation Program; the Zhejiang University Global Partnership Fund; the Experimental Technology Research Project of Zhejiang University (SZD202201).

Data Availability Statement

The total absorption coefficient and backscattering coefficient data are available at https://oceancolor.gsfc.nasa.gov/l3/order/, accessed on 17 March 2022. The in situ data are available at https://seabass.gsfc.nasa.gov/, accessed on 14 November 2022.

Acknowledgments

We thank the Ocean Biology Processing Group (OBPG) at NASA’s Goddard Space Flight Center for NASA’s OceanColor data. We are grateful to Seabass for supporting the experimental data. We appreciate the Student Research Training Program of Zhejiang University for its support.

Conflicts of Interest

The authors declare no conflict of interest.

References

  1. Liu, D.; Xu, P.; Zhou, Y.; Chen, W.; Han, B.; Zhu, X.; He, Y.; Mao, Z.; Le, C.; Chen, P.; et al. Lidar Remote Sensing of Seawater Optical Properties: Experiment and Monte Carlo Simulation. IEEE Trans. Geosci. Remote Sens. 2019, 57, 9489–9498. [Google Scholar] [CrossRef]
  2. Chen, S.; Tong, B.; Russell, L.M.; Wei, J.; Guo, J.; Mao, F.; Liu, D.; Huang, Z.; Xie, Y.; Qi, B. Lidar-based daytime boundary layer height variation and impact on the regional satellite-based PM2.5 estimate. Remote Sens. Environ. 2022, 281, 113224. [Google Scholar] [CrossRef]
  3. Wang, N.; Zhang, K.; Shen, X.; Wang, Y.; Li, J.; Li, C.; Mao, J.; Malinka, A.; Zhao, C.; Russell, L.M. Dual-field-of-view high-spectral-resolution lidar: Simultaneous profiling of aerosol and water cloud to study aerosol–cloud interaction. Proc. Natl. Acad. Sci. USA 2022, 119, e2110756119. [Google Scholar] [CrossRef] [PubMed]
  4. Wang, N.; Xiao, D.; Veselovskii, I.; Wang, Y.; Russell, L.M.; Zhao, C.; Guo, J.; Li, C.; Gross, S.; Liu, X.; et al. This is FAST: Multivariate Full-permutAtion based Stochastic foresT method—Improving the retrieval of fine-mode aerosol microphysical properties with multi-wavelength lidar. Remote Sens. Environ. 2022, 280, 113226. [Google Scholar] [CrossRef]
  5. Ackermann, J. The Extinction-to-Backscatter Ratio of Tropospheric Aerosol: A Numerical Study. J. Atmos. Ocean. Technol. 1998, 15, 1043–1050. [Google Scholar] [CrossRef]
  6. Hostetler, C.A.; Behrenfeld, M.J.; Hu, Y.; Hair, J.W.; Schulien, J.A. Spaceborne Lidar in the Study of Marine Systems. Annu. Rev. Mar. Sci. 2018, 10, 121–147. [Google Scholar] [CrossRef] [Green Version]
  7. Zhou, Y.; Chen, Y.; Zhao, H.; Jamet, C.; Dionisi, D.; Chami, M.; Di Girolamo, P.; Churnside, J.H.; Malinka, A.; Zhao, H. Shipborne oceanic high-spectral-resolution lidar for accurate estimation of seawater depth-resolved optical properties. Light Sci. Appl. 2022, 11, 261. [Google Scholar] [CrossRef]
  8. Behrenfeld, M.J.; O’Malley, R.T.; Boss, E.S.; Westberry, T.K.; Graff, J.R.; Halsey, K.H.; Milligan, A.J.; Siegel, D.A.; Brown, M.B. Revaluating ocean warming impacts on global phytoplankton. Nat. Clim. Chang. 2016, 6, 323–330. [Google Scholar] [CrossRef]
  9. Siegel, D.A.; Buesseler, K.O.; Doney, S.C. Global assessment of ocean carbon export by combining satellite observations and food-web models. Glob. Biogeochem. Cycles 2014, 28, 181–196. [Google Scholar] [CrossRef]
  10. Liu, D.; Liu, Q.; Bai, J.; Zhang, Y. Data processing algorithms of the space-borne lidar CALIOP: A review. Infrared Laser Eng. 2017, 46, 8–19. [Google Scholar]
  11. Ding, X.; Wang, Z.; Hu, G.; Liu, J.; Zhang, K.; Li, H.; Ratni, B.; Burokur, S.N.; Wu, Q.; Tan, J.; et al. Metasurface holographic image projection based on mathematical properties of Fourier transform. PhotoniX 2020, 1, 16. [Google Scholar] [CrossRef]
  12. Churnside, J.H.; Sullivan, J.M.; Twardowski, M.S. Lidar extinction-to-backscatter ratio of the ocean. Opt. Express 2014, 22, 18698–18706. [Google Scholar] [CrossRef]
  13. Xiao, D.; Wang, N.; Chen, S.; Wu, L.; Müller, D.; Veselovskii, I.; Li, C.; Landulfo, E.; Sivakumar, V.; Li, J.; et al. Simultaneous profiling of dust aerosol mass concentration and optical properties with polarized high-spectral-resolution lidar. Sci. Total. Environ. 2023, 872, 162091. [Google Scholar] [CrossRef] [PubMed]
  14. Hair, J.; Hostetler, C.; Cook, A.; Harper, D.; Ferrare, R.; Mack, T.; Welch, W.; Isquierdo, L.; Hovis, F. Airborne High Spectral Resolution Lidar for profiling Aerosol optical properties. Appl. Opt. 2009, 47, 6734–6752. [Google Scholar] [CrossRef] [Green Version]
  15. Zhou, Y.; Liu, D.; Xu, P.; Liu, C.; Bai, J.; Yang, L.; Cheng, Z.; Tang, P.; Zhang, Y.; Su, L. Retrieving the seawater volume scattering function at the 180° scattering angle with a high-spectral-resolution lidar. Opt. Express 2017, 25, 11813–11826. [Google Scholar] [CrossRef] [PubMed]
  16. Schulien, J.A.; Della Penna, A.; Gaube, P.; Chase, A.P.; Haëntjens, N.; Graff, J.R. Shifts in Phytoplankton Community Structure Across an Anticyclonic Eddy Revealed From High Spectral Resolution Lidar Scattering Measurements. Front. Mar. Sci. 2020, 7, 493. [Google Scholar] [CrossRef]
  17. Flores, J.M.; Bourdin, G.; Altaratz, O.; Trainic, M.; Lang-Yona, N.; Dzimban, E.; Steinau, S.; Tettich, F.; Planes, S.; Allemand, D.; et al. Tara Pacific Expedition’s Atmospheric Measurements of Marine Aerosols across the Atlantic and Pacific Oceans: Overview and Preliminary Results. Bull. Am. Meteorol. Soc. 2020, 101, E536–E554. [Google Scholar] [CrossRef] [Green Version]
  18. Taraocean, F. Misson Microbiomes Comprender la Población Invisible del Océano Para Preservar Nuestro Futuro; Fundación Tara Océan: Paris, France, 2020. [Google Scholar]
  19. Behrenfeld, M.J.; Moore, R.H.; Hostetler, C.A.; Graff, J.; Gaube, P.; Russell, L.M.; Chen, G.; Doney, S.C.; Giovannoni, S.; Liu, H.; et al. The North Atlantic Aerosol and Marine Ecosystem Study (NAAMES): Science Motive and Mission Overview. Front. Mar. Sci. 2019, 6, 122. [Google Scholar] [CrossRef] [Green Version]
  20. Siegel, D.; Stanley, R.; Buesseler, K.; Behrenfeld, M.; Benitez-Nelson, C.; Boss, E.; Brzezinski, M.; Burd, A.; Carlson, C.; D’Asaro, E.; et al. Prediction of the Export and Fate of Global Ocean Net Primary Production: The EXPORTS Science Plan. Front. Mar. Sci. 2016, 3, 22. [Google Scholar] [CrossRef] [Green Version]
  21. Churnside, J. Review of profiling oceanographic lidar. Opt. Eng. 2013, 53, 051405. [Google Scholar] [CrossRef] [Green Version]
  22. Lee, Z.-P.; Darecki, M.; Carder, K.; Davis, C.; Stramski, D.; Rhea, W. Diffuse Attenuation Coefficient of Downwelling Irradiance: An Evaluation of Remote Sensing Methods. J. Geophys Res. 2005, 110, C02017. [Google Scholar] [CrossRef]
  23. Zhang, X.; Boss, E.; Gray, D. Significance of scattering by oceanic particles at angles around 120 degree. Opt. Express 2014, 22, 31329–31336. [Google Scholar] [CrossRef] [PubMed]
  24. Chen, P. Subsurface phytoplankton vertical structure observations using offshore fixed platform-based lidar in the Bohai Sea for offshore responses to Typhoon Bavi. Opt. Express 2022, 30, 20614–20628. [Google Scholar] [CrossRef] [PubMed]
  25. Sullivan, J.; Twardowski, M. Angular shape of the oceanic particulate volume scattering function in the backward direction. Appl. Opt. 2009, 48, 6811–6819. [Google Scholar] [CrossRef]
  26. Churnside, J.; Marchbanks, R. Sub-surface plankton layers in the Arctic Ocean: Plankton layers in the Arctic. Geophys. Res. Lett. 2015, 42, 4896–4902. [Google Scholar] [CrossRef]
  27. Lee, J.; Churnside, J.; Marchbanks, R.; Donaghay, P.; Sullivan, J. Oceanographic lidar profiles compared with estimates from in situ optical measurements. Appl. Opt. 2013, 52, 786–794. [Google Scholar] [CrossRef]
  28. Sullivan, J.; Twardowski, M.; Zaneveld, J.R.V.; Moore, C. Measuring optical backscattering in water. Light Scatt. Rev. 2013, 6, 189–224. [Google Scholar]
  29. Kheireddine, M.; Brewin, B.; Ouhssain, M.; Jones, B. Particulate Scattering and Backscattering in Relation to the Nature of Particles in the Red Sea. J. Geophys. Res. Oceans 2021, 126, e2020JC016610. [Google Scholar] [CrossRef]
  30. Smith, R.C.; Baker, K.S. Optical properties of the clearest natural waters (200–800 nm). Appl. Opt. 1981, 20, 177–184. [Google Scholar] [CrossRef]
  31. Morrison, J.M.; Codispoti, L.A.; Smith, S.L.; Wishner, K.; Flagg, C.; Gardner, W.D.; Gaurin, S.; Naqvi, S.W.A.; Manghnani, V.; Prosperie, L.; et al. The oxygen minimum zone in the Arabian Sea during 1995. Deep Sea Res. 2 Top. Stud. Oceanogr. 1999, 46, 1903–1931. [Google Scholar] [CrossRef]
  32. Behrenfeld, M.J. Climate-mediated dance of the plankton. Nat. Clim. Chang. 2014, 4, 880–887. [Google Scholar] [CrossRef]
  33. Boyce, D.G.; Lewis, M.R.; Worm, B. Global phytoplankton decline over the past century. Nature 2010, 466, 591–596. [Google Scholar] [CrossRef] [PubMed]
  34. Kahru, M.; Kudela, R.; Manzano-Sarabia, M.; Mitchell, B. Trends in primary production in the California Current detected with satellite data. J. Geophys. Res. Oceans 2009, 114, C02004. [Google Scholar] [CrossRef] [Green Version]
  35. Friedman, A.R. The Changing Interhemispheric Temperature Difference: Mechanisms and Impacts; UC Berkeley: Berkeley, CA, USA, 2014. [Google Scholar]
  36. Saavedra-Pellitero, M.; Baumann, K.H.; Flores, J.A.; Gersonde, R. Biogeographic distribution of living coccolithophores in the Pacific sector of the Southern Ocean. Mar. Micropaleontol. 2014, 109, 1–20. [Google Scholar] [CrossRef]
  37. Behrenfeld, M.J.; Hu, Y.; O’Malley, R.T.; Boss, E.S.; Hostetler, C.A.; Siegel, D.A.; Sarmiento, J.L.; Schulien, J.; Hair, J.W.; Lu, X.; et al. Annual boom–bust cycles of polar phytoplankton biomass revealed by space-based lidar. Nat. Geosci. 2017, 10, 118–122. [Google Scholar] [CrossRef]
  38. Behrenfeld, M.; Hu, Y.; Hostetler, C.; Dall’Olmo, G.; Rodier, S.; Hair, J.; Trepte, C. Space-based lidar measurements of global ocean carbon stocks. Geophys. Res. Lett. 2013, 40, 4355–4360. [Google Scholar] [CrossRef]
  39. Wesley, B.; Christian, K.; Morales, C.A. Differences between East and West Pacific Rainfall Systems. J. Clim. 2002, 15, 3659–3672. [Google Scholar]
  40. Boyd, P.; Jickells, T.; Law, C.S.; Blain, S.; Boyle, E.; Buesseler, K.; Coale, K.; Cullen, J.; de Baar, H.; Follows, M.; et al. Mesoscale Iron Enrichment Experiments 1993–2005: Synthesis and Future Directions. Science 2007, 315, 612–617. [Google Scholar] [CrossRef] [Green Version]
  41. Tsuda, A.; Takeda, S.; Saito, H.; Nishioka, J.; Nojiri, Y.; Kudo, I.; Kiyosawa, H.; Shiomoto, A.; Imai, K.; Ono, T.; et al. A Mesoscale Iron Enrichment in the Western Subarctic Pacific Induces a Large Centric Diatom Bloom. Science 2003, 300, 958–961. [Google Scholar] [CrossRef]
  42. Brock, J.C.; Mcclain, C.R.; Hay, W.W. A southwest monsoon hydrographic climatology for the northwestern Arabian Sea. J. Geophys. Res. Oceans 1992, 97, 9455–9465. [Google Scholar] [CrossRef]
  43. Coble, P.G.; Del Castillo, C.E.; Avril, B. Distribution and optical properties of CDOM in the Arabian Sea during the 1995 Southwest Monsoon. Deep Sea Res. 2 Top. Stud. Oceanogr. 1998, 45, 2195–2223. [Google Scholar] [CrossRef]
  44. Krey, J.; Babenerd, B. Phytoplankton Production: Atlas of the International Indian Ocean Expedition; Institur für Meereskunde-Kiel Universität: Kiel, Germany, 1976. [Google Scholar]
  45. Madhupratap, M.; Gauns, M.; Ramaiah, N.; Kumar, S.P.; Muraleedharan, P.M.; Sousa, S.; Sardessai, S.; Muraleedharan, U. Biogeochemistry of the Bay of Bengal: Physical, chemical and primary productivity characteristics of the central and western Bay of Bengal during summer monsoon 2001. Deep-Sea Res. Pt. I 2003, 50, 881–896. [Google Scholar] [CrossRef] [Green Version]
  46. Schott, F.; Fischer, J. Winter monsoon circulation of the northern Arabian Sea and Somali Current. J. Geophys. Res. 2000, 105, 6359–6376. [Google Scholar] [CrossRef] [Green Version]
  47. Schott, F.A.; McCreary, J.P. The monsoon circulation of the Indian Ocean. Prog. Oceanogr. 2001, 51, 1–123. [Google Scholar] [CrossRef]
  48. Kumar, S.P.; Nuncio, M.; Narvekar, J.; Ramaiah, N.; Sardesai, S.; Gauns, M.; Fernandes, V.; Paul, J.T.; Jyothibabu, R.; Jayaraj, K.A. Seasonal cycle of physical forcing and biological response in the Bay of Bengal. Indian J. Mar. Sci. 2010, 39, 388–405. [Google Scholar]
  49. Westberry, T.K.; Schultz, P.; Behrenfeld, M.J.; Dunne, J.P.; Hiscock, M.R.; Maritorena, S.; Sarmiento, J.L.; Siegel, D.A. Annual cycles of phytoplankton biomass in the subarctic Atlantic and Pacific Ocean. Glob. Biogeochem. Cycles 2016, 30, 175–190. [Google Scholar] [CrossRef] [Green Version]
  50. Seegers, B.N.; Stumpf, R.P.; Schaeffer, B.A.; Loftin, K.A.; Werdell, P.J. Performance metrics for the assessment of satellite data products: An ocean color case study. Opt. Express 2018, 26, 7404–7422. [Google Scholar] [CrossRef] [Green Version]
  51. Zhao, R.; Huang, L.; Wang, Y. Recent advances in multi-dimensional metasurfaces holographic technologies. PhotoniX 2020, 1, 20. [Google Scholar] [CrossRef]
  52. Cetini, I.; Perry, M.J.; D’Asaro, E.; Briggs, N.; Lee, C.M. A simple optical index shows spatial and temporal heterogeneity in phytoplankton community composition during the 2008 North Atlantic Bloom Experiment. Biogeosciences 2015, 12, 2179–2194. [Google Scholar] [CrossRef] [Green Version]
  53. Sun, H.; Wang, S.; Hu, X.; Liu, H.; Zhou, X.; Huang, J.; Cheng, X.; Sun, F.; Liu, Y.; Liu, D. Detection of surface defects and subsurface defects of polished optics with multisensor image fusion. PhotoniX 2022, 3, 6. [Google Scholar] [CrossRef]
  54. Haoyi, Y.; Qiming, Z.; Xi, C.; Haitao, L.; Min, G. Three-dimensional direct laser writing of biomimetic neuron interfaces in the era of artificial intelligence: Principles, materials, and applications. Adv. Photonics 2022, 4, 034002. [Google Scholar]
  55. Westberry, T.; Behrenfeld, M.J.; Siegel, D.A.; Boss, E. Carbon-based primary productivity modeling with vertically resolved photoacclimation. Glob. Biogeochem. Cycles 2008, 22, 1–18. [Google Scholar] [CrossRef] [Green Version]
  56. Jiang, B.; Zhu, S.; Ren, L.; Shi, L.; Zhang, X. Simultaneous ultraviolet, visible, and near-infrared continuous-wave lasing in a rare-earth-doped microcavity. Adv. Photonics 2022, 4, 046003. [Google Scholar] [CrossRef]
  57. Doney, S.; Lima, I.; Moore, J.; Lindsay, K.; Behrenfeld, M.; Westberry, T.; Mahowald, N.; Glover, D.; Takahashi, T. Skill metrics for confronting global upper ocean ecosytem-biogeochemistry models against field and remote sensing data. J. Mar. Syst. 2009, 76, 95–112. [Google Scholar] [CrossRef] [Green Version]
  58. Dazhao, Z.; Liang, X.; Chenliang, D.; Zhenyao, Y.; Yiwei, Q.; Chun, C.; Hongyang, H.; Jiawei, C.; Mengbo, T.; Lanxin, Z.; et al. Direct laser writing breaking diffraction barrier based on two-focus parallel peripheral-photoinhibition lithography. Adv. Photonics 2022, 4, 066002. [Google Scholar]
  59. Ke, J.; Sun, Y.; Dong, C.; Zhang, X.; Wang, Z.; Lyu, L.; Zhu, W.; Ansmann, A.; Su, L.; Bu, L. Development of China’s first space-borne aerosol-cloud high-spectral-resolution lidar: Retrieval algorithm and airborne demonstration. PhotoniX 2022, 3, 17. [Google Scholar] [CrossRef]
  60. Zhang, Z.; Gao, Y.; Li, X.; Wang, X.; Zhao, S.; Liu, Q.; Zhao, C. Second harmonic generation of laser beams in transverse mode locking states. Adv. Photonics 2022, 4, 026002. [Google Scholar] [CrossRef]
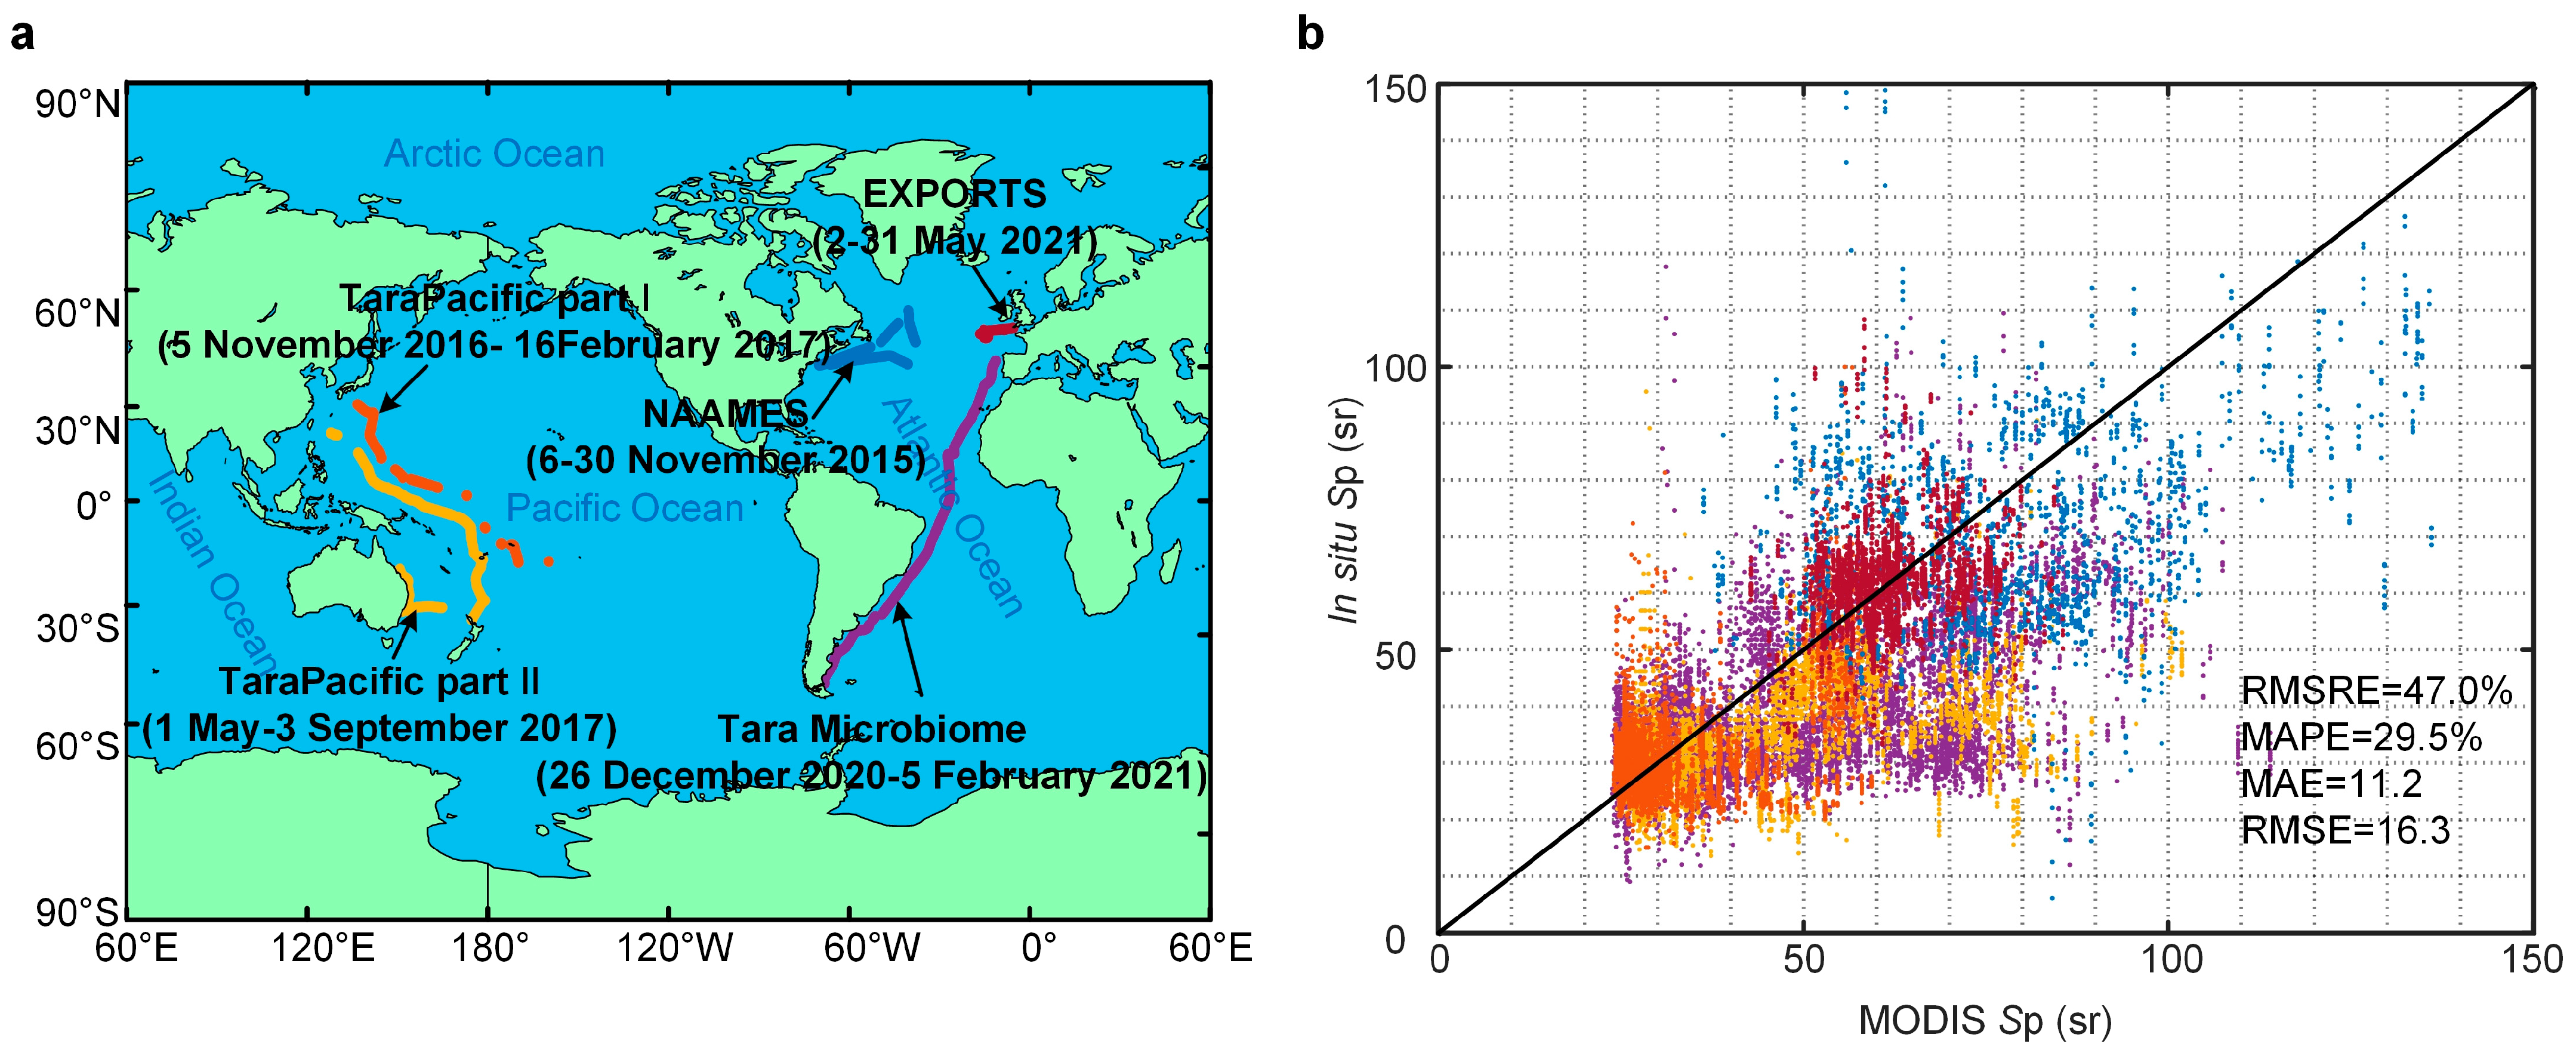
Figure 1. Analysis of experimental data. (a) In situ experiment tracks. (b) The statistical analysis of lidar ratio between in situ and MODIS results.
Remotesensing 15 03328 g001
Figure 2. Comparisons of lidar ratio values for in situ measurements and MODIS products. (a) Orange lines = TaraPacific part I track, 5 November 2016–16 February 2017. (b) Yellow lines = TaraPacific part II track, 1 May–3 September 2017. (c) Purple lines = Tara Microbiome track, 26 December 2020–5 February 2021. (d) Blue lines = NAAMES track, 6–30 November 2015–1–3 September 2017. (e) Red lines = EXPORTS track, 2–31 May 2021. Black lines = MODIS matched products.
Remotesensing 15 03328 g002
Figure 3. Spatial distribution analysis of lidar ratio. (a) Global lidar ratio distribution calculated using MODIS annual average total a and bb data in 2021. (b) Probability distribution curves of lidar ratio. (c) Lidar ratio values at different latitudes. Blue lines = eastern hemisphere. Green lines = western hemisphere. Red lines = global scale. The shaded areas represent the north and south polar night zones.
Remotesensing 15 03328 g003
Figure 4. Temporal distribution analysis of lidar ratio. (ad) represent the global distributions of lidar ratio drawn using seasonally average data from MODIS in spring, summer, autumn and winter in 2021, respectively.
Remotesensing 15 03328 g004
Figure 5. Analysis of lidar ratio for different hemispheres and seasons. (a) The bar charts of lidar ratio for boreal summer and winter of the northern hemisphere and southern hemisphere. (b) The lidar ratio distributions in boreal summer and winter. The gray-shaded areas represent the north and south polar night zones.
Remotesensing 15 03328 g005
Figure 6. Spatial–temporal analysis of lidar ratio in the Indian Ocean in 2021 using quarterly average MODIS data; (ad) plots represent the seasons of spring, summer, fall and winter, respectively.
Remotesensing 15 03328 g006
Figure 7. Lidar ratio (Sp) and carbon-to-chlorophyll (θ) variability in the global ocean. (a,b) The 11-year record of MODIS monthly resolution lidar ratio (Sp) and chlorophyll-to-carbon ratio (θ) data were divided into 5 variance bins. (c) L5 variance bin for the North Pacific (NP) region. (d) L4 variance bin for the North Atlantic (NA) region. (e) L2 variance bin for the Central Pacific (CP) region. (f) L5 variance bin for the Central Indian (CI) region. (g) L1 variance bin for the South Pacific (SP) region (144°W–147°W, 20°S–22°S). (h) L2 variance bin for the South Pacific (SP) region (90°W–99°W, 24°S–32°S). (i) L3 variance bin for the South Pacific (SP) region (80°W–84°W, 28°S–30°S). (j) L4 variance bin for the South Pacific (SP) region (176°E–179°E, 40°S–41°S). (k) L5 variance bin for the South Pacific (SP) region (124°W–132°W, 58°S–62°S). Right-hand legend: L1, lowest variability (most stable) waters; L5, highest variability waters. The solid lines represent the lidar ratio and the dotted lines represent the carbon-to-chlorophyll.
Remotesensing 15 03328 g007
Disclaimer/Publisher’s Note: The statements, opinions and data contained in all publications are solely those of the individual author(s) and contributor(s) and not of MDPI and/or the editor(s). MDPI and/or the editor(s) disclaim responsibility for any injury to people or property resulting from any ideas, methods, instructions or products referred to in the content.