Article

Coseismic Faulting Model and Post-Seismic Surface Motion of the 2023 Turkey–Syria Earthquake Doublet Revealed by InSAR and GPS Measurements

1
Department of Remote Sensing and Geoinformation Engineering, Southwest Jiaotong University, Chengdu 610031, China
2
State Key Laboratory of Geohazard Prevention and Geoenvironment Protection, Chengdu University of Technology, Chengdu 610059, China
*
Author to whom correspondence should be addressed.
Remote Sens. 2023, 15(13), 3327; https://doi.org/10.3390/rs15133327
Submission received: 12 May 2023 / Revised: 22 June 2023 / Accepted: 26 June 2023 / Published: 29 June 2023
(This article belongs to the Special Issue Earthquake Ground Motion Observation and Modelling)

Abstract

:
On 6 February 2023 (UTC), an earthquake doublet, consisting of the Mw 7.8 Pazarcik earthquake and the Mw 7.5 Elbistan earthquake, struck south-central Turkey and northwestern Syria, which was the largest earthquake that occurred in Turkey since the 1939 Erzincan earthquake. The faulting model of this earthquake was estimated based on the coseismic InSAR and GPS displacements. In addition, the best-fitting coseismic faulting model indicates that both the Pazarcik earthquake and the Elbistan earthquake were controlled by predominated left-lateral strike-slip motion, with slip peaks of 9.7 m and 10.8 m, respectively. The Coulomb failure stress (CFS) change suggests that the Pazarcik earthquake has a positive effect in triggering the rupture of the seismogenic fault of the Elbistan earthquake. Furthermore, these two main shocks promoted the occurrence of the Mw 6.3 strong aftershock. Additionally, it is found that the 2023 Turkey-Syria earthquake doublet increased the rupture risk of the Puturge segment of the EAF fault and the northern segment of the Dead Sea Fault (DSF). It is crucial to note that the northern segment of the DSF has not experienced a large earthquake in several centuries, highlighting the need for heightened attention to the potential seismic hazard of this segment. Finally, a deformation zone adjacent to the DSF was identified, potentially attributed to the motion of a blind submarine fault.

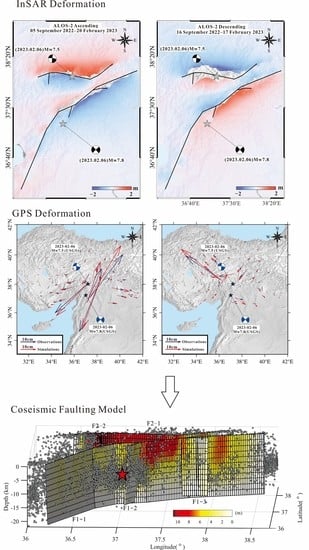
Graphical Abstract

1. Introduction

On 6 February 2023, an Mw 7.8 earthquake (known as the Pazarcik earthquake) hit south-central Turkey and northwestern Syria, with the hypocenter located at 37°13′33.6″N, 37°0′50.4″W and a source depth of 10.0 km (USGS solution). The Mw 7.8 earthquake was the largest seismic event in Turkey since the 1939 Erzincan earthquake [1]. About nine hours later, a magnitude 7.5 earthquake (referred to as the Elbistan earthquake) struck the nearby region, with the hypocenter located at 38°0′39.5″N, 37°11′45.6″W and a source depth of 7.4 km (USGS solution), ~95 km north of the epicenter of the Pazarcik earthquake. The 2023 Turkey-Syria earthquake doublet resulted in a death toll exceeding 50,000 individuals in Turkey and Syria, with thousands of houses suffering from varying degrees of damage [2].
Both of these two Mw 7.5+ earthquakes occurred along the East Anatolian Fault (EAF) and its subsidiary structures, the Surgu and Cardak faults [2]. In addition, the EAF forms the southeastern boundary of the Anatolian microplate in Turkey [3,4], which accommodates the northward movement of the Arabian Plate at a velocity of ~15 mm/yr [5,6], and the oblique collision between the Eurasian and African plates. Previous studies indicate that the boundary between the Arabian and Anatolian plates is predominantly characterized by pure strike-slip motion, possibly with minor extension [4,7]. The Anatolian microplate, subducting beneath the African Plate, exhibits the westward extrusion with counterclockwise rotation relative to Eurasia [4,8,9,10,11]. The extrusion of Anatolia is also influenced by a complex subduction system in the eastern Mediterranean and Aegean microplate [6]. The Aegean microplate is moving southwestward at a speed of 33 mm/yr relative to the African Plate [4]. Geological and geodetic studies suggest that both the Aegean microplate and the Anatolian microplate exhibit predominantly coherent motion with minor internal deformation (<1–2 mm/yr) [4,12,13]. As a consequence, bounding faults exhibit higher strain rates (50–100 nstrain/yr in Anatolia, 30–50 nstrain/yr in the Aegean) [4,14]. This constitutes a significant active tectonic framework within the Turkish region.
The EAF is an over 500 km sinistral fault and one of the major active faults in Turkey [8]. The EAF is adjacent to the Anatolian Fault in the northwest and connects with the Dead Sea Fault in the southwest. Historical records indicate that several earthquakes with a magnitude of Mw 6.0 or greater have occurred along the EAF, as shown in Figure 1, including the 2003 Bingöl earthquake [15], 2010 Mw6.1 Elazığ earthquake [16], and 2020 Mw 6.8 Sivrice earthquake [17]. Previous studies have revealed that the slip rate of the EAF decreases from northwest (~10 mm/yr) to southeast (~4 mm/yr) [3,9]. Compared to the Puturge and Palu segments, the Erkenek, Pazarcik, and Amanos segments that ruptured during the Mw 7.8 earthquake have relatively low seismicity [3]. These segments have not experienced any destructive earthquakes in nearly a century, which could lead to the accumulation of significant strain. In addition, the geometry of the EAF is complex, characterized by several parallel fault strands on the southern side, including the Surgu and Cardak faults, which are both north-dipping sinistral strike-slip faults [8]. The paleoseismic investigations indicate that the Surgu fault has accumulated meter-scale strain [4].
The occurrence of two consecutive Mw 7.5+ earthquakes within 24 h, their interrelationship, and their triggering effects on the Mw 6.3 earthquake in Uzunba, Turkey, that happened on 20 February have aroused widespread scientific interest. The 2023 Turkey-Syria earthquake doublet released a significant amount of energy, and its potential impact on the nearby major faults, especially the northern Dead Sea Fault, deserves significant attention. In this study, a dataset of InSAR and GPS data was utilized to estimate the coseismic slip model of the 2023 Turkey-Syria earthquake doublet. Then, the stress-triggering relationship between the two Mw 7.5+ earthquakes, as well as their impact on the occurrence of the 6.3 Mw earthquake on Feb. 20th was evaluated. Furthermore, the effects of the 2023 Turkey-Syria earthquake on the neighboring large faults were investigated through the calculation of the static CFS transfer.

2. Datasets and Processing

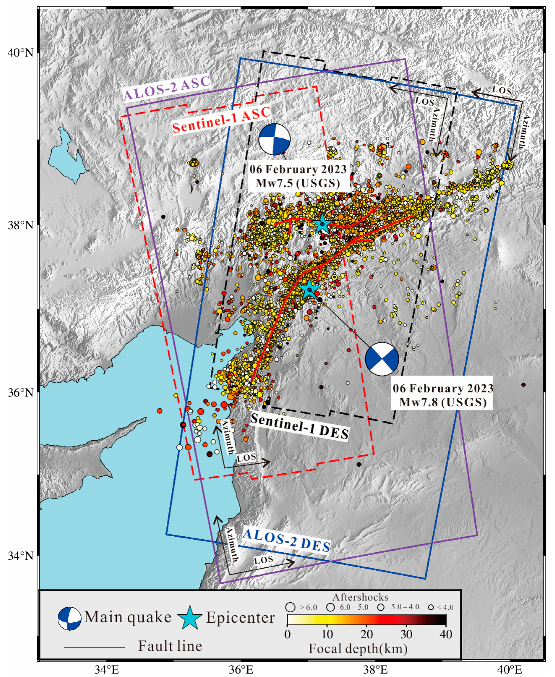
Geodetic measurements, including remote sensing data, have been extensively employed in the study of coseismic deformation [18,19]. In this study, ascending and descending track data acquired by the Sentinel-1A satellite from the European Space Agency and advanced land observing satellite-2 (ALOS-2) satellite from the Japan Aerospace Exploration Agency, were employed to measure the coseismic surface displacements related to the 2023 Turkey-SyriaTurkey-Syria earthquake doublet. The main parameters of the used radar images and the formed four image pairs are listed in Table 1, and the ground coverages of these SAR acquisitions are shown in Figure 2. The GAMMA-V20180813 and Interferometric synthetic aperture radar Scientific Computing Environment (ISCE) version 2 software were utilized to process the four SAR image pairs to extract coseismic surface deformation in the light-of-sight (LOS) direction. More specifically, the two-pass DInSAR method was applied to generate the differential interferogram [20] The Shuttle Radar Topography Mission version 4 (SRTM-4) digital elevation model (DEM) with a spatial resolution of 30 m × 30 m was used to simulate and mitigate the topographic phase contribution. The external GACOS data were utilized to mitigate the atmospheric delay component within the InSAR observation [21]. The split-range-spectrum method (SSM) was used to estimate the ionospheric delay in the interferograms produced by the L-band ALOS-2 images [22,23]. The ionospheric delay in the C-band Sentinel-1 deformation has not been removed, as its impact can be negligible. The Goldstein filter was utilized to mitigate the random noise [24], followed by phase unwrapping using the Minimum Cost Flow (MCF) method [25]. The residual orbital error was removed by applying a quadratic approximation of the far-field observations excluding significant surface deformation due to the main shock [26]. Finally, the InSAR coseismic deformation field of the 2023 Turkey-Syria earthquake doublet was obtained, as shown in Figure 3.
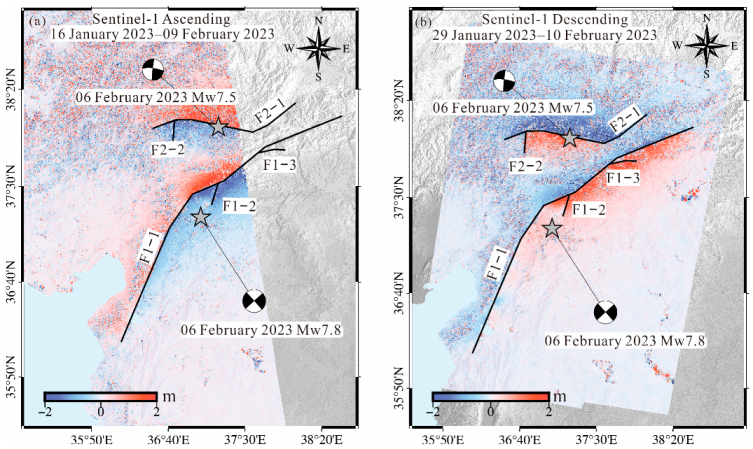
Strong strike-slip earthquakes such as the Turkey-Syria earthquake doublet are often associated with seismogenic faults of complex geometry. In addition, the pixel offset-tracking (POT) technique was employed to extract the near-field coseismic surface deformation from the used Sentinel images, which can be further used to identify the fault surface traces. In detail, the extraction of POT deformation was performed using the offset-tracking module of the GAMMA-V20180813 software. Considering the trade-off between the calculation efficiency and the precision of the offset estimations [27,28], the searching window size was set as 125 × 25 pixels. The sampling interval was set as 20 (range) × 5 (azimuth), resulting in the ground range and azimuth pixel spacing of approximately 40 m × 40 m. This effectively improved the pixel-matching correlation. Finally, the POT deformation in the range direction of the 2023 Turkey-Syria earthquake doublet was derived, as shown in Figure 3. The surface rupture trace was identified through the extraction of displacement discontinuities (see F1–F2 marked in Figure 3), which are likely to represent the seismogenic faults of the Pazarcik and Elbistan earthquakes. The spatial location of the F1 fault (including F1-1, F1-2, and F1-3) coincides with that of the EAF, while the spatial location of the F2 fault (including F2-1 and F2-2) aligns with the Surgu and Cardak faults. The surface rupture trace can provide the initial geometry parameters (location, length, and strike angle) for estimating the coseismic faulting model.
Figure 4 shows coseismic horizontal GPS deformation related to the Pazarcik and Elbistan earthquakes, which were obtained from the Nevada Geodetic Laboratory. Coseismic displacements were preliminarily estimated based on time series data with a 5 min sampling rate. This dataset was divided into three parts that were recorded before, during, and after the Mw 7.5+ earthquake, respectively, enabling the calculation of specific coseismic displacements related to the Pazarcik and Elbistan earthquakes. The GPS stations are distributed throughout the entire seismic area but are more densely concentrated to the north of the epicenter, with the maximum deformation exceeding 4 m.

3. Inversion Configuration

Firstly, samples with interferometric coherence < 0.3 were masked to avoid the negative effect of InSAR data with high uncertainties. Then, to improve the calculation efficiency, the quadtree method was utilized to down-sample the obtained InSAR deformation fields, which consist of millions of samples [29]. Finally, 2247 and 2078 samples from the ALOS-2 ascending and descending tracks were, respectively, retained for further estimation of the coseismic faulting model. The weighting ratio is determined as 10:1 based on the observation accuracies of GPS observations (millimeters in the horizontal direction) and InSAR measurements (cm), which have been incorporated through the observation error covariance in the inversion. This approach ensures that the higher precision of GPS observations exerts a stronger influence, while still incorporating the valuable information provided by InSAR measurements. In addition, the POT observations were not introduced in the geodetic inversion for the coseismic faulting model due to the relatively lower accuracy of the displacements measured by the POT method (23 cm, a typical accuracy on the order of 1/10 of a pixel).
The determination of initial values and search intervals for the fault geometry parameters is essential for estimating the fault slip model. The strike angles of F1-1 (the five segments from southwest to northeast) are 21.1°, 34.3°, 66.9°, 50.7°, and 67.7°, respectively. These values are directly extracted from the POT-based fault lines shown in Figure 3. In addition, the strike angles of F1-2 and F1-3 (two segments from southwest to northeast) are 205.0°, 8.3°, and 92.3°, respectively. Similarly, the strike angles of F2-1 (the five segments from northeast to southwest) and F2-2 are 231.4°, 245.1°, 281.9°, 269.4°, 249.1°, and 2.3°. The initial values and search ranges of the dip and rake angles were set based on the published focal mechanism solutions (Table 2) and the previous studies about the Turkish active faults [3,8]. Specifically, the initial dip angles for the F1 and F2 faults were set as 89° and 78°, with the search ranges of (70°, 90°) and (40°, 90°), respectively. The initial values of fault rake angles were both set as 0°, with a search range of (−90°, 90°). In addition, the initial fault width was set as 30 km, which is generally enough for a Mw 7.8 earthquake. The length and location of the fault are also determined using POT-based fault lines. Based on the coseismic deformation field, it is assumed that all fault segments rupture to the surface with a slip peak of 15 m.
In this study, the method proposed by Yang et al. [30] based on the elastic dislocation theory was adopted to estimate the faulting model of the 2023 Turkey-Syria earthquake doublet [31]. Firstly, all fault planes were discretized into sub-faults with a size of 5 km × 5 km along the strike and down-dip directions. The simulated annealing algorithm with a minimum misfit criterion was used to search for the optimal dip and rake angles of each fault. A Laplace smoothing operator was applied to avoid the sharp changes in fault slip in nearby sub-faults. The suitable smoothing factor was detected based on the trade-off curve between the model residual and slip roughness (Figure 5). Finally, all fault planes were re-discretized into a smaller patch with a size of 2 km × 2 km to infer the detailed fault slip distribution responsible for the 2023 Turkey-Syria earthquake doublet.

4. Results

4.1. Coseismic Surface Deformation of the 2023 Turkey-Syria Earthquake Doublet

Figure 6 shows the surface deformation caused by the 2023 Turkey-Syria earthquake doublet. The L-band ALOS satellite radar images with a long radar wavelength of 0.236 m are beneficial for extracting a high-quality near-field deformation of the 2023 Turkey-Syria earthquake doublet. For the ascending InSAR track, the positive ground deformation signals (slant range decrease) are presented on the northern flank of the Surgu fault and the northwestern flank of the EAFZ fault, and the negative signals (slant range extension from the satellite) are mainly concentrated on the southern flank of the Surgu fault and the southeastern flank of the EAF fault. Conversely, the crustal deformation extracted from the descending InSAR track displays the opposite sign to the ascending track. This indicates the sinistral strike-slip motions during the Mw 7.8 event generated by the faulting of the EAFZ fault and the Mw 7.5 rupture related to the Surgu and Cardak faults.
As depicted in the ascending InSAR deformation field, the deformation on the northern side of the Surgu fault is greater than that on the southern side, suggesting that the fault may dip toward the north. Meanwhile, the descending InSAR deformation illustrates that the ground on the southeastern side of the EAF fault deforms much more significantly than on the northwestern side, implying the southeast-dipping feature of the EAF fault. Moreover, some InSAR data are missing in the near-fault zone attributed to severe ground motion. This suggests that the coseismic rupture of the 2023 Turkey-Syria earthquake doublet probably has extended to the ground surface.

4.2. Estimated Coseismic Faulting Model

Figure 7 shows the coseismic fault slip models constrained by InSAR and GPS observations for the Pazarcik and Elbistan earthquakes. The causative fault (F1) for the Pazarcik earthquake has an average strike angle of 43° and an average dip angle of 88°, with a seismic moment release of approximately 5.62 × 10²⁰ Nm, equivalent to Mw 7.8. The F1 fault is nearly vertical, although its dip angle remains a topic of academic controversy. Geological investigation indicates that the F1 fault dips to the northwest in the Palu and Celikhan segments, but dips to the southeast in other segments [8]. Our best-fitting result supports a southeastward dipping of the seismogenic fault, consistent with the GCMT result. This is due to the smaller residuals between the observed and simulated data in the southeast-dipping model. However, the USGS and CENC solutions suggest a northwestward dipping of the seismogenic fault. The causative fault (F2) for the Elbistan earthquake has an average strike angle of 261° and an average dip angle of 70°, with a seismic moment release of approximately 4.53 × 10²⁰ Nm, equivalent to Mw 7.7. Unlike the F1-1 fault, the F2-1 fault shows a gradually increasing fault dip angle from southwest to northeast across its distinct segments, a pattern that is consistent with the distribution of aftershocks (Figure 2).
It can be found from Figure 7 that the two earthquakes have ruptured to the ground surface. The faulting in the two earthquakes was primarily controlled by the left-lateral strike-slip motion. The F1-1 fault has two distinguished slip asperities (S-1 and S-2 zones). The S-1 zone is located at 170–235 km along the fault strike direction, with a depth range of 0–15 km and a maximum slip of 9.7 m. Meanwhile, the high slip zone S-2 is located at 270–290 km along the fault strike direction, with a depth range of 0–15 km and a maximum slip of 7.0 m. The slip on F2-1 concentrates at distances of 40–140 km along the strike direction and at depths of 0–15 km, with a peak slip up to 10.8 m. It is noteworthy that the F2-2 fault is predominantly characterized by the normal fault motion.
Figure 6 shows the InSAR data predicted based on our best-fitting faulting model and the residual between the predicted and observed deformation. It is evident that the simulated surface displacements are in good agreement with the observed displacements. The model residuals are 8.1 cm and 7.6 cm for the ALOS ascending and descending data, respectively. The estimated slip model can, respectively, explain 97.8% and 97.9% of the ALOS-2 ascending and descending observations. These values indicate that the slip model derived in this paper is reliable for explaining the ground InSAR observations. Furthermore, some residuals can be found in both ascending and descending track deformation, which could be attributed to the limitations of the simple fault model applied in this study, as well as the atmospheric delay error, particularly the ionospheric effect. Figure 4 shows the observed and predicted GPS displacements. The GPS misfit for the Pazarcik and Elbistan earthquakes is 1.3 cm and 2.4 cm, respectively, approximately equal to the theoretic precision of GPS observations, and the slip model can explain 96% and 90% of the GPS observations for these two earthquakes.

5. Discussion

5.1. Effects of the 2023 Turkey-Syria Earthquake on Nearby Faults

Two earthquakes of magnitude Mw 7.5+ occurred within ~9 h, followed by the Mw 6.3 Uzunba earthquake two weeks later, at the intersection of the EAF fault and the Dead Sea Fault. Therefore, the triggering relationship among these three earthquakes is worthy of study [33,34,35,36]. Previous studies indicate that earthquakes could release accumulated strain and adjust the stress status of surrounding faults. In other words, the former event may have a positive or negative effect in subsequent rupture [37,38,39]. Therefore, the static CFS was used to help understand the triggering relationship between the 2023 Turkey-Syria earthquake doublet and its stress impact on the neighboring major faults in this study [40,41,42].
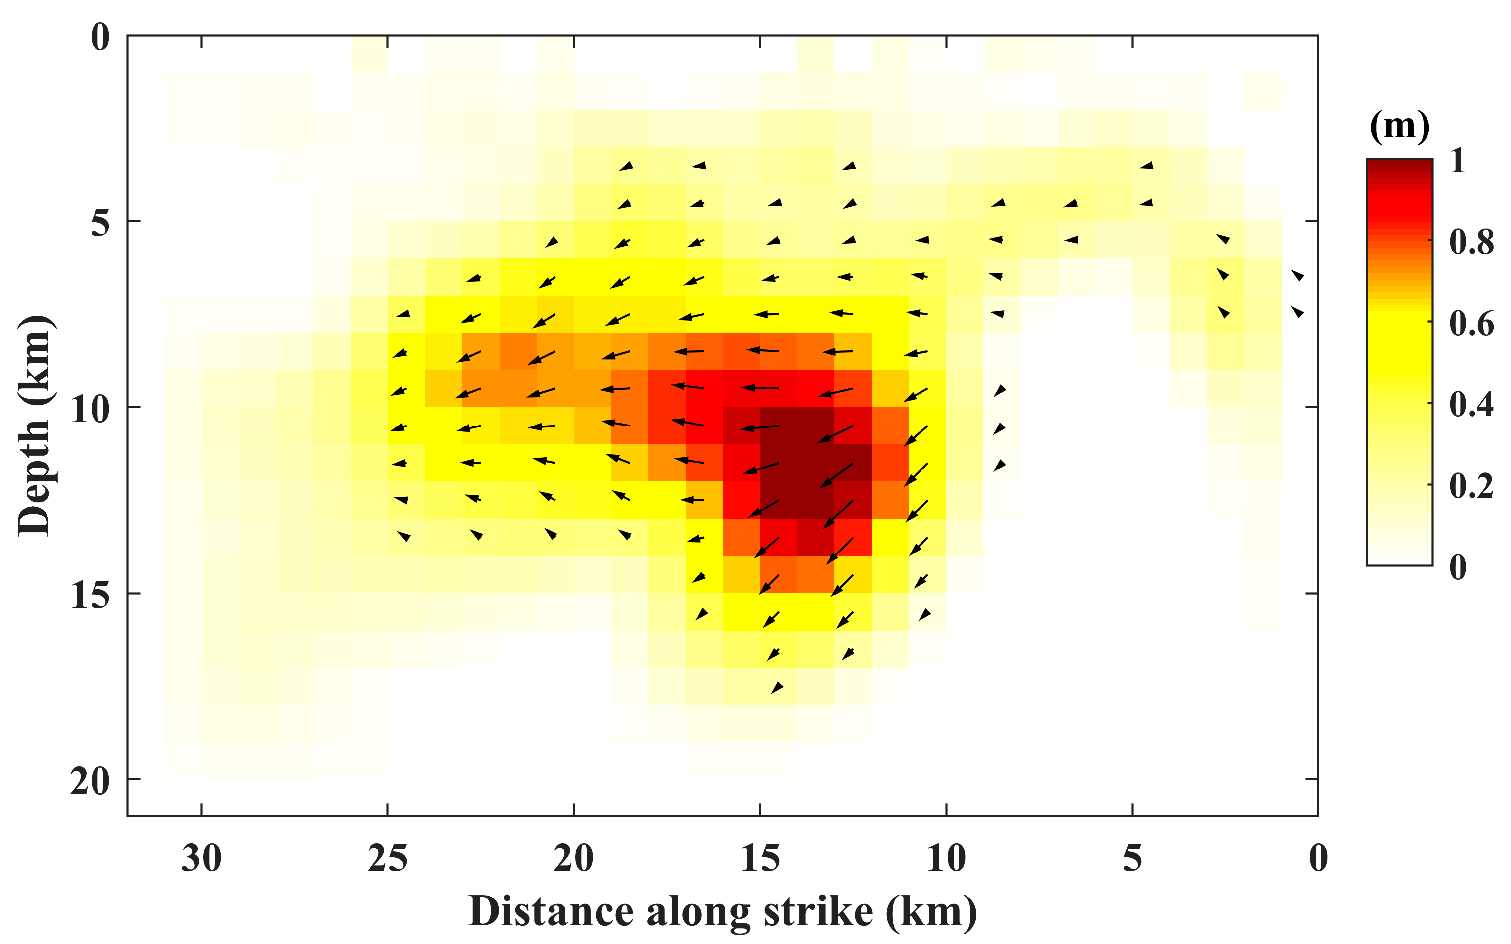
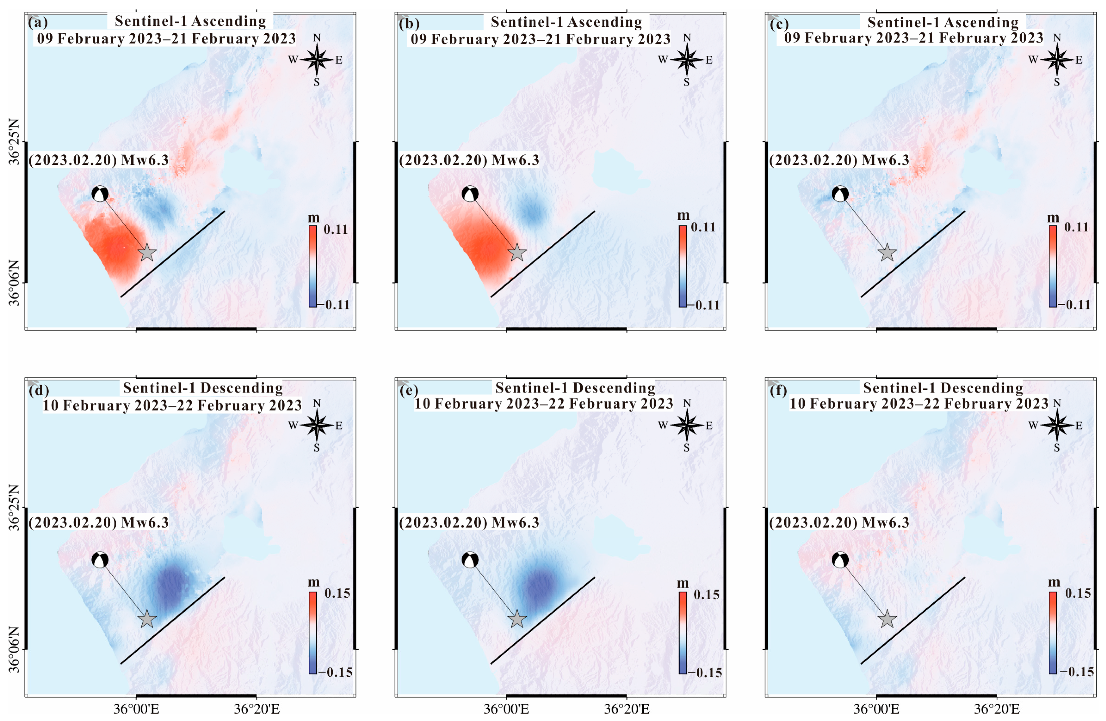
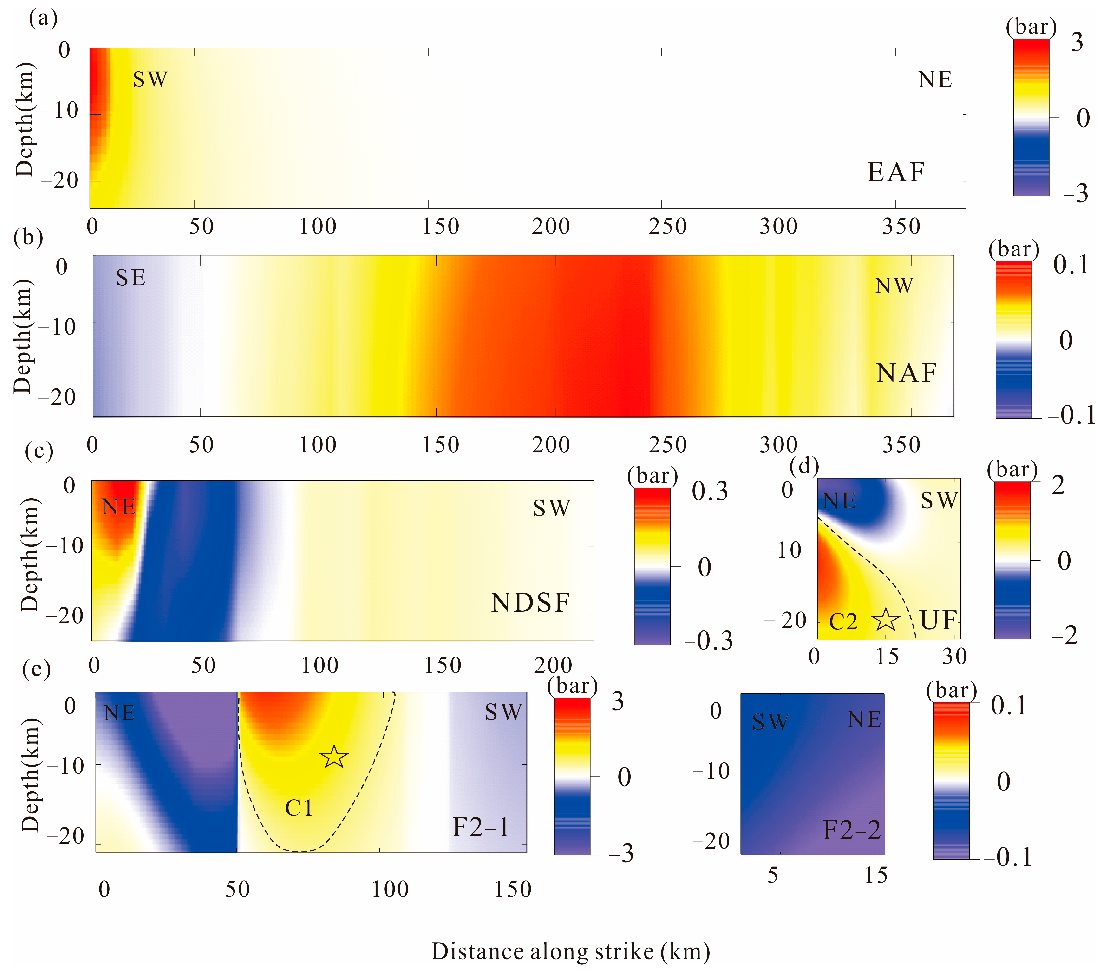
Firstly, the deformation of the ascending and descending tracks measured using Sentinel-1 satellite images was used to estimate the faulting model of the Mw 6.3 Uzunba earthquake (Figure 8), and the main parameters of the used image pairs are listed in Table 1. The observations, simulations, and residuals are shown in Figure 9. The estimated optimal strike angle is 231°, the dip angle is 47.5°, and the rake angle is −0.2°. This earthquake was characterized by a predominately sinistral strike-slip motion, accompanied by some dip-slip motion. The estimated maximum fault slip is up to ~1.0 m. The static CFS changes on the seismogenic fault of the Elbistan earthquake (the F2-1 fault and F2-2 fault, shown in Figure 7) due to the Pazarcik earthquake and the seismogenic fault of the Uzunba earthquake (the UF fault, shown in Figure 8) due to the 2023 Turkey-Syria earthquake doublet were calculated, respectively. The coefficient of friction, rigidity, and Poisson’s ratio were set as 0.4, 30 GPa, and 0.25, respectively. It could be found from Figure 10e that a CFS increase zone (the C1 zone) was located at 50–110 km along the fault strike direction, with a maximum of 4.7 bar. The increase in the CFS at the hypocenter of the Elbistan earthquake exceeded 1.0 bar. This suggests that the rupture of the Pazarcik earthquake had a positive effect in triggering the fault rupture during the subsequent Elbistan event. For the Uzunba earthquake, a significant CFS increase zone (the C2 zone) with a peak value of 1.6 bar was also identified in Figure 10d, and the hypocenter of the Uzunba earthquake was located within this zone; thus, it can be inferred that the former events had a favorable impact in initiating the Uzunba rupture.
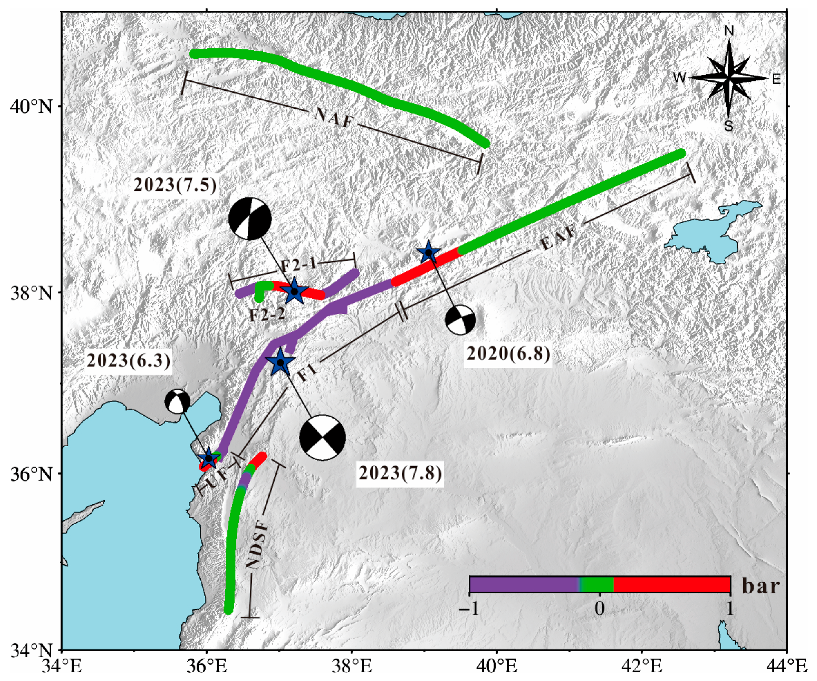
Based on the fault models shown in Figure 7 and Figure 8, the triggered static CFS changes on the North Anatolian Fault, the northern segment of the Dead Sea Fault, and the unruptured segment of the East Anatolian Fault due to the 2023 Turkey-Syria earthquake sequence (including the 6.3 Uzunba earthquake) were calculated. The spatial relationship among these faults is shown in Figure 11. All three faults shared the same dip angle of 87°, and the rake angles were set as 180°, 0°, and 0° for the NAF, DSF, and EAF, respectively [8]. These results show that this earthquake sequence has minimal impact on the North Anatolian Fault but promotes the rupture of the Puturge segment of the EAF and the northern segment of the Dead Sea Fault. Specifically, there is a significant CFS increase zone with a maximum of 3.0 bar in the Puturge segment of the EAF, indicating an elevated risk of future rupture. It is noteworthy that the 2020 Mw 6.8 Sivrice earthquake has partially released the accumulated stress in this segment [43]. Therefore, the possibility of an imminent seismic rupture or earthquake is relatively minimal. As for the northern segment of the Dead Sea Fault, a significant positive Coulomb stress change zone can be found at a distance of 0–20 km along the fault strike direction, indicating an increased possibility of future rupture. Furthermore, the long-term absence of large-scale earthquakes on this fault also suggests a high seismic risk [44]. Hence, it is necessary to give more attention to this fault.

5.2. A Special Post-Seismic Deformation Zone

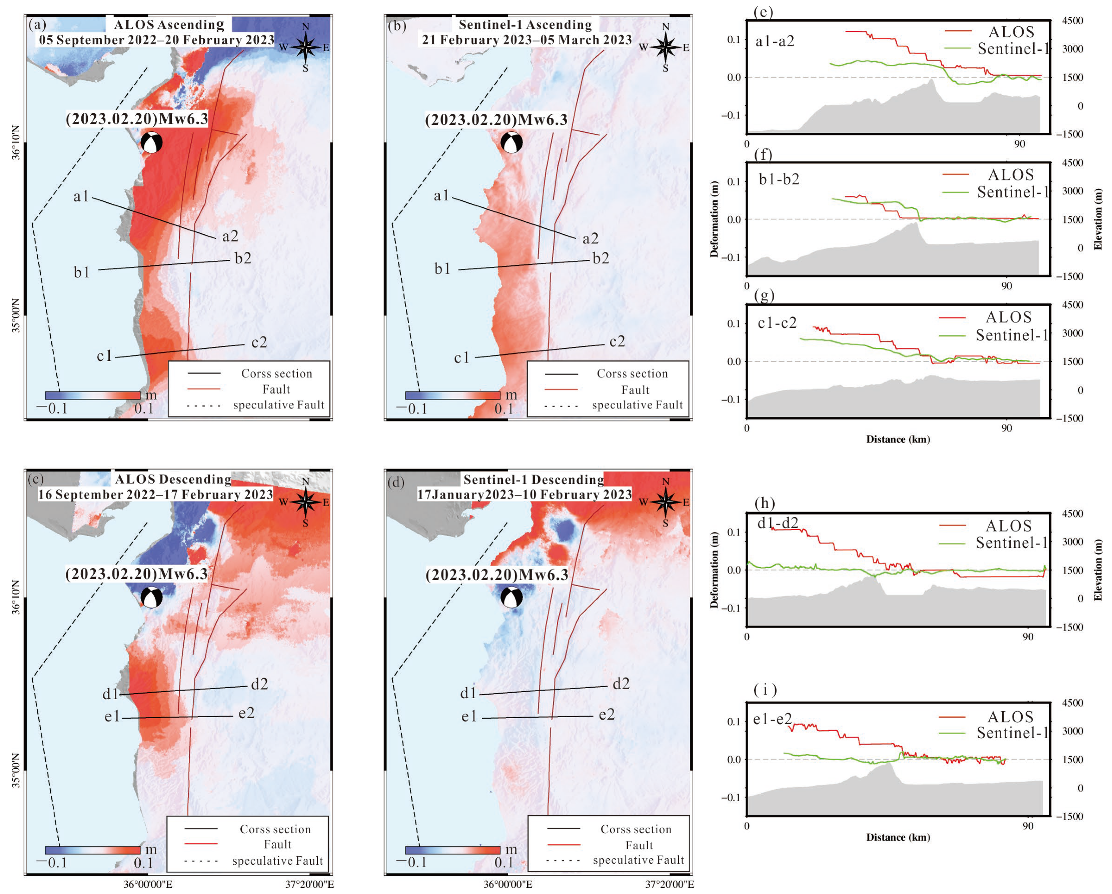
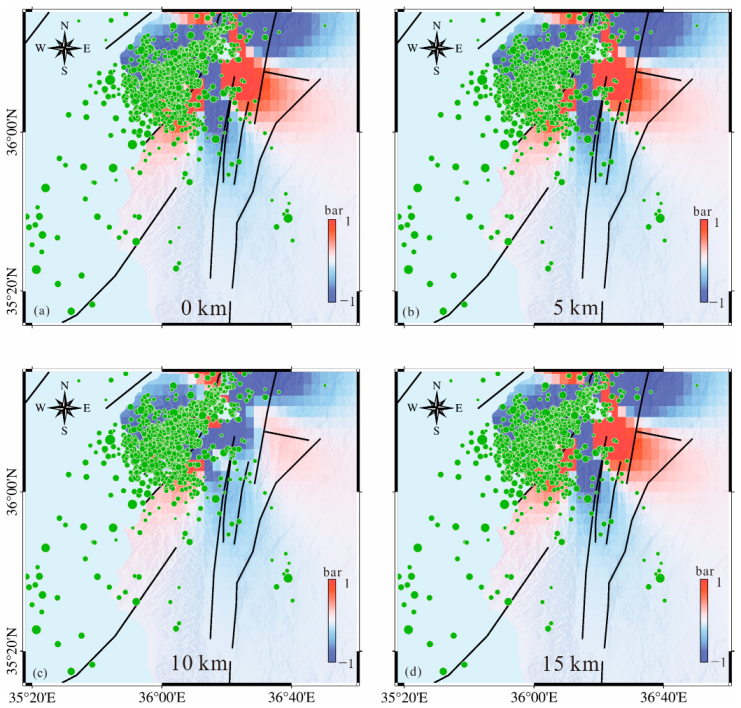
A significant post-seismic deformation zone located near the Dead Sea Fault could be found from both the ALOS-2 and Sentinel-1 InSAR observations (Figure 12). This zone locates at the intersection of the African, Arabian, and Anatolian plates, which is characterized by multiple faults and a complex tectonic background. The northern boundary of the deformed zone is adjacent to the EAF and may be affected by the 2023 Turkey-Syria earthquake doublet. The observed post-seismic deformation zone extends over 200 km along the NS direction, with the maximum deformation exceeding 0.1 m along the LOS direction. It exhibits a towards-satellite deformation trend in both ascending and descending tracks. The cross-sectional profile reveals an increase in deformation towards the western coastline, and the extension of deformation is inhibited by the Dead Sea Fault. Therefore, it can be inferred that the deformation may be caused by submarine fault activity. In addition, the effects of the 2023 Turkey-Syria earthquake doublet and the Uzunba earthquake on the deformation zone were investigated by calculating CFS changes at various depths (0 km, 5 km, 10 km, and 15 km) with a rake angle of 0° based on the coseismic fault slip model estimated in this study; the results are shown in Figure 13. The distribution patterns of the CFS change at different depths are generally similar, with positive values observed in the northern part of the deformation zone, implying an increased risk of fault rupture.
The geological complexity and high density of faults near the EAF fault system warrant further comprehensive research on nearby major faults, particularly the Dead Sea Fault, valuable for assessing seismic hazards in the future. This entails utilizing geodetic data to extract interseismic deformation fields along the Dead Sea Fault, estimating interseismic fault slip models, calculating slip deficit rates, and integrating historical earthquake catalogs and geological information to determine the elapsed time since the last earthquake. Through such comprehensive assessments, it becomes possible to evaluate seismic hazards and determine the maximum potential earthquake magnitude. Moreover, the continuous motion observed within the identified special deformation zone warrants further extensive investigation to enhance understanding in this area.

6. Conclusions

A comprehensive investigation was carried out utilizing SAR images, GPS displacement data, historical earthquakes, and aftershocks to investigate the coseismic slip model, the stress-triggering relationship between the two Mw 7.5+ earthquakes, their impact on the occurrence of the 6.3 Mw earthquake on 20 February, and the effects of the 2023 Turkey-Syria earthquake on neighboring large faults. The main results indicate the following:
(1)
The geometry of the fault that ruptured during the 2023 Turkey-Syria earthquake doublet is highly complex, with a surface rupture length exceeding 300 km. Both Mw 7.5+ earthquakes were dominated by the left-lateral strike-slip motion, with a slip peak of ~10.8 m located near the ground surface, three distinct asperities clearly discernible along the major fault, and a total released seismic moment of 10.15 × 10²⁰ Nm.
(2)
The Mw 7.8 Pazarcik earthquake is believed to have triggered the subsequent Elbistan earthquake by increasing CFS (>1 bar) in the nucleation zone of the Elbistan earthquake. These two earthquakes collectively facilitated the occurrence of the Uzunba earthquake on 20 February through stress redistribution.
(3)
For the adjacent large faults, the 2023 Turkey-Syria earthquake promoted the rupture of the Puturge segment of the EAF fault and the northern segment of the Dead Sea Fault. Due to the minor CFS variations, this earthquake has a negligible impact on other neighboring major faults. Notably, the absence of large-magnitude earthquakes in the northern segment of the DSF for several centuries suggests an increasing risk of future seismic hazards.
(4)
A special deformation zone adjacent to the Dead Sea Fault was identified, characterized by an increase in deformation towards the western coastline. The extension of deformation is inhibited by the Dead Sea Fault, which may be attributed to the activity of a submarine fault.

Author Contributions

Conceptualization, J.-J.Z., Q.C. and Y.-H.Y.; Methodology and software, J.-J.Z. and Q.X.; Validation, J.-J.Z. and Q.X.; Resources, Y.-H.Y.; Writing—original draft preparation, J.-J.Z.; Writing—review and editing, J.-J.Z., Q.C. and Y.-H.Y.; Visualization, J.-J.Z. and Q.X.; Supervision, Q.C. and Y.-H.Y. All authors have read and agreed to the published version of the manuscript.

Funding

This work was supported by the State Key Laboratory of Geohazard Prevention and Geoenvironment Protection Independent Research Project (SKLGP2021Z016).

Data Availability Statement

The Sentinel-1 SAR images were provided by the European Space Agency (ESA). The ALOS-2 images used in this study are provided by the Japan Aerospace Exploration Agency (JAXA). SRTM DEM data are the void-filled seamless SRTM data V4, available from the CGIAR-CSI SRTM 30 database: http://srtm.csi.cgiar.org/, accessed on 10 April 2023. The GACOS data are freely available here: www.gacos.net, accessed on 20 March 2023. The GPS data are collected from the Nevada Geodetic Laboratory (http://geodesy.unr.edu/, accessed on 6 March 2023).

Acknowledgments

Most of the figures were plotted with the Generic Mapping Tool (GMT6) software provided by Wessel and Smith (1998).

Conflicts of Interest

The authors declare no conflict of interest.

References

  1. ISC. ISC-GEM Global Instrumental Earthquake Catalogue (1904–2018); International Seismological Centre: Thatcham, UK, 2022. [Google Scholar]
  2. Zilio, D.; Ampuero, J.-P. Earthquake doublet in Turkey and Syria. Commun. Earth Environ. 2023, 4, 71. [Google Scholar] [CrossRef]
  3. Güvercin, S.E.; Karabulut, H.; Konca, A.Ö.; Doğan, U.; Ergintav, S. Active seismotectonics of the East Anatolian Fault. Geophys. J. Int. 2022, 230, 50–69. [Google Scholar] [CrossRef]
  4. Reilinger, R.; McClusky, S.; Vernant, P.; Lawrence, S.; Ergintav, S.; Cakmak, R.; Ozener, H.; Kadirov, F.; Guliev, I.; Stepanyan, R.; et al. GPS constraints on continental deformation in the Africa-Arabia-Eurasia continental collision zone and implications for the dynamics of plate interactions. J. Geophys. Res. 2006, 111, B05411. [Google Scholar] [CrossRef]
  5. Viltres, R.; Jónsson, S.; Alothman, A.O.; Liu, S.; Leroy, S.; Masson, F.; Doubre, C.; Reilinger, R. Present-Day Motion of the Arabian Plate. Tectonics 2022, 41, e2021TC007013. [Google Scholar] [CrossRef]
  6. Legendre, C.P.; Zhao, L.; Tseng, T.-L. Large-scale variation in seismic anisotropy in the crust and upper mantle beneath Anatolia, Turkey. Commun. Earth Environ. 2021, 2, 73. [Google Scholar] [CrossRef]
  7. Allmendinger, R.W.; Reilinger, R.; Loveless, J. Strain and rotation rate from GPS in Tibet, Anatolia, and the Altiplano. Tectonics 2007, 26. [Google Scholar] [CrossRef] [Green Version]
  8. Emre, Ö.; Duman, T.Y.; Özalp, S.; Şaroğlu, F.; Olgun, Ş.; Elmacı, H.; Çan, T. Active fault database of Turkey. Bull. Earthq. Eng. 2018, 16, 3229–3275. [Google Scholar] [CrossRef]
  9. McClusky, S.; Balassanian, S.; Barka, A.; Demir, C.; Ergintav, S.; Georgiev, I.; Gurkan, O.; Hamburger, M.; Hurst, K.; Kahle, H.; et al. Global Positioning System constraints on plate kinematics and dynamics in the eastern Mediterranean and Caucasus. J. Geophys. Res. 2000, 105, 5695–5719. [Google Scholar] [CrossRef]
  10. Lyberis, N.; Yurur, T.; Chorowicz, J.; Kasapoglu, E.; Gundogdu, N. The East Anatolian Fault: An oblique collisional belt. Tectonophysics 1992, 204, 1–15. [Google Scholar] [CrossRef]
  11. McKenzie, D. Active Tectonics of the Mediterranean Region. Geophys. J. Int. 1972, 30, 109–185. [Google Scholar] [CrossRef] [Green Version]
  12. Lazos, I.; Sboras, S.; Pikridas, C.; Pavlides, S.; Chatzipetros, A. Geodetic analysis of the tectonic crustal deformation pattern in the North Aegean Sea, Greece. Mediterr. Geosci. Rev. 2021, 3, 79–94. [Google Scholar] [CrossRef]
  13. Müller, M.D.; Geiger, A.; Kahle, H.G.; Veis, G.; Billiris, H.; Paradissis, D.; Felekis, S. Velocity and deformation fields in the North Aegean domain, Greece, and implications for fault kinematics, derived from GPS data 1993–2009. Tectonophysics 2013, 597–598, 34–49. [Google Scholar] [CrossRef]
  14. Nyst, M.; Thatcher, W. New constraints on the active tectonic deformation of the Aegean. J. Geophys. Res. 2004, 109. [Google Scholar] [CrossRef]
  15. Doǧangün, A. Performance of reinforced concrete buildings during the May 1, 2003 Bingöl Earthquake in Turkey. Eng. Struct. 2004, 26, 841–856. [Google Scholar] [CrossRef]
  16. Calayır, Y.; Sayın, E.; Yön, B. Performance of structures in the rural area during the March 8, 2010 Elazığ-Kovancılar earthquake. Nat. Hazards 2012, 61, 703–717. [Google Scholar] [CrossRef]
  17. Isik, E.; Aydin, M.C.; Buyuksarac, A. 24 January 2020 Sivrice (Elazığ) earthquake damages and determination of earthquake parameters in the region. Earthq. Struct. 2020, 19, 145–156. [Google Scholar]
  18. Cerovečki, A.; Gharahjeh, S.; Harirchian, E.; Ilin, D.; Okhotnikova, K.; Kersten, J. Evaluation of Change Detection Techniques Using Very High Resolution Optical Satellite Imagery. Preface 2015, 2, 20. [Google Scholar]
  19. Jafari, M.; Aflaki, M.; Mousavi, Z.; Walpersdorf, A.; Motaghi, K. Coseismic and post-seismic characteristics of the 2021 Ganaveh earthquake along the Zagros foredeep fault based on InSAR data. Geophys. J. Int. 2023, 234, 1125–1142. [Google Scholar] [CrossRef]
  20. Werner, C.; Wegmuller, U.; Strozzi, T.; Wiesmann, A. Gamma SAR processor and interferometry software. In Proceedings of the 3rd ERS Symposium, Space Service Environment (Special Publication 414 ESA), Florence, Italy, 14–21 March 1997; Volume III, pp. 1687–1692. [Google Scholar]
  21. Yu, C.; Li, Z.; Penna, N.T.; Crippa, P. Generic Atmospheric Correction Model for Interferometric Synthetic Aperture Radar Observations. J. Geophys. Res. 2018, 123, 9202–9222. [Google Scholar] [CrossRef]
  22. Gomba, G.; Parizzi, A.; Zan, F.D.; Eineder, M.; Bamler, R. Toward Operational Compensation of Ionospheric Effects in SAR Interferograms: The Split-Spectrum Method. IEEE Trans. Geosci. Remote Sens. 2016, 54, 1446–1461. [Google Scholar] [CrossRef] [Green Version]
  23. Gomba, G.; González, F.R.; Zan, F.D. Ionospheric Phase Screen Compensation for the Sentinel-1 TOPS and ALOS-2 ScanSAR Modes. IEEE Trans. Geosci. Remote Sens. 2017, 55, 223–235. [Google Scholar] [CrossRef]
  24. Goldstein, R.M.; Werner, C.L. Radar interferogram filtering for geophysical applications. Geophys. Res. Lett. 1998, 25, 4035–4038. [Google Scholar] [CrossRef] [Green Version]
  25. Chen, C.W.; Zebker, H.A. Network approaches to two-dimensional phase unwrapping: Intractability and two new algorithms. J. Opt. Soc. Am. A 2000, 17, 401–414. [Google Scholar] [CrossRef] [PubMed]
  26. Hanssen, R.F. Radar Interferometry: Data Interpretation and Error Analysis; Springer Science & Business Media: Berlin/Heidelberg, Germany, 2001; Volume 2. [Google Scholar]
  27. Zou, W.; Li, Y.; Li, Z.; Ding, X. Improvement of the Accuracy of InSAR Image Co-Registration Based on Tie Points—A Review. Sensors 2009, 9, 1259–1281. [Google Scholar] [CrossRef] [Green Version]
  28. Sun, L.; Muller, J.-P. Evaluation of the Use of Sub-Pixel Offset Tracking Techniques to Monitor Landslides in Densely Vegetated Steeply Sloped Areas. Remote Sens. 2016, 8, 659. [Google Scholar] [CrossRef] [Green Version]
  29. Wessel, P.; Smith, W.H. New, improved version of Generic Mapping Tools released. Eos Trans. Am. Geophys. Union 1998, 79, 579. [Google Scholar] [CrossRef]
  30. Yang, Y.-H.; Tsai, M.-C.; Hu, J.-C.; Aurelio, M.A.; Hashimoto, M.; Escudero, J.A.P.; Su, Z.; Chen, Q. Coseismic Slip Deficit of the 2017 Mw 6.5 Ormoc Earthquake That Occurred Along a Creeping Segment and Geothermal Field of the Philippine Fault. Geophys. Res. Lett. 2018, 45, 2659–2668. [Google Scholar] [CrossRef]
  31. Okada, Y. Surface deformation due to shear and tensile faults in a half-space. Bull. Seismol. Soc. Am. 1985, 75, 1135–1154. [Google Scholar] [CrossRef]
  32. Lomax, A. Precise, NLL-SSST-Coherence Hypocenter Catalog for the 2023 Mw 7.8 and Mw 7.6 SE Turkey Earthquake Sequence. 2023. Available online: https://zenodo.org/record/7699882 (accessed on 10 April 2023).
  33. King, G.C.P.; Stein, R.S.; Lin, J. Static stress changes and the triggering of earthquakes. Bull. Seismol. Soc. Am. 1994, 84, 935–953. [Google Scholar]
  34. Harris, R.A.; Simpson, R.W.; Reasenberg, P.A. Influence of static stress changes on earthquake locations in southern California. Nature 1995, 375, 221–224. [Google Scholar] [CrossRef]
  35. Wan, Y.; Shen, Z.-K. Static Coulomb stress changes on faults caused by the 2008 Mw 7.9 Wenchuan, China earthquake. Tectonophysics 2010, 491, 105–118. [Google Scholar] [CrossRef]
  36. Kilb, D.; Gomberg, J.; Bodin, P. Aftershock triggering by complete Coulomb stress changes. J. Geophys. Res. 2002, 107, ESE 2-1–ESE 2-14. [Google Scholar] [CrossRef]
  37. Harris, R.A.; Simpson, R.W. Changes in static stress on southern California faults after the 1992 Landers earthquake. Nature 1992, 360, 251–254. [Google Scholar] [CrossRef]
  38. Hanks, T.C. Earthquake stress drops, ambient tectonic stresses and stresses that drive plate motions. Pure Appl. Geophys. 1977, 115, 441–458. [Google Scholar] [CrossRef]
  39. Gomberg, J.; Blanpied, M.L.; Beeler, N.M. Transient triggering of near and distant earthquakes. Bull. Seismol. Soc. Am. 1997, 87, 294–309. [Google Scholar] [CrossRef]
  40. Stein, R.S.; Barka, A.A.; Dieterich, J.H. Progressive failure on the North Anatolian fault since 1939 by earthquake stress triggering. Geophys. J. Int. 1997, 128, 594–604. [Google Scholar] [CrossRef] [Green Version]
  41. Heidbach, O.; Ben-Avraham, Z. Stress evolution and seismic hazard of the Dead Sea Fault System. Earth Planet. Sci. Lett. 2007, 257, 299–312. [Google Scholar] [CrossRef] [Green Version]
  42. Liu, X.; Chen, Q.; Yang, Y.; Xu, Q.; Zhao, J.; Xu, L.; Liu, R. The 2021 Mw 7.4 Maduo earthquake: Coseismic slip model, triggering effect of historical earthquakes and implications for adjacent fault rupture potential. J. Geodyn. 2022, 151, 101920. [Google Scholar] [CrossRef]
  43. Alkan, H.; Büyüksaraç, A.; Bektaş, Ö.; Işık, E. Coulomb stress change before and after 24.01.2020 Sivrice (Elazığ) Earthquake (Mw = 6.8) on the East Anatolian Fault Zone. Arab. J. Geosci. 2021, 14, 2648. [Google Scholar] [CrossRef]
  44. Meghraoui, M.; Gomez, F.; Sbeinati, R.; Van der Woerd, J.; Mouty, M.; Darkal, A.N.; Radwan, Y.; Layyous, I.; Al Najjar, H.; Darawcheh, R.; et al. Evidence for 830 years of seismic quiescence from palaeoseismology, archaeoseismology and historical seismicity along the Dead Sea fault in Syria. Earth Planet. Sci. Lett. 2003, 210, 35–52. [Google Scholar] [CrossRef]
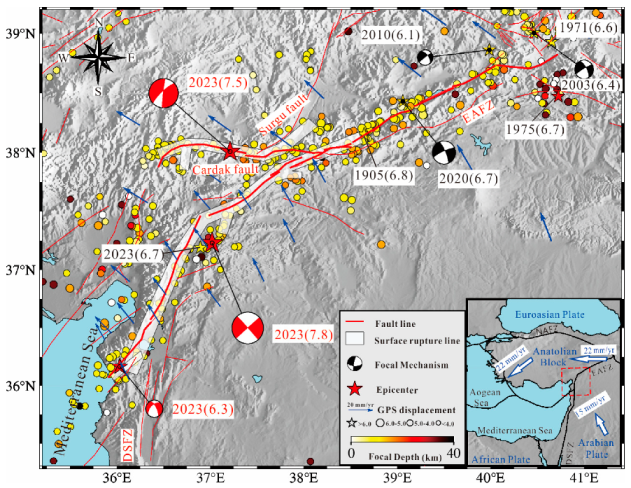
Figure 1. Tectonic setting of the study area. Recorded earthquake (M > 4.5) from USGS solution before the 2023 Turkey-Syria earthquake doublet, main faults (red lines), are shown on a shaded relief of SRTM-4 DEM. Stars indicate the epicenters of the major seismic events. GPS data are from Reilinger et al. [4]. EAFZ: East Anatolian Fault Zone, NAFZ: North Anatolian Fault Zone, DSFZ: Dead Sea Fault Zone. The red beach balls depict the focal mechanisms of the 2023 Turkey-Syria earthquake doublet and the largest aftershock and the black beach balls represent the focal mechanisms of historical earthquakes.
Remotesensing 15 03327 g001
Figure 2. The ground coverage of the SAR images used in the 2023 Turkey-Syria earthquake doublet. The dots show the aftershocks and the cyan stars show the epicenters of the 2023 Turkey-Syria earthquake doublet.
Remotesensing 15 03327 g002
Figure 3. Surface deformation in the range direction measured by the POT technique from the ascending (a) and descending (b) Sentinel-1 tracks. Bold lines indicate the surface traces of the seismogenic faults. The positive signals represent ground deformation moving toward the satellite, while the negative displacements mean movements far away from the satellite. The stars and the beach balls show the epicenters and the focal mechanisms of the 2023 Turkey-Syria earthquake doublet.
Remotesensing 15 03327 g003
Figure 4. Coseismic horizontal GPS deformation related to the Pazarcik (a) and Elbistan (b) earthquakes. (The GPS data are collected from the Nevada Geodetic Laboratory, http://geodesy.unr.edu/, accessed on 6 March 2023). The stars and the beach balls show the epicenters and the focal mechanisms of the 2023 Turkey-Syria earthquake doublet.
Remotesensing 15 03327 g004
Figure 5. Trade-off curve between the model RMSE and slip roughness, which indicates K = 7 is the optimal smoothing factor and further increasing the roughness does not lead to a significant improvement in the model misfit.
Remotesensing 15 03327 g005
Figure 6. Observed (a,d), predicted (b,e), and residual (c,f) surface deformation of the 2023 Turkey-Syria earthquake doublet for the ascending and descending ALOS-2 tracks. The black lines show the surface traces of the seismogenic faults. Stars and beach balls indicate the epicenter and focal mechanisms of this earthquake doublet. The positive signals represent ground deformation moving toward the satellite, while the negative displacements indicate movements away from the satellite.
Remotesensing 15 03327 g006
Figure 7. The coseismic slip distribution on the fault of the 2023 Turkey-Syria earthquake doublet. The gray dots show aftershocks from Lomax [32] and the red star shows the hypocenter. ‘F1-1’, ‘F1-2’, and ‘F1-3’ indicate the seismogenic faults of the Pazarcik earthquake and ‘F2-1’ and ‘F2-2’ indicate the seismogenic faults of the Elbistan earthquake. ‘S-1’, ‘S-2’, and ‘S-3’ indicate distinguished slip asperities.
Remotesensing 15 03327 g007
Figure 8. Coseismic faulting model of the Mw 6.3 Uzunba earthquake constrained by the InSAR data. The black arrows suggest the motion of the hanging wall relative to the footwall of the fault.
Remotesensing 15 03327 g008
Figure 9. Coseismic surface deformation related to the Mw 6.3 Uzunba earthquake. Observations (a,d), simulations (b,e), and residuals (c,f) for the Sentinel-1A ascending and descending tracks. The gray star and beach ball indicate the epicenter and focal mechanism of the Uzunba earthquake. The positive signals represent ground deformation moving toward the satellite, while the negative displacements indicate movements away from the satellite.
Remotesensing 15 03327 g009
Figure 10. The static CFS change on Turkey-Syriathe unruptured segment of the East Anatolian Fault (a), the North Anatolian Fault (b), the northern segment of the Dead Sea Fault (c) due to the 2023 Turkey-Syria earthquake sequence (including the 6.3 Uzunba earthquake). Additionally, the static CFS changes on the seismogenic fault of the Elbistan earthquake (e) due to the Pazarcik earthquake and the seismogenic fault of the Uzunba earthquake (d) due to the 2023 Turkey-Syria earthquake doublet. EAF: East Anatolian Fault, NAF: North Anatolian Fault, NDSF the northern end of Dead Sea Fault. UF: the seismogenic fault of the Mw 6.3 Uzunba earthquake, F2-1 and F2-2: the seismogenic faults of the Elbistan earthquake. ‘C1’ and ‘C2’ indicate distinguished CFS increase zone. The stars (d,e) indicate of the epicenter of the Uzunba and Elbistan earthquake.
Remotesensing 15 03327 g010
Figure 11. Coulomb failure stress changes on nearby faults caused by the 2023 Turkey-Syria earthquake. EAF: East Anatolian Fault, NAF: the North Anatolian Fault, NDSF the northern segment of the Dead Sea Fault. UF: the seismogenic fault of the Mw 6.3 Uzunba earthquake, F1: the seismogenic fault of the Pazarcik earthquake, F2-1 and F2-2: the seismogenic faults of the Elbistan earthquake. The positive signals represent an increase in Coulomb failure stress, promoting fault rupture, while the negative displacements indicate a decrease in Coulomb failures tress, inhibiting fault rupture.
Remotesensing 15 03327 g011
Figure 12. The InSAR deformation (ad) and profiles (ei) of the ascending and descending orbital tracks. Profiles a1a2, b1b2, and c1c2 are located in the ascending track, while profiles d1d2 and e1e2 are situated in the descending track. The black dashed line represents inferred active faults. The solid red lines show the regional faults. Beach balls indicate the focal mechanisms of the Mw 6.3 Uzunba earthquake. The positive value suggests surface movement towards the satellite, while the negative value indicates the ground motion far away from the satellite.
Remotesensing 15 03327 g012
Figure 13. Triggered Coulomb failure stress changes on 0 km (a), 5 km (b), 10 km (c), 15 km (d) by the 2023 Turkey-Syria earthquake doublet and the Mw 6.3 Uzunba earthquake. The green dots indicate the aftershocks and the solid black lines show the regional faults. The positive signals represent an increase in Coulomb failure stress, promoting fault rupture, while the negative displacements indicate a decrease in Coulomb failures tress, inhibiting fault rupture.
Remotesensing 15 03327 g013
Table 1. Parameters of the used radar image pairs for estimating the coseismic faulting model.
SensorOrbit DirectionAcquisition TimePerp. Baseline
(m)
Heading Angle (°)Incidence Angle (°)Imaging Mode
The 2023 Turkey-Syria earthquake doubletSentinel-1Ascending16 January 2023–
9 February 2023
4.9−13.033.9TOPS
Sentinel-1Descending29 January 2023–
10 February 2023
106−166.633.8TOPS
ALOS-2Ascending5 September 2022–
20 February 2023
−15.2−10.935.4ScanSAR
ALOS-2Descending16 September 2022–
17 February 2023
48.6−169.135.2ScanSAR
The Mw 6.3 Uzunba
earthquake
Sentinel-1Ascending9 February 2023–
21 February 2023
1.59−13.033.9TOPS
Sentinel-1Descending10 February 2023–
22 February 2023
66.9−166.933.9TOPS
Table 2. Source parameters of the 2023 Turkey-Syria earthquake doublet estimated by different institutions.
Institution/AuthorFaultStrike Angle (°)Dip Angle (°)Rake Angle (°)Mw
This studyF1~43~88~07.8
F2~26170−47.7
USGSF122889−17.75
F2~2617047.55
GCMTF15470117.8
F226142−87.7
CENCF123588−67.7
F226642−147.6
Note: ‘F1’ and ‘F2’ indicate the seismogenic faults of the Pazarcik and Elbistan earthquakes.
Disclaimer/Publisher’s Note: The statements, opinions and data contained in all publications are solely those of the individual author(s) and contributor(s) and not of MDPI and/or the editor(s). MDPI and/or the editor(s) disclaim responsibility for any injury to people or property resulting from any ideas, methods, instructions or products referred to in the content.