

Analysis of Four Decades of Land Use and Land Cover Change in Semiarid Tunisia Using Google Earth Engine
 ,
,  and
and 
Abstract
1. Introduction
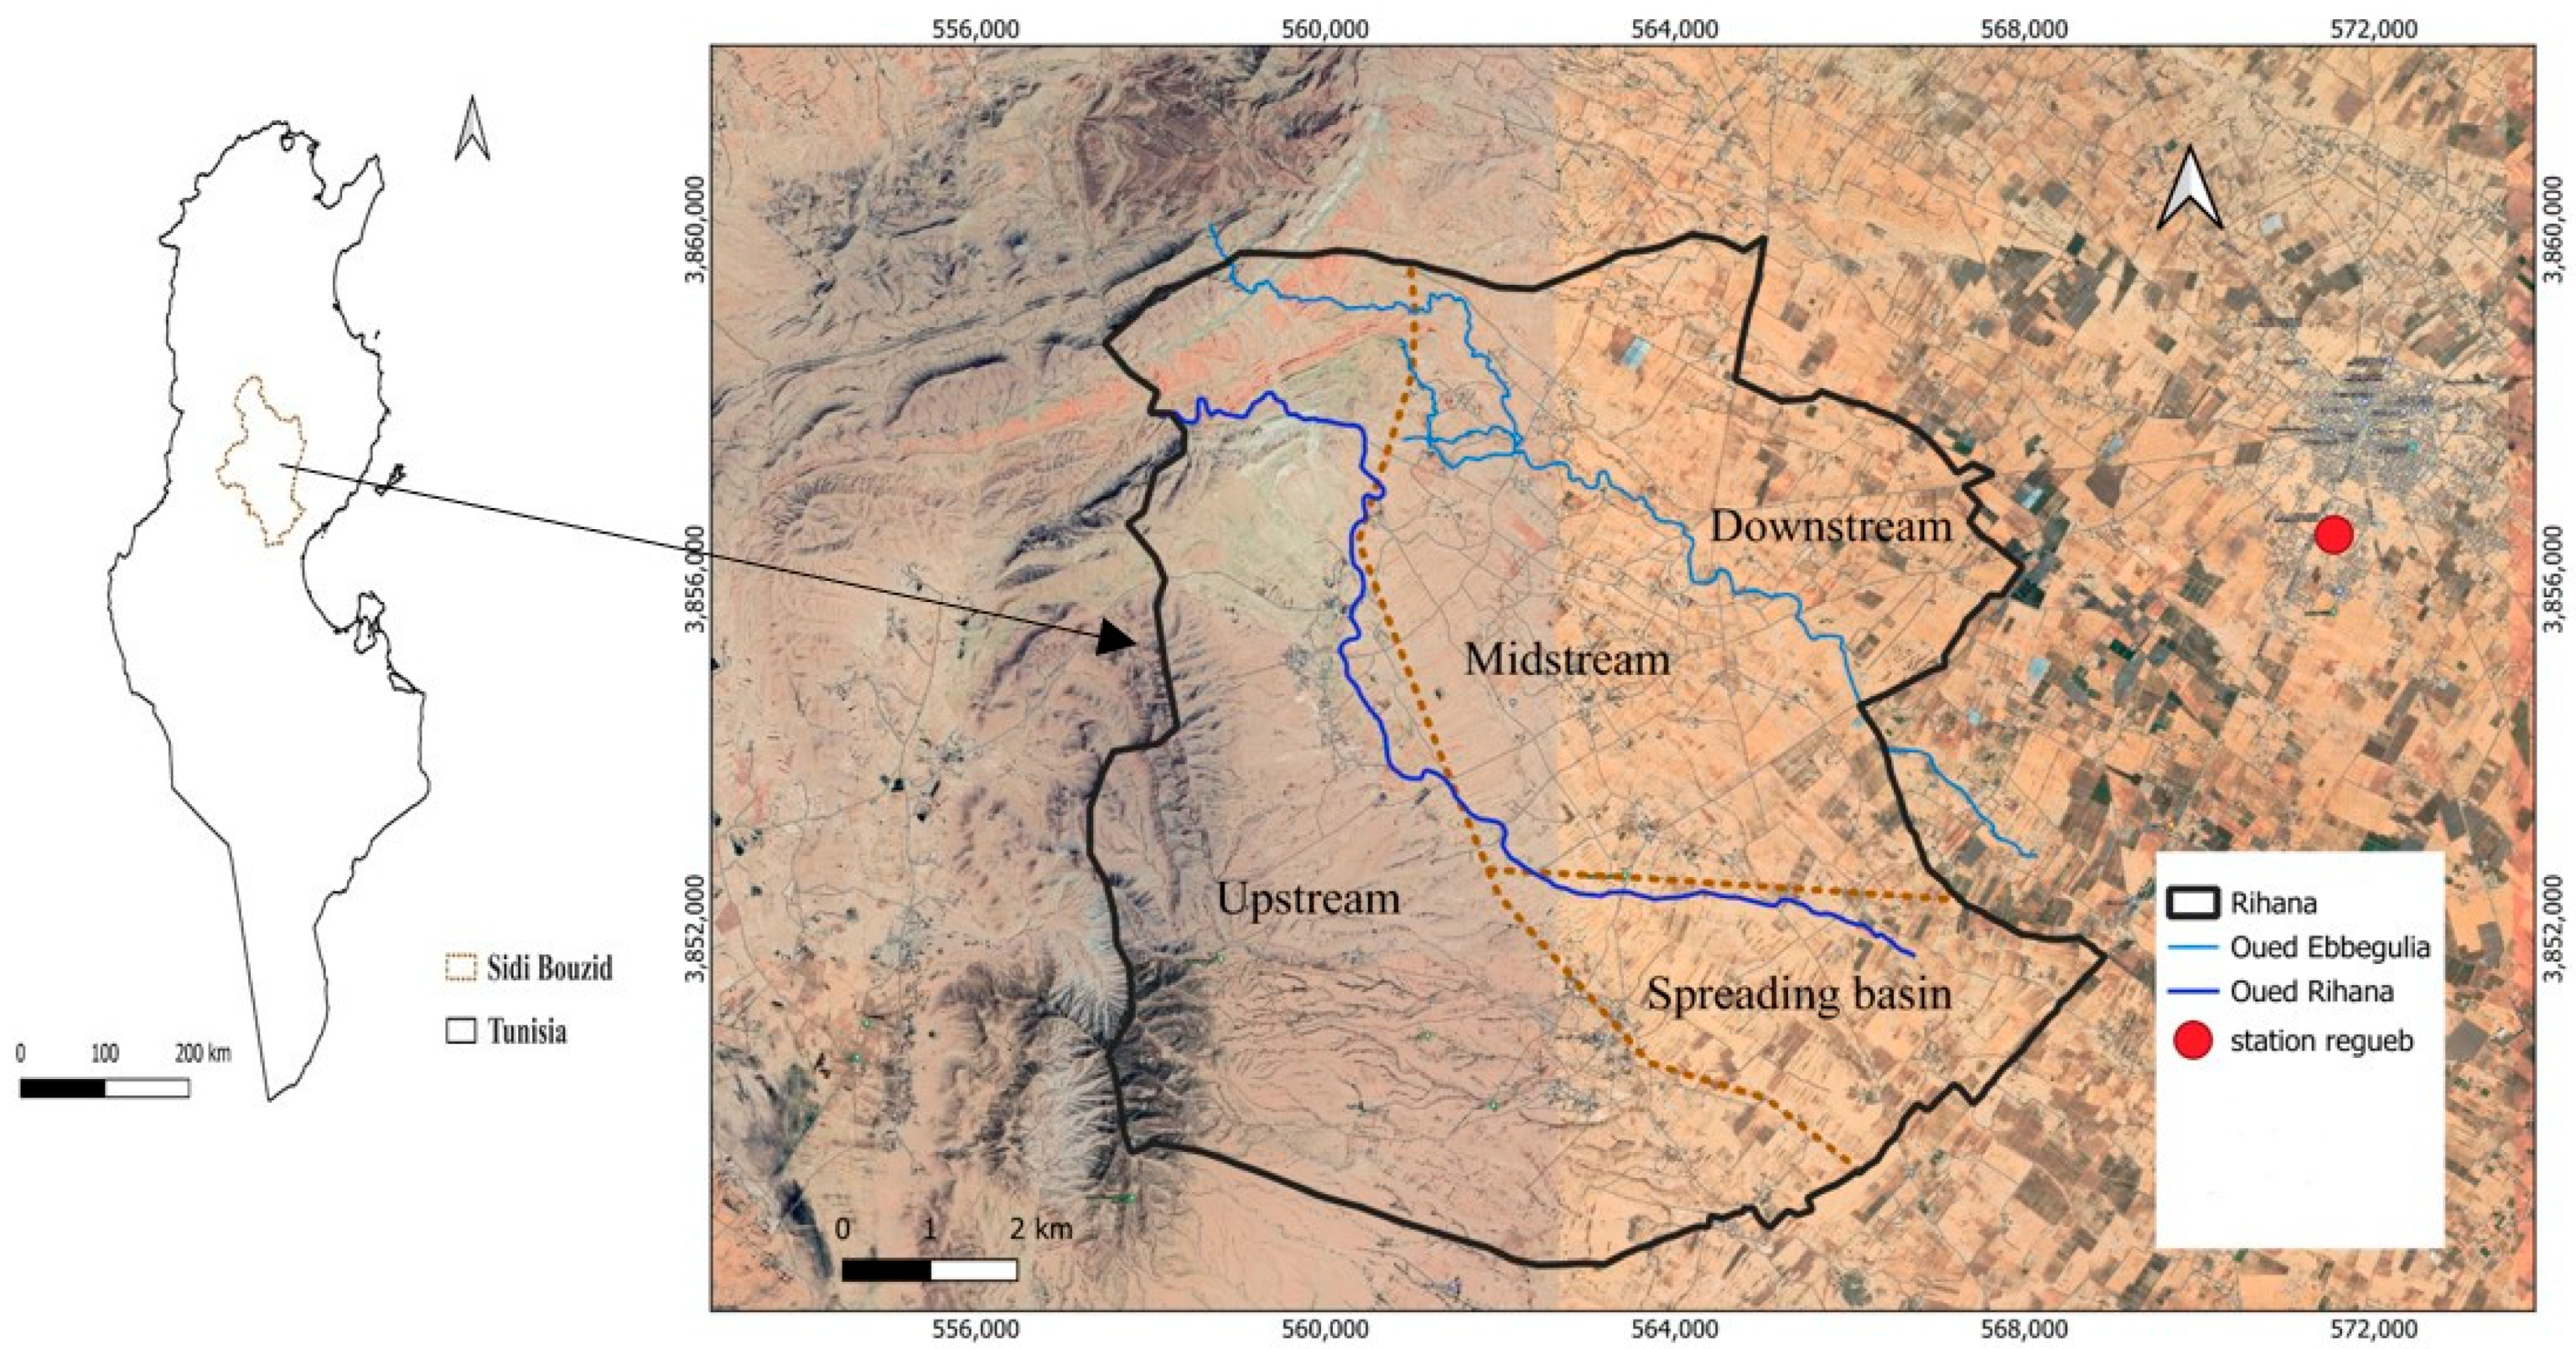
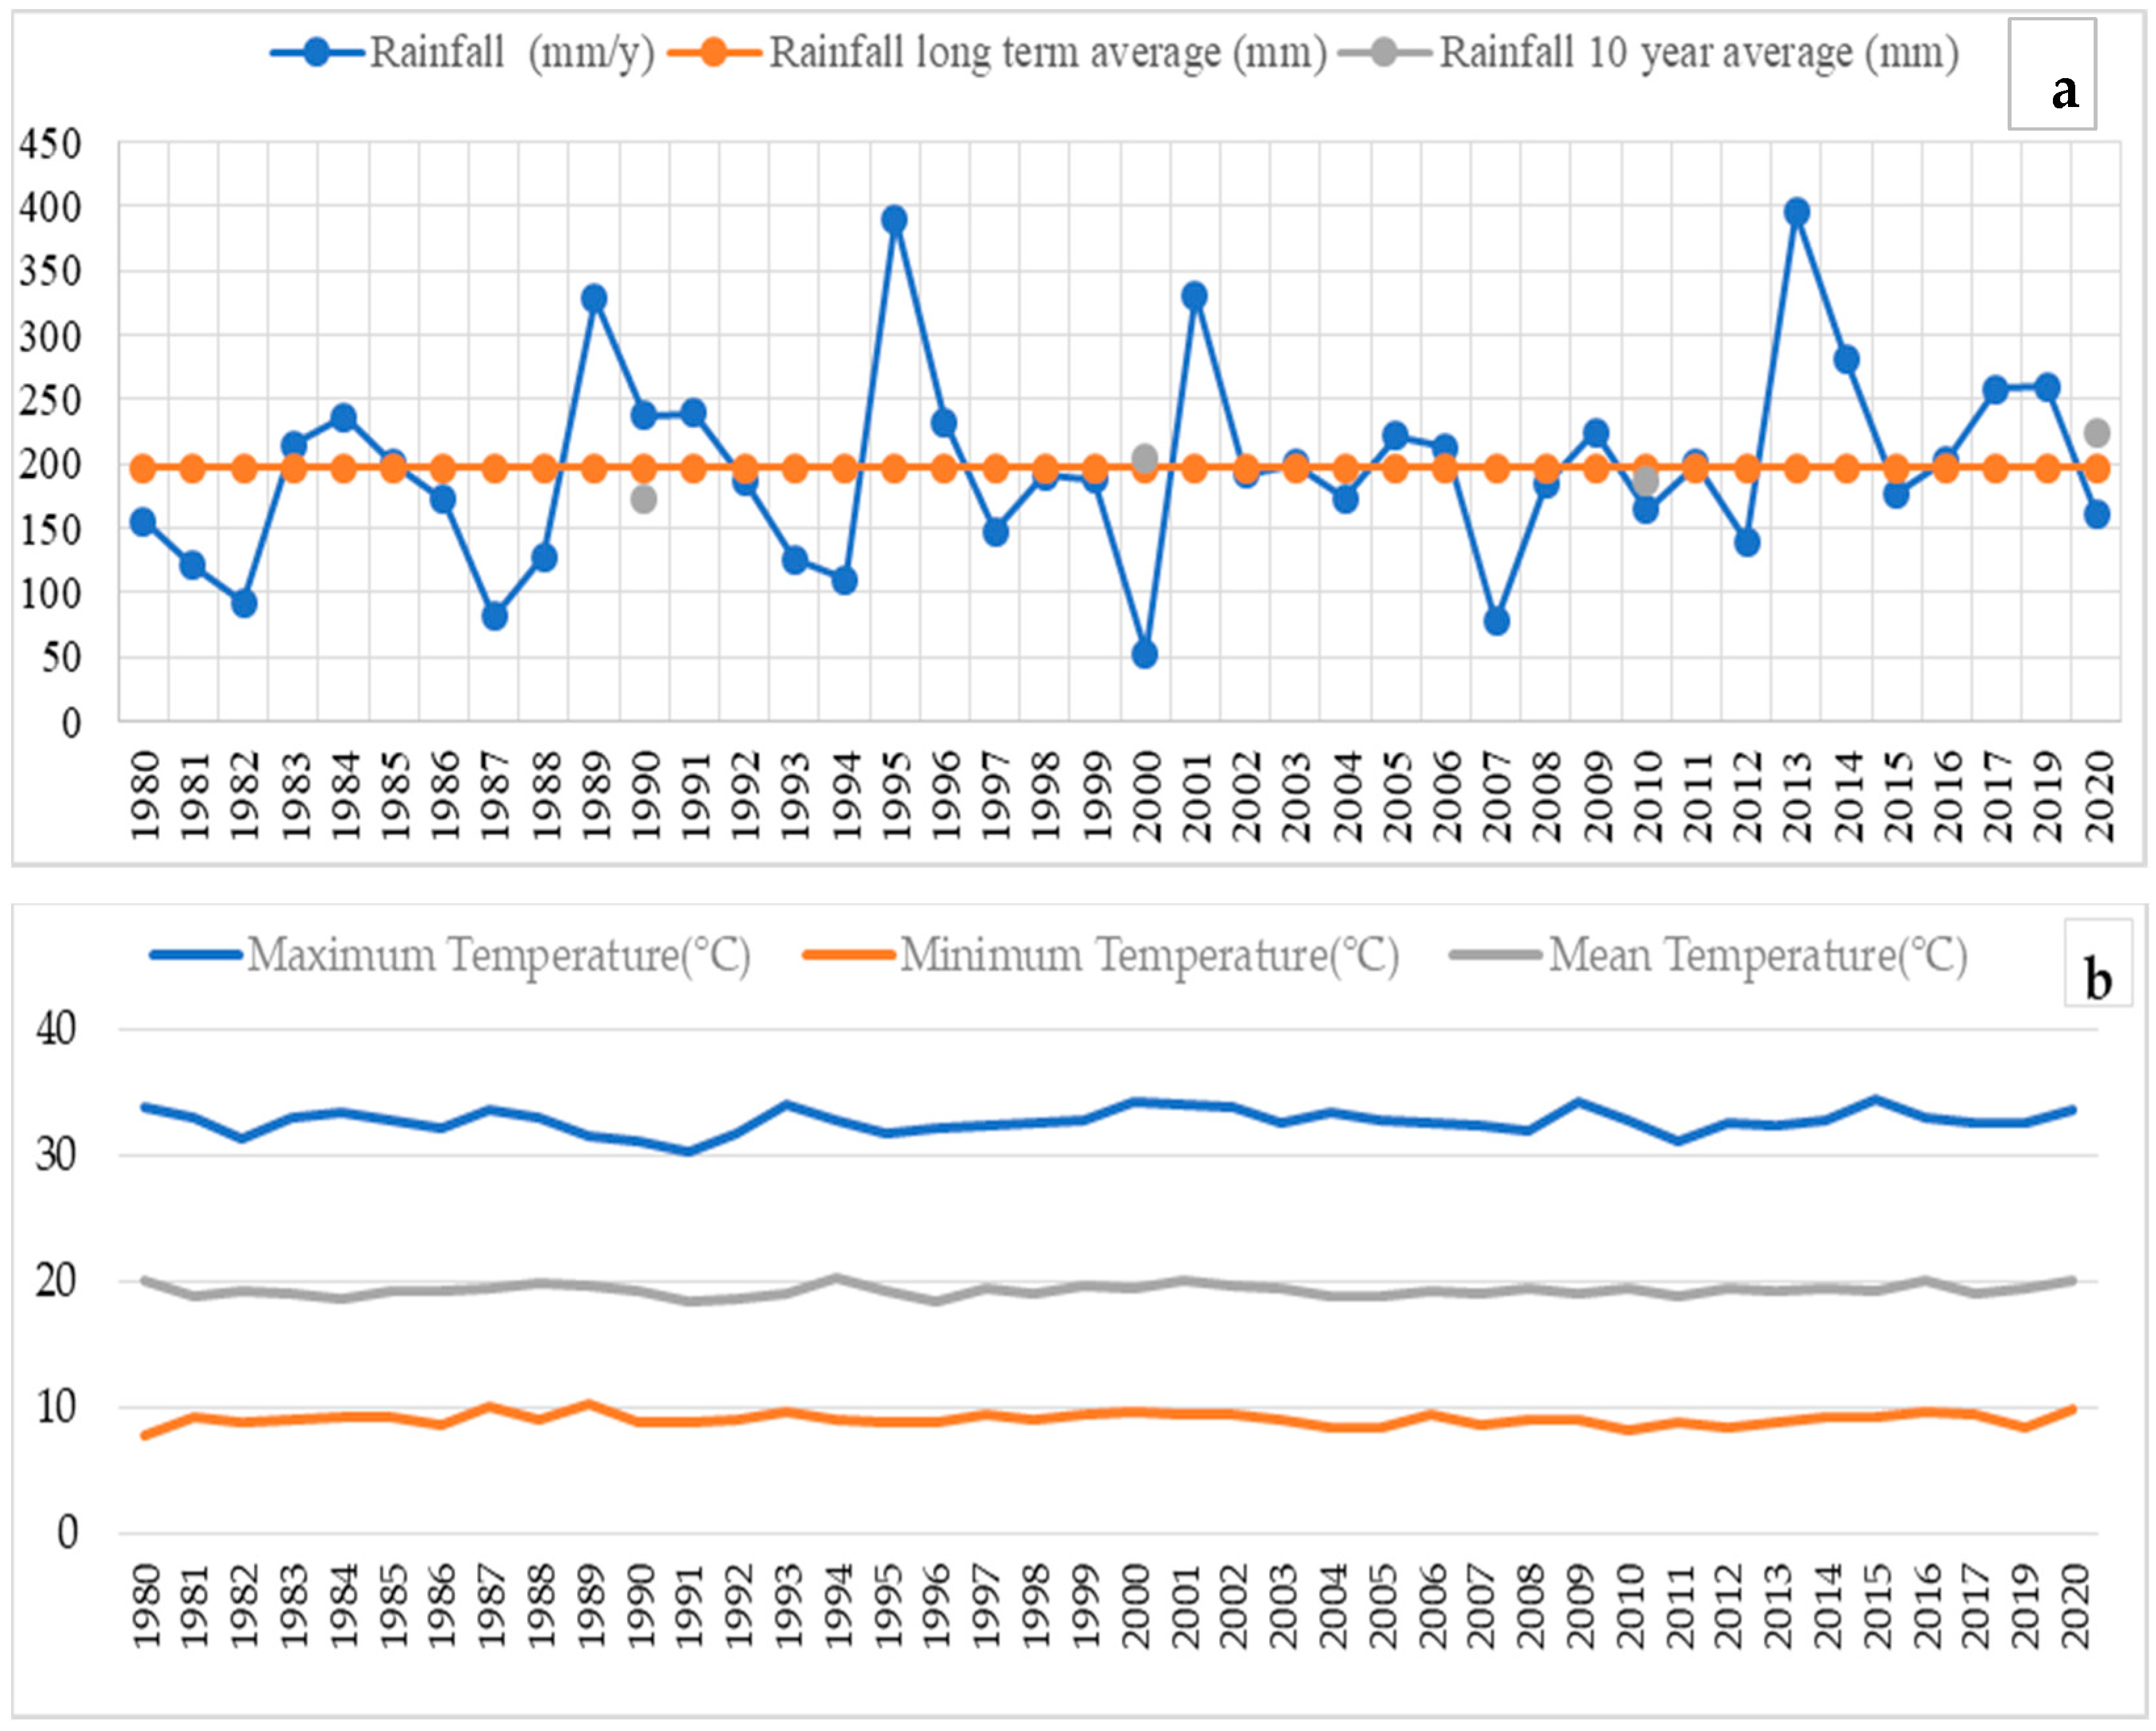
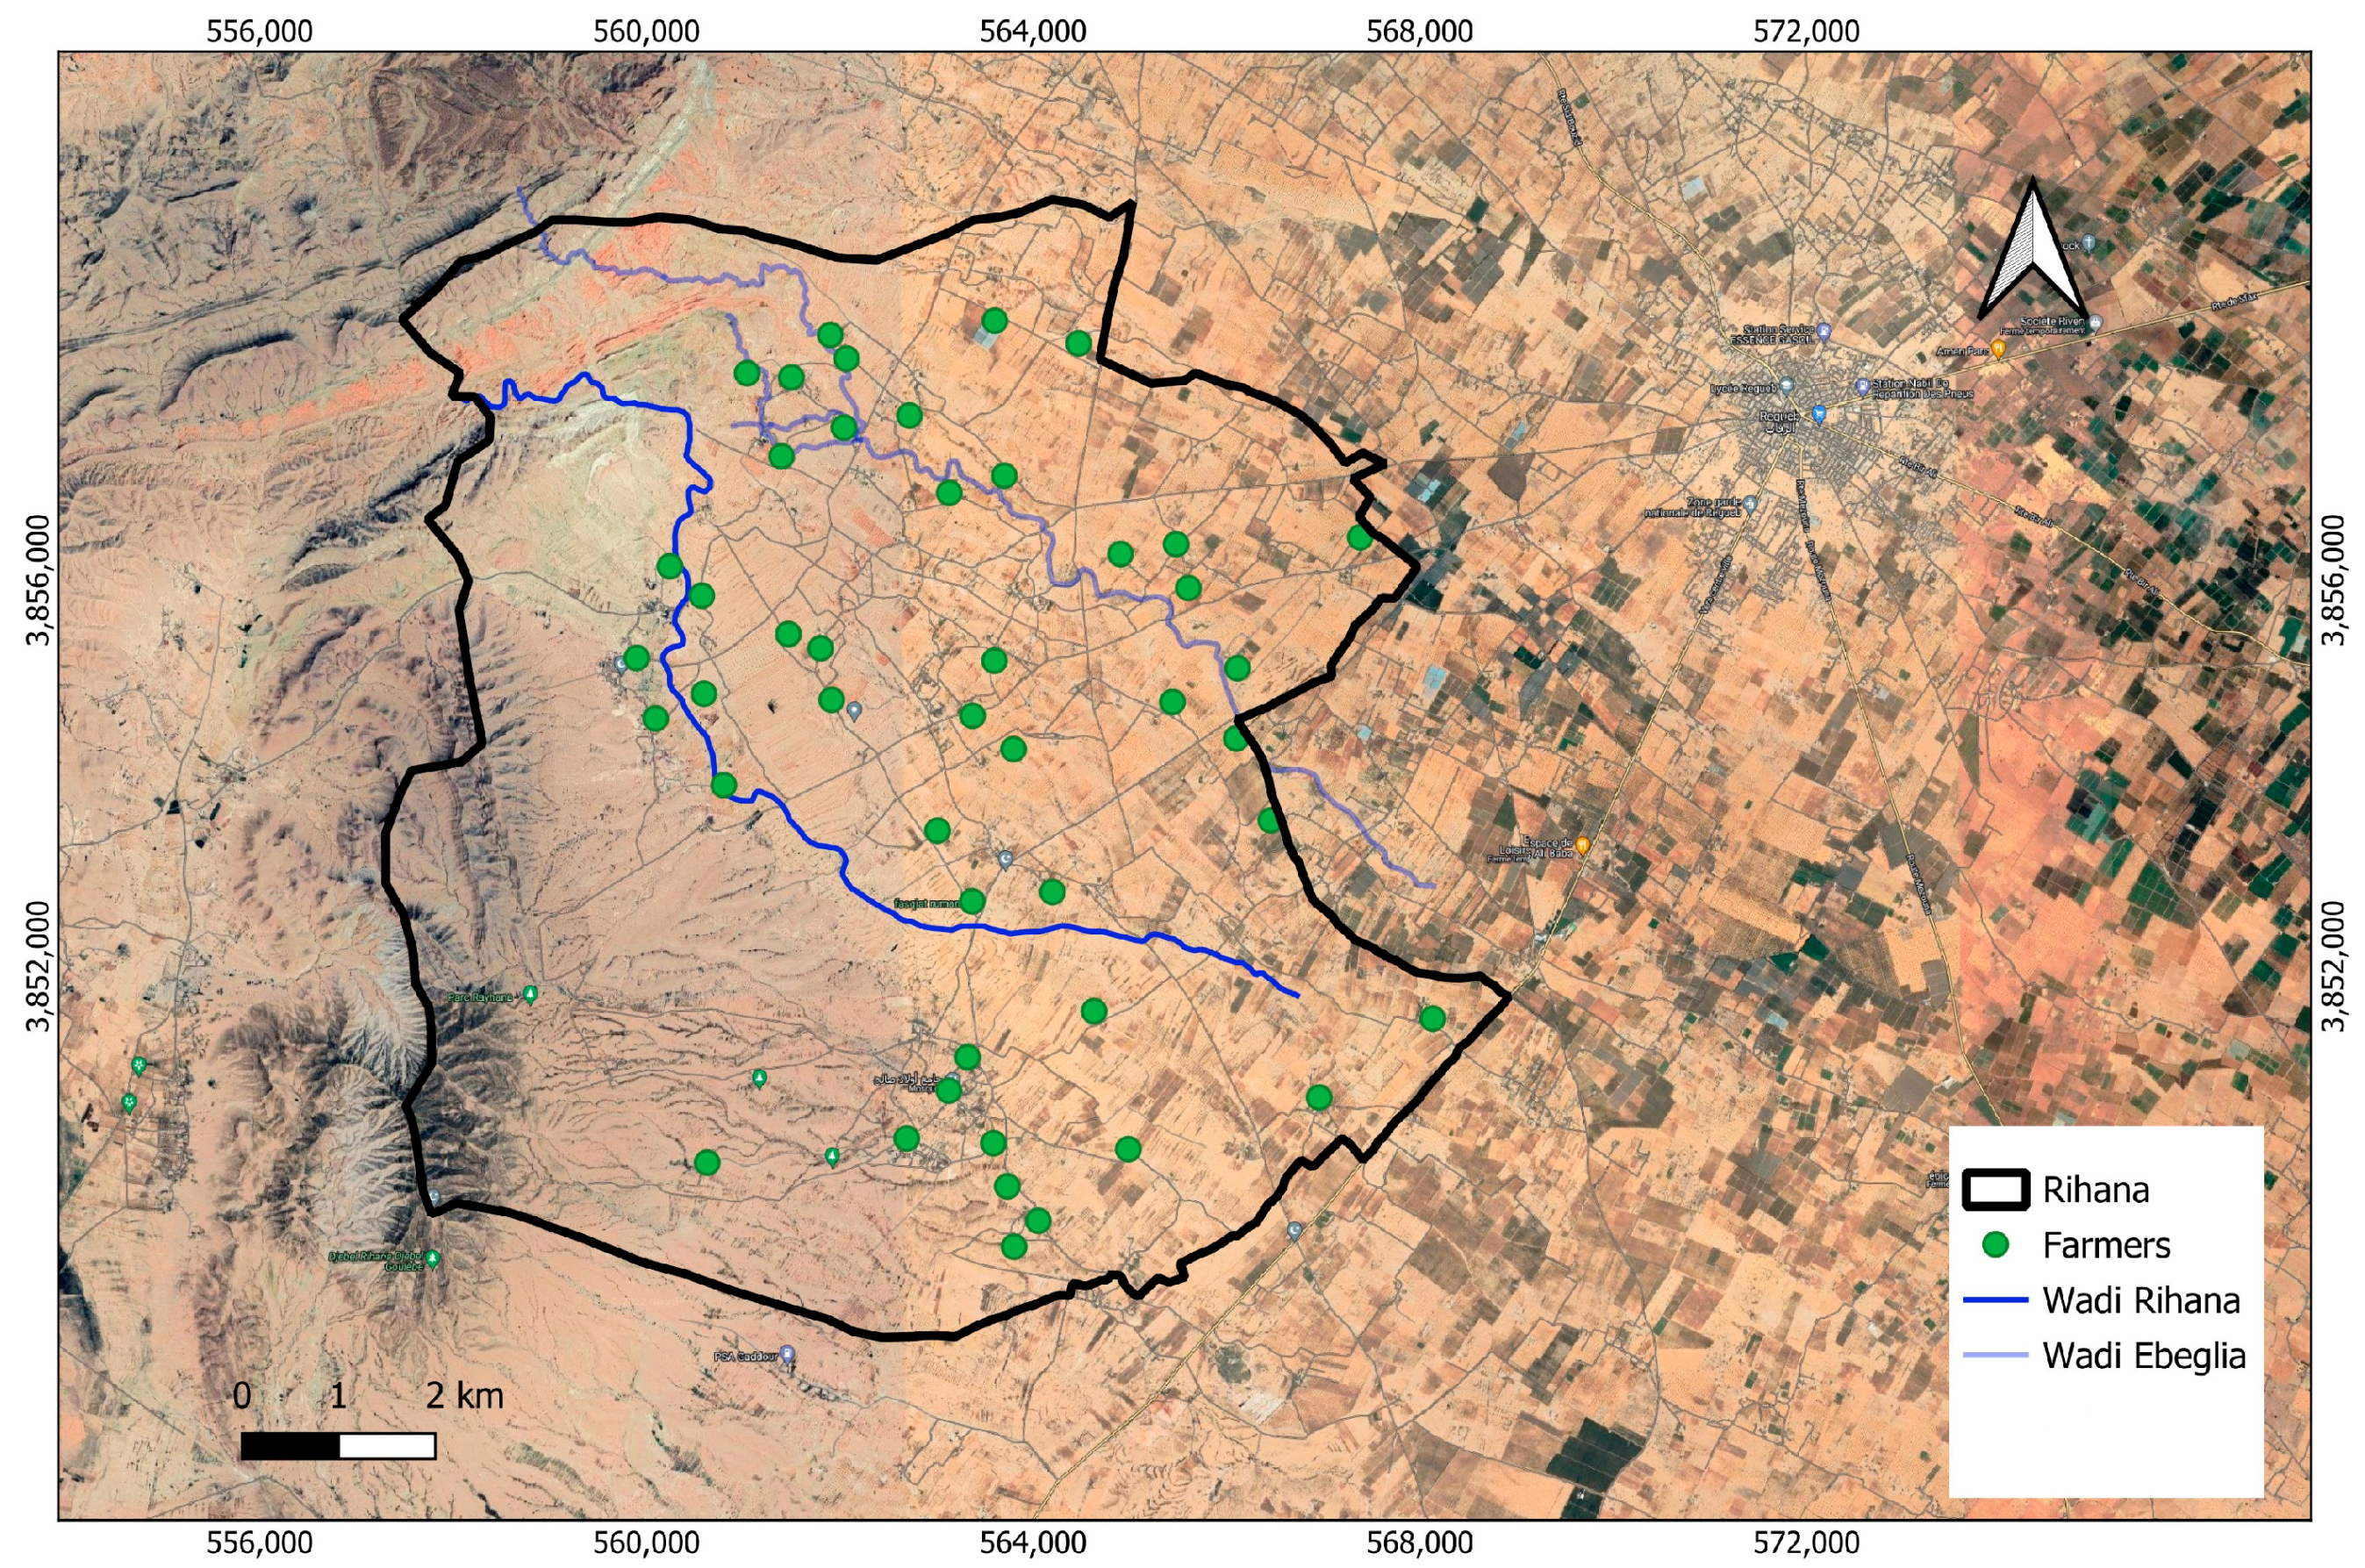
2. Study Area
3. Data and Methods
3.1. Datasets
3.1.1. Satellite Imagery
3.1.2. Training and Validation
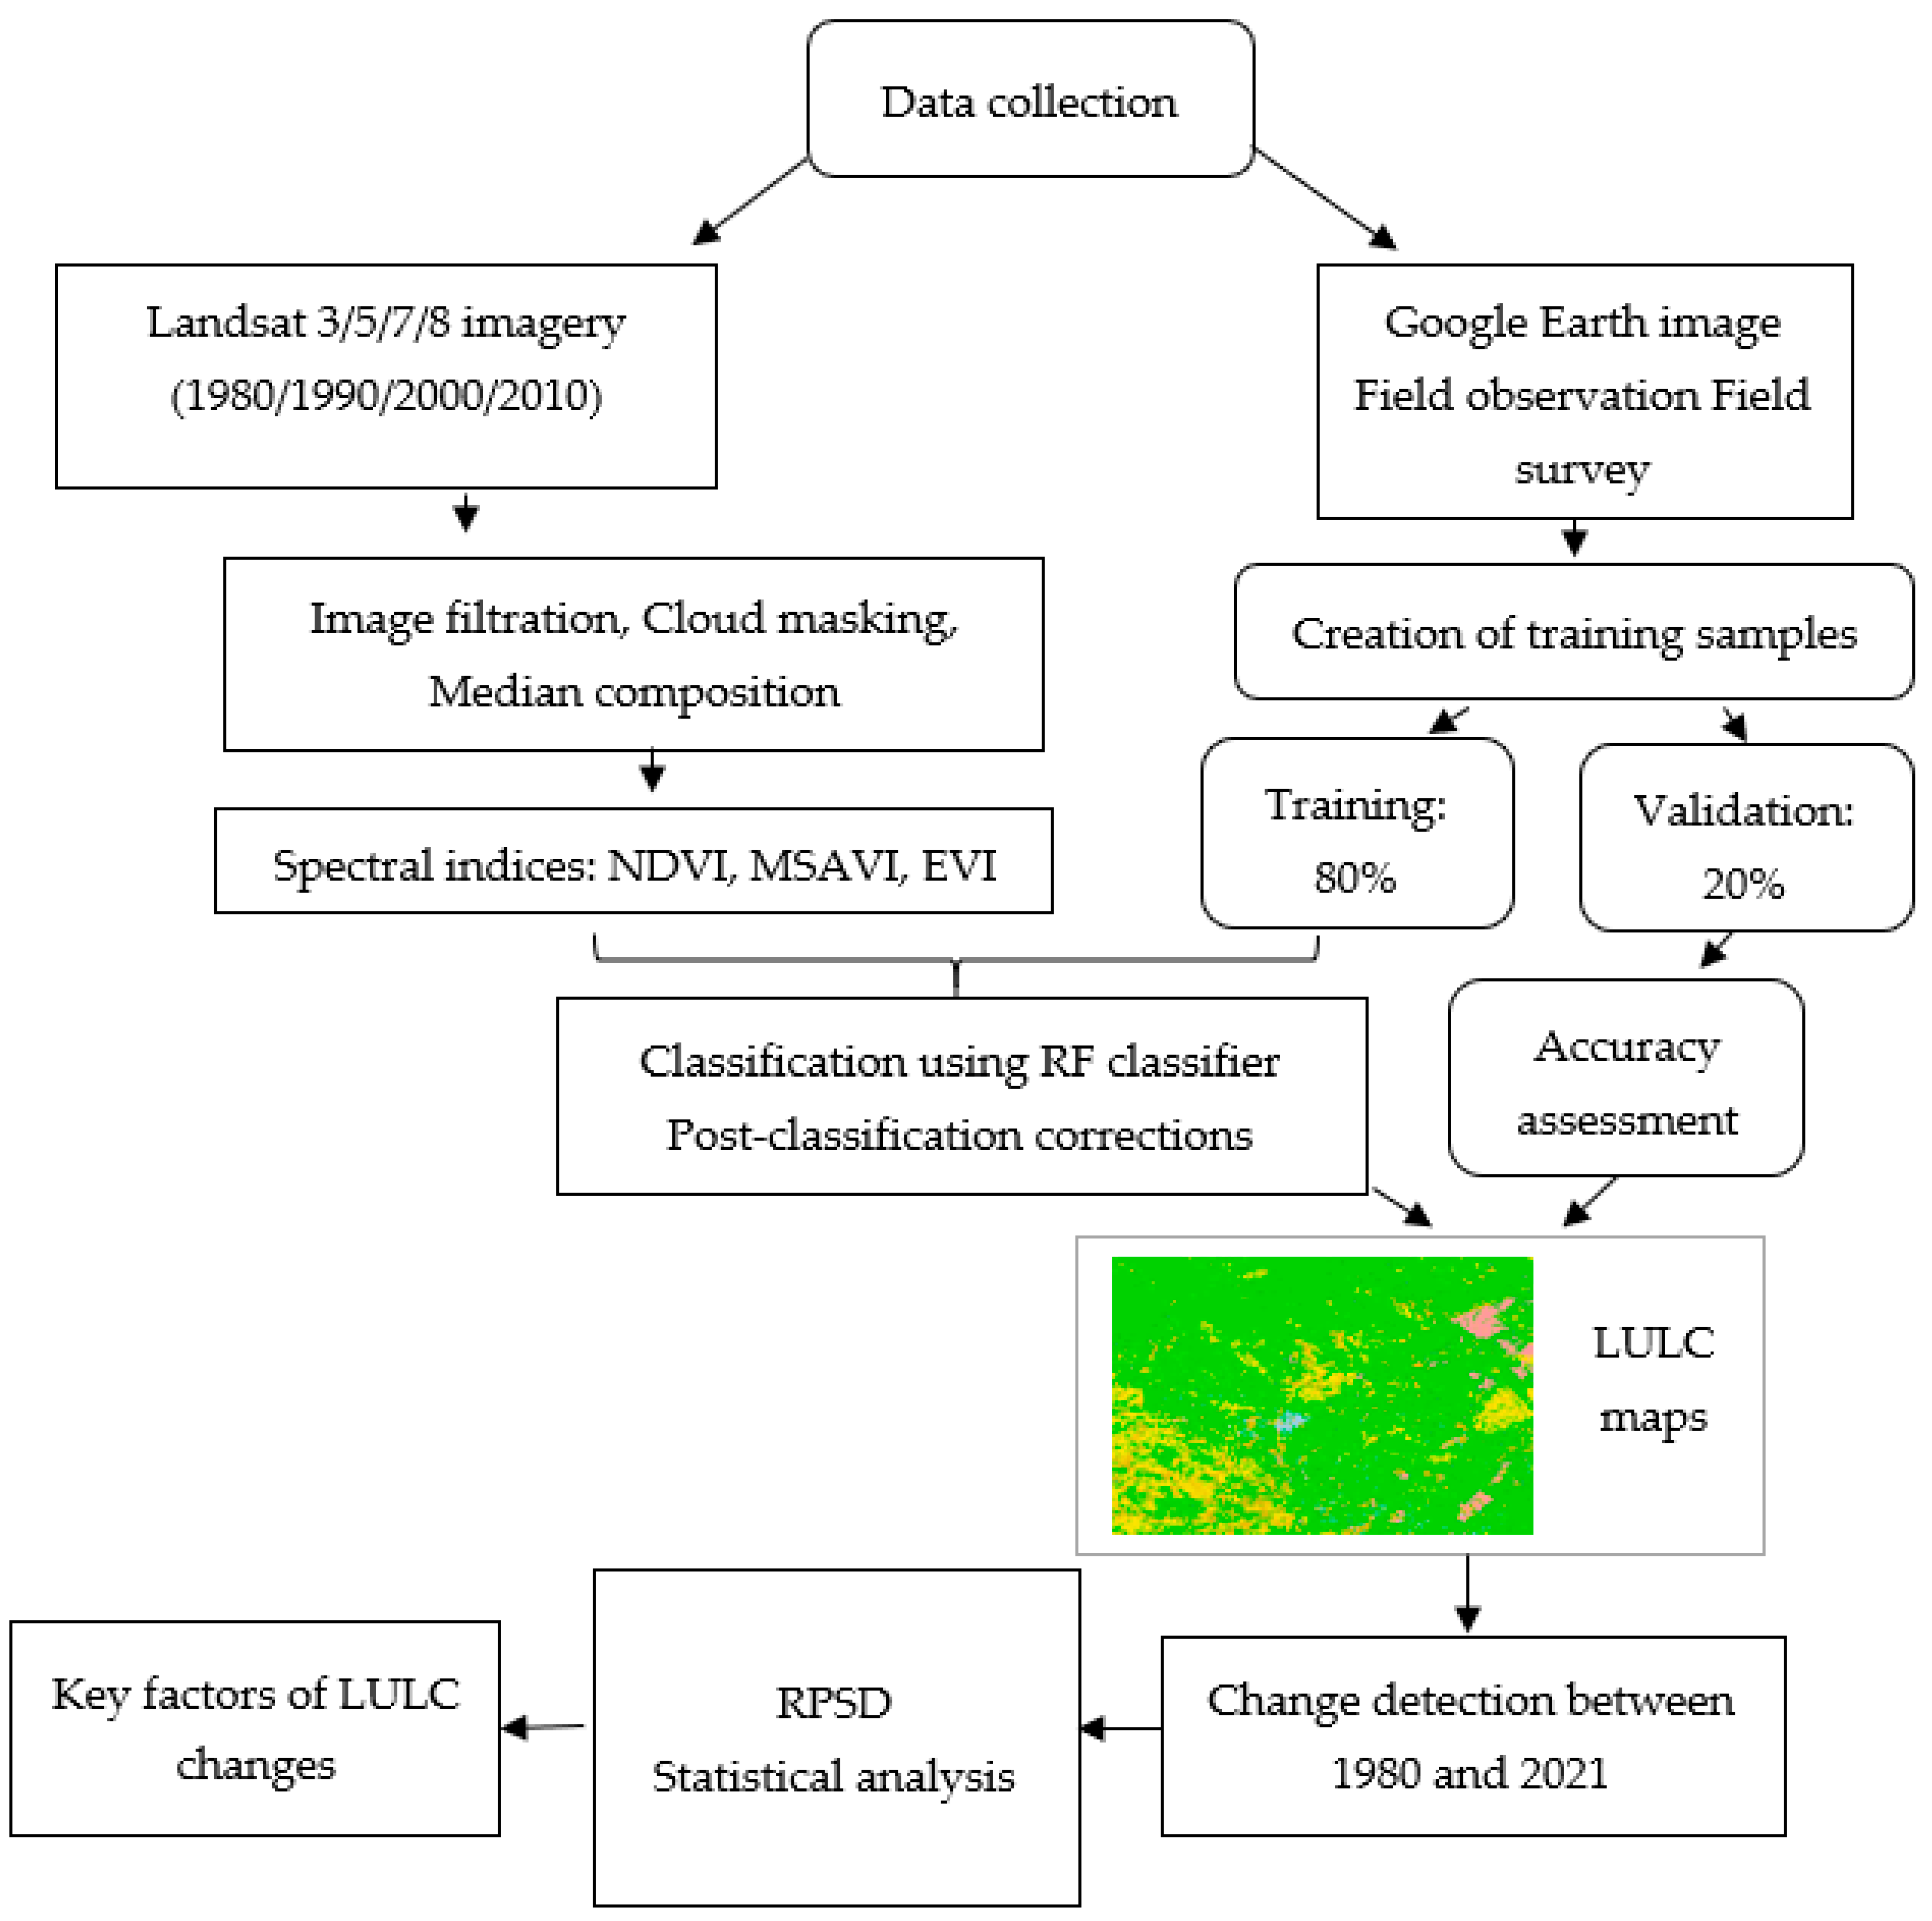
3.2. Methodology
3.2.1. Classification and Post-Processing
3.2.2. Drivers of LULC Change Based on the RPSD Methodology
4. Results and Discussion
4.1. Classification Performance
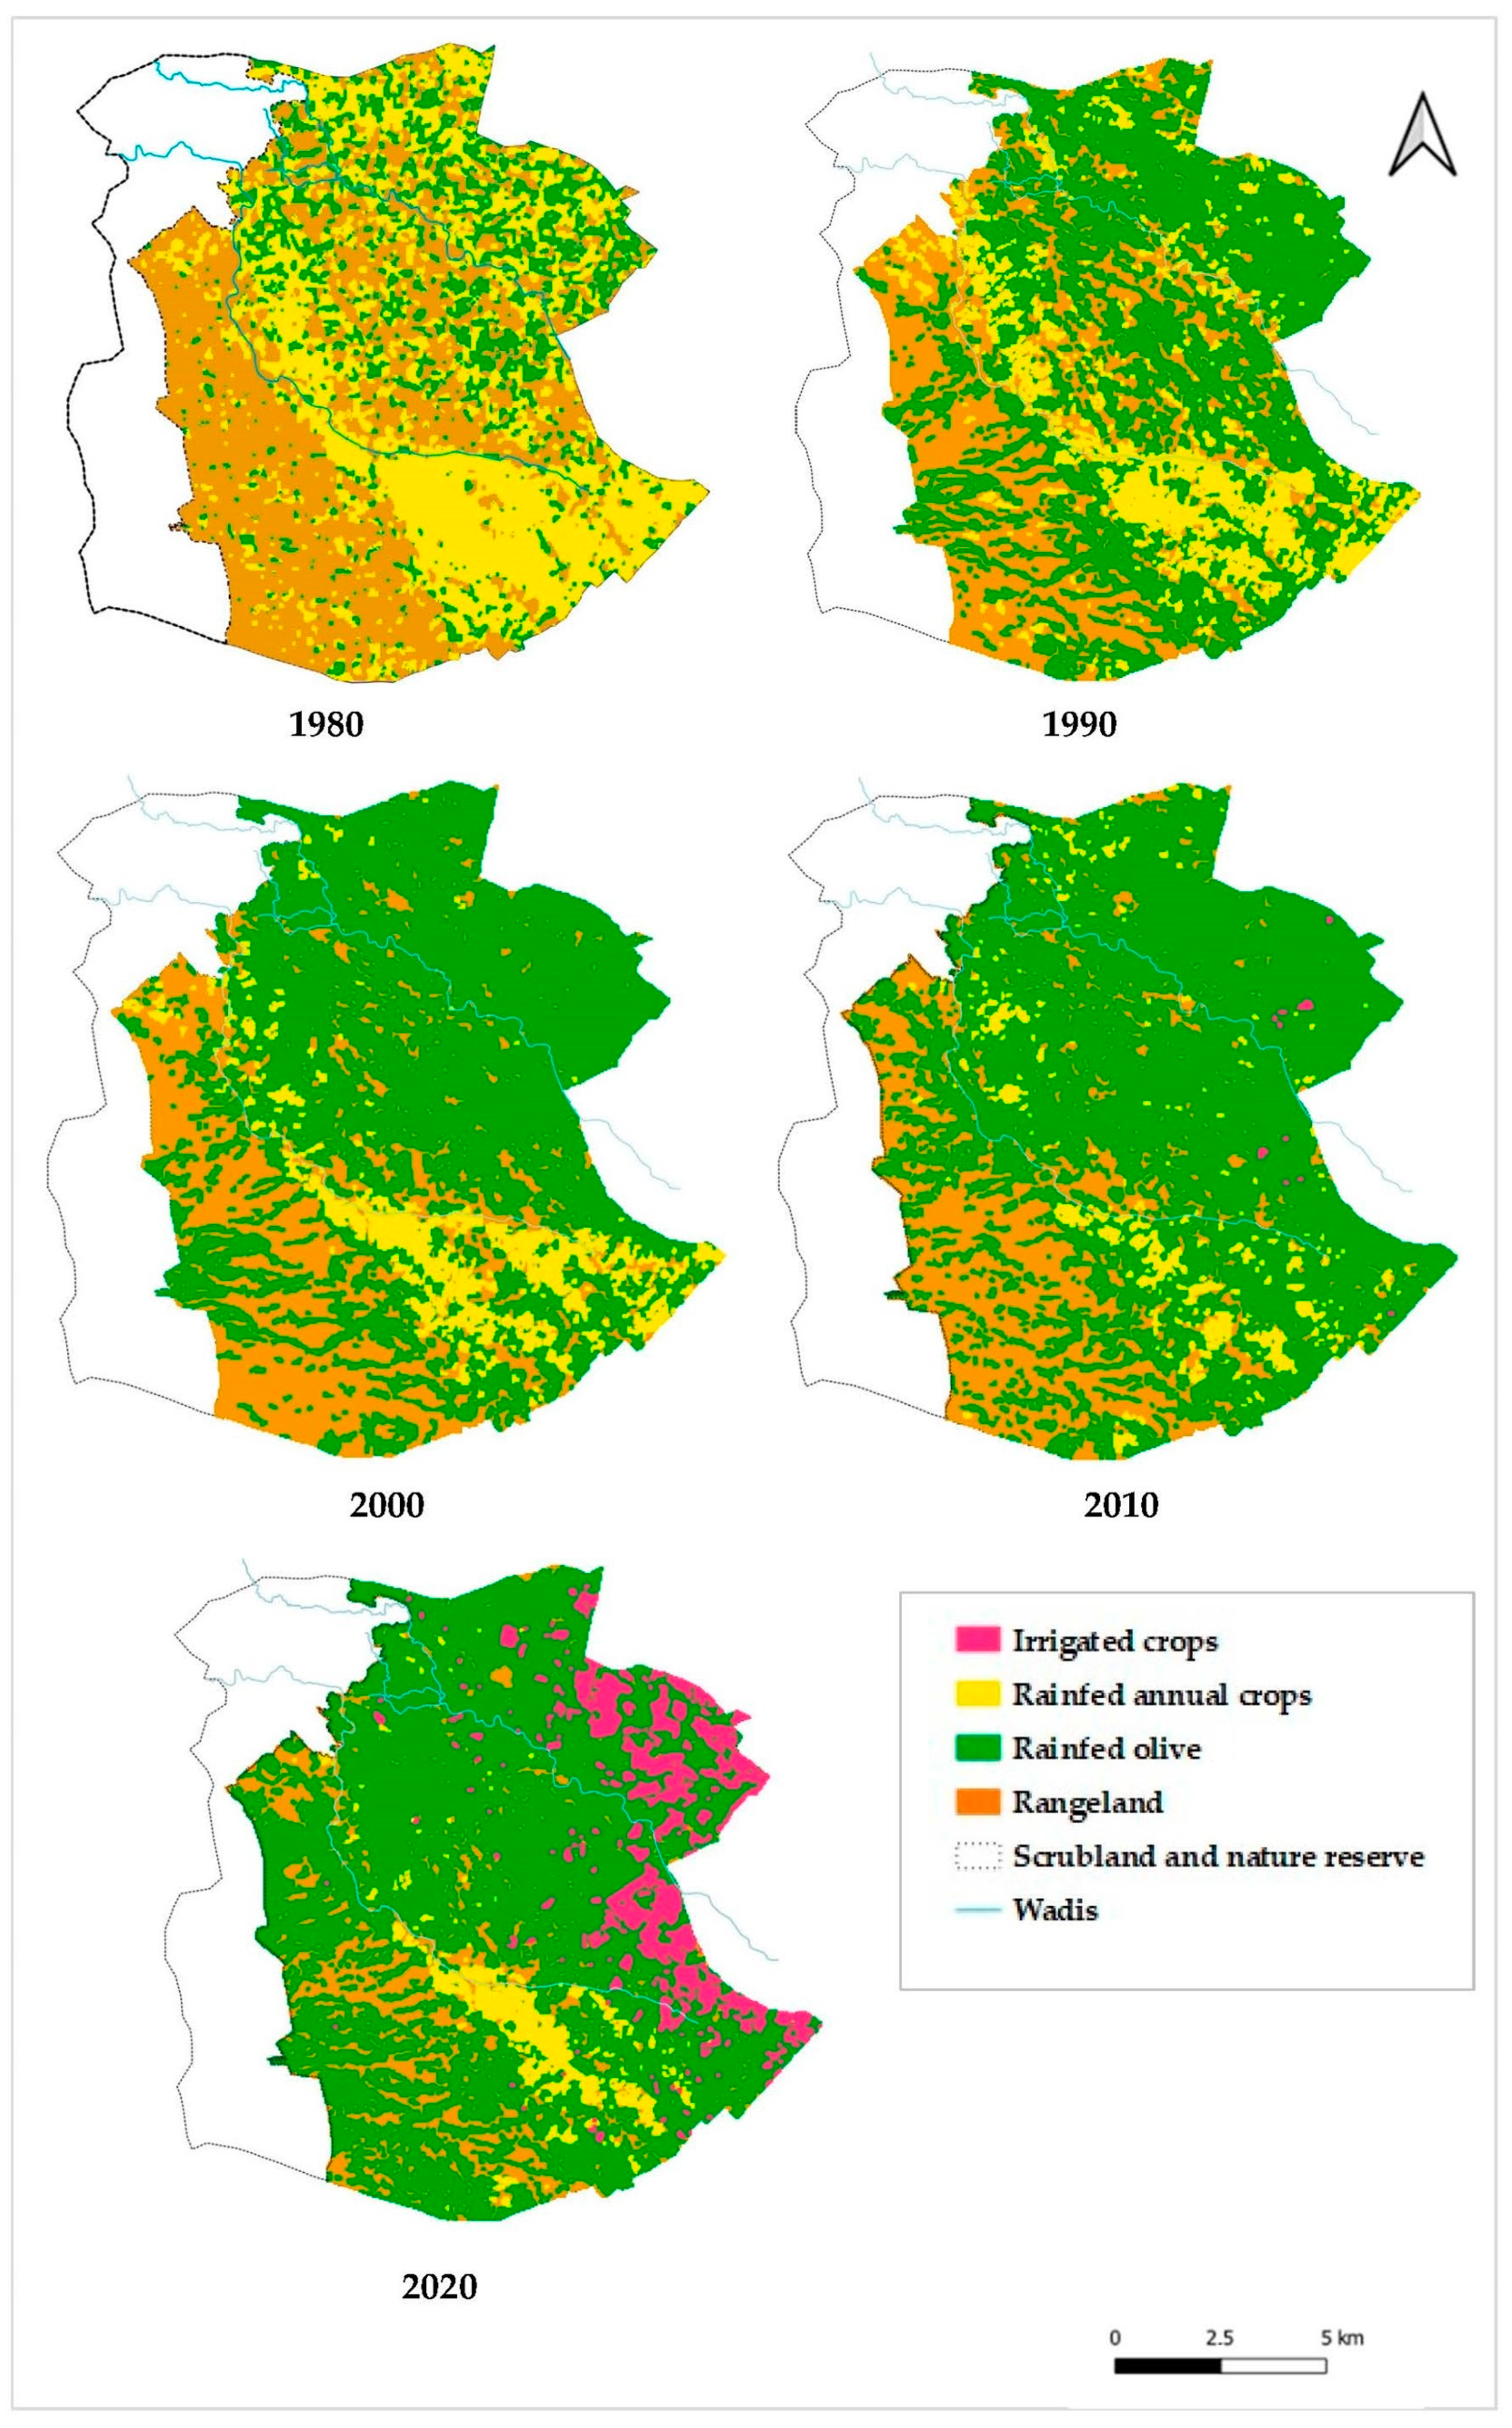
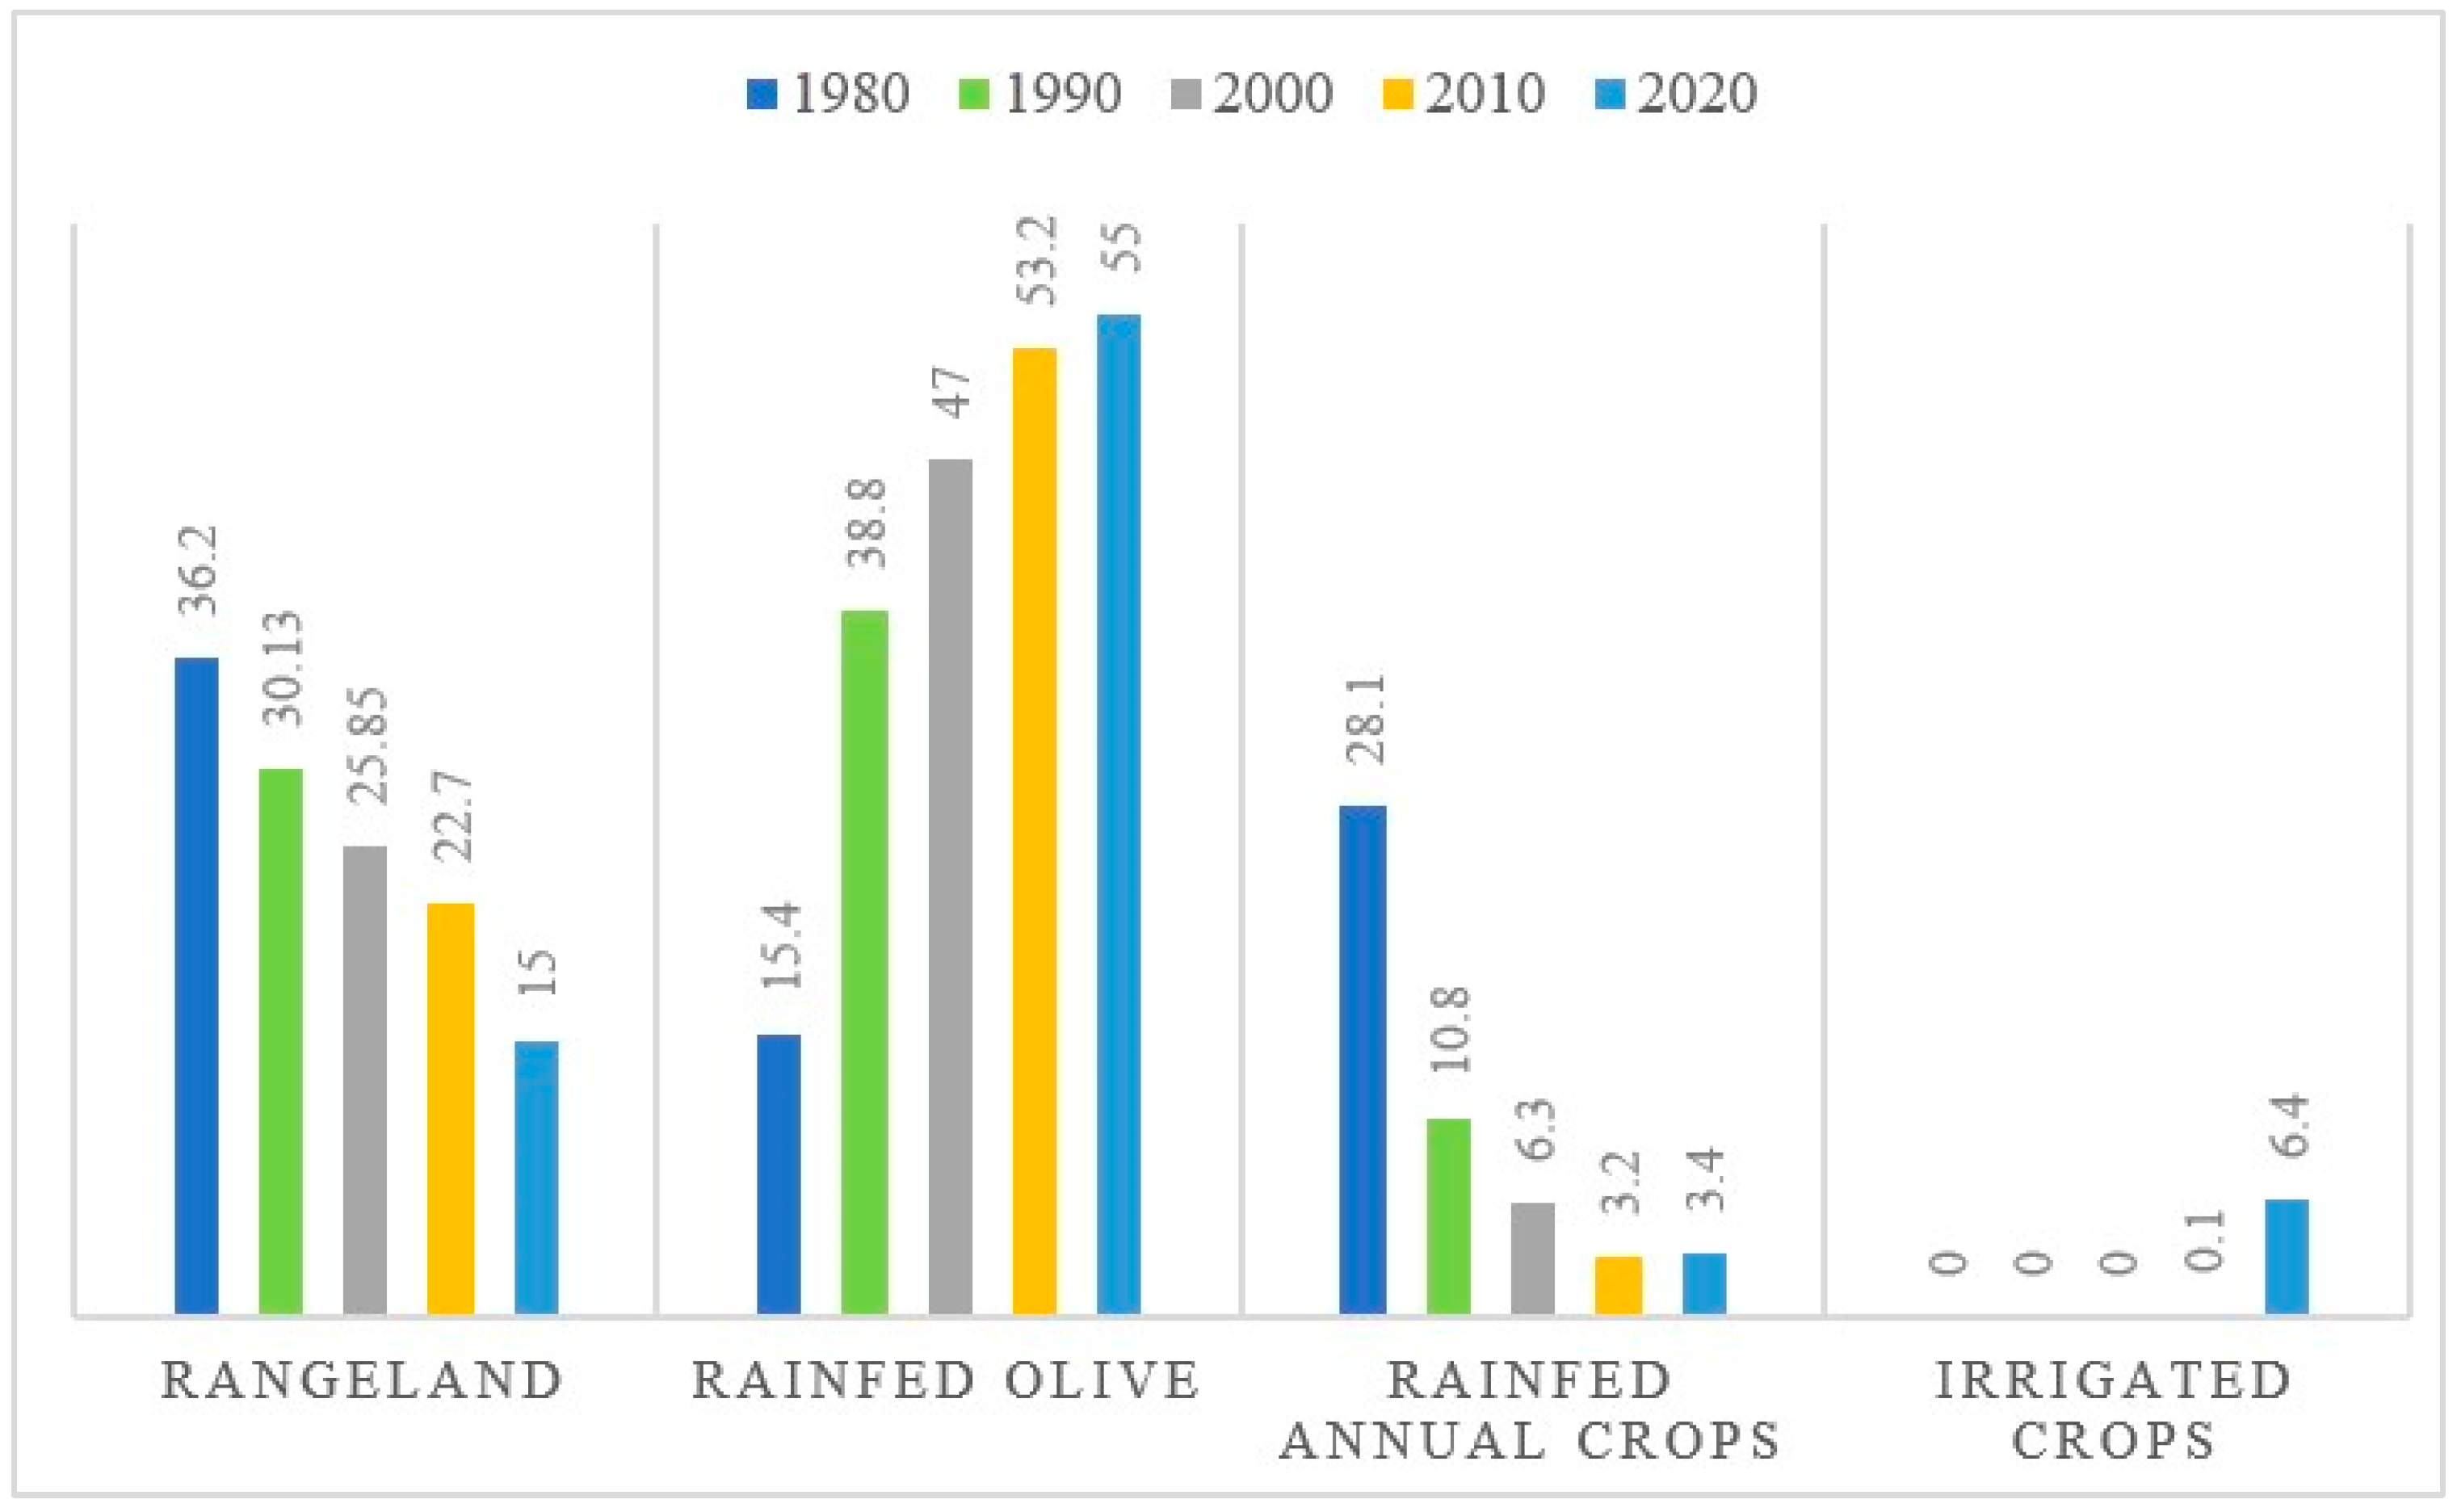
4.2. LULC Classification Analysis
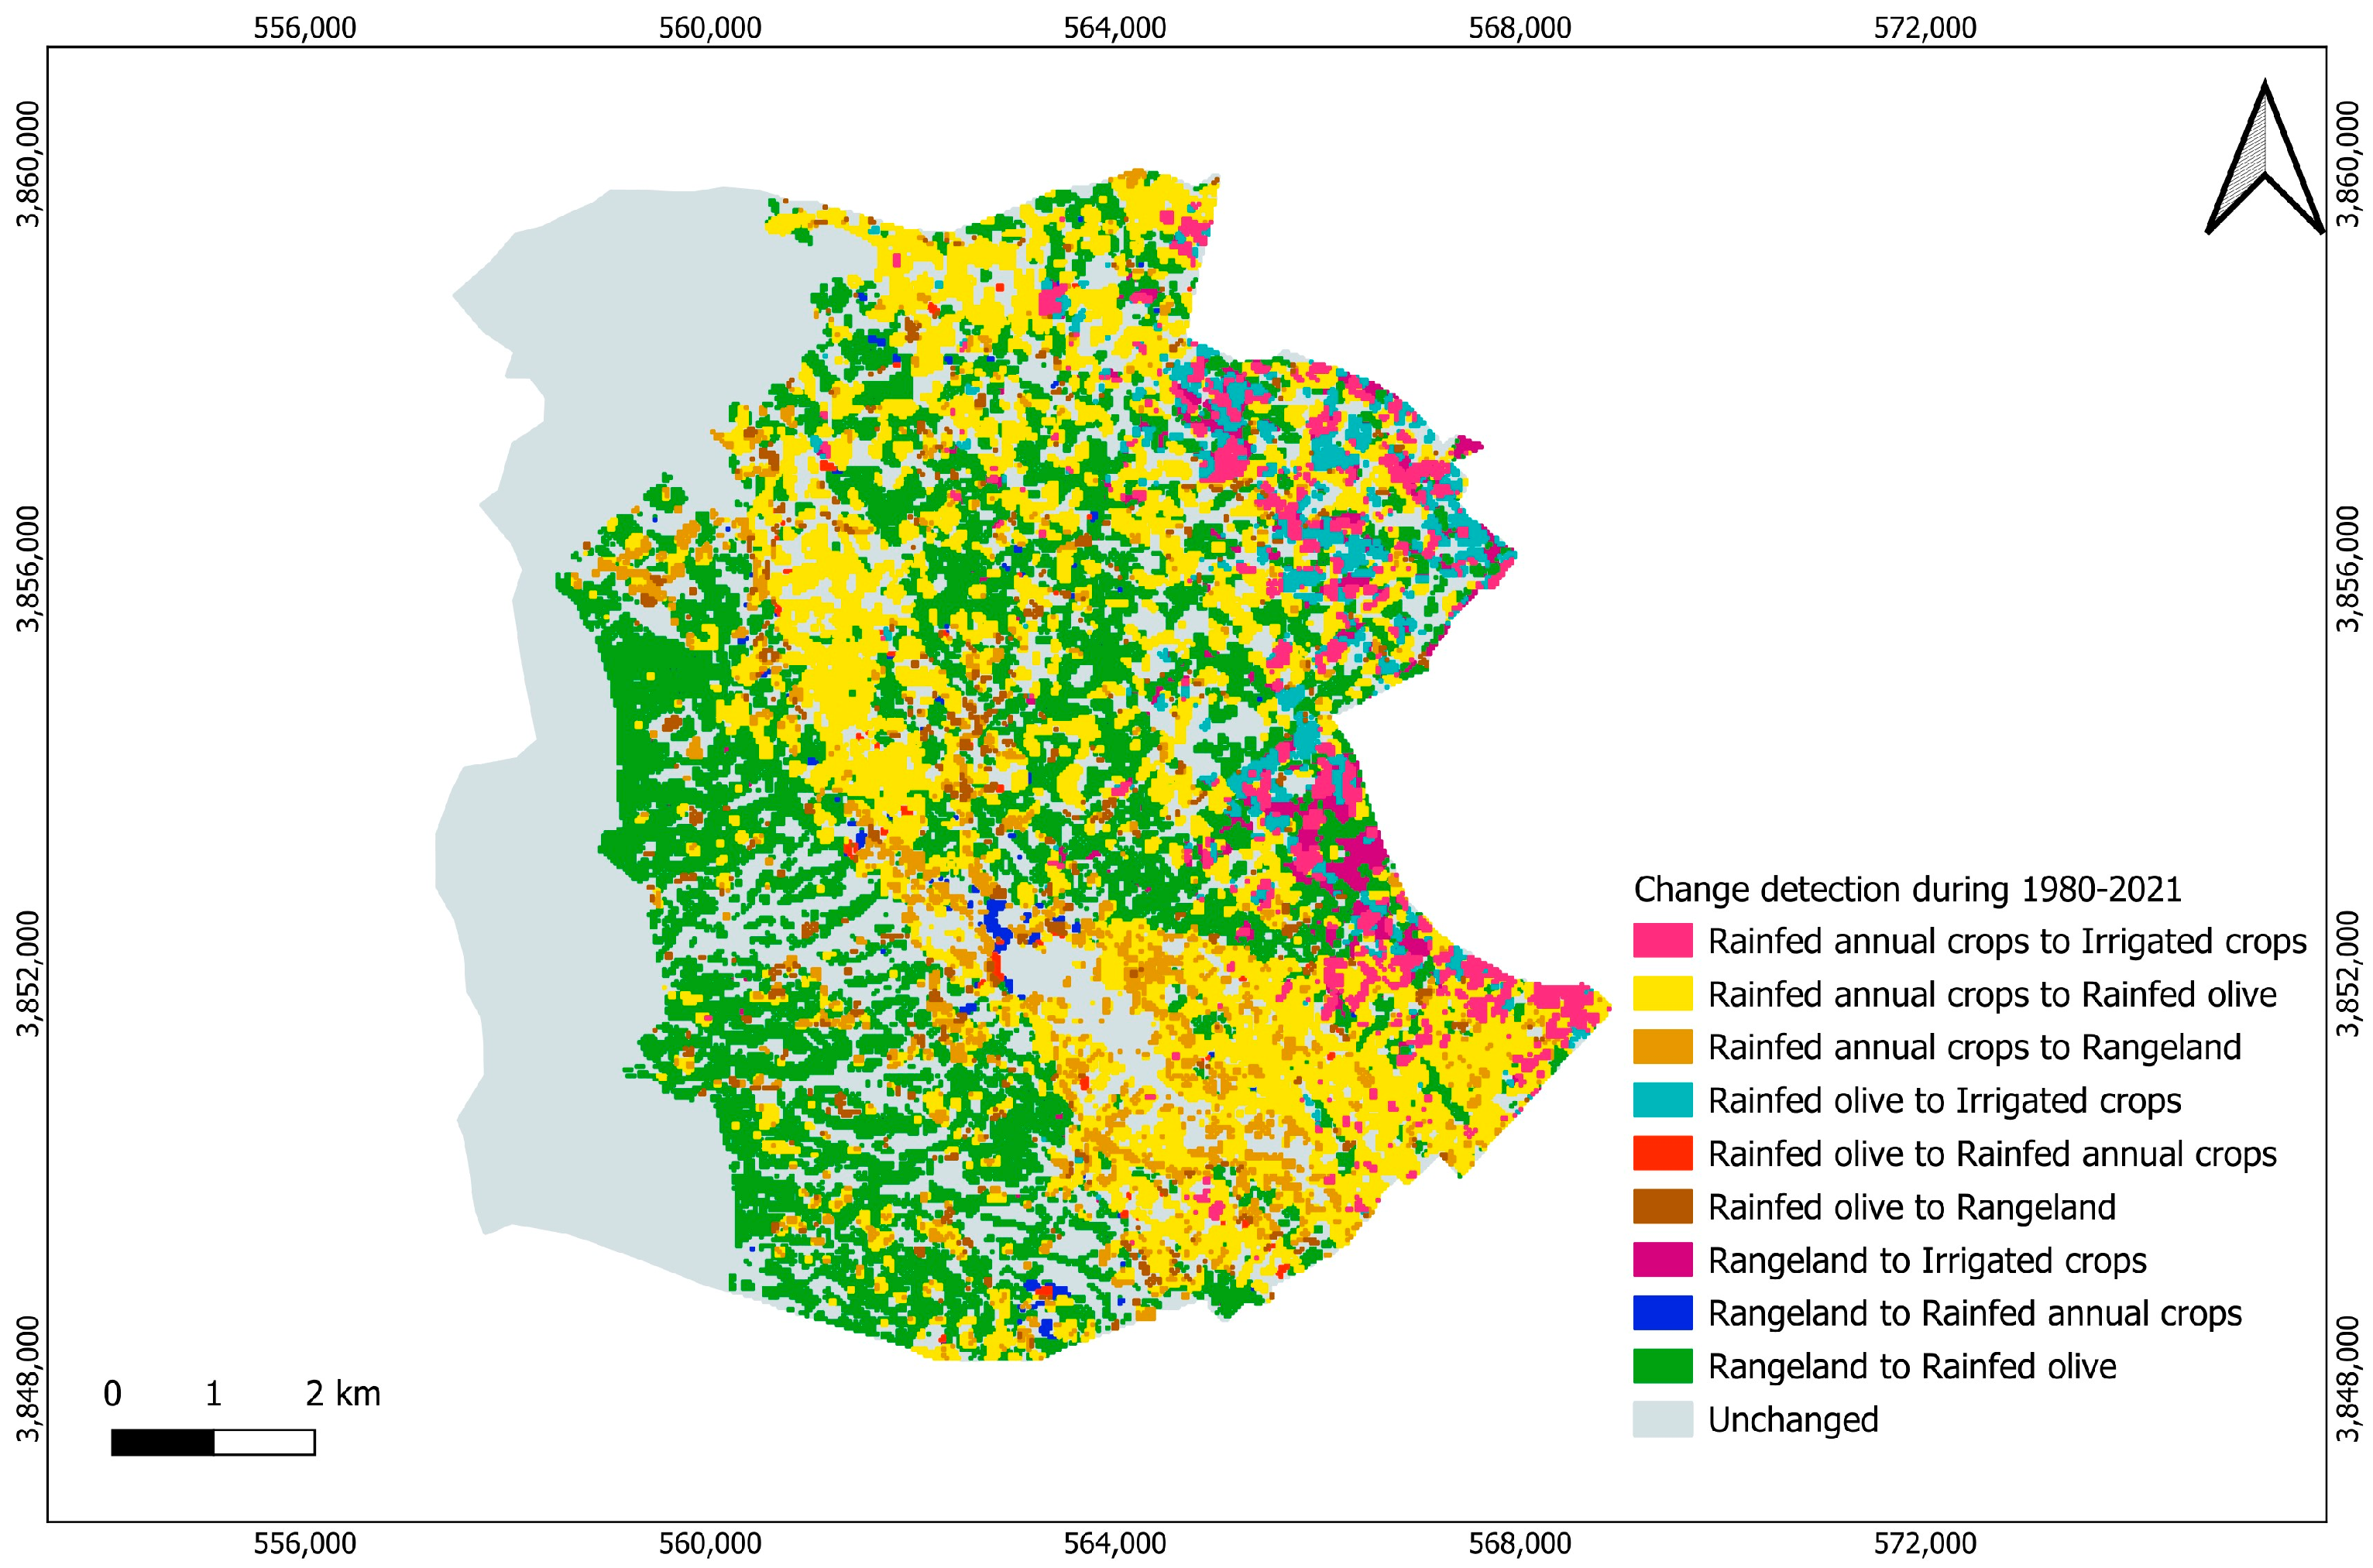
4.3. Drivers of LULC Change
5. Conclusions
Author Contributions
Funding
Data Availability Statement
Acknowledgments
Conflicts of Interest
References
- Quintero-Gallego, M.E.; Quintero-Angel, M.; Vila-Ortega, J.J. Exploring land use/land cover change and drivers in Andean mountains in Colombia: A case in rural Quindio. Sci. Total Environ. 2018, 634, 1288–1299. [Google Scholar] [CrossRef] [PubMed]
- Mariem, J.; Burte, J.; Biard, Y.; Benaissa, N.; Amara, H.; Sinfort, C. A framework for coupling a participatory approach and life cycle assessment for public decision-making in rural territory management. Sci. Total Environ. 2019, 655, 1017–1027. [Google Scholar] [CrossRef]
- Yan, X.Y.; Zhang, Q.; Yan, X.M.; Wang, S.; Ren, X.Y.; Zhao, F.N. An overview of distribution characteristics and formation mechanisms in global arid areas. Adv. Earth Sci. 2019, 34, 826–841. [Google Scholar] [CrossRef]
- Zhang, F.; Kung, H.T.; Johnson, V.C. Assessment of Land-Cover/Land-Use Change and Landscape Patterns in the Two National Nature Reserves of Ebinur Lake Watershed, Xinjiang, China. Sustainability 2017, 9, 724. [Google Scholar] [CrossRef]
- Lasaponara, R.; Abate, N.; Fattore, C.; Aromando, A.; Cardettini, G.; Di Fonzo, M. On the Use of Sentinel-2 NDVI Time Series and Google Earth Engine to Detect Land-Use/Land-Cover Changes inFire-Affected Areas. Remote Sens. 2022, 14, 4723. [Google Scholar] [CrossRef]
- Phan, T.N.; Kuch, V.; Lehnert, L.W. Land Cover Classification Using Google Earth Engine and Random Forest Classifier—The Role of Image Composition. Remote. Sens. 2020, 12, 2411. [Google Scholar] [CrossRef]
- Sazib, N.; Mladenova, I.; Bolten, J. Leveraging the Google Earth Engine for drought assessment using global soil moisture data. Remote. Sens. 2018, 10, 1265. [Google Scholar] [CrossRef]
- Felegari, S.; Sharifi, A.; Moravej, K.; Amin, M.; Golchin, A.; Muzirafuti, A.; Tariq, A.; Zhao, N. Integration of Sentinel 1 and Sentinel 2 Satellite Images for Crop Mapping. Appl. Sci. 2021, 11, 10104. [Google Scholar] [CrossRef]
- Ngongo, Y.; deRosari, B.; Basuki, T.; Njurumana, G.N.; Nugraha, Y.; Harianja, A.H.; Ardha, M.; Kustiyo, K.; Shofiyati, R.; Heryanto, R.B.; et al. Land Cover Change and Food Security in Central Sumba: Challenges and Opportunities in the Decentralization Era in Indonesia. Land 2023, 12, 1043. [Google Scholar] [CrossRef]
- Amani, M.; Ghorbanian, A.; Ahmadi, S.A.; Kakooei, M.; Moghimi, A.; Mirmazloumi, S.M.; Moghaddam, S.H.A.; Mahdavi, S.; Ghahremanloo, M.; Parsian, S.; et al. Google Earth Engine Cloud Computing Platform for Remote Sensing Big Data Applications: A Comprehensive Review. IEEE J. Sel. Top. Appl. Earth Obs. Remote Sens. 2020, 13, 5326–5350. [Google Scholar] [CrossRef]
- Kruasilp, J.; Pattanakiat, S.; Phutthai, T.; Vardhanabindu, P.; Nakmuenwai, P. Evaluation of Land Use Land Cover Changes in Nan Province, Thailand, Using Multi-Sensor Satellite Data and Google Earth Engine. Environ. Nat. Resour. J. 2023, 21, 186–197. [Google Scholar] [CrossRef]
- Kolli, M.K.; Opp, C.; Karthe, D.; Groll, M. Mapping of major land-use changes in the Kolleru Lake freshwater ecosystem by using Landsat satellite images in Google Earth Engine. Water 2020, 12, 2493. [Google Scholar] [CrossRef]
- Basheer, S.; Wang, X.; Farooque, A.A.; Nawaz, R.A.; Liu, K.; Adekanmbi, T.; Liu, S. Comparison of Land Use Land Cover Classifiers Using Different Satellite Imagery and Machine Learning Techniques. Remote Sens. 2022, 14, 4978. [Google Scholar] [CrossRef]
- Xie, S.; Liu, L.; Zhang, X.; Yang, J.; Chen, X.; Gao, Y. Automatic land-cover mapping using Landsat time-series data based on google earth engine. Remote Sens. 2019, 11, 3023. [Google Scholar] [CrossRef]
- Jamali, A. Land use land cover modeling using optimized machine-learning classifiers: A case study of Shiraz, Iran. Model. Earth Syst. Environ. 2020, 7, 1539–1550. [Google Scholar] [CrossRef]
- Abdi, A.M. Land cover and land use classification performance of machine learning algorithms in a boreal landscape using Sentinel-2 data. GISci. Remote Sens. 2020, 57, 1–20. [Google Scholar] [CrossRef]
- Thanh Noi, P.; Kappas, M. Comparison of Random Forest, k-Nearest Neighbor, and Support Vector Machine Classifiers for Land Cover Classification Using Sentinel-2 Imagery. Sensors 2018, 18, 18. [Google Scholar] [CrossRef]
- Naushad, R.; Kaur, T.; Ghaderpour, E. Deep Transfer Learning for Land Use and Land Cover Classification: A Comparative Study. Sensors 2021, 21, 8083. [Google Scholar] [CrossRef] [PubMed]
- Pham, T.D.; Yokoya, N.; Bui, D.T.; Yoshino, K.; Friess, D.A. Remote Sensing Approaches for Monitoring Mangrove Species, Structure, and Biomass: Opportunities and Challenges. Remote Sens. 2019, 11, 230. [Google Scholar] [CrossRef]
- Maurya, K.; Mahajan, S.; Chaube, N. Remote Sensing Techniques: Mapping and Monitoring of Mangrove Ecosystem—A Review. Complex. Intell. Syst. 2021, 7, 2797–2818. [Google Scholar] [CrossRef]
- Kouassi, C.J.A.; Qian, C.; Afridi, D.K.; Suika, A.L.; Kebin, Z.; Omifolaji, K.; Yang, X. Goofle Earth Engine for Landsat Image Processing and Assessing LULC Classification in Southwestern CÔTE D’IVOIRE. Geod. Cartogr. 2023, 49, 37–50. [Google Scholar] [CrossRef]
- Dubertret, F.; Le Tourneau, F.M.; Villarreal, M.L.; Norman, L.M. Monitoring Annual Land Use/Land Cover Change in the Tucson Metropolitan Area with Google Earth Engine (1986–2020). Remote Sens. 2022, 14, 2127. [Google Scholar] [CrossRef]
- Agyekum Codjoe, K.; Afrifa Acheampong, A. Spatio Temporal Analysis in Forest Cover Using Google Earth Engine in Ashanti Region, Ghana. Ajgis 2022, 11, 41–50. [Google Scholar] [CrossRef]
- Loukika, K.N.; Keesara, V.R.; Sridhar, V. Analysis of Land Use and Land Cover Using Machine Learning Algorithms on Google Earth Engine for Munneru River Basin, India. Sustainability 2021, 13, 13758. [Google Scholar] [CrossRef]
- Negm, A.M.; Khebour Allouche, F. Introduction to “Environmental Remote Sensing and GIS in Tunisia”. In Environmental Remote Sensing and GIS in Tunisia; Springer Nature: Berlin/Heidelberg, Germany, 2021; pp. 3–14. Available online: https://link.springer.com/chapter/10.1007/978-3-030-63668-5_1 (accessed on 8 June 2023).
- Boussema, S.; Allouche, F.; Ajmi, R.; Chaabane, B.; Gad, A. Assessing and monitoring the effects of land cover changes in biodiversity. Case study: Mediterranean coastal region, Sousse, Tunisia. Egypt. J. Remote Sens. Space Sci. 2023, 26, 185–196. [Google Scholar] [CrossRef]
- Henchiri, M.; Liu, Q.; Essifi, B.; Javed, T.; Zhang, S.; Bai, Y.; Zhang, J. Spatio-Temporal Patterns of Drought and Impact on Vegetation in North and West Africa Based on Multi-Satellite Data. Remote Sens. 2020, 12, 3869. [Google Scholar] [CrossRef]
- Bousbih, S.; Zribi, M.; El Hajj, M.; Baghdadi, N.; Lili-Chabaane, Z.; Gao, Q.; Fanise, P. Soil Moisture and Irrigation Mapping in A Semi-Arid Region, Based on the Synergetic Use of Sentinel-1 and Sentinel-2 Data. Remote Sens. 2018, 10, 1953. [Google Scholar] [CrossRef]
- Zribi, M.; Dridi, G.; Amri, R.; Lili-Chabaane, Z. Analysis of the Effects of Drought on Vegetation Cover in a Mediterranean Region through the use of SPOT-VGT and TERRA-MODIS Long Time Series. Remote Sens. 2016, 8, 992. [Google Scholar] [CrossRef]
- Da Silva, V.S.; Salami, G.; Da Silva, O.; Silva, E.A.; Junior, J.J.M.; Alba, E. Methodological evaluation of vegetation indexes in land use and land cover (LULC) classification. Geol. Ecol. Landsc. 2020, 4, 159–169. [Google Scholar] [CrossRef]
- DGACTA. Rapport de Programme d’Adaptation au Changement Climatique des Territoires Tunisiens: Cadre de Gestion Environnemental et Social; DGACTA, Ed.; DGACTA: Tunis, Tunisie, 2018; p. 95. [Google Scholar]
- Hajjem, A. Etude sur l’hydrogéologie de la plaine de Bled Regueb. In Rapport de la Direction Générale des Ressources en eau (DGRE); DGRE: Tunis, Tunisie, 1999; p. 50. [Google Scholar]
- DGRE. Rapport Annuaire Hydrologique; Internal Report; Regional Directorate of Water Resources of Tunis, Ed.; DGRE: Tunis, Tunisie, 2022; p. 35. [Google Scholar]
- Ghanmi, K.; Kadri, S.; Morardet, S.; Younsi, S.; Nsiri, N.; Saïdi, A.; Omrani, K.; Kadri, N. Programme d’Adaptation au changement Climatique des Territoires de Tunisie. Diagnostic Territorial, Participatif et Systémique: Zone d’intervention de Sidi Bouzid Rihana; PACTE program, Ed.; PACTE program: Tunis, Tunisie, 2020; p. 64. [Google Scholar]
- Muchsin, F.; Dirghayu, D.; Prasasti, I.; Rahayu, M.I.; Fibriawati, L.; Pradono, K.A.; Mahatmanto, B. Comparison of atmospheric correction models: FLAASH and 6S code and their impact on vegetation indices (case study: Paddy field in Subang District, West Java). IOP Conf. Ser. Earth Environ. Sci. 2019, 280, 012034. [Google Scholar] [CrossRef]
- Belay, T.; Mengistu, D.A. Land use and land cover dynamics and drivers in the Muga watershed, Upper Blue Nile Basin, Ethiopia. Remote Sens. Appl. Soc. Environ. 2019, 15, 100249. [Google Scholar] [CrossRef]
- Liu, C.; Frazier, P.; Kumar, L. Comparative assessment of the measures of thematic classification accuracy. Remote Sens. Environ. 2007, 107, 606–616. [Google Scholar] [CrossRef]
- Burte, J. Diagnostic Rapide Participatif Systémique: Guide Pratique; CIRAD-ES-UMR GEAU: Tunis, Tunisia, 2016; p. 19. [Google Scholar]
- Lee, E. Analysis of MODIS 250 m NDVI Using Different Time-Series Data for Crop Type Separability. Ph.D. Thesis, University of Kansas, Lawrence, KS, USA, 2014; pp. 1–62. [Google Scholar]
- Htitiou, A.; Boudhar, A.; Lebrini, Y.; Hadria, R.; Lionboui, H.; Elmansouri, L.; Tychon, B.; Benabdoulwaheb, T. The performance of random forest classification based on phenological metrics derived from Sentinel-2 and Landsat 8 to map crop cover in an irrigated semi-arid region. Remote Sens. Earth Syst. Sci. 2019, 2, 208–224. [Google Scholar] [CrossRef]
- Huang, Y.; Li, J.; Li, X. Comparison of the Accuracy of Three Commonly Used Landsat Imagery Classification Methods. Remote Sens. 2018, 10, 542. [Google Scholar] [CrossRef]
- Abdallah, H.; Gammar, A.M. Steppisation et exploitation du bois dans le secteur de Soughas (versant sud de la Dorsale tunisienne). In Climat, Société et dynamique des Paysages Ruraux en Tunisie; Faculté des Sciences Humaines et Sociales de Tunis: Tunis, Tunisie, 2010; pp. 142–164. [Google Scholar]
- Attia, H. Les Hautes Steppes Tunisiennes. De la Société Pastorale à la Société Paysanne. Ph.D.Thesis, l’Université Paris VII, Paris, France, 1977; p. 78. [Google Scholar]
- El Amami, S. Traditional Water Management in Tunisia; Centre de Recherche de Génie Rural: Tunis, Tunisie, 1984; p. 194. [Google Scholar]
- Abaab, A. La Modernisation Agricole et ses Effets sur les Systèmes de Production Agricole. Cas de la région de Sidi Bouzid en Tunisie Centrale. Ph.D. Thesis, Université de Ghent, Ghent, Belgique, 1999. [Google Scholar]
- Jaramillo, S.; Graterol, E.; Pulver, E. Sustainable Transformation of Rainfed to Irrigated Agriculture Through Water Harvesting and Smart Crop Management Practices. Front. Sustain. Food Syst. 2020, 4, 437086. [Google Scholar] [CrossRef]
- Li, X.; Troy, T.J. Changes in rainfed and irrigated crop yield response to climate in the western US. Environ. Res. Lett. 2018, 13, 064031. [Google Scholar] [CrossRef]
- Achour, H.; Toujani, A.; Rzigui, T.; Faiz, S. Forest cover in Tunisia before and after the 2011 Tunisian revolution: A spatial analysis approach. J. Geovis. Spat. Anal. 2018, 2, 10. [Google Scholar] [CrossRef]
- CRDA Sidi Bouzid. CRDA Sidi Bouzid. Gestion des ressources naturelle à Sidi Bouzid; Internal report; Regional Agricultural Development Comisssion, Ed.; CRDA: Tunis, Tunisie, 2021. [Google Scholar]
- Elloumi, M. L’agriculture tunisienne dans le contexte de la libéralisation. Libéralisation Agricole Pays Développement (Revue Rég. Développement) 2006, 23, 129–159. Available online: https://regionetdeveloppement.univ-tln.fr/wp-content/uploads/R23_Elloumi.pdf (accessed on 5 November 2022).


| Data Sets | Acquisition Date | Resolution (m) |
|---|---|---|
| USGS Landsat 3 MSS | 01 September 1980/31 August 1981 | 60 |
| USGS Landsat 5 Tier 1 Surface Reflectance | 01 September 1990/31 August 1991 | 30 |
| USGS Landsat 7 Tier 1 Surface Reflectance | 01 September 2000/31 August 2001 01 September 2010/31 August 2011 | 30 |
| USGS Landsat 8 Tier 1 Surface Reflectance | 01 September 2020/31 August2021 | 30 |
| LULC Category | Description |
|---|---|
| Rangeland | Grazed land characterized by natural vegetation. |
| Rainfed olive | Olives cultivated in solely rainfed areas. |
| Rainfed annual crops | Annual crops that rely on rainfall for water, specifically cereals and forage crops |
| Irrigated crops | Includes areas with at least one crop cycle using irrigation as a water source |
| Rangeland | Rainfed Olive | Rainfed Annual Crops | Irrigated Crops | ||
|---|---|---|---|---|---|
| 1980 (Landsat 3) | Polygons | 16 | 10 | 18 | - |
| Surface (pixels) | 75 | 42 | 92 | - | |
| 1990 (Landsat 5) | Polygons | 15 | 7 | 10 | - |
| Surface (pixels) | 233 | 67 | 89 | - | |
| 2000 (Landsat 7) | Polygons | 21 | 23 | 16 | - |
| Surface (pixels) | 444 | 689 | 144 | - | |
| 2010 (Landsat 7) | Polygons | 23 | 67 | 8 | 6 |
| Surface (pixels) | 756 | 2644 | 311 | 111 | |
| 2020 (Landsat 8) | Polygons | 92 | 76 | 6 | 146 |
| Surface (pixels) | 1156 | 2433 | 233 | 633 | |
| Rangeland | Rainfed Olive | Rainfed Annual Crops | Irrigated Crops | ||
|---|---|---|---|---|---|
| 1980 (Landsat 3) | PA | 0.98 | 0.96 | 0.98 | _ |
| UA | 0.97 | 0.97 | 0.99 | _ | |
| OA | 0.98 | ||||
| K | 0.97 | ||||
| 1990 (Landsat 5) | PA | 0.99 | 0.96 | 0.99 | _ |
| UA | 0.98 | 0.98 | 0.99 | _ | |
| OA | 0.99 | ||||
| K | 0.98 | ||||
| 2000 (Landsat 7) | PA | 0.98 | 0.99 | 0.97 | _ |
| UA | 0.99 | 0.98 | 0.98 | _ | |
| OA | 0.99 | ||||
| K | 0.98 | ||||
| 2010 (Landsat 7) | PA | 0.97 | 0.99 | 0.96 | 0.71 |
| UA | 0.95 | 0.96 | 0.98 | 0.99 | |
| OA | 0.96 | ||||
| K | 0.93 | ||||
| 2020 (Landsat 8) | PA | 0.97 | 0.97 | 0.94 | 0.97 |
| UA | 0.95 | 0.97 | 0.97 | 0.99 | |
| OA | 0.97 | ||||
| K | 0.95 | ||||
| Period | Drivers | Rank |
|---|---|---|
| 1980–1990 | Sedentarization policy | 1 |
| Decreased sheep grazing | 2 | |
| Severe droughts | 3 | |
| Increased implementation of SWC techniques by the local population | 4 | |
| Seasonal migration | 5 | |
| Land registration operation | 6 | |
| 1990–2000 | the implementation of the first national strategy of SWC | 1 |
| 2000–2010 | Severe droughts | 1 |
| The widespread use of irrigation in Regueb | 2 | |
| Topography and soil fertility | 3 | |
| Availability of larger farms | 4 | |
| 2010–2020 | The revolution resulting in the weak administrative control | 1 |
| Topography and soil fertility | 2 | |
| Occurrence of larger farms | 3 | |
| Extended drought periods | 4 | |
| High cost of forage grass | 5 | |
| Increased cost of fuel and electricity | 6 | |
| Tradition of cultivating rainfed olive | 7 |
Disclaimer/Publisher’s Note: The statements, opinions and data contained in all publications are solely those of the individual author(s) and contributor(s) and not of MDPI and/or the editor(s). MDPI and/or the editor(s) disclaim responsibility for any injury to people or property resulting from any ideas, methods, instructions or products referred to in the content. |
© 2023 by the authors. Licensee MDPI, Basel, Switzerland. This article is an open access article distributed under the terms and conditions of the Creative Commons Attribution (CC BY) license (https://creativecommons.org/licenses/by/4.0/).
Share and Cite
Kadri, N.; Jebari, S.; Augusseau, X.; Mahdhi, N.; Lestrelin, G.; Berndtsson, R. Analysis of Four Decades of Land Use and Land Cover Change in Semiarid Tunisia Using Google Earth Engine. Remote Sens. 2023, 15, 3257. https://doi.org/10.3390/rs15133257
Kadri N, Jebari S, Augusseau X, Mahdhi N, Lestrelin G, Berndtsson R. Analysis of Four Decades of Land Use and Land Cover Change in Semiarid Tunisia Using Google Earth Engine. Remote Sensing. 2023; 15(13):3257. https://doi.org/10.3390/rs15133257
Chicago/Turabian StyleKadri, Nesrine, Sihem Jebari, Xavier Augusseau, Naceur Mahdhi, Guillaume Lestrelin, and Ronny Berndtsson. 2023. "Analysis of Four Decades of Land Use and Land Cover Change in Semiarid Tunisia Using Google Earth Engine" Remote Sensing 15, no. 13: 3257. https://doi.org/10.3390/rs15133257
APA StyleKadri, N., Jebari, S., Augusseau, X., Mahdhi, N., Lestrelin, G., & Berndtsson, R. (2023). Analysis of Four Decades of Land Use and Land Cover Change in Semiarid Tunisia Using Google Earth Engine. Remote Sensing, 15(13), 3257. https://doi.org/10.3390/rs15133257