Communication

Sensitivity of Grassland Coverage to Climate across Environmental Gradients on the Qinghai-Tibet Plateau

1
Institute of Environment and Sustainable Development in Agriculture, Chinese Academy of Agricultural Sciences, Beijing 100081, China
2
National Data Center of Agricultural Environment, Beijing 100081, China
3
National Agricultural Experimental Station for Agricultural Environment, Nagqu 852000, China
*
Author to whom correspondence should be addressed.
Remote Sens. 2023, 15(12), 3187; https://doi.org/10.3390/rs15123187
Submission received: 27 April 2023 / Revised: 29 May 2023 / Accepted: 6 June 2023 / Published: 19 June 2023

Abstract

:
Grassland cover is strongly influenced by climate change. The response of grassland cover to climate change becomes complex with background climate. There have been some advances in research on the sensitivity of grassland vegetation to climate change around the world, but the differences in climate sensitivity among grassland types are still unclear in alpine grassland. Therefore, we applied MODIS NDVI data and trend analysis methods to quantify the spatial and temporal variation of grassland vegetation cover on the Qinghai-Tibet Plateau. Then, we used multiple regression models to analyze the sensitivity of fractional vegetation cover (FVC) to climatic factors (Temperature, Precipitation, Solar radiation, Palmer drought severity index) and summarized the potential mechanisms of vegetation sensitivity to different climatic gradients. Our results showed (1) a significant increasing trend in alpine desert FVC from 2000–2018 (1.12 × 10⁻³/a, R2 = 0.56, p < 0.001) but no significant trend in other grassland types. (2) FVC sensitivity to climatic factors varied among grassland types, especially in the alpine desert, which had over 60% of the area with positive sensitivity to temperature, precipitation and PDSI. (3) The sensitivity of grassland FVC to heat factors decreases with rising ambient temperature while the sensitivity to moisture increases. Similarly, the sensitivity to moisture decreases while the sensitivity to thermal factors increases along the moisture gradient. Furthermore, the results suggest that future climate warming will promote grassland in cold and wet areas of the Qinghai-Tibet Plateau and may suppress vegetation in warmer areas. In contrast, the response of the alpine desert to future climate is more stable. Studying the impact of climate variation at a regional scale could enhance the adaptability of vegetation in future global climates.

1. Introduction

Grasslands occupy 40% of the global surface area and serve as carbon sinks; they store and release water and maintain the biodiversity of terrestrial ecosystems [1,2]. However, grassland vegetation is sensitive and vulnerable to climate alterations such as temperature and humidity extremes that affect vegetation growth and activity [3,4] and, therefore, strongly influence productivity [5]. Fractional vegetation cover (FVC) is a method for the characterization and dynamic monitoring of surface vegetation conditions [6,7]. Long-term observations of green cover provide unique insights into vegetation productivity responses to climate change [8]. Therefore, quantifying FVC sensitivity to climate variation is an effective way to understand the impact of climate change on grassland productivity and provides support for adaptation to future climatic conditions.
The temperature sensitivity of grassland varies with climatic space, and the temperature effects of productivity are not uniform between different regions. The warming effect on alpine grasslands varies with spatial location, and water availability also regulates vegetation growth [9]. Other studies have shown that the temperature sensitivity of vegetation also depends on ambient temperature and grassland types [10]. Temperature sensitivity studies in grasslands promoted the understanding of the relationship between temperature varying and vegetation growth. However, it is still unclear how grassland FVC sensitivity to temperature varied across the different climatic gradients.
Precipitation is a key factor regulating vegetation and ecosystem processes, and grasslands are more sensitive to dry rather than wet conditions, and this has been globally proved [5]. Mean annual precipitation was found to be the environmental factor most closely linked with grassland vegetation growth [11]. In particular, the Palmer drought severity index (PDSI) represents the degree of dryness and humidity of the symptomatic climate and is widely used in the study of the evolution of vegetative responses to climate change [12,13]. For instance, arid grasslands were most sensitive to drought in six different grasslands of the central United States [13]. Similar results were found in China, where grasslands and croplands were more strongly affected by drought in northern regions, which received less rainfall than southern regions [12]. These studies illustrate that the sensitivity of vegetation productivity to climate change becomes complex with climate space. In the climate-sensitive Qinghai-Tibet Plateau (QTP), the sensitivity of its vegetation to environmental factors has not been thoroughly explored.
The QTP is known as the “roof of the world” and the “third pole” [14] and is comprised of 60% alpine grassland. These are the highest grassland ecosystems in the world and are extremely sensitive to climate change [15]. The spatial heterogeneity of climate trends leads to different responses of alpine grasslands in terms of diversity, phenology and even productivity [16]. However, many studies have provided a good understanding of the spatial distribution and temporal dynamics of the sensitivity of QTP grasslands to climate change, but the gradient of climate sensitivity of grassland productivity with different environmental factors is still unclear. Therefore, we used FVC as a grassland productivity factor to analyze the spatial and temporal dynamics of different grassland types from 2000 to 2018. Meanwhile, based on the sensitivity of grassland FVC to various climate factors, we elucidate the distribution mechanism of climate sensitivity of various grassland types with climate gradients. This work provides data and theoretical support for future research on grassland dynamics and for formulating a sustainable grassland management plan for the QTP.

2. Materials and Methods

2.1. Study Area

The Qinghai-Tibet Plateau is located in southwestern China, with a total area of about 268.32 Mha [17]. The average altitude is >4000 m, the average annual temperatures range from >15 °C to <0 °C and the average annual precipitation ranges from >1000 mm to <50 mm [18]. The QTP possesses 3 primary grassland types; alpine meadow, alpine steppe and alpine desert, which are distributed from southeast to northwest [19] (Figure 1).

2.2. Data Sources and Collation

2.2.1. Satellite Vegetation Index Data

The MOD13A2 16-day 1-km MODIS NDVI product from the NASA Earth Data Search website (https://search.earthdata.nasa.gov/search, accessed on 30 May 2023) was selected as the remote-sensing vegetation index in this paper (Figure S1). Method of Maximum Value Composites was used to mitigate the effects of cloud cover, aerosols, cloud shadows, solar altitude and human disturbance [20,21]. Eventually, annual maxima of NDVI were obtained for each year from 2000–2018 to represent the dynamics of vegetation using ENVI Version 5.3 (Esri, Redlands, CA, USA).

2.2.2. Climate Dataset

In this paper, we adopted critical hydrothermal condition factors for vegetation growth, such as temperature and precipitation (Figures S2 and S3), and selected surface solar radiation (Srad) and PDSI, which characterize the degree of heat and climate drought, for sensitivity analysis of vegetation cover. Meteorological data collected from the National Tibetan Plateau Scientific Data Centre (https://data.tpdc.ac.cn, accessed on 30 May 2023), including temperature, precipitation and Srad data from 2000–2018, at 1 km and 10 km spatial resolution. PDSI datasets (from 2000–2018) were taken from the Earth Surface Climate Variable Data Set CRU-TS4.05 (https://crudata.uea.ac.uk/cru/data/hrg, accessed on 30 May 2023), which has a spatial resolution of 0.5° × 0.5° and has been widely used in global climate change research [20]. The four climate factors were acquired in this paper; temperature, precipitation, Srad and PDSI were applied as mean annual temperatures, total precipitation, mean annual Srad and mean annual PDSI. Specifically, PDSI is a meteorological drought index for estimating moisture supply and demand [12]. Moreover, PDSI scores > 0 represent wet and <0 designate dry. The vegetation growth, soil moisture and integrated environmental factors are also important components and are represented in the PDSI score [22]. For uniformity of the spatial data, the nearest neighbor interpolation method was used to resample the Srad and PDSI data to 1km in ArcGIS 10.8, and the projection coordinate system of all data was set to WGS 1984 UTM ZONE 47 to obtain the final climate data set for 2000–2018.

2.2.3. Vegetation Type

The spatial distribution data of vegetation types in this paper were obtained from the 1:1,000,000 vegetation map of China [23] from the National Tibetan Plateau Scientific Data Center (https://data.tpdc.ac.cn/, accessed on 30 May 2023). The spatial distribution data of the 3 primary grassland vegetation types were extracted; alpine meadow, alpine steppe and alpine desert (Figure 1).

2.3. Data Analysis

2.3.1. Calculation of FVC

The dimidiate pixel model [7] was chosen for calculating the FVC with ENVI Version 5.3. This method is a simple and efficient type of mixed-pixel linear discretization that is broadly available for most vegetation studies. This model takes the NDVI value of an image element as the surface-weighted sum of the NDVI of vegetated cover and unvegetated cover (bare ground). The equation is as follows.
F V C = N D V I N D V I s N D V I v N D V I s
where FVC represents the vegetation cover of the pixel, N D V I represents the NDVI value of bare soil, and N D V I v represents the NDVI value of pure vegetation pixels. By summarizing the experience of previous studies and the actual situation in the study area, the NDVI values were ranked, and the NDVI values corresponding to the first 5% of the calculated results were   N D V I s , and the NDVI values corresponding to the last 95% were NDVIV.

2.3.2. Trend Analysis

The Theil-Sen Median trend analysis with the Mann-Kendall trend significance test [24,25] were used in this paper to reveal the FVC dynamics of QTP. This analysis is a robust trend analysis method based on non-parametric statistics [26] and is less sensitive to outliers in the time series [27]. Therefore, this method is often used for long-term analysis of vegetation and meteorological factors [28,29,30]. The slope β of the Theil-Sen Median indicates that the increase or decrease rate of the time series can be obtained by the following equation:
β = Median F V C i F V C j i j ;   2000 j < i 2020
where F V C i and F V C j are the annual max FVC value in years i and j. When β > 0, FVC exhibits an increasing tendency; if β < 0, FVC exhibits a decreasing tendency.
The MK test is a non-parametric test that does not require the data to obey a normal distribution [31] and is insensitive to the interference of a few outliers, especially effective for short-term time series data [32]. In this study, FVC trends and p-values were calculated in MATLAB for Windows Version 2019b (MathWorks, Natick, MA, USA).

2.3.3. Sensitivity Analysis

We applied a multiple linear regression method to examine the relationships between FVC and climate change. To distinguish the independent effects of climate variation from the joint effects on vegetation growth, the first difference in the FVC time series and climatic factors was calculated and then utilized in the regression model [33]. The first difference represents the absolute difference between two consecutive years and refers to the year-by-year change in FVC or climatic factors. It is commonly used as a detrending method to reduce or improve the effect of long-term trends between climate and vegetation productivity. The multiple regression equation established was as follows:
F V C = S t e m × T e m + S p r e × P r e + S p d s i × P D S I + S s r a d × S r a d + i n t
F V C is the first difference for two consecutive years. T e m , P r e , P D S I , S r a d denote the first-difference value of mean annual temperature, annual precipitation, mean annual drought index and mean annual solar radiation of the corresponding period. S t e m , S p r e , S P D S I ,   S s r a d denote the sensitivity to climatic factors, respectively; int is the constant of the regression equation. The above work was performed using MATLAB Version 2019b.
To analyze the variation of vegetation sensitivity to climatic factors across environmental gradients, the mean sensitivity to climatic factors was calculated for each environmental interval. The gradient of mean annual temperature (MAT) was set to 0.2 °C, and the mean value of sensitivity was determined as the corresponding dependent variable in this interval. By analogy, the gradient of annual precipitation was 20 mm, the gradient of mean annual PDSI was 0.2, and the gradient of mean annual Srad was 0.2. The mean values of climate sensitivity for all environmental gradients were fitted by using the linear regression method in Origin Version 2018 (OriginLab, Northampton, MA, USA).

3. Results

3.1. Spatial and Temporal Dynamics of FVC for the Qinghai-Tibet Plateau

Grassland FVC has a highly heterogeneous spatial distribution on the Qinghai-Tibet Platea. Areas with high FVC accounted for 26.3% of the total grassland (FVC > 60%) and were distributed in the southeast. The central region contained 18.5% of the grassland in the range 60% > FVC > 30%, while 55.2% of the north and west areas had low (FVC < 30%) FVC values (Figure 2a).
The FVC of the QTP grasslands displayed an overall trend of enhancement. For instance, areas with increasing trends were more than half of the area (57.8%), and significantly increased FVC were distributed in the northeastern region (19.6%). Overall, 42.2% of the area displayed a decreasing trend, and only 10.2% of the area showed a significant trend, mainly in the north and sporadically in the southern part of the plateau (Figure 2b).
During the study period, the FVC of different grassland types showed different trend distributions (Figure 3). The FVC of alpine desert showed a significant increasing trend (1.12 × 10⁻³/a, R2 = 0.56, p < 0.001), while the FVC had no significant trend on alpine steppe (3.38 × 10⁻⁴/a, R2 = 0.03), alpine meadow (−1.54 × 10⁻⁴/a, R2 = 0.004) or total grassland (2.78 × 10⁻⁴/a, R2 = 0.02).

3.2. Spatial Distribution of Sensitivity of FVC to Climatic Factors

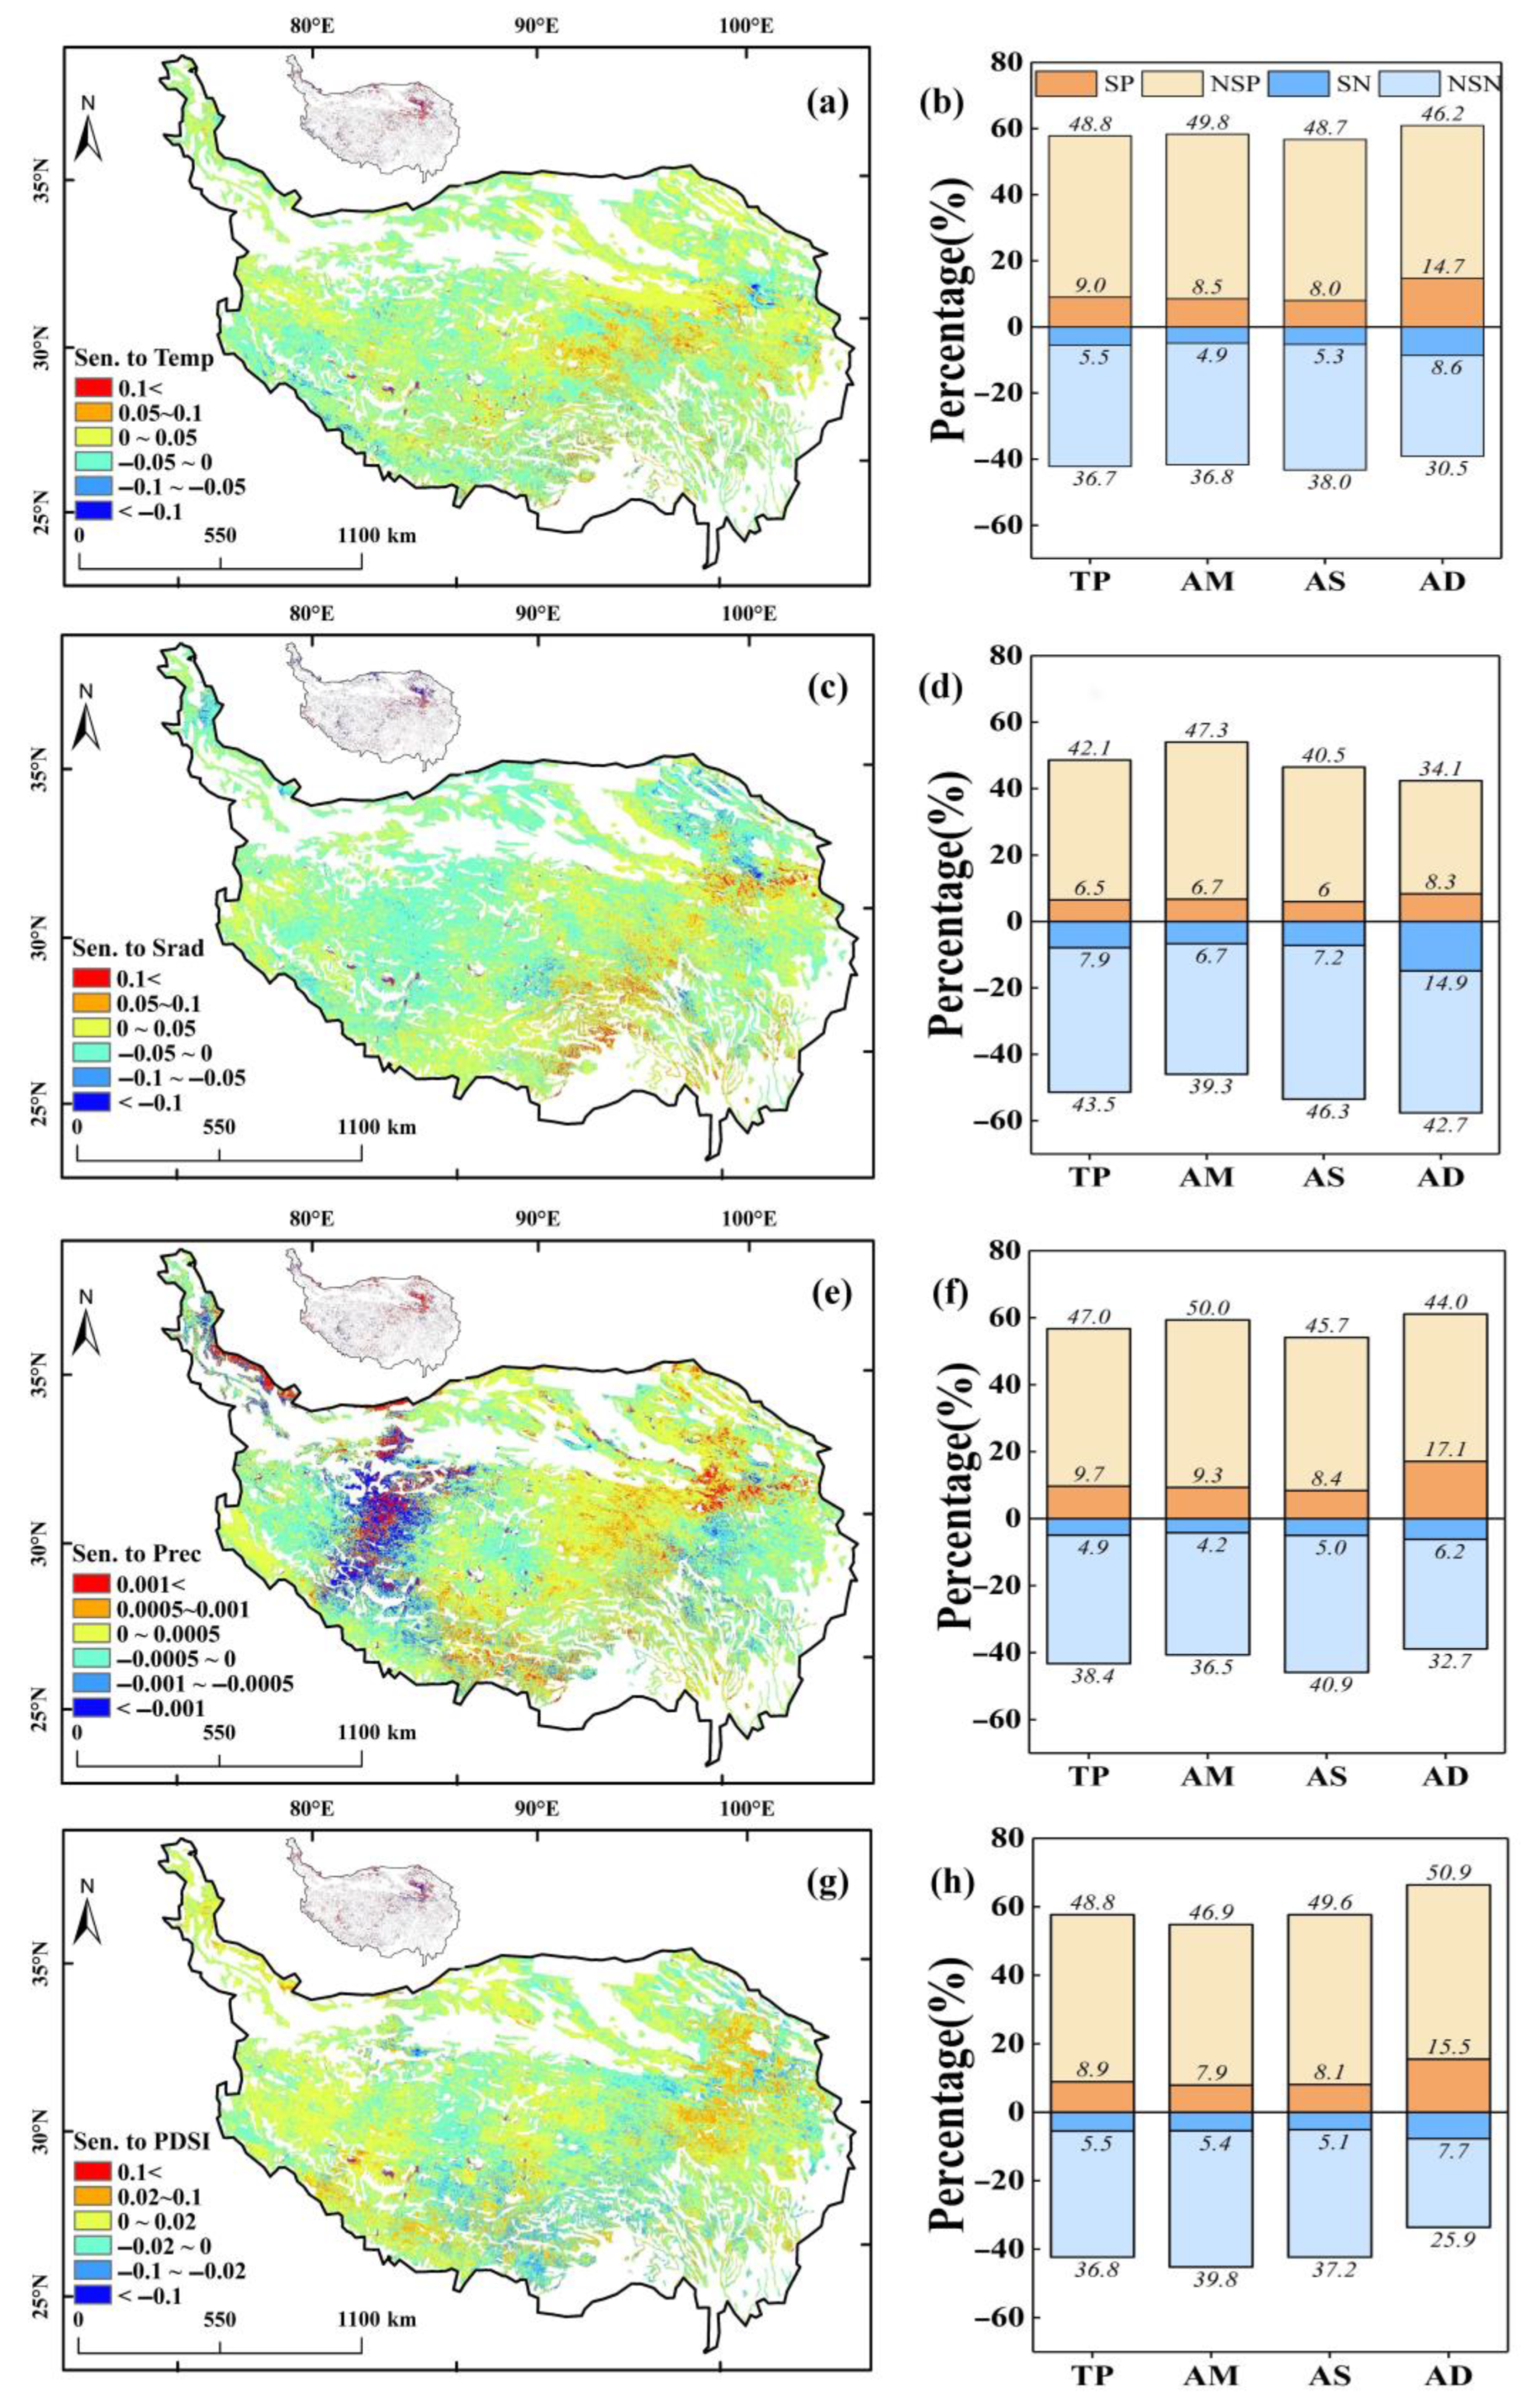
The sensitivity of alpine grassland FVC to temperature has a strong spatial heterogeneity. We observed that 9.0% of the grassland area exhibited a significant positive sensitivity to temperature, predominantly distributed in the central part of the Qinghai-Tibet Plateau (QTP). Conversely, 5.5% of the grassland area showed a significant negative sensitivity, distributed in the northeast and southwest regions of the QTP (see Figure 4a). All three types of grasslands exhibited a larger area of positive sensitivity to temperature compared to negative impact areas. The alpine desert exhibited the highest positive sensitivity (14.7%), followed by the alpine meadow (8.5%) and the alpine steppe (8.0%). Notably, the alpine desert also exhibited the highest percentage of significantly negative sensitivity areas, indicating it is most responsive to temperature change (Figure 4b).
The sensitivity of grassland FVC to solar radiation (Srad) revealed that more than half of the grassland exhibited negative sensitivity, with a significant area of 7.9%, primarily located in the southwest and parts of the northeast regions (Figure 4c). Conversely, regions displaying a significant positive effect (6.5%) were primarily found in the northeast. Most grassland types exhibited larger areas of significant negative sensitivity compared to significant positive sensitivity, with the alpine desert exhibiting the highest proportion of negative sensitivity (14.9%). Notably, alpine meadows had a relatively higher proportion of positive sensitivity (see Figure 4d).
The precipitation sensitivity of grassland FVC showed positive sensitivity in 56.8% of alpine grasslands (9.7% significant) and mainly in the northeast, central and southwest. Moreover, 43.2% of the total grassland displayed negative sensitivity, with only 4.9% significance (Figure 4e). All three types of grassland exhibited mostly positive FVC sensitivity to precipitation in over 50% of their areas, especially in the alpine desert, where the positive area was about 60% with a 17.1% of significant relationship (Figure 4f).
The sensitivity of grassland FVC to PDSI showed positive sensitivity in 57.7% of the grassland area. The significant positive areas covered 8.9% of the grasslands that were primarily in the northeast, central and southwest. The significant negative impact area occupied 5.5% of the total grassland (Figure 4e). The sensitivity of grassland FVC to PDSI showed positive responses across most spaces, and a positive sensitivity covered over 50% of the area. The alpine desert has the highest proportion of positive sensitivity (Figure 4h).

3.3. The Sensitivity of FVC to Climatic Factors with Climatic Gradients

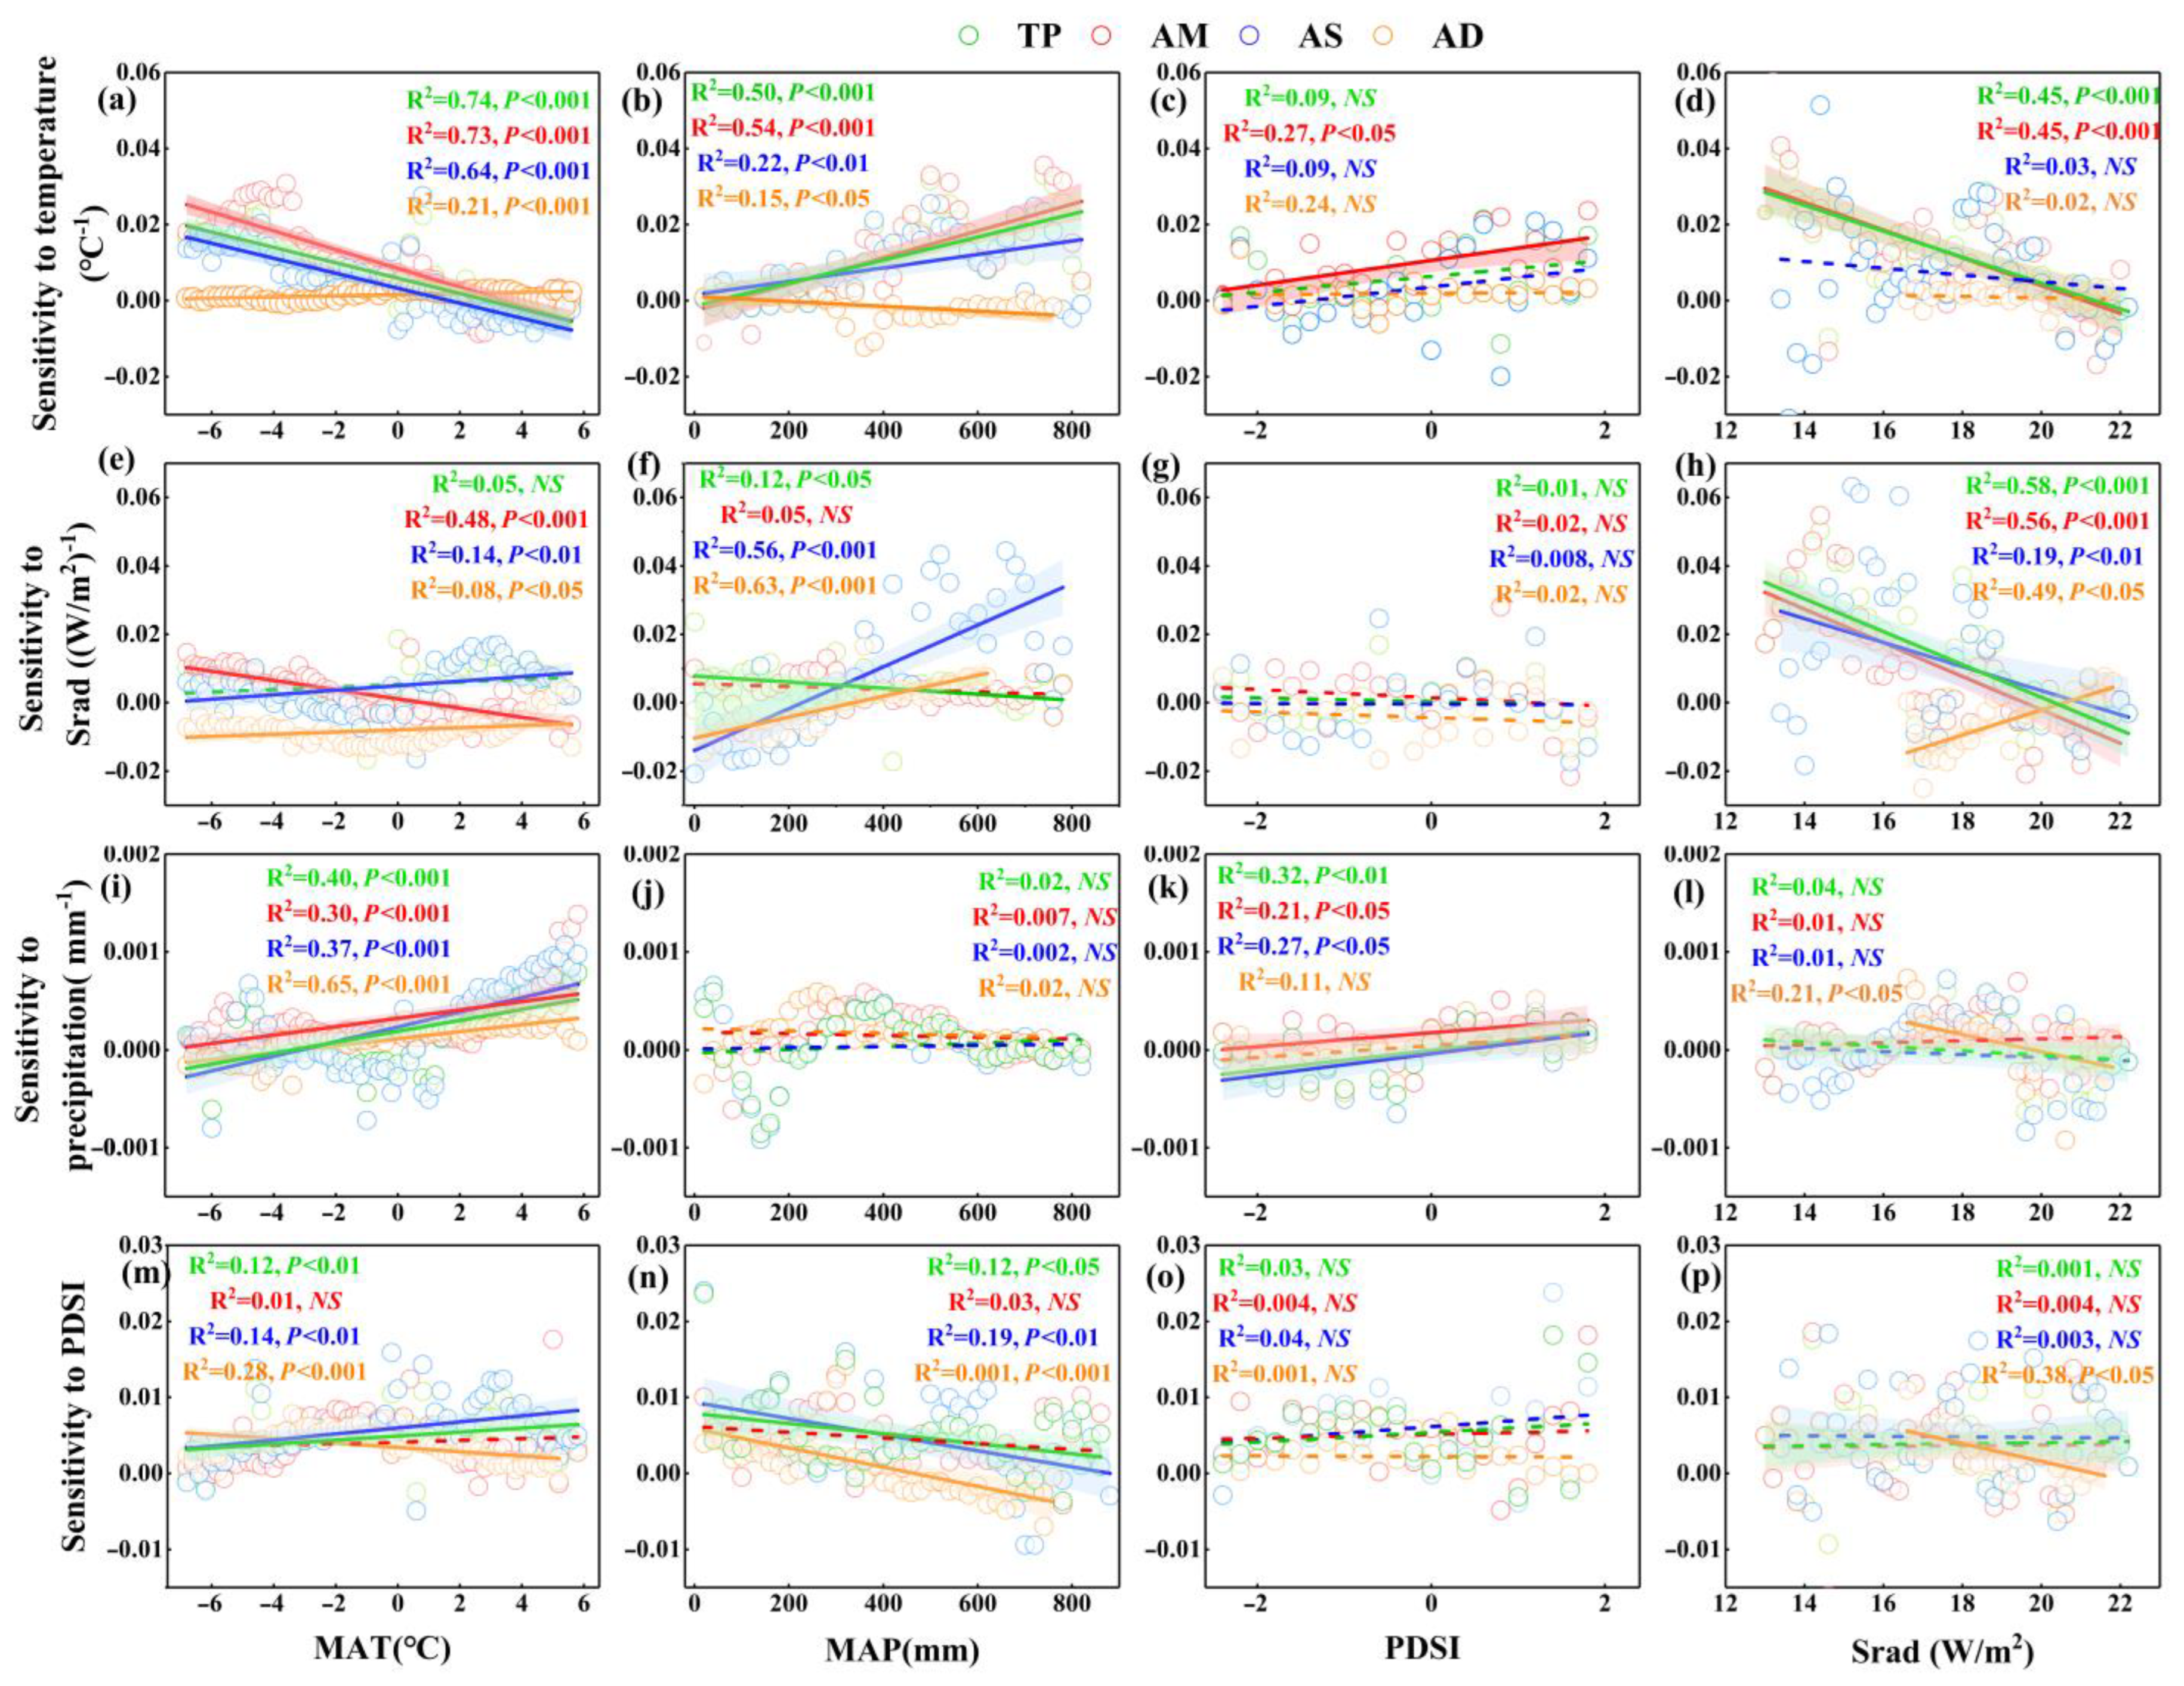
The climate sensitivity of grassland FVC responded differently across the temperature gradient (Figure 5). The temperature sensitivity of alpine grasslands decreased significantly with increased temperature, as in alpine meadows and alpine steppe. However, the temperature sensitivity of alpine deserts tended to rise with increasing temperature (Figure 5a). Temperature sensitivity of grassland FVC increases with the precipitation gradient, but there is an opposite trend in the alpine desert (Figure 5b). As PDSI increased, temperature sensitivity tended to increase significantly in the alpine meadow, but there were no significant dynamics in other grasslands (Figure 5c). As Srad increased, temperature sensitivity tended to decrease significantly in the alpine meadow and alpine grassland, whereas no significant changes were observed in the other grassland types (Figure 5d).
The Srad sensitivity of grassland FVC responds differently to temperature gradients. Among the various grassland types, the Srad sensitivity of the alpine steppe showed a significant increasing trend, while the Srad sensitivity of the alpine meadow significantly decreased with rising temperature. The sensitivity of alpine deserts to radiation has a significant positive trend as the climate warms (Figure 5e). As precipitation increases, the sensitivity to Srad tends to decline significantly in the alpine grassland but increases significantly in the alpine steppe and the alpine desert (Figure 5f). Furthermore, a significant positive trend in Srad sensitivity occurred in the alpine desert along the radiation gradient, while a significant negative trend was observed in the alpine meadow and other grassland types (Figure 5h). Along PDSI gradients, there is no significant trend in the Srad sensitivity of alpine grassland (Figure 5g).
The precipitation sensitivity of grassland FVC tended to increase significantly with rising temperature, with consistent changes for all grassland types (Figure 5i). Precipitation sensitivity also tended to increase slightly with rising PDSI in most grassland, but no significant dynamics were found in alpine deserts (Figure 5k). With increasing radiation, precipitation sensitivity decreased significantly only in the alpine desert, but no significant trend was found in other grasslands (Figure 5l). There was no significant trend in precipitation sensitivity to precipitation gradient for all grasslands (Figure 5j).
The PDSI sensitivity of alpine grassland FVC showed a significant increasing trend along the temperature gradient. Among the different grasslands, there was a significant increasing trend in the alpine steppe and alpine desert, while no significant relationship was found in the alpine meadow (Figure 5m). The sensitivity to PDSI tended to decrease significantly with increasing precipitation in most grasslands, but there was no significant relationship in the alpine meadow (Figure 5n). Only the alpine desert showed a significant decrease in PDSI sensitivity with an increase in radiation (Figure 5p), while the trend in other grasslands was not significant. Furthermore, no clear trend in the PDSI sensitivity of grassland FVC was observed with the gradient of PDSI (Figure 5o).

4. Discussion and Conclusions

Throughout the study period, the alpine desert FVC showed a significant increasing trend, while the FVC dynamics in other grasslands were not significant. QTP grassland productivity is generally consistent with the trends in vegetation productivity in most parts of the world [34]. Grassland productivity has been found to vary with geographic distribution over the last 20 years [35]. The trend for grassland productivity in the eastern part of the QTP primarily increased in contrast to the western part, that decreased [10]. Various grassland types on the QTP showed distinct trends in FVC, which is somewhat different from previous studies [36]. This discrepancy may be the result of differing data sources and study periods, and factors such as these should be taken into consideration so that studies can be directly compared.
The spatial distribution of the sensitivity of alpine grassland vegetation to different climatic factors is inconsistent. The temperature sensitivity of alpine grasslands has a positive sensitivity in the central and eastern parts of the plateau and a negative sensitivity in the southwest, which is also consistent with previous studies [37]. While the sensitivity of alpine vegetation to solar radiation spatially indicates a positive sensitivity of vegetation in the eastern and southern parts of the plateau and a negative sensitivity response in the predominantly central part of the plateau, this is also consistent with previous studies in this area [38]. Of all the factors affecting vegetation, apart from thermal factors, moisture conditions are also the most immediate and critical [39]. Previous studies have also shown that most Qinghai-Tibet Plateau grasslands exhibit positive sensitivity to precipitation, especially in the northeastern part of the plateau, where increased precipitation promotes vegetation growth in alpine grasslands, and a negative sensitivity is mainly observed in the southwestern part of the plateau [40], while there is a consistent spatial distribution pattern in our results.
The sensitivity of alpine grasslands to heat indicators gradually decreased to a thermal gradient. For instance, the temperature sensitivity and radiation sensitivity in alpine grassland both exhibit a downward trend with rising external heat (Figure 5a,d,h). Vegetation is more sensitive to temperature changes in colder environments, as relatively small temperature fluctuations can have a greater impact on vegetation’s heat balance [41]. Therefore, vegetation in colder areas tends to have a stronger response to the same degrees of warming and may be more susceptible to heat constraints than vegetation in warmer areas [42]. Additionally, the temperature sensitivity of NDVI decreases with rising temperatures, implying that sensitivity reduces as temperature increases [43,44,45].
Our study identified similar trends in the sensitivity of vegetation to moisture conditions, such as the PDSI sensitivity of FVC decreasing with increased precipitation and the precipitation sensitivity of FVC decreasing with progressively wetter climates (Figure 5k,n). This finding is consistent with previous studies in the United States, which found that vegetation sensitivity to precipitation decreased from desert and grassland to savanna and forest domains [46]. Empirical models of vegetation’s climate sensitivity across the globe have demonstrated that water sensitivity is less pronounced in wetter regions [47,48]. This may be due to the limited precipitation in arid regions, where vegetation growth is primarily restricted by water availability [5,49]. In contrast, in wetter areas, plant growth is typically limited by other factors, such as influencing substances, and therefore tends to be less sensitive to changes in precipitation [13,50]. Overall, vegetation productivity appears to exhibit lower sensitivity with continental-scale precipitation gradients or thermal gradients, either linearly or non-linearly [46].
As one factor of heat or moisture conditions gradually increases, the sensitivity of FVC to the other factor would gradually increase. Our findings suggest that the sensitivity of alpine grassland FVC to temperature increases with the gradient of precipitation, the sensitivity of precipitation increases with the gradual increase of temperature, and the sensitivity to PDSI also significantly increases with the rise of temperature (Figure 5b,i,m). On the one hand, increased temperature enhances photosynthesis, which in turn increases the water demand of vegetation [51]. On the other hand, increased precipitation reduces the water stress on the vegetation environment and leads to an effective improvement in vegetation growth. In addition, the transfer of nitrogen from the soil to vegetation is severely limited in dry soils, while increased soil moisture promotes more nitrogen uptake by vegetation to support their growth [52,53]. In wet and cold areas, vegetation is more sensitive to temperature than precipitation, but the opposite condition is observed in arid zones, where precipitation is the key factor due to limited water resources [54,55]. Conversely, heat becomes a constraint for vegetation growth in wet areas where water resources are abundant and in cold areas where temperatures are relatively low [45]. However, the sensitivity of alpine grassland to radiation showed a clear tendency to decrease with increasing precipitation gradient (Figure 5f). It suggested that increased precipitation offset part of the radiation impact on alpine grassland, thus reducing the radiation sensitivity. These findings provide valuable insights into the complex interplay between heat and moisture conditions on alpine grassland productivity and can guide the formulation of effective grassland management strategies in the future.
The FVC sensitivity to climate evolution is not consistent in different grassland types. The temperature sensitivity of the alpine meadow and alpine steppe gradually decreases with an increasing temperature gradient, and negative sensitivity may occur above their temperature threshold (Figure 5a). This generally indicates that grassland response to temperature is more sensitive in colder than warmer areas, and our results suggest that warming may inhibit the growth of grassland vegetation in areas with mean annual temperatures above 2 °C. Moreover, the temperature sensitivity of the alpine meadow and steppe also tended to increase gradually on the precipitation gradient (Figure 5b), indicating that grasslands in wetter climates are more sensitive to temperature. The temperature sensitivity of alpine desert FVC had a relatively small variation which is around zero, although it had a significant trend to both temperature gradient and precipitation gradient. Thus, the sensitivity of the alpine desert to climate change is relatively stable, especially compared to the alpine meadow and steppe [14]. Therefore, more emphasis needs to be placed on discussing grassland types’ responses to climate change in future studies [56,57]. Different QTP future climatic scenario models showed that both temperature and precipitation tend to increase to different degrees [58], which may also affect the structure and function of grassland ecosystems on the Qinghai-Tibet Plateau. Our results suggested that climate warming will promote the growth of grassland vegetation in colder regions but may inhibit its effective growth in relatively warmer regions. Moreover, warming will have a boosting effect on the grassland vegetation in wet climate areas. Previous studies have also shown that warmer and wetter climates will improve grassland productivity in the future [56]; specifically, warming will improve forage quality in cold and wet areas but will reduce forage quality in warm and dry areas [59]. The alpine meadow in the southeastern part of the Qinghai-Tibet Plateau is gradually evolving into shrubs under climate warming [56]. However, more detailed methods are needed in our study to explore the range change characteristics of the alpine meadow or alpine steppe in response to future climate change. Overall, climate warming has a catalytic effect on alpine grasslands, especially in cold and humid regions, but the climate sensitivity of alpine deserts is relatively stable and low along environmental gradients. Climate change is having a significant impact on the dynamics of vegetation ecosystems across the QTP, particularly in alpine grassland situated at high elevations that are particularly sensitive to such changes [60]. Therefore, understanding the climate sensitivity of alpine grassland on different climate gradients can help predict the response mechanism of vegetation to future climate and propose more scientific and reasonable ecological and environmental conservation management policies, which is also beneficial to improve the quality of life of people dependent on alpine grassland [57].
This paper presents a detailed study of the sensitivity of alpine grassland vegetation cover to climate factors along climatic gradients. The results show that the sensitivity of vegetation cover to temperature and solar radiation decreases with its gradient, while a similar trend is observed for moisture indicators. The FVC sensitivity to heat indicators in alpine grassland tended to increase with moisture gradients, while the FVC sensitivity to moisture indicators became stronger with increasing external heat. However, the limitations cannot be neglected from data availability and objective perceptions. One of the shortcomings of this study is the limited consideration given to the drivers of alpine vegetation productivity beyond hydrothermal conditions. Natural factors such as soil moisture, evapotranspiration, and aerosol content also play a significant role in vegetation cover but were not accounted for in this study. To conduct a more comprehensive and scientifically robust investigation of the mechanisms of spatial and temporal changes in grassland response to climate change, it is necessary to consider the effects of various factors on grassland cover and climate sensitivity. Besides the drivers, the turning point of climate sensitivity with different climate gradients is also an important change factor. This could be achieved by incorporating a more holistic approach that accounts for the interplay of multiple factors influencing grassland dynamics. Future research in this area could greatly benefit from a more interdisciplinary approach, which combines ecological and climatological perspectives to provide a more comprehensive understanding of the mechanisms driving alpine grassland dynamics.

Supplementary Materials

The following supporting information can be downloaded at: https://www.mdpi.com/article/10.3390/rs15123187/s1, Figure S1: Spatial and temporal dynamics of NDVI in grassland on the Qinghai-Tibet Plateau from 2000 to 2018. Figure S2: Spatial distribution of annual mean temperature (a) and mean precipitation (b) in the grasslands of the Qinghai-Tibet Plateau from 2000 to 2018. Figure S3: Temporal and spatial dynamics of grassland temperature and precipitation on the Qinghai-Tibet Plateau from 2000 to 2018.

Author Contributions

Conceptualization, R.W. and G.H.; methodology, R.W. and G.H.; software, R.W.; data curation, R.W.; writing—original draft preparation, R.W. and G.H.; writing—review and editing, G.H., H.G. and Q.G.; supervision, Q.G. All authors have read and agreed to the published version of the manuscript.

Funding

This research was funded by the Second Tibetan Plateau Scientific Expedition and Research Project (2019QZKK0307), the National Natural Science Foundation of China (32171590), and the Central Public-Interest Scientific Institution Basal Research Fund (Y2023LM04, Y2023QC08, BSRF202009, Y2022CG03).

Data Availability Statement

Data supporting the results of this study can be obtained from the corresponding authors on reasonable request.

Conflicts of Interest

The authors declare that they have no known competing financial interests or personal relationships that could have appeared to influence the work reported in this paper.

References

  1. Bardgett, R.D.; Bullock, J.M.; Lavorel, S.; Manning, P.; Schaffner, U.; Ostle, N.; Chomel, M.; Durigan, G.; Fry, E.L.; Johnson, D.; et al. Combatting global grassland degradation. Nat. Rev. Earth Environ. 2021, 2, 720–735. [Google Scholar] [CrossRef]
  2. O’Mara, F.P. The role of grasslands in food security and climate change. Ann. Bot. 2012, 110, 1263–1270. [Google Scholar] [CrossRef] [PubMed] [Green Version]
  3. Brookshire, E.; Stoy, P.C.; Currey, B.; Finney, B. The greening of the Northern Great Plains and its biogeochemical precursors. Glob. Chang. Biol. 2020, 26, 5404–5413. [Google Scholar] [CrossRef] [PubMed]
  4. Jiao, K.; Gao, J.; Liu, Z.; Wu, S.; Fletcher, T.L. Revealing climatic impacts on the temporal and spatial variation in vegetation activity across China: Sensitivity and contribution. Adv. Clim. Chang. Res. 2021, 12, 409–420. [Google Scholar] [CrossRef]
  5. Zeng, X.; Hu, Z.; Chen, A.; Yuan, W.; Hou, G.; Han, D.; Liang, M.; Di, K.; Cao, R.; Luo, D. The global decline in the sensitivity of vegetation productivity to precipitation from 2001 to 2018. Glob. Chang. Biol. 2022, 28, 6823–6833. [Google Scholar] [CrossRef]
  6. Zhang, X.F.; Liao, C.H.; Li, J.; Sun, Q. Fractional vegetation cover estimation in arid and semi-arid environments using HJ-1 satellite hyperspectral data. Int. J. Appl. Earth Obs. 2013, 21, 506–512. [Google Scholar] [CrossRef]
  7. Lin, X.; Chen, J.; Lou, P.; Yi, S.; Qin, Y.; You, H.; Han, X. Improving the estimation of alpine grassland fractional vegetation cover using optimized algorithms and multi-dimensional features. Plant Methods 2021, 17, 96. [Google Scholar] [CrossRef]
  8. Ukkola, A.M.; Kauwe, M.; Roderick, M.L.; Burrell, A.; Pitman, A.J. Annual precipitation explains variability in dryland vegetation greenness globally but not locally. Glob. Chang. Biol. 2021, 27, 4367–4380. [Google Scholar] [CrossRef]
  9. Fu, G.Ø.; Zhang, X.; Zhang, Y.; Shi, P.; Li, Y.; Zhou, Y.; Yang, P.; Shen, Z. Experimental warming does not enhance gross primary production and above-ground biomass in the alpine meadow of Tibet. J. Appl. Remote Sens. 2013, 7, 6451–6465. [Google Scholar] [CrossRef] [Green Version]
  10. Wang, Y.; Lv, W.; Xue, K.; Wang, S.; Zhang, L.; Hu, R.; Zeng, H.; Xu, X.; Li, Y.; Jiang, L.; et al. Grassland changes and adaptive management on the Qinghai–Tibetan Plateau. Nat. Rev. Earth Environ. 2022, 3, 668–683. [Google Scholar] [CrossRef]
  11. Hou, E.Q.; Litvak, M.E.; Rudgers, J.A.; Jiang, L.F.; Collins, S.L.; Pockman, W.T.; Hui, D.F.; Niu, S.L.; Luo, Y.Q. Divergent responses of primary production to increasing precipitation variability in global drylands. Glob. Chang. Biol. 2021, 27, 5225–5237. [Google Scholar] [CrossRef]
  12. Ding, Y.; Xu, J.; Wang, X.; Peng, X.; Cai, H. Spatial and temporal effects of drought on Chinese vegetation under different coverage levels. Sci. Total Environ. 2020, 716, 137166. [Google Scholar] [CrossRef] [PubMed]
  13. Knapp, A.K.; Carroll, C.J.; Denton, E.M.; La Pierre, K.J.; Collins, S.L.; Smith, M.D. Differential sensitivity to regional-scale drought in six central US grasslands. Oecologia 2015, 177, 949–957. [Google Scholar] [CrossRef] [Green Version]
  14. Li, L.; Zhang, Y.; Wu, J.; Li, S.; Zhang, B.; Zu, J.; Zhang, H.; Ding, M.; Paudel, B. Increasing sensitivity of alpine grasslands to climate variability along an elevational gradient on the Qinghai-Tibet Plateau. Sci. Total Environ. 2019, 678, 21–29. [Google Scholar] [CrossRef] [PubMed]
  15. Zha, X.; Niu, B.; Li, M.; Duan, C. Increasing Impact of Precipitation on Alpine-Grassland Productivity over Last Two Decades on the Tibetan Plateau. Remote Sens. 2022, 14, 3430. [Google Scholar] [CrossRef]
  16. Shen, M.; Piao, S.; Cong, N.; Zhang, G.; Jassens, I.A. Precipitation impacts on vegetation spring phenology on the Tibetan Plateau. Glob. Chang Biol. 2015, 21, 3647–3656. [Google Scholar] [CrossRef] [PubMed] [Green Version]
  17. Liu, Y.; Lu, C. Quantifying Grass Coverage Trends to Identify the Hot Plots of Grassland Degradation in the Tibetan Plateau during 2000–2019. Int. J. Env. Res. Pub. He. 2021, 18, 416. [Google Scholar] [CrossRef]
  18. Zhang, Y.; Qi, W.; Zhou, C.; Ding, M.; Liu, L.; Gao, J.; Bai, W.; Wang, Z.; Zheng, D. Spatial and temporal variability in the net primary production of alpine grassland on the Tibetan Plateau since 1982. J. Geogr. Sci. 2014, 24, 269–287. [Google Scholar] [CrossRef]
  19. Cao, X.J.; Ganjurjav, H.; Hu, G.Z.; Gao, Q.Z. Characteristics of Grassland Degradation in the Qinghai Tibetan Plateau, Based on NDVI3g Data. Chin. J. Agrometeorol. 2019, 40, 86–95. (In Chinese) [Google Scholar]
  20. Cao, X.; Gao, Q.; Hasbagan, G.; Liang, Y.; Li, W.; Hu, G. Corrigendum to: Influence of climatic factors on variation in the Normalised Difference Vegetation Index in Mongolian Plateau grasslands. Rangel. J. 2018, 40, 205. [Google Scholar] [CrossRef]
  21. HOLBEN; Brent, N. Characteristics of maximum-value composite images from temporal AVHRR data. Int. J. Remote Sens. 1986, 7, 1417–1434. [Google Scholar]
  22. Dai, A. Characteristics and trends in various forms of the Palmer Drought Severity Index during 1900–2008. J. Geophys. Res. Atmos. 2011, 116, D12115. [Google Scholar] [CrossRef] [Green Version]
  23. Hou, X. 1:1 Million Vegetation Map of China; National Tibetan Plateau/Third Pole Environment Data Center: Beijing, China, 2019. [Google Scholar]
  24. Yaru, Z.; Yi, H.; Yanlin, L.; Liping, J. Spatiotemporal variation and driving forces of NDVI from 1982 to 2015 in the Qinba Mountains, China. Environ. Sci. Pollut. Res. 2022, 29, 52277–52288. [Google Scholar]
  25. Kisi, O.; Ay, M. Comparison of Mann-Kendall and innovative trend method for water quality parameters of the Kizilirmak River, Turkey. J. Hydrol. 2014, 513, 362–375. [Google Scholar] [CrossRef]
  26. Cui, L.; Wang, L.; Singh, R.P.; Lai, Z.; Jiang, L.; Yao, R. Association analysis between spatiotemporal variation of vegetation greenness and precipitation/temperature in the Yangtze River Basin (China). Environ. Sci. Pollut. Res. 2018, 25, 21867–21878. [Google Scholar] [CrossRef]
  27. Kosanic, A.; Harrison, S.; Anderson, K.; Kavcic, I. Present and historical climate variability in South West England. Clim. Chang. 2014, 124, 221–237. [Google Scholar] [CrossRef]
  28. Fu, G.; Yu, J.; Yu, X.; Ouyang, R.; Zhang, Y.; Wang, P.; Liu, W.; Min, L. Temporal variation of extreme rainfall events in China, 1961–2009. J. Hydrol. 2013, 487, 48–59. [Google Scholar] [CrossRef]
  29. Sun, B.; Li, Z.; Gao, Z.; Guo, Z.; Wang, B.; Hu, X.; Bai, L. Grassland degradation and restoration monitoring and driving forces analysis based on long time-series remote sensing data in Xilin Gol League. Acta Ecol. Sin. 2017, 37, 219–228. [Google Scholar] [CrossRef]
  30. Huang, C.; Yang, Q.; Guo, Y.; Zhang, Y.; Guo, L. The pattern, change and driven factors of vegetation cover in the Qin Mountains region. Sci. Rep. 2020, 10, 20591. [Google Scholar] [CrossRef]
  31. Chandole, V.; Joshi, G.S.; Rana, S.C. Spatio-temporal trend detection of hydro -meteorological parameters for climate change assessment in Lower Tapi river basin of Gujarat state, India. J. Atmos. Sol.-Terr. Phy. 2019, 195, 105130. [Google Scholar] [CrossRef]
  32. Hamed, K.H.; Ramachandra Rao, A. A modified Mann-Kendall trend test for autocorrelated data. J. Hydrol. 1998, 204, 182–196. [Google Scholar] [CrossRef]
  33. Liu, Y.; Chen, Q.; Ge, Q.; Dai, J.; Qin, Y.; Dai, L.; Zou, X.; Chen, J. Modelling the impacts of climate change and crop management on phenological trends of spring and winter wheat in China. Agr. Forest Meteorol. 2018, 248, 518–526. [Google Scholar] [CrossRef]
  34. Li, W.H. An Overview of Ecological Research Conducted on the Qinghai-Tibetan Plateau. J. Resour. Ecol. 2017, 8, 1–4. [Google Scholar]
  35. Piao, S.L.; Zhang, X.Z.; Wang, T.; Liang, E.Y.; Wang, S.P.; Zhu, J.T.; Niu, B. Responses and feedback of the Tibetan Plateau’s alpine ecosystem to climate change. Chin. Sci. Bull. 2019, 64, 2842–2855. (In Chinese) [Google Scholar] [CrossRef]
  36. Duan, H.; Xue, X.; Wang, T.; Kang, W.; Liao, J.; Liu, S. Spatial and Temporal Differences in Alpine Meadow, Alpine Steppe and All Vegetation of the Qinghai-Tibetan Plateau and Their Responses to Climate Change. Remote Sens. 2021, 13, 669. [Google Scholar] [CrossRef]
  37. Chen, A.; Huang, L.; Liu, Q.; Piao, S. Optimal temperature of vegetation productivity and its linkage with climate and elevation on the Tibetan Plateau. Glob. Chang. Biol. 2021, 27, 1942–1951. [Google Scholar] [CrossRef]
  38. Wu, K.; Chen, J.; Yang, H.; Yang, Y.; Hu, Z. Spatiotemporal Variations in the Sensitivity of Vegetation Growth to Typical Climate Factors on the Qinghai–Tibet Plateau. Remote Sens. 2023, 15, 2355. [Google Scholar] [CrossRef]
  39. Li, F.; Lu, H.; Wang, G.; Yao, Z.; Li, Q.; Qiu, J. Zoning of precipitation regimes on the Qinghai–Tibet Plateau and its surrounding areas responded by the vegetation distribution. Sci. Total Environ. 2022, 838, 155844. [Google Scholar] [CrossRef]
  40. Zeng, N.; Ren, X.; He, H.; Zhang, L.; Niu, Z. Precipitation Conditions Constrain the Sensitivity of Aboveground Net Primary Productivity in Tibetan Plateau Grasslands to Climate Change. Remote Sens. 2023, 15, 2591. [Google Scholar] [CrossRef]
  41. Prevéy, J.; Vellend, M.; Rüger, N.; Hollister, R.D.; Rixen, C. Greater temperature sensitivity of plant phenology at colder sites: Implications for convergence across northern latitudes. Glob. Chang. Biol. 2017, 23, 2660–2671. [Google Scholar] [CrossRef] [Green Version]
  42. Rustad, L.; Campbell, J.; Marion, G.; Norby, R.; Mitchell, M.; Hartley, A.; Cornelissen, J.; Gurevitch, J. A meta-analysis of the response of soil respiration, net nitrogen mineralization, and aboveground plant growth to experimental ecosystem warming. Oecologia 2001, 126, 543–562. [Google Scholar] [CrossRef]
  43. Orain, R.; Russo Ermolli, E.; Lebreton, V.; Di Donato, V.; Bahain, J.J.; Sémah, A.M. Vegetation sensitivity to local environmental factors and global climate changes during the Middle Pleistocene in southern Italy—A case study from the Molise Apennines. Rev. Palaeobot. Palyno. 2015, 220, 69–77. [Google Scholar] [CrossRef]
  44. Ning, T.; Liu, W.; Lin, W.; Song, X. NDVI Variation and Its Responses to Climate Change on the Northern Loess Plateau of China from 1998 to 2012. Adv. Meteorol. 2015, 2015, 725427. [Google Scholar] [CrossRef] [Green Version]
  45. Bao, Z.; Zhang, J.; Wang, G.; Guan, T.; Jin, J.; Liu, Y.; Li, M.; Ma, T. The sensitivity of vegetation cover to climate change in multiple climatic zones using machine learning algorithms. Ecol. Indic. 2021, 124, 107443. [Google Scholar] [CrossRef]
  46. Maurer, G.E.; Hallmark, A.J.; Brown, R.F.; Sala, O.E.; Collins, S.L. Sensitivity of primary production to precipitation across the United States. Ecol. Lett. 2020, 23, 527–536. [Google Scholar] [CrossRef]
  47. Quetin, G.R.; Swann, A.L.S. Empirically Derived Sensitivity of Vegetation to Climate across Global Gradients of Temperature and Precipitation. J. Clim. 2017, 30, 5835–5849. [Google Scholar] [CrossRef] [Green Version]
  48. Liu, D.; Zhang, C.; Ogaya, R.; Fernandez-Martinez, M.; Pugh, T.; Penuelas, J. Increasing climatic sensitivity of global grassland vegetation biomass and species diversity correlates with water availability. New Phytol. 2021, 230, 1761–1771. [Google Scholar] [CrossRef]
  49. Running, S.W.; Nemani, R.R.; Heinsch, F.A.; Zhao, M.; Reeves, M.; Hashimoto, H. A Continuous Satellite-Derived Measure of Global Terrestrial Primary Production. Bioscience 2004, 54, 547–560. [Google Scholar] [CrossRef] [Green Version]
  50. Roca, A.L.; Kahila Bar-Gal, G.; Eizirik, E.; Helgen, K.M.; Maria, R.; Springer, M.S.; O’Brien, J.S.; Murphy, W.J. Mesozoic origin for West Indian insectivores. Nature 2004, 429, 649–651. [Google Scholar] [CrossRef]
  51. Zheng, Y.; Han, J.; Huang, Y.; Fassnacht, S.R.; Xie, S.; Lv, E.; Chen, M. Vegetation response to climate conditions based on NDVI simulations using stepwise cluster analysis for the Three-River Headwaters region of China. Ecol. Indic. 2018, 92, 18–29. [Google Scholar] [CrossRef]
  52. Liu, W.; Allison, S.D.; Ping, L.; Jing, W.; Chen, D.; Wang, Z.; Yang, S.; Diao, L.; Wang, B.; Liu, L. The effects of increased snow depth on plant and microbial biomass and community composition along a precipitation gradient in temperate steppes. Soil Biol. Biochem. 2018, 124, 134–141. [Google Scholar] [CrossRef] [Green Version]
  53. Yan, G.; Mu, C.; Xing, Y.; Wang, Q. Responses and mechanisms of soil greenhouse gas fluxes to changes in precipitation intensity and duration: A meta-analysis for a global perspective. Can. J. Soil Sci. 2018, 98, 591–603. [Google Scholar] [CrossRef]
  54. Fabricante, I.; Oesterheld, M.; Paruelo, J.M. Annual and seasonal variation of NDVI explained by current and previous precipitation across Northern Patagonia. J. Arid Environ. 2009, 73, 745–753. [Google Scholar] [CrossRef]
  55. Wang, J.; Wang, K.; Zhang, M.; Zhang, C. Impacts of climate change and human activities on vegetation cover in hilly southern China. Ecol. Eng. 2015, 81, 451–461. [Google Scholar] [CrossRef]
  56. Gao, Q.; Guo, Y.; Xu, H.; Ganjurjav, H.; Li, Y.; Wan, Y.; Qin, X.; Ma, X.; Liu, S. Climate change and its impacts on vegetation distribution and net primary productivity of the alpine ecosystem in the Qinghai-Tibetan Plateau. Sci. Total Environ. 2016, 554–555, 34–41. [Google Scholar] [CrossRef] [PubMed]
  57. Verrall, B.; Pickering, C.M. Alpine vegetation in the context of climate change: A global review of past research and future directions. Sci. Total Environ. 2020, 748, 141344. [Google Scholar] [CrossRef]
  58. Wang, S.; Liu, F.; Zhou, Q.; Chen, Q.; Liu, F. Simulation and estimation of future ecological risk on the Qinghai-Tibet Plateau. Sci. Rep. 2021, 11, 17603. [Google Scholar] [CrossRef]
  59. Xu, W.; Zhu, M.; Zhang, Z.; Ma, Z.; Liu, H.; Chen, L.; Cao, G.; Zhao, X.; Schmid, B.; He, J. Experimentally simulating warmer and wetter climate additively improves rangeland quality on the Tibetan Plateau. J. Appl. Ecol. 2018, 55, 1486–1497. [Google Scholar] [CrossRef] [Green Version]
  60. Fan, Z.; Bai, X. Scenarios of potential vegetation distribution in the different gradient zones of Qinghai-Tibet Plateau under future climate change. Sci. Total Environ. 2021, 796, 148918. [Google Scholar] [CrossRef]
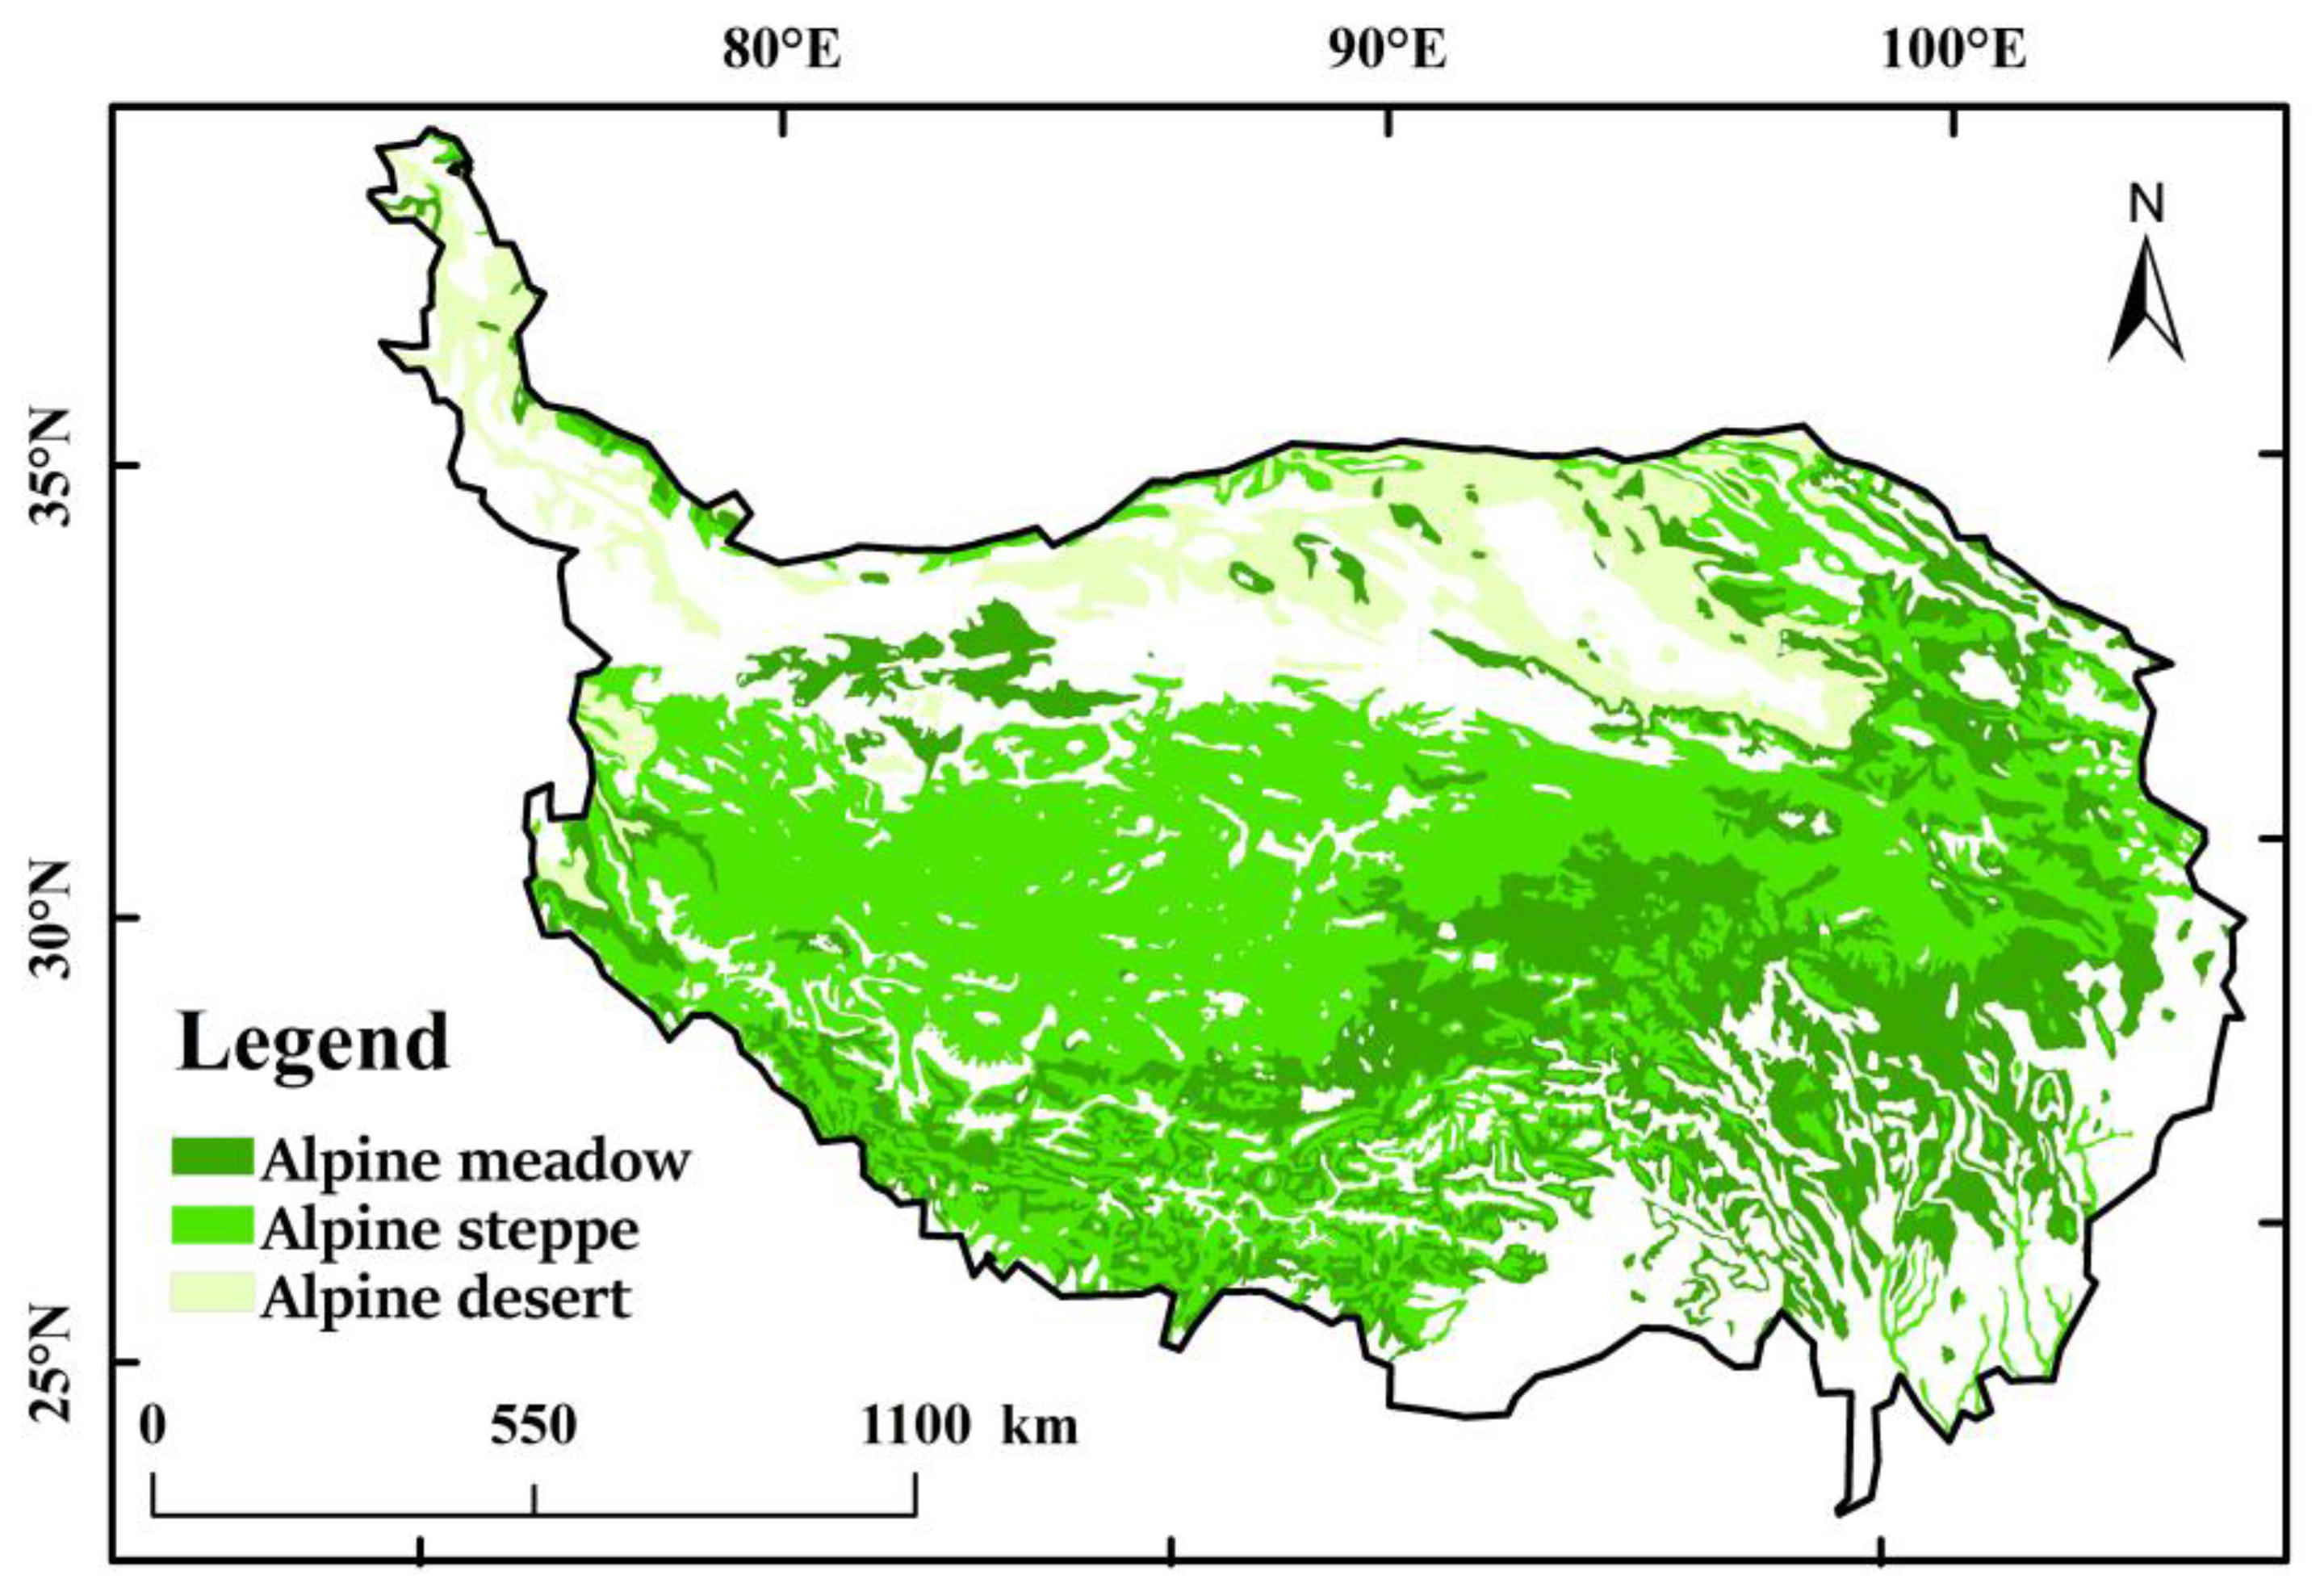
Figure 1. Qinghai-Tibet Plateau Grassland Classification.
Remotesensing 15 03187 g001
Figure 2. Spatial distribution of (a) mean FVC and (b) FVC trends in grasslands during 2000–2018.
Remotesensing 15 03187 g002
Figure 3. Interannual FVC variation in different grassland types during 2000–2018.TP: total grassland of the QTP; AM, alpine meadow; AS, alpine steppe; AD, alpine desert.
Remotesensing 15 03187 g003
Figure 4. Proportions of areas displaying differing degrees of sensitivity for grassland FVC as related to mean annual temperature (a,b), mean annual Srad (c,d), annual precipitation (e,f) and mean annual PDSI (g,h). Insets in the upper right corners of the graphs represent the spatial distribution of significant sensitivity as follows; red, positive and blue, negative. TP: total grasslands of the QTP; AM, alpine meadow; AS, alpine steppe; AD, alpine desert; SN, significant negative; NSN, not significant negative; NSP, not significant positive and SP, significant positive.
Remotesensing 15 03187 g004
Figure 5. Distribution of sensitivity of grasslands to temperature (ad), solar radiation (eh), precipitation (il) and drought level (mp) with gradients of temperature, Srad, precipitation and PDSI. (NS, not significant, TP: total grassland of the QTP (in green); AM, alpine meadow (in red); AS, alpine steppe (in blue); AD, alpine desert (in yellow)).
Remotesensing 15 03187 g005
Disclaimer/Publisher’s Note: The statements, opinions and data contained in all publications are solely those of the individual author(s) and contributor(s) and not of MDPI and/or the editor(s). MDPI and/or the editor(s) disclaim responsibility for any injury to people or property resulting from any ideas, methods, instructions or products referred to in the content.