Article

Remote Sensing Analysis of the Surface Urban Heat Island Effect in Vitoria-Gasteiz, 1985 to 2021

by
Cristina Laurenti Errea
1,
Cátia Rodrigues de Almeida
1,2,3,
Artur Gonçalves
3,4,* and
Ana Cláudia Teodoro
1,2
1
Department of Geosciences, Environment and Land Planning, Faculty of Sciences, University of Porto, 4169-007 Porto, Portugal
2
Earth Sciences Institute (ICT), Pole of the FCUP, University of Porto, 4169-007 Porto, Portugal
3
Centro de Investigação de Montanha (CIMO), Instituto Politécnico de Bragança (IPB), Campus de Santa Apolónia, 5300-253 Bragança, Portugal
4
Laboratório Associado para a Sustentabilidade e Tecnologia em Regiões de Montanha (SusTEC), Instituto Politécnico de Bragança, Campus de Santa Apolónia, 5300-253 Bragança, Portugal
*
Author to whom correspondence should be addressed.
Remote Sens. 2023, 15(12), 3110; https://doi.org/10.3390/rs15123110
Submission received: 1 June 2023 / Accepted: 7 June 2023 / Published: 14 June 2023
(This article belongs to the Special Issue Remote Sensing Based Urban Development and Climate Change Research)

Abstract

:
Vitoria-Gasteiz has taken several urban greening actions such as the introduction of a ring of parks that connect the city’s surroundings, a sustainable mobility plan, and urban green structure strategies. Previous studies establish a connection to the importance of greening to mitigate the surface urban heat island (SUHI) and evaluate the effectiveness of these measures on urban climate. In this study, land surface temperature (LST), a remote sensing (RS) parameter, recorded by Landsat satellites (5, 7, and 8) was used to evaluate the effect of SUHI in Vitoria-Gasteiz between 1985–2021. The aim was to evaluate whether the urban greening actions influenced the local thermal conditions and, consequently, helped minimize the SUHI. Thirty sampling locations were identified, corresponding to different local climate zones (LCZ), at which LST data were extracted. A total of 218 images were processed and separated into summer and winter. Four of the 30 locations had, since 2003, on-site meteorological stations with regular air temperature (Tair) measurements which were used to validate the LST data. The results showed that Spearman’s correlation between Tair and LST was higher than 0.88 in all locations. An amount of 21 points maintained the same LCZ classification throughout the analysed period and nine underwent a LCZ transformation. The highest average temperature was identified in the city centre (urbanized area), and the lowest average was in a forest on the outskirts of the city. SUHI was more intense during the summer. A significant increase in SUHI intensity was identified in areas transformed from natural to urban LCZs. However, SUHI during satellite data acquisition periods has shown a minimal change in areas where sustainable practices have been implemented. RS was valuable for analysing the thermal behaviour of the LCZs, despite the limitation inherent in the satellite’s time of passage, in which the SUHI effect is not as evident.

Graphical Abstract

1. Introduction

The growth of human settlements has an impact on the local climate, generating an increase in urban temperature. It is one of the most relevant human-driven climatological effects and one of the most studied and documented due to its impact on human comfort and quality of life [1]. Howard (1833) introduced the urban heat island (UHI) concept as a local climate effect consequence of urbanization [2]. This effect refers to the persistence of higher temperatures in urban areas when compared to surrounding rural areas. The UHI effect is stronger during summer nights when there is a greater difference in temperature between the city and the periphery [3] and it has also been shown that the UHI effect is intensified in the presence of heat waves, as cities tend to present aggravated effects when compared with rural areas [4,5].
When addressing the impact of cities on environmental thermal behaviour, it is important to consider characteristics, such as (i) surface structures: their geometry, the properties of building materials or the density of buildings, factors that can modify the airflow, heat transport and surfaces’ radiation balances [6,7]. (ii) Natural cover: vegetation absorbs solar radiation and converts it into chemical energy through the process of photosynthesis. This stored energy is then used to fuel the plant’s growth and metabolism, and it is not stored as heat. In contrast, paved surfaces absorb and store heat from the sun, leading to increased temperatures in urban areas. Additionally, vegetation contributes to the cooling of the surrounding environment through the process of evapotranspiration, where water is released from the leaves and into the atmosphere [8,9]. Finally, (iii) human activity: increased heat from everyday activities such as transport use, industrial metabolism or waste energy, also contribute to heat input into the environment [10,11].
The UHI effect, when combined with the rise in temperatures, causes a series of consequences on citizens’ quality of life, such as: (i) compromised human health and comfort: with higher air-pollution levels, higher daytime temperatures and less capacity for night-time cooling in the cities [12]; and (ii) increased energy consumption: urban overheating demands for more energy consumption for cooling purposes [13].
To quantify the UHI effect, data on temperature from rural and urban areas were gathered. To assess the urban heat island effect, various sources can be used including in situ automatic meteorological stations that measure air temperature (Tair) and satellite sensors that measure land surface temperature (LST). This approach has become increasingly popular since the turn of the century [14]. One of the great advantages of remote sensing (RS) data is the fact that it can provide information from the surface, extracted from each pixel of a satellite image [15].
As LST values can be used to estimate UHIs, the result is an indirect estimate of this phenomenon, known as surface urban heat island (SUHI) [16]. LST measurement is not the same physical variable as Tair obtained from meteorological in situ stations, but it is an indication of the surface heating, which then affects the air temperature at the lower atmosphere [17]. Although the correlation between LST and air temperature may also be influenced by factors such as vegetation cover, soil moisture, and urbanization, there is an expected relation between the thermal behaviour of surfaces and the air above it, furthermore, data from both sources were found to be highly correlated [18,19,20].
Rao [21] carried out the first SUHI study using RS measurements in 1972. Since then, a variety of sensor-platform combinations (satellite, aircraft, ground-based) have been used in SUHI studies [22,23]. To facilitate access to and the processing of satellite data, the Google Earth Engine (GEE) was created. It is a cloud-based platform that provides access to a large geospatial dataset from a variety of satellite and Earth-observing RS imagery [24]. This multi-petabyte curated collection includes the entire Landsat archive.
Since 1972, eight Landsat missions have been launched uninterruptedly [25] and, from Landsat 4 onwards, all satellites include at least a thermal band that allowed them to estimate LST data at a high spatial resolution, which made it particularly appropriate for local and small-scale studies [26,27].
The classical approach to quantify SUHI using RS data starts with the differentiation of the study area into urban and rural areas, to then extract LST values from pixels in both categories [15]. This is a widely used method to assess temperature differences between urbanized and vegetated/rural areas. However, when the study focuses on analysing the influence of environmental characteristics on SUHI, the differentiation between “urban” and “rural” cannot sufficiently describe the microscale effects. To improve and standardise such approaches in urban climate studies, in 2012 Stewart and Oke [11] developed a local climate zone (LCZ) classification. These LCZs are universal urban landscape typologies based on expected characteristics at the neighbourhood scale, with an approximate impact on the local climate.
Several studies using LCZs employ a single classification map, which can be created with software provided by the World Urban Database and Access Portal Tools (WUDAPT) [28]. This tool allows the identification of areas representing different LCZs in the same study area. This database provides information for all pixels belonging to each LCZ, allowing recurrent analysis of the SUHI [29]. On the other hand, these types of maps are not as useful when there is interest in analysing information at specific locations, with specific characteristics. For these cases, the best approach to study the SUHI is to visually identify and classify LCZs for specific locations. This method is mostly used in multi-annual approaches to analyse the impact of urban transformation over the years [18].
The literature has demonstrated the advantages of green spaces in providing a cooling effect in cities, which reduces the impact of SUHIs [30]. However, the evaluation of the efficiency of urban greening measures requires long-term temperature data that is not always available from in situ measurements. On the other hand, when using RS data, the main limitation is the spatial resolution of the sensor, which must be high enough to obtain urban-scale data [20]. Medium-resolution remotely sensed satellite data such as Landsat, has been used to estimate LST for long-term temperature observations from the early 1980s. For instance, the effectiveness of urban greening strategies to reduce the SUHI effect has been widely demonstrated [31,32,33]. According to the literature, there are two approaches to studying the SUHI effect: (i) based on a single city to focus on temporal dynamics [34], and (ii) comparing multiple cities using the same method [19]. The present study adopts the first approach, applied to the Spanish city of Vitoria-Gasteiz. This city is known worldwide as a green city, given the effort by local institutions in promoting urban sustainable development, ensuring the well-being of its citizens, while promoting the conservation of the natural environment [35]. Although it is argued that the implemented measures should reduce the SUHI effect [36], there are no previous detailed studies of this effect in this city.
Given the relevance of analysing the presence of the SUHI effect in Vitoria-Gasteiz, a reference city in urban greening, this research uses RS data to analyse the environmental characteristics of different LCZs associated with the increase or decrease in the SUHI effect. For this purpose, this study has the following objectives: (i) assess urban and peri-urban areas to evaluate the changes in LCZ classification over the period of 1985–2021; (ii) identify urban and peri-urban LCZ changes over the period of 1985–2021; (iii) determine which LCZs had the SUHI effects and potential reductions; and (iv) evaluate the impact of LCZ transformations on the SUHI intensity. As a hypothesis, the SUHI effect is expected to decrease in areas subject to sustainable urban strategies and to increase in areas that have undergone an urbanization process, to evaluate the impact of urban transformations in this context.

2. Materials and Methods

2.1. Study Area

Vitoria-Gasteiz is the capital city of Basque Country, located in the province of Álava in northern Spain, with a total population of 253,672 inhabitants (2022) [37]. It is located in a central plain, with an average elevation of 539 m above sea mean level (asml) and surrounded by several mountains reaching an altitude of about 1000 m asml, with a maximum elevation of 1167 m asml. The Zadorra River, a tributary of the Ebro River, flows through the outskirts of Vitoria-Gasteiz, and several streams cross the city (Figure 1) [30].
According to the Köppen climate classification, Vitoria’s climate is temperate and humid, corresponding to subtype Cfb [39,40]. Summers are warm and winters are cold, with average temperatures between 17.1 °C and 4.4 °C, respectively, for the period 1991–2021. Given its oceanic climate, Vitoria-Gasteiz weather tends to have frequent cloudy conditions, with an average annual rainfall of 817 mm (1991–2021) recording the highest levels in November and the lowest in June [41].
Since the late 18th century, a large fraction of the rural population settled in the urban area, looking for better services and opportunities [40]. Therefore, Vitoria-Gasteiz experienced quick growth in its urban area, leading to a populational increase of 18% between 1996 and 2022 [37]. During these years, Vitoria-Gasteiz underwent an important industrialization process (automobile and metallurgical industry) and consequently, gravel pits and rubbish dumps start to settle in vast areas on the urban periphery, turning it into degraded areas where the environmental impact threatened the richness of the habitats and their biodiversity [35].
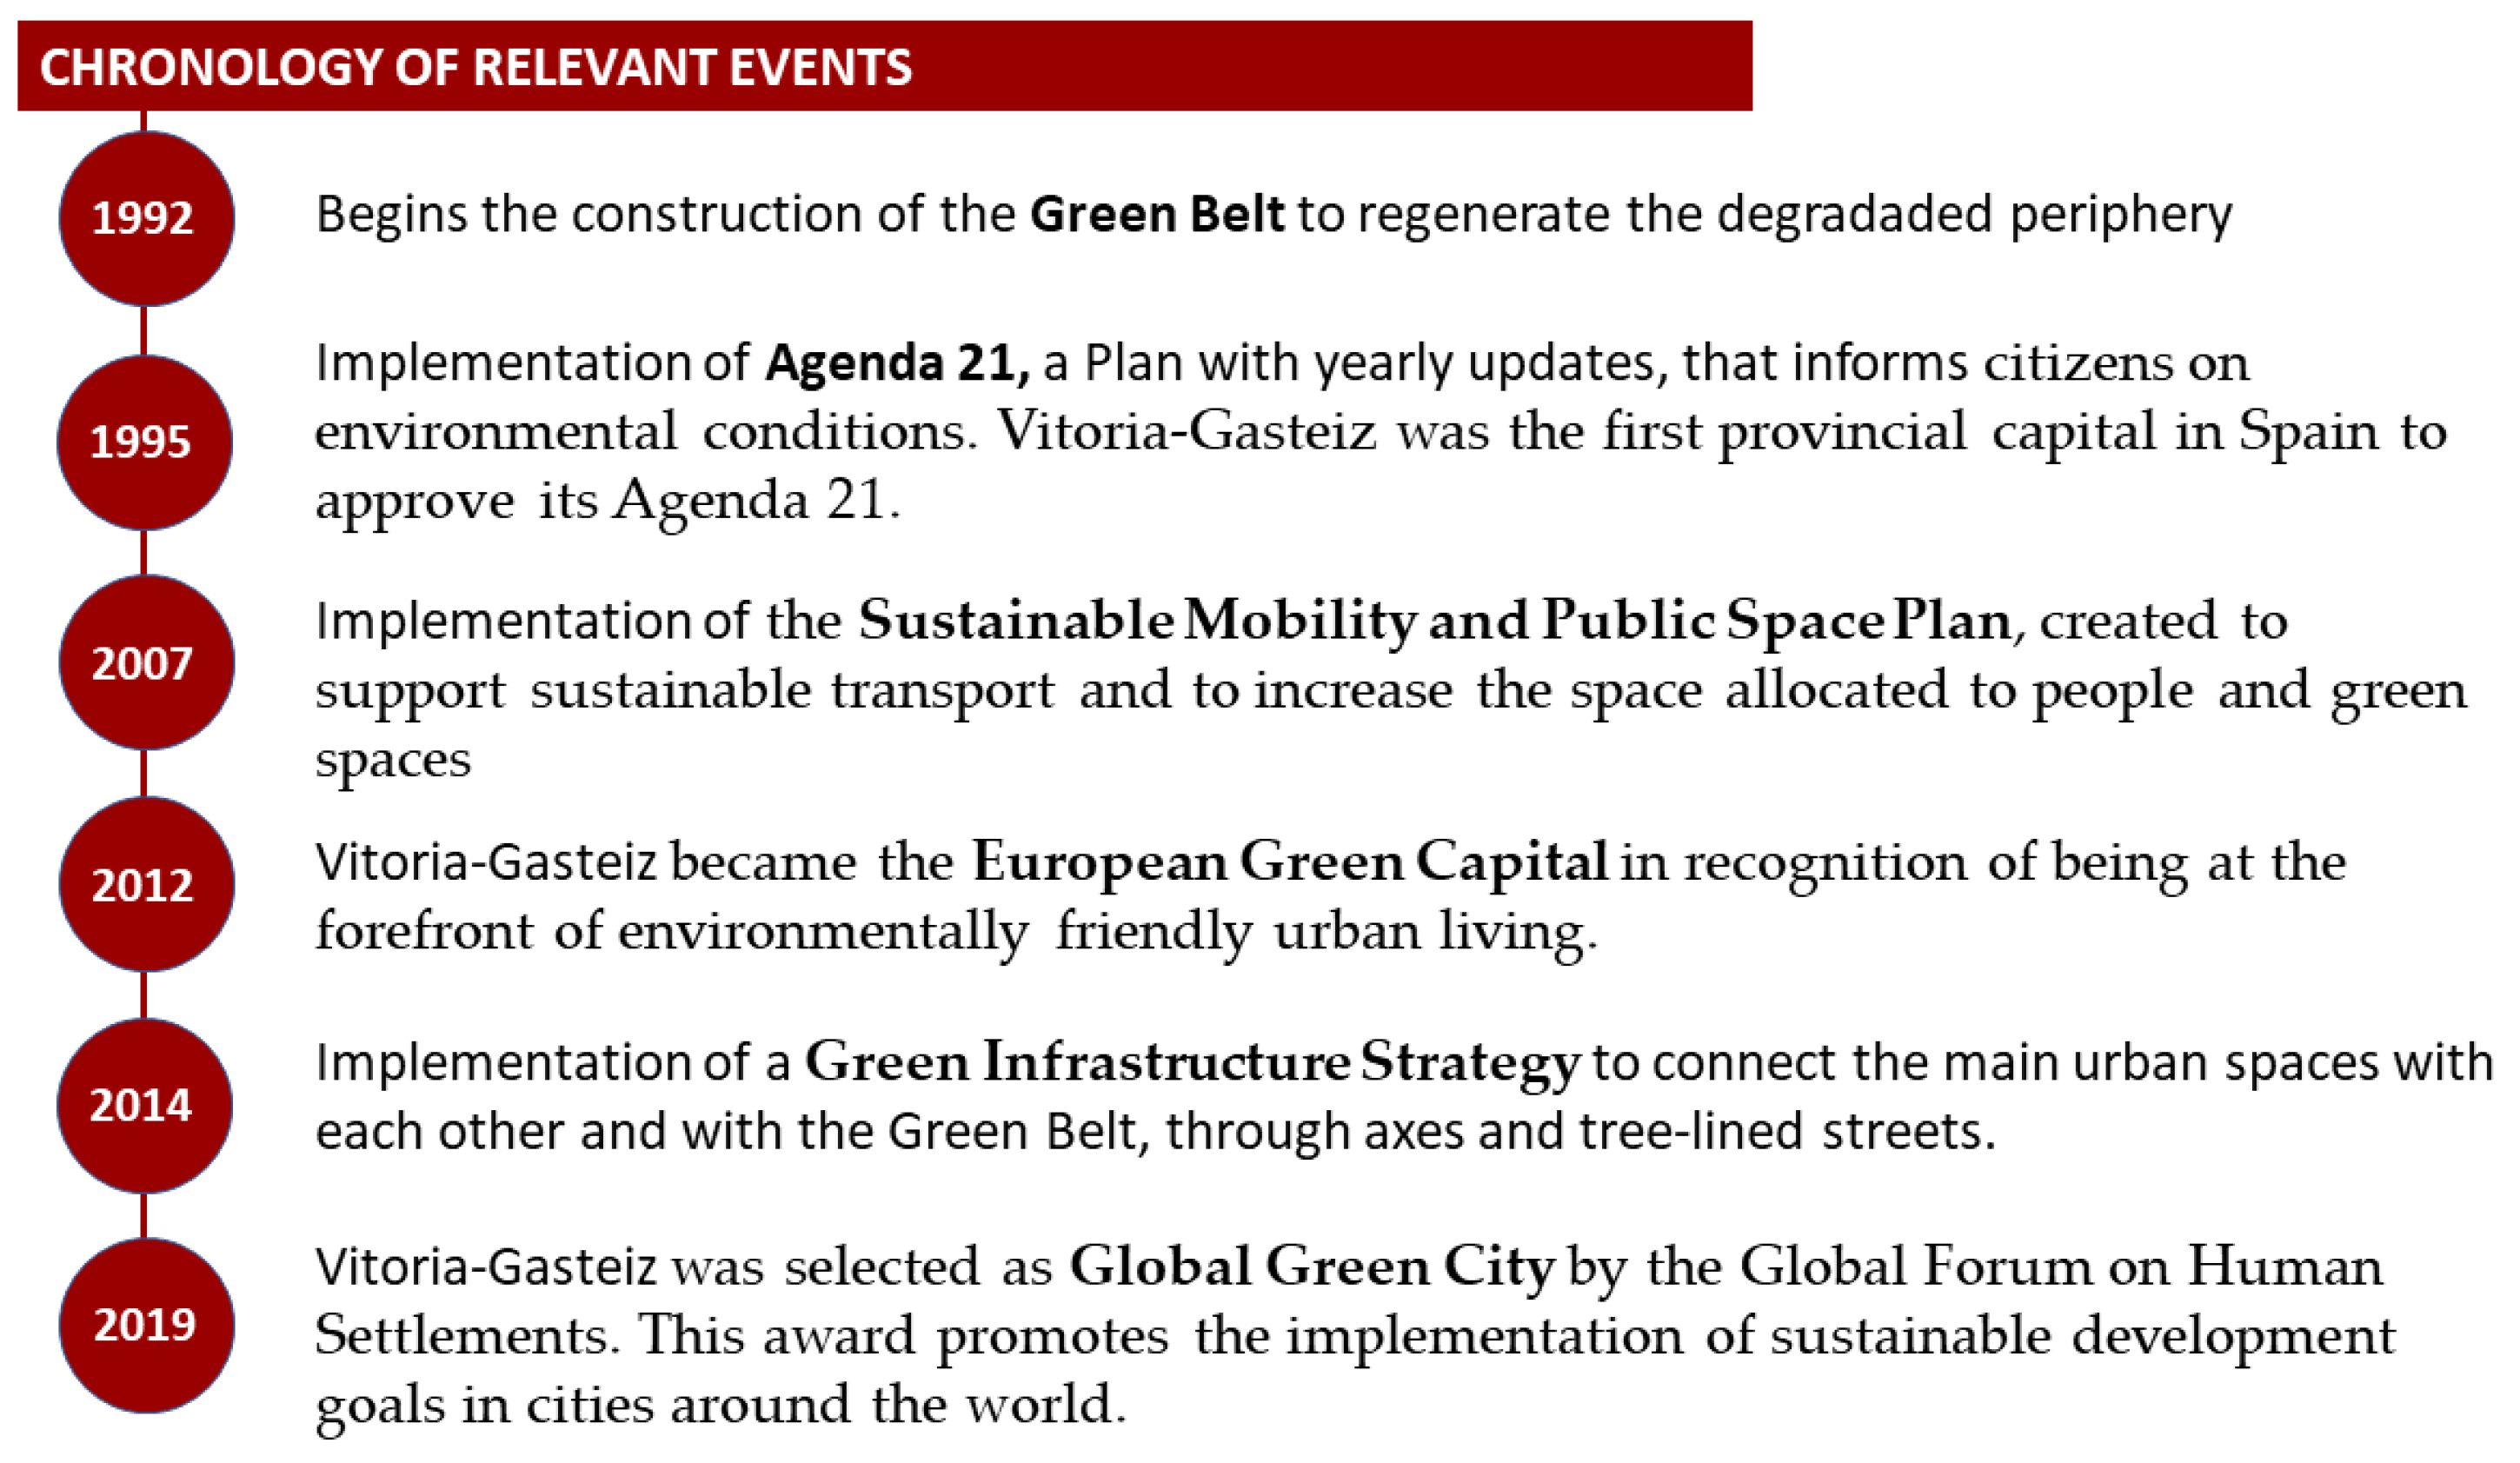
In 1992, to regenerate the degraded periphery of Vitoria-Gasteiz, a local project began to implement a network of green spaces around the city, called the Green Belt of Vitoria-Gasteiz. The aim of this project was to enhance ecological connectivity between peri-urban spaces and the surrounding regional natural areas [42]. Over the years, various ecological and landscape restoration initiatives have been implemented in the outskirts of Vitoria-Gasteiz, ultimately resulting in the development of a Green Belt. Figure 2 shows the parks that currently exist in the Green Belt. The result will be a 79 km corridor around the city. Some of the actions carried out include the recovery of wetlands, the restoration of the Zadorra River, and the development of ecological corridors [43]. Several studies demonstrate the environmental benefits that the Green Belt had on biodiversity, ecology, and ecosystem services in the area [44,45].
The Green Belt has become an icon of the city, but there are more environmental measures carried out in the city over the years. Figure 3 shows the implementation in chronological order of the most relevant interventions and other important moments that have occurred in Vitoria-Gasteiz.
Since the implementation of the green infrastructure strategy in 2014, over 111 interventions have been carried out. These include the planting of 250,000 trees in streets and squares to improve climate comfort and increase CO2 capture, the installation of orchards and urban forests on unused plots, and the creation of lagoons in peri-urban parks to prevent flooding [43]. Vitoria-Gasteiz currently has 445 hectares of urban green areas and 827 hectares of peri-urban green areas in its Green Belt, which places it among the European cities with the largest surface area of urban and peri-urban green spaces [35].

2.2. Identification of LCZ Study Locations

For this study, 30 locations were chosen to represent different LCZs, based on the Stewart and Oke [11] classification. This classification consists of 17 standard LCZs and is divided into “built types” 1–10 and “land cover types” A-G (Table 1).
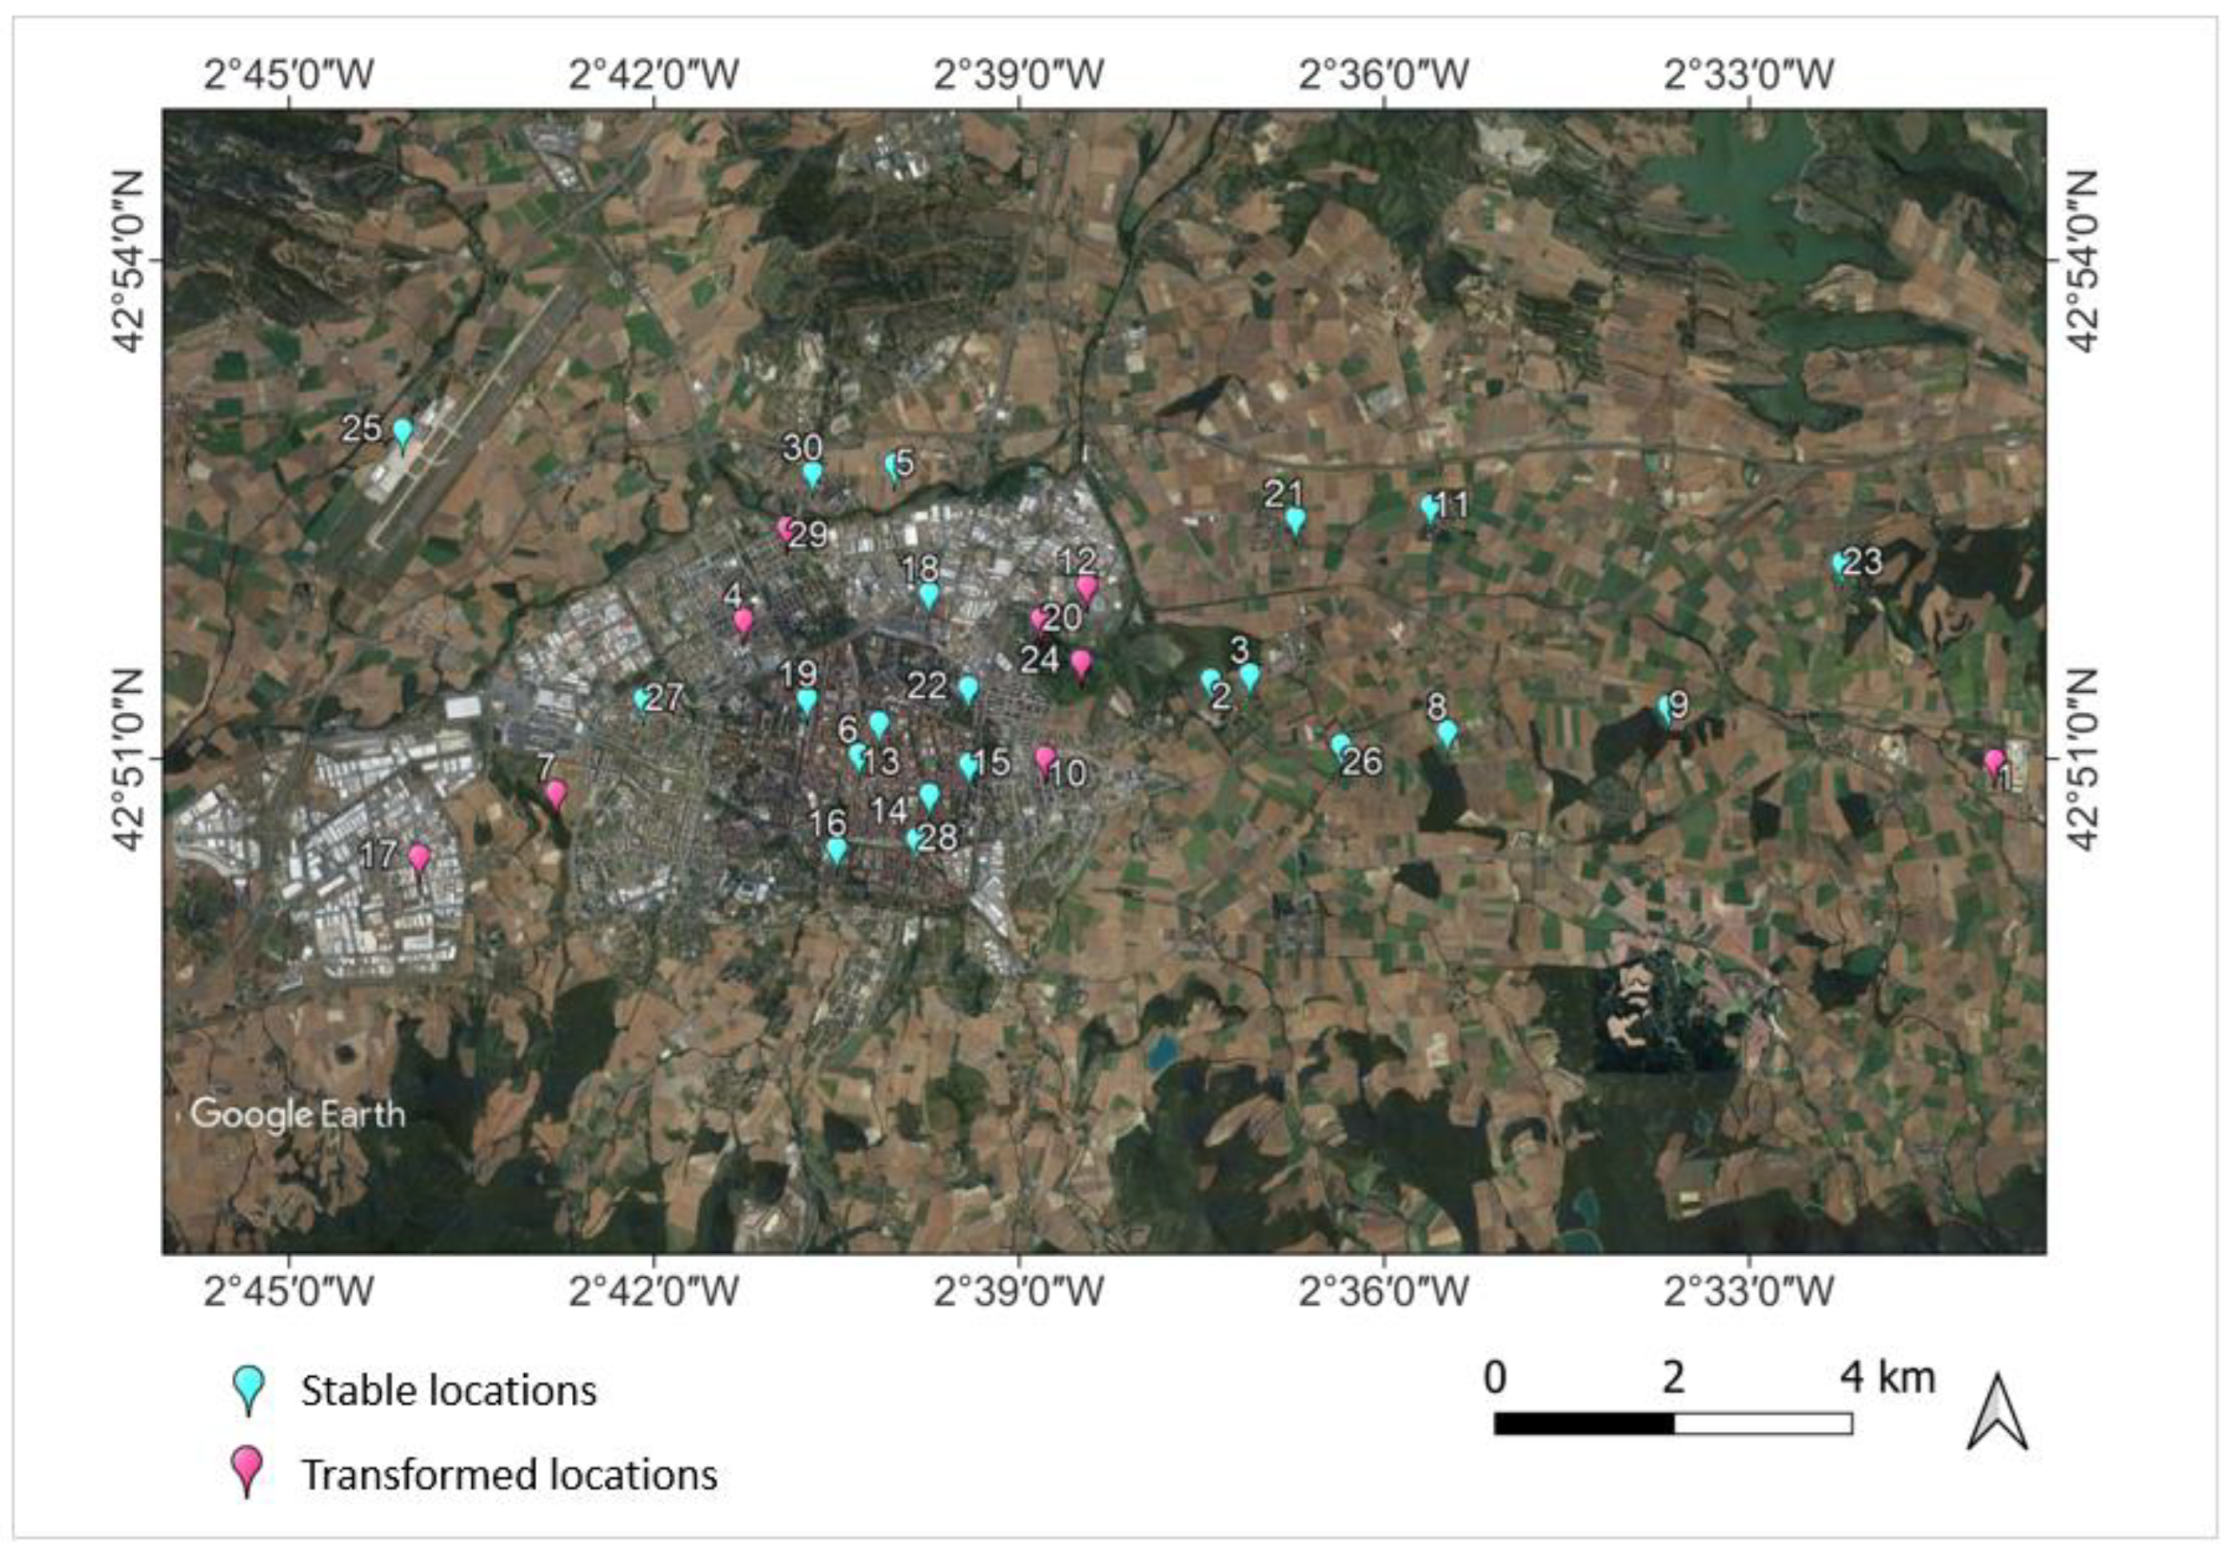
The selection of the study locations was done through a detailed visual analysis of the study area from historical satellite images using Google Earth Pro and aerial images available by the National Geographic Institute (IGN) of Spain [46]. The 30 selected locations are scattered across the study area and include the different land cover and urban development contexts (Figure 4). The LCZ typologies 1, 3, 7, and 10 were not identified in the study area. Of the 30 selected locations, 21 maintained the same LCZ between 1985–2021 and nine underwent some transformation, culminating in the change of LCZ during this period (Table 2).

2.3. Estimation of LST Data from Landsat Thermal Sensors

A GEE open-source code for LST estimation from Landsat series modified from Ermida et al. [26] was used. This code includes time series analysis, so the result is the combination of Landsat 5, 7, and 8 observations over the period of 1985–2021. Ermida et al.’s [26] code was first published in May 2020 and has since been applied in multiple urban climate studies [31,47,48] proving its efficiency in LSTs values collected from Landsat series. Figure 5 illustrates the processing chain for generating Landsat LST values from the code proposed by Ermida et al. [26].
All Landsat data is available on GEE, including top-of-atmosphere (TOA) and surface reflectance (SR) data of each satellite/sensor. For this study, TOA reflectance collections have provided the thermal infrared (TIR) bands and SR datasets have provided the near-infrared (NIR) and red bands. Both collections are combined to obtain LST data.
The code uses two other collections available within GEE: atmospheric data from the National Centers for Environmental Prediction (NCEP) [49] and the National Center for Atmospheric Research (NCAR) [50] and surface emissivity from the Advanced Spaceborne Thermal Emission and Reflection Radiometer Global Emissivity Database (ASTER GED). NCEP/NCAR provide data on total column water vapor (TCWV), required to better account for atmospheric contributions in the TIR observations. ASTER GED dataset provides prescribed values of surface emissivity used to correct the Landsat TIR band [26].
The normalized difference vegetation index (NDVI) is computed to calculate the fraction of vegetation cover (FVC) and ASTER FVC, both used to obtain the surface emissivity for each Landsat TIR band. Values for NDVI were considered in the threshold of 0.2 and 0.86 for completely bare and fully vegetated pixels, respectively. The code applies a cloud mask to TOA reflectance and SR collections using the quality information bands [26]. Additionally, a filter has been applied to discard images with more than 20% of cloud cover, which has reduced the initial 836 images to 218.
As each satellite incorporates different measurement instruments due to its continuous updates, they have different characteristics which must be considered when processing the data (Table 3). The three satellites have a spatial resolution of 30 m (with the exception of TIR bands, which is 100 m) and a temporal resolution of 16 days.
RS studies rely on data that are collected during satellite passages, which capture thermal conditions at discrete times. As a result, UHI effects can be evaluated for specific times of the day. In this study, the image data corresponds to path 201, row 30 of the Worldwide Reference System (WRS) [51], as Landsat satellites pass over Vitoria-Gasteiz between 9:00 a.m. and 11:00 a.m., an interval in which the UHI effect is not expected to be the most intense. Interpreting SUHI during the period between 9:00 a.m. and 11:00 a.m. is complex due to the lower angle of solar radiation incidence on surfaces, which is influenced by existing structures. Additionally, the extensive shadows cast during this time, as compared to the noon period, can further complicate SUHI interpretation [52]. Therefore, results must consider the potential effects of shadows cast by nearby physical elements.
Studies conducted during stable overnight conditions can provide data on the higher values for SUHI, with an expected maximum value just before sunrise. During the night, physical elements play a more stable role in the thermal behaviour of surfaces, as LST is highly influenced by the rate of energy released from surfaces, which is conditioned by the level of openness of the urban landscape. As a result, higher SUHI intensity is expected in more densely urbanized areas [3].

2.4. Validation with In Situ Data

The LST data obtained with GEE has been compared with in situ data from four meteorological stations managed by the Basque meteorology agency, Euskalmet [53]. These stations have been active since 2003 and are equipped with Rotronic sensors that record, among other variables, Tair, every 10 min. Their location corresponds to locations 1, 2, 4, and 5 in the study area (Figure 4). All the meteorological records from these stations can be accessed from the Esukalmet website (https://www.euskalmet.euskadi.eus, accessed on 23 February 2023) [53].
Both meteorological and satellite data were collected from 2003 to 2021; 149 images were obtained from the three Landsat satellites, providing LST values for each sampling location. Firstly, to compare the LST values with the in situ Tair, data for these two parameters were collected for the timeframe of the satellite passage over the study area (which ranged from 9:48 UTC to 10:57 UTC). LST and Tair values were then computed, and the root mean square error (RMSE) was calculated as an estimation of data uncertainty. To assess the normality of the data, a Shapiro–Wilk test was performed, showing that the data series did not present a normal behaviour. Therefore, Spearman’s non-parametric correlation test was applied to assess the association between the two variables.

2.5. SUHI Quantification

To study the SUHI effect, multiple analyses were performed. First, LST was determined for each location on the 218 data collection days and plotted the results on a boxplot graph. This process was repeated for summer (74 images) and winter days (31 images) to compare seasonal differences in the SUHI effect.
Subsequently, the SUHI effect was evaluated for the 21 stable locations, according to common approaches of SUHI indicators [54]. For this purpose, three rural LCZs were selected as a reference [43] for rural areas, namely, LCZD, LCZA, and LCZG (croplands, forest, and water bodies areas, respectively). The SUHI intensity (SUHIint) was calculated as the difference in temperature between urban and rural areas, according to Equation (1):
S U H I i n t = L S T u r b a n L S T r u r a l ( L C Z x )
where L S T r u r a l ( L C Z x ) are LST values of the different LCZD, LCZA, and LCZG locations, and L S T u r b a n are the remaining LST values of locations that are not L S T r u r a l ( L C Z x ) .
In some cases, LCZ typologies may have more than one representative sample location within the study area. For example, in this study, four LCZD locations were present in the measured data. In such cases, the average value was used to calculate SUHIint data.
For each of the three SUHI indicators (LCZD, LCZA, and LCZG), a boxplot graph with the SUHIint for all the LCZurban was created. The result was also computed distinguishing summer and winter seasons. Additionally, to better describe the SUHIint evolution over the time series 1985–2021, a dispersion graphic using LCZD as a SUHI indicator was created.
Finally, the remaining nine locations that changed during the period studied (1985–2021) were analysed considering the changes in LCZ classification. In those cases, just LCZD locations were considered as L S T r u r a l when applying Equation (1), as it is the main LCZ type in the surrounding area. Then, the mean LST is analysed for each location before and after the LCZ transformation.
To analyse the SUHIint evolution in the altered locations, a five-year moving average was applied to the 1987–2021 period to evaluate the potential trends in the dataset. Additionally, for the periods before and after the urban transformation, a regression trend was calculated. For this analysis, only summer data were considered for the period of 1987–2021, since there were no available images for 1985 and 1986 due to the image selection criteria used in this study. In those cases where LCZ transformation took several years, data from the transition years were disregarded. Statistical normality test Shapiro–Wilk was applied, showing normal behaviour in all series of values. Therefore, t-test for parametric data was used to evaluate the differences in LST values before and after the transformation.
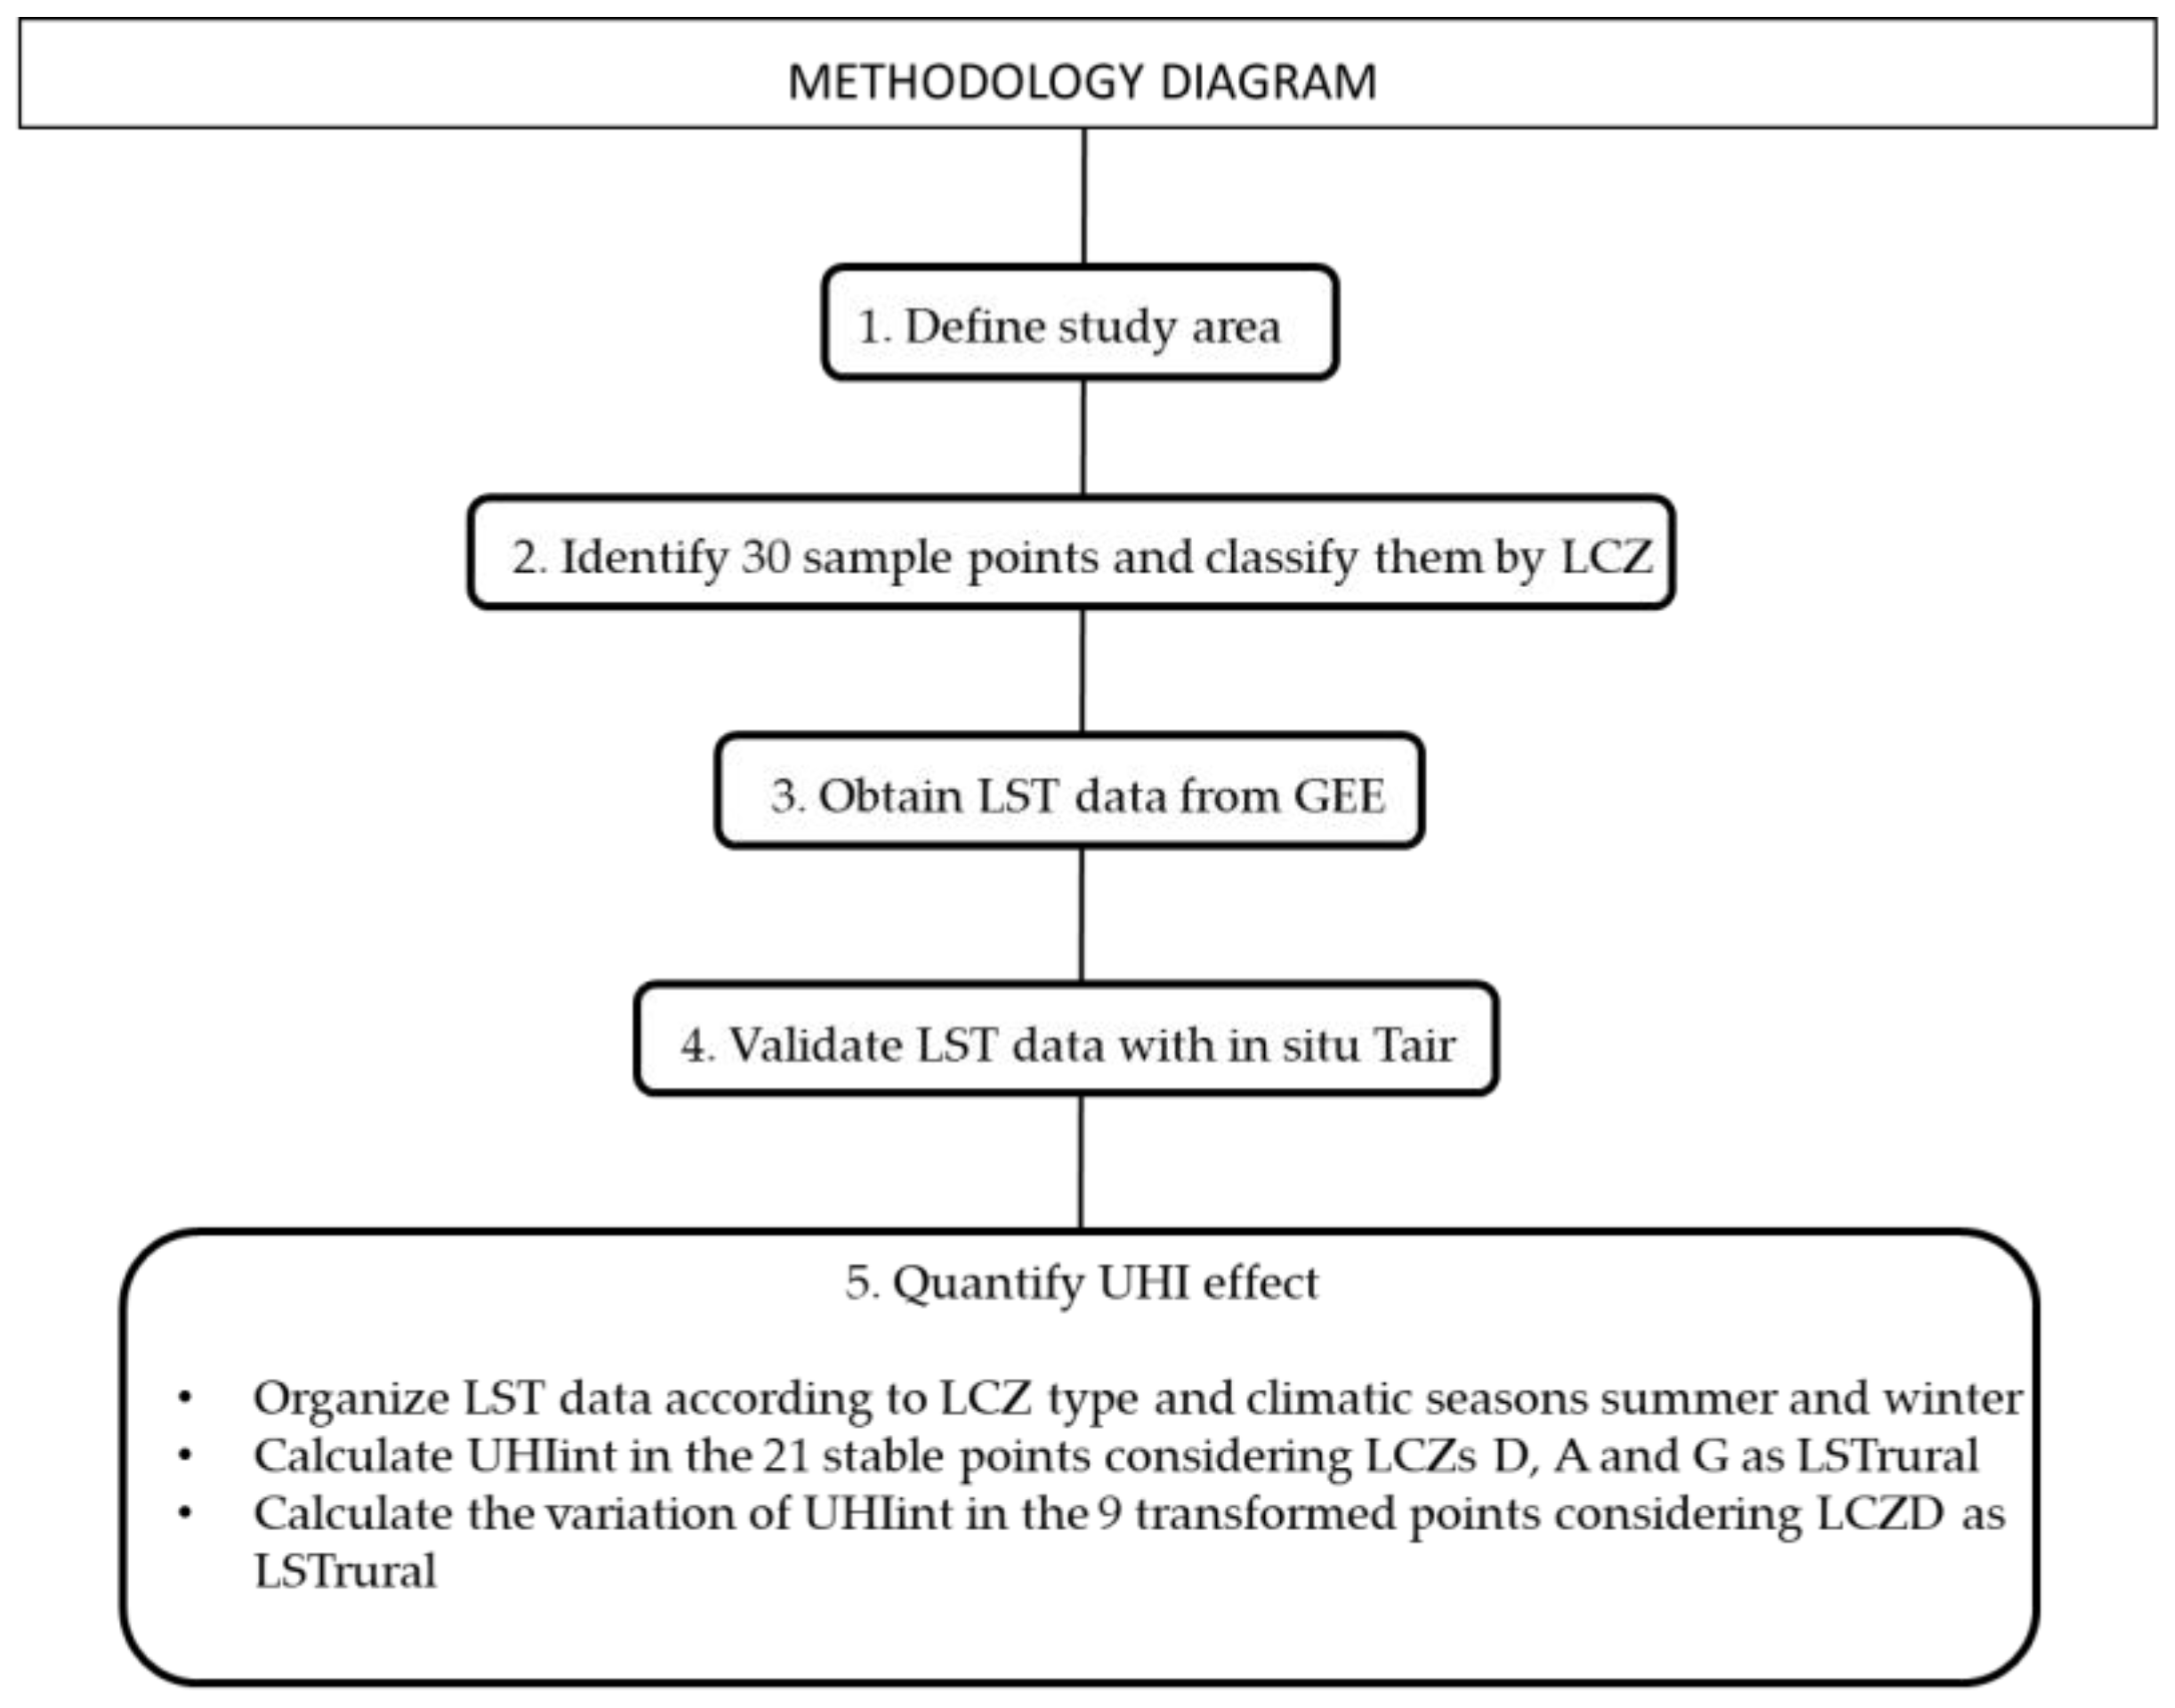
Figure 6 presents a summary of the steps that have been carried out in the methodology of the study.

3. Results

3.1. Validation of LST Data

The results from the comparison between LST and Tair data of the four in situ stations show RMSE higher than 7 °C, whereas the Spearman correlation shows high values, therefore showing similar behaviour in both datasets. Statistical results are shown in Table 4.

3.2. LST for Stable Locations

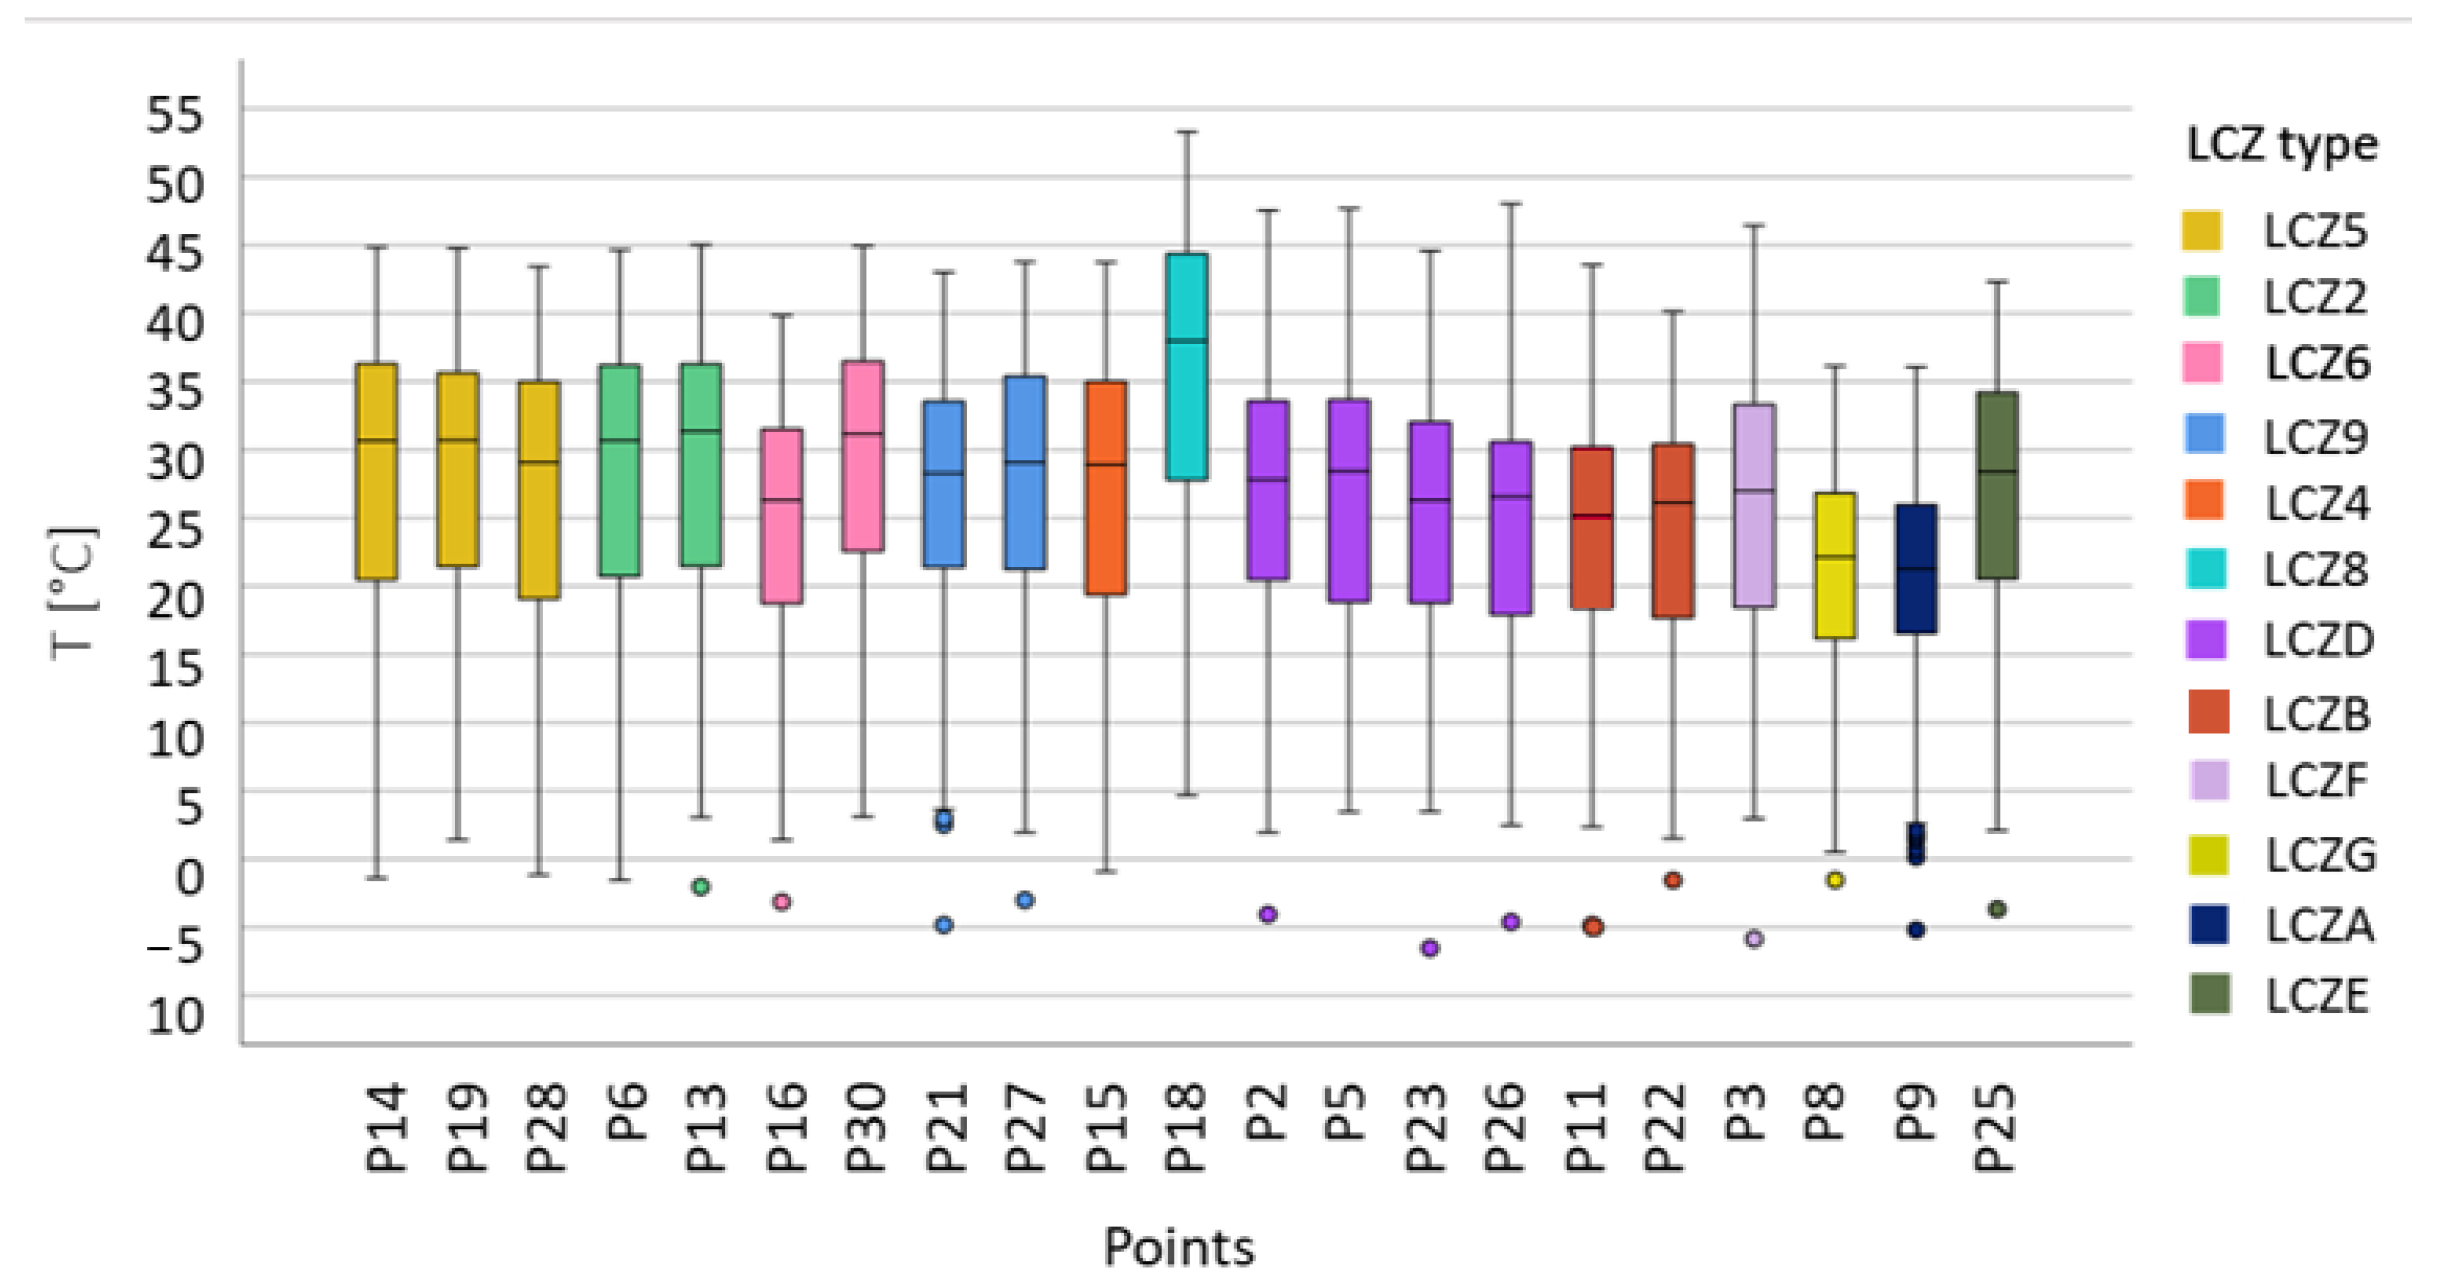
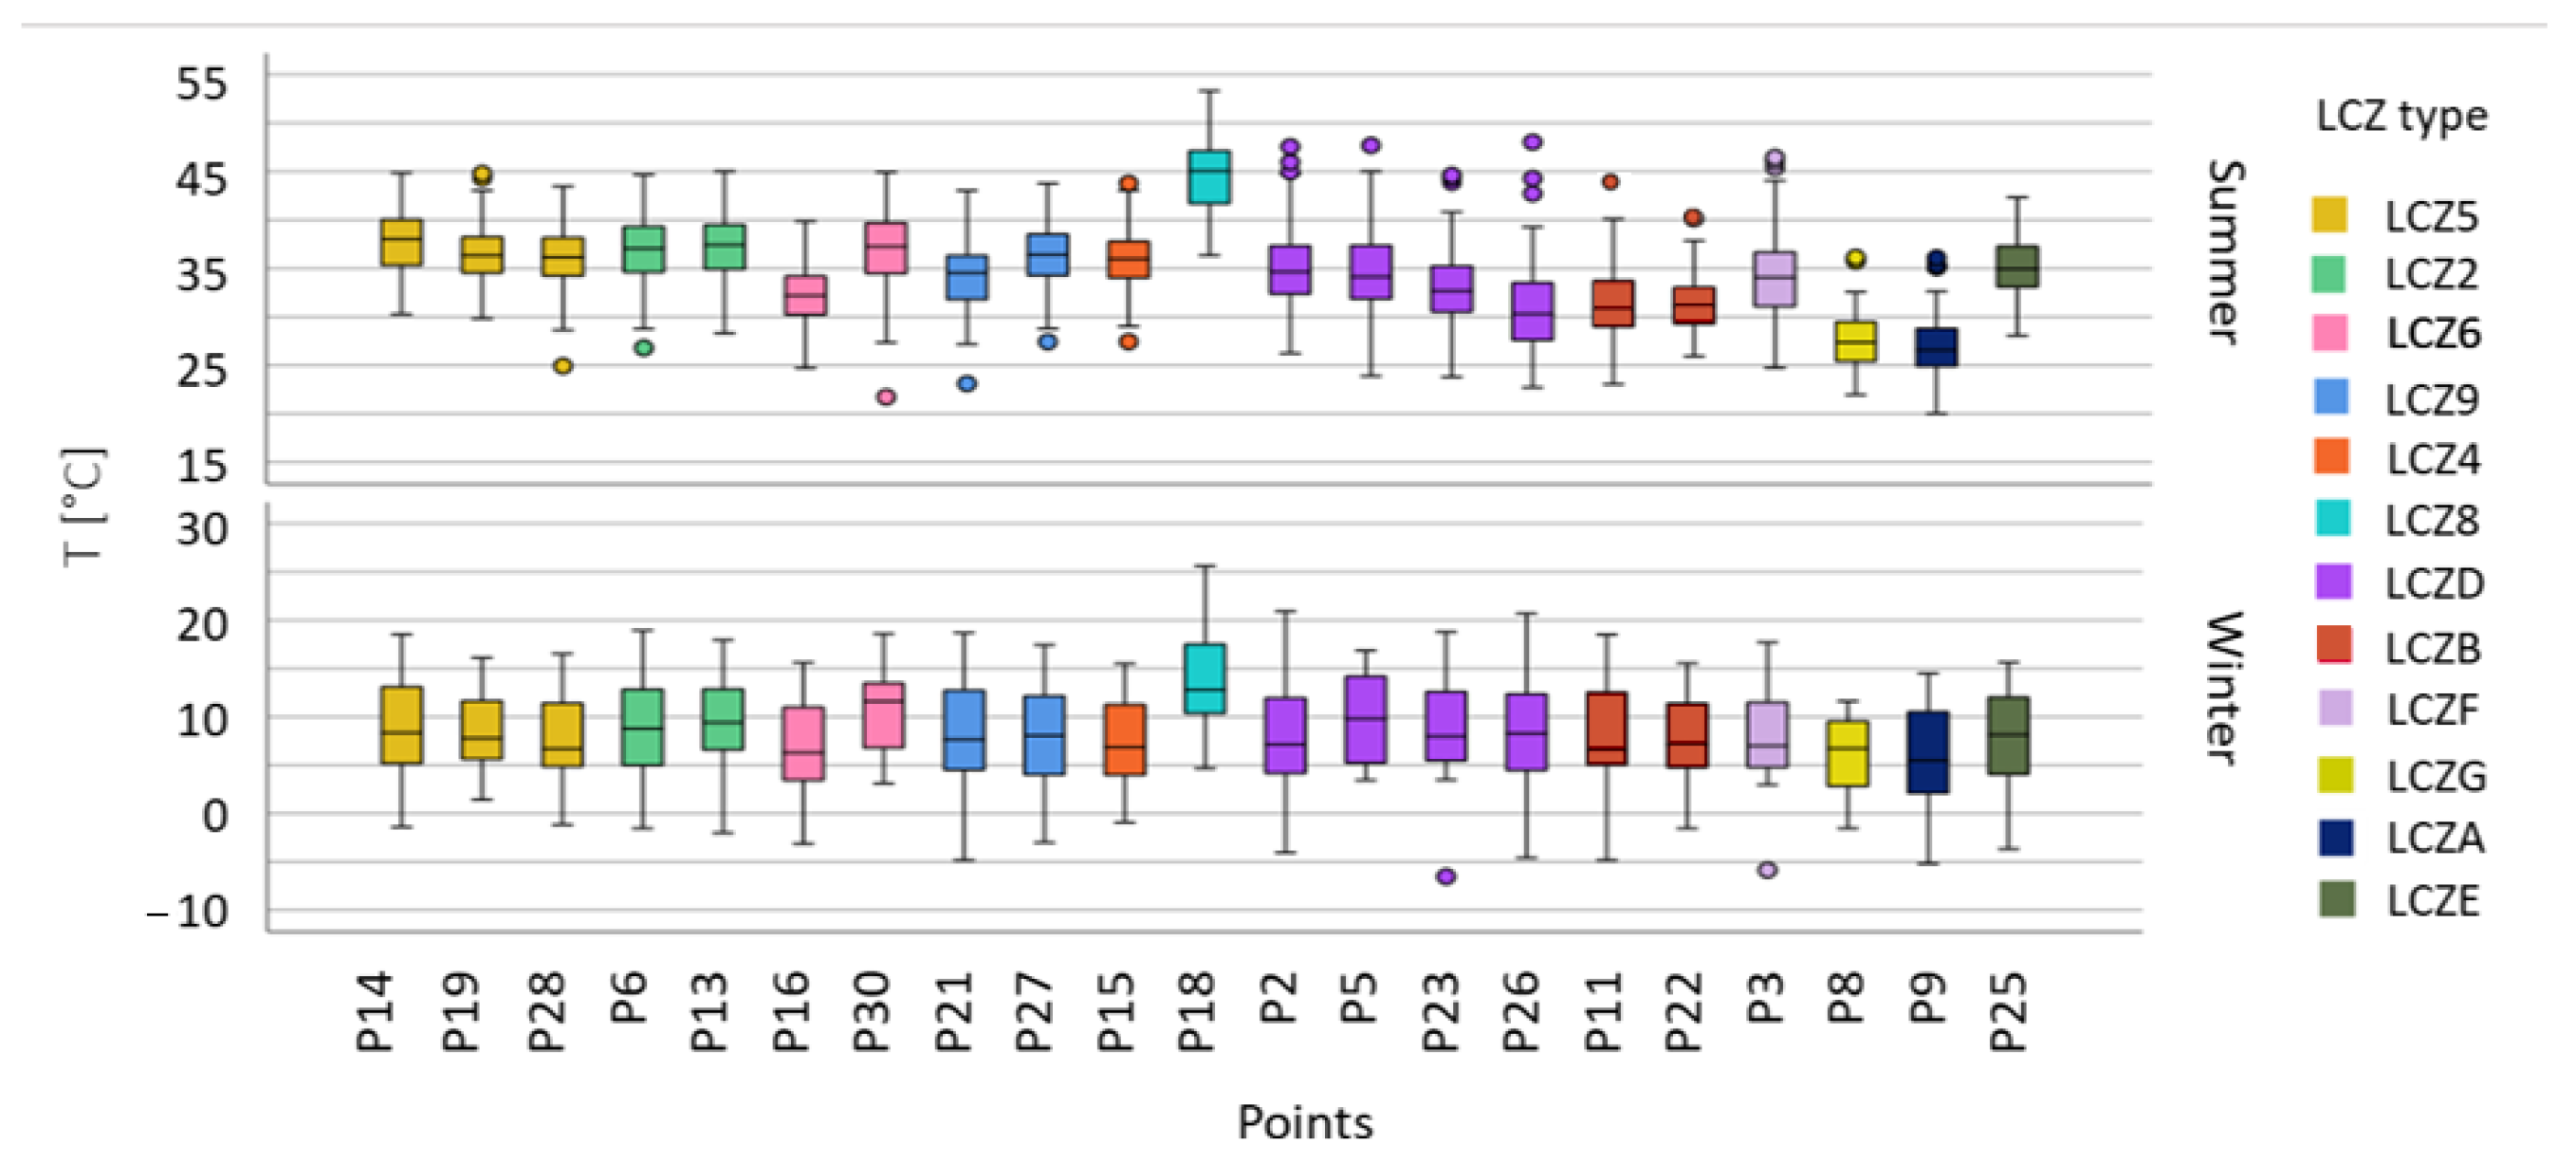
The highest LST median value of all the data series is 37.99 °C in P18, representative of urban LCZ8, and the lowest is 21.27 °C in P9, representative of rural LCZA. Figure 7 shows that rural locations (LCZ types D, B, F, G, and A) have lower LST median values than urban locations, having significant differences between both spots after applying the non-parametric Kruskal–Wallis test, H(1) = 171.632, p <0.001.
Results for summer and winter seasons show that the distribution of the LST values in the winter was more heterogonous than in summer, with higher interquartile ranges, as shown in Figure 8. Still, in winter, the median LST difference between urban and rural zones is near 1 °C, while in summer differences rise to approximately 5 °C between both types of zones. Table A1 with data from all the locations is present in Appendix A.

3.3. Temporal Variation of SUHI in Stable Locations

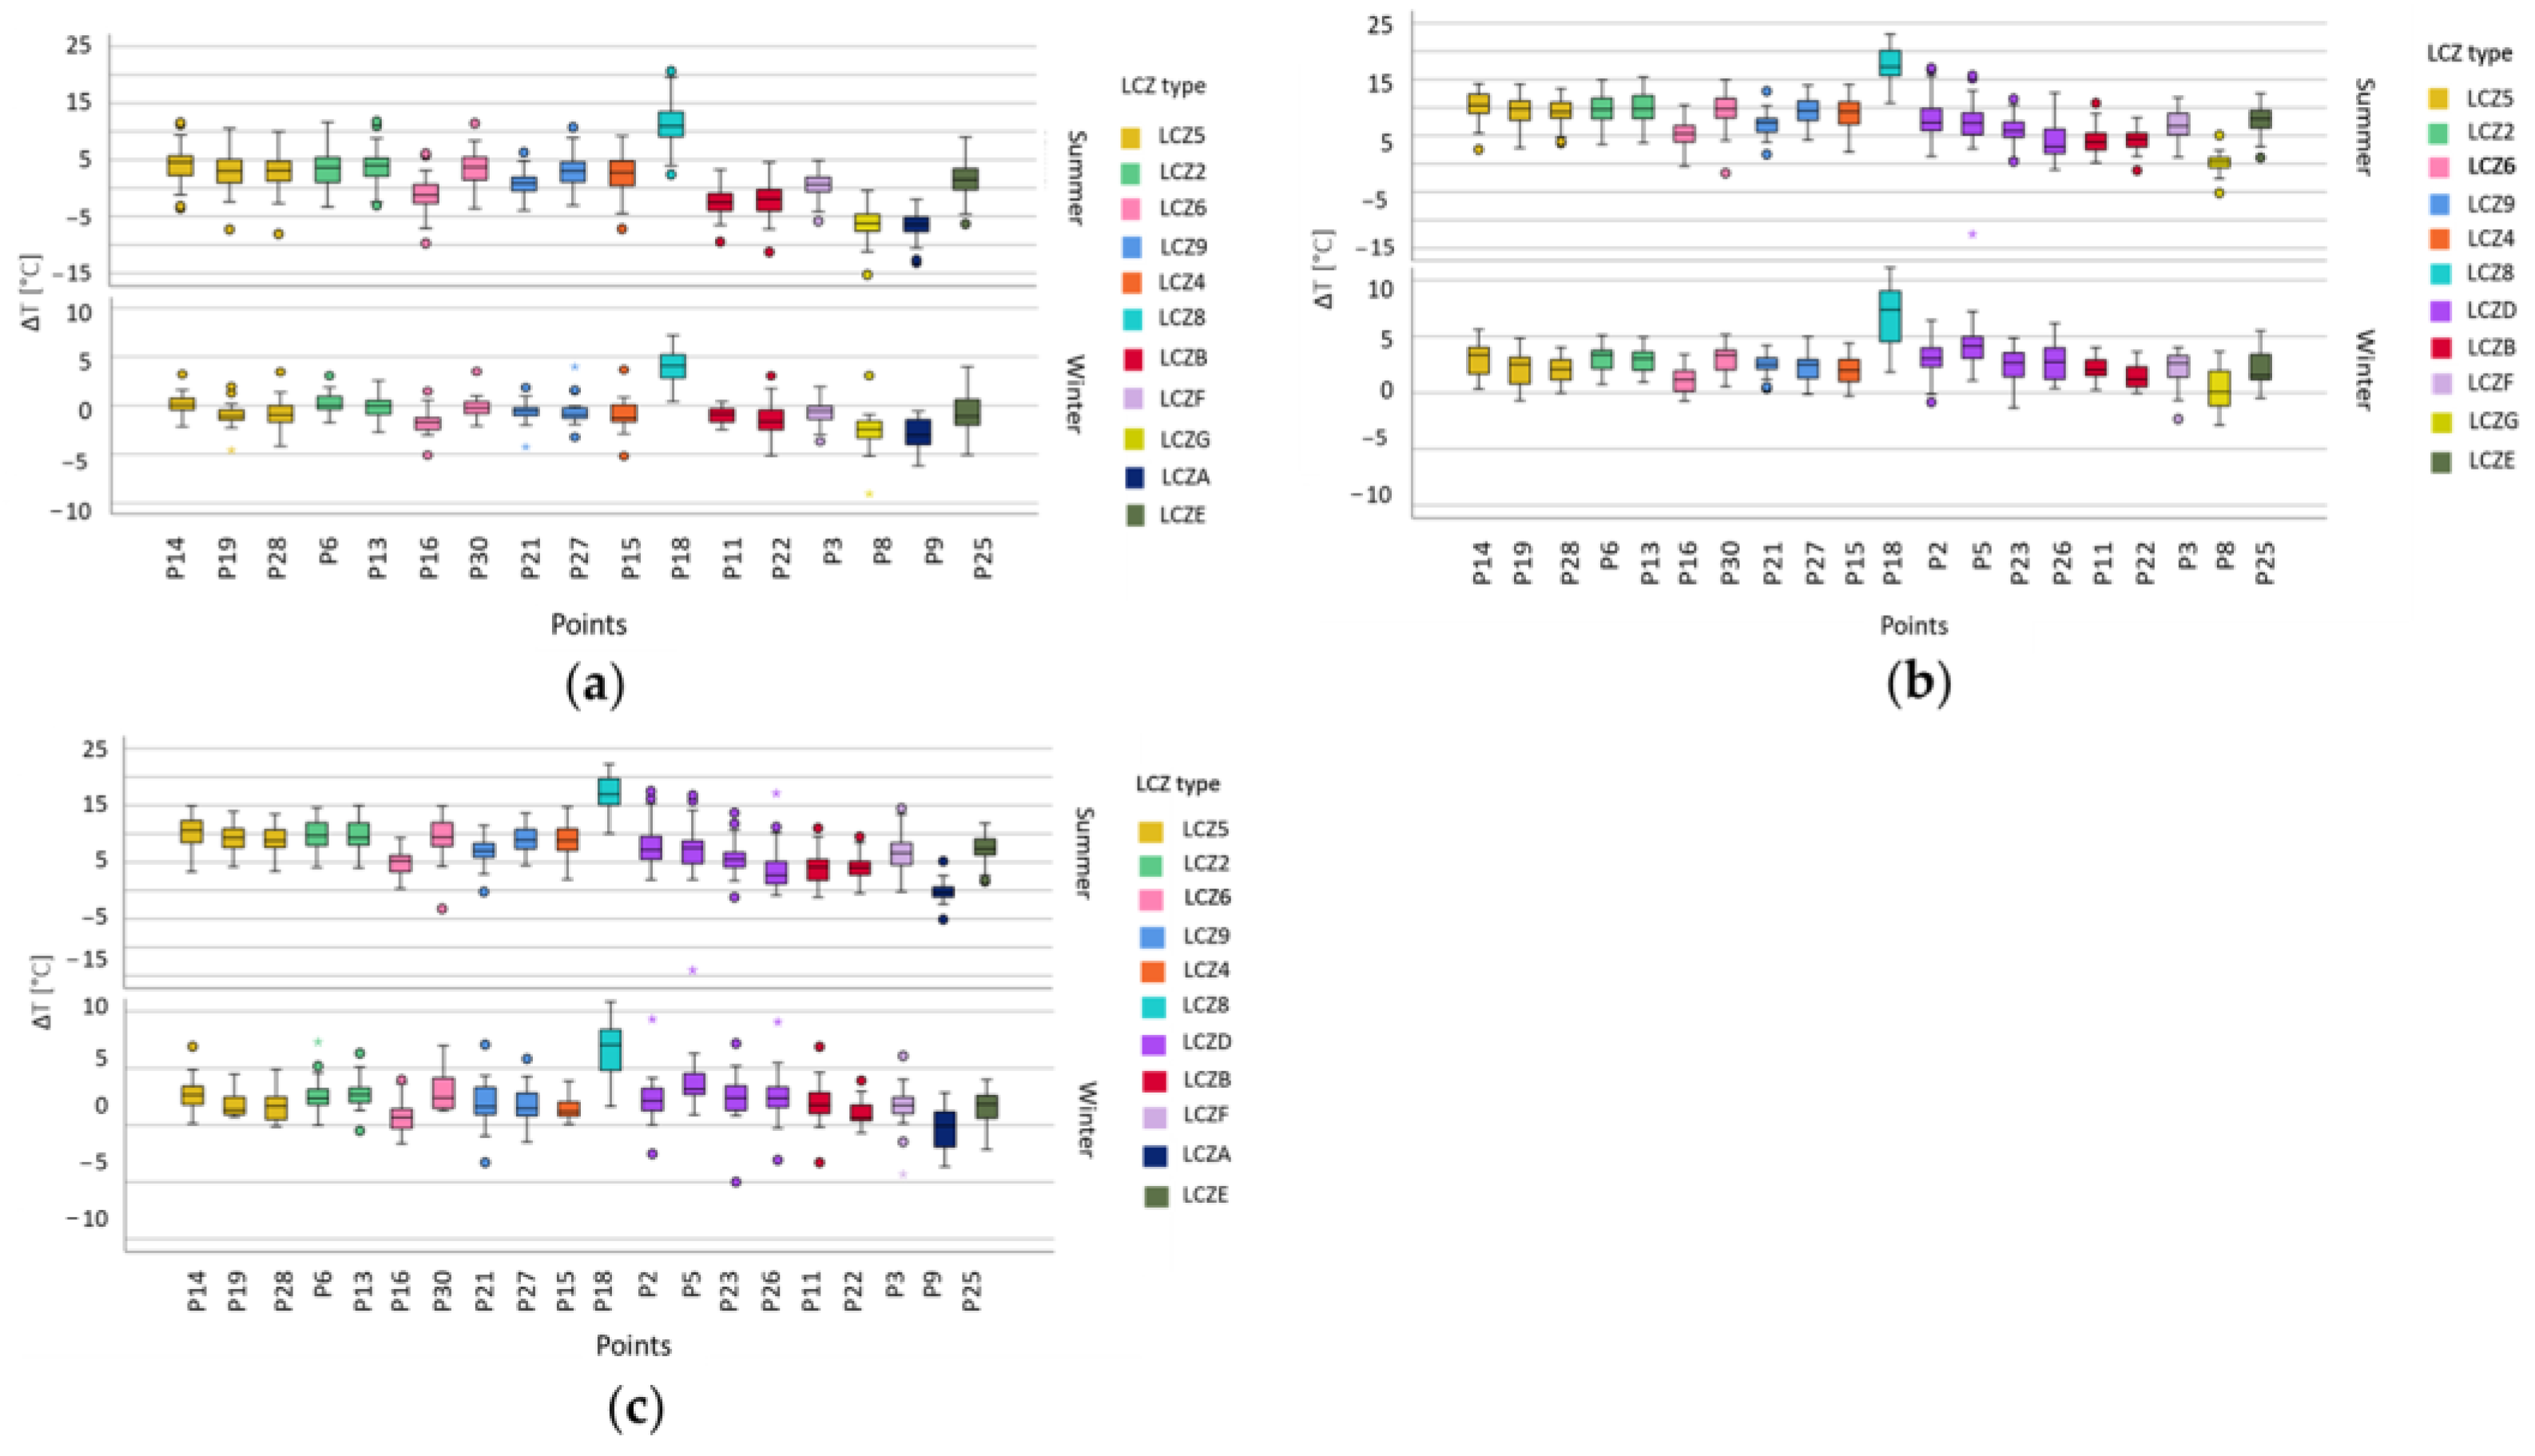
Figure 9 shows the SUHIint in all the stable sample locations considering the three different rural LCZs (LCZD, LCZA, and LCZG). In the three cases, SUHIint is higher in urban LCZs than in natural LCZs. P18, representing LCZ8 (open arrangement of large-rise buildings with no trees and land cover mostly paved), shows the highest values: 9.05 °C when compared with LCZD (Figure 9a), 14.38 °C with LCZA (Figure 9b), and 14.50 °C with LCZG (Figure 9c). When considering the three rural contexts, higher differences were found when comparing LCZA (forest), while the use of the LCZD (croplands) as a reference provides the lowest SUHI.
Relevant differences are found when comparing SUHIint in summer and winter. Figure 10 shows the results considering the three rural scenarios. In the three cases, SUHI is more intense during summer showing significant differences after applying the non-parametric Kruskal–Wallis test: LCZD (H(1) = 85.076, p < 0.001), LCZA (H(1) = 482.225, p < 0.001), and LCZG ((H(1) = 443.464, p < 0.001). The highest values are again found for P18: 10.99 °C respect LCZD (Figure 10c), 14.38 °C respect LCZA (Figure 10b), and 14.50 °C respect LCZG (Figure 10c). Additionally, in the summer, the difference in SUHIint between urban and rural locations is much higher than in winter. Table A2, Table A3 and Table A4 with data from all the locations for each case (LCZD, LCZA, and LCZG, respectively) are presented in Appendix A.
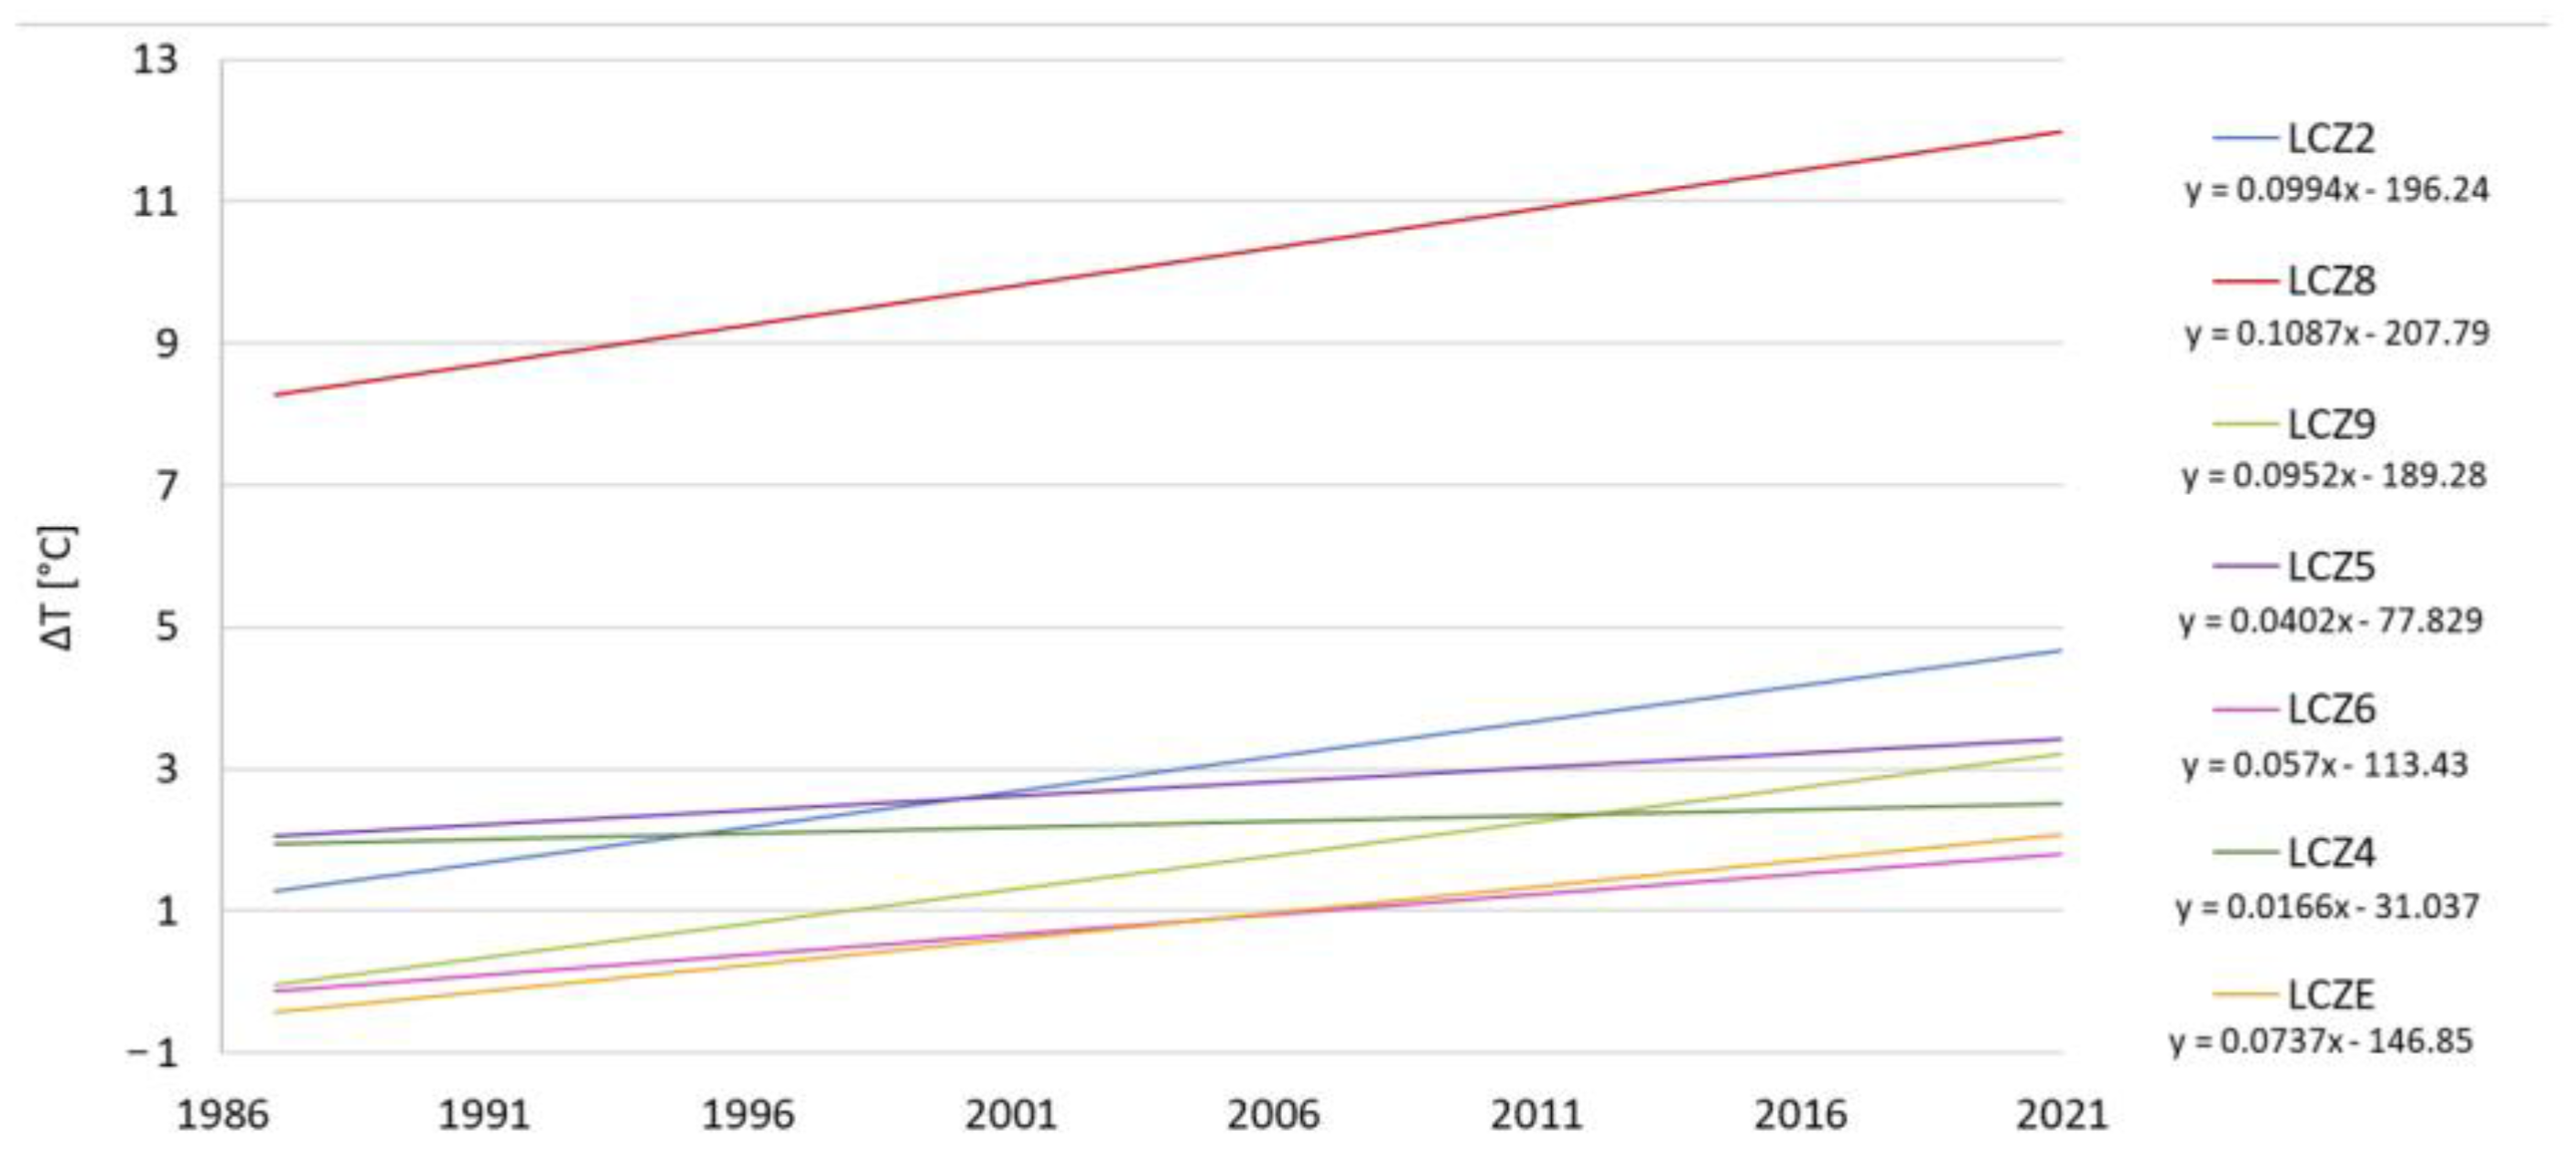
SUHI evolution was assessed in comparison with LCZD, as is the main LCZ type in the suburbs of Vitoria-Gasteiz. Figure 11 shows the linear trends of the urban LCZ typologies. Results show that the SUHI effect has increased between 1985 and 2021, since the trend for all urban LCZs is positive. LCZ8 presents the highest slope and LCZ4 the lowest.

3.4. Temporal Variation of SUHI in Altered Locations

Median values before and after the LCZ transformation of the nine altered locations are shown in Table 5. Six of these locations have suffered a transformation from a natural LCZ to an urban LCZ, namely: P1, P4, P10, P12, P17, and P29. For these locations, the LST median is higher after the urbanization process. The remaining three locations, placed in the green belt, had a major transformation from a natural LCZ to another natural LCZ, namely: P7, P20 and P24. For these locations, the LST median is very similar before and after the transformation.
Locations P1, P4, P12, and P17 show significant differences in LST values before and after the transformation (sig. < 0.05 in t-test); their analyses are further detailed below, while the rest of the locations did not present significant differences.
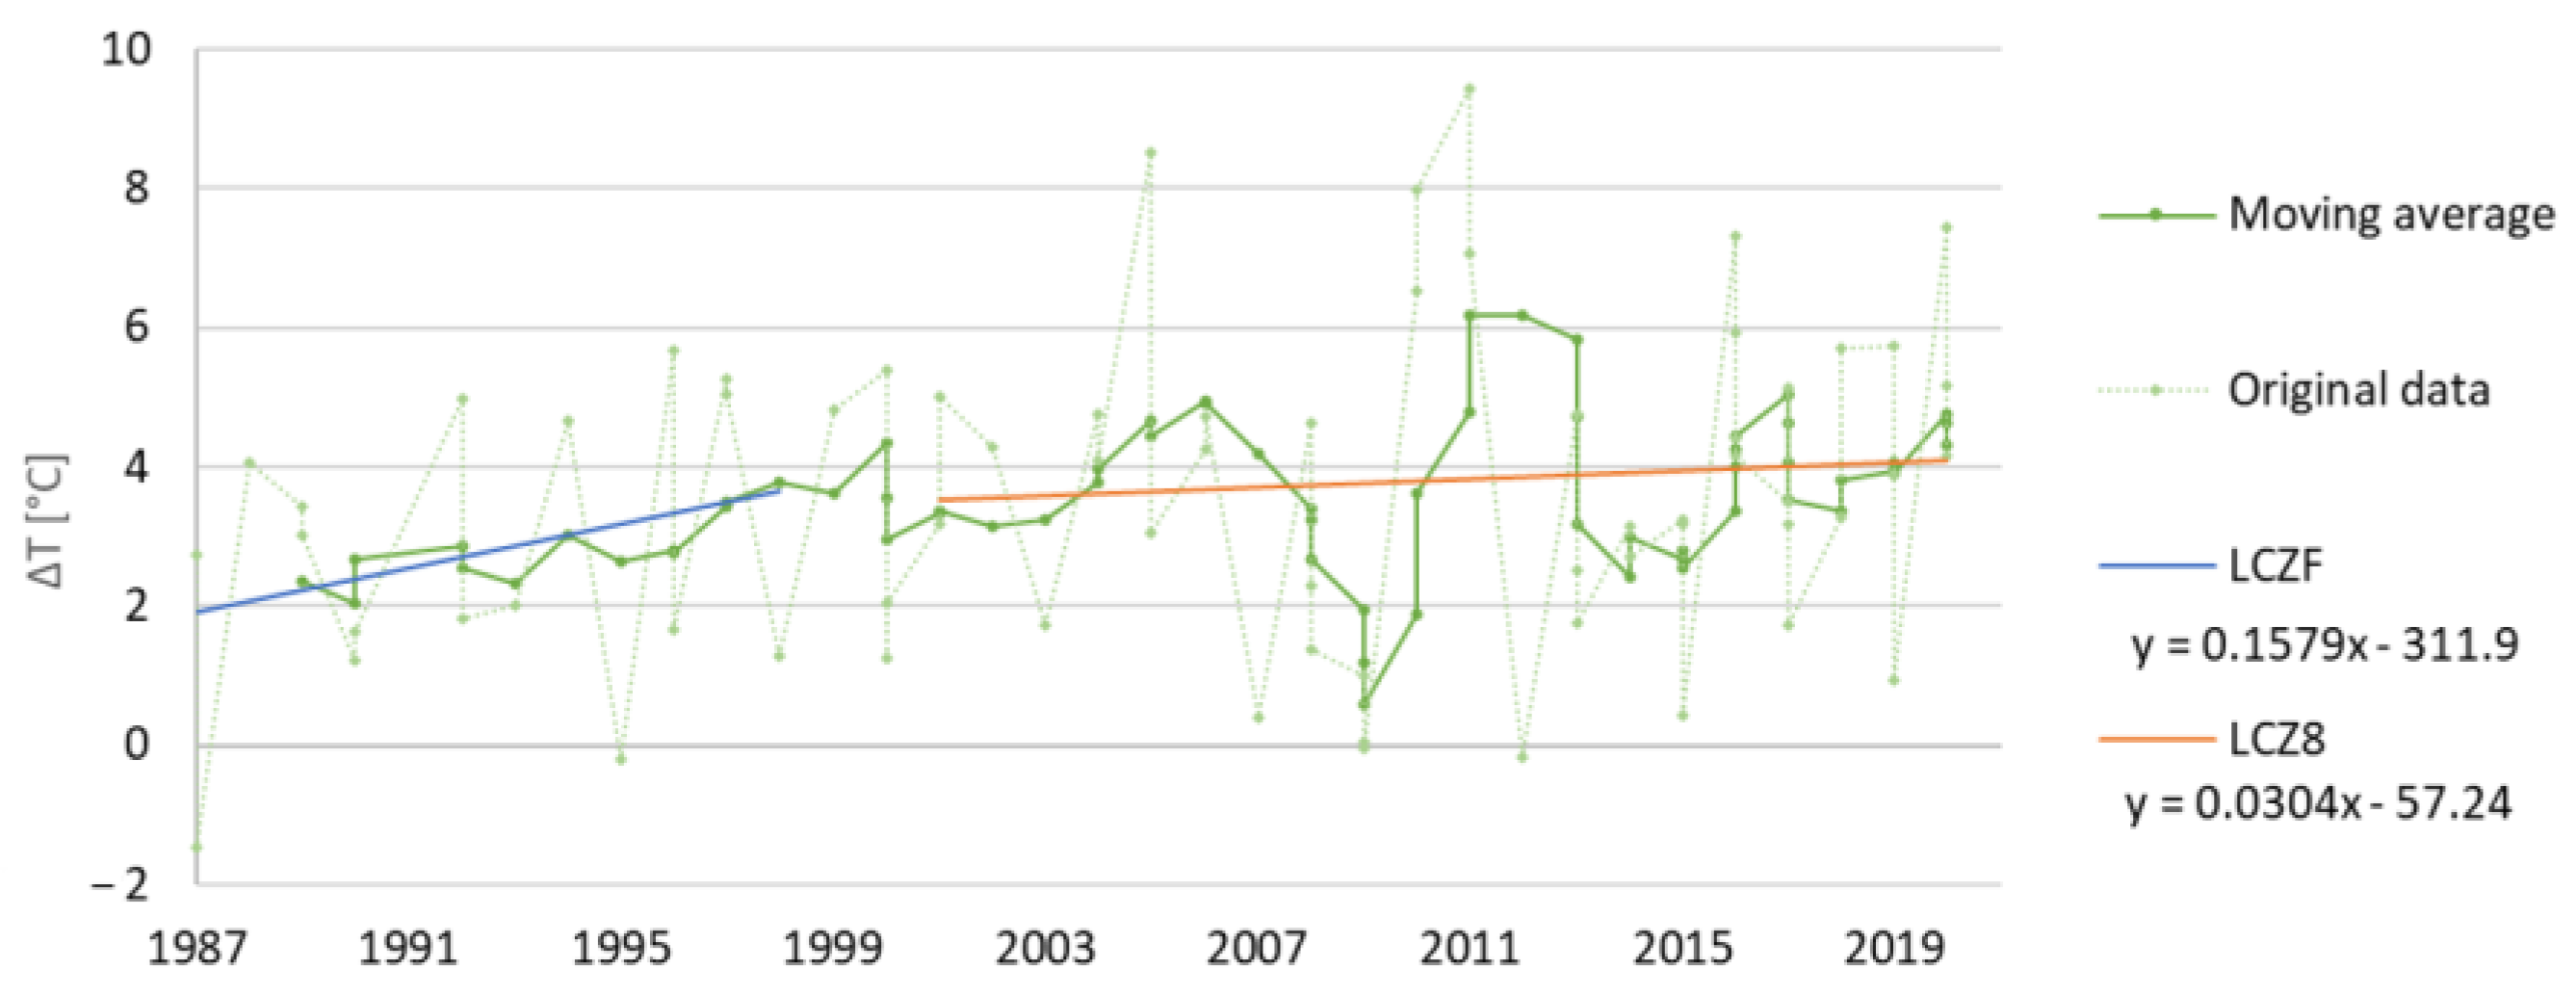
P1 evolution is shown in Figure 12. This location corresponds to LCZF between 1985 and 1998. The median LST of this first period was 34.28 °C. The linear regression of SUHI values shows a slope of 0.157. From approximately 2001, P1 was transformed into an urban area, LCZ8. The median LST for this second period was 37.61 °C and the SUHIint shows a 0.030 slope trend.
P4 evolution is shown in Figure 13. This location corresponded to an LCZF profile between 1985 and 1998. The median LST of this first period was 33.97 °C. The linear regression of SUHI values shows a trend of a −0.047 slope. From approximately 2001, P4 was transformed into a residential and leisure area, categorised as LCZ6. The median SUHI of this second period was 36.97 °C and SUHI shows a slope of 0.118. SUHI was higher when P4 corresponded to LCZ6 than LCZF, as the slope trend changed when the location was transformed into an urban area.
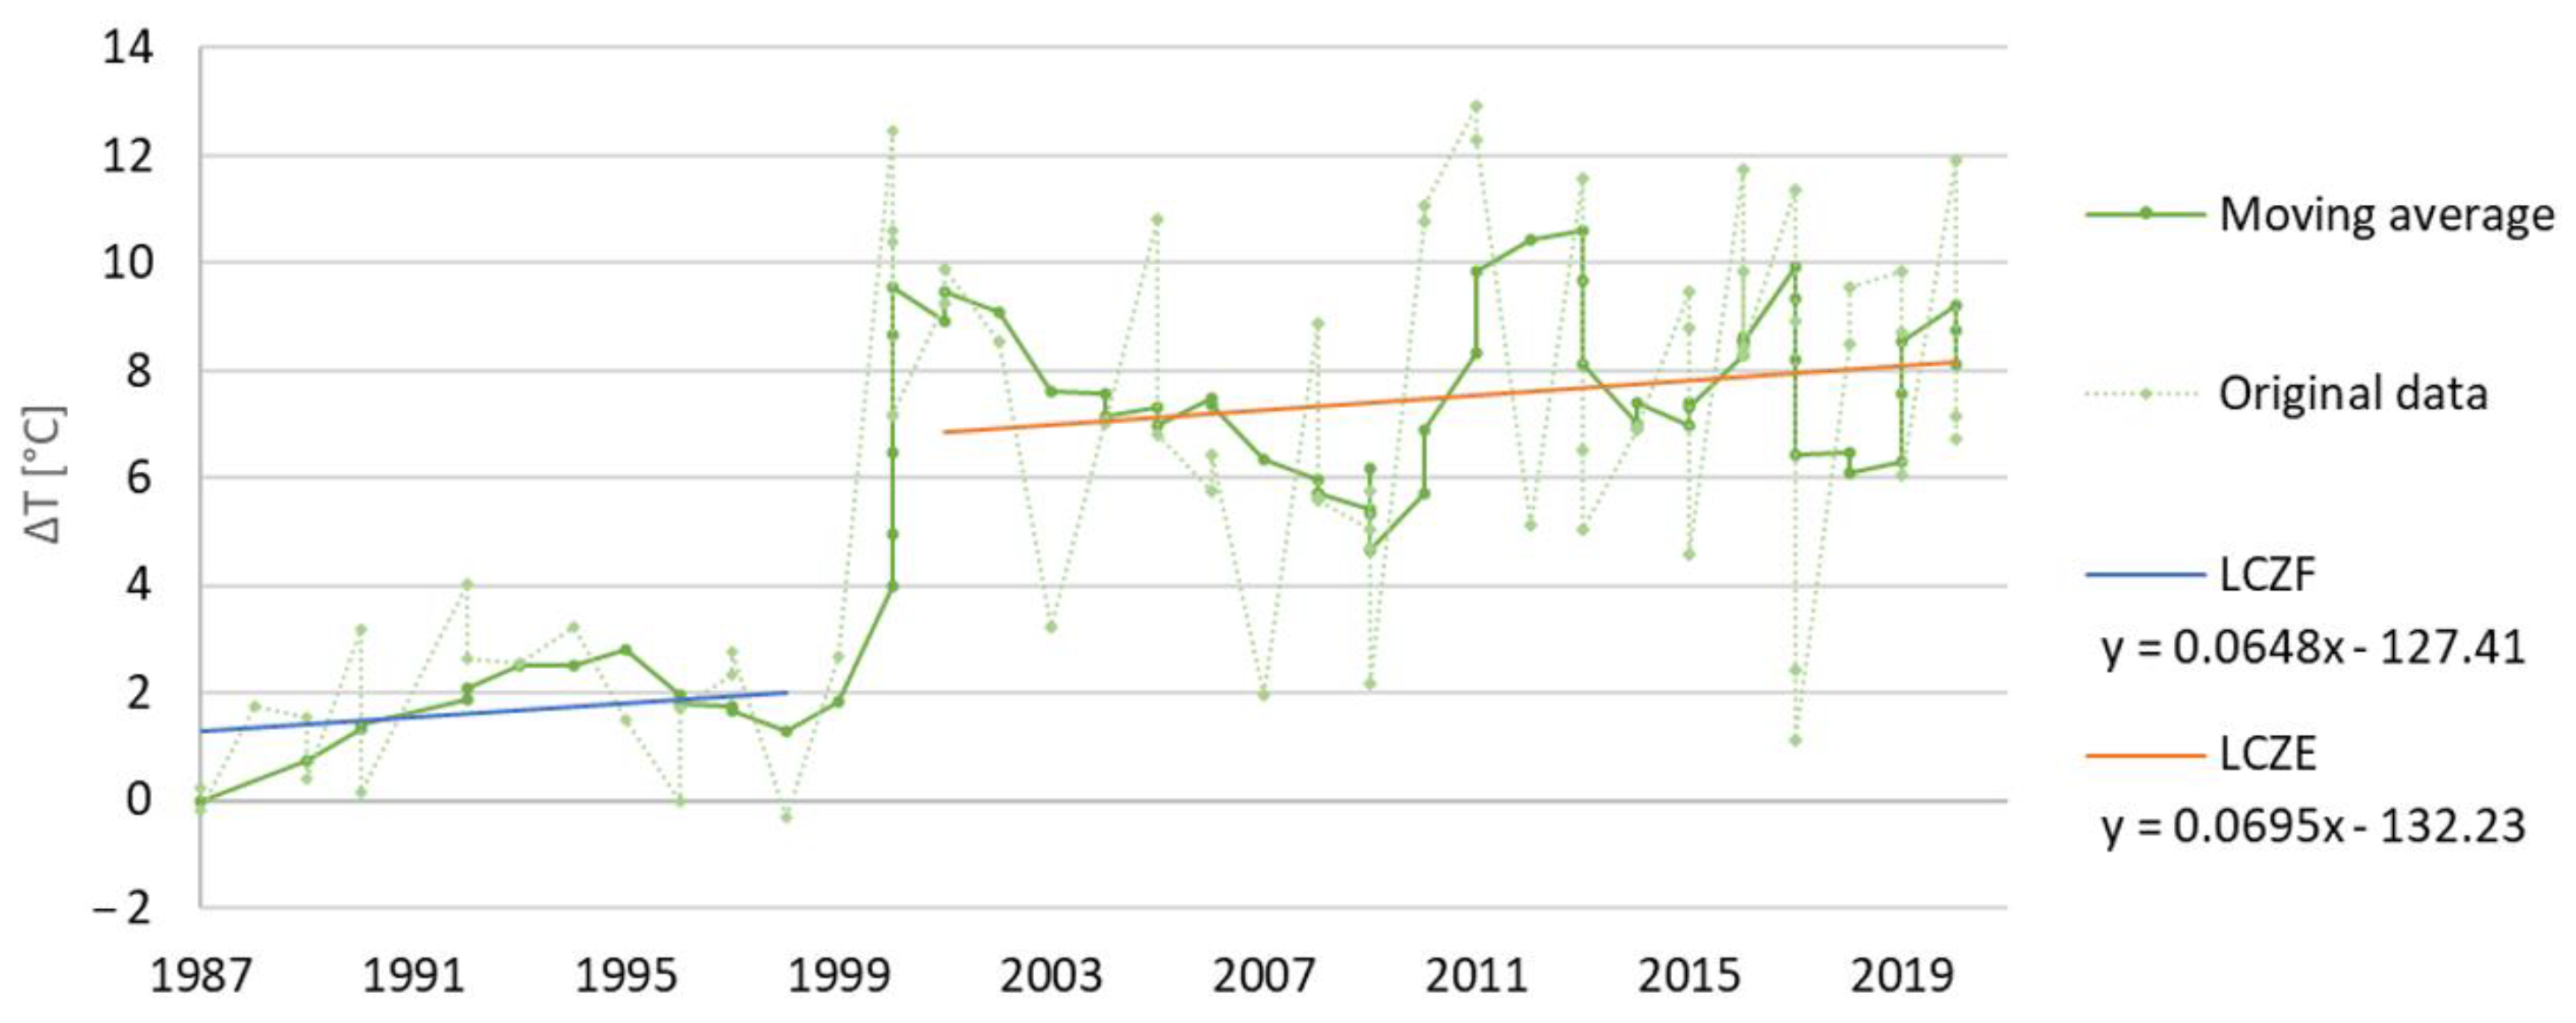
P12 evolution is shown in Figure 14. This location corresponded to an LCZF between 1985 and 1998. The median LST of this first period was 34.68 °C, while the linear regression of SUHI values shows a slope of 0.064. From approximately the year 2001, P12 was transformed into a parking area, categorised as LCZE. The median SUHI for this second period was 41.32 °C and the following changes presented a slope of 0.069. SUHI is more intense when P12 represents LCZE than LCZF. The trendline slope is similar for both periods. This particular location illustrates the negative impact of urbanization on local thermal conditions since the change in land use corresponded to a high increase in UHIint.
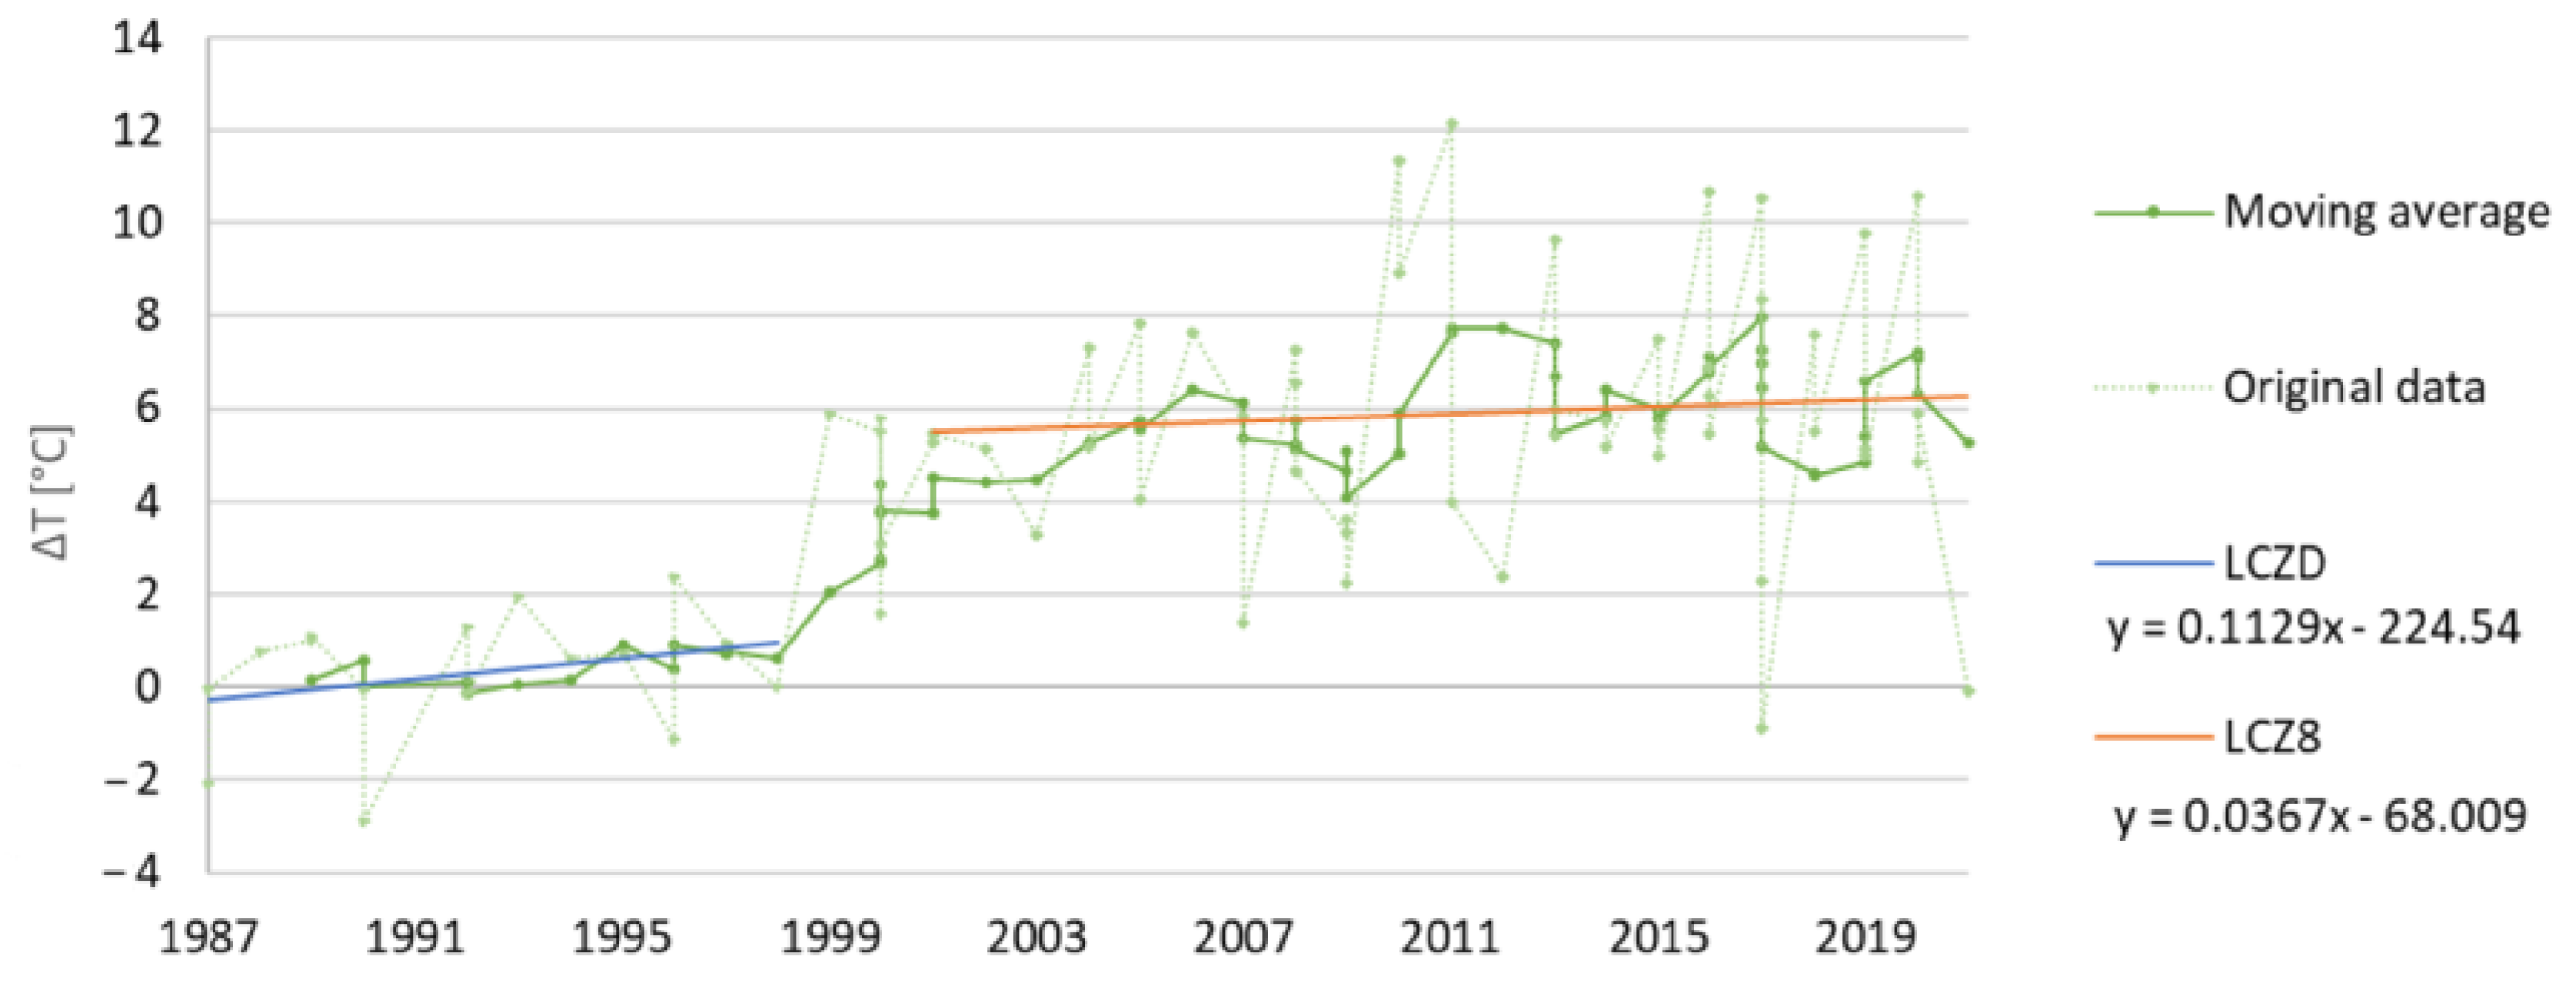
P17 evolution is shown in Figure 15. This location corresponded to LCZD, between 1985 and 1998. The median LST for this first period was 32.47 °C. The linear regression of SUHI values shows a slope of 0.112. In 2001, the P17 location was transformed into an industrial area, categorised as LCZ8. The median SUHI for this second period was 40.05 °C and SUHI shows a slope of 0.036. SUHI is more intense than when it corresponded to LCZD. The trend slope is lower after this location was transformed into an urban area. Similarly to P12, this location also illustrates the impact of urbanization on SUHIint.

4. Discussion

As expected, LST values were significantly higher in urban areas when compared with rural areas since paved surfaces retain more heat and release heat more slowly than natural surfaces in rural areas [55]. P18 shows the highest LST values, corresponding to a LCZ8—an open arrangement of low-rise buildings with no trees and the land cover mostly paved. The low albedo of paved surfaces causes most of the radiation coming from the sun to be absorbed and accumulated, resulting in a higher LST value [2,6,7]. Additionally, the presence of low-rise buildings reduces the influence of shading which could reduce the LST at the time of satellite passage [45]. This can be observed for LCZ2—compact midrise buildings, where the surface is also paved and there is no vegetation, but LST values are lower than in LCZ8, which can be a consequence of the shadow cast by the midrise buildings.
On the other hand, P9 presents the lowest LST values, representing a LCZA—a heavily wooded landscape of trees, where the land cover is mostly covered by high plants. Vegetation provides humidity to the air by evapotranspiration, helping to regulate the temperature of the surface.
In the summer, the median LST in urban areas was approximately 5 °C higher than in rural areas, while in winter the difference is almost 1 °C. This circumstance can be explained by the lower radiation intake and the effects of shading [56]. In addition, Vitoria’s climate during winters is quite humid and rainfall is very frequent, which increases the moisture over surfaces and the air humidity, decreasing the LST in urban settings [57]. The opposite happens in summer, when the sun’s radiation hits the surface more directly and for longer periods, resulting in higher heat retention in paved urban areas [5]. Dry weather and heat wave episodes coupled with the lower wind to ventilate and cool the surface are also contributing factors that influence the differences between urban and rural LST and take place mostly during the summer [5].
When using LCZA (forest) as a rural reference, results show higher SUHIint values than when considering LCZD (cropland) and LCZG (water). The characteristics of such a densely wooded area (natural cover and evergreen trees) are in contrast with urban areas (mostly paved cover, no trees, and construction materials), so the result is an extreme interpretation of the SUHI effect and could be overestimated. Moreover, as LCZA areas do not predominate in the surrounding of Vitoria-Gasteiz, other indicators may provide more consistent results. By using LCZG (water) as an indicator, higher SUHIint values were also expected, since the low heat capacity of water does not allow it to retain as much heat as other surfaces. This shows that the presence of water bodies favours thermoregulation and cooling. On the other hand, cropland areas (LCZD) are the most abundant LCZ in the rural areas surrounding the city of Vitoria-Gasteiz and is also a widely used indicator in other SUHI studies [57,58]; therefore, it was used as a reference for the SUHIint calculation.
Urban areas with an open structure and the presence of vegetation, such as LCZ4, LCZ5, LCZ6 or LCZ9, show lower SUHIint than areas with no vegetation, such as LCZ2 or LCZ8, due to the positive effects of vegetation, such as the interception of solar energy reducing sensible heat and the humidity supply by evapotranspiration [9,59]. This is in line with what has been found in other similar studies [20,31], where urban areas record higher LST values than areas with vegetation. In summer, SUHI is more intense than in winter, in line with what other authors have previously found [8,18,60].
In winter, it has been found that LST values in urban areas are often lower than in rural LCZD areas, which results in a negative SUHIint. This is known as the urban cold island effect (UCI). This phenomenon is more common in winter because the solar radiation trajectory is lower and the buildings often cast shadows on vast urban areas, slowing the temperature rise during the early hours of the day. Meanwhile, in rural areas such as LCZD, fewer obstacles to solar radiation directly hit the surfaces, leading them to faster warming when compared with those located in densely built urban areas [61]. UCI is more common during the early hours of the day, and since the time of passage of the satellite is between 9:00 and 11:00 a.m., this effect is not uncommon.
The global trend of the SUHIint shows an increase between 1985 and 2021 in all studied urban areas. When comparing different zones, it was found that SUHIint at LCZs 2, 8, and 9 had a higher increase than other LCZs. These three urban locations share the presence of medium–low-rise buildings and were, therefore, more exposed to solar radiation than areas with higher buildings or trees. On the other hand, LCZ4, which corresponds to open high-rise buildings, presented the lowest SUHI. In these locations, at the satellite passage time, the presence of high obstacles makes the surface less exposed to direct radiation, contributing to a reduced or negative SUHI.
The change in SUHIint over time on the places that had some kind of urban transformation shows that newly forested spots on the periphery (P7, P20, and P24) located inside the greenbelt of Vitoria-Gasteiz have no significant differences before and after the transformation. These results suggest that planting trees in areas that already have some pre-existing vegetation, either with low vegetation as in P24 or with low tree density as in P7, will generate mild effects due to the pre-existence of a wide vegetation cover.
In contrast, the transformation of locations P1, P4, P12, and P17 meant a change from rural LCZs (F, F, F, and D, respectively) to urban LCZs (8, 6, E, and 8, respectively), generating a noticeable increase in the LST. Results suggest that an abrupt transformation from semi-natural to urban areas does intensify the SUHI effect. These four cases support the physical basis of the SUHI effect since when the same location belongs to a natural LCZ (either F or D), it retains less heat than if the same location corresponds to an urban LCZ (such as 8, 6 or E), promoting an increase in the SUHIint.
P10 and P29 have also undergone a transformation from a rural LCZ into an urban LCZ (from LCZF to LCZ4 and from LCZC to LCZ5, respectively), but their median LST difference before and after the transformation was not significant. LCZ4 and LCZ5 are open areas of medium and high-rise buildings, so shading by large buildings hinders solar incidence and surface heating, in contrast to urban areas with low-rise buildings, such as LCZ6, where the surface is more exposed to solar radiation and, therefore, records higher LST values. This is in line with the notion that the vertical expansion of cities can mitigate the SUHI effect during the initial hours of the day by providing a shading effect that decreases solar incidence [62]. Nonetheless, these same areas are more prone to have the highest daily SUHIint during the night just before sunrise, due to the heat retention caused by the low sky view factor, slowing longwave radiation emission by the surfaces [3].
The study results and conclusions are based on the SUHI effect, offering a close expression of the UHI effect on the time of the satellite passage, as they assume a strong relationship. This is the first study on UHI conducted in Vitoria-Gasteiz, offering relevant historical results to be considered both in the future urban development of Vitoria-Gasteiz, as well as in urban strategies in cities around the world that seek solutions to adapt to the UHI effect. However, as a consequence of the limitations of RS, this study promotes the need to carry out complementary studies to achieve the proposed objectives in a more satisfactory way, specifying the type of urban planning measure and its influence on reducing the SUHI effect. Such studies should establish a relationship between the spatial morphology of green areas and the intensity of UHIs. For this purpose, there are methodologies that may allow quantifying the contribution of morphological factors that influence the UHI, such as random forest [63] or the feed-forward neural network (FNN) [64], which both have proven to be a good tool for establishing effective mitigation measures to reduce the intensity of the UHI effect.
To this end, it is worth noting that the spatial resolution of the Landsat sensors, obtained at 100 m and resampled at 30 m, can be a limiting factor in this study which can be complemented with data from unmanned aerial vehicles (UAV), equipped with thermal sensors. In this case, each pixel would represent more reliably the type of land cover, minimizing the averages between distinct types (such as vegetation and asphalt, in transition zones).

5. Conclusions

The analysis of Landsat data from 1985 to 2021 in Vitoria-Gasteiz shows that LST is higher in urban areas than in rural ones, with the differences between both areas being greater during summer than during winter. LCZD (croplands) has proved to be a good indicator of rural reference for calculating SUHIint. During the satellite passage time of the day, the highest SUHIint value was 10.99 °C for P18, representative of LCZ8—large low-rise building area and LCZD. Results under this study’s conditions show that the SUHI effect in Vitoria-Gasteiz has increased over the period of 1985–2021. In urban areas composed of low-rise buildings such as LCZ8 or LCZ9, higher SUHIint values were recorded than in urban areas with medium–high-rise buildings such as LCZ4 or LCZ5. Non-urban areas with vegetation cover such as LCZB or LCZF show significantly lower SUHIint values for the same study conditions. The transformed locations in the green belt do not show a significant decrease in SUHIint using this study methodology, nor do those areas transformed from rural, such as LCZD or LCZF, into mid–high-rise building areas such as LCZ4 and LCZ5. On the other hand, areas transformed from rural areas into low-rise buildings areas such as LCZ6 and LCZ8 or simple paved areas such as LCZE, have shown a significant increase in SUHIint after the transformation.
The use of RSdata is a key tool for urban climate studies based on long time series but also requires identifying, in detail and coherently, the location of the sampling locations where LSTs are to be obtained, for which having only the remote visual analysis of the study area may be a limiting factor. To investigate the impact of urban structure changes on the SUHI effect, it is crucial to identify areas that have remained stable as a baseline for SUHI behaviour interpretation, and then compare them with transformed areas to pinpoint any differences.
The results suggest that the presence of the green belt reduces SUHIint, as LST is lower than core urban areas. However, once the ring area was restored, the implementation of further naturalisation measures did not significantly reduce the SUHI effect during this study’s conditions. On the other hand, the transformation of green areas into urban areas is shown to substantially increased SUHIint. As expected, this study suggests that naturalising urban areas could offer a noticeable decrease in the SUHI effect.
The municipality of Vitoria-Gasteiz is referential for its commitment to the implementation of urban strategies that ensure the well-being of its inhabitants. In order to validate present and future urban interventions, it is recommended that further studies on the UHI effect should be carried out. Therefore, additional monitoring should be carried out to consider the Tair variations across the city and the analysis should be expanded to consider daily variations in UHI intensity, especially considering the impact of nocturnal conditions, since the highest UHIint values are expected to be found in the moments before sunrise.

Author Contributions

C.L.E. participated in the manuscript design, study selection, analysis and selection of study data, and data processing in software. C.R.d.A. participated in the manuscript design and systematic review. A.C.T. participated in the manuscript design and systematic review. A.G. participated in the manuscript design and systematic review. A.C.T. and A.G. supervised the work. All authors have read and agreed to the published version of the manuscript.

Funding

This work was funded by National Funds through the FCT—Foundation for Science and Technology and FEDER, under the projects UIDB/04683/2020, UIDB/00690/2020, UIDP/00690/2020) and LA/P/0007/2020.

Acknowledgments

Cátia Rodrigues de Almeida was financially supported by Portuguese national funds through FCT—Foundation for Science and Technology I.P. (Grant: PRT/BD/153518/2021).

Conflicts of Interest

The authors declare no conflict of interest.

Correction Statement

This article has been republished with a minor correction to resolve spelling and grammatical errors. This change does not affect the scientific content of the article.

Appendix A

Table A1. Land surface temperature (LST) values; expressed in °C, of 218 data days for the 21 stable locations. Median, maximum, and minimum values for urban and rural areas.
Urban Locations
14192861316302127151825
PeriodLCZ5LCZ5LCZ5LCZ2LCZ2LCZ6LCZ6LCZ9LCZ9LCZ4LCZ8LCZEMedianMaximumMinimum
All30.6730.7029.0730.6931.3626.3231.1628.2829.0728.9337.9928.3929.8737.9926.32
Summer38.0336.3336.1737.0637.4332.2137.2634.5636.4135.9745.0534.9536.3745.0532.21
Winter8.377.786.708.779.426.3111.627.668.086.8612.788.178.1312.786.31
Rural locations
2523261122389
PeriodLCZDLCZDLCZDLCZDLCZBLCZBLCZFLCZGLCZAMedianMaximumMinimum
All27.8028.4526.3026.5725.2226.1326.9822.1621.2726.3028.4521.27
Summer34.6334.1432.6930.3030.7931.1634.0927.3826.5731.1634.6326.57
Winter7.149.827.978.286.587.197.006.755.507.149.825.50
Table A2. Median surface urban heat island (SUHI) values; expressed in °C, of the period 1985–2021 for the stable location respect Local Climate Zone D (cropland) locations. Median, maximum, and minimum values for urban and rural areas.
Urban Locations
14192861316302127151825
PeriodLCZ5LCZ5LCZ5LCZ2LCZ2LCZ6LCZ6LCZ9LCZ9LCZ4LCZ8LCZEMedianMaximumMinimum
All2.101.711.121.872.14−1.482.040.411.340.749.050.401.539.05−1.48
Summer4.603.063.173.674.06−1.173.750.903.072.7810.991.543.1210.99−1.17
Winter0.08−1.11−0.960.01−0.02−1.72−0.26−0.56−0.95−1.284.09−1.10−0.764.09−1.72
Rural locations
1122389
PeriodLCZBLCZBLCZFLCZGLCZAMedianMaximumMinimum
All−1.75−1.86−0.03−4.73−5.19−1.86−0.03−5.19
Summer−2.45−1.870.68−6.18−6.39−2.450.68−6.39
Winter−0.88−1.62−0.62−2.42−3.04−1.62−0.62−3.04
Table A3. Median surface urban heat island (SUHI) values; expressed in °C of the period 1985–2021 for the stable location respect local climate zone A (forest) location. Median, maximum, and minimum values for urban and rural areas.
Urban Locations
14192861316302127151825
PeriodLCZ5LCZ5LCZ5LCZ2LCZ2LCZ6LCZ6LCZ9LCZ9LCZ4LCZ8LCZEMedianMaximumMinimum
All7.386.776.54257.047.343.557.6965.876.945.8914.385.886.8614.383.55
Summer10.419.819.2389.709.825.359.8157.299.4079.2717.268.009.5517.265.35
Winter3.362.532.0863.373.031.163.332.532.52751.997.361.522.537.361.16
Rural locations
252326112238
PeriodLCZDLCZDLCZDLCZDLCZBLCZBLCZFLCZGMedianMaximumMinimum
All5.935.694.473.462.892.844.860.263.975.930.26
Summer7.307.255.863.053.884.406.750.365.137.300.36
Winter3.044.132.652.752.031.202.620.062.644.130.06
Table A4. Median surface urban heat island (SUHI) values; expressed in °C of the period 1985–2021 for the stable location respect Local Climate Zone G (water) location. Median, maximum, and minimum values for urban and rural areas.
Urban Locations
14192861316302127151825
PeriodLCZ5LCZ5LCZ5LCZ2LCZ2LCZ6LCZ6LCZ9LCZ9LCZ4LCZ8LCZEMedianMaximumMinimum
All7.567.106.69257.187.563.667.82855.736.7776.2414.505.806.9414.503.66
Summer10.589.348.8379.679.345.259.41257.008.9248.8416.957.409.1316.955.25
Winter2.651.341.67452.362.670.692.4021.621.4631.187.041.841.767.040.69
Rural locations
252326112239
PeriodLCZDLCZDLCZDLCZDLCZBLCZBLCZFLCZAMedianMaximumMinimum
All5.505.274.213.002.883.064.54−0.263.645.50−0.26
Summer7.157.495.492.694.144.056.64−0.364.827.49−0.36
Winter2.163.182.392.371.780.631.75−0.061.973.18−0.06

References

  1. Oke, T.R. City size and the urban heat island. Atmos. Environ. 1973, 7, 769–779. [Google Scholar] [CrossRef]
  2. Howard, L. The Climate of London; Elsevier: Amsterdam, The Netherlands, 1833; Volume I–III. [Google Scholar]
  3. Oke, T.R. The energetic basis of the urban heat island. Q. J. R. Meteorol. Soc. 1982, 108, 1–24. [Google Scholar] [CrossRef]
  4. Santamouris, M. Recent progress on urban overheating and heat island research. Integrated assessment of the energy, environmental, vulnerability and health impact. Synergies with the global climate change. Energy Build. 2020, 207, 109482. [Google Scholar] [CrossRef]
  5. Li, D.; Bou-Zeid, E. Synergistic Interactions between Urban Heat Islands and Heat Waves: The Impact in Cities Is Larger than the Sum of Its Parts. J. Appl. Meteorol. Clim. 2013, 52, 2051–2064. [Google Scholar] [CrossRef]
  6. Stewart, I.D.; Oke, T.R.; Krayenhoff, E.S. Evaluation of the ‘local climate zone’ scheme using temperature observations and model simulations. Int. J. Climatol. 2014, 34, 1062–1080. [Google Scholar] [CrossRef]
  7. Cuadrat Prats, J.M.; Vicente-Serrano, S.M.; Saz Sánchez, M.A. Los Efectos de La Urbanización En El Clima de Zaragoza (España): La Isla de Calor y Sus Factores Condicionantes. Boletín De La Asoc. De Geógrafos Españoles 2005, 40, 311–327. [Google Scholar]
  8. Oliveira, S.; Andrade, H.; Vaz, T. The cooling effect of green spaces as a contribution to the mitigation of urban heat: A case study in Lisbon. Build. Environ. 2011, 46, 2186–2194. [Google Scholar] [CrossRef]
  9. Epa, U.; Branch, L.; Protection Partnerships Division. Reducing Urban Heat Islands: Compendium of Strategies: Trees and Vegetation. 2008. Available online: https://www.epa.gov/sites/default/files/2017-05/documents/reducing_urban_heat_islands_ch_2.pdf (accessed on 9 February 2023).
  10. Hibbard, K.; Hoffman, F.; Huntzinger, D.; West, T. Changes in Land Cover and Terrestrial Biogeochemistry. In Climate Science Special Report: Fourth National Climate Assessment; U.S. Global Change Research Program: Washington, DC, USA, 2017; Volume I. [Google Scholar] [CrossRef]
  11. Stewart, I.D.; Oke, T.R. Local Climate Zones for Urban Temperature Studies. Bull. Am. Meteorol. Soc. 2012, 93, 1879–1900. [Google Scholar] [CrossRef]
  12. Heat Island Impacts|US EPA. Available online: https://www.epa.gov/heatislands/heat-island-impacts#_ftn1 (accessed on 9 February 2023).
  13. Santamouris, M.; Cartalis, C.; Synnefa, A.; Kolokotsa, D. On the impact of urban heat island and global warming on the power demand and electricity consumption of buildings—A review. Energy Build. 2015, 98, 119–124. [Google Scholar] [CrossRef]
  14. de Almeida, C.R.; Teodoro, A.C.; Gonçalves, A. Study of the Urban Heat Island (UHI) Using Remote Sensing Data/Techniques: A Systematic Review. Environments 2021, 8, 105. [Google Scholar] [CrossRef]
  15. ARSET—Satellite Remote Sensing for Measuring Urban Heat Islands and Constructing Heat Vulnerability Indices | NASA Applied Sciences. Available online: https://appliedsciences.nasa.gov/join-mission/training/english/arset-satellite-remote-sensing-measuring-urban-heat-islands-and (accessed on 15 February 2023).
  16. Marando, F.; Heris, M.P.; Zulian, G.; Udías, A.; Mentaschi, L.; Chrysoulakis, N.; Parastatidis, D.; Maes, J. Urban heat island mitigation by green infrastructure in European Functional Urban Areas. Sustain. Cities Soc. 2022, 77, 103564. [Google Scholar] [CrossRef]
  17. Price, J.C. Assessment of the Urban Heat Island Effect Through the Use of Satellite Data. Mon. Weather. Rev. 1979, 107, 1554–1557. [Google Scholar] [CrossRef]
  18. de Almeida, C.R.; Furst, L.; Gonçalves, A.; Teodoro, A.C. Remote Sensing Image-Based Analysis of the Urban Heat Island Effect in Bragança, Portugal. Environments 2022, 9, 98. [Google Scholar] [CrossRef]
  19. Masoudi, M.; Tan, P.Y.; Liew, S.C. Multi-city comparison of the relationships between spatial pattern and cooling effect of urban green spaces in four major Asian cities. Ecol. Indic. 2019, 98, 200–213. [Google Scholar] [CrossRef]
  20. Chen, X.; Xu, Y.; Yang, J.; Wu, Z.; Zhu, H. Remote sensing of urban thermal environments within local climate zones: A case study of two high-density subtropical Chinese cities. Urban Clim. 2020, 31, 100568. [Google Scholar] [CrossRef]
  21. Rao, K.P. Remote Sensing of Urban Heat Islands from an Environmental Satellite. Bull. Amer. Meterol. Soc. 1972, 53, 647–648. [Google Scholar]
  22. Kwarteng, A.; Small, C. Remote Sensing of Urban Environmental Conditions. In Remote Sensing of Urban and Suburban Areas; Rashed, T., Jürgens, C., Eds.; Springer: Dordrecht, The Netherlands, 2010; pp. 267–287. ISBN 978-1-4020-4385-7. [Google Scholar]
  23. Voogt, J.A.; Oke, T.R. Thermal remote sensing of urban climates. Remote Sens. Environ. 2003, 86, 370–384. [Google Scholar] [CrossRef]
  24. Gorelick, N.; Hancher, M.; Dixon, M.; Ilyushchenko, S.; Thau, D.; Moore, R. Google Earth Engine: Planetary-scale geospatial analysis for everyone. Remote Sens. Environ. 2017, 202, 18–27. [Google Scholar] [CrossRef]
  25. History|Landsat Science. Available online: https://landsat.gsfc.nasa.gov/about/history/ (accessed on 14 February 2023).
  26. Ermida, S.L.; Soares, P.; Mantas, V.; Göttsche, F.-M.; Trigo, I.F. Google Earth Engine Open-Source Code for Land Surface Temperature Estimation from the Landsat Series. Remote Sens. 2020, 12, 1471. [Google Scholar] [CrossRef]
  27. Landsat Satellite Missions|U.S. Geological Survey. Available online: https://www.usgs.gov/landsat-missions/landsat-satellite-missions (accessed on 10 March 2023).
  28. Demuzere, M.; Kittner, J.; Bechtel, B. LCZ Generator: A Web Application to Create Local Climate Zone Maps. Front. Environ. Sci. 2021, 9, 112. [Google Scholar] [CrossRef]
  29. Zhang, Y.; Li, D.; Liu, L.; Liang, Z.; Shen, J.; Wei, F.; Li, S. Spatiotemporal Characteristics of the Surface Urban Heat Island and Its Driving Factors Based on Local Climate Zones and Population in Beijing, China. Atmosphere 2021, 12, 1271. [Google Scholar] [CrossRef]
  30. Petzold, J.; Mose, L. Urban Greening as a Response to Climate-Related Heat Risk: A Social–Geographical Review. Sustainability 2023, 15, 4996. [Google Scholar] [CrossRef]
  31. Santamouris, M.; Espinoza-Molina, J.; Acosta-Caipa, K.; Chambe-Vega, E.; Huayna, G.; Pino-Vargas, E.; Abad, J. Spatiotemporal Analysis of Urban Heat Islands in Relation to Urban Development, in the Vicinity of the Atacama Desert. Climate 2022, 10, 87. [Google Scholar] [CrossRef]
  32. Terfa, B.K.; Chen, N.; Zhang, X.; Niyogi, D. Spatial Configuration and Extent Explains the Urban Heat Mitigation Potential due to Green Spaces: Analysis over Addis Ababa, Ethiopia. Remote Sens. 2020, 12, 2876. [Google Scholar] [CrossRef]
  33. Lu, L.; Weng, Q.; Xiao, D.; Guo, H.; Li, Q.; Hui, W. Spatiotemporal Variation of Surface Urban Heat Islands in Relation to Land Cover Composition and Configuration: A Multi-Scale Case Study of Xi’an, China. Remote Sens. 2020, 12, 2713. [Google Scholar] [CrossRef]
  34. Montaner-Fernández, D.; Morales-Salinas, L.; Rodriguez, J.S.; Cárdenas-Jirón, L.; Huete, A.; Fuentes-Jaque, G.; Pérez-Martínez, W.; Cabezas, J. Spatio-Temporal Variation of the Urban Heat Island in Santiago, Chile during Summers 2005–2017. Remote Sens. 2020, 12, 3345. [Google Scholar] [CrossRef]
  35. Green Infrastructure. Available online: https://environment.ec.europa.eu/topics/nature-and-biodiversity/green-infrastructure_en (accessed on 8 February 2023).
  36. De, C.; Ambientales, E. La Infraestructura Verde Urbana de Vitoria-Gasteiz Documento de Propuesta-Febrero 2014. Imagen de Portada: Parque de Zabalgana (Vitoria-Gasteiz) QUINTAS Fotógrafos. Available online: https://www.vitoria-gasteiz.org/wb021/http/contenidosEstaticos/adjuntos/eu/32/95/53295.pdf (accessed on 4 December 2022).
  37. Instituto Nacional de Estadística (INE) Portal Del INE, Nomenclátor. Available online: https://www.ine.pt/xportal/xmain?xpid=INE&xpgid=ine_main (accessed on 11 May 2022).
  38. Ayuntamiento de Vitoria Sitio Web Del Ayuntamiento de Vitoria-Gasteiz—Red Hidrográfica. Available online: https://www.vitoria-gasteiz.org/wb021/was/contenidoAction.do?idioma=es&uid=app_j34_0066 (accessed on 7 February 2023).
  39. Beck, H.E.; Zimmermann, N.E.; McVicar, T.R.; Vergopolan, N.; Berg, A.; Wood, E.F. Present and future Köppen-Geiger climate classification maps at 1-km resolution. Sci. Data 2018, 5, 180214. [Google Scholar] [CrossRef]
  40. Olazabal, M.; Feliu, E.; Herranz-Pascual, M.K.; Abajo, B.; González-Aparicio, I.; Simón-Moral, A.; Alonso, A.M. Climate Change Adaptation Plan of Vitoria-Gasteiz, Spain. In Resilient Cities 2: Cities and Adaptation to Climate Change—Proceedings of the Global Forum 2011; Springer: Dordrecht, The Netherlands, 2012; pp. 335–347. [Google Scholar] [CrossRef]
  41. Climate-Data Clima Vitoria. Available online: https://es.climate-data.org/europe/espana/pais-vasco/vitoria-402/ (accessed on 6 February 2023).
  42. Sitio Web Del Ayuntamiento de Vitoria-Gasteiz—Parques Del Anillo Verde. Available online: https://www.vitoria-gasteiz.org/wb021/was/contenidoAction.do?idioma=es&uid=app_j34_0099 (accessed on 8 February 2023).
  43. Vitoria-gasteiz Vitoria-Gasteiz Green Capital: A Human-Scale City Sustainable Mobility and Urban Green Infrastructure 2-3 Ss; ISBN 9788496845602. Available online: https://agriculture.ongov.net/wp-content/uploads/2021/03/humanscalecity.pdf (accessed on 20 December 2022).
  44. Centro de Estudios Ambientales Vitoria-Gasteiz Análisis Del Ecosistema Anillo Verde. Efectos y Valores Del Bosque Urbano. 2020. Available online: https://blogs.vitoria-gasteiz.org/ceagreenlab/files/2020/06/i-tree_Anillo-Verde_Mayo-2020_Especies.pdf (accessed on 1 December 2022).
  45. CEA MINTEGIAK 2022 Resumen Anual Del POEJ 2021-22 En El Jardín Botánico de Olarizu y Otros Enclaves de Infraestructura Verde de Vitoria-Gasteiz. Available online: https://blogs.vitoria-gasteiz.org/ceagreenlab/tag/jardin-botanico-de-olarizu/ (accessed on 4 December 2022).
  46. Centro de Descargas Del CNIG (IGN). Available online: http://centrodedescargas.cnig.es/CentroDescargas/index.jsp (accessed on 22 February 2023).
  47. Chakraborty, T.; Lee, X.; Ermida, S.; Zhan, W. On the land emissivity assumption and Landsat-derived surface urban heat islands: A global analysis. Remote Sens. Environ. 2021, 265, 112682. [Google Scholar] [CrossRef]
  48. Smith, P.; Sarricolea, P.; Peralta, O.; Aguila, J.P.; Thomas, F. Study of the urban microclimate using thermal UAV. The case of the mid-sized cities of Arica (arid) and Curicó (Mediterranean), Chile. Build. Environ. 2021, 206, 108372. [Google Scholar] [CrossRef]
  49. National Centers for Environmental Prediction. Available online: https://www.weather.gov/ncep/ (accessed on 13 March 2023).
  50. National Center for Atmospheric Research|National Center for Atmospheric Research. Available online: https://ncar.ucar.edu/ (accessed on 13 March 2023).
  51. The Worldwide Reference System|Landsat Science. Available online: https://landsat.gsfc.nasa.gov/about/the-worldwide-reference-system/ (accessed on 23 February 2023).
  52. Stewart, I.D.; Krayenhoff, E.S.; Voogt, J.A.; Lachapelle, J.A.; Allen, M.A.; Broadbent, A.M. Time evolution of the surface urban heat island. Earth’s Future 2021, 9, e2021EF002178. [Google Scholar] [CrossRef]
  53. Euskalmet—Agencia Vasca de Meteorología. Available online: https://www.euskalmet.euskadi.eus/s07-5853x/es/meteorologia/datos/mapaesta.apl?e=5 (accessed on 23 February 2023).
  54. Schwarz, N.; Lautenbach, S.; Seppelt, R. Exploring indicators for quantifying surface urban heat islands of European cities with MODIS land surface temperatures. Remote Sens. Environ. 2011, 115, 3175–3186. [Google Scholar] [CrossRef]
  55. Bechtel, B.; Demuzere, M.; Mills, G.; Zhan, W.; Sismanidis, P.; Small, C.; Voogt, J. SUHI analysis using Local Climate Zones—A comparison of 50 cities. Urban Clim. 2019, 28, 100451. [Google Scholar] [CrossRef]
  56. Giridharan, R.; Kolokotroni, M. Urban heat island characteristics in London during winter. Sol. Energy 2009, 83, 1668–1682. [Google Scholar] [CrossRef]
  57. Alexander, P.J.; Mills, G. Local Climate Classification and Dublin’s Urban Heat Island. Atmosphere 2014, 5, 755–774. [Google Scholar] [CrossRef]
  58. Yang, J.; Xin, J.; Zhang, Y.; Xiao, X.; Xia, J.C. Contributions of sea–land breeze and local climate zones to daytime and nighttime heat island intensity. NPJ Urban Sustain. 2022, 2, 12. [Google Scholar] [CrossRef]
  59. Wang, Y.; Akbari, H. The effects of street tree planting on Urban Heat Island mitigation in Montreal. Sustain. Cities Soc. 2016, 27, 122–128. [Google Scholar] [CrossRef]
  60. Cuadrat, J.M.; Serrano-Notivoli, R.; Barrao, S.; Saz, M.; Tejedor, E. Variabilidad temporal de la isla de calor urbana de la ciudad de Zaragoza (España). Cuad. Investig. Geogr. 2022, 48, 97–110. [Google Scholar] [CrossRef]
  61. Yang, X.; Li, Y.; Luo, Z.; Chan, P.W. The urban cool island phenomenon in a high-rise high-density city and its mechanisms. Int. J. Clim. 2017, 37, 890–904. [Google Scholar] [CrossRef]
  62. Harun, Z.; Reda, E.; Abdulrazzaq, A.; Abbas, A.A.; Yusup, Y.; Zaki, S.A. Urban heat island in the modern tropical Kuala Lumpur: Comparative weight of the different parameters. Alex. Eng. J. 2020, 59, 4475–4489. [Google Scholar] [CrossRef]
  63. Lin, J.; Qiu, S.; Tan, X.; Zhuang, Y. Measuring the relationship between morphological spatial pattern of green space and urban heat island using machine learning methods. Build. Environ. 2023, 228, 109910. [Google Scholar] [CrossRef]
  64. Qi, Y.; Li, X.; Liu, Y.; He, X.; Gao, W.; Miao, S. The Influence of Block Morphology on Urban Thermal Environment Analysis Based on a Feed-Forward Neural Network Model. Buildings 2023, 13, 528. [Google Scholar] [CrossRef]
Figure 1. Terrain elevation map of Vitoria-Gasteiz, Zadorra River, and streams (modified from [38]).
Remotesensing 15 03110 g001
Figure 2. Green Belt of Vitoria-Gasteiz in 2019 (modified from [42]).
Remotesensing 15 03110 g002
Figure 3. Timeline with some of the measures implemented in the city of Vitoria-Gasteiz and international recognition prizes.
Remotesensing 15 03110 g003
Figure 4. Satellite view (Google Earth image) of Vitoria-Gasteiz, with stable (in blue) and transformed sampled locations (in pink). The number in the figure is equivalent to the analysed point, from 1 to 30.
Remotesensing 15 03110 g004
Figure 5. Google Earth Engine (GEE) processing chain for retrieving Landsat land surface temperature (LST) (modified from [26]).
Remotesensing 15 03110 g005
Figure 6. Diagram of the steps followed in the methodology of this study.
Remotesensing 15 03110 g006
Figure 7. Boxplot with land surface temperature (LST) values of the period 1985–2021 for the 21 stable locations. Locations are organized by local climate zone (LCZ) type, from left to right, first the urban typologies and then the rural ones.
Remotesensing 15 03110 g007
Figure 8. Boxplot with land surface temperature (LST) values in summer and winter of the period 1985–2021 for the 21 stable locations. Locations are organized by local climate zone (LCZ) type, from left to right, from urban to rural typologies.
Remotesensing 15 03110 g008
Figure 9. Boxplot with surface urban heat island (SUHI) values of the period 1985–2021 for each stable location concerning rural local climate zones D, cropland (a); A, forest (b); and G, water (c).
Remotesensing 15 03110 g009
Figure 10. Boxplot with surface urban heat island (SUHI) values in summer and winter of the period 1985–2021 for each stable location concerning rural local climate zones D: cropland (a), A; forest (b) and G; water (c).
Remotesensing 15 03110 g010
Figure 11. Linear trend of surface urban heat island (SUHI) values of urban locations concerning local climate zone D (cropland), from dispersion plot of summer values between 1987 and 2021. Equation of the linear regression for each local climate zone (LCZ) showing the slope.
Remotesensing 15 03110 g011
Figure 12. Surface urban heat island (SUHI) original values of summer data from 1987 to 2021, five period moving average and linear trend in Location 1 (P1) transformed from local climate zone F (bare soil) to 8 (large low-rise).
Remotesensing 15 03110 g012
Figure 13. Surface urban heat island (SUHI) original values of summer data from 1987 to 2021, five-year moving average and linear trend in Location 4 (P4) transformed from local climate zone F (bare soil) to 6 (open low-rise).
Remotesensing 15 03110 g013
Figure 14. Surface urban heat island (SUHI) original values for summer data from 1987 to 2021, five-year moving average and linear trend in Location 12 (P12) transformed from local climate zone F (bare soil) to E (paved).
Remotesensing 15 03110 g014
Figure 15. Surface urban heat island (SUHI) original values of summer data from 1987 to 2021, five-year moving average and linear trend in Location 17 (P17) transformed from local climate zone D (cropland) to 8 (large low rise).
Remotesensing 15 03110 g015
Table 1. Definitions of the local climate zone (LCZ) types (modified from [11]).
Built TypesDefinitionLand Cover TypesDefinition
1. Compact high-riseDense mix of tall buildings to tens of stories. Few or no trees.A. Dense treesHeavily wooded landscape of trees. Land cover mostly pervious (low plants).
2. Compact midriseDense mix of midrise buildings (3–9 stories). Few or no trees.B. Scattered treesLightly wooded landscape of trees. Land cover mostly pervious (low plants).
3. Compact low-riseDense mix of low-rise buildings (1–3 stories). Few or no trees.C. Bush, scrubOpen arrangement of bushes, shrubs, and short, woody trees. Land cover mostly pervious (bare soil or sand).
4. Open high-riseOpen arrangement of tall buildings to tens of stories. Abundance of previous land cover (low plants, scattered trees).D. Low plantsFeatureless landscape of grass or herbaceous plants/crops. Few or no trees.
5. Open midriseOpen arrangement of midrise buildings (3–9 stories). Abundance of previous land cover (low plants, scattered trees).E. Bare rock or pavedFeatureless landscape of rock or paved cover. Few or no trees.
6. Open low-riseOpen arrangement of low-rise buildings (1–3 stories). Abundance of previous land cover (low plants, scattered trees).F. Bare soil or sandFeatureless landscape of soil or sand cover. Few or no trees.
7. Lightweight low-riseDense mix of single-story buildings. Few or no trees.G. WaterLarge, open water bodies such as seas and lakes, or small bodies such as rivers, reservoirs, and lagoons
8. Large low-riseOpen arrangement of large low-rise buildings (1–3 stories). Few or no trees.
9. Sparsely builtSparse arrangement of small or medium-sized buildings in a natural setting. Abundance of pervious land cover.
10. Heavy industryLow-rise and midrise industrial structures (towers, tanks, stacks). Few or no trees.
Table 2. Classification of the sample locations according to their local climate zones (LCZ) type. Altered locations indicated the transition year.
21 Stable Locations9 Altered Locations
LCZ TypeSample LocationLCZ Type TransformationTransition YearSample Location
2. Compact midrise6, 13B-A1998–20017
4. Open high-rise15C-G2006–200920
5. Open midrise14, 19, 28C-52002–200729
6. Open low-rise16, 30D-81998–200117
8. Large low-rise18D-B199424
9. Sparsely built21, 27F-81998–20011
A. Dense trees9F-61998–20014
B. Scattered trees11, 22F-42004–201110
D. Low plants2, 5, 23, 26F-E1998–200112
E. Paved25
F. Bare soil3
G. Water8
Table 3. Sensor, activity time, and equatorial crossing time (ECT) for each Landsat satellite used.
SatelliteSensorSpatial ResolutionTemporal ResolutionActivityE.C.T 1
Landsat 5TM, Thematic Mapper30 m16 days1984–20139:45 a.m.
Landsat 7ETM+, Enhanced Thematic Mapper Plus30 m16 days1999–active10:00 a.m.
Landsat 8OLI, Operational Land Imager
TIRS, Thermal Infrared Sensor
30 m
100 m
16 days2013–active10:00 a.m.
1 ±15 min.
Table 4. Validation statistics of land surface temperature (LST) with air temperature (Tair) root mean square error (RMSE), Spearman correlation coefficients, and height of the in situ sensors.
StationRMSE (°C)Spearman CorrelationHeight (m)
1. Alegría10.540.8764.5
2. Arkaute8.860.8901.7
4. Gasteiz9.880.8996.2
5. Abetxuko7.810.8741.4
Table 5. Altered locations with their respective local climate zone (LCZ) and years of transitions, median summer land surface temperature (LST) for each period, and the significance value of the t-test, applied for both periods of each location.
Altered LocationsLCZ Type TransformationTransition YearsMedian LST (°C)Difference Significance (t-test)
P1LCZF199834.280.033
LCZ8200137.61
P4LCZF199833.970.003
LCZ6200136.97
P7LCZB200229.430.922
LCZA29.43
P10LCZF200433.870.192
LCZ4201135.59
P12LCZF199834.68<0.001
LCZE200141.32
P17LCZD199832.47<0.001
LCZ8200140.05
P20LCZC200627.410.829
LCZG200926.91
P24LCZD199426.650.99
LCZB26.87
P29LCZC200234.860.078
LCZ5200736.63
Disclaimer/Publisher’s Note: The statements, opinions and data contained in all publications are solely those of the individual author(s) and contributor(s) and not of MDPI and/or the editor(s). MDPI and/or the editor(s) disclaim responsibility for any injury to people or property resulting from any ideas, methods, instructions or products referred to in the content.