Article

Anomaly Detection in Pedestrian Walkways for Intelligent Transportation System Using Federated Learning and Harris Hawks Optimizer on Remote Sensing Images

by
Manal Abdullah Alohali
1,
Mohammed Aljebreen
2,
Nadhem Nemri
3,
Randa Allafi
4,
Mesfer Al Duhayyim
5,*,
Mohamed Ibrahim Alsaid
6,
Amani A. Alneil
6 and
Azza Elneil Osman
6
1
Department of Information Systems, College of Computer and Information Sciences, Princess Nourah bint Abdulrahman University, P.O. Box 84428, Riyadh 11671, Saudi Arabia
2
Department of Computer Science, Community College, King Saud University, P.O. Box 28095, Riyadh 11437, Saudi Arabia
3
Department of Information Systems, College of Science & Art at Mahayil, King Khalid University, Abha 61421, Saudi Arabia
4
Department of Computers and Information Technology, College of Sciences and Arts, Northern Border University, Arar 91431, Saudi Arabia
5
Department of Computer Science, College of Computer Engineering and Sciences, Prince Sattam bin Abdulaziz University, Al-Kharj 16273, Saudi Arabia
6
Department of Computer and Self Development, Preparatory Year Deanship, Prince Sattam bin Abdulaziz University, Al-Kharj 16273, Saudi Arabia
*
Author to whom correspondence should be addressed.
Remote Sens. 2023, 15(12), 3092; https://doi.org/10.3390/rs15123092
Submission received: 25 February 2023 / Revised: 1 May 2023 / Accepted: 1 June 2023 / Published: 13 June 2023
(This article belongs to the Special Issue Remote Sensing for Intelligent Transportation Systems in Smart Cities)

Abstract

:
Anomaly detection in pedestrian walkways is a vital research area that uses remote sensing, which helps to optimize pedestrian traffic and enhance flow to improve pedestrian safety in intelligent transportation systems (ITS). Engineers and researchers can formulate more potential techniques and tools with the power of computer vision (CV) and machine learning (ML) for mitigating potential safety hazards and identifying anomalies (i.e., vehicles) in pedestrian walkways. The real-world challenges of scenes and dynamics of environmental complexity cannot be handled by the conventional offline learning-based vehicle detection method and shallow approach. With recent advances in deep learning (DL) and ML areas, authors have found that the image detection issue ought to be devised as a two-class classification problem. Therefore, this study presents an Anomaly Detection in Pedestrian Walkways for Intelligent Transportation Systems using Federated Learning and Harris Hawks Optimizer (ADPW-FLHHO) algorithm on remote sensing images. The presented ADPW-FLHHO technique focuses on the identification and classification of anomalies, i.e., vehicles in the pedestrian walkways. To accomplish this, the ADPW-FLHHO technique uses the HybridNet model for feature vector generation. In addition, the HHO approach is implemented for the optimal hyperparameter tuning process. For anomaly detection, the ADPW-FLHHO technique uses a multi deep belief network (MDBN) model. The experimental results illustrated the promising performance of the ADPW-FLHHO technique over existing models with a maximum AUC score of 99.36%, 99.19%, and 98.90% on the University of California San Diego (UCSD) Ped1, UCSD Ped2, and avenue datasets, respectively. Therefore, the proposed model can be employed for accurate and automated anomaly detection in the ITS environment.

1. Introduction

Currently, the easy-to-use unmanned remote sensing vehicles (UAVs) and the availability of low-cost image acquisition systems have made remote sensing imaging (RSI) more popular and convenient [1]. It has become possible to obtain a wide range of high-quality RSI without a considerable amount of time and elaborate planning. The RSI has been adopted in several tasks, namely precision agriculture, cartography, urban studies, and landscape archaeology for over a decade [2]. One effective implementation is to classify and detect the vehicle in RSI. It is progressively adopted to smart transportation for traffic flow estimation, parking space allocation, vehicle identification, and so on. Hence, it is the future trend to use RSI for vehicle and transportation-related applications [3]. Over the past years, vehicle identification in RSI has been extensively used in several fields and thus attracted considerable interest. Despite the serious amount of effort dedicated to these tasks, the current method still requires significant expansion to overcome these problems [4]. Firstly, direction and scale variability makes it highly challenging to precisely locate the vehicle object. Next, complex backgrounds rise interclass similarity and intraclass variability. At last, some RSI is captured in a lower resolution, which can lead to lacking an abundant detailed appearance for distinguishing vehicles from similar objects. As compared with each image of the vehicle [5], the RSI captured from the perpendicular perspective lose the ‘face’ of the vehicle, and the vehicle commonly shows a rectilinear structure. Therefore, the presence of non-vehicle rectilinear objects such as electrical units and trash bins can complicate the task of air conditioning units on the top of buildings, which causes several false alarms [6]. Thus, researchers are trying to employ contemporary DL-based object detection methods to push the boundary of triumph in these regards.
With the latest improvements in machine learning (ML) approaches, we are now capable of achieving higher object detection rates in cluttered scenes [7]. ML is a subfield of artificial intelligence (AI) that focuses on the design of algorithms and statistical models, which allows computers to learn and make predictions without being explicitly programmed. The detection and classification of vehicles using aerial images become more realistic with deep neural networks (DNN). The technique for vehicle detection using aerial images is categorized into two classes, the traditional ML approaches and the DL methods [8]. DL for computer vision (CV) grows more conventional every year, particularly due to Convolutional Neural Networks (CNN) that are capable of learning expressive and powerful descriptors from an image for a great number of tasks: detection, classification, segmentation, and so on [9]. This ubiquity of CNN in CV is now beginning to affect remote sensing, as they could address several tasks such as object detection or land use classification in RSI. Furthermore, a new architecture has appeared, derived from Fully Convolutional Networks (FCN) [5], capable of outputting dense pixel-wise annotation and therefore capable of achieving fine-grained classification. Federated learning (FL) is an ML approach that trains the model using multiple independent sessions. In contrast, the classical centralized ML model, where local datasets are combined into one training session, considers that local data samples can be identically distributed. FL allows many actors for building a common, robust ML approach with no data distribution, thus resolving challenging problems such as data privacy, data security, data access rights, and access to heterogeneous data.
Javadi et al. [10] examined the capability of 3D mapping features for improving the efficiency of DNN for vehicle detection. Charouh et al. [11] presented a structure for reducing the complexity of CNN-oriented AVS approaches, whereas a BS-related element was established as a pre-processing stage for optimizing the count of convolutional functions implemented by the CNN component. A CNN-based detector with a suitable count of convolutions was executed for all the image candidates for handling the overlapping issue and enhancing detection efficiency. In [12], emergency vehicle detection (EVD) for police cars, fire brigades, and ambulances is performed dependent upon its horn sounds. A database in Google Audioset ontology has gathered and extracted features by Mel-frequency Cepstral Coefficient (MFCC). The three DNN approaches such as CNN, dense layer, and RNN, with distinct configurations and parameters, are examined. Afterwards, an ensemble approach was planned with better-chosen methods and executing experimental testing on several configurations with hyperparameter tuning. The authors in [13] examined a model for vehicle detection in multi-modal aerial imagery through an improved YOLOv3 and DNN, which behaviours mid-level fusion. The presented mid-level fusion structure is a primary of its type that is utilized for detecting vehicles in multi-modal aerial imagery using a hierarchical object detection network. Joshi et al. [14] presented the EDL-MMLCC method (ensemble of DL-related multimodal land cover classification) utilizing remote sensing images (RSI). In addition, the trained procedure of DL approaches is improved by utilising the hosted cuckoo optimization (HCO) technique. Lastly, the SSA with regularized ELM (RELM) technique was executed for the land cover classifier.
Li et al. [15] presented an anchor-free target detection approach for solving these challenges. Primarily, a multi-attention feature pyramid network (MA-FPN) has been planned for addressing the control of noise and background data on vehicle target recognition by fusing attention data from the feature pyramid network (FPN) infrastructure. Secondly, a more precise foveal area (MPFA) has been presented for providing the best ground truth for the anchor-free process to determine a further precise positive instance selective region. In [16], the authors established a new vehicle detection and classification method for smart traffic observation which utilizes CNN for segmenting UAVs. These segmentation images can be examined to identify the vehicles with incorporated innovative customized pyramid pooling. Lastly, such vehicles can be tracked using Kalman filter (KF), kernelized filter-based approaches for coping with and accomplishing huge traffic flows with lesser human intervention.
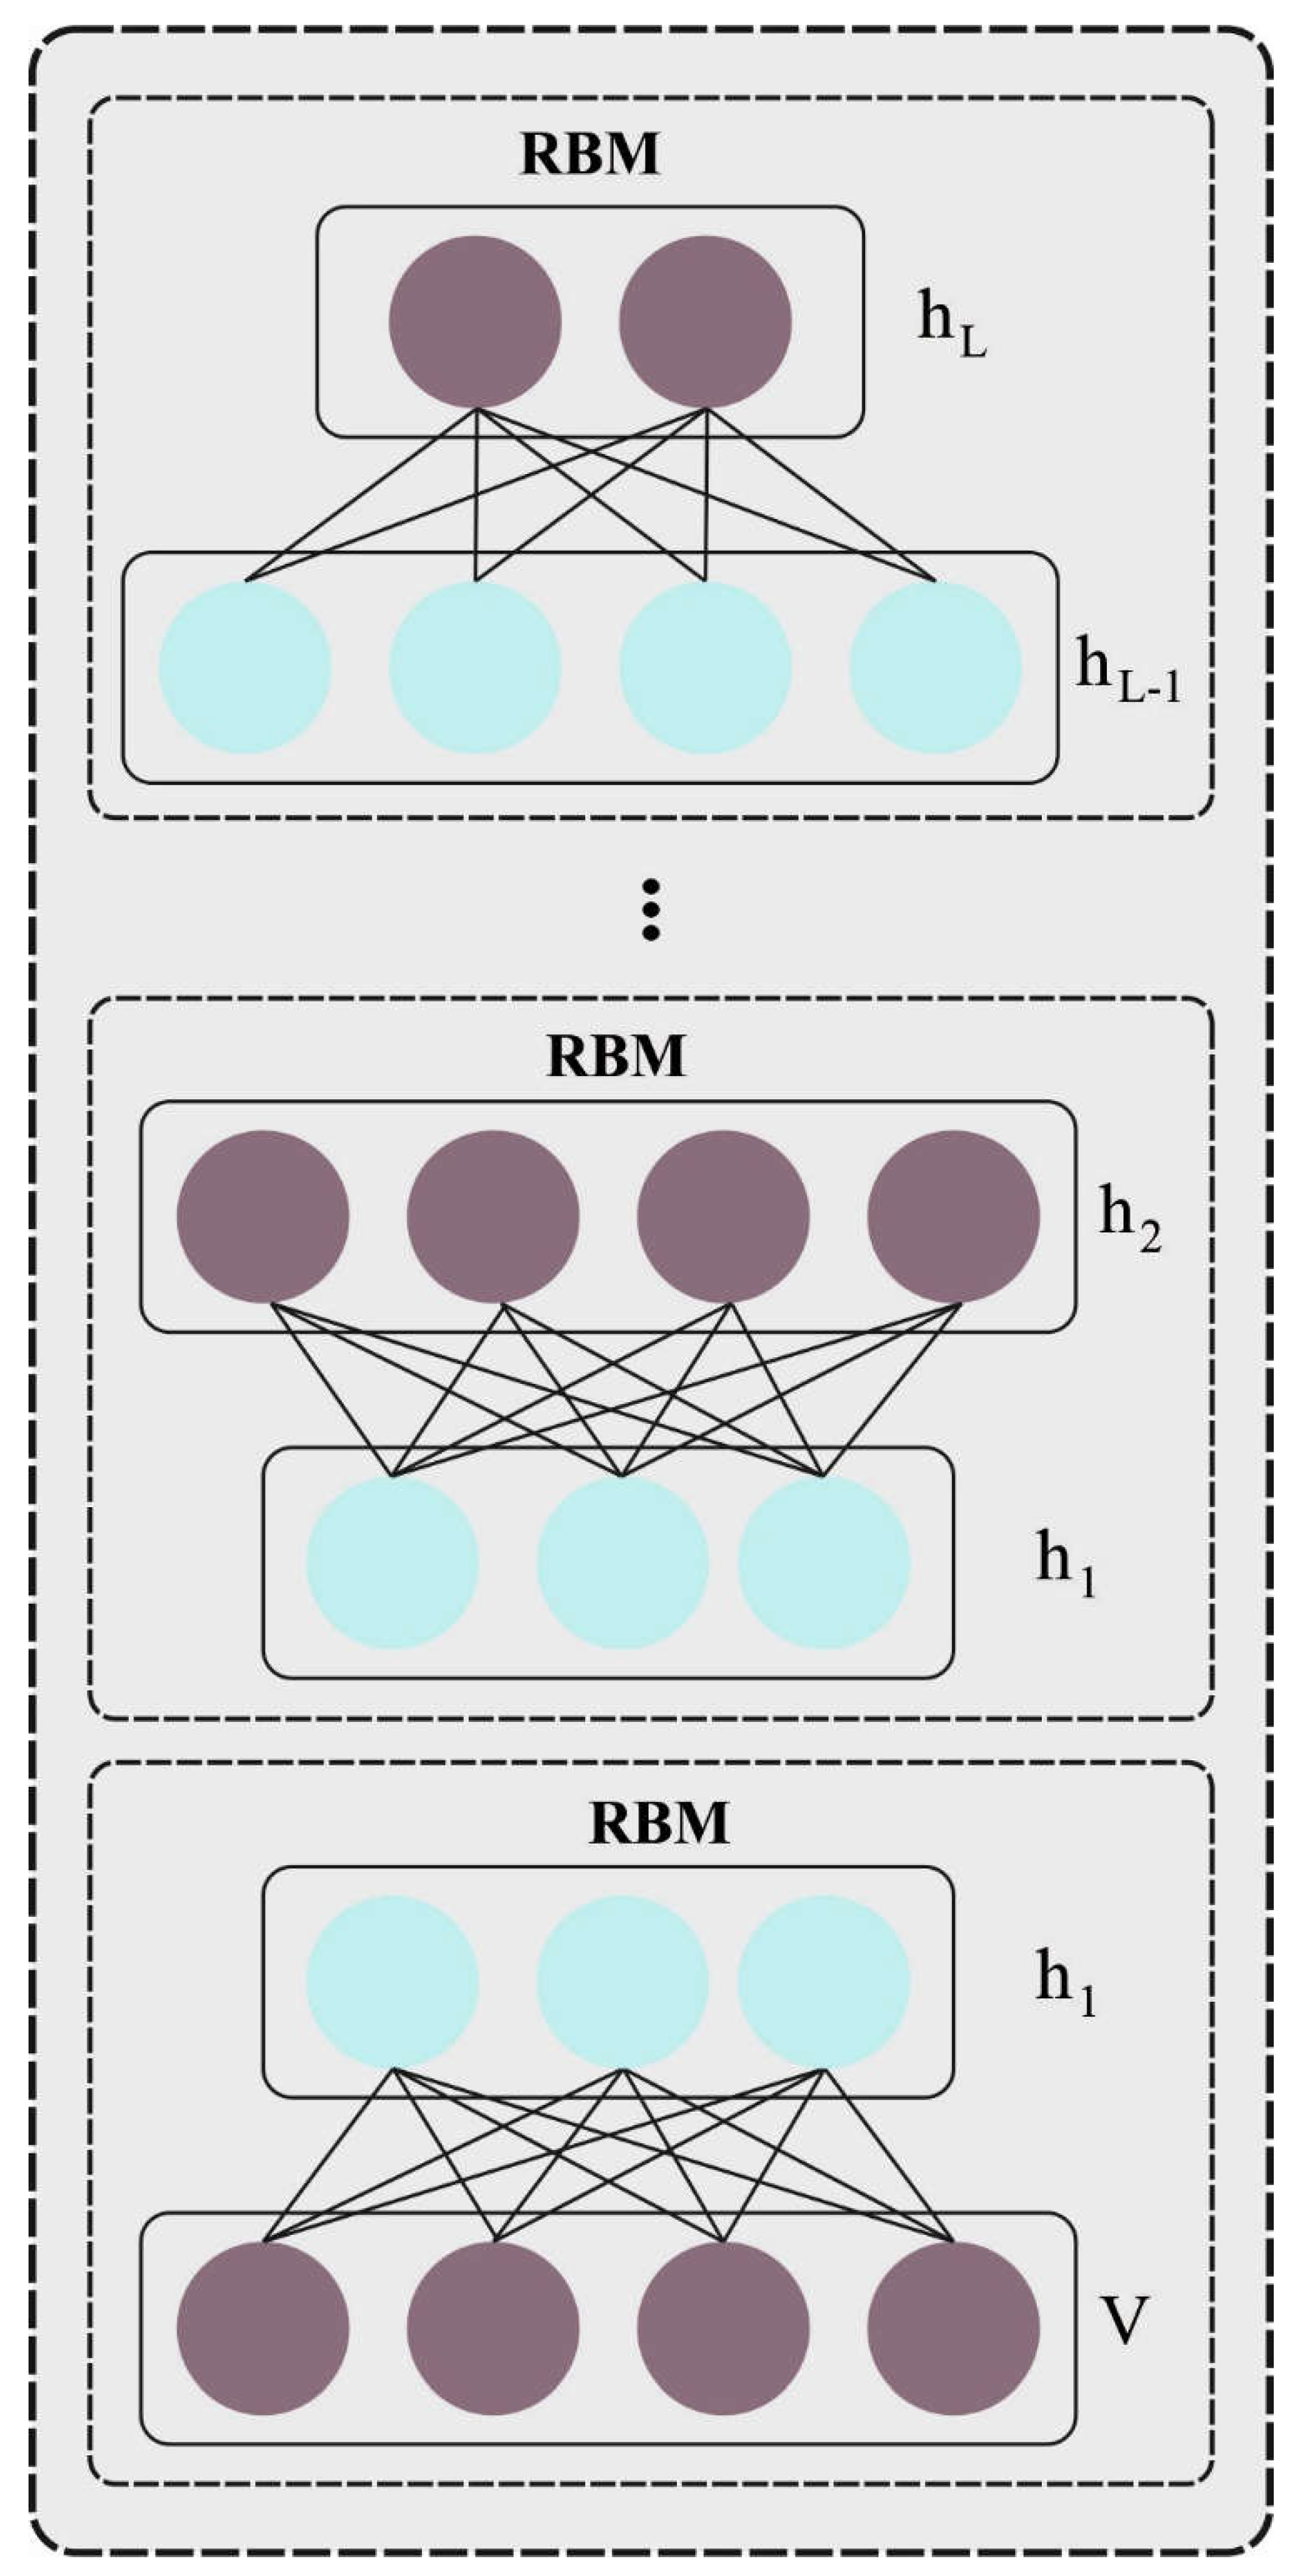
Several models exist in the literature to perform the classification process. Though several ML and DL models for anomaly classification are available in the literature, it is still needed to enhance the classification performance. Owing to the continual deepening of the model, the number of parameters of DL models also increases quickly, which results in model overfitting. At the same time, different hyperparameters have a significant impact on the efficiency of the CNN model. Particularly, hyperparameters such as epoch count, batch size, and learning rate selection are essential to attain an effectual outcome. Since the trial and error method for hyperparameter tuning is a tedious and erroneous process, metaheuristic algorithms can be applied. Therefore, in this work, we employ an HHO algorithm for the parameter selection of the HybridNet model.
This study presents an Anomaly Detection in Pedestrian Walkways for Intelligent Transportation Systems using Federated Learning and Harris Hawks Optimizer (ADPW-FLHHO) algorithm on Remote Sensing Images. The ADPW-FLHHO technique uses the HybridNet model for feature vector generation. In addition, the HHO algorithm is implemented for the optimal hyperparameter tuning process. For anomaly detection, the ADPW-FLHHO technique uses a multi deep belief network (MDBN) model. The experimental results of the ADPW-FLHHO technique can be studied on the UCSD anomaly detection dataset.
The rest of the paper is organized as follows. Section 2 provides the related works and Section 3 offers the proposed model. Then, Section 4 gives the result analysis and Section 5 concludes the paper.

2. Materials and Methods

In this study, a novel ADPW-FLHHO approach was developed for anomaly detection in the pedestrian walkways, to improve the safety of the pedestrians. The presented ADPW-FLHHO technique mainly concentrated on the effectual identification and classification of anomalies, i.e., vehicles in the pedestrian walkways. Figure 1 demonstrates the overall flow of the ADPW-FLHHO algorithm.

2.1. Data Used

The performance of the ADPW-FLHHO technique can be examined under three datasets, namely UCSDPed1 (http://www.svcl.ucsd.edu/projects/anomaly/dataset.htm, accessed on 24 February 2023), UCSDPed2, and avenue dataset (http://www.cse.cuhk.edu.hk/leojia/projects/detectabnormal/dataset.html, accessed on 24 February 2023). Table 1 illustrates the details of the datasets.

2.2. FL Model

Federated learning (FL) is classified into federated transfer learning (FTL), sample-based (horizontal) FL, and feature-based (vertical) FL based on the data distribution amongst different parties [17]. In sample-based or horizontal FL, datasets share a similar feature space but dissimilar sample space (data samples). In feature-based or vertical FL, the dataset shares a similar sample space but varies in feature space. In FTL, the dataset differs in both sample and feature space, which have a smaller intersection. In the presented method, consider a horizontal FL case. A bottom one (decentralized) and a top one (centralized) are the two standard designs of a federated architecture. For centralized design: initially, every partner within the data sharing federation collects local datasets from its data acquisition source (for example, surveillance cameras or vehicle sensors). Next, the raw information is exploited for a local anomaly recognition model that is framed and well-trained with the locally accessible dataset. Then, the local model is periodically synchronized with the cloud server. The failure would disrupt the training method of every client. On the other hand, the bottom of the FL structure does not depend on a central cloud instance, however, it allows to synchronize and direct exchange method parameters between partners. However, both methods are potential and the selected technique may rely on the partner included in a data-sharing federation.

2.3. Feature Extraction Using HybridNet

To derive a set of feature vectors, the Hybrid Net technique is used. For the generation of the visual feature of the input image, the HybridNet model is exploited in the presented study [18]. Overall, classification needs intra-class in-variant features while re-establishment should retain each dataset. HybridNet consists of the unsupervised path ( E u and D u ) and a discriminating path ( E c and D c ) to overcome the limitation. Both E u and E c encoding functions take an x input image and generate h c and h u representations, however, the D c and D u decoding function correspondingly assume h c and h u as an input to create x ^ and x ^ partial reconstruction. Finally, C classification produces a class prediction through discriminating features: y ^ = C ( h c ) . While both paths might have the same structure, they have to do complementary and various roles. The discriminating path should extract the h c discriminating attribute that needs to be crafted well to perform the classifier task and make an x ^ c partial reconstruction that could be precise while maintaining the data. So, the unsupervised path role is corresponding to the discriminating path through p in h u the data lost in h c . Accordingly, it generates x ^ complementary reconstruction, while adding x ^ and x ^ , reconstruction x ^ is close to x , and it can be formulated as follows:
h c = E c x x ^ c = D c h c y ^ = C h c
h u = E u x x ^ u = D u h u x ^ = x ^ c + x ^ u
The ultimate purpose is to perform the process as regularised for discriminating encoding. The key problem and contribution are to develop an approach for ensuring that both paths are performed.
The two most important challenges that are addressed are in the discriminating path to emphasise discriminating features, and that required both paths to contribute and co-operate toward the reconstruction. Two paths that work individually are a reconstruction path x ^ = x ^ u = D ( E ( x ) ) and a classification path y ^ = C E x and x ^ c = 0 . Next, we resolved the problems by using the encoding and decoding function altogether with an accurate training and loss function. The HybridNet method comprises dual data paths in that one creates a class prediction and both create a partial reconstruction that needs to be integrated. In the presented algorithm, we overcome issues of training those structures efficiently. It involves an intermediate reconstruction with L r e c i n t e r b , l (for layer l and branch b ) ; classification with L c l s ; stability with Ω s t a b i l i t y ; and reconstruction with L r e c .
All of these terms are weighted through the parameter λ and it follows the branch complementarity training model.
L = λ c L c l s + λ r L r e c + b ϵ c , u , l λ r b , l L r e c i n t e r b , l + λ s Ω s t a b i l i t y
Every batch was incorporated of n samples, categorized into labelled images n s from D s u p and unlabelled images n u from D u n s u p . HybridNet was trained on the partially labelled dataset, that is labelled pairs D s u p = { x k , y k } k = 1 . N s and unlabelled images D u n s u p = { x ( k ) } k = 1 . . N u . The classification term was a regular cross-entropy term that is exploited on n s labelled instance as follows:
l c l s = l C E ( y ^ , y ) = i y i l o g y ^ , L c l s = 1 n s k l c l s ( y ^ ( k ) , y ( k ) ) .

2.4. Hyperparameter Tuning Using HHO Algorithm

In this work, the HHO technique is applied for the optimal hyperparameter tuning process. HHO was stimulated by the behaviour of Harris Hawks (HHs), which are intellectual birds [19]. Using different states of energy, the fundamental phases of HHO can be obtained. The exploration stage mimics the mechanism if HHs could not exactly locate prey. In that case, the hawk takes a break to locate and track the newest prey. The candidate solution was the hawks in the HHO technique, and the better solution in each step is prey. The hawks arbitrarily perch at the dissimilar location and wait for the prey applying 2 major operators, which are designated according to the q probability, where q < 0.5 specifies that hawks perch at the place of others and the prey (rabbit). The hawks are at an arbitrary position near the population range if q 0.5 . The following are symbols utilized in the algorithm to facilitate the understanding of HHO, is given below:
  • The initial state of energy, escape energy E0, E;
  • Vector of hawks location (search agent) Xi;
  • Location of Rabbit (better agent) Xrabbit;
  • Location of a random Hawk Xrand;
  • Hawks average location Xm;
  • The maximal amount of iterations, swarm size, iteration counter T, N, t 6. Random integers lie within (0,1)r1, r2, r3, r4, r5, q;
  • Dimension, upper and lower boundaries of parameters, D, LB, UB.
The exploration stage is represented below:
X t + 1 = X r a n d t r 1 X r a n d t 2 r 2 X t q 0.5 X r a b b i t t X m t r 3 L B + r 4 U B L B q < 0.5
The average location of the X m hawks can be shown as:
X m t = 1 N i = 1 N X i t
where X ( t ) denotes the location in the iteration for t Hawk and N symbolizes the overall amount of hawks. The average location was effectuated by applying dissimilar techniques. An effective changeover from exploration to exploitation was needed; herein a shift was predictable among the exploitative behaviour by using escaping energy factor E of prey, which drastically minimizes escaping behaviours. The prey energy is calculated using the following equation:
E = 2 E 0 1 t T
where E 0 denotes the initial escape energy and T characterizes the greatest amount of iterations, correspondingly. The soft besiege was a crucial stage in HHO, it can be displayed if r 0.5 and | E | 0.5 . In such scenarios, the rabbit has adequate energy. The rabbit performs a random misleading shift to escape, but still, in metaphor, it could not. These steps are determined by the following rules:
X t + 1 = Δ X t E J X r a b b i t t X t
Δ X t = X r a b b i t t X t
where Δ X ( t ) denotes the different location vector for each rabbit and for a current position at t iteration, and J = 2 ( 1 r 5 ) is the spontaneous jumping ability of the rabbit all over the escaping stage. The J value varies arbitrarily in every iteration for representing rabbit behaviours. In the extreme siege phase, if r 0.5 and | E | < 0.5 , then the prey was tired and had no escape energy. The HHs were barely encircling the trained prey and attacked them. For these cases, the existing location is changed by Equation (8):
X t + 1 = X r a b b i t t E Δ X t
Assume the hawks’ behaviour, they gradually select the better dive for prey if they capture the prey in a competitive situation:
Y = X r a b b i t t E J X r a b b i t t X t
The soft besiege given in the prior Equation (9) was implemented in progressive speedy dives just if | E | 0.5 but r < 0.5 . In such cases, the rabbit has enough energy for escaping and can be exploited for a soft siege beforehand so an attack comes as a surprise. The HHO model has diverse paradigms of escape for prey and leap frog movements. Here, the Lévy flights (LF) are developed for emulating the different movements of the rabbit dives and Hawk.
Z = Y + S × L F D
where S signifies the random vector of 1 × D size and LF indicates the Lévy flight function, utilizing Equation (11):
L F x = 0.01 × u × σ | ν | 1 β , σ = Γ 1 + β × sin π β 2 Γ 1 + β 2 × β × 2 β 1 2 1 β
where, u , and v indicate the random value within ( 0,1 ) , and β symbolizes the default constant fixed to 1.5. The last stage was to upgrade the location of hawks using:
X t + 1 = y i f F Y < F X t Z i f F Z < F X t
In Equation (12), y and Z are calculated using Equations (7) and (8). In progressive quick dives, HHO was hard-pressed, if | E | < 0.5 and r < 0.5 . Now, the rabbit does not have enough strength to escape and the hard siege is recommended before the surprise attack is made to kill and catch prey. Here, hawks seek to drop the distance between the average position and prey:
X t + 1 = Y i f F Y < F X t Z i f F Z < F X t
where y and Z values are proposed based on the new rules in Equations (14) and (15), where X ( t ) can be attained.
Y = X r a b b i t t E J x r a b b i t t X m t
Z = Y + S × L F D
Fitness selection is a crucial factor in the HHO approach. Solution encoding is exploited for assessing the aptitude (goodness) of the candidate solution. Now, the accuracy value is the main condition utilized for designing a fitness function.
F i t n e s s = m a x P
P = T P T P + F P
where TP represents the true positive and FP denotes the false positive value.

2.5. MDBN-Based Classification

For anomaly detection, the ADPW-FLHHO technique used the MDBN model. RBM comprises a visible layer (VL) and a hidden layer (HL). The VL has been responsible for input, and HL learns higher-level semantic features in the input dataset [20]. The visible and hidden units can be binary variables with a state of 0 or 1. An entire network refers to a bipartite graph, and there is no connecting edge in the VL/HL that occurs among the visible unit v = [ v 1 , , v m , , v k ] and hidden unit h = [ h 1 , , h m , , h k ] . The parameter of RBM is altered to the suitable values for avoiding the local optimum solution. A strong-feature learning capability called RBM is utilized to extract the data. However, the efficiency of FE or RBM has been restricted once it can be executed on difficult non-linear data. For improving the representation capability of a single RBM, the DBN approach has been introduced by stacking several RBMs altogether. Therefore, the DBN search for a deep hierarchical representation of trained instances. The 2 neighbouring layers of DBN are assumed as a single RBM. The greedy layer-wise unsupervised learning trains all the RBMs, and RBM could not assume other RBM in their learning procedure. Figure 2 showcases the framework of the DBN technique.
For extracting deep features to all the classes in remote sensing images, a multi-DBN infrastructure is planned for the complete extraction of the data from all the classes. The first to ( L 1 ) -th layer in MMDBN relates to multi-DBN infrastructure. Based on the HSI properties, Gaussian distribution has been established to model inputs that recognize real-valued RBM rather than binary RBM. The conditional probability distribution and energy function can be determined as:
E v , h ; θ = m = 1 ( v m i b m i ) 2 2 ( σ m i ) 2 n = 1 a n i h n i m = 1 n = 1 w m n i v m i σ m i h n i
P h n i v i ; θ
w m n i σ m i ) 2
where σ i denotes standard deviation, and N ( μ , σ 2 ) implies Gaussian distribution with variance σ and mean μ .
The MDBN framework feature extraction in the perspective of DL and the feature attained in the ( L 1 ) -th layer comprise deep abstract data for the hyperspectral dataset. For improving the discriminative ability of extraction features, MMDBN searches manifold infrastructure in HSI utilizing label data.

3. Results

Figure 3 exhibits the accuracy of the ADPW-FLHHO technique during the training and validation process on the UCSDPed1 dataset. The figure specifies that the ADPW-FLHHO technique reaches higher accuracy values over increasing epochs. As well, the increasing validation accuracy over training accuracy displays that the ADPW-FLHHO approach learns efficiently on the UCSDPed1 dataset.
The loss analysis of the ADPW-FLHHO technique at the time of training and validation is seen on the UCSDPed1 dataset in Figure 4. The results indicate that the ADPW-FLHHO technique reaches closer values of training and validation loss. The ADPW-FLHHO technique learns efficiently on the UCSDPed1 dataset.
Figure 5 examines the accuracy of the ADPW-FLHHO technique during the training and validation process on the UCSDPed2 dataset. The figure highlights that the ADPW-FLHHO technique reaches increasing accuracy values over increasing epochs. In addition, the increasing validation accuracy over training accuracy exhibits that the ADPW-FLHHO technique learns efficiently on the UCSDPed2 dataset.
The loss analysis of the ADPW-FLHHO technique at the time of training and validation on the UCSDPed2 dataset is shown in Figure 6. The figure points out that the ADPW-FLHHO technique reaches closer values of training and validation loss. The ADPW-FLHHO technique learns efficiently on the UCSDPed2 dataset.
Figure 7 inspects the accuracy of the ADPW-FLHHO method during the training and validation process on the Avenue dataset. The figure highlights that the ADPW-FLHHO technique reaches increasing accuracy values over increasing epochs. In addition, the increasing validation accuracy over training accuracy exhibits that the ADPW-FLHHO approach learns efficiently on the Avenue dataset.
The loss analysis of the ADPW-FLHHO technique at the time of training and validation is given on the Avenue dataset in Figure 8. The figure indicates that the ADPW-FLHHO method reaches closer values of training and validation loss. It is observed that the ADPW-FLHHO technique learns efficiently on the Avenue dataset.

4. Discussion

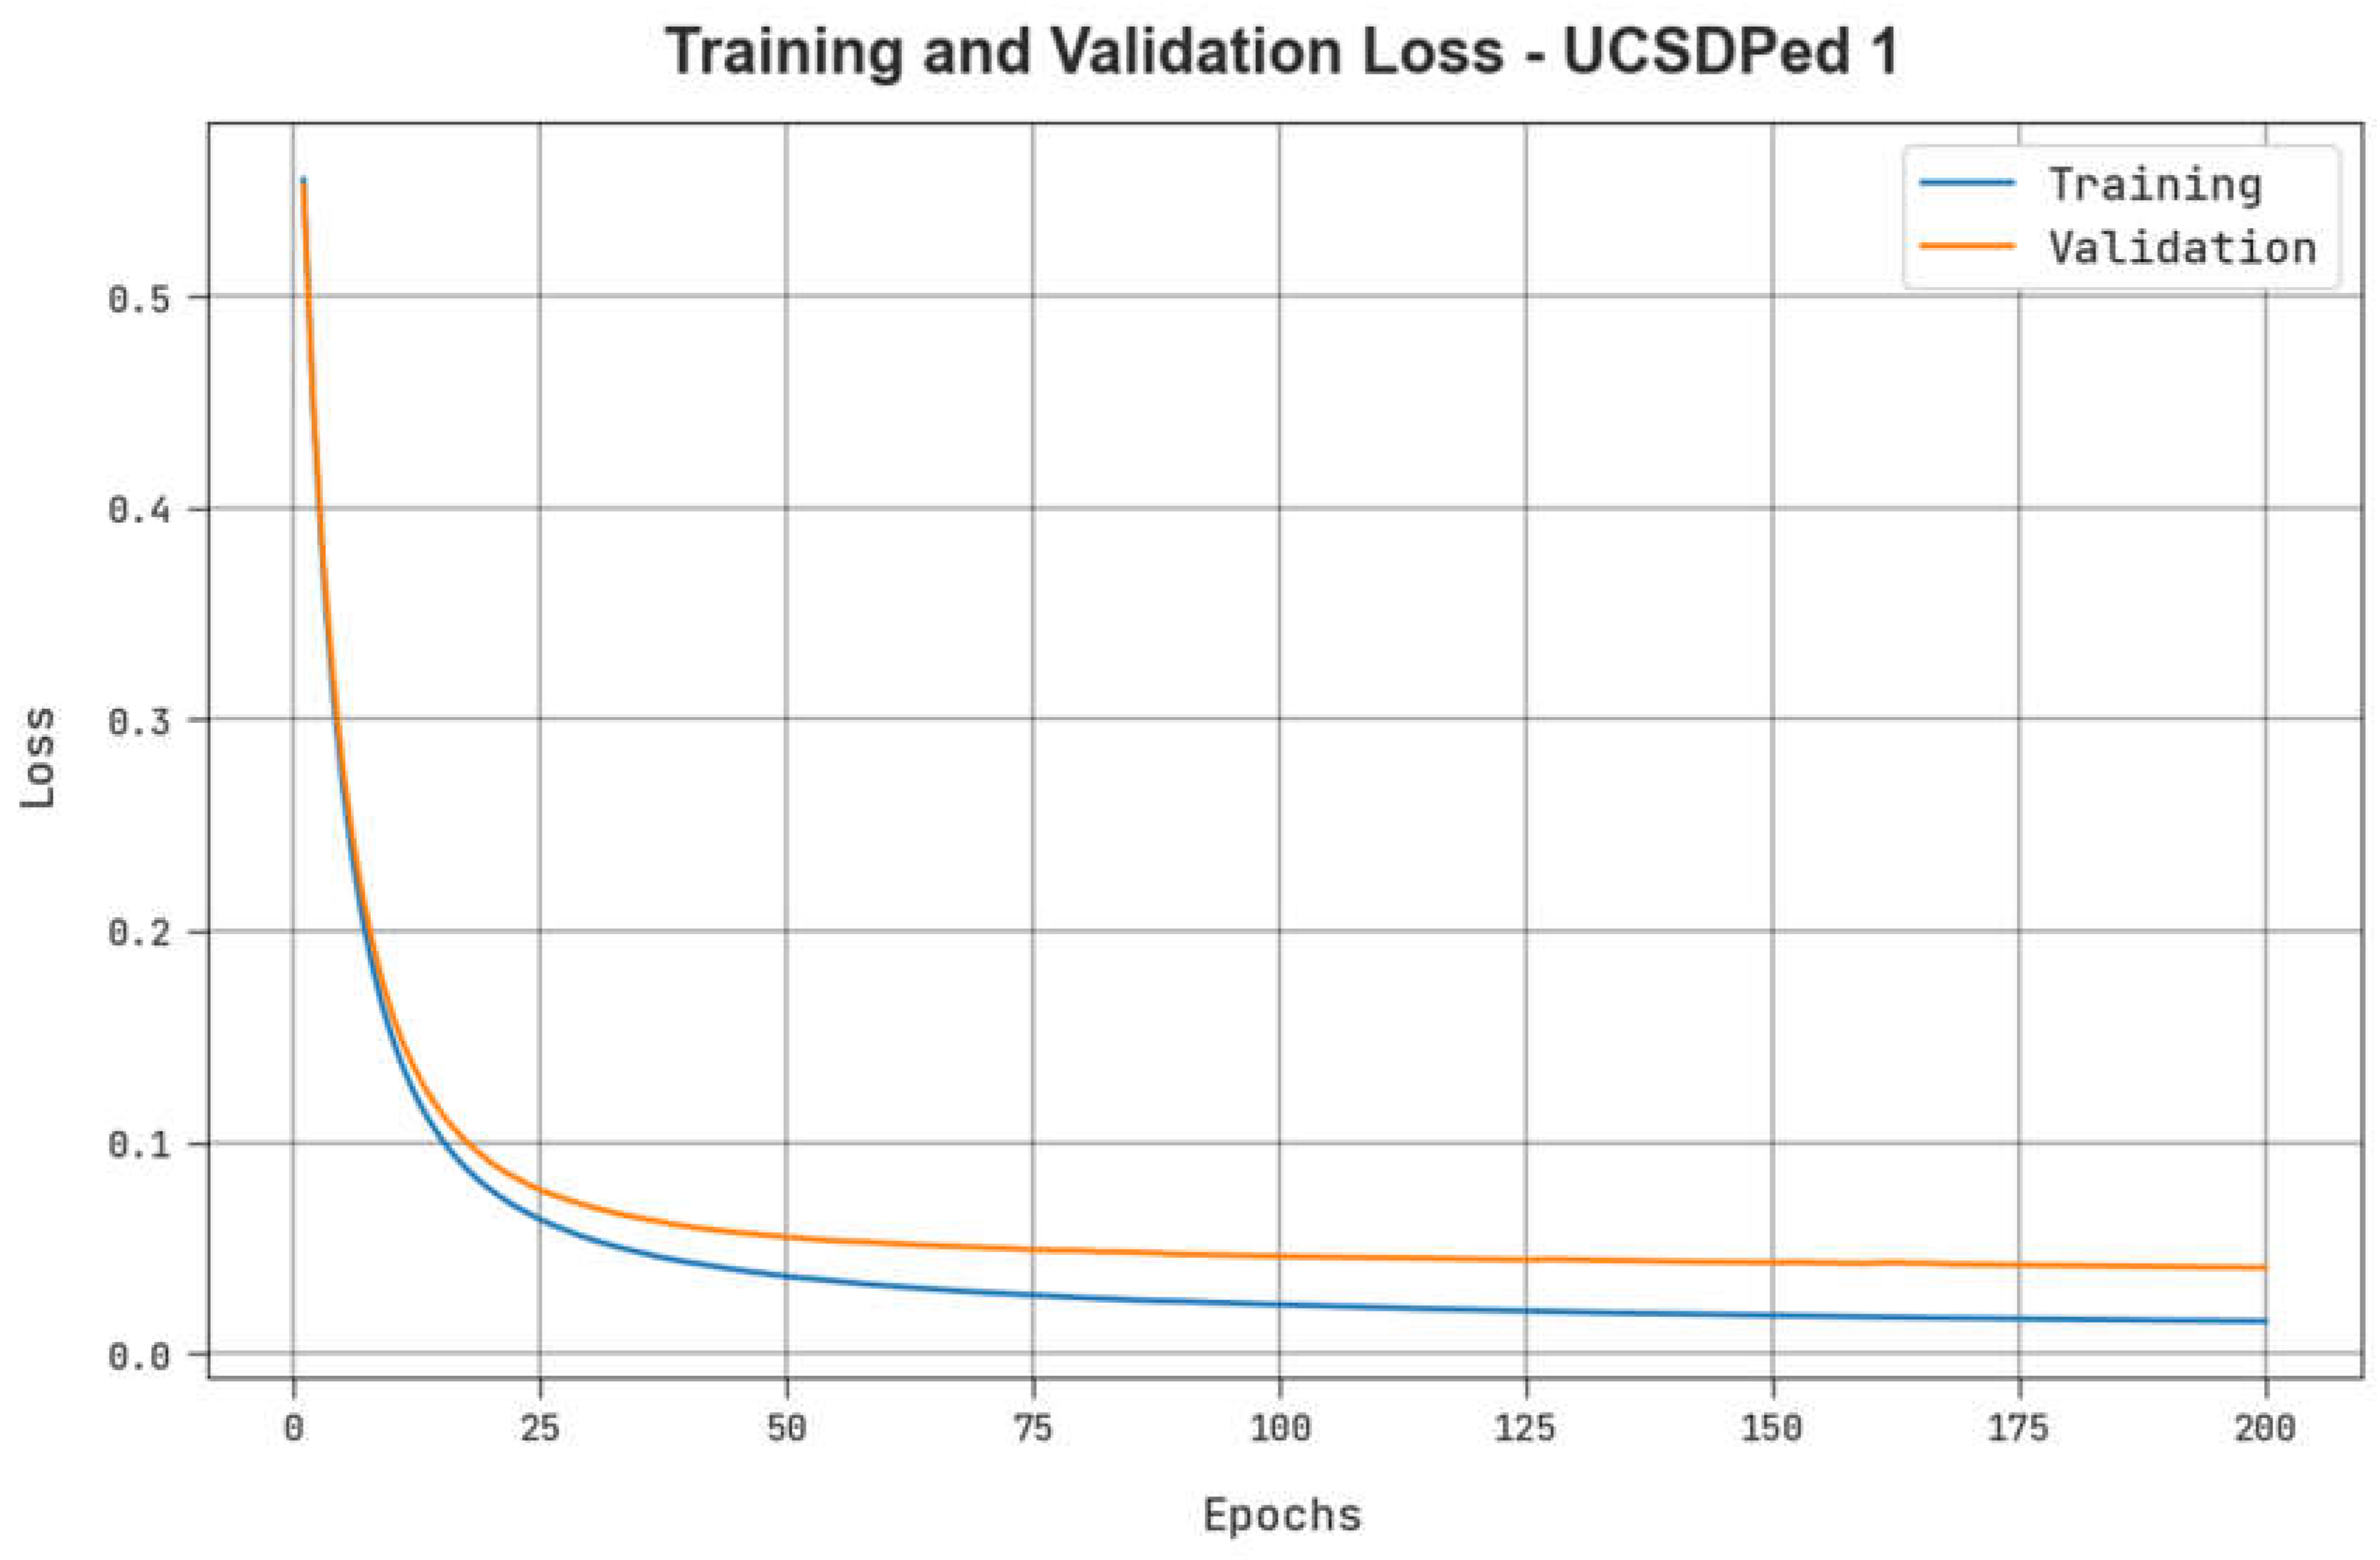
Table 2 illustrates the TPR outcomes of the ADPW-FLHHO technique on the UCSDPed1 dataset. The figure indicates that the values of TPR are raised with an increase in FPR. It is noticed that the MPPCA, SF, and MDT models resulted in the least TPR values while the AMDN model accomplishes certainly boosted TPR values. Contrastingly, the EADN model accomplishes near-optimal performance with reasonable TPR values. Nevertheless, the ADPW-FLHHO technique reaches maximum performance with higher TPR values on the UCSDPed-1 dataset.
Table 3 highlights a comparative A U C s c o r e inspection of the ADPW-FLHHO method with the recent algorithm on the UCSDPed1 dataset [21]. The figure demonstrates the ineffectual outcomes of the TSN-Optical Flow, spatiotemporal, and TSN-RGB models with closer A U C s c o r e of 92.86%, 91.57%, and 90.49%, respectively. Contrastingly, the binary SVM and MIL-C3D models have managed to report a certainly increased A U C s c o r e of 96.73% and 94.99%, respectively. Although the EADN model accomplishes a considerable A U C s c o r e of 98.36%, the ADPW-FLHHO technique ensures its supremacy with a maximum A U C s c o r e of 99.36%.
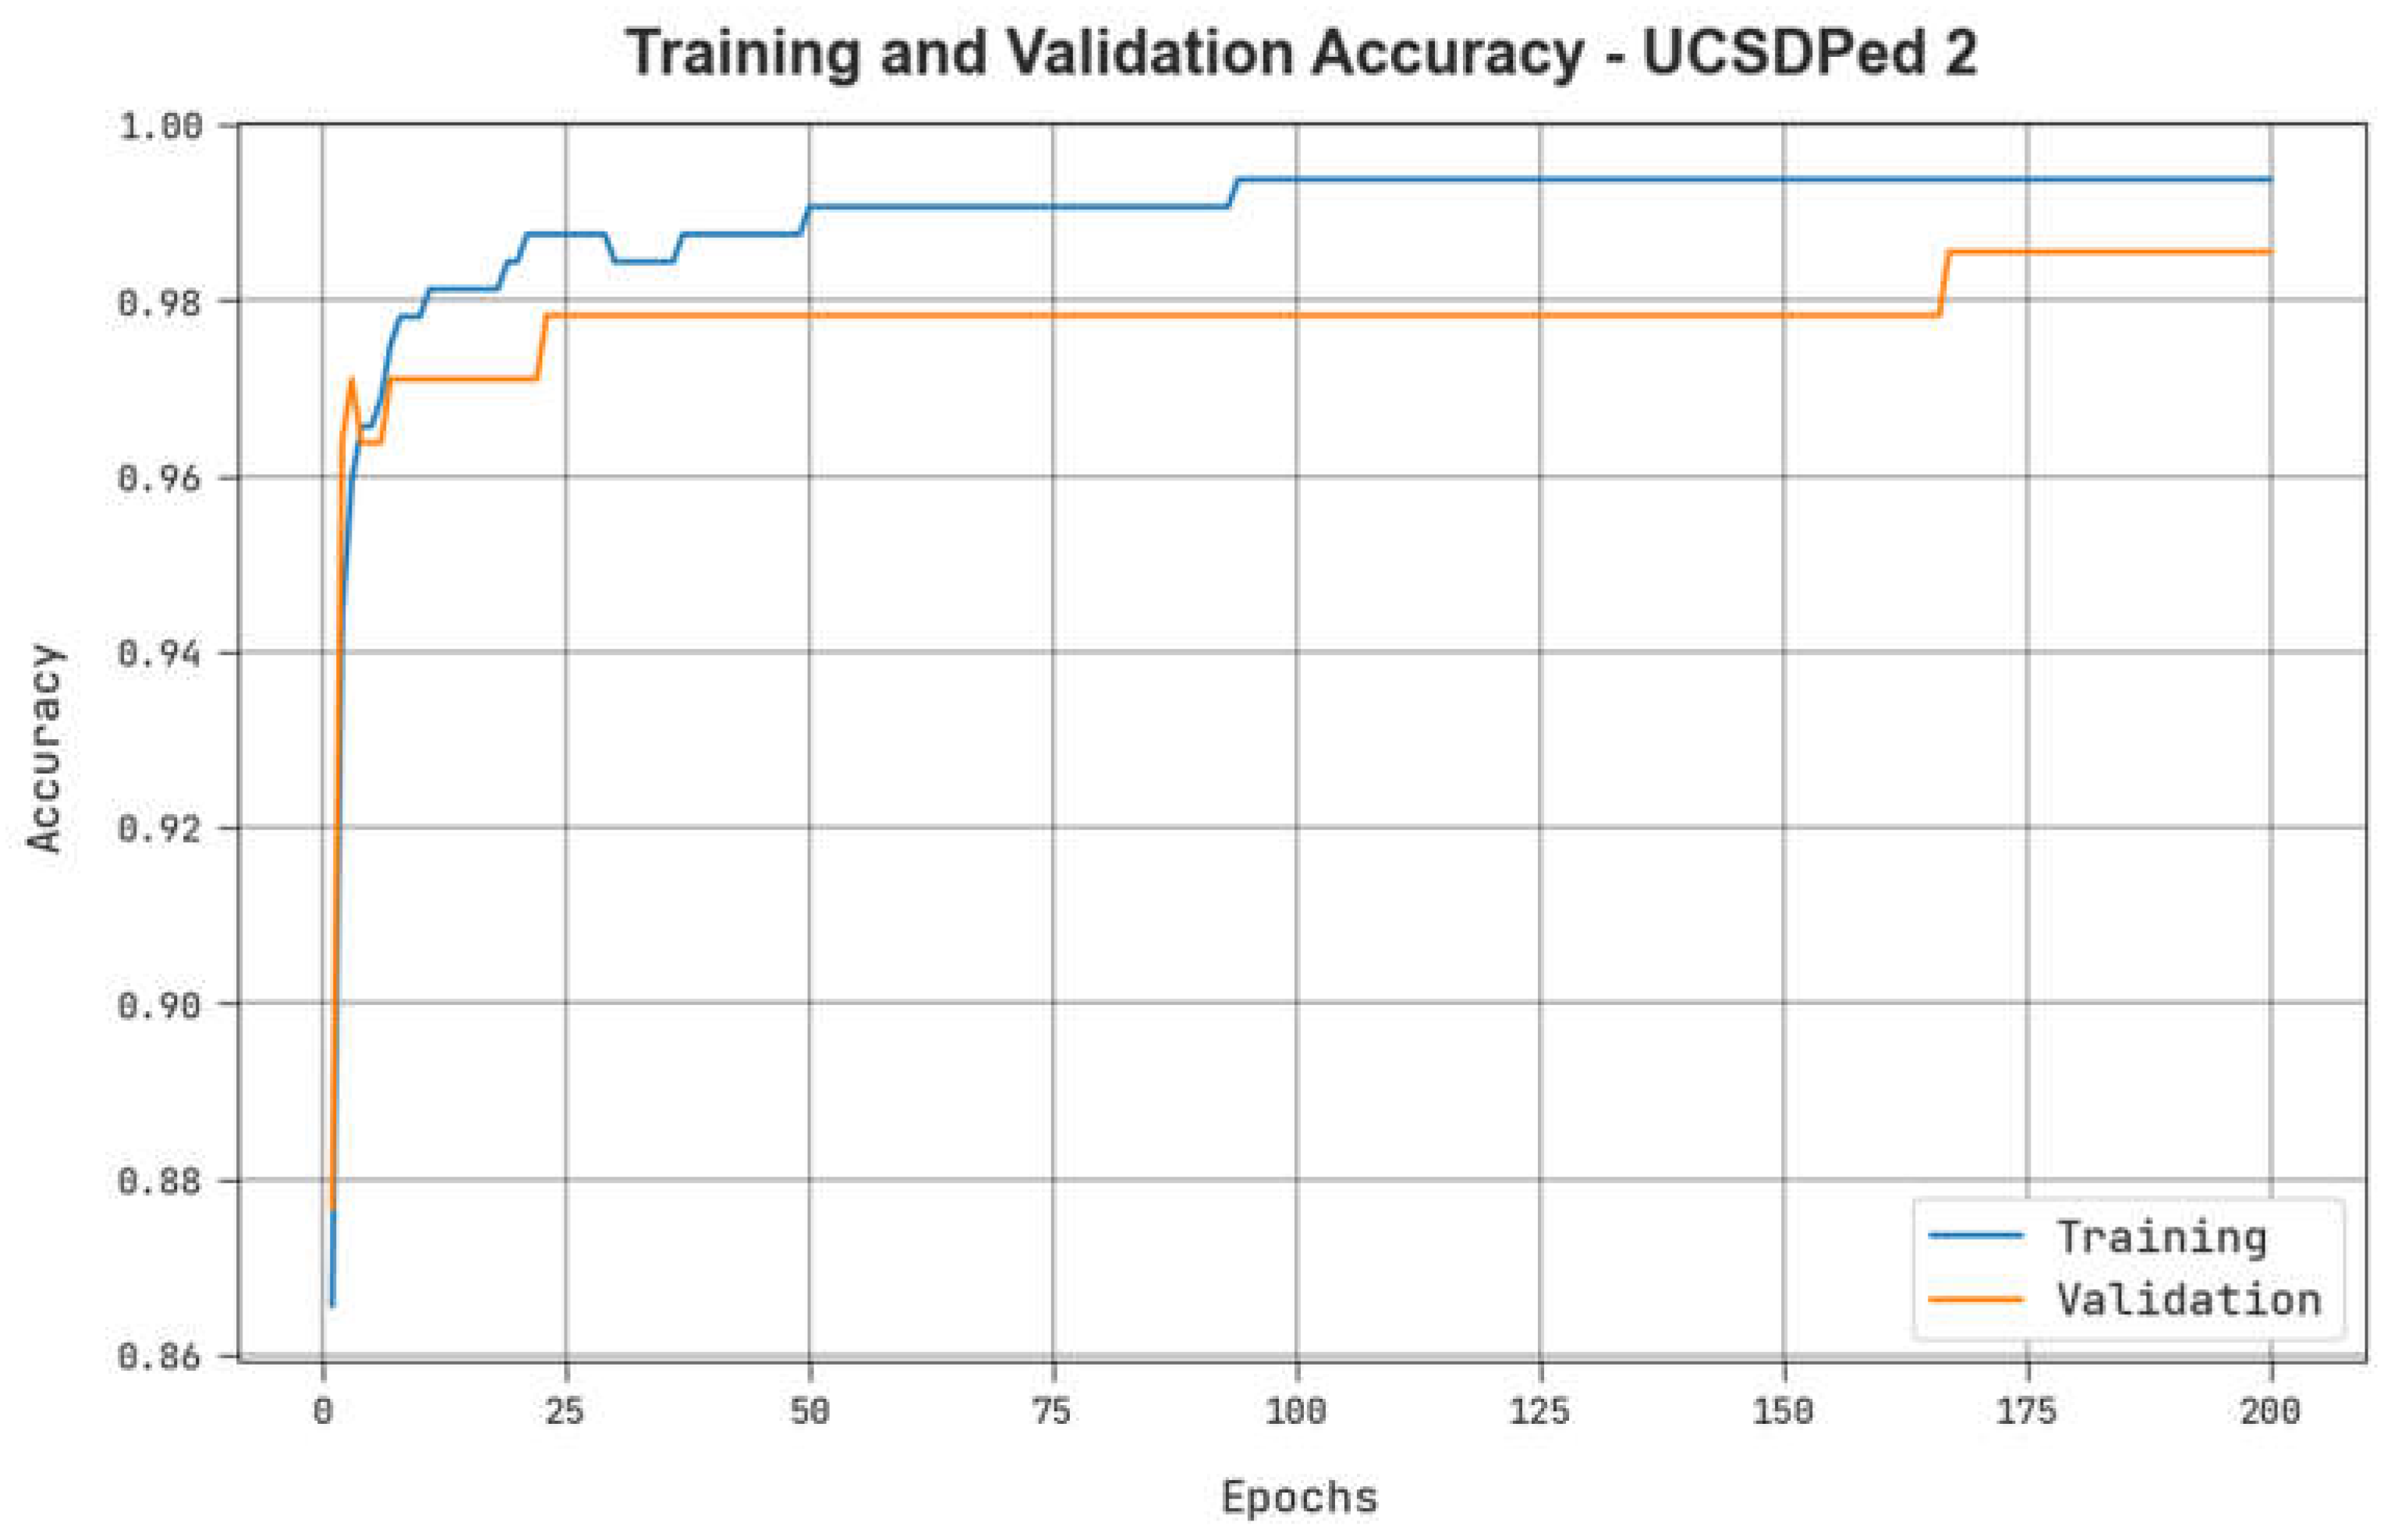
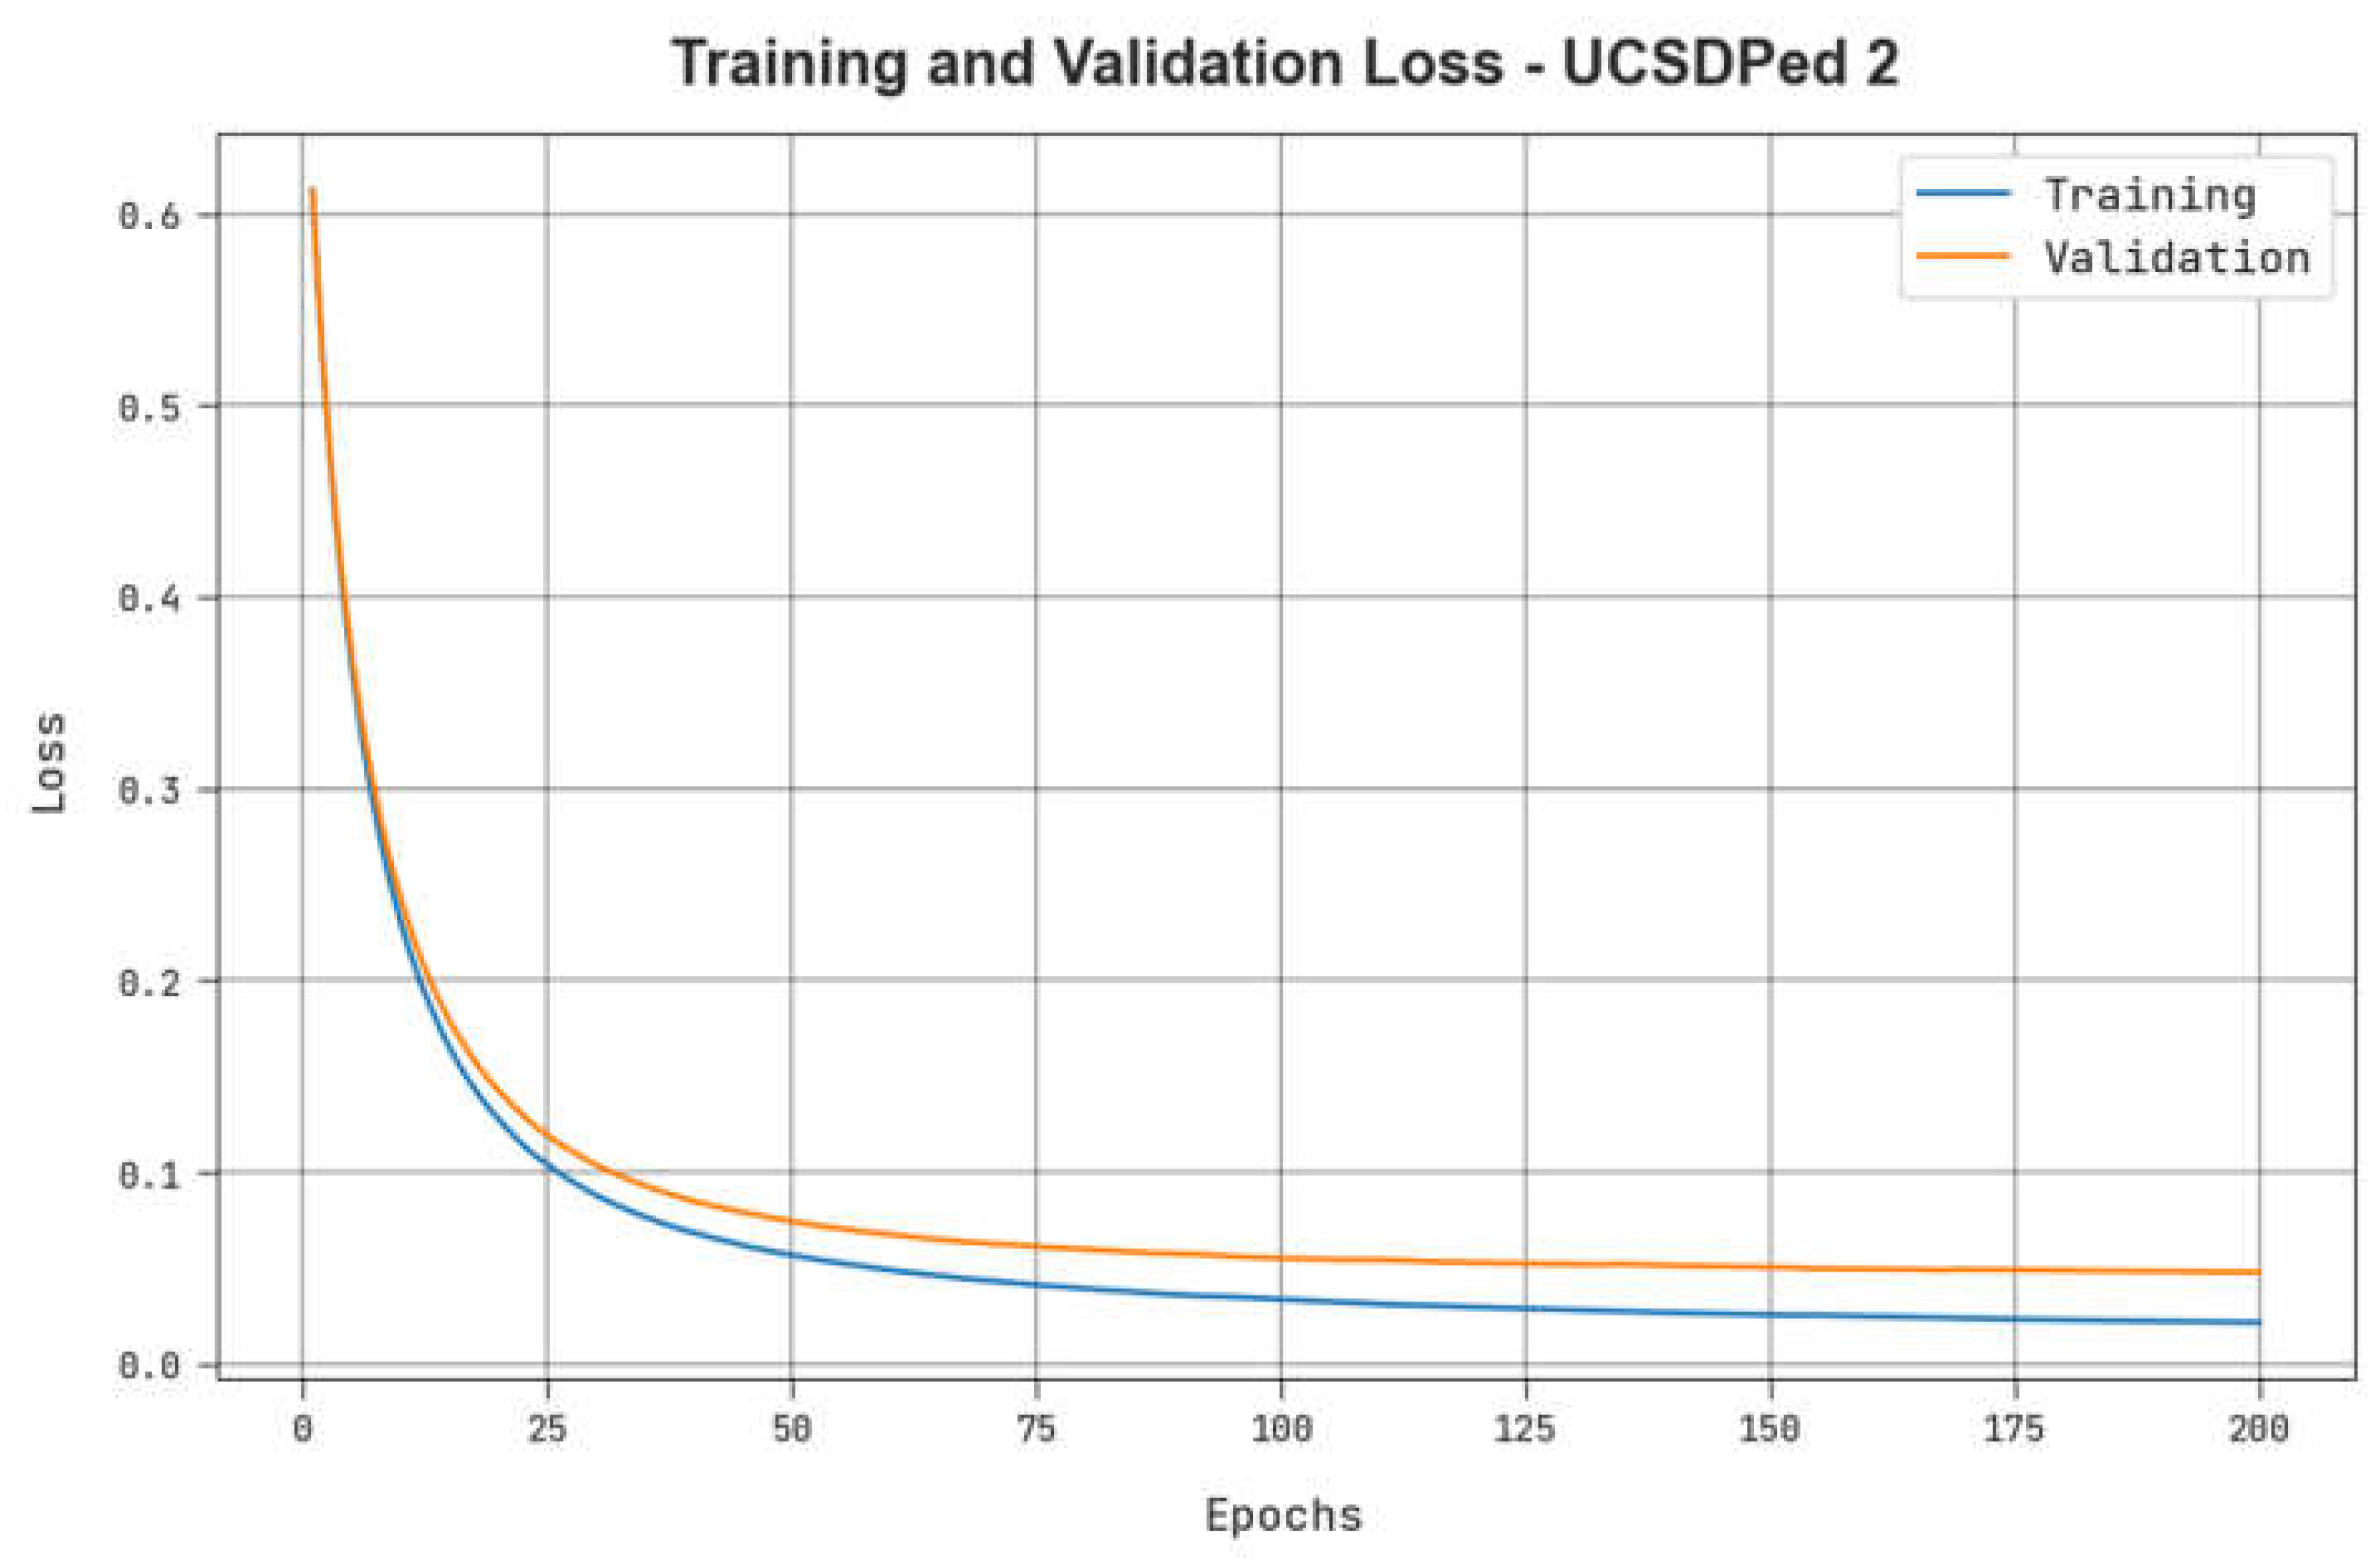
Table 4 reveals the TPR results of the ADPW-FLHHO technique on the UCSDPed2 dataset. The figure indicates that the values of TPR are raised with an increase in FPR. It is noticed that the MPPCA, SF, and MDT models resulted in the lowest TPR values while the AMDN model accomplishes certainly boosted TPR values. In contrast, the EADN model accomplishes near-optimal performance with reasonable TPR values. Nevertheless, the ADPW-FLHHO technique reaches maximum performance with maximum TPR values on the UCSDPed-1 dataset.
Table 5 shows a comparative A U C s c o r e inspection of the ADPW-FLHHO method with recent approaches on the UCSDPed2 dataset. The figure demonstrates the ineffectual outcomes of the TSN-RGB, Spatiotemporal, and TSN-Optical Flow with closer A U C s c o r e of 90.44%, 92.48%, and 94.36%, correspondingly. Contrastingly, the MIL-C3D and Binary SVM models have managed to report a certainly increased A U C s c o r e of 95.5% and 97.16%, correspondingly. Although the EADN technique accomplishes a considerable A U C s c o r e of 98.30%, the ADPW-FLHHO technique ensures its supremacy with a higher A U C s c o r e of 99.19%.
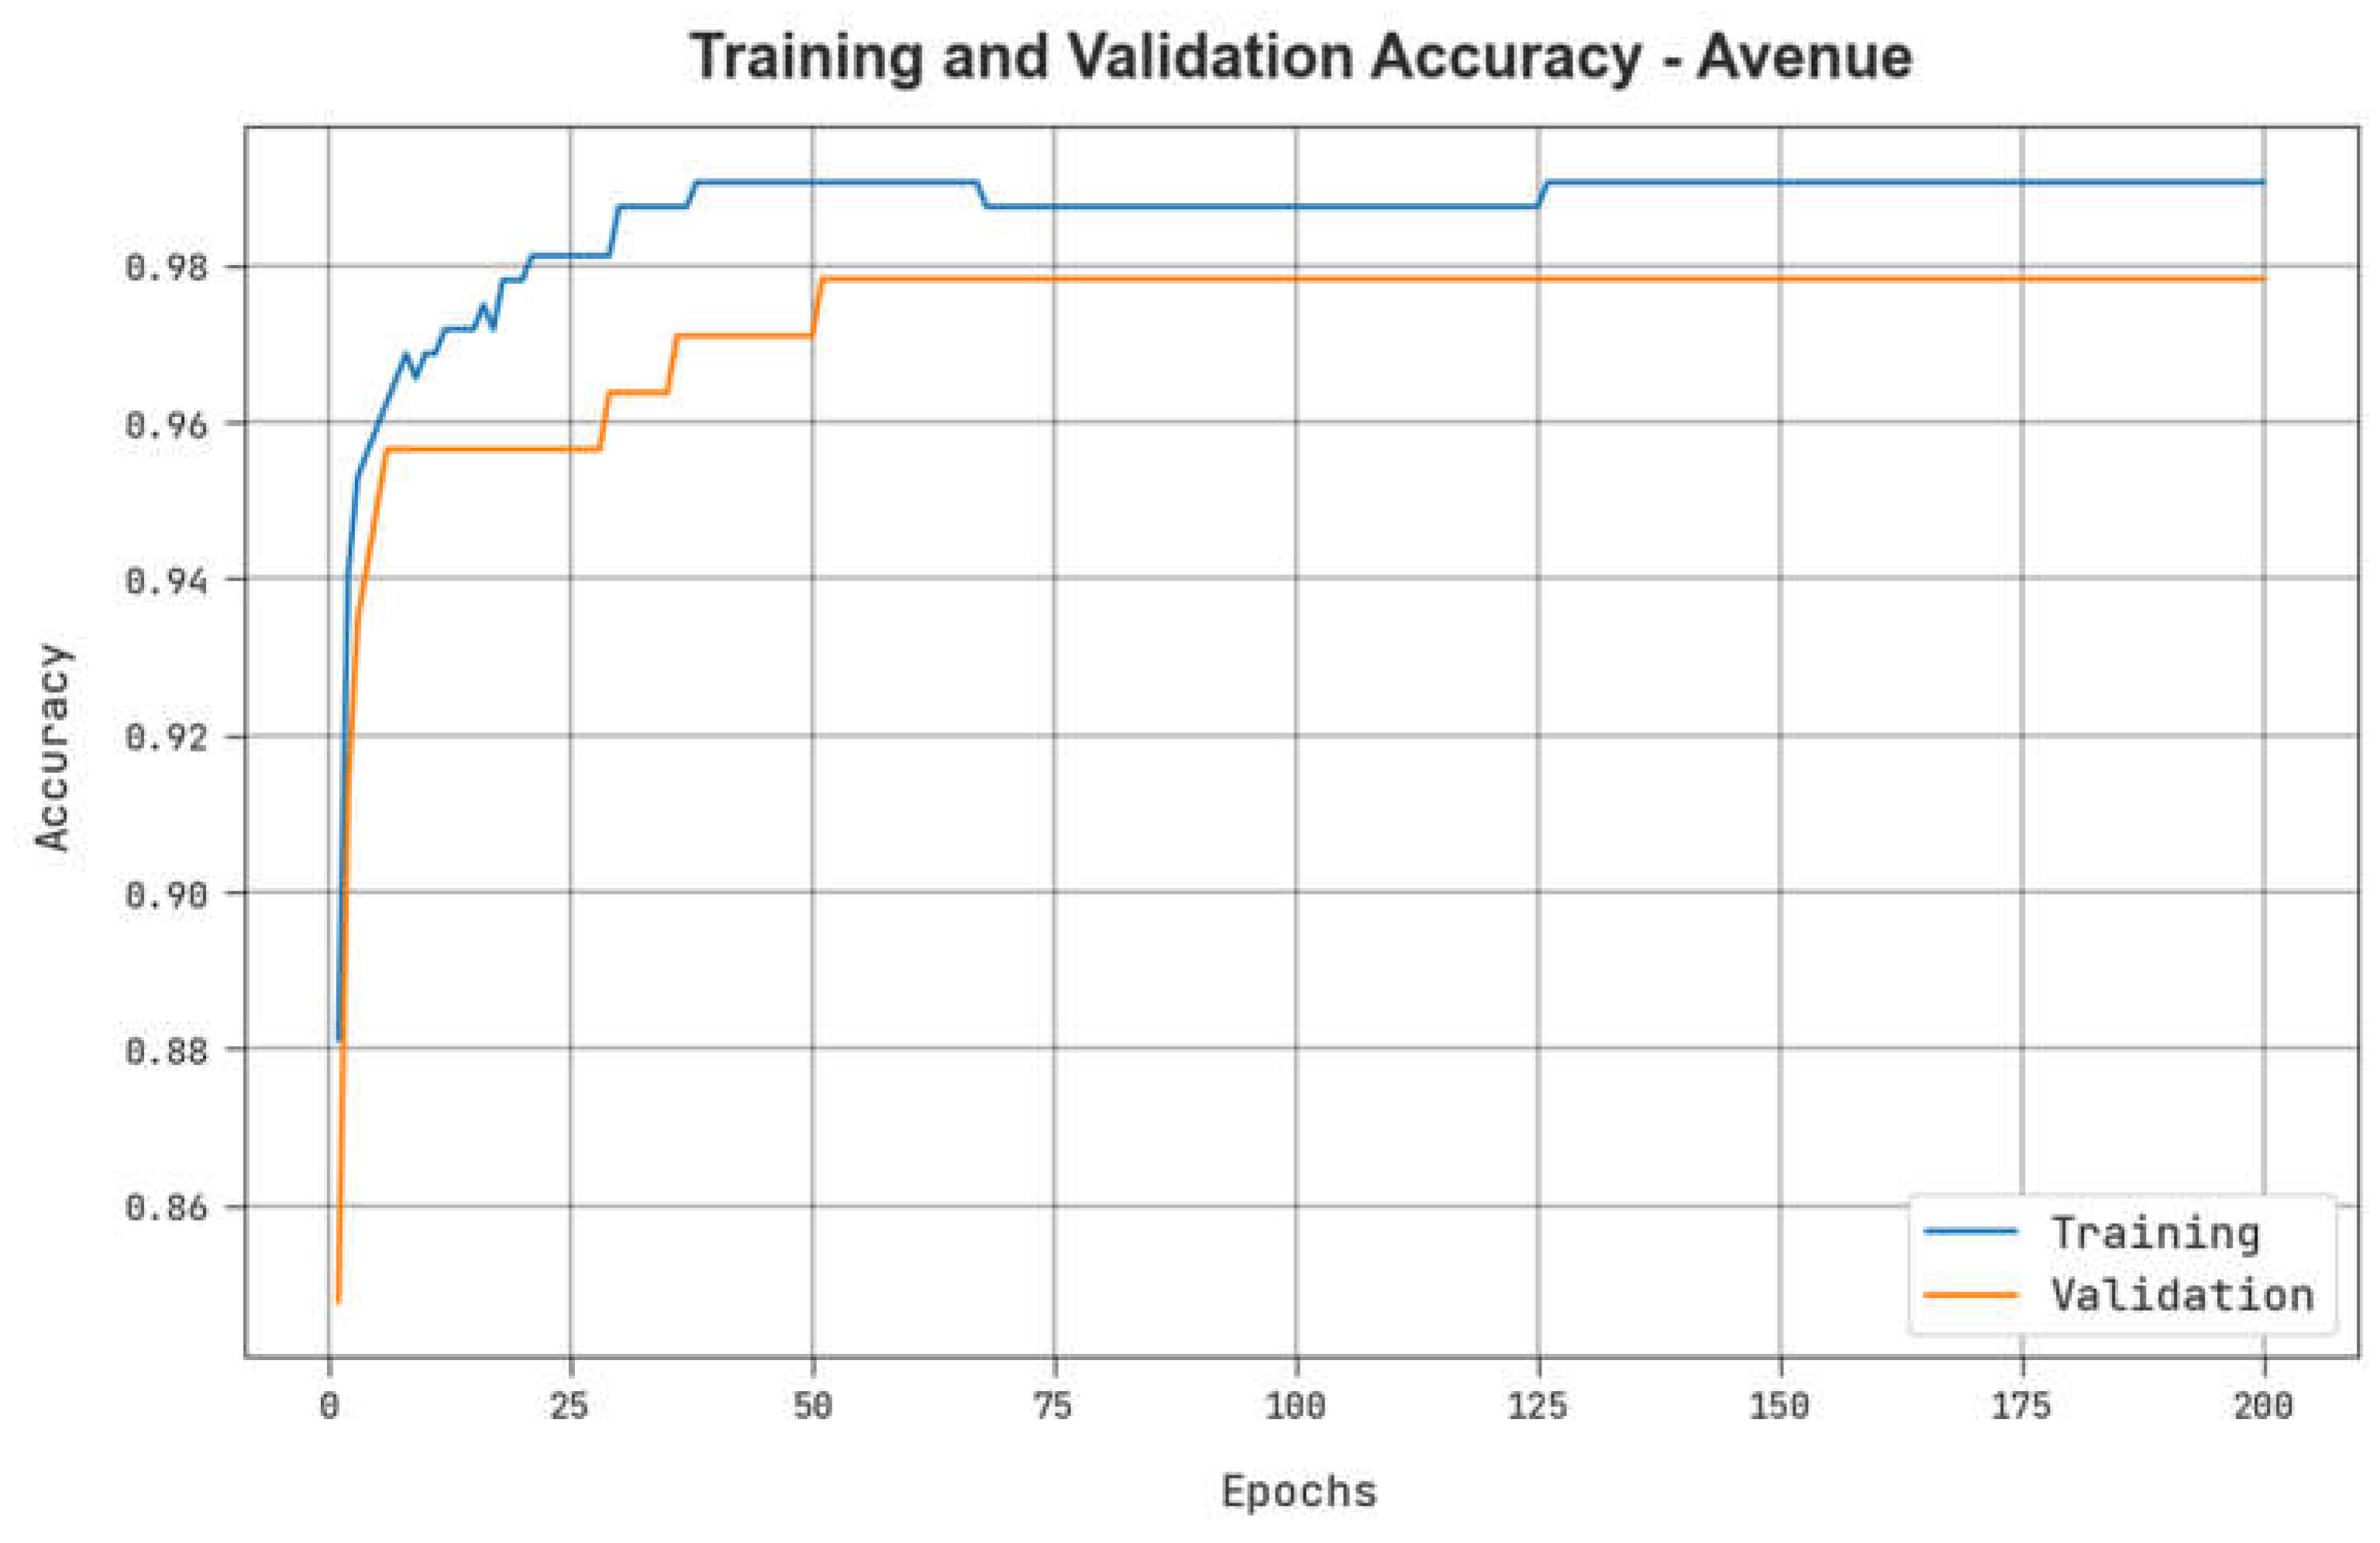
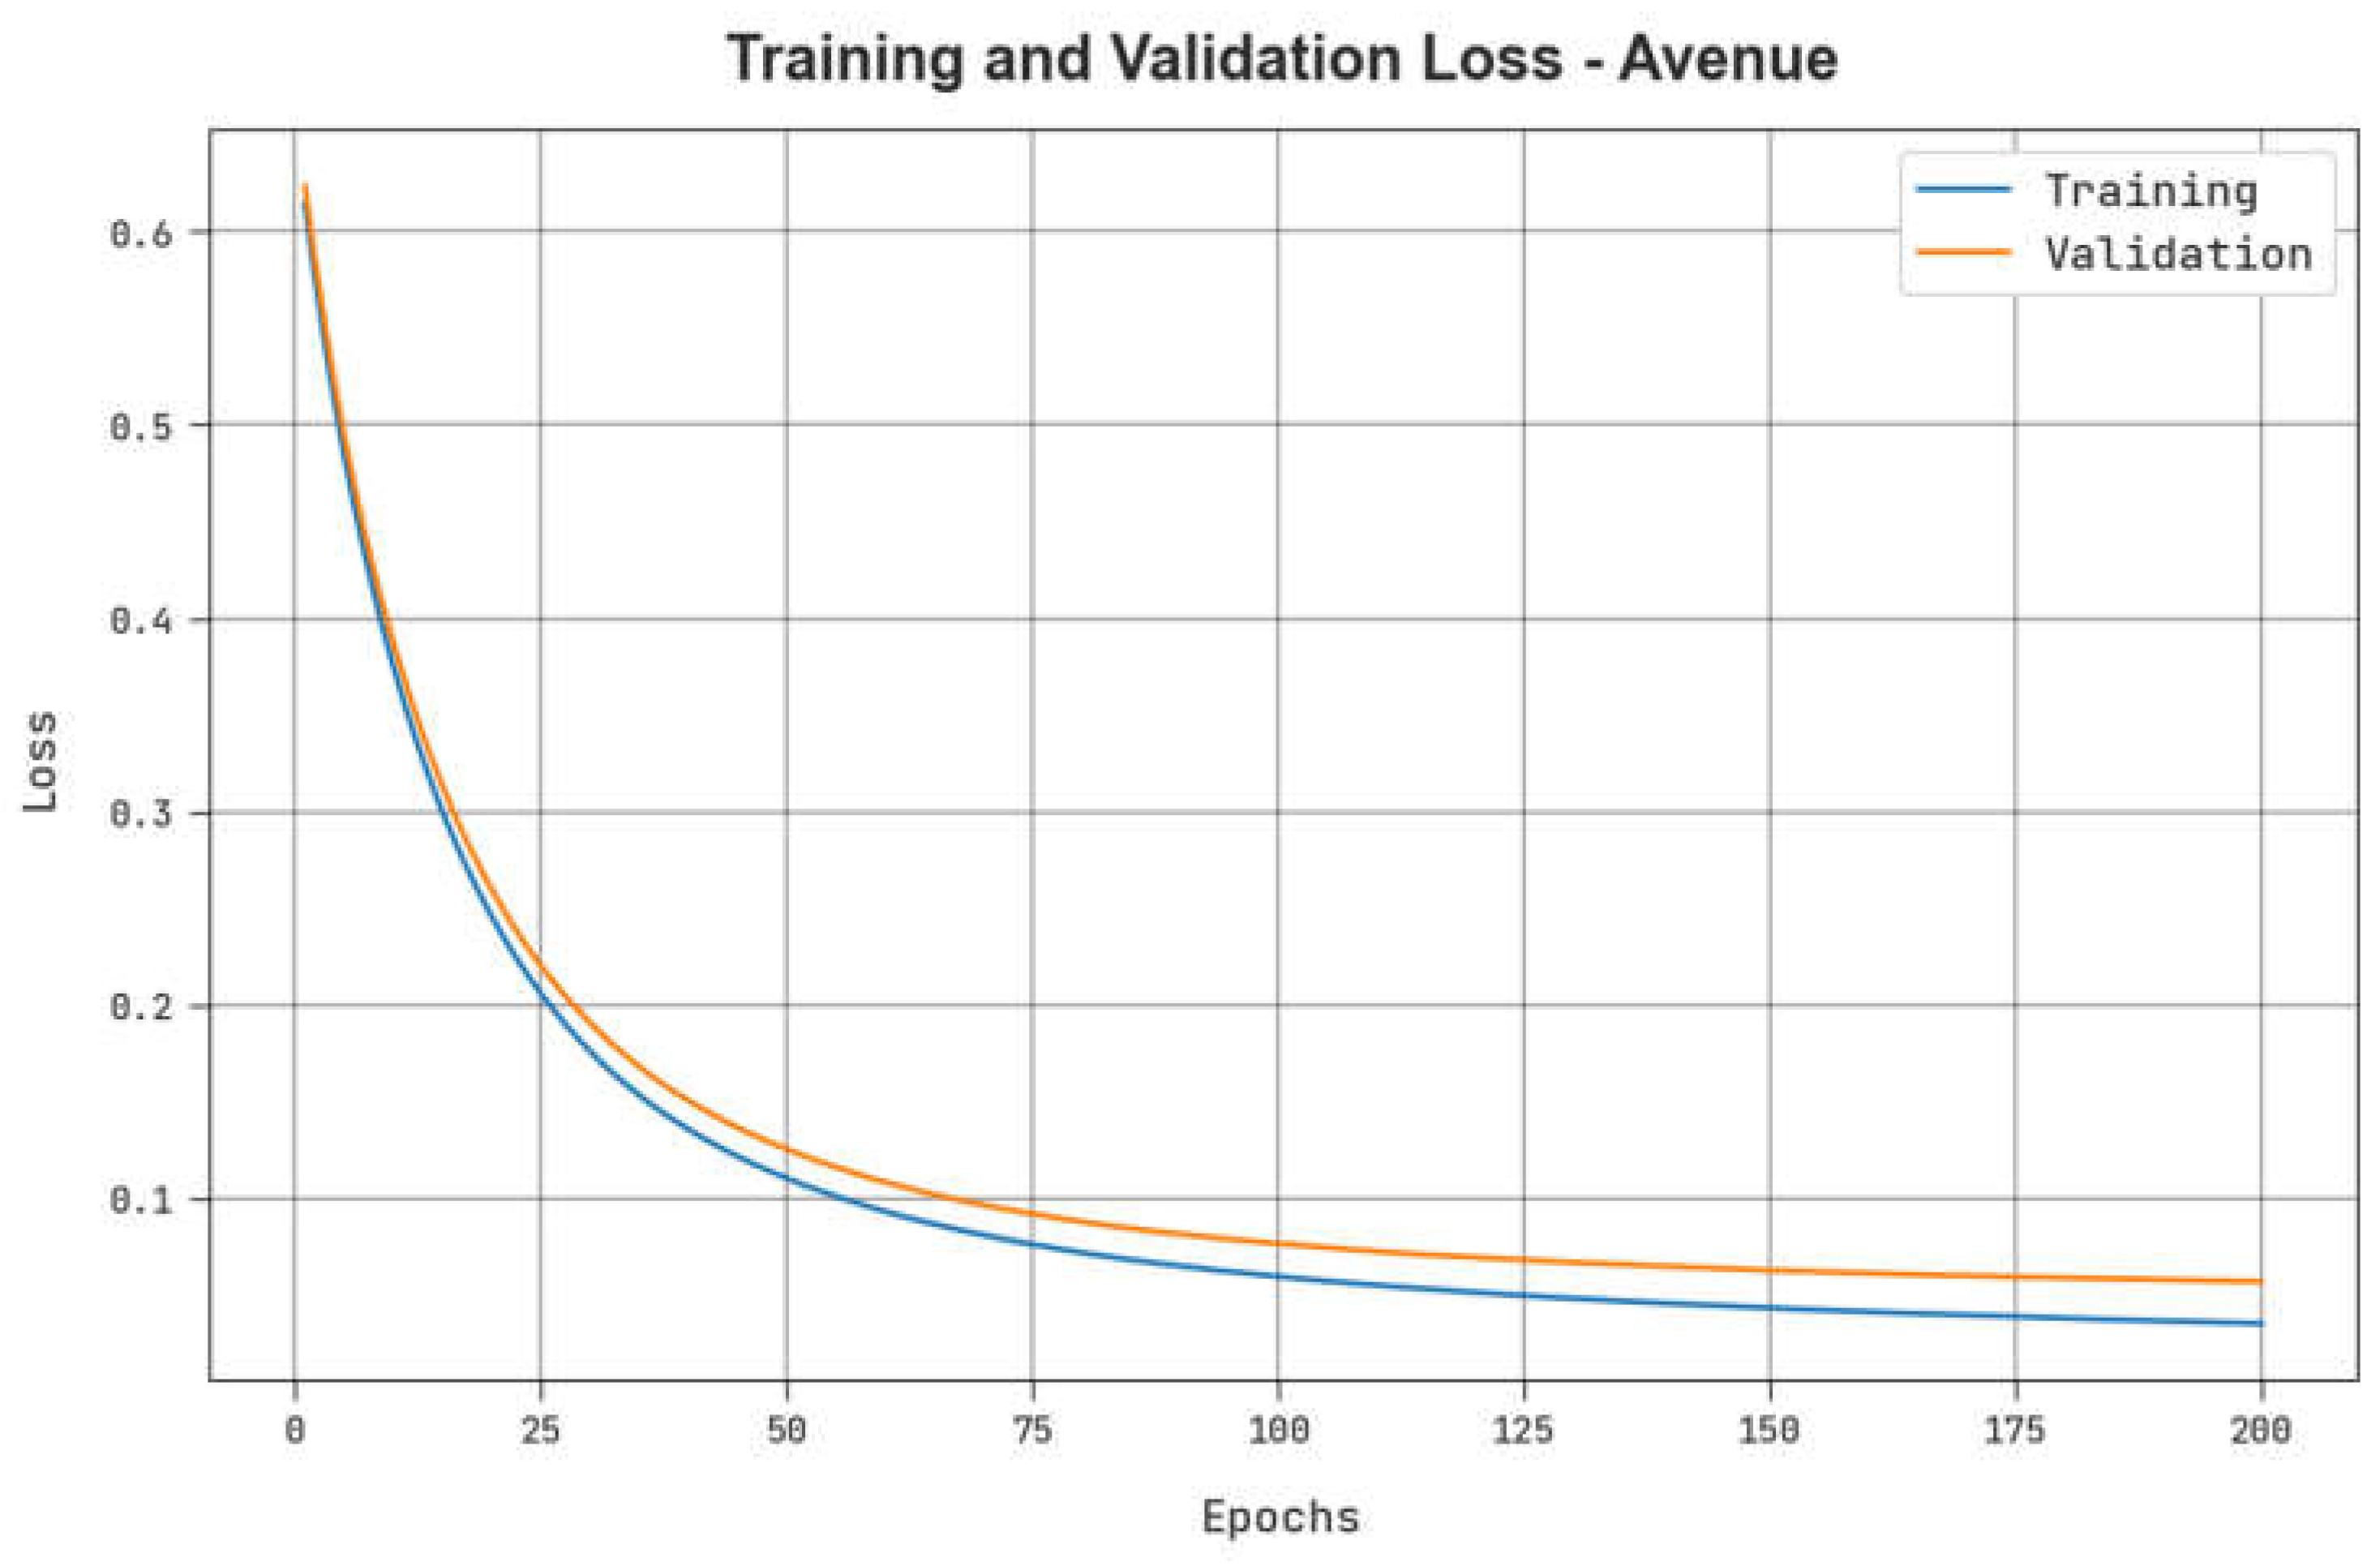
Table 6 describes the TPR results of the ADPW-FLHHO technique on the Avenue dataset. The figure indicates that the values of TPR are raised with an increase in FPR. It is noticed that the MPPCA, SF, and MDT models resulted in the lowest TPR values while the AMDN model accomplishes certainly enhanced TPR values. Contrastingly, the EADN model accomplishes near-optimal performance with reasonable TPR values. Nevertheless, the ADPW-FLHHO technique reaches maximum performance with maximal TPR values on the UCSDPed-1 dataset.
Table 7 highlights a comparative A U C s c o r e inspection of the ADPW-FLHHO technique with recent methods on the Avenue dataset. The results demonstrate the ineffectual outcomes of the TSN-RGB, Spatiotemporal, and TSN-Optical Flow with a closer A U C s c o r e of 89.47%, 91.41%, and 93.31%, respectively. Contrastingly, the binary MIL-C3D and Binary SVM approaches have reported a certainly increased A U C s c o r e of 95.02% and 96.21%, respectively.
Though the EADN model accomplishes a considerable A U C s c o r e of 97.78%, the ADPW-FLHHO technique ensures its supremacy with a maximum A U C s c o r e of 98.90%. From the detailed results and discussion, it is assumed that the ADPW-FLHHO technique highlights proficient results over other models. The proposed model can alert authorities to identify abnormal objects in the pedestrian walkways, which results in a quick response time during an emergency, and potentially prevent accidents or other safety incidents. This can enhance the accessibility for people with disabilities or mobility issues, making pedestrian walkways more inclusive. It has the potential to improve safety, security, efficiency, accessibility, and urban planning, making pedestrian walkways more pleasant and inclusive spaces for everyone.

5. Conclusions

In this study, a novel ADPW-FLHHO algorithm was developed for anomaly detection in pedestrian walkways, to improve the safety of pedestrians. The presented ADPW-FLHHO technique mainly concentrated on the effectual identification and classification of anomalies, i.e., vehicles in the pedestrian walkways. To accomplish this, the ADPW-FLHHO technique uses the HybridNet model for feature vector generation. In addition, the HHO method is implemented for the optimal hyperparameter tuning process. For anomaly detection, the ADPW-FLHHO technique used the MDBN model. The experimental results of the ADPW-FLHHO technique can be studied on the UCSD anomaly detection dataset and the results illustrated the promising performance of the ADPW-FLHHO approach over existing models. In future, the proposed model can be tested on a large-scale real-time remote sensing image dataset. Additionally, the computation complexity of the proposed model can be investigated in future.

Author Contributions

Conceptualization, M.A.A. and M.A.; methodology, N.N.; software, R.A.; validation, R.A., M.A.A. and M.A.; formal analysis, M.A.D.; investigation, M.A.D.; resources, M.I.A.; data curation, A.A.A.; writing—original draft preparation, M.A.A., M.A., R.A.; M.A.D., M.A.; writing—review and editing, M.A., A.E.O., A.A.A.; visualization, M.A.; supervision, M.A.A.; project administration, M.A.D.; funding acquisition, M.A.A., M.A., N.N., R.A. The manuscript was written through contributions of all authors. All authors have read and agreed to the published version of the manuscript.

Funding

The authors extend their appreciation to the Deanship of Scientific Research at King Khalid University for funding this work through large group Research Project under grant number (RGP2/02/44). Princess Nourah bint Abdulrahman University Researchers Supporting Project number (PNURSP2023R330), Princess Nourah bint Abdulrahman University, Riyadh, Saudi Arabia. Research Supporting Project number (RSP2023R459), King Saud University, Riyadh, Saudi Arabia. The authors extend their appreciation to the Deanship of Scientific Research at Northern Border University, Arar, KSA for funding this research work through the project number “NBU-FFR-2023-0059”.

Institutional Review Board Statement

This article does not contain any studies with human participants performed by any of the authors.

Informed Consent Statement

Not applicable.

Data Availability Statement

Data sharing not applicable to this article as no datasets were generated during the current study.

Conflicts of Interest

The authors declare that they have no conflict of interest.

References

  1. Bouguettaya, A.; Zarzour, H.; Kechida, A.; Taberkit, A.M. Vehicle detection from UAV imagery with deep learning: A review. IEEE Trans. Neural Netw. Learn. Syst. 2021, 33, 6047–6067. [Google Scholar]
  2. Kumar, S.; Rajan, E.G.; Rani, S. A Study on Vehicle Detection through Aerial Images: Various Challenges, Issues and Applications. In Proceedings of the 2021 International Conference on Computing, Communication, and Intelligent Systems (ICCCIS), Greater Noida, India, 19–20 February 2021; pp. 504–509. [Google Scholar]
  3. Qiu, Z.; Bai, H.; Chen, T. Special Vehicle Detection from UAV Perspective via YOLO-GNS Based Deep Learning Network. Drones 2023, 7, 117. [Google Scholar] [CrossRef]
  4. Tak, S.; Lee, J.D.; Song, J.; Kim, S. Development of AI-based vehicle detection and tracking system for C-ITS application. J. Adv. Transp. 2021, 2021, 4438861. [Google Scholar] [CrossRef]
  5. Zhou, W.; Shen, J.; Liu, N.; Xia, S.; Sun, H. An anchor-free vehicle detection algorithm in aerial image based on context information and transformer. IEEE Geosci. Remote Sens. Lett. 2022, 19, 1246. [Google Scholar] [CrossRef]
  6. Li, J.; Zhang, Z.; Tian, Y.; Xu, Y.; Wen, Y.; Wang, S. Target-guided feature super-resolution for vehicle detection in remote sensing images. IEEE Geosci. Remote Sens. Lett. 2021, 19, 1–5. [Google Scholar] [CrossRef]
  7. Chen, R.; Ferreira, V.G.; Li, X. Detecting Moving Vehicles from Satellite-Based Videos by Tracklet Feature Classification. Remote Sens. 2023, 15, 34. [Google Scholar] [CrossRef]
  8. Weber, I.; Bongartz, J.; Roscher, R. Artificial and beneficial–exploiting artificial images for aerial vehicle detection. ISPRS J. Photogramm. Remote Sens. 2021, 175, 158–170. [Google Scholar] [CrossRef]
  9. Karnick, S.; Ghalib, M.R.; Shankar, A.; Khapre, S.; Tayubi, I.A. A novel method for vehicle detection in high-resolution aerial remote sensing images using YOLT approach. Multimed. Tools Appl. 2022, 81, 23551–23566. [Google Scholar]
  10. Javadi, S.; Dahl, M.; Pettersson, M.I. Vehicle detection in aerial images based on 3D depth maps and deep neural networks. IEEE Access 2021, 9, 8381–8391. [Google Scholar] [CrossRef]
  11. Charouh, Z.; Ezzouhri, A.; Ghogho, M.; Guennoun, Z. A resource-efficient CNN-based method for moving vehicle detection. Sensors 2022, 22, 1193. [Google Scholar] [CrossRef] [PubMed]
  12. Mittal, U.; Chawla, P. Acoustic Based Emergency Vehicle Detection Using Ensemble of deep Learning Models. Procedia Comput. Sci. 2023, 218, 227–234. [Google Scholar] [CrossRef]
  13. Dhanaraj, M.; Sharma, M.; Sarkar, T.; Karnam, S.; Chachlakis, D.G.; Ptucha, R.; Markopoulos, P.P.; Saber, E. Vehicle detection from multi-modal aerial imagery using YOLOv3 with mid-level fusion. In Big Data II: Learning, Analytics, and Applications; SPIE: Bellingham, WA, USA, 2020; Volume 11395, pp. 22–32. [Google Scholar]
  14. Joshi, G.P.; Alenezi, F.; Thirumoorthy, G.; Dutta, A.K.; You, J. Ensemble of deep learning-based multimodal remote sensing image classification model on unmanned aerial vehicle networks. Mathematics 2021, 9, 2984. [Google Scholar] [CrossRef]
  15. Li, X.; Men, F.; Lv, S.; Jiang, X.; Pan, M.; Ma, Q.; Yu, H. Vehicle detection in very-high-resolution remote sensing images based on an anchor-free detection model with a more precise foveal area. ISPRS Int. J. Geo-Inf. 2021, 10, 549. [Google Scholar] [CrossRef]
  16. Rafique, A.A.; Al-Rasheed, A.; Ksibi, A.; Ayadi, M.; Jalal, A.; Alnowaiser, K.; Meshref, H.; Shorfuzzaman, M.; Gochoo, M.; Park, J. Smart Traffic Monitoring through Pyramid Pooling Vehicle Detection and Filter-based Tracking on Aerial Images. IEEE Access 2023, 11, 2993–3000. [Google Scholar] [CrossRef]
  17. Koetsier, C.; Fiosina, J.; Gremmel, J.N.; Müller, J.P.; Woisetschläger, D.M.; Sester, M. Detection of anomalous vehicle trajectories using federated learning. ISPRS Open J. Photogramm. Remote Sens. 2022, 4, 100013. [Google Scholar] [CrossRef]
  18. Robert, T.; Thome, N.; Cord, M. Hybridnet: Classification and reconstruction cooperation for semi-supervised learning. In Proceedings of the European Conference on Computer Vision (ECCV), Munich, Germany, 8–14 September 2018; pp. 153–169. [Google Scholar]
  19. Houssein, E.H.; Hosney, M.E.; Elhoseny, M.; Oliva, D.; Mohamed, W.M.; Hassaballah, M. Hybrid Harris hawks optimization with cuckoo search for drug design and discovery in chemoinformatics. Sci. Rep. 2020, 10, 1–22. [Google Scholar] [CrossRef] [PubMed]
  20. Li, Z.; Huang, H.; Zhang, Z.; Shi, G. Manifold-Based Multi-Deep Belief Network for Feature Extraction of Hyperspectral Image. Remote Sens. 2022, 14, 1484. [Google Scholar] [CrossRef]
  21. Khan, A.A.; Nauman, M.A.; Shoaib, M.; Jahangir, R.; Alroobaea, R.; Alsafyani, M.; Binmahfoudh, A.; Wechtaisong, C. Crowd Anomaly Detection in Video Frames Using Fine-Tuned AlexNet Model. Electronics 2022, 11, 3105. [Google Scholar] [CrossRef]
Figure 1. Overall flow of ADPW-FLHHO algorithm.
Remotesensing 15 03092 g001
Figure 2. Structure of DBN.
Remotesensing 15 03092 g002
Figure 3. Accuracy curve of ADPW-FLHHO approach under UCSDPed1 dataset.
Remotesensing 15 03092 g003
Figure 4. Loss curve of ADPW-FLHHO approach under UCSDPed1 dataset.
Remotesensing 15 03092 g004
Figure 5. Accuracy curve of ADPW-FLHHO approach under UCSDPed2 dataset.
Remotesensing 15 03092 g005
Figure 6. Loss curve of ADPW-FLHHO approach under UCSDPed2 dataset.
Remotesensing 15 03092 g006
Figure 7. Accuracy curve of ADPW-FLHHO approach under Avenue dataset.
Remotesensing 15 03092 g007
Figure 8. Loss curve of ADPW-FLHHO approach under Avenue dataset.
Remotesensing 15 03092 g008
Table 1. Details of datasets.
DatasetNo. of VideosTraining SetTesting SetAverage FramesDataset Length
UCSDPed1 (Bikers, small carts, walking across walkways)7034362015 min
UCSDPed2 (Bikers, small carts, walking across walkways2816121635 min
Avenue (Run, throw, new object)3716218395 min
Table 2. TPR outcome of ADPW-FLHHO approach on UCSDPed1 dataset.
True Positive Rate
False Positive RateMPPCASocial ForceMDTAMDNEADNADPW-FLHHO
00.00000.00000.00000.00000.00000.0000
50.09040.13020.22570.32390.34510.5944
100.22570.24430.39810.44590.54930.7430
150.35040.36630.50160.56530.75360.8226
200.43000.45650.58650.69790.75360.8730
250.93660.92070.75090.68200.53610.5175
300.57320.63160.75630.84640.94190.9605
350.63420.71650.79600.90480.95520.9711
400.67930.80930.85440.92600.96320.9764
450.75360.88090.88090.93930.97110.9817
500.79600.90750.92340.96050.97640.9844
550.83050.93130.95790.97110.97640.9844
600.87830.93930.96320.97640.97640.9870
650.91010.94720.97640.97910.98170.9870
700.95250.95520.97910.97910.98171.0000
750.95520.97380.97910.98170.98701.0000
800.96050.98170.98171.00001.00001.0000
850.96580.98171.00001.00001.00001.0000
900.98170.98171.00001.00001.00001.0000
950.97910.99231.00001.00001.00001.0000
1001.00001.00001.00001.00001.00001.0000
Table 3. A U C s c o r e outcome of ADPW-FLHHO approach with other systems on UCSDPed1 dataset.
MethodsAUC Score (%)
ADPW-FLHHO99.36
EADN98.36
Binary SVM classifier96.73
MIL-C3D94.99
TSN-Optical Flow92.86
Spatiotemporal91.57
TSN-RGB90.49
Table 4. TPR outcome of ADPW-FLHHO approach on UCSDPed2 dataset.
True Positive Rate
False Positive RateMPPCASocial ForceMDTAMDNEADNADPW-FLHHO
00.00000.00000.00000.00000.00000.0000
50.07040.12220.26320.37690.34240.5637
100.24600.26470.42210.46710.52950.6407
150.35990.41260.55460.54090.59690.7857
200.48450.48880.63750.67190.74190.8655
250.55440.64420.75700.68630.77630.9025
300.68760.72790.79260.85940.92150.9550
350.71340.82530.79450.91710.94190.9552
400.76960.87180.82890.92700.94820.9639
450.79310.92170.87130.93560.95440.9753
500.82660.93840.92950.95410.96080.9800
550.92140.95180.96310.96530.97590.9856
600.93340.95490.97140.96720.97951.0000
650.94600.97070.99950.98540.98831.0000
700.95850.97661.00000.99000.99411.0000
750.97750.98351.00000.99180.99871.0000
800.98320.99451.00000.99741.00001.0000
850.98840.99581.00001.00001.00001.0000
901.00001.00001.00001.00001.00001.0000
951.00001.00001.00001.00001.00001.0000
1001.00001.00001.00001.00001.00001.0000
Table 5. AUCscore outcome of ADPW-FLHHO approach with other systems on UCSDPed2 dataset.
MethodsAUC Score (%)
ADPW-FLHHO99.19
EADN98.30
Binary SVM classifier97.16
MIL-C3D95.50
TSN-Optical Flow94.36
Spatiotemporal92.48
TSN-RGB90.44
Table 6. TPR outcome of ADPW-FLHHO approach on Avenue dataset.
True Positive Rate
False Positive RateMPPCASocial ForceMDTAMDNEADNADPW-FLHHO
00.00000.00000.00000.00000.00000.0000
50.10840.18430.21880.32920.34070.5694
100.24760.29320.43030.45930.55290.5850
150.32320.41740.54470.59180.59600.7382
200.46290.45020.58070.68780.72560.8654
250.60240.65230.72180.72750.73860.8868
300.63910.76870.74070.88760.92170.9468
350.70990.78810.77730.90220.94970.9578
400.78300.85930.89350.92380.97350.9597
450.82980.92800.91050.97150.97730.9716
500.83080.93530.91740.97300.98290.9819
550.88150.94120.96330.97900.98570.9858
600.89970.95330.96740.99360.99170.9941
650.94490.96010.97390.99360.99651.0000
700.95520.96450.97890.99451.00001.0000
750.96470.98820.99220.99551.00001.0000
800.97261.00001.00001.00001.00001.0000
850.97951.00001.00001.00001.00001.0000
901.00001.00001.00001.00001.00001.0000
951.00001.00001.00001.00001.00001.0000
1001.00001.00001.00001.00001.00001.0000
Table 7. AUCscore outcome of ADPW-FLHHO approach with other systems on Avenue dataset.
MethodsAUC Score (%)
ADPW-FLHHO98.90
EADN97.78
Binary SVM classifier96.21
MIL-C3D95.02
TSN-Optical Flow93.31
Spatiotemporal91.41
TSN-RGB89.47
Disclaimer/Publisher’s Note: The statements, opinions and data contained in all publications are solely those of the individual author(s) and contributor(s) and not of MDPI and/or the editor(s). MDPI and/or the editor(s) disclaim responsibility for any injury to people or property resulting from any ideas, methods, instructions or products referred to in the content.

