Article

Environmental and Volcanic Implications of Volatile Output in the Atmosphere of Vulcano Island Detected Using SO2 Plume (2021–23)

1
Istituto Nazionale di Geofisica e Vulcanologia, Sezione di Palermo Via Ugo La Malfa, 153-90146 Palermo, Italy
2
Instituto de Geofísica, Universidad Autónoma de México, Mexico City 04510, Mexico
3
Departamento de Geología, Centro de Investigación Científica y de Educación Superior de Ensenada, Baja California (CICESE), Ensenada 22860, Mexico
4
GNS Science Wairakei Research Centre, 114 Karetoto Road, Wairakei, Private Bag 2000, Taupo 3352, New Zealand
*
Author to whom correspondence should be addressed.
Remote Sens. 2023, 15(12), 3086; https://doi.org/10.3390/rs15123086
Submission received: 19 April 2023 / Revised: 7 June 2023 / Accepted: 9 June 2023 / Published: 13 June 2023

Abstract

:
The volatiles released by the volcanic structures of the world contribute to natural environmental pollution both during the passive and active degassing stages. The Island of Vulcano is characterized by solfataric degassing mainly localized in the summit part (Fossa crater) and in the peripheral part in the Levante Bay. The normal solfataric degassing (high-temperature fumarolic area of the summit and boiling fluids emitted in the Levante Bay area), established after the last explosive eruption of 1888–90, is periodically interrupted by geochemical crises characterized by anomalous degassing that are attributable to increased volcanic inputs, which determine a sharp increase in the degassing rate. In this work, we have used the data acquired from the INGV (Istituto Nazionale di Geofisica e Vulcanologia) geochemical monitoring networks to identify, evaluate, and monitor the geochemical variations of the extensive parameters, such as the SO2 flux from the volcanic plume (solfataric cloud) and the CO2 flux from the soil in the summit area outside the fumaroles areas. The increase in the flux of volatiles started in June–July 2021 and reached its maximum in November of the same year. In particular, the mean monthly flux of SO2 plume of 22 tons day−1 (t d−1) and of CO2 from the soil of 1570 grams per square meter per day (g m2 d−1) increased during this event up to 89 t d−1 and 11,596 g m2 d−1, respectively, in November 2021. The average annual baseline value of SO2 output was estimated at 7700 t d−1 during normal solfataric activity. Instead, this outgassing increased to 18,000 and 24,000 t d−1 in 2021 and 2022, respectively, indicating that the system is still in an anomalous phase of outgassing and shows no signs of returning to the pre-crisis baseline values. In fact, in the first quarter of 2023, the SO2 output shows average values comparable to those emitted in 2022. Finally, the dispersion maps of SO2 on the island of Vulcano have been produced and have indicated that the areas close to the fumarolic source are characterized by concentrations of SO2 in the atmosphere higher than those permitted by European legislation (40 μg m−3 for 24 h of exposition) on human health.

1. Introduction

The volatiles emitted in different ways from the active volcanoes during the active and passive degassing are responsible for the increase in atmospheric natural pollution caused by gases, such as CO2, SO2, and H2S, both during active and quiescent phases of the volcanic activity [1,2,3,4]. The volatiles are exsolved from the magma batch located below the volcano edifice and can interact with surficial fluids during the rising towards the surface acting as aquifers and can be emitted diffusively by soil and fumarole or bubbling gases from surficial water. The high-temperature fumaroles show a chemical composition that varies over time as a function of the level of volcanic activity and the compositional molar ratios of the most abundant gases, i.e., H2O/CO2 and CO2/SO2 ranging within 4–11 and 30–67, respectively [5,6,7,8,9]. Among the gases released by active volcanoes, sulfur dioxide (SO2) is generally the most abundant of the dry gases after carbon dioxide (CO2) [10,11], with worldwide emissions of over 27 Tg SO2/y [12]. The volcanic emissions in the world represent 10% of the SO2 in the atmosphere [3,4].
Vulcano Island is located in the Aeolian archipelago on the southern side of Italy (Figure 1). The last volcanic eruption occurred in 1888–1990 (VEI = 3), followed by solfataric activity at the summit of the volcano and hydrothermal activity in the lower part of the island. The island of Vulcano in the last century has been affected by various geochemical crises characterized by increases in the degassing of volcanic fluids both from the fumarolic area of the summit and in diffuse form from the soil in the summit and peripheral area (extensive parameters). Moreover, these crises are characterized by compositional variations of the fumarolic fluids, indicating the arrival of more oxidizing volcanic fluids with higher CO/CH4 and SO2/H2S and CO2/H2O compositional ratios (intensive parameters). In June 2021, a new geochemical crisis was observed in the island of Vulcano inferred by an increase in degassing activity from June 2021 reaching a maximum during September 2021 [13,14,15,16] and by significant variations in the chemical and isotopic composition of high-temperature fumarolic fluids [9]. The intensification of gas emissions during this geochemical crisis also contributes to the contamination increase in natural gases in the atmosphere, especially near the gas-emitting fumaroles fields and in the neighboring areas of the island. The gas contamination in the atmosphere is a function of the emitted fluxes of gases that cause an increase in gas concentrations and the speed and direction of the prevailing winds that define the gas distribution. The degassing activity of Vulcano Island is routinely monitored by the geochemical networks of INGV (Istituto Nazionale di Geofisica e Vulcanologia-Italy).
The study is mainly focused on: (1) monitoring the SO2 plume and the soil CO2 fluxes at La Fossa Cone as well as evaluating and identifying processes that change volcanic activity and (2) evaluating the dispersion of SO2 and the possible environmental implications during the last crisis that started in June 2021.

2. Materials and Methods

2.1. SO2 Output Network

Near-continuous SO2 plume flux measurements have been carried out with a network system of SO2 measurements at Vulcano Island, Italy. Two scan-DOAS stations belonging to the NOVAC Project are located at NE and SW of the volcanic cone, respectively (Figure 1). This configuration allowed to track over 80% of plume emissions during the solar year.
NOVAC (Network for Observation of Volcanic and Atmospheric Change) is a permanent network for the measurement of volcanic gas emissions established in 2005 due to a European project to create and install automated prototypes capable of monitoring gases from volcanic plumes around the world [17]. The main objective was to quantify global volcanic gas emissions and increase knowledge on changes in volcanic activity by estimating the gases emitted by each individual volcanic system. The remote sensing technique used is the DOAS (Differential Optical Absorption Spectroscopy) [18,19]. The analysis of solar radiation in the ultraviolet region, collected by spectrometers during the daytime, allows us to quantify the optical density column of different magmatic volatiles emitted by active volcanoes (e.g., SO2, NO2, and BrO).
The scan-DOAS NOVAC instrument consists of a conical scanning UV telescope with a 60-degree window rotating terminal, an in-focus optical fiber connected to a UV spectrometer, an embedded PC, a GPS, a timer, a WIFI system for transmitting data in near real-time, and a self-powered system with photovoltaic panel and battery. Details of the instrumentation can be found in Galle et al. [20]. Several steps are performed before calculating the SO2 flux. The first action in a measurement cycle is the “Sky” spectrum measured at the zenith, and it represents the clear background, and all the spectra of this measurement are divided from this spectrum to derive the differential column density.
To reduce dark current and electronic offset errors, a dark offset spectrum is measured in dark conditions with the shielded window in the nadir position, and this spectrum is subtracted from any other spectrum of the same measurement. A complete measurement is made from all scans measured in one cycle from horizon to horizon across a conical surface intercepting the volcanic plume.
Slant column densities of gas are calculated using the DOAS Method [21], and the emission rate is estimated by multiplying the integral of column density with the wind velocity.
The NOVAC project has involved several volcanological observatories over time. Although the project ended in 2010, the NOVAC community continues to grow. It started with 16 volcanoes and about 30 instruments in 2007 and now has more than 160 stations on 47 volcanoes around the world [17].
At Vulcano Island, there are two permanent Novac-scanning DOAS, one in the Palizzi area and the other in the Levante Bay (Figure 1) installed in 2008 and 2015, respectively [13,22]. Moreover, to complete the network plume measurement, a meteorological station was installed on Mount Lentia and a video camera in the volcanological observatory “Centro Carapezza” to observe the emission zone on the crater la fossa. The acquired data are transmitted in real-time to Chalmers servers and to the NOVAC Database through a wireless system [23].
The long-term measurements of SO2 flux have given excellent information about the degassing activity of active volcanoes [24,25] as in our Vulcano Island cases [13,26]. This information coupled with CO2 flux measurements contribute in estimating the number of volcanic gases released, during passive and active degassing of active volcanoes, into the atmosphere [14,27].

2.2. Soil Summit CO2 Flux Monitoring

Near-continuous soil CO2 flux measurements have been carried out utilizing a geochemical station (VSCS) located on the summit crater area of Vulcano Island (Figure 1), [13,14,28]. This geochemical station measures CO2 fluxes on the ground using the dynamic accumulation chamber principle [24] and it is engineered and distributed by WEST Systems S.r.l. The detector used for CO2 concentration measurements is the Dräger Polytron IR spectrometer. Furthermore, sensors for monitoring environmental parameters, such as soil and atmosphere temperature, wind speed and direction, and soil and atmosphere humidity, have also been installed. These environmental parameters are useful for controlling any environmental influences on CO2 degassing from soil [14]. The monitoring frequency is hourly and the data are sent via internet automatically every hour to the data acquisition center at INGV-Palermo using a WLAN/rooter service. More technical information is available in [29].

2.3. Air Dispersion Model

AERMOD (Lakes Environmental™, Waterloo, ON, Canada; https://www.weblakes.com/ (accessed on 18 April 2023)) is an atmospheric dispersion model designed to simulate the dispersion of air pollutants from stationary anthropogenic and natural emission sources [30,31,32]. From November 2005, the United State Environmental Protection Agency (USEPA) formally adopted AERMOD as the preferred air quality dispersion model for regulatory applications and included it in their guidelines [33].
The AERMOD is a steady-state Gaussian air dispersion model based on the planetary boundary layer (PBL) aimed at short-range (source–receptor distance less than 50 km) from a specific source [34]. Gaussian dispersion is characterized by a normal distribution with the capacity to simulate the horizontal and vertical spread of a plume. The algorithm parameters in conjunction with meteorological measurements can characterize the wind vertical variation, wind structure, and turbulence profiles. Moreover, the AERMOD algorithm contains terrain treatment, buoyancy, plume rise, and building downwash. On the contrary, AERMOD does not take into account chemical reactions between atmospheric compounds. The dispersion simulation in the PBL (lower part of the atmosphere, 0–3 km deep) is particularly important considering the direct contact with the earth’s surface and its influence in the dispersion, emission, transport, and mixing of contaminants [35,36].
In order to run AERMOD model, a detailed emission inventory in necessary, including pollutant compound and the point source. We used the SO2 inventory concentration and flux values presented in this work. Furthermore, the model requires some specific information as the location of the source (latitude and longitude), elevation, gas temperature, diameters of the conduct, and flow rate. The value of the radius from the source to develop the model has been set at 3 km, considering the limitations due to the complex terrain as well as the distance from the coastline. By carrying out various tests, we chose 3 km as the best option, which resulted in even fewer errors. The complete AERMOD modeling system includes AERMET and AERMAP. Terrain structure, i.e., landscape formed by specific morphological relief (simple, intermediate, and complex) and meteorological parameters affect the dispersion of contaminants and contribute to building downwash, which influences the air quality modeling. AERMET is a meteorological pre-processor system that provides information about state of surface, mixed layer, and PBL turbulence structure. The meteorological model requires a specific input, such as wind speed and direction, cloud cover, and air temperature, among others, and return friction velocity, mixing height, convective velocity scale, and surface heat flux [37]. The values of wind speed and direction (from January 2021 to February 2023) were obtained from a meteorological station (http://www.meteosystem.com/dati/vulcano/ (accessed on 10 March 2023)) located near the emission source. On the other hand, AERMAP is a terrain pre-processor that generates receptor grids and the structure of complex terrain using USGS Digital Elevation data (GeoTIFF format and spatial resolution of 30 m) [38] with AERMOD and reports an increase in accuracy in modeling around complex terrain (e.g., mountain areas).

3. Results

3.1. Near Real-Time Monitoring of Plume SO2 Flux and Soil CO2 Flux

3.1.1. SO2 Monitoring

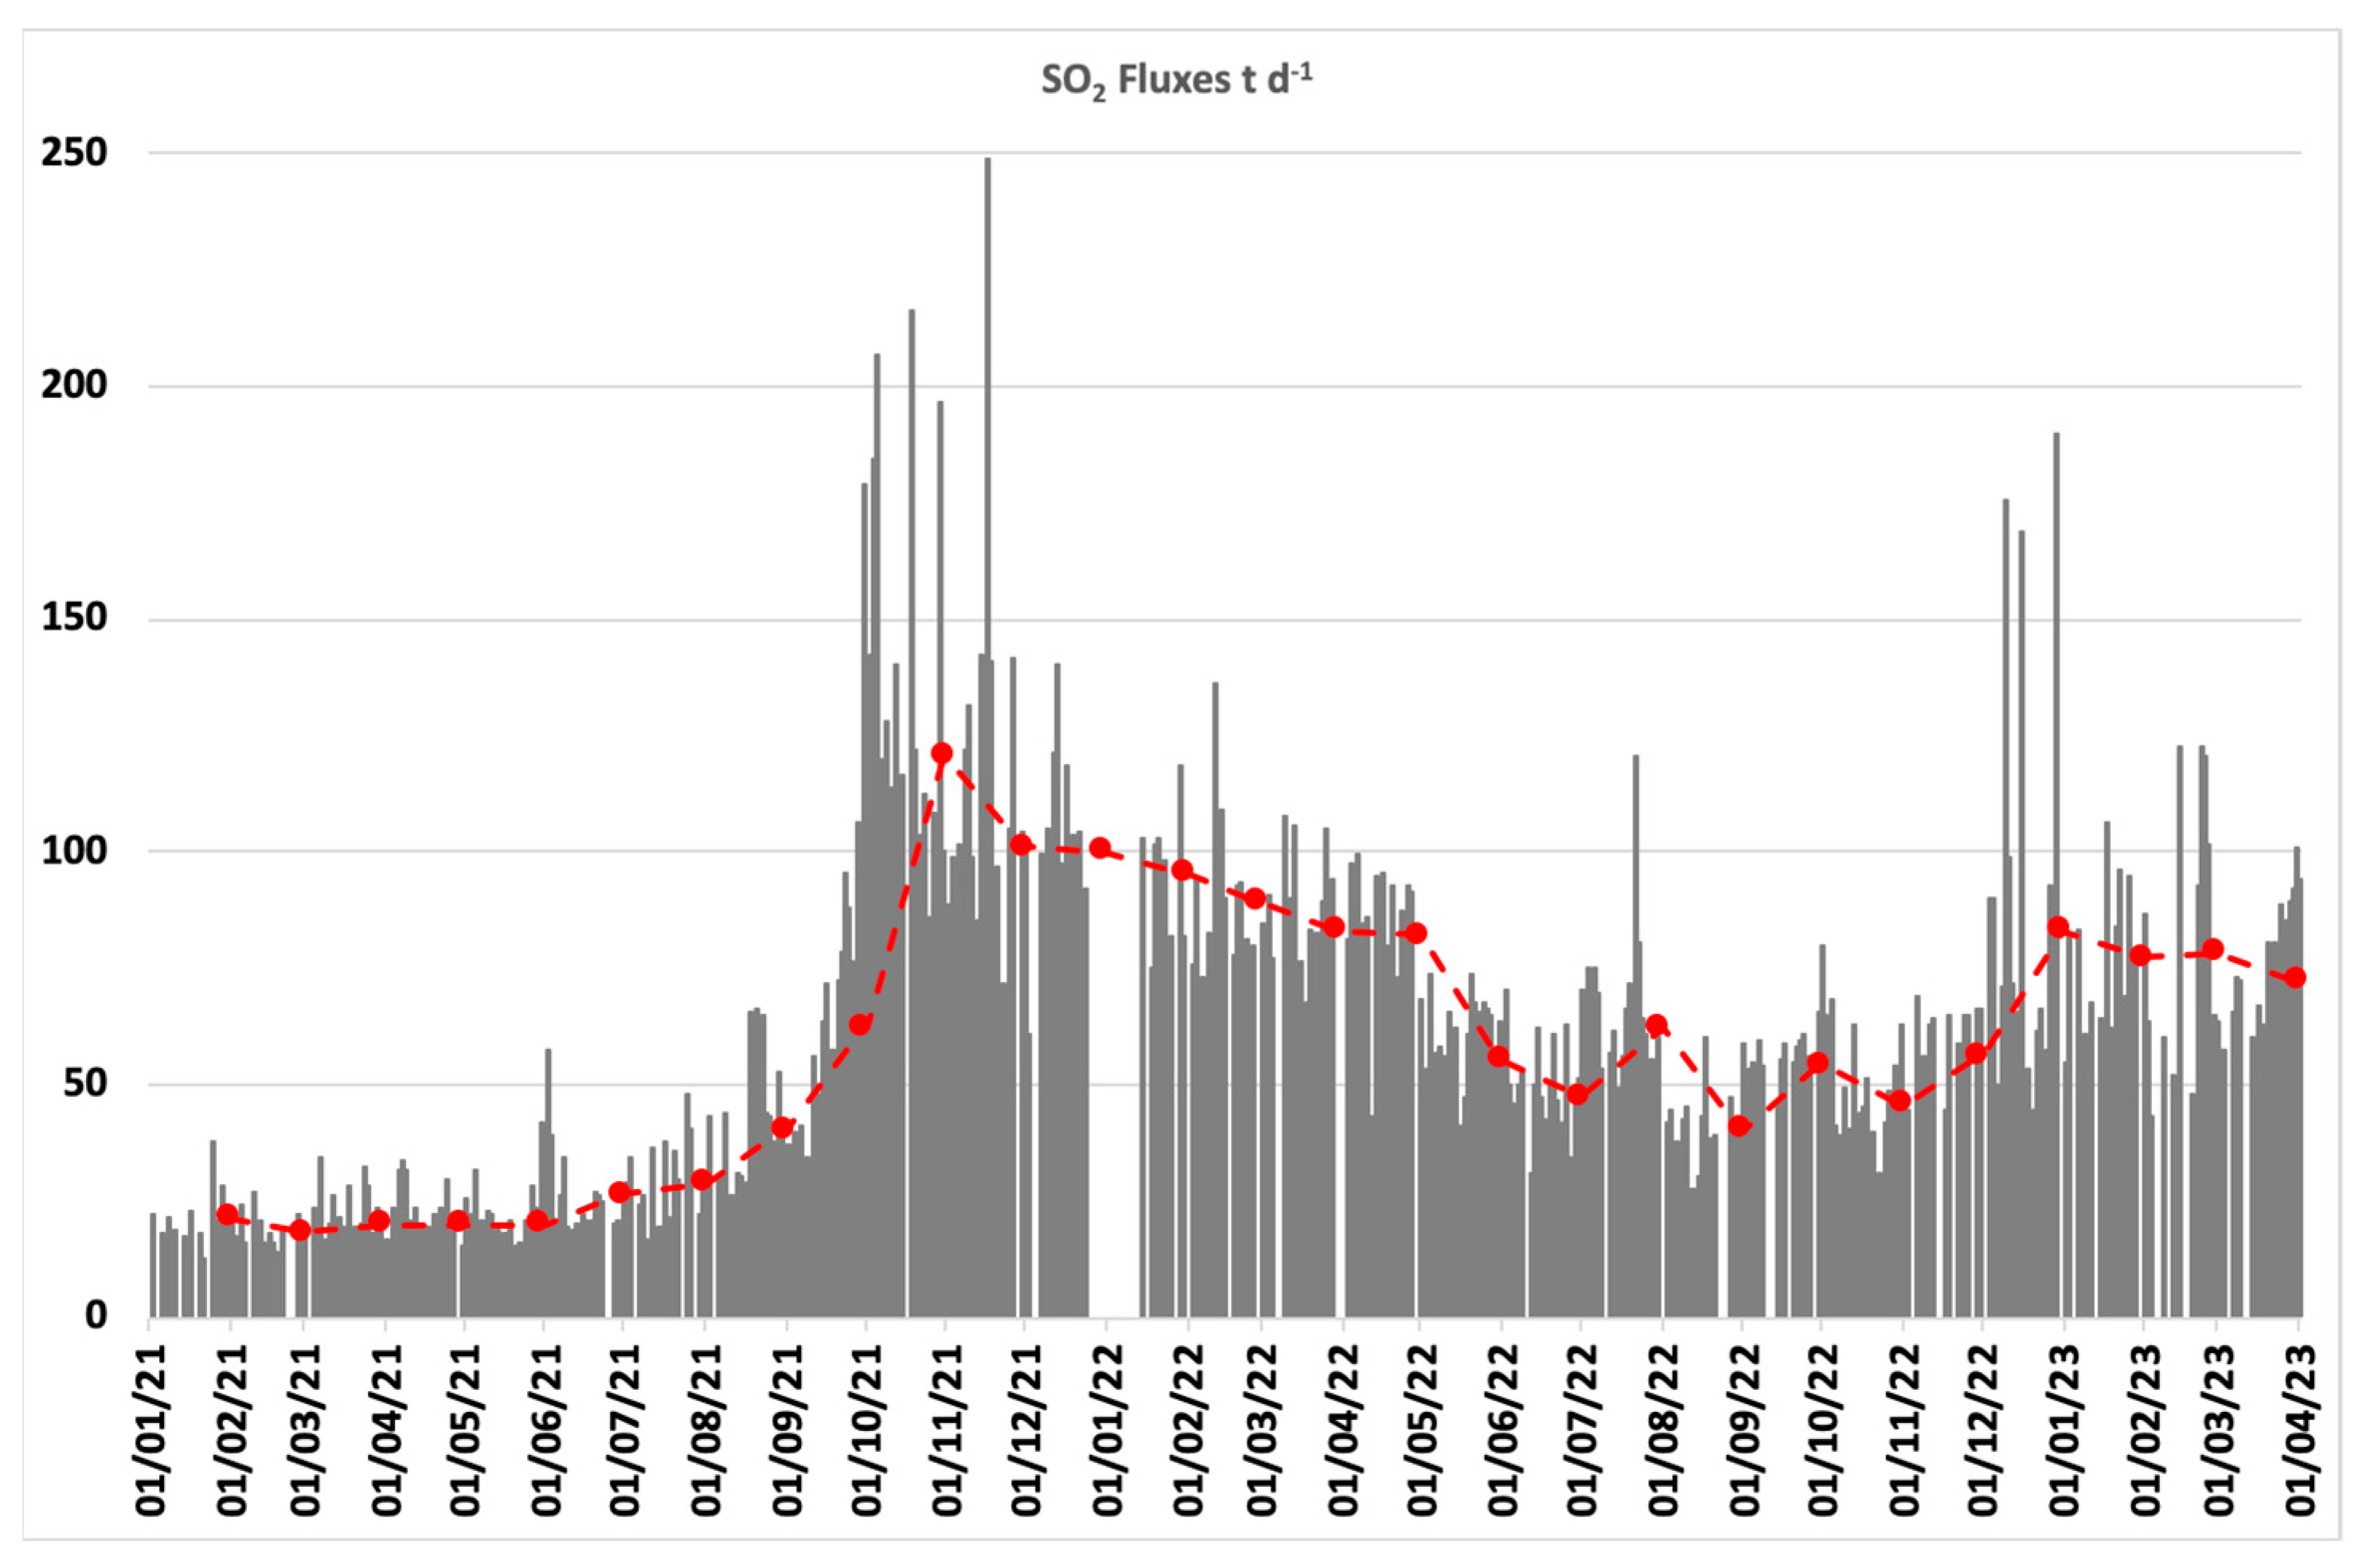
The fluxes of SO2 plume acquired using the UV-scanning DOAS network in the study period (2021–2023) with monthly average values between 20 and 121 t d−1 (Figure 2). The average background level value of 22 t d−1 for the period preceding June 2021 is reported in a previous study [14] (Figure 2). Starting from June 2021 onwards, the SO2 output showed a positive trend with an abrupt increase and reaching the highest monthly value in September 2021 (monthly average value = 121 t d−1) and the highest daily measurement on 16 November 2021 (daily average = 238 t d−1). Thereafter, the SO2 output from the plume showed a smoothly decreasing trend but remained at high values (e.g., September 2022, monthly average value = 55 t d−1). At the end of 2022, a new small increase in SO2 flow was recorded with monthly average values of 70 t d−1 and with daily average peaks over 150 t d−1.

3.1.2. Near Real-Time Soil CO2 Monitoring

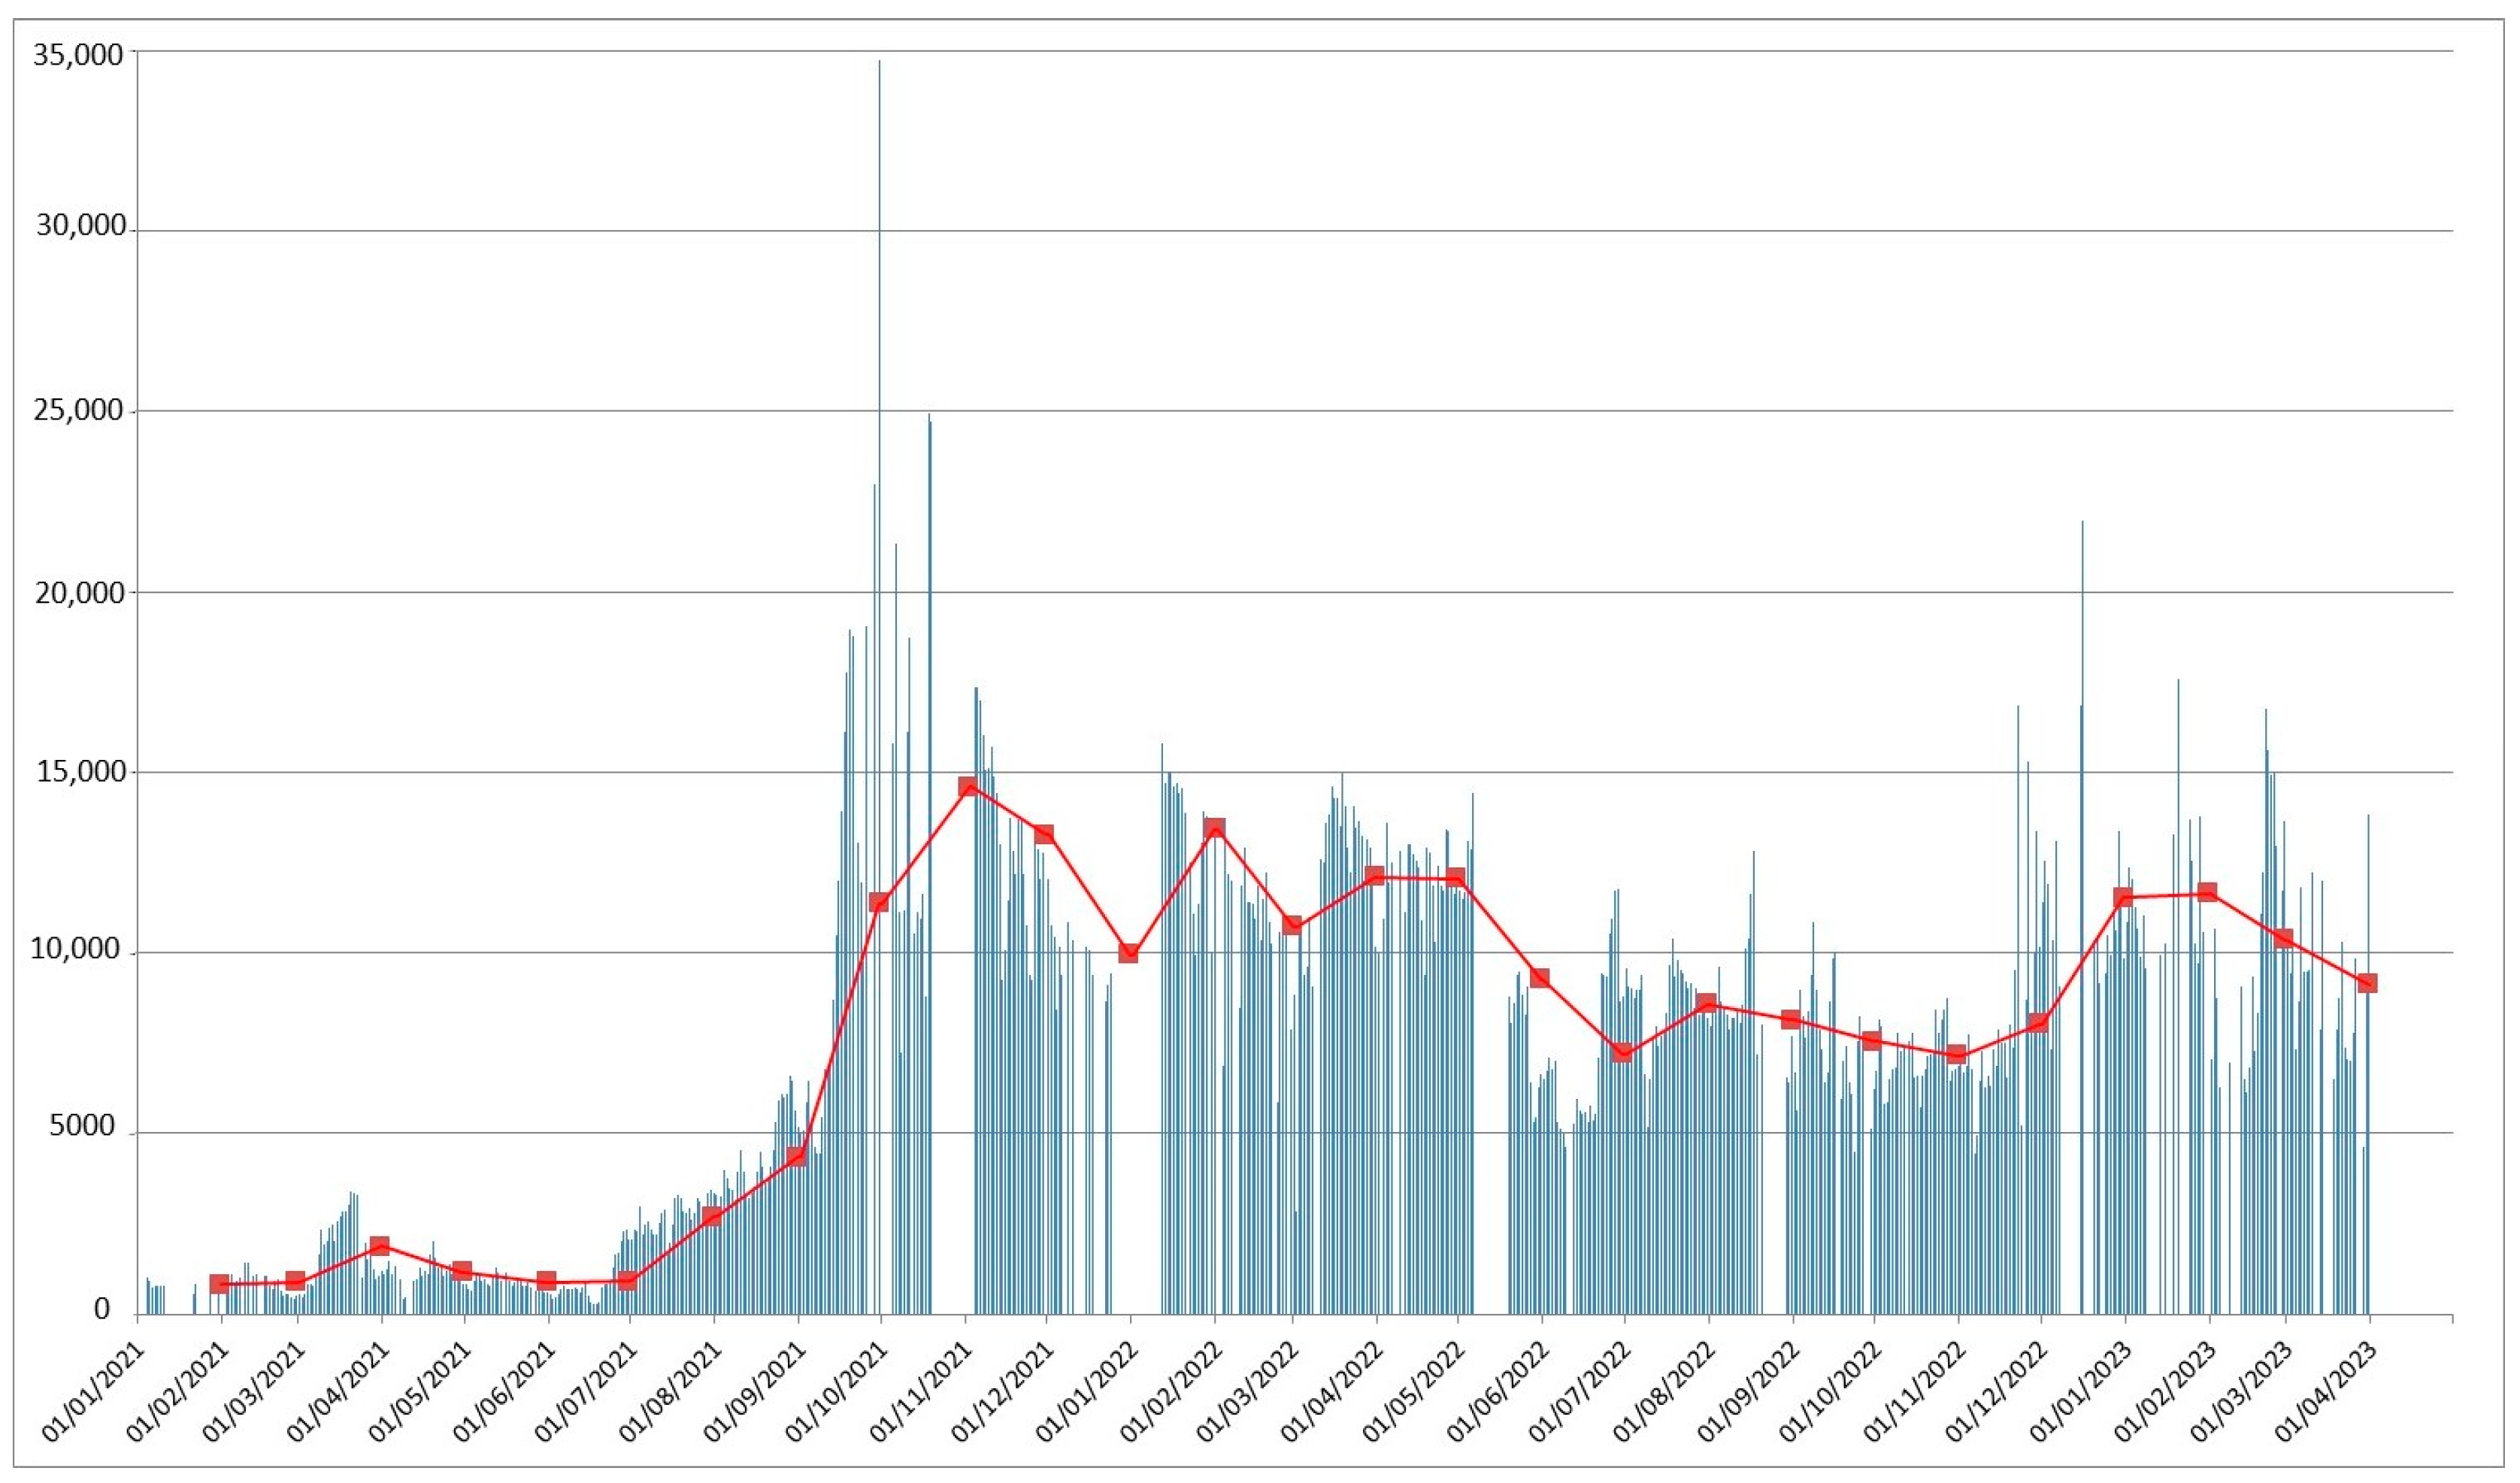
The fluxes of soil CO2 recorded in the period 2021–2023, by the VSCS station, highlighted the changes of the CO2 degassing output in the La Fossa crater area of Vulcano Island (Figure 3.
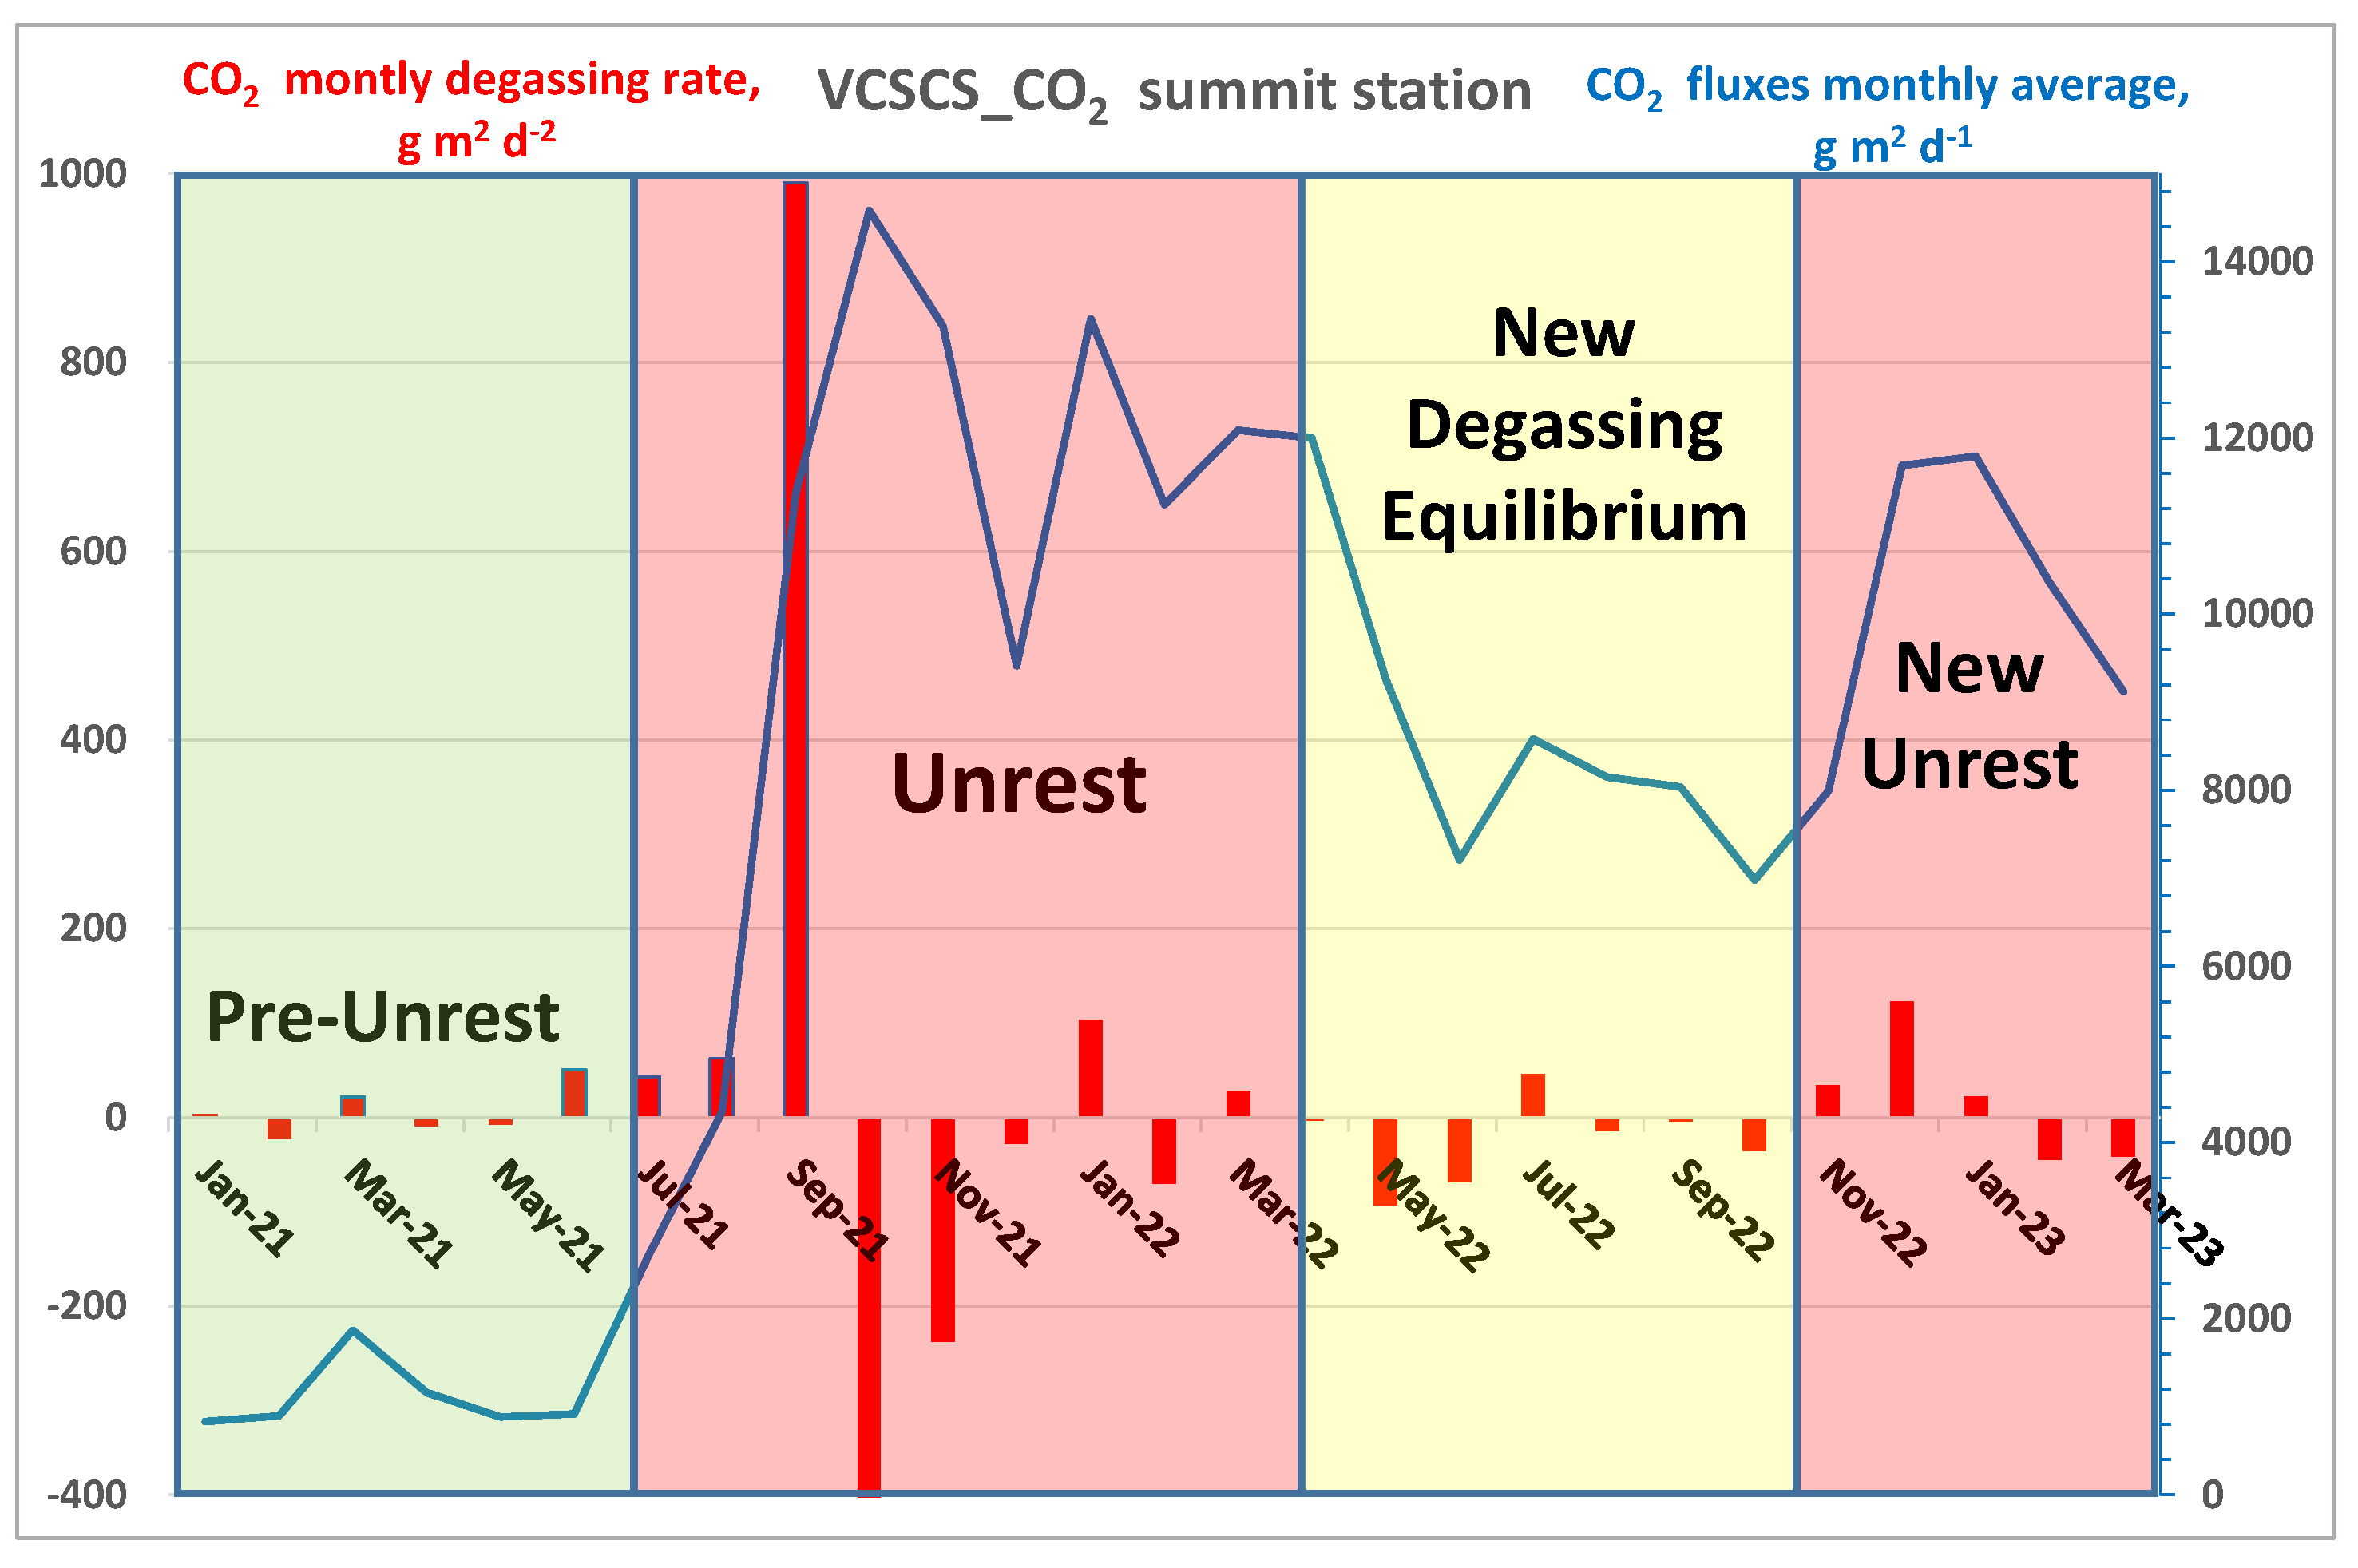
The summit monitoring station (VSCS) showed monthly average values ranging from 800 to 14,000 g m−2 d−1, and the background degassing value of 1720 g m−2 d−1 [9] have been calculated using the data from 2018 to June 2021 (before the last crisis) (Figure 3). From June 2021 onwards, the CO2 output from the VSCS station showed an abrupt increase up to September 2021. In September 2021, the monthly average of the soil CO2 fluxes sharply increased and reached the maximum value of 14,000 g m−2 d−1 in October. Thereafter, the soil CO2 fluxes in the summit area (VSCS) decrease slowly but remained above 8000–9000 g m−2 d−1 until November 2022. Finally, in December 2022, a new input of CO2 has been recorded reaching in January 2023 monthly average values of up to 12,000 g m−2 d−1.

4. SO2 Map Dispersions

AERMOD air quality forecasting model was used for SO2 pollutant dispersion in the period January 2021 to February 2023. The dispersion models were developed using the average wind speed (2.9 m s−1) recorded over the considered period. In the wind rose plot (Figure 4), we can recognize 10 preferential directions with the dominant wind coming from NE and NNW, followed by WNW, W, and WSW. As shown in Figure 4A, the contour plot of the average concentration of SO2 map dispersion in the study site is modeled as 24 h with a flux of 22 t d−1. The maximum concentration of SO2 (red line) were registered in the proximity of the crater and fumarole field, with values >600 μg m−3. Instead, lower SO2 concentration (blue line) values of 42 μg m−3 was detected close to the village located in the northern area at 1.2 km from the main source. Intermediate concentrations of SO2 between 115 and 331 μg m−3 was recorded in the uninhabited area on the slopes of the volcano. Apparently, due to the dilution effect, the concentrations of SO2 reaching the southern part of the island are negligible. The SO2 concentrations registered close to the village are similar to the air quality limit (40 μg m−3) established by World Health Organization (WHO). On the other hand, following the current 24 h limit value of the Italian air quality norms (125 μg m−3), the concentration of SO2 is 2.9 times lower. Figure 4B shows the SO2 concentration contour plot for 24 h with an anomalous flux event of 238 t d−1. The highest SO2 concentration (red line) of >6000 μg m−3 was reported at the bottom of the volcano crater. In this case, distribution maps predicted an SO2 concentration of about 443 μg m−3 that could affect the village (blue line). Under these conditions, the concentration of SO2 which affects the resident population in the northern area is 11 and 3.5 times higher than the air quality limit established by WHO and Italian norms, respectively. In addition, across the edge and at the foot of the crater, intermediate SO2 concentrations between 1172 and 3344 μg m−3 were recorded. According to the model simulation and considering both scenarios (22 and 238 t d−1), the harbor area (Vulcano Porto) is less affected by SO2 emissions and the southern area of the Vulcano Island is also less affected.

5. Discussion

The CO2 and SO2 fluxes monitoring at Vulcano Island showed a great and sharp increase in the degassing rate, allowing the hypothesis of the arrival of a new magma input [9,14,16] and as a consequence a new higher level of degassing activity.
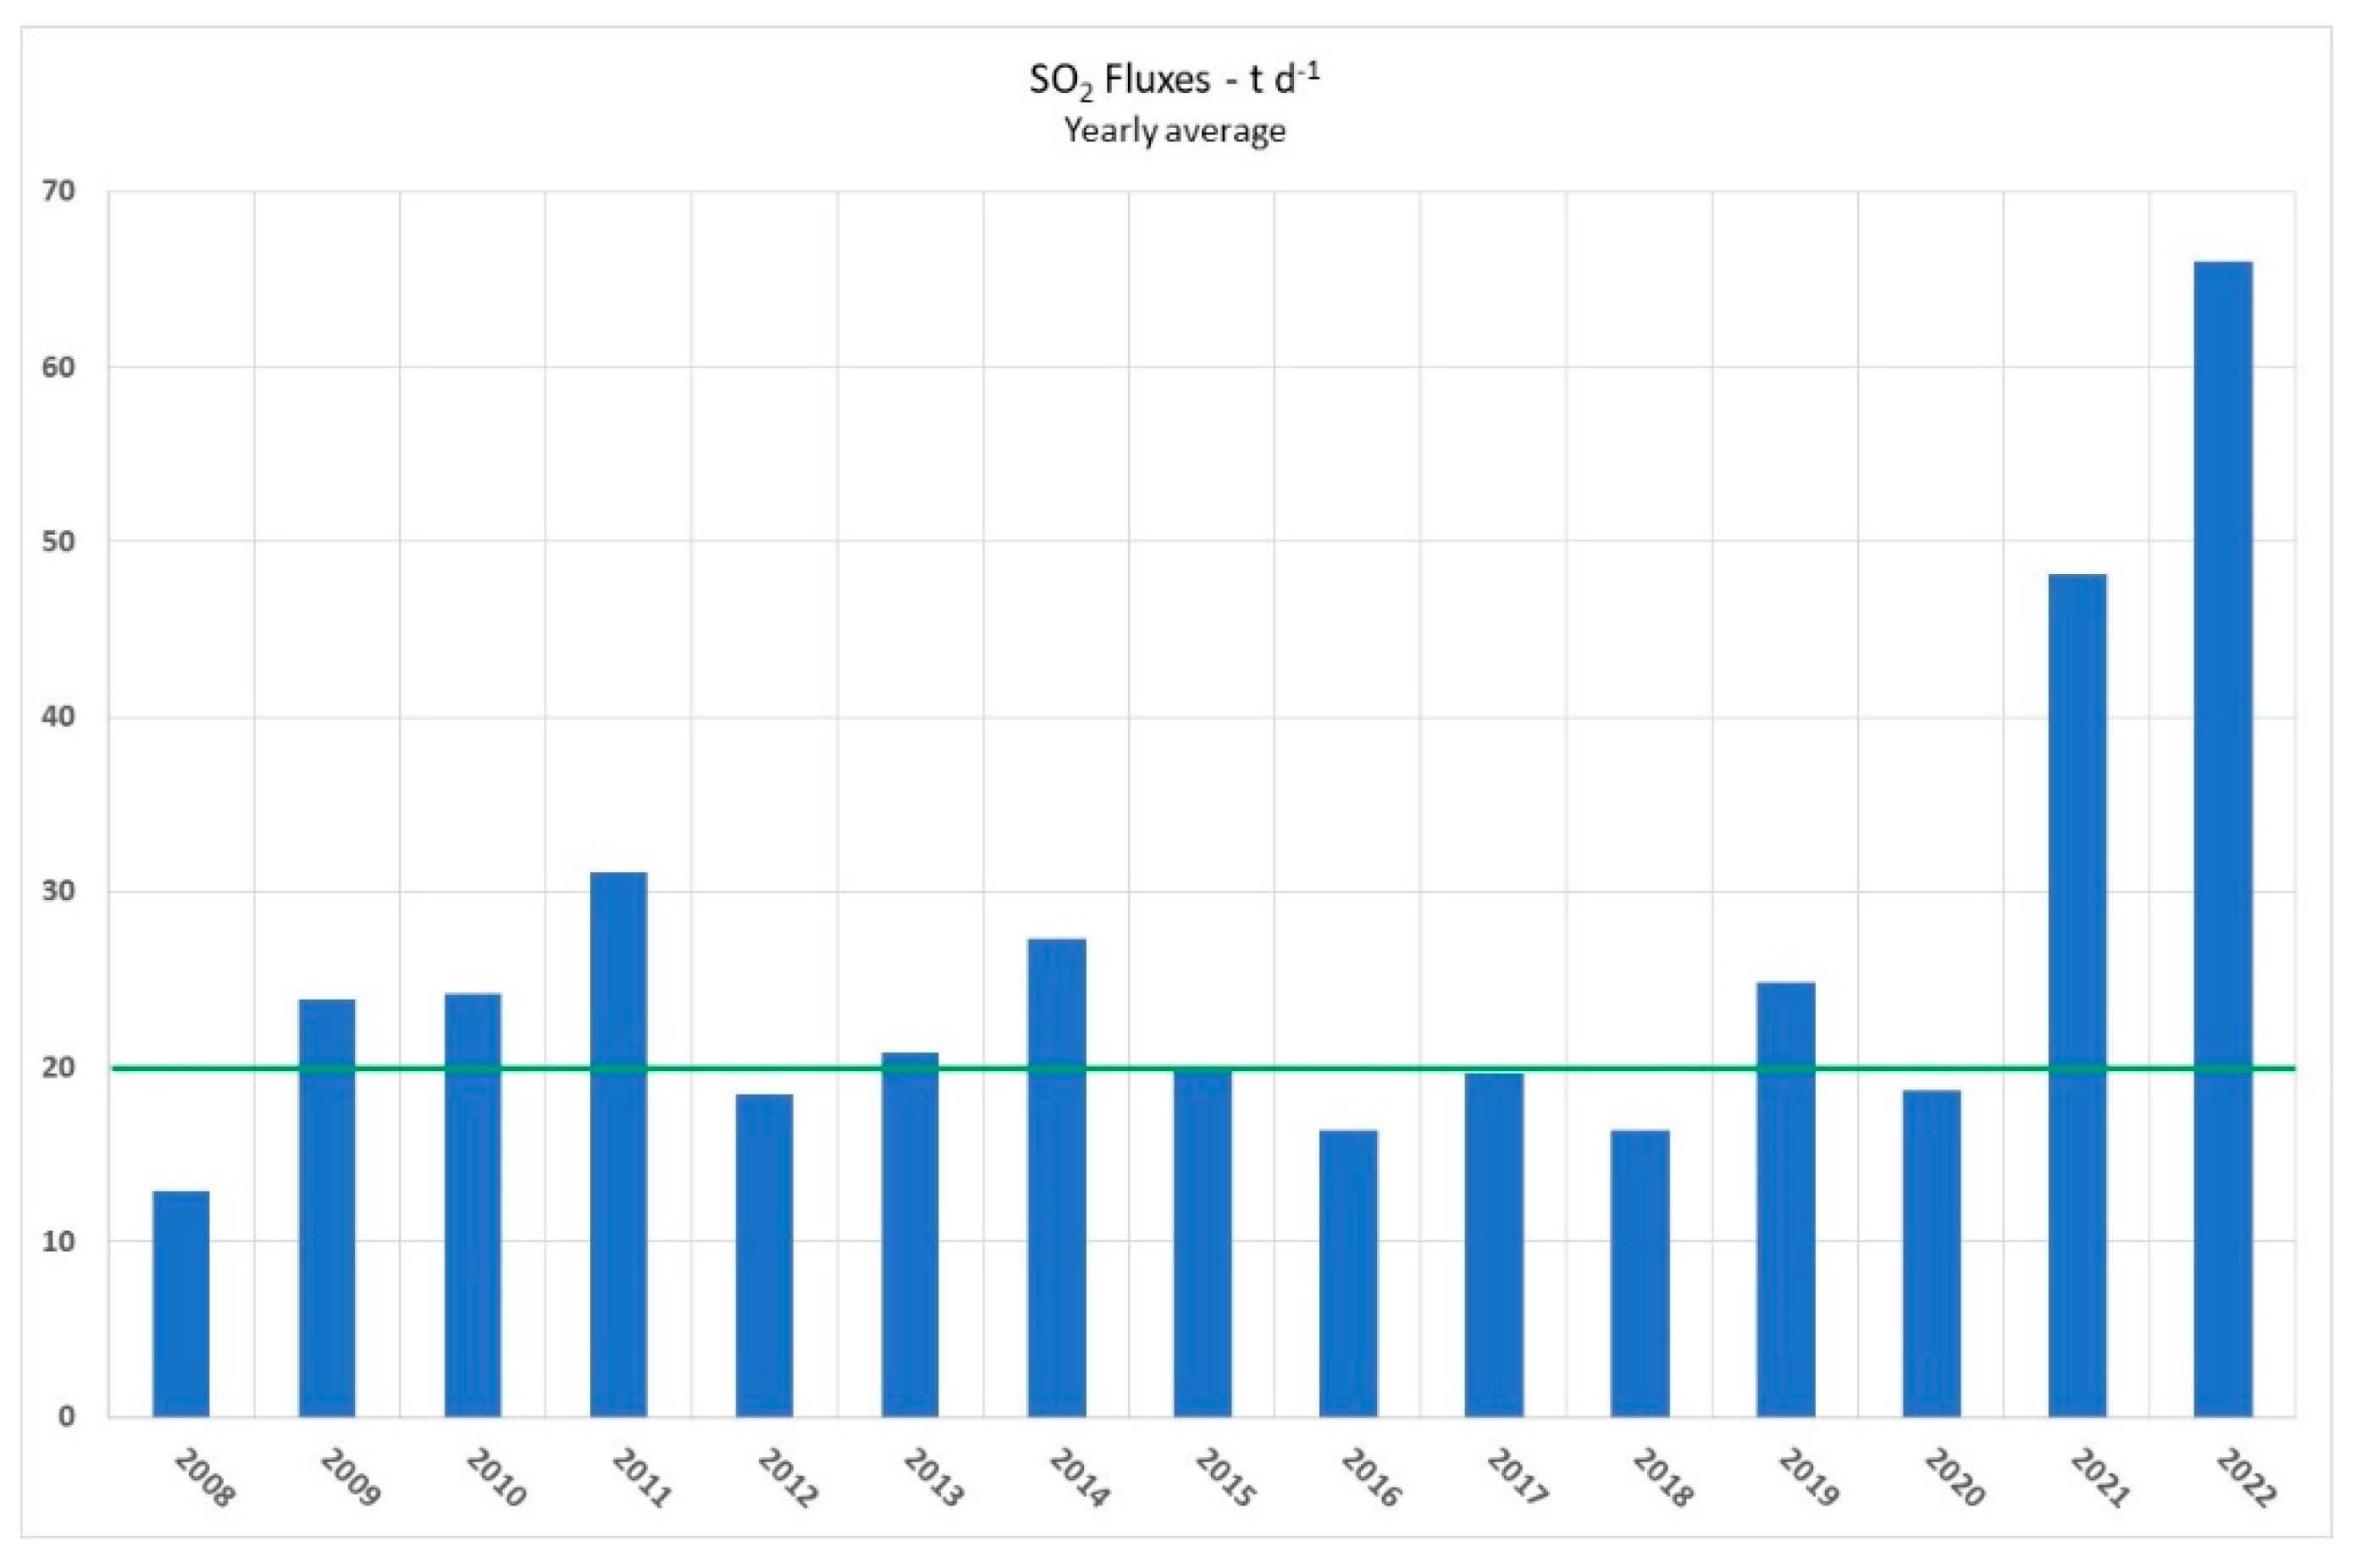
To better frame this increase in the normal outgassing observed over the years in the Vulcano island system, the yearly average of SO2 plume flux from 2008 to 2022 has been plotted in Figure 5. This graphic showed values around 20 t d−1 in the observation period from 2008 to 2020, while a strong increase in SO2 plume degassing reaching around 50 t d−1 has been observed in 2021. Finally, in 2022, the yearly average value of SO2 degassing increased up to around 65 t d−1 due to a geochemical crisis started in June 2021 and characterized by strong degassing processes.
On the basis of the yearly average values, we estimated the yearly output of SO2 from Vulcano island (Figure 6) that showed a background value of 7700 t calculated for the period 2008–2020, and high values of SO2 output degassing of 18,000 and 24,000, respectively, for 2021 and 2022.
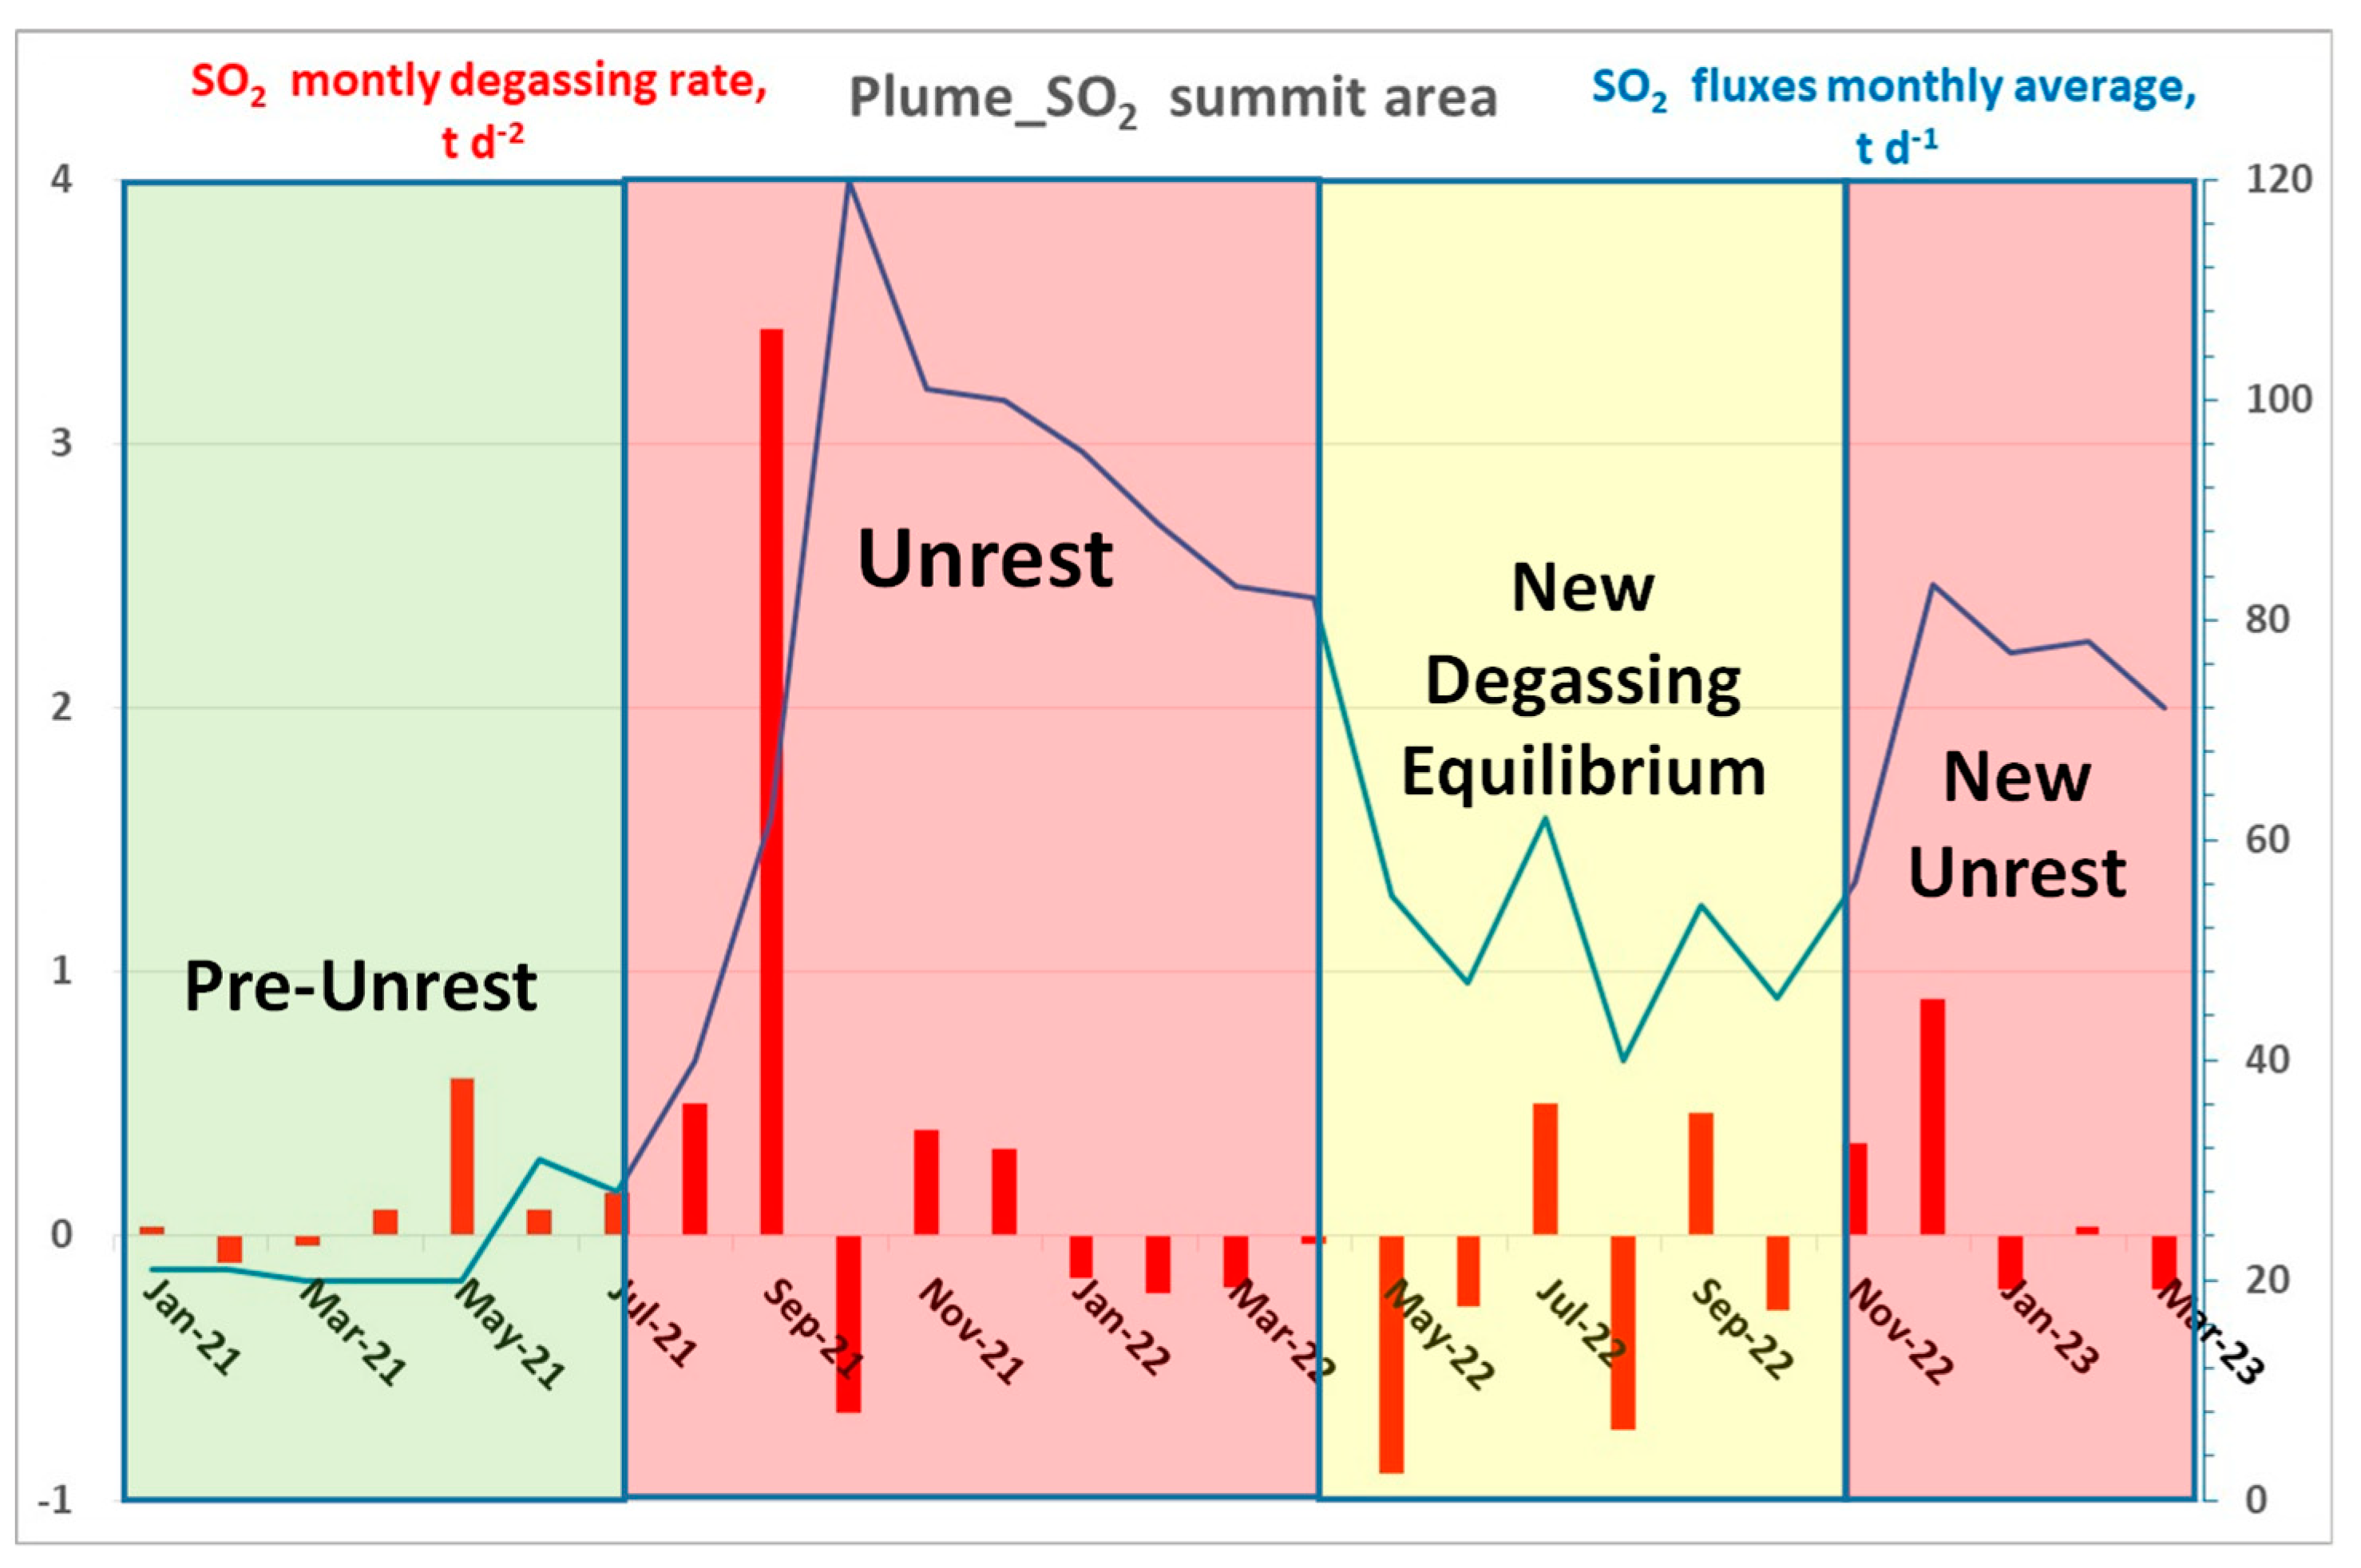
Figure 7 shows the values of SO2 monthly average fluxes and their degassing rate from January 2021 to April 2023. We shared this peculiar degassing period in four phases (Table 1): Pre-Unrest, Unrest, New degassing equilibrium, and New Unrest with mean degassing fluxes of 22 t d−1, 89 t d−1, 51 t d−1, and 78 t d−1, respectively (Table 1). It is clear that the big increase in SO2 degassing rate during the event occurred from June–September 2021, exhibiting an increase from 0.1 to 3.5 t d−2. This great and abrupt change in the SO2 degassing rate resulted in a monthly average SO2 degassing value of up to 120 t d−1 in October 2021, causing a strong increase in SO2 discharged in the atmosphere. Then, we observed decreased SO2 fluxes from April–November 2022 that indicate a new degassing equilibrium with values around 50 t d−1, remaining one order of magnitude higher with respect to the Pre-Unrest phase. Finally, in November 2022 to April 2023, we recorded a new SO2 input event, with a new increased degassing rate around 1 t d−2, and an average SO2 fluxes that reached 78 t d−1.
Similar behavior to the SO2 outgassing style was exhibited by the soil CO2 summit degassing monitored by the VSCS station (Figure 8).
In fact, a near-synchronous strong degassing of CO2 has been recorded from June–September 2021 with a high degassing rate of up to 1000 g m−2 d−2 that resulted in a monthly CO2 degassing of 14,000 g m−2 d−1 in October 2021. Then, in the last months of 2022, a new input of volatiles was observed in the shallow plumbing system and reaching a monthly CO2 degassing of about 12,000 g m−2 d−1 at the surface.
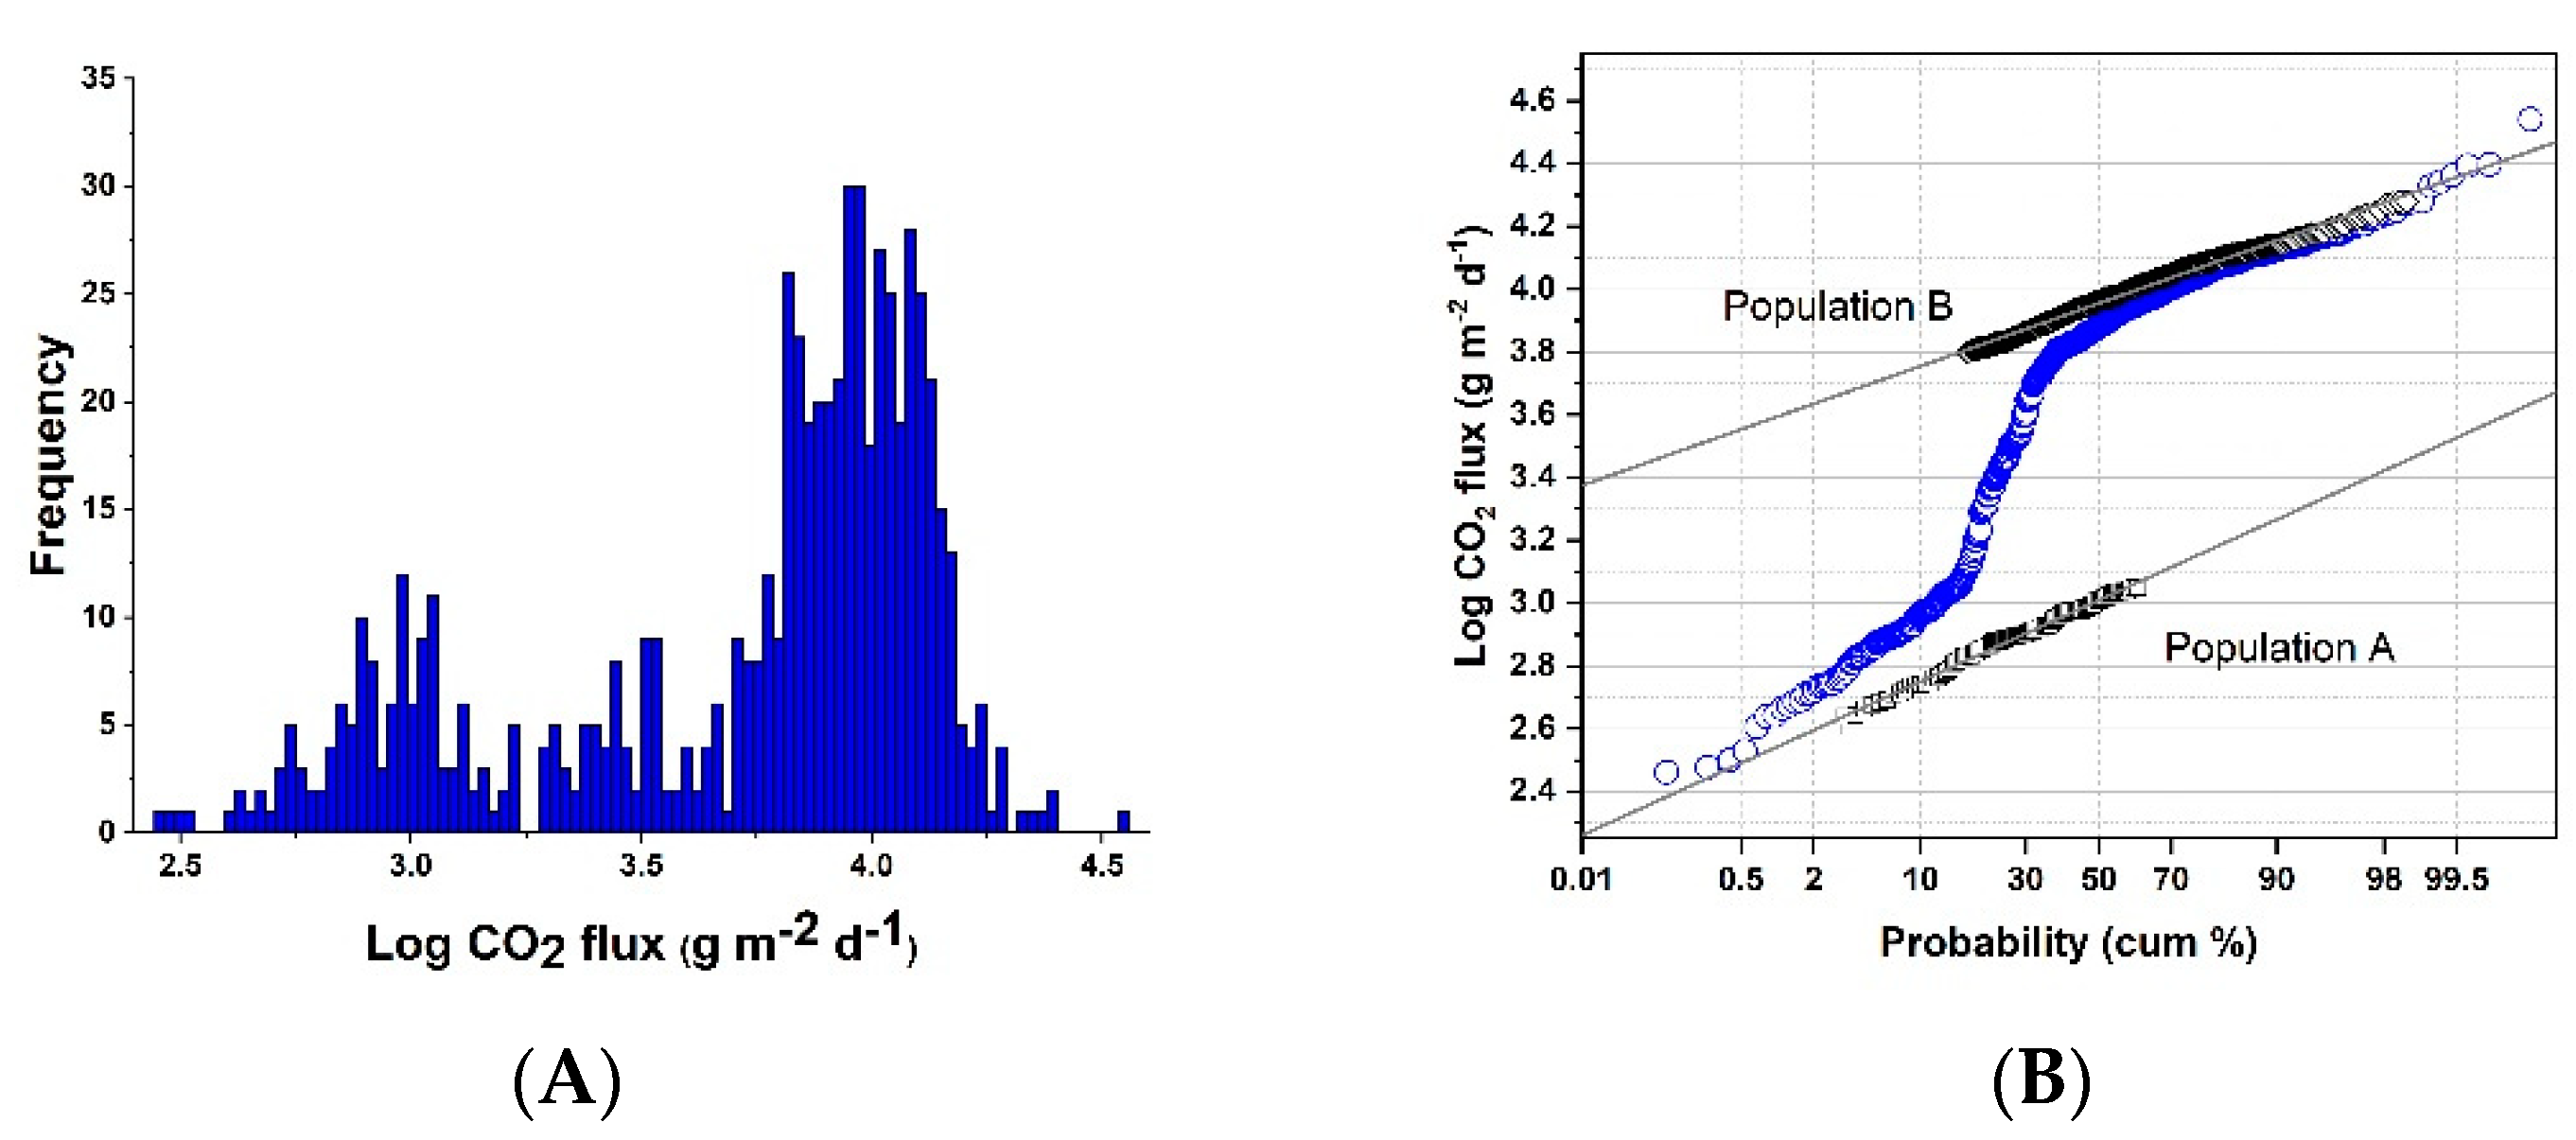
The probability plot resulting from the flux measured at VSCS station (Figure 9) shows two log-normal distributions with one corresponding to background CO2 flux emissions (Population A) and the second one corresponding to higher CO2 fluxes (Population B). Table 2 shows the summary of the statistics of the two populations.
The statistics of the CO2 flux from the VSCS station show similar results for the SO2 flux (Table 3). The pre-event CO2 flux values were lower in the period before August 2021, and the flux values stayed elevated after the event from August 2021–April 2022, suggesting a new degassing equilibrium after the event.
The environmental risk caused by the strong and sudden increase in SO2 fluxes recorded in 2021 and 2022 affected the SO2 concentration in the atmosphere of Vulcano Island, leaving 2022 to 2023 average values of degassing fluxes always one order of magnitude higher with respect to the background values recorded in the last two decades [13,14,23,28].
The simulation model of SO2 pollution described in both scenarios (Figure 4A,B) show that meteorological parameters and local topographic conditions play an important role in atmospheric dispersion. In the vicinity of the village and Vulcano harbor (northern sector), a low health risk has been detected for the resident population considering the average SO2 flux condition (22 t d−1) in short-term exposure. During the peak emission event (238 t d−1), high concentrations of SO2 reached the southern part of the village, with possible health concerns for the population. People walking near the source and the fumarolic field as well as the researchers and technicians that frequently carry out volcanic monitoring campaigns are exposed to high concentrations of SO2 that could have an adverse effect on health in a short time. Finally, Figure 10 represents the dispersion of SO2 in the equilibrium condition of the system, with an average wind speed of 2.9 m s−1 and an average measured flux of 65 t d−1 (yearly average values of 2022). As seen previously, an important dilution effect affects the area surrounding the Vulcano fumarolic field. The lowest concentrations of SO2 were recorded in the outermost isoline (white line), with values of 114 μg m−3, which is 2.8 times higher than the 24 h exposure limit (40 μg m−3) proposed by the WHO (World Health Organization). While considering the 24 h exposure limit proposed by Italian norms (125 μg m−3), no adverse health effects were detected. Exposure to low concentrations of SO2 by the inhabitants of the island does not seem to produce adverse health effects in the short term. The long-term effects have yet to be studied in detail (monthly and yearly exposure), especially considering periods of anomalous activity and the direction of the prevailing winds.
In addition to SO2, other pollutants are normally emitted from the volcanic fumaroles system, such as H2S and CO2 [39]. A recent study was carried out on the island of Vulcano by Diliberto et al. 2021 [40] that highlighted the volcanic hazard in the Levante Bay area due to the passive fluid degassing of H2S gas and the subsequent anomalous concentrations in the atmosphere and the harmful effects on human health in relation to the concentration and exposure time.
Furthermore, another study on the dispersion of volcanic gases in the atmosphere of the island of Vulcano was carried out by Granieri et al. 2014 [41] that studied the dispersion of the CO2 emitted by the solfataric area of the summit and produced the iso-concentration maps involving the summit and peripherals area with particular attention to the village of Vulcano Porto. The results of this investigation showed that the CO2 concentrations in the air at human breathing height, estimated from the dispersion models, are negligible in the Vulcano Village and that the anomalous direct-measured CO2 concentrations in the atmosphere are due to local outgassing from the surrounding soil. While in the crater area, the air CO2 content due to both the soil degassing and crater fumaroles, on the basis of the speed and direction of the wind, may reach CO2 levels harmful for visitors in some areas of the crater’s rim or bottom.

6. Conclusions

The sharp increase in the degassing of volatiles observed in 2021, never recorded in the last two decades, showed two clear fundamental implications: environmental and volcanic. In particular, the anomalous increase in outgassing has worried the scientific community regarding the possibility of the occurrence of a paroxysmal event [9,13,14,15,16]. In fact, the near-continuous monitoring data of extensive parameters, such as the SO2 plume and soil CO2 degassing in the summit area, showed similar behaviors, highlighting a strong deep volcanic fluids input released from the new and rich magma batch in 2021 and subsequently in 2023 that affected the concentration of these species in the shallow plumbing system. The deep input of volatile degassing that started in 2021 keeps showing up in the 2023 anomalous average values of SO2 and CO2 degassing, which have remained well above the normal baseline levels recorded in recent decades. Therefore, the surface fluid system of the volcano is now at a higher energy level both in terms of mass and energy, and a possible new input could act as a trigger for a paroxysmal event, which would find the energy in the large quantity of volatiles stored in the surface system.
Furthermore, the increase in the concentration of volcanic gases in the atmosphere has also caused an environmental alert for public health. Consequently, the Italian Civil Protection declared an environmental state of emergency and ordered the evacuation of the population from the inhabited center of Vulcano Porto in November 2021. In addition, the authorities have also ordered a ban on tourist access to Vulcano Island for a month. Finally, in May 2023, considering the persistence of high fluxes of volatiles (CO2 and SO2) emitted from the summit system into the atmosphere, the Mayor of Lipari regulated the access of tourists to the crater area of Vulcano, through the weather conditions (wind speed and direction), to avoid access when the wind blows in the direction of the path that leads to the summit of the volcano.
In conclusion, the new geochemical crisis that began in June 2021 has not yet shown irrefutable signs of a return to the background values recorded in the last 20 years of observation. It would seem at the moment that the surface system of the island of Vulcano has settled on a new and higher level of background both in mass and in energy. For this reason, the volcanic system of the island of Vulcano deserves a high level of attention for volcanic monitoring by the scientific community and by the Civil Protection.

Author Contributions

Conceptualization, S.I. and F.V.; methodology, S.I., F.V., C.I., A.M. and B.S.; validation, S.I., F.V. and A.M.; investigation, S.I.; data curation, F.V., S.I. and A.M.; writing—original draft preparation, S.I., A.M., C.I. and B.S.; writing—review and editing, S.I., C.I., A.M., F.V. and B.S. All authors have read and agreed to the published version of the manuscript.

Funding

This research was funded by the INGV-DPCN (Italian National Institute of Geophysics and Volcanology-Italian National Department for Civil Protection) volcanic surveillance program of Vulcano island, ObFu 0304.010. Moreover, this investigation was partially funded by TORS project in the framework of institutional INGV projects (“Ricerca Libera”, ObFu 9999.549 and Pianeta Dinamico Task V2, ObFu 1020.010).

Data Availability Statement

Not applicable.

Acknowledgments

The authors wish to thank their colleagues at the Istituto Nazionale di Geofisica e Vulcanologia of Palermo for their help in acquiring and processing data and for their support in field logistics.

Conflicts of Interest

The authors declare no conflict of interest.

References

  1. Brantley, S.L.; Koepenick, K.W. Measured carbon dioxide emissions from Oldoinyo Lengai and the skewed distribution of passive volcanic fluxes. Geology 1995, 23, 933–936. [Google Scholar] [CrossRef]
  2. Arthur, M.A. Volcanic contributions to the carbonand sulfur geochemical cycles and global change. In Encyclopedia of Volcanoes; Sigurdsson, H., Houghton, B., Rymer, H., Stix, J., McNutt, S., Eds.; Academic Press: San Diego, CA, USA, 2000; pp. 1045–1056. [Google Scholar]
  3. Carn, S.A.; Fioletov, V.E.; McLinden, C.A.; Li, C.; Krotkov, N.A. A decade of global volcanic SO2 emissions measured from space. Sci. Rep. 2017, 7, 44095. [Google Scholar] [CrossRef] [Green Version]
  4. Stevenson, D.S.; Johnson, C.E.; Collins, W.J.; Derwent, R.G. The Tropospheric Sulphur Cycle and the Role of Volcanic SO2; Special Publications; Geological Society: London, UK, 2007; Volume 213, p. 295. [Google Scholar] [CrossRef]
  5. Capasso, G.; Favara, R.; Inguaggiato, S. Chemical features and isotopic composition of gaseous manifestations on Vulcano Island, Aeolian Islands, Italy: An interpretative model of fluid circulation. Geochim. Cosmochim. Acta 1997, 61, 3425–3440. [Google Scholar] [CrossRef]
  6. Paonita, A.; Favara, R.; Nuccio, P.M.; Sortino, F. Genesis of fumarolic emissions as inferred by isotope mass balances: CO2 and water at Vulcano Island, Italy. Geochim. Cosmochim. Acta 2002, 66, 759–772. [Google Scholar] [CrossRef]
  7. Aiuppa, A.; Inguaggiato, S.; Mcgonigle, A.J.S.; O’Dwyer, M.; Oppenheimer, C.; Padgett, M.J.; Rouwet, D.; Valenza, M. H2S fluxes from Mt. Etna, Stromboli, and Vulcano (Italy) and implications for the sulfur budget at volcanoes. Geochim. Cosmochim. Acta 2005, 69, 1861–1871. [Google Scholar] [CrossRef]
  8. McGonigle, A.J.S.; Aiuppa, A.; Giudice, G.; Tamburello, G.; Hodson, A.J.; Gurrieri, S. Unmanned aerial vehicle measurements of volcanic carbon dioxide fluxes. Geophys. Res. Lett. 2008, 35. [Google Scholar] [CrossRef] [Green Version]
  9. Federico, C.; Cocina, O.; Gambino, S.; Paonita, A.; Branca, S.; Coltelli, M.; Italiano, F.; Bruno, V.; Caltabiano, T.; Camarda, M.; et al. Inferences on the 2021 Ongoing Volcanic Unrest at Vulcano Island (Italy) through a Comprehensive Multidisciplinary Surveillance Network. Remote Sens. 2023, 15, 1405. [Google Scholar] [CrossRef]
  10. Chiodini, G.; Granieri, D.; Avino, R.; Caliro, S.; Costa, A.; Werner, C. Werner Carbon dioxide diffuse degassing and estimation of heat release from volcanic and hydrothermal systems. J. Geophys. Res. 2005, 110, B08204. [Google Scholar] [CrossRef]
  11. Inguaggiato, S.; Mazot, A.; Diliberto, I.S.; Inguaggiato, C.; Madonia, P.; Rouwet, D.; Vita, F. Total CO2 output from Vulcano island (Aeolian Islands, Italy). Geochemistry, Geophysics. Geosystems 2012, 13, Q02012. [Google Scholar] [CrossRef]
  12. Fischer, T.P.; Arellano, S.; Carn, S.; Aiuppa, A.; Galle, B.; Allard, P.; Lopez, T.; Shinohara, H.; Kelly, P.; Werner, C.; et al. The emissions of CO2 and other volatiles from the world’s subaerial volcanoes. Sci. Rep. 2019, 9, 18716. [Google Scholar] [CrossRef] [Green Version]
  13. Inguaggiato, S.; Vita, F.; Diliberto, I.S.; Mazot, A.; Calderone, L.; Mastrolia, A.; Corrao, M. The Extensive Parameters as a Tool to Monitoring the Volcanic Activity: The Case Study of Vulcano Island (Italy). Remote Sens. 2022, 14, 1283. [Google Scholar] [CrossRef]
  14. Inguaggiato, S.; Vita, F.; Diliberto, I.S.; Inguaggiato, C.; Mazot, A.; Cangemi, M.; Corrao, M. The volcanic activity changes occurred in the 2021–2022 at Vulcano island (Italy), inferred by the abrupt variations of soil CO2 output. Sci. Rep. 2022, 12, 21166. [Google Scholar] [CrossRef]
  15. Aiuppa, A.; Bitetto, M.; Calabrese, S.; Delle Donne, D.; Lages, J.; La Monica, F.P.; Chiodini, G.; Tamburello, G.; Cotterill, A.; Pistolesi, M.; et al. Mafic magma feeds degassing unrest at Vulcano Island, Italy. Commun. Earth Environ. 2022, 3, 255. [Google Scholar] [CrossRef]
  16. Di Martino, R.M.R.; Gurrieri, S.; Camarda, M.; Capasso, G.; Prano, V. Hazardous changes in soil CO2 emissions at Vulcano, Italy, in 2021. J. Geophys. Res. Solid Earth 2022, 127, e2022JB024516. [Google Scholar] [CrossRef]
  17. Arellano, S.; Galle, B.; Apaza, F.; Avard, G.; Barrington, C.; Bobrowski, N.; Bucarey, C.; Burbano, V.; Burton, M.; Chacón, Z.; et al. Synoptic analysis of a decade of daily measurements of SO2 emission in the troposphere from volcanoes of the global ground-based Network for Observation of Volcanic and Atmospheric Change. Earth Syst. Sci. Data 2021, 13, 1167–1188. [Google Scholar] [CrossRef]
  18. Platt, U. Differential optical absorption spectroscopy (DOAS). In Air Monitoring by Spectroscopic Techniques; Chemical Analysis Series; Sigrist, M.W., Ed.; John Wiley & Sons Inc.: Hoboken, NJ, USA, 1994; Volume 127, pp. 27–83. [Google Scholar]
  19. Platt, U.; Stutz, J. Differential Optical Absorption Spectroscopy Principles and Applications, Physics of Earth and Space Environments; Springer: Berlin/Heidelberg, Germany, 2008; p. 597. ISBN 978-3-540-75776-4. [Google Scholar]
  20. Galle, B.; Johansson, M.; Rivera, C.; Zhang, Y.; Kihlman, M.; Kern, C.; Lehmann, T.; Platt, U.; Arellano, S.; Hidalgo, S. Network for Observation of Volcanic and Atmospheric Change (NOVAC): A global network for volcanic gas monitoring -Network layout and instrument description. J. Geophys. Res. 2010, 115, D05304. [Google Scholar] [CrossRef]
  21. Vita, F.; Kern, C.; Inguaggiato, S. Development of a portable active long-path differential optical absorption spectroscopy system for volcanic gas measurements. J. Sens. Sens. Syst. 2014, 3, 355–367. [Google Scholar] [CrossRef] [Green Version]
  22. Vita, F.; Inguaggiato, S.; Bobrowski, N.; Calderone, L.; Galle, B.; Parello, F. Continuous SO2 flux measurements for Vulcano Island, Italy. Ann. Geophys. 2012, 55, 2. [Google Scholar] [CrossRef]
  23. Vita, F.; Arellano, S.; Inguaggiato, S.; Galle, B. SO2 flux of -VULCANO- volcano from the NOVAC data-base, [Data set], v.001. NOVAC Database 2020. [Google Scholar] [CrossRef]
  24. Burton, M.R.; Caltabiano, T.; Murè, F.; Salerno, G.; Randazzo, D. SO2 flux from Stromboli during the 2007 eruption: Results from the FLAME network and traverse measurements. J. Volcanol. Geotherm. Res. 2009, 182, 214–220. [Google Scholar] [CrossRef]
  25. Tamburello, G.; Aiuppa, A.; Kantzas, E.P.; McGonigle, A.J.S.; Ripepe, M. Passive vs. active degassing modes at an open-vent volcano (Stromboli, Italy). Earth Planet. Sci. Lett. 2012, 359, 106–116. [Google Scholar] [CrossRef] [Green Version]
  26. Inguaggiato, S.; Vita, F.; Rouwet, D.; Bobrowski, N.; Morici, S.; Sollami, A. Geochemical evidence of the renewal of volcanic activity inferred from CO2 soil and SO2 plume fluxes: The 2007 Stromboli eruption (Italy). Bull. Volcanol. 2011, 73, 443–456. [Google Scholar] [CrossRef]
  27. Granieri, D.; Vita, F.; Inguaggiato, S. Volcanogenic SO2, a natural pollutant: Measurements, modeling and hazard assessment at Vulcano Island (Aeolian Archipelago, Italy). Environ. Pollut. 2017, 231, 219–228. [Google Scholar] [CrossRef]
  28. Inguaggiato, S.; Calderone, L.; Inguaggiato, C.; Mazot, A.; Morici, S.; Vita, F. Long-time variation of soil CO2 fluxes at summit crater of Vulcano (Italy). Bull. Volcanol. 2012, 74, 1859–1863. [Google Scholar] [CrossRef]
  29. Inguaggiato, S.; Diliberto, I.S.; Federico, C.; Paonita, A.; Vita, F. Review of the evolution of geochemical monitoring, networks and methodologies applied to the volcanoes of the Aeolian Arc (Italy). Earth-Sci. Rev. 2018, 176, 241–276. [Google Scholar] [CrossRef]
  30. Perry, S.G.; Cimorelli, A.J.; Paine, R.J.; Brode, R.W.; Weil, J.C.; Venkatram, A.; Wilson, R.B.; Lee, R.F.; Peters, W.D. AERMOD: A dispersion model for industrial source applications. Part II: Model performance against 17 field study databases. J. Appl. Meteorol. Climatol. 2005, 44, 694–708. [Google Scholar] [CrossRef] [Green Version]
  31. Gibson, M.D.; Pierce, J.R.; Waugh, D.; Kuchta, J.S.; Chisholm, L.; Duck, T.J.; Hopper, J.T.; Beauchamp, S.; King, G.H.; Franklin, J.E.; et al. Identifying the sources driving observed PM2.5 temporal variability over Halifax, Nova Scotia, during BORTAS-B. Atmos. Chem. Phys. 2013, 13, 7199–7213. [Google Scholar] [CrossRef] [Green Version]
  32. Jenkins, S.F.; Barsotti, S.; Hincks, T.K.; Neri, A.; Phillips, J.C.; Sparks, R.S.J.; Sheldrake, T.; Vougioukalakis, G. Rapid emergency assessment of ash and gas hazard for future eruptions at Santorini Volcano, Greece. J. Appl. Volcanol. 2015, 4, 16. [Google Scholar] [CrossRef] [Green Version]
  33. Lee, S.S.; Keener, T.C. Dispersion modeling of mercury emissions from coal fired power plants at Coshocton and Manchester, Ohio. J. Sci. 2008, 108, 65–69. [Google Scholar]
  34. Cimorelli, A.J.; Perry, S.G.; Venkatram, A.; Weil, J.C.; Paine, R.J.; Wilson, R.B.; Lee, R.F.; Peters, W.D.; Paumier, J.O. AERMOD: Description of Model Formulation; U.S. Environmental Protection Agency Report, EPA 2003 454/R,03,002d; U.S. EPA: Washington, DC, USA, 2003; 85p.
  35. Kumar, A.; Dixit, S.; Varadarajan, C.; Vijayan, A.; Masuraha, A. Evaluation of the AERMOD dispersion model as a function of atmospheric stability for an urban area. Environ. Prog. 2006, 25, 141–151. [Google Scholar] [CrossRef]
  36. Silverman, K.C.; Tell, J.G.; Sargent, E.V.; Qiu, Z. Comparison of the Industrial Source Complex and AERMOD Dispersion Models: Case Study for Human Health Risk Assessment. J. Air Waste Manag. Assoc. 2007, 57, 1439–1446. [Google Scholar] [CrossRef] [PubMed] [Green Version]
  37. Cimorelli, A.J.; Perry, S.G.; Venkatram, A.; Weil, J.C.; Paine, R.J.; Wilson, R.B.; Lee, R.F.; Peters, W.D.; Brode, R.W. AERMOD: A Dispersion Model for Industrial Source Applications. Part I: General Model Formulation and Boundary Layer Characterization. J. Appl. Meteorol. Climatol. 2005, 44, 682–693. [Google Scholar] [CrossRef] [Green Version]
  38. Langner, C.; Klemm, O. A Comparison of Model Performance between AERMOD and AUSTAL2000. J. Air Waste Manag. Assoc. 2011, 61, 640–646. [Google Scholar] [CrossRef] [Green Version]
  39. Hansell, A.L.; Horwell, C.J.; Oppenheimer, C. The health hazards of volcanoes and geothermal areas. Occup. Environ. Med. 2006, 63, 149–156. [Google Scholar] [CrossRef] [PubMed] [Green Version]
  40. Diliberto, I.S.; Cangemi, M.; Gagliano, A.L.; Inguaggiato, S.; Paz, M.P.J.; Madonia, P.; Mazot, A.; Pedone, M.; Pisciotta, A. Volcanic gas hazard assessment in the Baia di Levante area (Vulcano Island, Italy) inferred by geochemical investigation of passive fluid degassing. Geosciences 2021, 11, 478. [Google Scholar] [CrossRef]
  41. Granieri, D.; Carapezza, M.L.; Barberi, F.; Ranaldi, M.; Ricci, T.; Tarchini, L. Atmospheric dispersion of natural carbon dioxide emissions on Vulcano Island, Italy. J. Geophys. Res. Solid Earth 2014, 119, 5398–5413. [Google Scholar] [CrossRef] [Green Version]
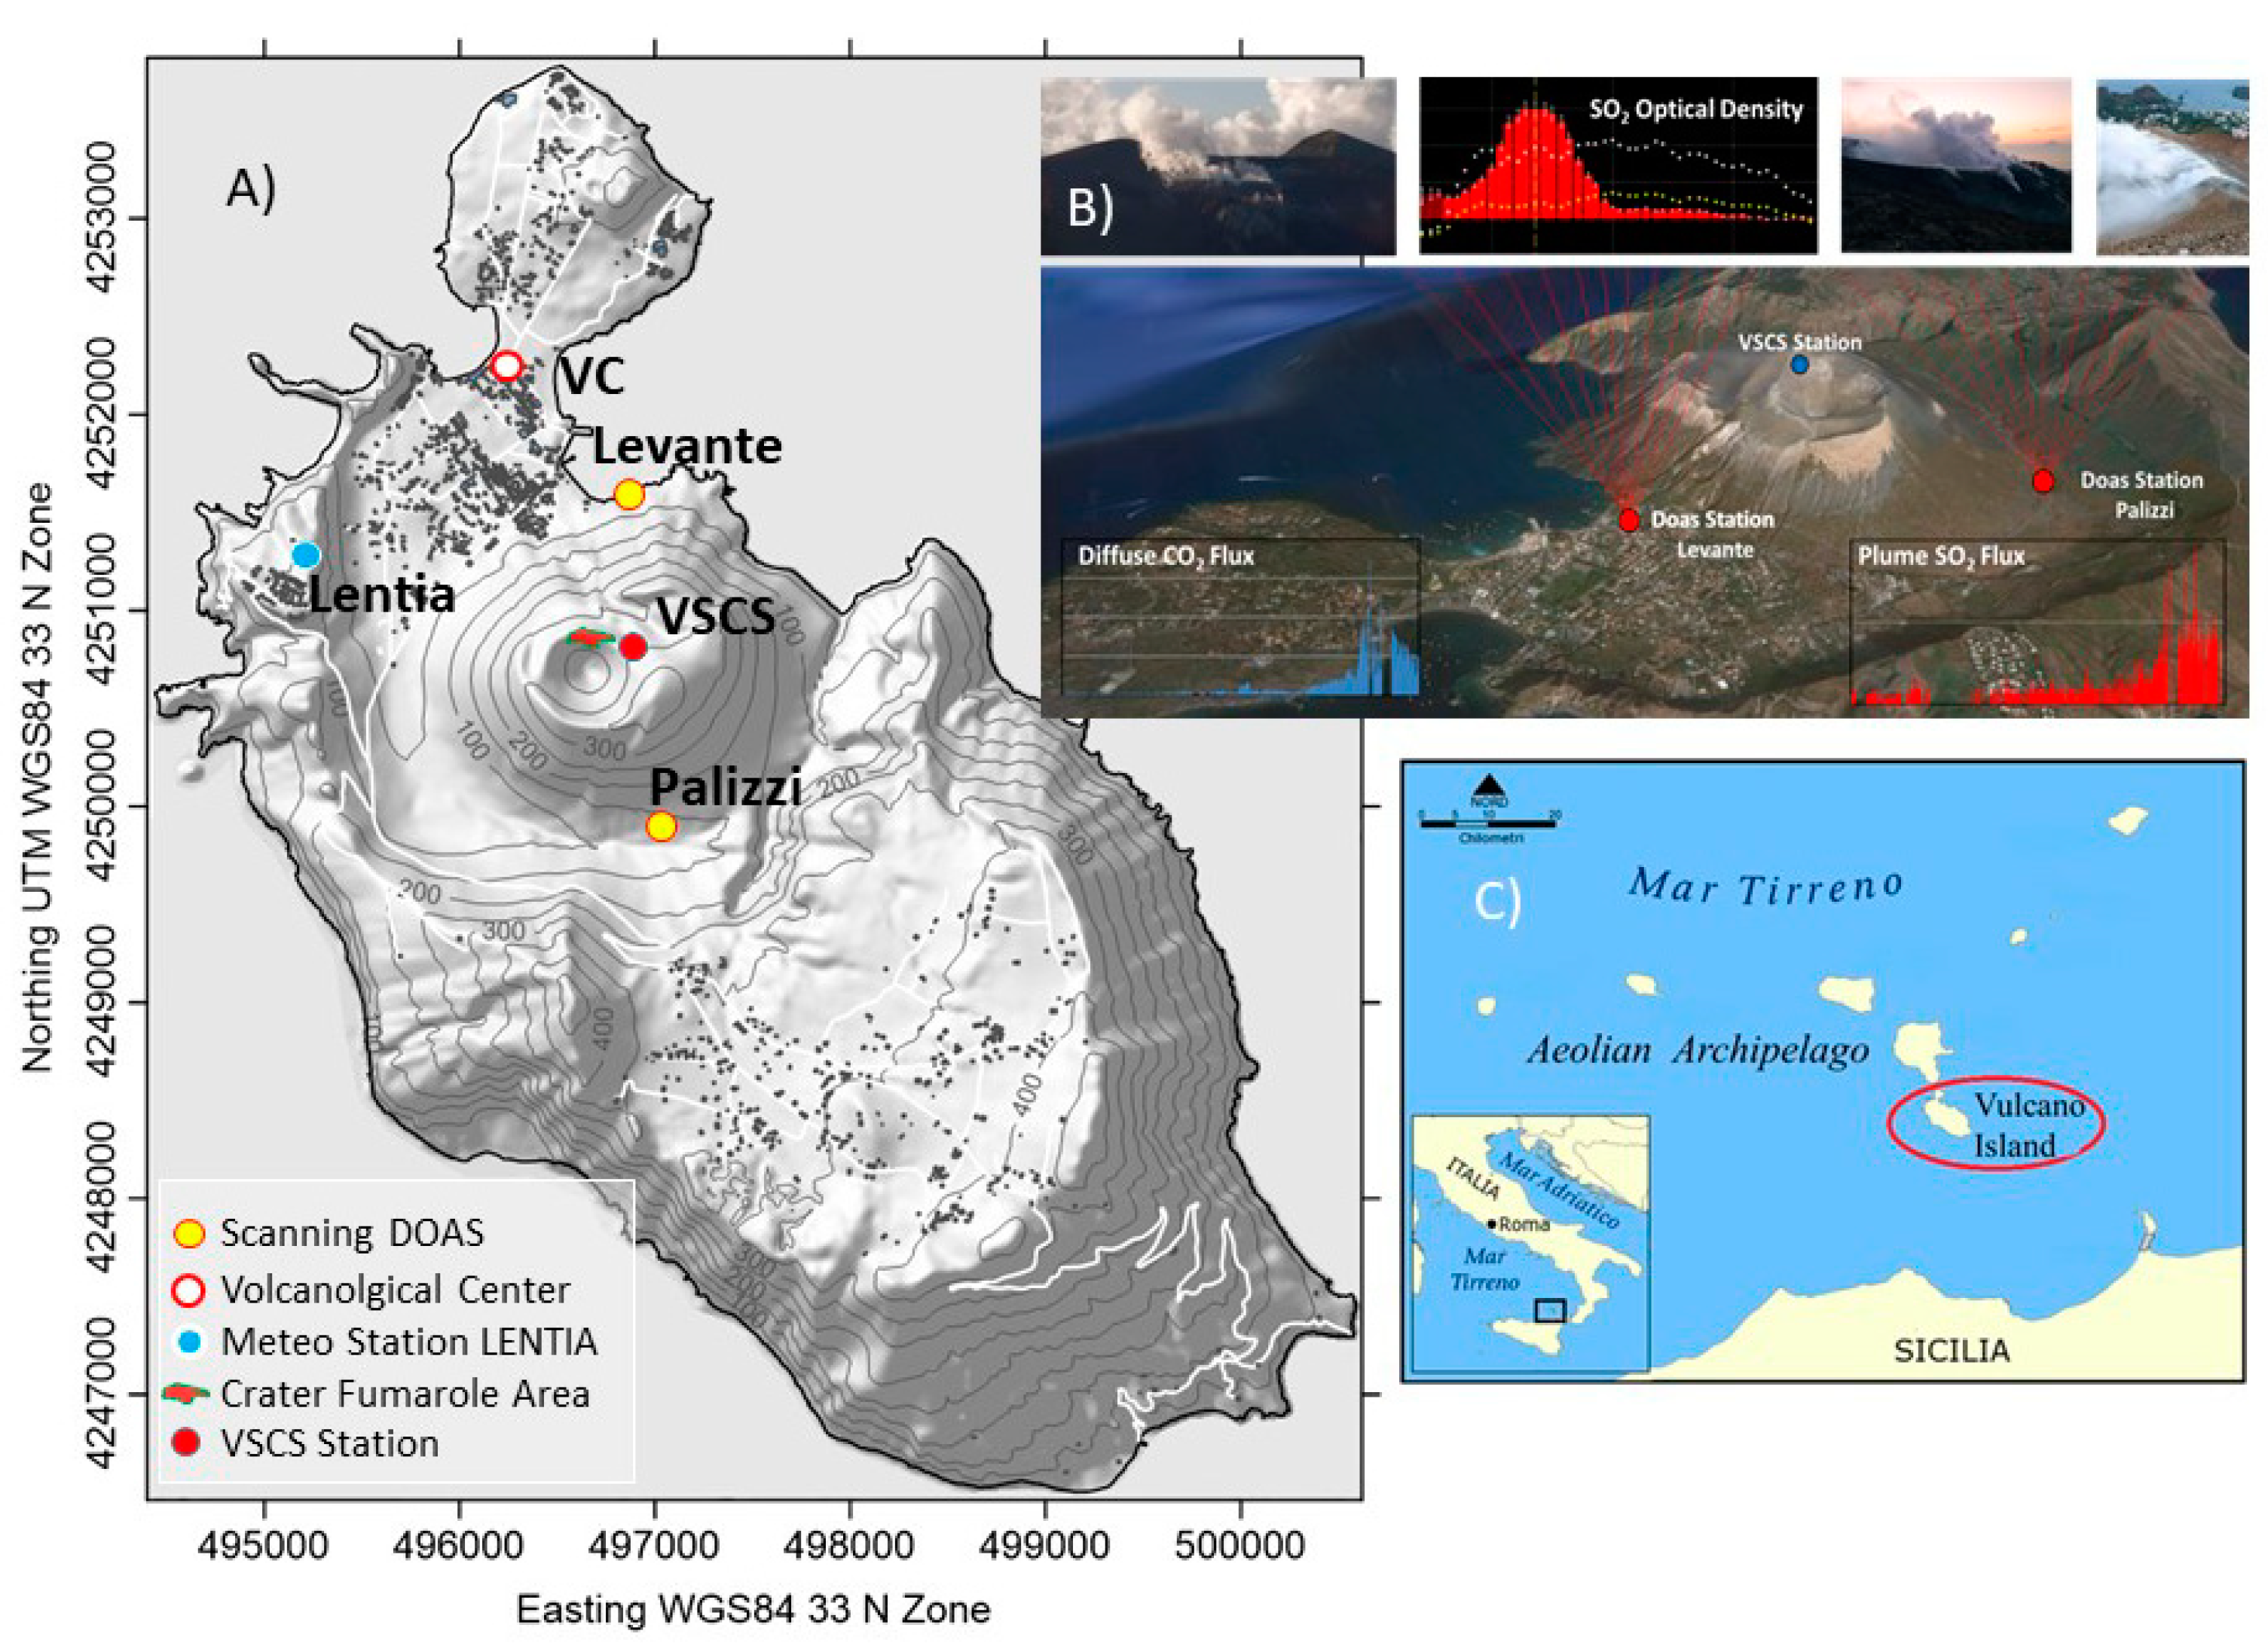
Figure 1. (A) Vulcano island map which includes the location of the following monitoring stations: The SO2 fluxes network stations (Palizzi and Levante), yellow circles; Soil CO2 fluxes station (VSCS), red circle; Meteorological station (Lentia), light-blue circle; Volcanological Center, white circle. Red square indicates the Vulcano Island position. ATLFS: Aeolian–Tindari–Letojanni fault systems. (B) Inset of the geochemical network with a few pictures of the solfataric area showing the strong degassing that occurred in 2021 and an SO2 optical density spectrum of DOAS instruments; (C) Sicily Island map.
Remotesensing 15 03086 g001
Figure 2. Time variation of SO2 plume monthly output in t d−1. The dashed red line indicates the monthly average.
Remotesensing 15 03086 g002
Figure 3. Time variation of soil CO2 fluxes from the summit and stations (VSCS). We report the monthly average of recorded flux values (continuous red line) to filter out the minor short-term effects registered at the local scale.
Remotesensing 15 03086 g003
Figure 4. The SO2 contour plot generated from AERMOD simulated model for 2 years (January 2021 to February 2023) in the case of the flux of (A) 22 t d−1 and (B) 238 t d−1. The colored lines identify the different SO2 concentrations. Isolines of SO2 concentrations are expressed in μg m−3.
Remotesensing 15 03086 g004
Figure 5. Yearly SO2 plume degassing from 2008 to 2022. The green line represents the background value (around 20 t d−1) of SO2 degassing in the last decade.
Remotesensing 15 03086 g005
Figure 6. Yearly output of SO2 emitted from crater solfataric area. The yellow line represents the minimum value of 5000 t SO2 in 2008. The blue line represents the average SO2 output value of 7700 t. The red line represents the polynomial curve highlighting the strong increase in SO2 output in the 2021–2022 period reaching 24,000 t of SO2.
Remotesensing 15 03086 g006
Figure 7. SO2 fluxes monthly average (t d−1) blue line and SO2 degassing rate (t d−2) red bars from January 2021 to March 2023.
Remotesensing 15 03086 g007
Figure 8. CO2 fluxes monthly average (g m−2 d−1) blue line and CO2 degassing rate (g m−2 d−2) red bars from January 2021 to March 2023.
Remotesensing 15 03086 g008
Figure 9. (A) Histogram of Log CO2 fluxes for the 2021–2023 period. (B) Log CO2 fluxes vs cumulated probability for the 2021–2023 period.
Remotesensing 15 03086 g009
Figure 10. The SO2 contour plot generated from AERMOD simulated model for 2 years (January 2021 to February 2023) in the case of flux value of 65 t d−1. The colored lines identify the different SO2 concentrations. Isolines of SO2 concentrations are expressed in μg m−3.
Remotesensing 15 03086 g010
Table 1. Statistical data of SO2 fluxes from January 2021 to March 2023. The entire period has been shared in four phases.
SO2 FluxesPre-UnrestUnrestNew Degassing EquilibriumNew-Unrest
tons day−1January–August 2021August 2021–April 2022April 2022–November 2022November 2022–March 2023
min4.5142427
max57.7239121190
mean22.2895178
median20.4885168
sd7.9351432
Table 2. Proportions of each population with the mean CO2 flux (in g m−2 d−1) and the corresponding 90% confidence intervals obtained using the statistical graphical approach of log-normal distribution for VSCS station.
Population
of CO2 Flux
Mean Flux of CO2
(g m−2 d−1)
90 % Confidence
Interval
(g m−2 d−1)
Proportion (%)
A11441064–124625
B94988331–994175
Table 3. Statistical data of CO2 fluxes from January 2021 to March 2023. The entire period has been shared in four phases.
Pre-Event
January–August 2021
Event
August 2021–April 2022
New Degassing Equilibrium
April 2022–November 2022
New-Event
November 2022–March 2023
min289283044354635
max452634,74116,85921,956
mean157211,596800610,556
median110611,871778510,306
sd1014415419962893
Disclaimer/Publisher’s Note: The statements, opinions and data contained in all publications are solely those of the individual author(s) and contributor(s) and not of MDPI and/or the editor(s). MDPI and/or the editor(s) disclaim responsibility for any injury to people or property resulting from any ideas, methods, instructions or products referred to in the content.