Article

Variation of Aerosol Optical Properties over Cluj-Napoca, Romania, Based on 10 Years of AERONET Data and MODIS MAIAC AOD Product

Faculty of Environmental Science and Engineering, Babeș-Bolyai University, 30 Fântânele St., 400294 Cluj-Napoca, Romania
*
Author to whom correspondence should be addressed.
Remote Sens. 2023, 15(12), 3072; https://doi.org/10.3390/rs15123072
Submission received: 10 April 2023 / Revised: 21 May 2023 / Accepted: 8 June 2023 / Published: 12 June 2023
(This article belongs to the Special Issue Remote Sensing of Aerosols and Gases in Cities II)

Abstract

:
Aerosols play an important role in Earth’s climate system, and thus long-time ground- based measurements of aerosol optical properties are useful in understanding this role. Ten years of quality-assured measurements between 2010 and 2020 are used to investigate the aerosol climatology in the Cluj-Napoca area, in North-Western Romania. In this study, we analyze the aerosol optical depth (AOD), single scattering albedo (SSA) and angstrom exponent obtained by the CIMEL sun photometer, part of the aerosol robotic network (AERONET), to extract the seasonality of aerosols in the region and investigate the aerosol climatology of the area. Higher aerosol loads are found during July and August. The angstrom exponent has the lowest values in April and May, and the highest in August. The classification of aerosols using AERONET data is performed to separate dust, biomass burning, polluted urban, marine and continental-dominant aerosol mixtures. In addition, the study presents the validation efforts of the Multi-Angle Implementation of Atmospheric Correction (MAIAC) dataset against AERONET AOD over a 10-year period.

1. Introduction

According to the Intergovernmental Panel on Climate Change (IPCC), aerosols play an important role in Earth’s climate system, due to the absorption and scattering of the solar radiation, and interactions with the clouds [1]. These processes are still sources of uncertainty in climate modelling and with regard to the magnitude of aerosol radiative forcing [2]. In addition, the atmospheric aerosols may affect human health [3,4], and pose socio economic risks [5]. Regional studies are essential to assess the aerosol trends, as the optical parameters vary from one region to another.
At present, some ground networks are monitoring the aerosol properties, the most developed one being the AERONET network, with hundreds of stations on a global scale [6]. Other major networks are SKYNET (MEXT Sky Radiometer Network) [7] and the Global Atmospheric Watch/Precision Filter Radiometer (GAW/PFR) [8].
AERONET data are accurate and considered a benchmark for validating other aerosol measurement data. AERONET products are accessible, making them a valuable resource for researchers and atmospheric scientists to analyze and interpret data for various applications. In Asia, Tu et al. (2021) used AERONET data to determine aerosol characteristics over four observation sites in East China, highlighting the frequency of urban pollution from fossil fuel burning during a period of 20 years [9]. Yu et al. (2022), determined the dominant aerosol types in Hong Kong and their interactions with meteorological factors by using both AERONET data and satellite-based observations from 2006 to 2021 [10]. Natural, large-scale events of aerosol intrusions have been researched by Sun et al. (2022), who studied two extreme dust events over North China in March, 2021, by using AERONET in situ observations and CALIPSO satellite data to obtain the distribution characteristics of dust aerosol optical properties along their transport pathways [11]. Additionally, Dementeva et al. (2022) analyzed AERONET data collected over a 10-year period, and found that there was a significant increase in smoke aerosols during the summer months, which was caused by large-scale wildfires in the boreal forests surrounding Lake Baikal [12]. In Southeastern Europe, long-term aerosol trends have been researched using AERONET datasets. Carstea et al. (2019), analyzed the climatology of aerosol optical and microphysical properties over Romania, based on 9 years of AERONET data, to highlight the efficiency of EU regulations on particulate matter emissions in Bucharest [13]. Evgenieva et al. (2022), used a two-year AERONET dataset to highlight the main characteristics and transport models of aerosol loads over Sofia, Bulgaria, quantifying the high content of urban aerosols and rare occurrences of desert dust and biomass-burning aerosols [14]. In Greece, Raptis et al. (2020), studied the aerosol seasonality and trends over Athens, using a decade’s worth of AERONET and satellite data to underline an increase in aerosol loads during the spring and summer months [15]. Measuring campaigns in Thessaloniki and data from AERONET observations, carried out by Voudouri et al. (2022), were used to study the intrusions of biomass-burning aerosols over Greece [16]. AERONET long-term measurements were also used to determine the climate impacts of aerosols. Markowicz et al. (2021), studied the climate interaction trends of aerosols distributed over Poland and their effects on incoming radiation fluxes, using a 10-year AERONET dataset [17]. Damiano et al. (2022) characterized the columnar aerosol optical and microphysical properties to determine the prevailing aerosol type in the Naples Mediterranean area, using an AERONET dataset from a 5-year period [18]. AERONET and satellite datasets for a period of 16 years were also used by researchers to determine the annual variability of aerosol intrusion episodes in Morocco and the location’s susceptibility to desert dust transport on a seasonal basis [19]. Timpu et al. (2020) analyzed the tropospheric dust and associated atmospheric circulations over the Mediterranean region using modeling and AERONET data [20].
The Multi-Angle Implementation of Atmospheric Correction (MAIAC) algorithm [21], applied to the Moderate Resolution Imaging Spectroradiometer (MODIS) level 1B land-surface radiances generated for a global 1 km resolution sinusoidal grid, is widely used in air quality and epidemiological studies, due to its high 1 km resolution and improved retrieval capability over urban areas. The MAIAC AOD has been evaluated over a few geographical regions such as North America [22,23] South America [24], South Asia [25], Europe [26,27,28], the Black Sea, arid areas of the Dead Sea [29], the alpine region [30] and Australia [31]. Some studies suggest that the algorithm may exhibit a negative bias in desert areas of Western China, while a positive bias has been reported for low-moderate aerosol loading in East China [32,33]. Additionally, the MAIAC AOD product has been found to perform well in South Asia, outperforming other AOD products [25]. The algorithm has also been used to derive surface particulate matter concentration over various regions such as the USA [34], Mexico City [35], Italy [28] and Israel [36]. These studies have highlighted the ability of the MAIAC AOD product to capture spatial variations of PM2.5 with higher accuracy than other methods, as well as its improved correspondence with ground-based measurements in certain regions. Despite the extensive use of MAIAC AOD, few studies have been conducted to verify its accuracy and robustness on a global scale. The uncertainty of the MAIAC AOD retrievals was found to be heavily dependent on satellite viewing geometry, aerosol types, particle size and aerosol loading. The algorithm performs particularly well over densely vegetated areas, bright surfaces and when retrieving smoke AOD [25,37,38].
The main objective of the study is to comprehensively investigate the variability of aerosol optical properties over Cluj-Napoca, Romania using AERONET data, and compare it with MODIS MAIAC. This involves characterizing the temporal distribution of aerosol optical properties, assessing data availability and identifying the factors contributing to the observed variability. The study aims to provide valuable insights into the dynamics of atmospheric aerosols over the study area, as well as to fill the knowledge gap regarding the distribution of aerosols in the region (only sites within a 200 km radius), thereby making a novel contribution to the field of aerosol research in Eastern Europe.
The MODIS MAIAC AOD product is known to improve retrieval over urban areas while subsequently reducing the scale down to 1 km [21]. These improvements over similar algorithms such as Deep Blue (DB) and Dark Target (DT) make it a viable candidate for analyzing urban AOD and aerosol climatology studies. Since validation efforts in Eastern Europe have not been reported, this study covers this knowledge gap while also comparing the robustness of the retrieval algorithm to other urban locations in different parts of the globe.

2. Materials and Methods

2.1. Site Description

Cluj-Napoca is a city of approx. 400,000 inhabitants located in the North-West part of Romania, in the Someș river valley, surrounded by hills. The measurement site is located at the Faculty of Environmental Science and Engineering (Lat.: 46.76833°N, Long.: 23.55139°E, elevation: 405 m). The measurement station is part of ACTRIS (Aerosols, Clouds and Trace gases Research Infrastructure, https://www.actris.eu/, accessed on 15 April 2023) network and has conducted aerosol measurements since 2010. The Cluj-Napoca AERONET measurement station can be considered representative for the whole Transylvanian territory, and also for the Pannonian Basin, given the limited coverage in Hungary, Austria, and South-Western Ukraine [39]. The main sources of local emissions are represented by heavy traffic and heating facilities during winter, with few emissions related to industrial facilities [40,41]. The positioning of the city in a valley with neighboring high topography may cause frequent temperature inversions during the winter season [42], and contributes to the accumulation of air pollution in the city [41]. In addition, long-range transported aerosols such as Saharan dust [39] and biomass burning [43] may also influence the area. A detailed view of Cluj-Napoca and the surrounding area is shown in Figure 1.

2.2. Meteorological Parameters

Meteorological parameters such as temperature, relative humidity, and wind speed and direction, have important effects on the evolution of aerosols [44]. In order to analyze the meteorological conditions in the study period, daily data received from the in situ DAVIS Vantage Pro2 (Hayward, Berkeley Heights, NJ, USA) weather station was used. For wind direction and wind speed, we used only the daytime data during the sun photometer measurements.
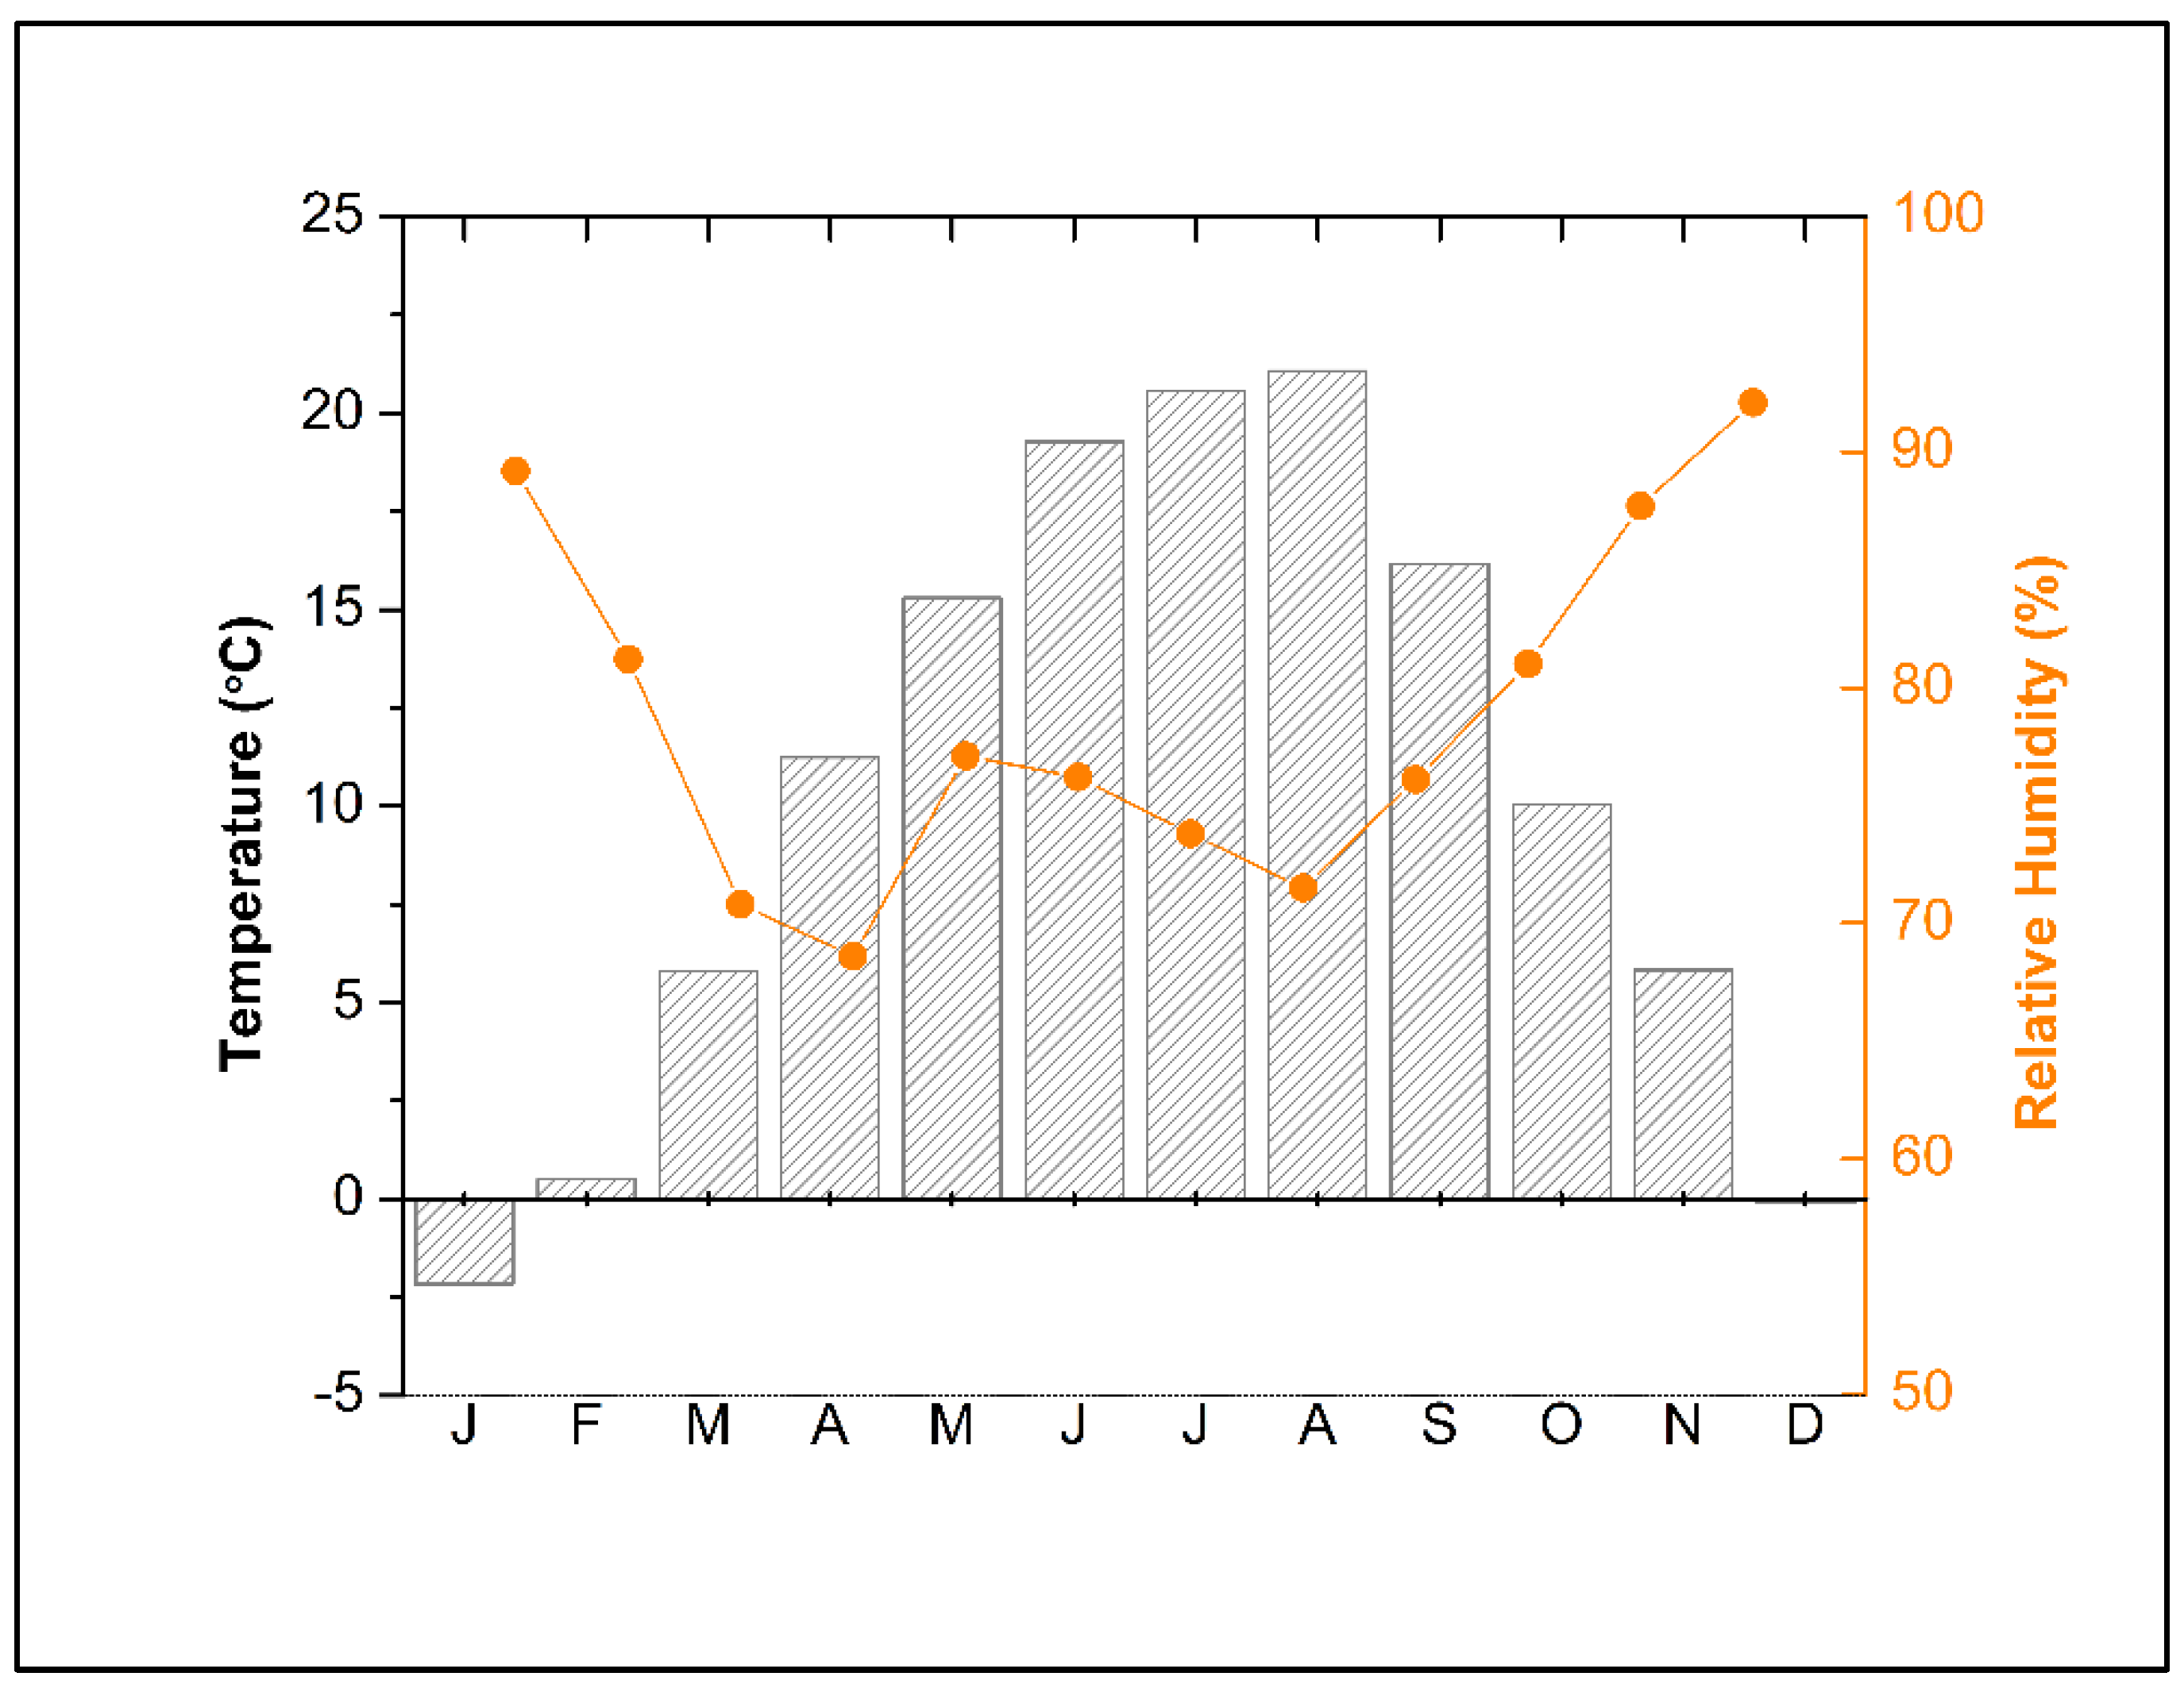
Due to the temperate continental climate, the monthly average air temperature in Cluj-Napoca can vary greatly, ranging between −2.17 °C in January and 21.1 °C in July, with a mean annual air temperature of 10.3 °C (2010–2020) (Figure 2). The official national meteorological station annual mean temperature in Cluj-Napoca for the same period was 10.1 °C [45]. Comparing it with the value recorded over a longer period (between 1961 and 2019), of 8.8 °C [46], a significant increase in the local temperature was observed in the investigated period.
The relative humidity, which is generally inversely proportional with air temperature, shows the highest values in the cold season, mainly between November and January (around 90% on average), while the lowest values are specific to the March–April period (<70%). Monthly, the mean values for relative humidity vary between 92% in December and 68% in April, while the annual mean is 79% (Figure 2).
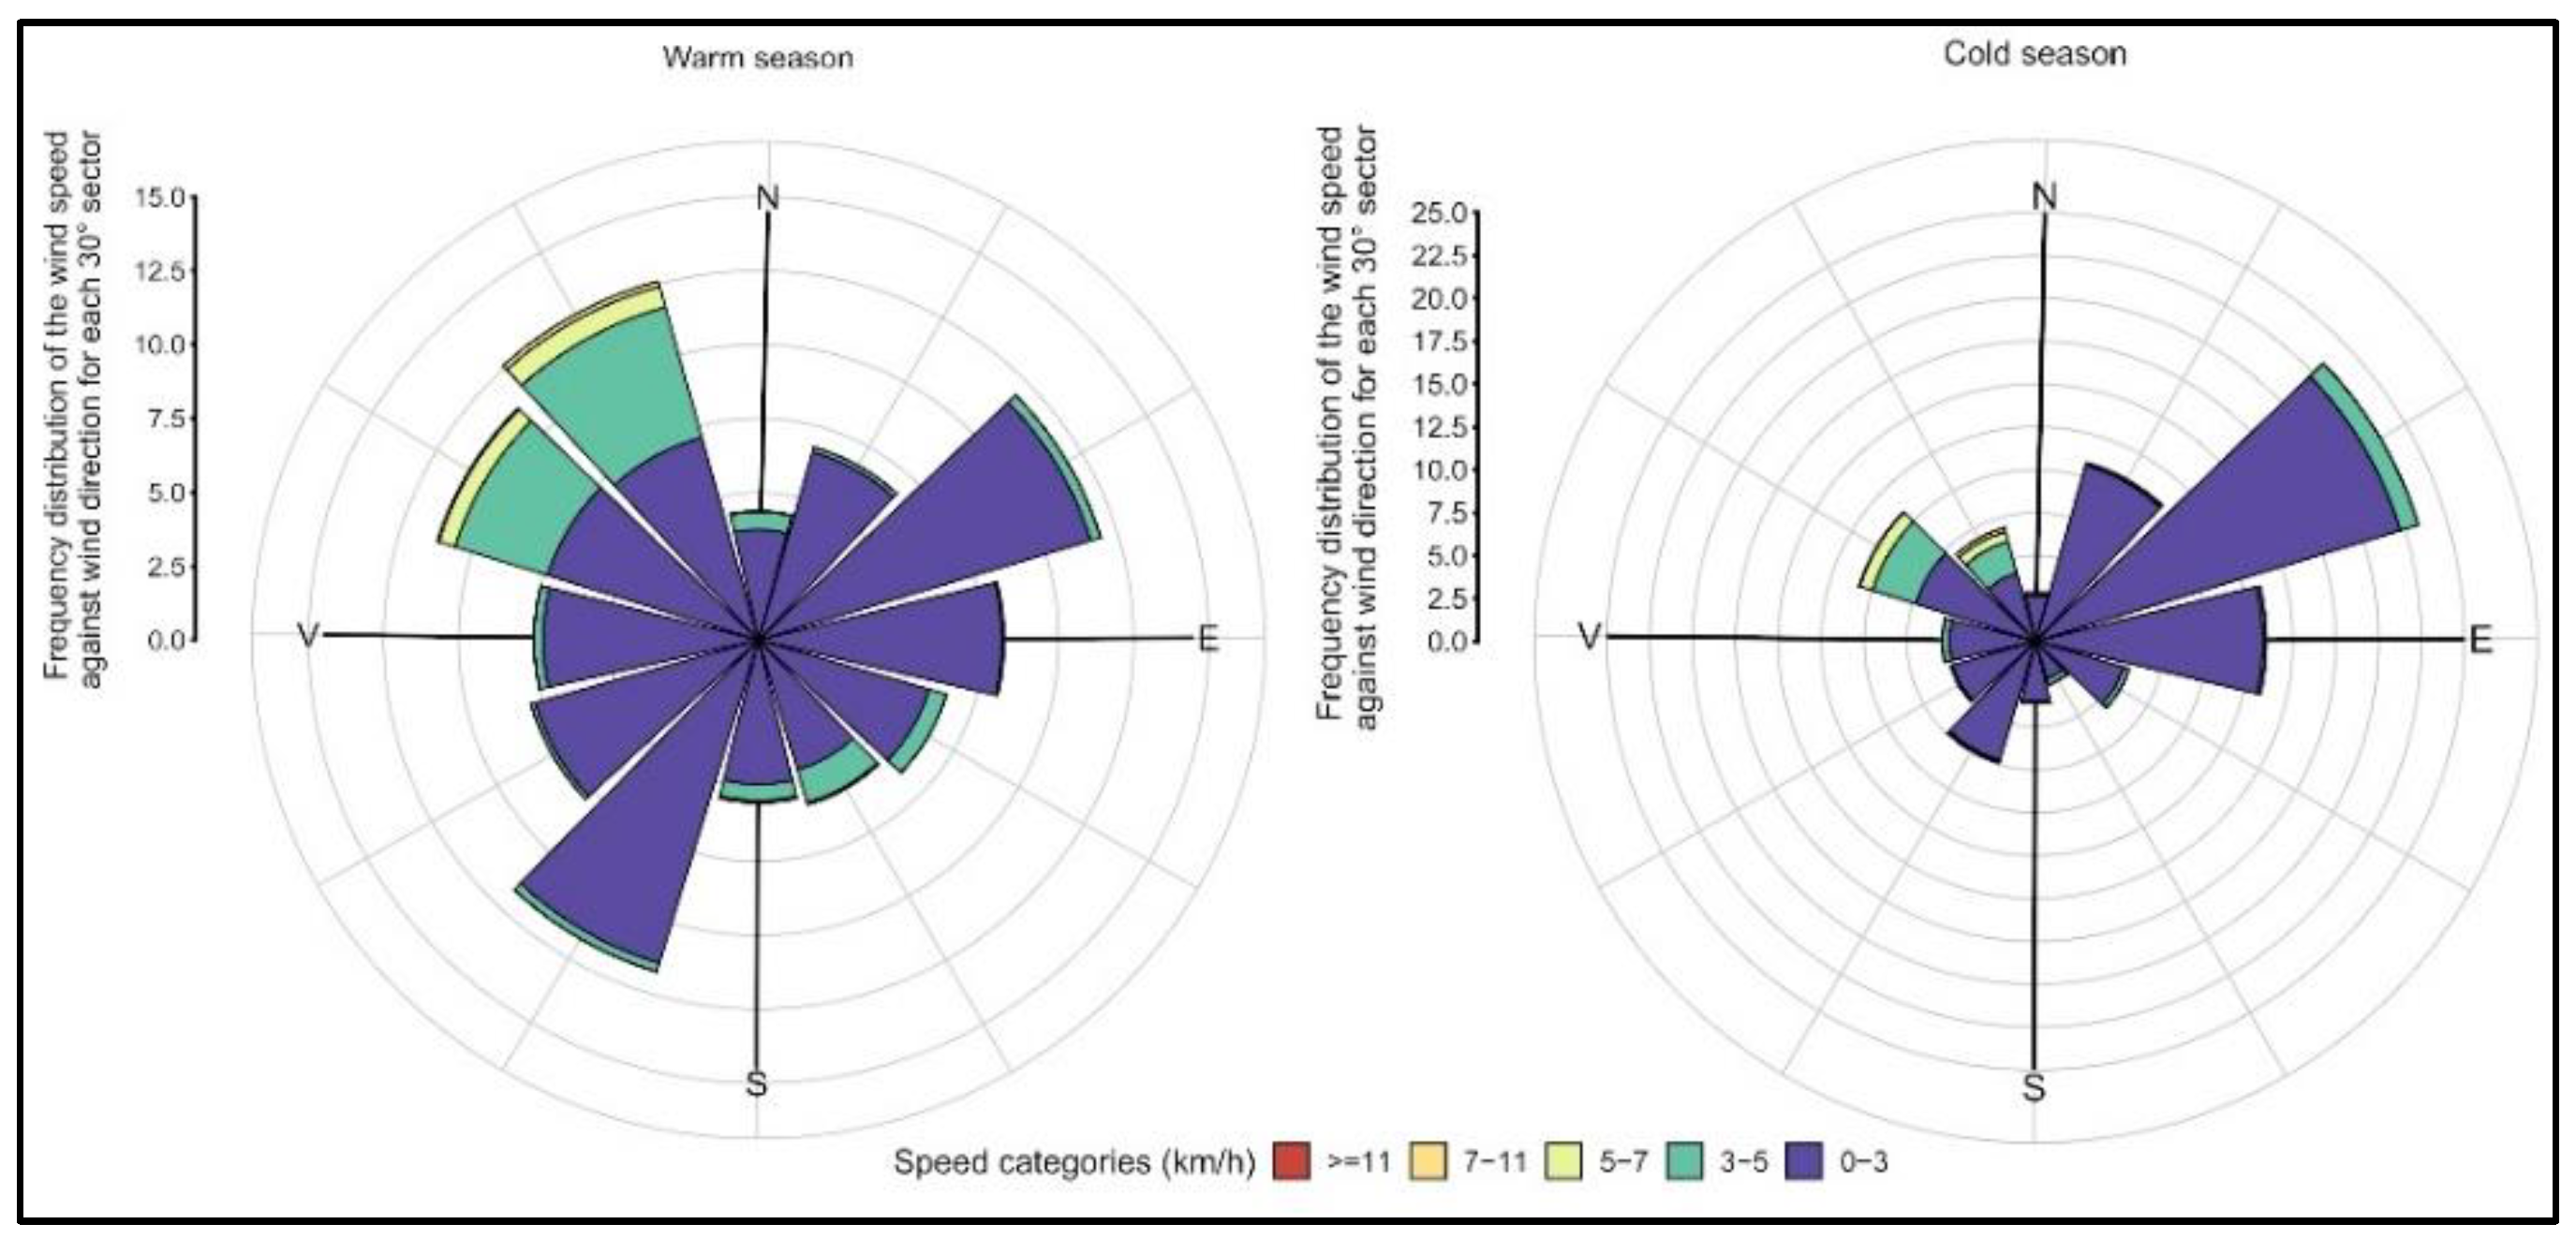
The wind direction in Cluj-Napoca is largely influenced by the local topography, being fairly consistent with the Someșul Mic Valley orientation (generally from southwest to northeast). In addition, the wind direction pattern can have significant variations throughout the seasons. During the cold season (October–March) when the regional influence of the East European anticyclone is increasing, the daytime winds tend to blow from the east-northeast (36.8% of all observations in the range of 45–105°), bringing continental polar air masses over Romania. In the warm season (April–September) the winds are more likely to come from the northwest (23.8% of all observations in the range of 285–345°), although the east-northeast directions have maintained their high prevalence. High percentages are also specific to winds that come from the southwest (Figure 3). The average daytime wind speed is low in the study area, being higher in the warm season (1.94 m/s) and lower in the cold season (1.86 m/s). Analyzing the wind speed (m/s) against wind direction, it can be observed that the highest average wind speeds are clearly related to the northwesterly directions that usually bring unstable polar maritime air masses (Figure 3). Due to the sheltering conditions induced by the Western Carpathians and the Somesul Mic Valley, the atmospheric calm has a high frequency (47.2%), with minimum values in the warm season and for daytime conditions, thus producing more frequent pollution episodes.

2.3. AERONET Data

The instrument is a Cimel Electronics (Paris, France) Automatic Sun Tracking Photometer CE 318, which performs direct Sun and sky radiance measurements at nine band-pass filters between 340 and 1640 nm. We analyzed data from the start of the measurements in July 2010 until October 2020. Gaps in the time series are expected, due to the annual calibrations demanded by the AERONET network protocol. The calibrations were performed at Laboratoire d’Optique Appliquée (LOA) at Université de Lille, France. The measurements were processed centrally, and are available on the aerosol robotic network (AERONET) [6] website. Aerosol optical depth (AOD) data were produced for three data quality levels: Level 1.0 (unscreened), Level 1.5 (cloud-screened), and Level 2.0 (cloud-screened and quality-assured). Besides the gaps from the calibration of the instruments (2 or 3 months for every calibration), other gaps in time series may be present because of the cloudy conditions and/or because of instrument malfunction.
In this study, AERONET version 3 retrievals have been used at level 2.0 for direct Sun (AOD and angstrom exponent) in order to have the highest quality of data. For the Single Scattering Albedo (SSA) inversion retrievals, level 1.5 was used. Due to the very strict AERONET level 2.0 criteria, these type of data are limited in many areas, including Cluj-Napoca. Nevertheless, this approach should be performed taking into account the higher uncertainty of this product, which could be up to 0.04 higher than level 2, depending on the AOD and Solar Zenith Angle. A similar approach was carried out in [15], as this practice is relatively common in climatology studies.
Further on, an aerosol classification was conducted based on the thresholds described by Dubovik et al. [47], using both direct measurements and inversion products. Raptis et al. employed a comparable methodology in their previous investigation [15]. It should be noted that this classification has the role of highlighting the dominant aerosol types and their prevalent proportions, as the columnar atmospheric mixture over Cluj-Napoca is highly unlikely to have only one type of aerosol [43]. According to Dubovik et al. [47], the main sources of uncertainties in this classification are derived from the accuracy of the individual retrievals used to characterize the variability of absorption and optical properties of key aerosol types observed in multiple locations. The level of accuracy is related, but not limited, to measurements errors, systematic instrumental offsets, cases with low aerosol loading, assumptions related to the nonspherical aerosols, etc. [47].
Following the classification process, a statistical analysis was performed to determine the distribution of monthly observations for each aerosol type, with the aim of ascertaining any potential seasonal patterns. A Pearson correlation coefficient (noted “λr”, not to be confused with the correlation coefficient presented in the MODIS data comparison section) was calculated in order to measure the linear correlation between the monthly distribution for each class of aerosols and the monthly distribution for the total number of observations.

2.4. MODIS Data

The Moderate Resolution Imaging Spectroradiometer (MODIS) sensors on board the Terra and Aqua satellites have been providing columnar aerosol properties since the year 2000 and 2002, respectively [48,49]. The two satellites perform an equatorial crossing at 10:30 (Terra) and 13:30 (Aqua) local time. The MODIS sensor makes use of 36 spectral bands at spatial resolutions of 250, 500 and 1000 m, while scanning a 2330 km wide swath to provide near-daily global coverage of the Earth. The MODIS aerosol retrieval algorithms have undergone several updates, resulting in four operational algorithms: Dark Target (DT) over land [49], DT over the ocean [50] Deep Blue (DB) for bright surfaces [51] and land surfaces [48], and the Multiple Angle Implication of Atmospheric Correction (MAIAC) algorithm. The standard MODIS aerosol products (DT and DB) are provided with two spatial resolutions, one of 10 km at the nadir and another of 3 km [52], while MAIAC retrieves high resolution data at 1 km [21,53]. This finer spatial scale provides an excellent opportunity for aerosol research at city levels. In this analysis, we used collection 6 (C6) data products of the MAIAC AOD retrieval algorithm.

2.4.1. MODIS MAIAC Aerosol Retrieval Algorithm

The Multi-Angle Implementation of Atmospheric Correction (MAIAC) algorithm utilizes a physical atmosphere–surface model that is obtained from measurements with minimal assumptions [21]. The algorithm is applied to the MODIS level 1B land-surface radiances, which are generated for a global 1 km resolution sinusoidal grid. To simultaneously retrieve aerosol and surface parameters, the algorithm utilizes multi-angle information from time series of MODIS observations for up to 16 days for a given pixel, at a resolution of 1 km [53]. The surface characterization in MAIAC is achieved through the derivation of spectral regression coefficients (SRC) that relate the surface BRF in the blue (470 nm), green (550 nm), and shortwave infrared (2130 nm) bands of MODIS. The MAIAC cloud mask is combined with the detection of absorbing aerosols (smoke or dust), allowing MAIAC to characterize most of the aerosol emission sources at 1 km resolution, including high intensity plumes, without masking them as clouds. By characterizing and storing unique surface signatures for each 1 km grid cell, MAIAC is able to detect clear-sky, clouds, or snow-cover pixels [54] and enhance the accuracy of atmospheric correction and AOD retrieval on partially cloudy days [21]. The C6 version of the MAIAC algorithm has also improved the estimation of surface reflectance at a pixel scale, reducing the “blockiness” of AOD retrievals caused by random SRC bias [21]. MAIAC selects from among three aerosol types, including two absorbing coarse- and fine-mode aerosols (dust and smoke) and one less-absorbing background aerosol type, which is regionally derived using one of eight prescribed aerosol models based on the long-term climatology of aerosol properties obtained from AERONET [21].

2.4.2. Collocation and Validation Approach

To validate the MODIS MAIAC AOD product, we used the level 2.0 Direct Sun AOD AERONET version 3 as a reference [55]. The MAIAC AOD provides data at 550 nm and 470 nm, while the closest AERONET Direct Sun AOD is at 440 nm and 500 nm. In this study, we estimated the AERONET AOD at 550 nm by linear interpolation, using the AERONET angstrom exponent, from the 440 nm and 675 nm wavelength pair [56]. The uncertainty in the AERONET AOD is dominated by sensor calibration, and is approximated at 0.01–0.02 [56]. The sampling interval is dependent on site specifications and is achieved between 5 and 15 min, in cloud-free conditions.
To accurately compare satellite AOD retrievals with AERONET AOD measurements, it is crucial to account for atmospheric variability and temporal offset in spatio-temporal collocation. An average of two or more AERONET measurements taken around the satellite overpass time is recommended to ensure reliable results [57,58]. Thus, AOD validation typically averages AERONET data within a ±30–60 min temporal window, matching satellite retrievals over a ±25 km × 25 km area; however, this criterion should be adjusted for the fine spatial resolution of the MODIS MAIAC product. Several studies have reported validation efforts of the MAIAC AOD product, utilizing various temporal collocation intervals. A temporal window of ±60 min of mean AERONET AOD was reported in [24,25]. The most common interval reported in the literature is ±30 min, as seen in [23,32,37,38]. Ref. [59] suggests the optimal temporal interval of ±15 min, which is also reported in [23,37]. However, this comes at the expense of lesser matches with minimal improvements in overall statistics. Since the validations in this paper were conducted over a 10-year period, we selected a more stringent temporal interval of ±15 min, with two or more AERONET retrievals. Regarding the spatial collocation, values range from single-pixel overlap of 1 km × 1 km boxes [37,38,60], up to 25 km × 25 km boxes [24] or a 25 km radius [32]. We selected a 5 km radius in this study, similar to [23,37], as the best representation of the urban area around the AERONET location in Cluj-Napoca. Matchups were discarded if less than <20% of pixels were retrieved in the selected 5 km radius.
For the C6 MODIS MAIAC retrievals, the highest quality data were selected for validation. The MAIAC AOD uncertainty is estimated at ±(0.05 + 0.1⋅AOD) [21]; however, regional influences were reported, ranging from ±(0.05 + 0.15AOD) over South Asia [25] and China [61], to ±(0.05 + 0.05AOD) over South America [24]. We decided to evaluate the reported uncertainty estimate of ±(0.05 + 0.01⋅AOD) by [21]. To achieve a rigorous validation effort we opted for the method described in [59].
The total expected discrepancy (ED) between a single matchup of MODIS MAIAC and AERONET accounts for the uncertainties in both datasets
ED = sqrt   ( ϵ S 2 + ϵ A 2 )
where ϵ S 2 is the MODIS MAIAC uncertainty, while ϵ A 2 is the AERONET uncertainty. Based on the expected discrepancy, we can then define a normalized error ΔN as the ratio of the actual error to the ED,
ΔN = (AODMODIS − AODAERONET)/ED
Since the AERONET retrieval is substantially more accurate than the satellite retrieval, the normalized error will be dominated by the extent of the uncertainty and errors in the satellite AOD retrievals. If both satellite and AERONET uncertainties are correctly estimated, ΔN should follow a normal distribution. If ΔN is normally distributed, 68.3% of the values should fall within the range [−1, +1]. If the fraction is smaller, then uncertainties are underestimated, and if it is larger, then uncertainties are overestimated. Additionally, the average uncertainties, correlation coefficient (r), mean bias (Bias), and root mean square error (RMSE) are calculated.

3. Results

3.1. Seasonality

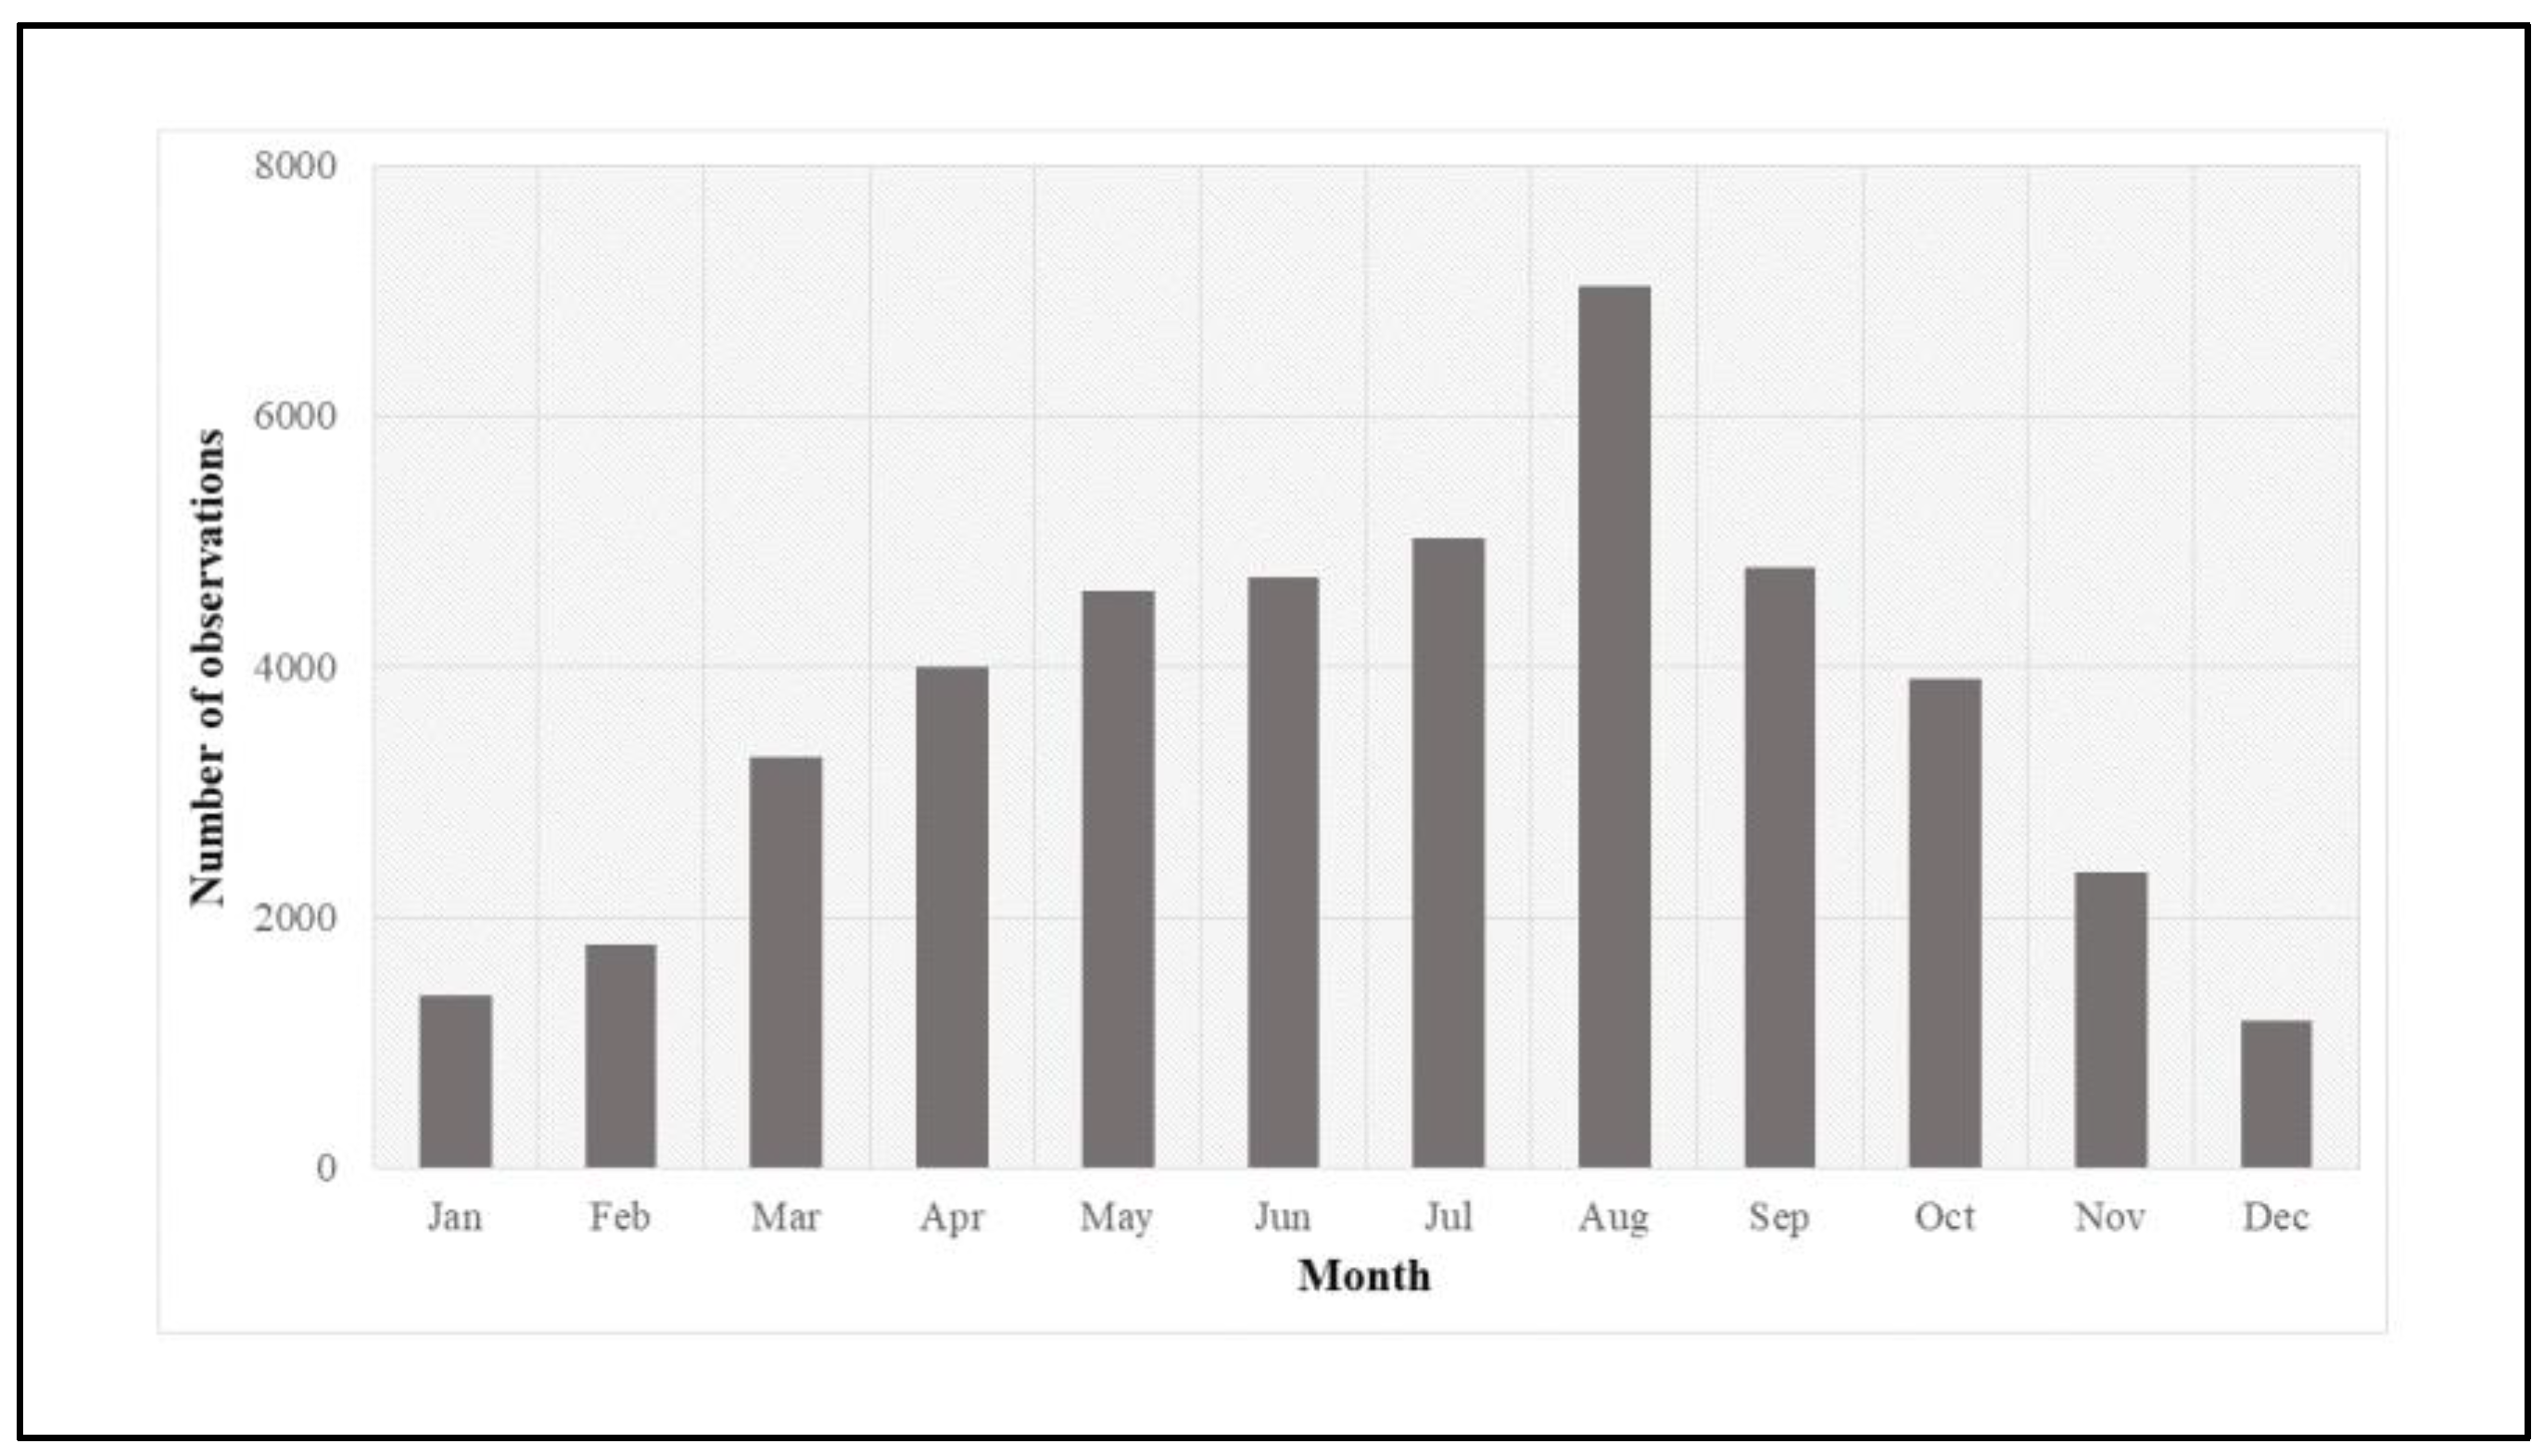
As one of the objectives of this study is to determine the climatology of aerosols in the Cluj-Napoca region, the analysis encompassed 44,070 observations collected between 2010 and 2020. Figure 4 illustrates the monthly distribution of the data points during the entire measuring period. It can be observed that the quantity of data obtained is correlated with the number of sunny days and daylight hours, since measurements rely on direct solar irradiance. This proportionality is apparent if we consider the simulated historical climate and weather data for Cluj-Napoca available on the meteoblue® website [62]. This data shows that July and August are the months with the most sunny and partly cloudy days (over twenty-four days per month). Thus, most observations were made in the summer months (mainly July and August), December being the month with the lowest number of observations (1169).
A further aspect that influenced the availability of data during the analyzed period is associated with periodic calibration procedures, which imply data gaps in the respective period.
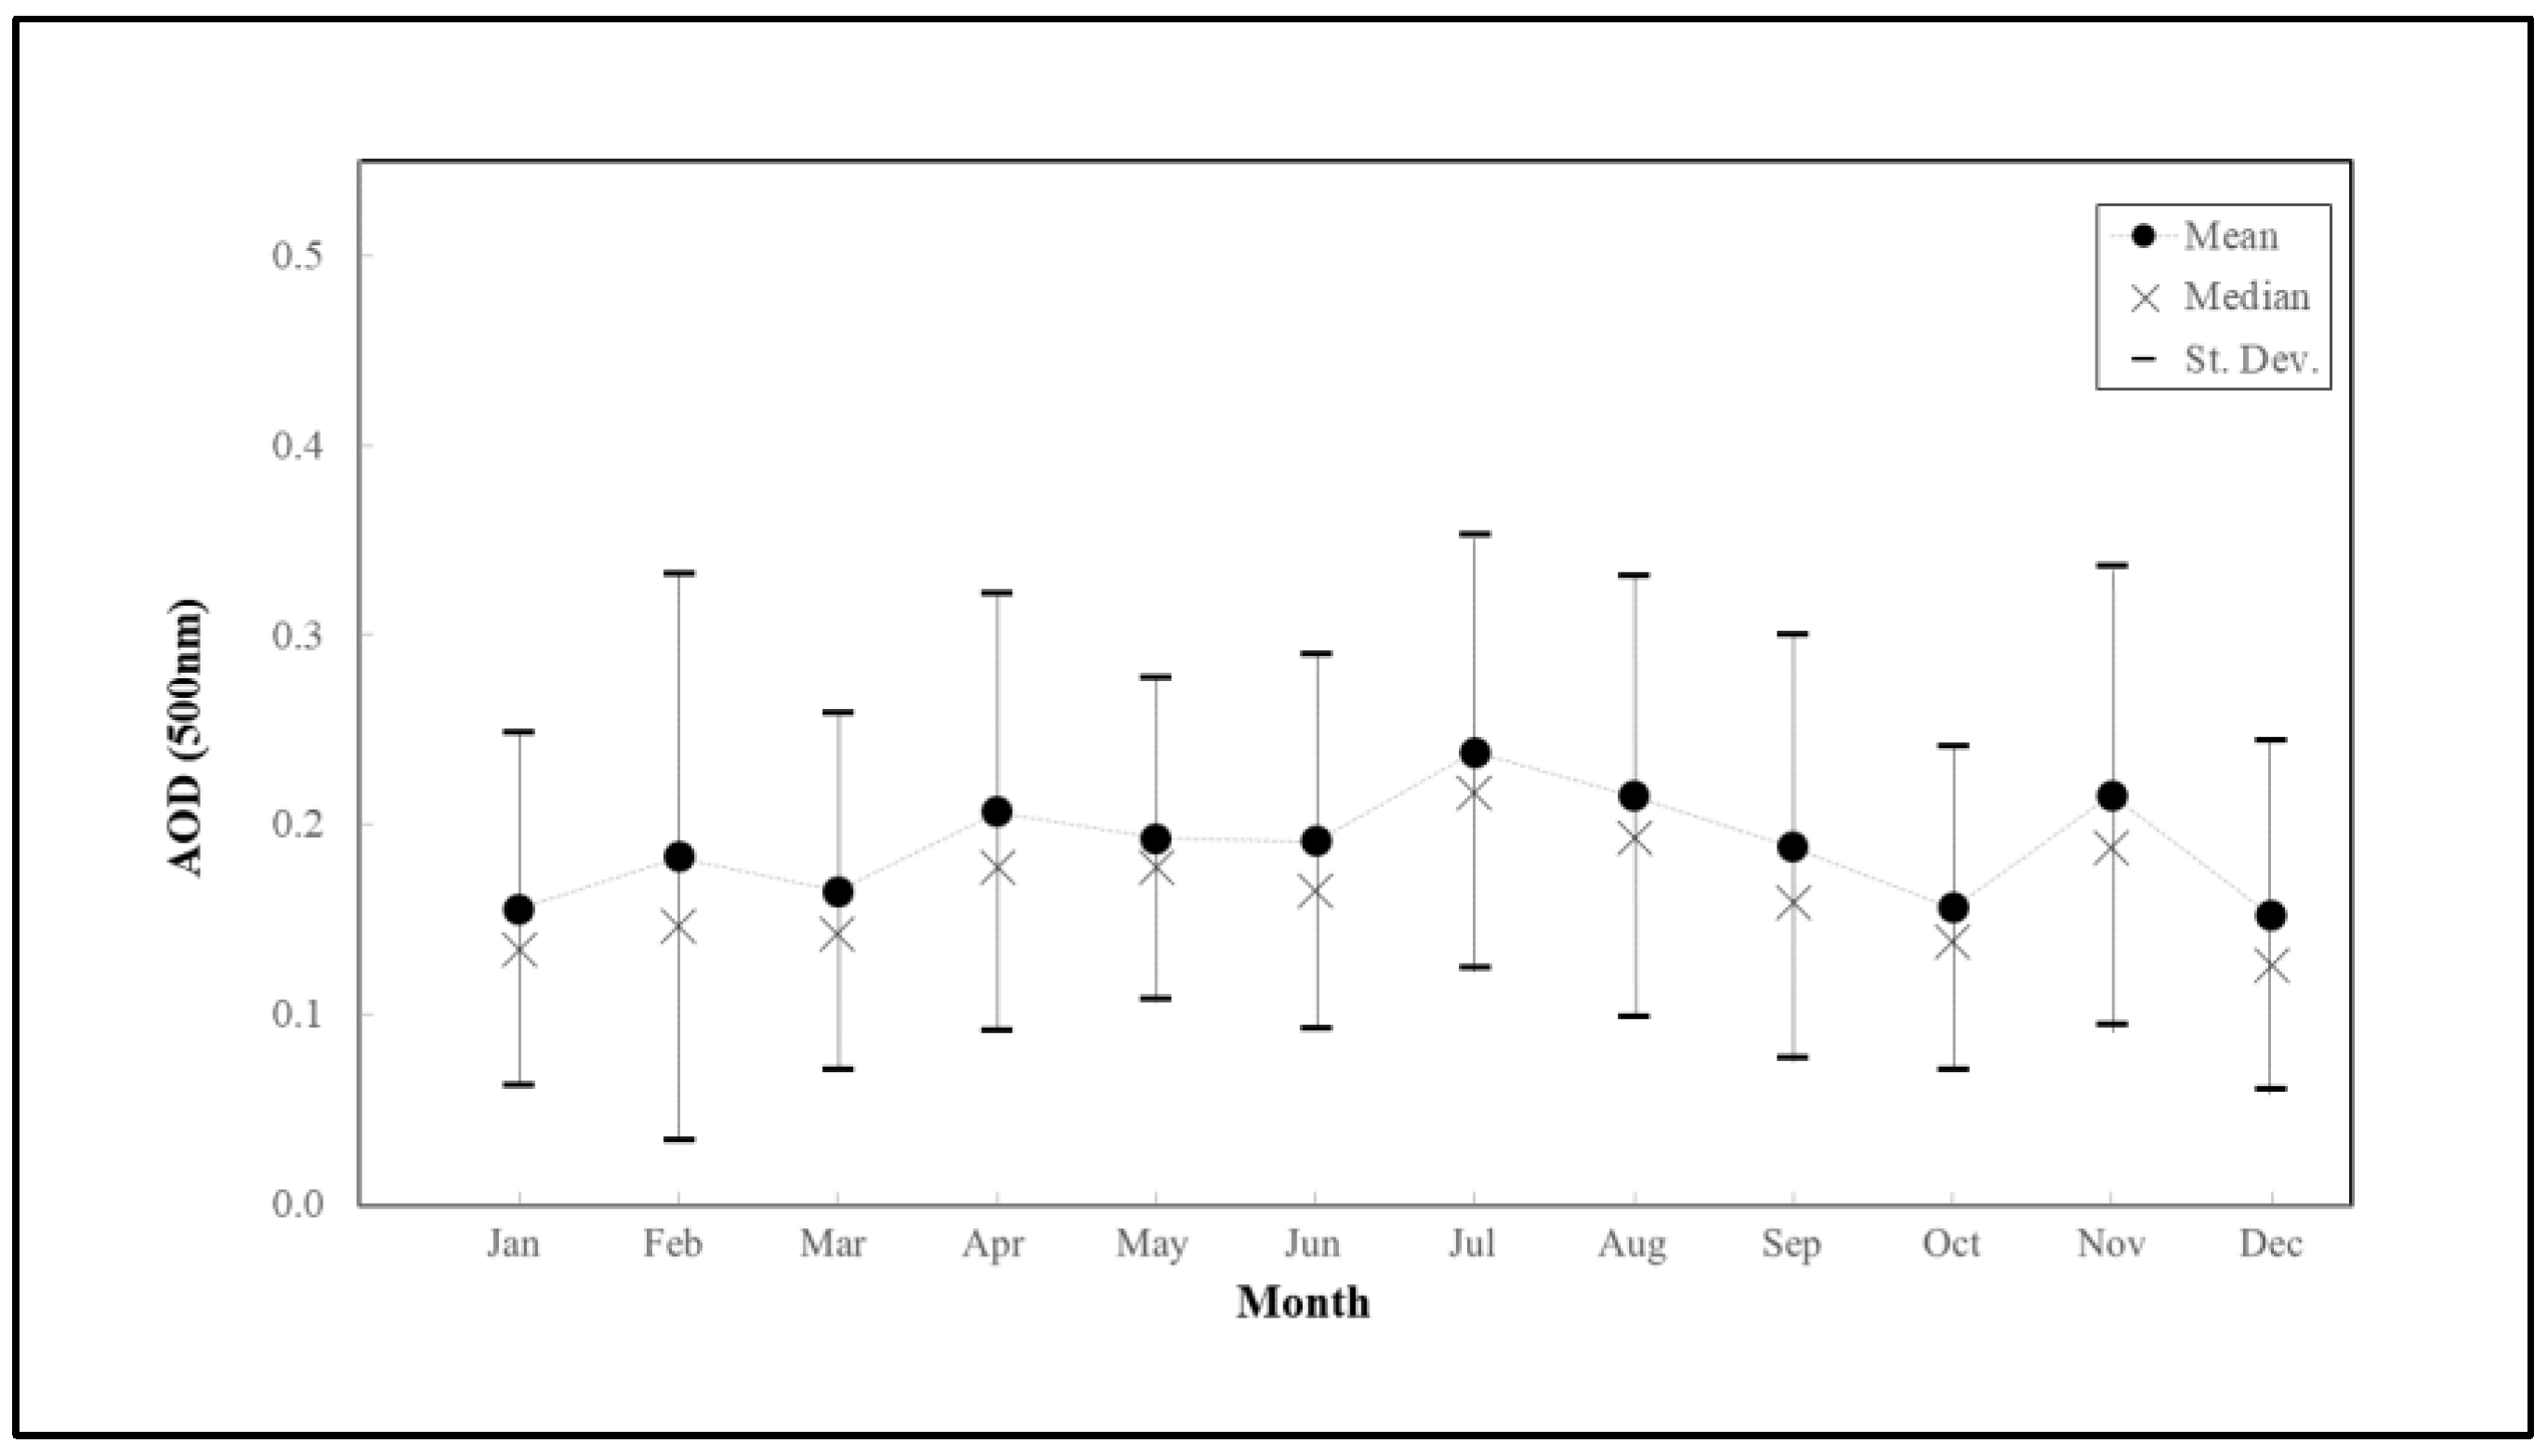
The monthly mean variation of AOD at 500 nm is presented in Figure 5. Retrievals at this wavelength show peak monthly AOD values in July–August (0.23 and 0.21 ± 0.11, respectively), while the minimum values are recorded in December and January (0.15 ± 0.09). In the absence of precipitation, the low scavenging of atmospheric aerosols is linked to the warm-season maximum. In addition, aerosols resulting from wildfires caused by severe drought events in Eastern Europe have influenced the aerosol load in the atmosphere in the summer months. On the other hand, higher precipitation values in the colder months played a dominant role in below-cloud aerosol wet deposition. In addition, the behavior of the population in Eastern Europe plays a role in contributing to the total aerosol load in the atmosphere in the cold season, through generating controlled fires (biomass burnings) in agricultural regions [63]. The majority of these fires occur during the pre-spring (February) and late autumn (November) periods.
Figure 6 shows the monthly mean variation of the angstrom exponent (440–870 nm). Upon initial observation, it becomes apparent that fine particles prevail throughout the year, as indicated by AE values surpassing 1. The overall mean value of the AE for the entire measurement period is 1.5 ± 0.29, with a maximum of 1.62 ± 0.26 in August, and a minimum of 1.33 ± 0.39 in April. The April minimum can be mainly attributed to the presence of larger aerosol particles such as mineral dust. This is a consequence of the Saharan dust intrusion events, as shown in [39,63,64,65].
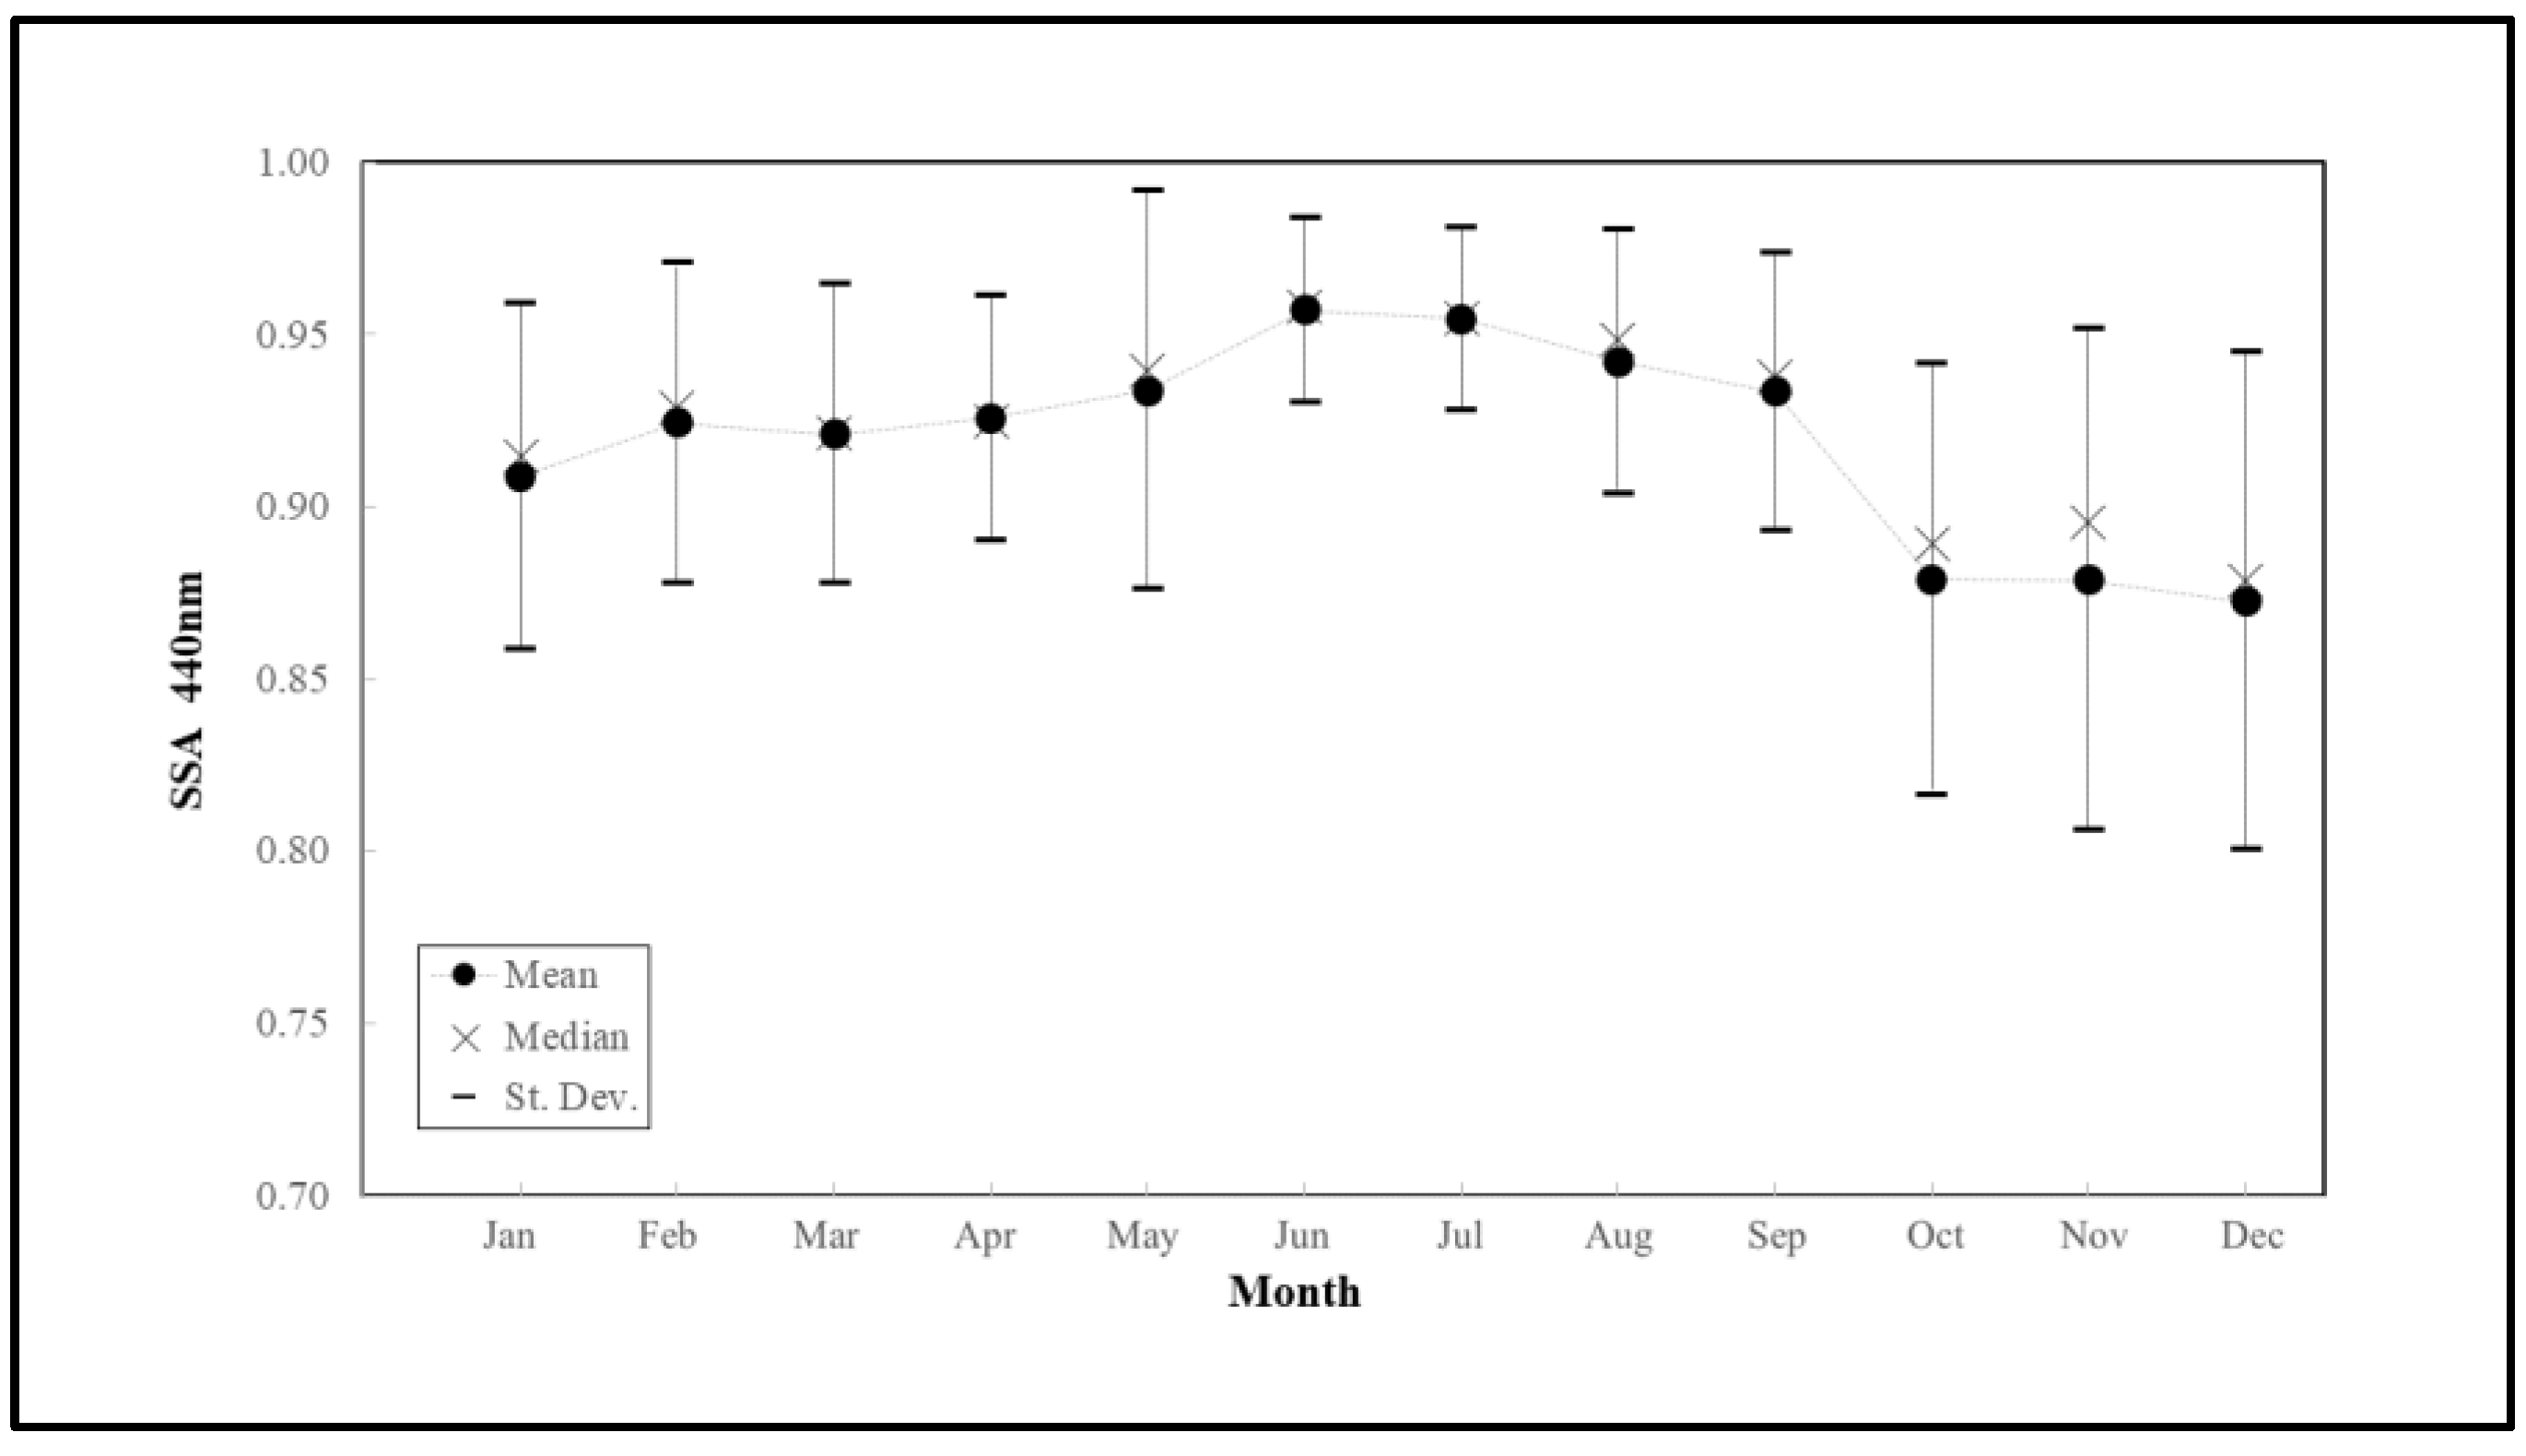
Single Scattering Albedo at 440 nm is presented in Figure 7. Despite utilizing level 1.5 data for this parameter, just over 5000 observation points were generated during the analyzed period. The overall mean SSA value at 440 nm is 0.92 ± 0.05, with a maximum of 0.96 ± 0.03 in June, and a minimum of 0.87 ± 0.07 in December. The lowest values are typically observed during the cold season, particularly in October, November, and December, when the atmosphere contains higher concentrations of absorbing aerosols, due to atmospheric conditions and increased use of fossil fuels for heating and transportation. This can result in elevated levels of black carbon in the atmosphere.
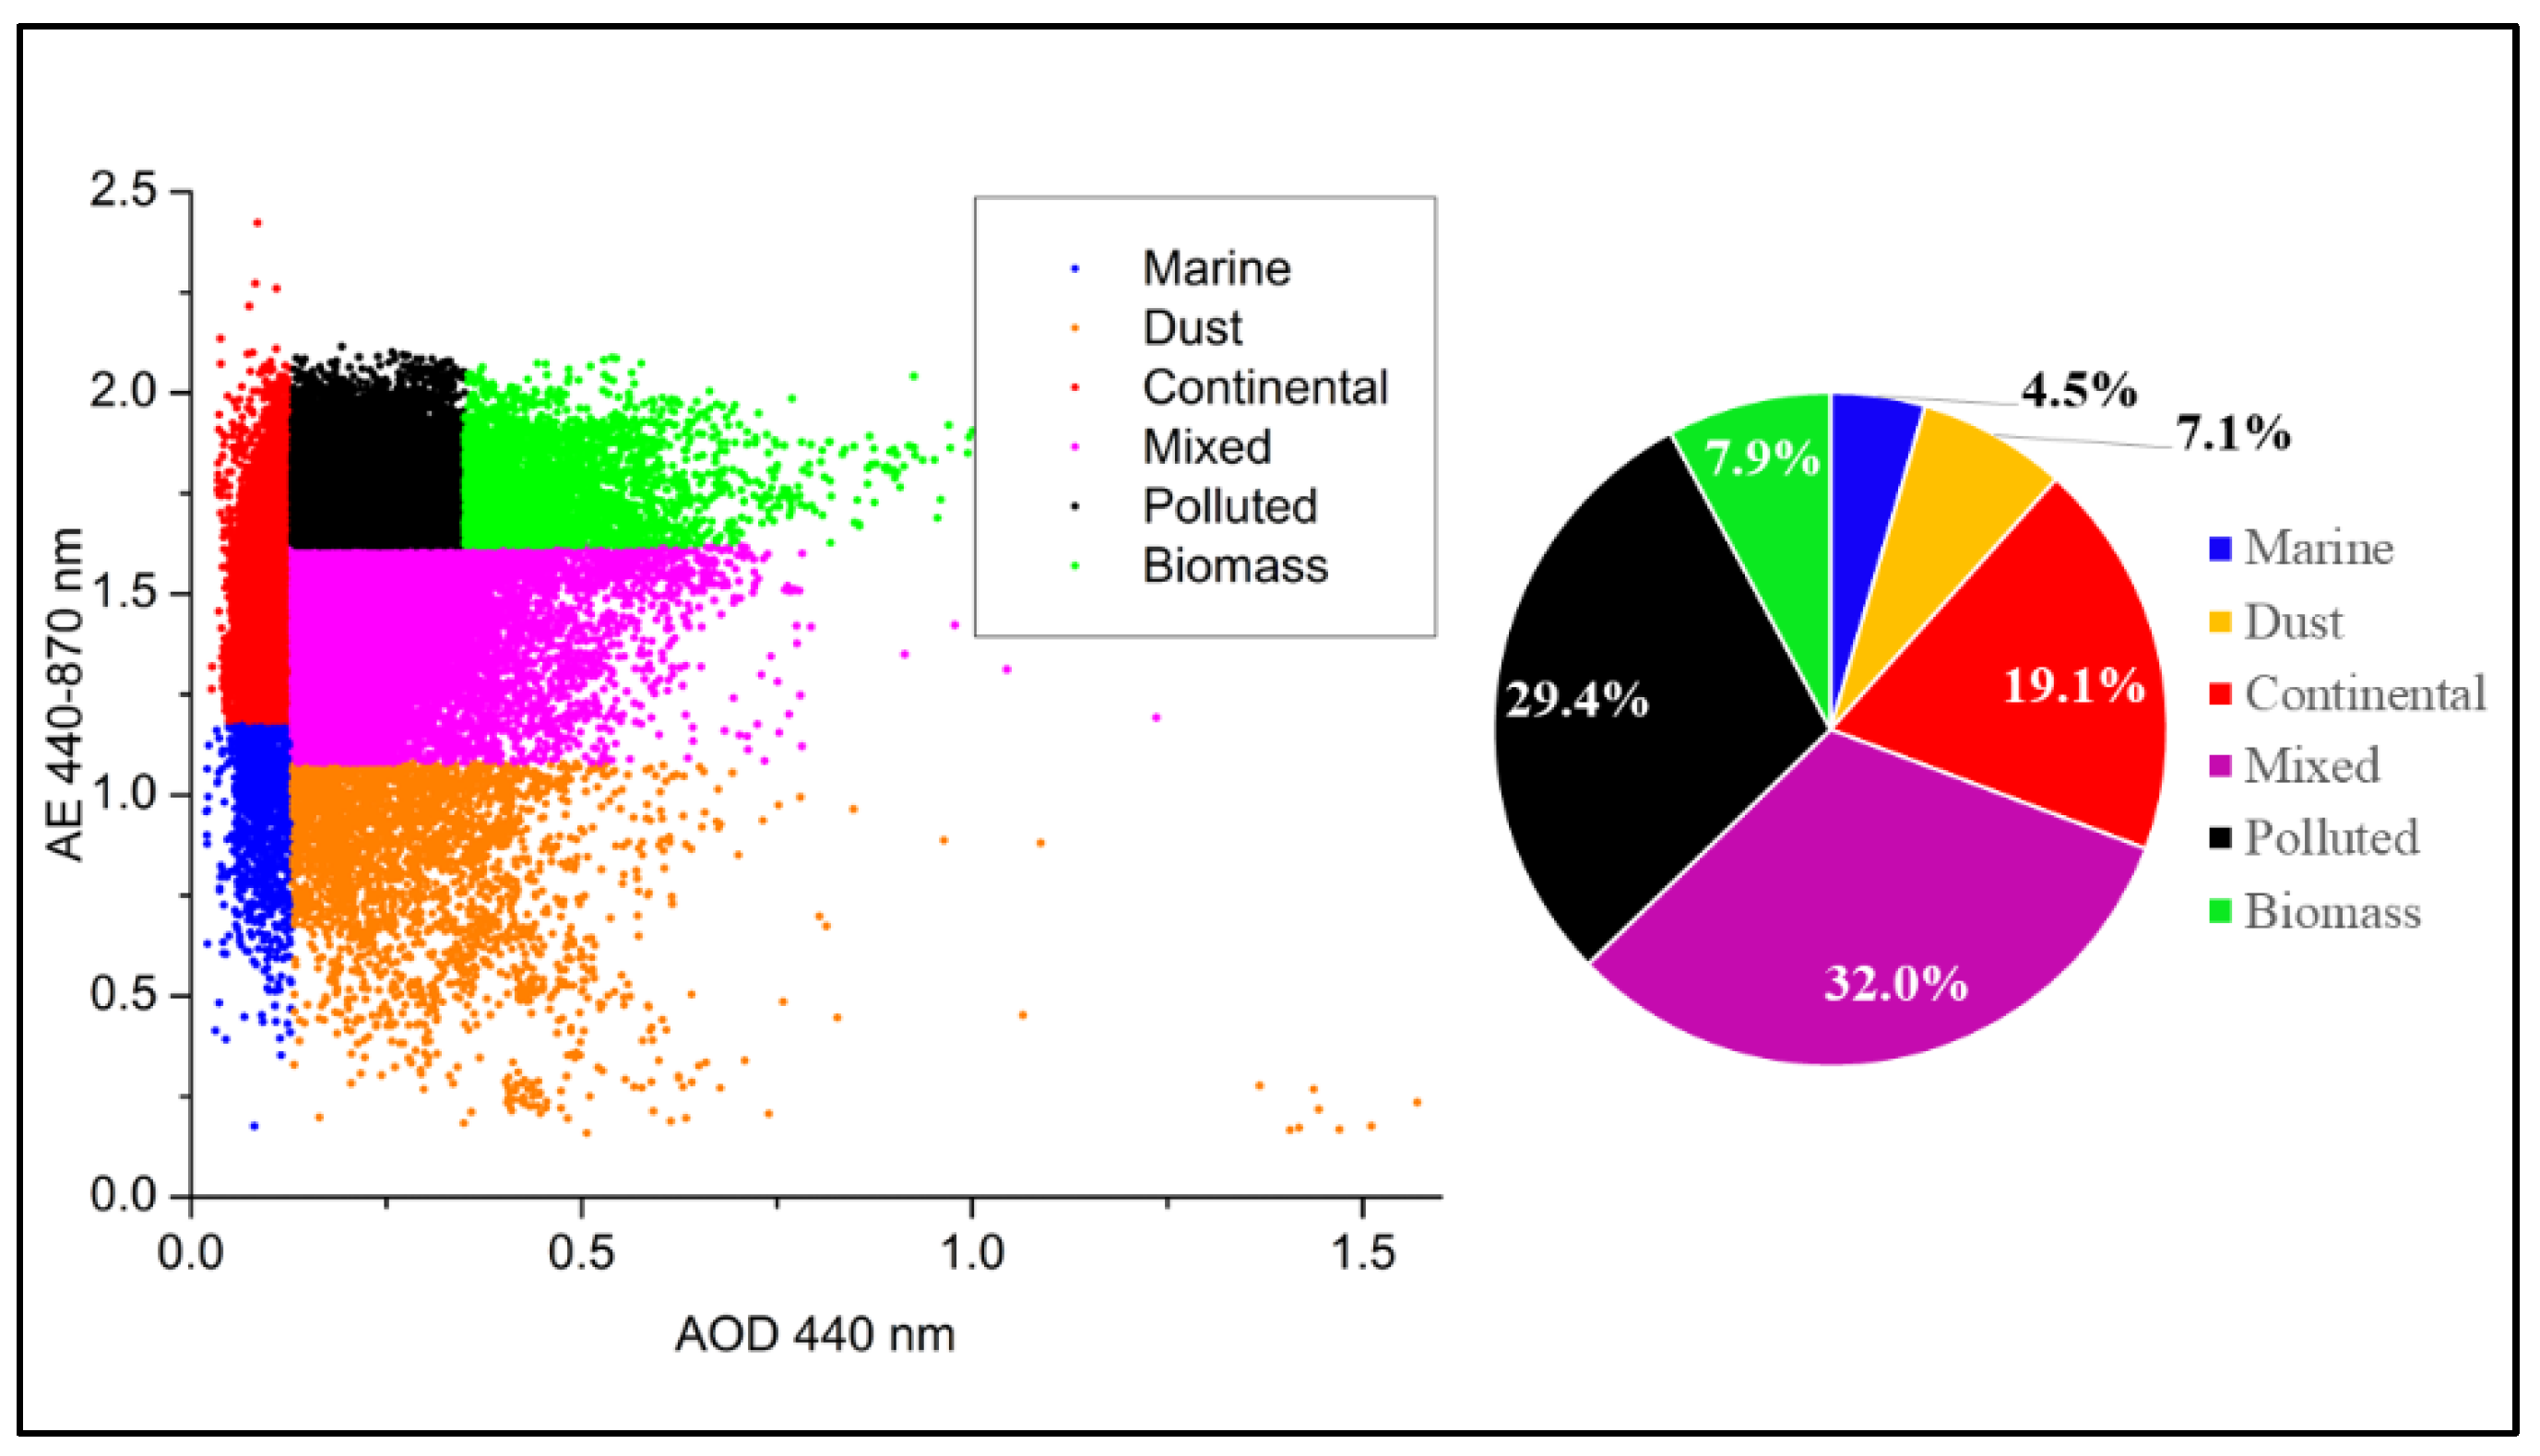
The aerosol classification, which was used in similar studies [15,47], is presented visually in Figure 8. As mentioned in the Methodology Section, this classification is only meant to highlight the prevailing type(s) of aerosols and their proportions, based on previously defined threshold values for each class. According to this classification, we observed higher proportions of continental (19.1%), polluted (29.4%), and mixed aerosols (32%). In contrast, the least-frequently detected as being the dominant aerosol classes are those resulting from biomass burning (7.9%) and marine sources (4.5%). Although marine and continental aerosols are prevalent in cases of low AOD, the scarcity of observed marine aerosols can be attributed to the considerable distance from the sea. Additionally, the physical properties of marine aerosols are not conducive to their long-range transport. Mineral dust comprises 7.1% of the overall observations, this proportion being influenced by the seasonal occurrence of mineral dust intrusions.
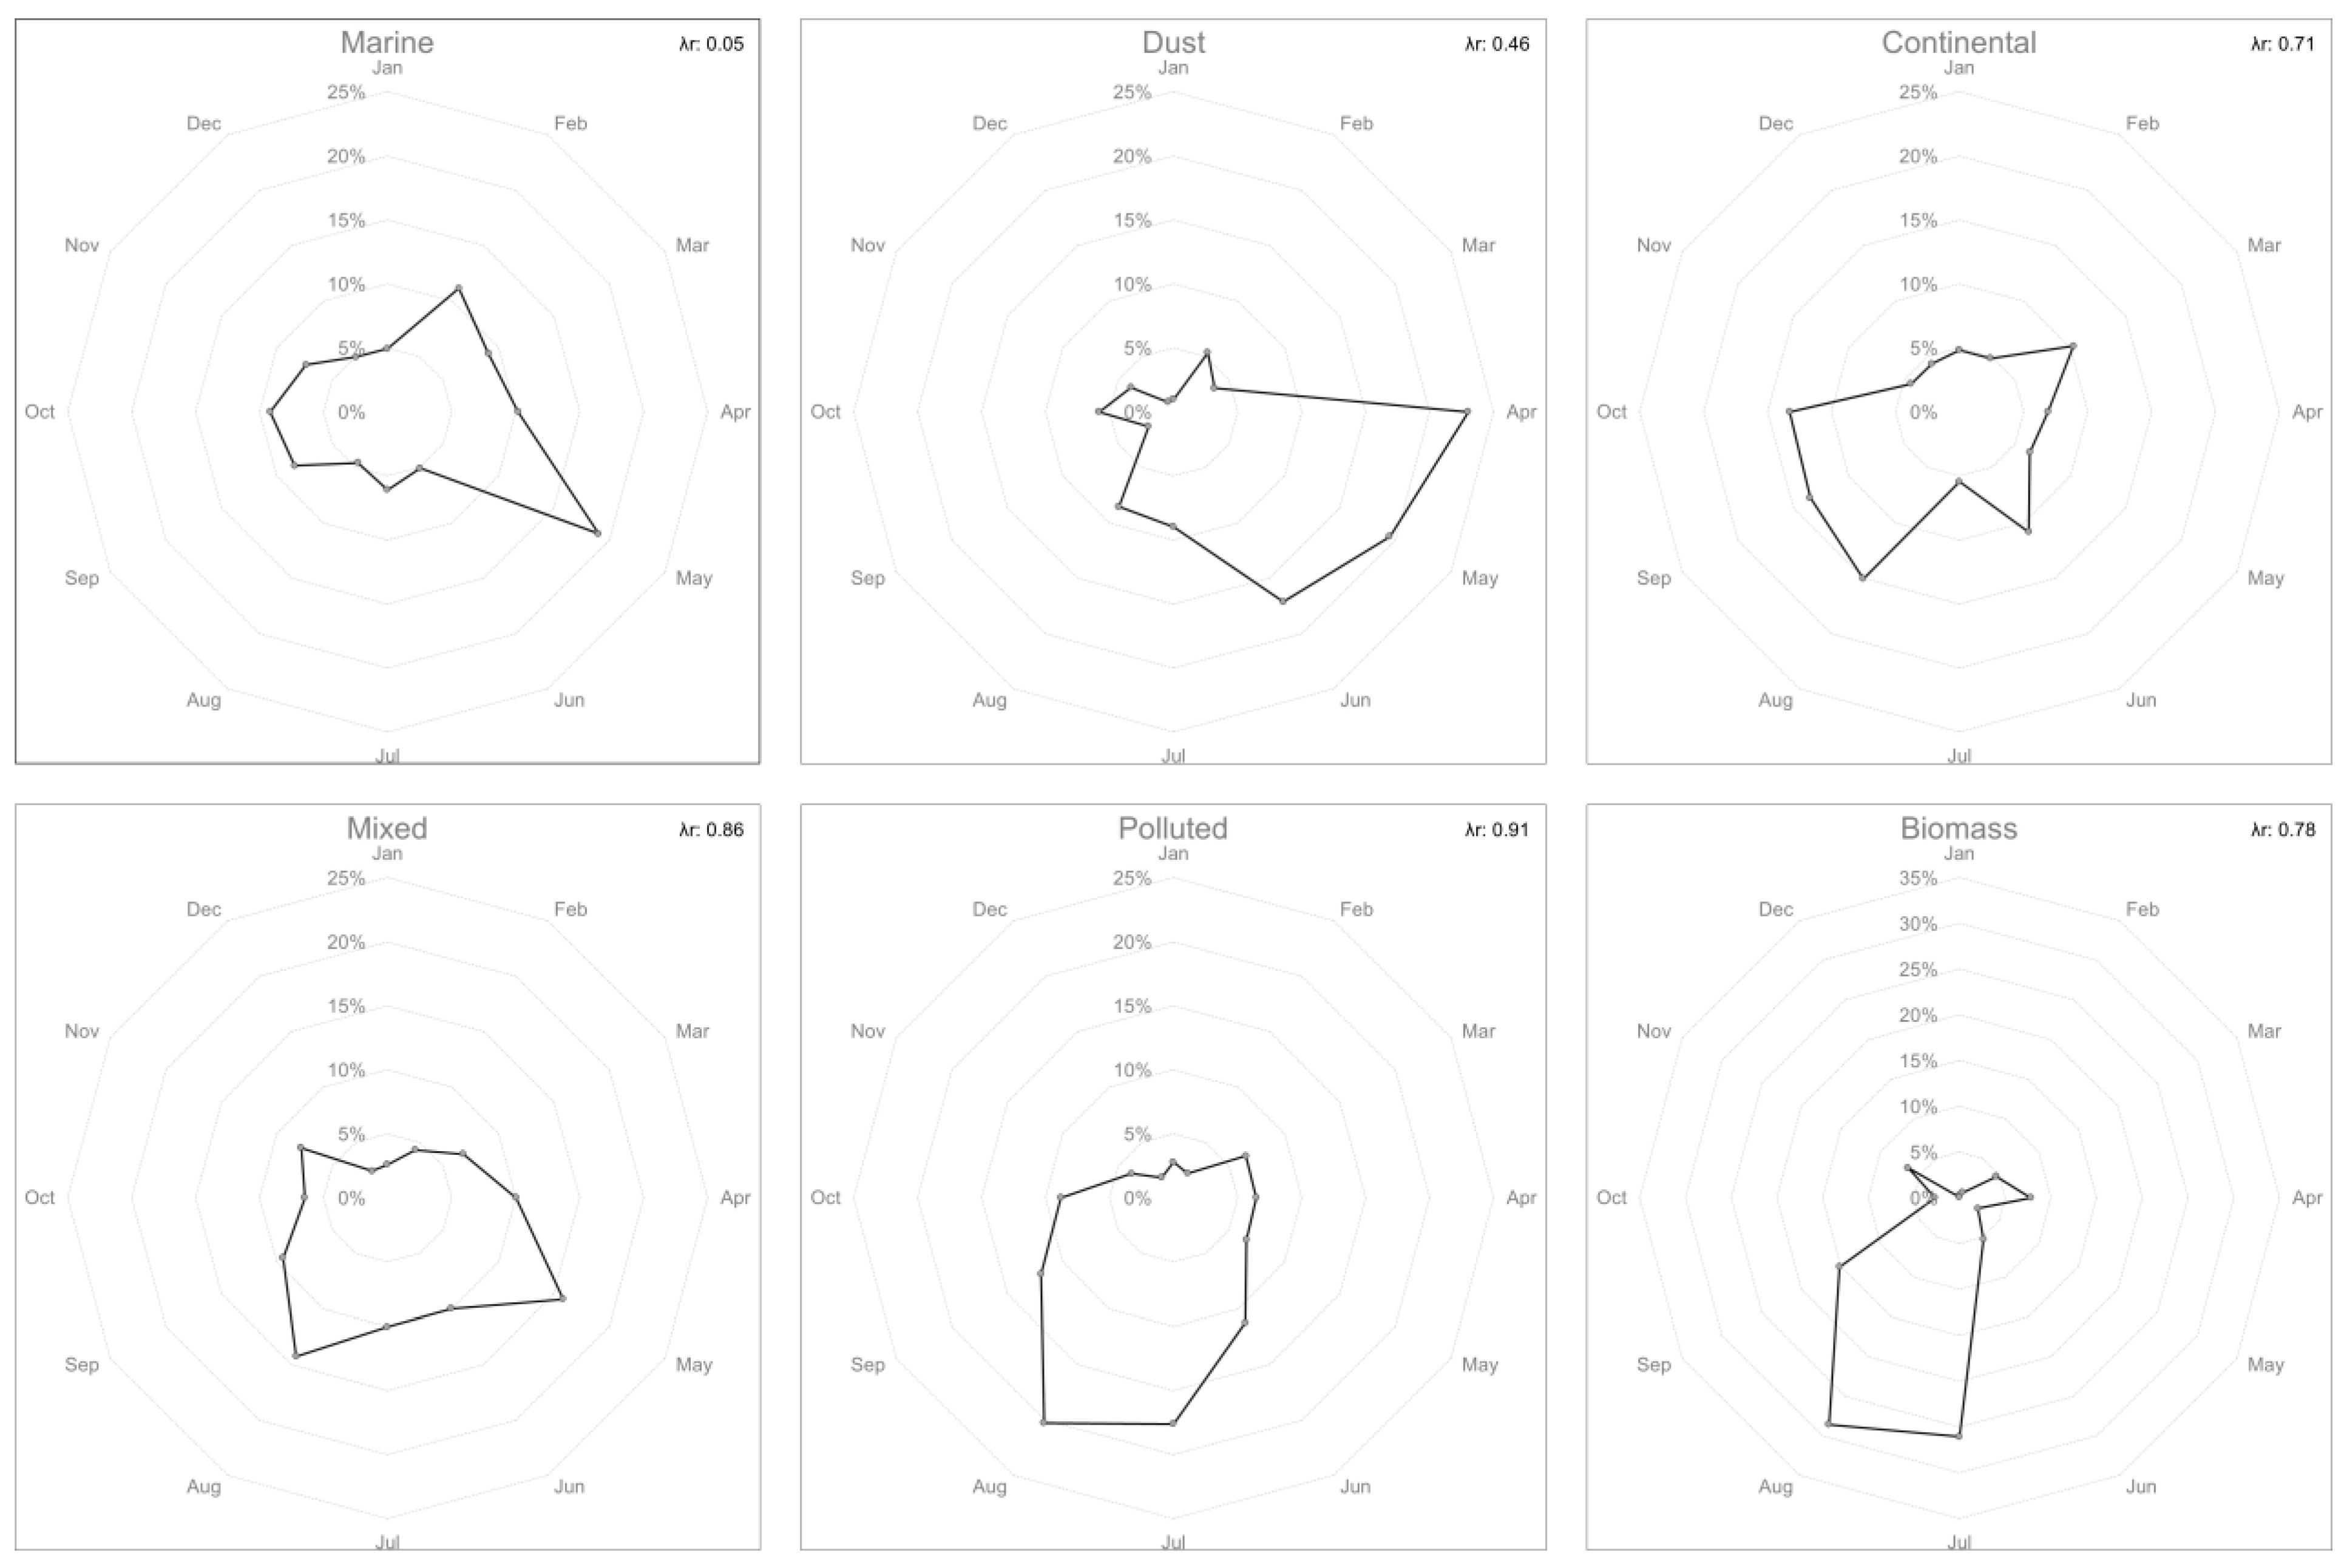
The graphics presented in Figure 9 depict the monthly distribution of observations for each aerosol class, to highlight the potential seasonal character of different types of aerosols. While mixed and polluted aerosols appear to be more prevalent in the summer months, their high correlation coefficient with the total number of observations (λr = 0.86 for mixed and λr = 0.91 for polluted) suggests that they are present throughout the year. It is possible that their apparent prevalence in the summer months is due to proportional representation.
The distribution of monthly observations for continental aerosols reveals a shift towards the months of August through October. Although the high number of observations in August can be attributed to a relatively elevated correlation coefficient (λr = 0.71), the prevalence of such observations in early autumn can be a result of increased agricultural activities such as harvest and plowing, in addition to natural processes related to vegetation decay. In addition, weather patterns (relatively calm weather conditions) facilitate the buildup of aerosols from previously mentioned sources.
For biomass-burning aerosols, the high frequency of observations during the summer months is attributed to the increased occurrence of wildfires over the last decade, which has been exacerbated by episodes of drought. Some examples of such events are the 2010 Russian wildfires [66], the 2015 Ukrainian wildfires [67,68], and the 2019 Siberian wildfires [69]. Biomass-burning aerosols from the specific Eastern European agricultural practices of burning the farmland are also observed in smaller fractions during the months of March–April and November. During the spring months, the atmosphere contains a significant fraction of coarse aerosols (such as mineral dust), which can contribute to a lower number of observations where only the fine fraction is detected.
Similar to specific events that were highlighted in previous studies on dust intrusions over Cluj-Napoca [39,63,64,65], this statistical analysis confirms that dust aerosols are notably prevalent during the months of April, May, and June. This seasonality is mostly determined by atmospheric circulation patterns.
The atmospheric circulation patterns previously mentioned also facilitate the transport of marine aerosols, particularly in May, as air masses move from the southwest (Adriatic Sea) towards the continental region of Eastern Europe. The small value of the correlation coefficient (λr = 0.05) clearly shows the seasonal character of these aerosols in the atmospheric column above Cluj-Napoca.

3.2. MODIS MAIAC Validation against AERONET

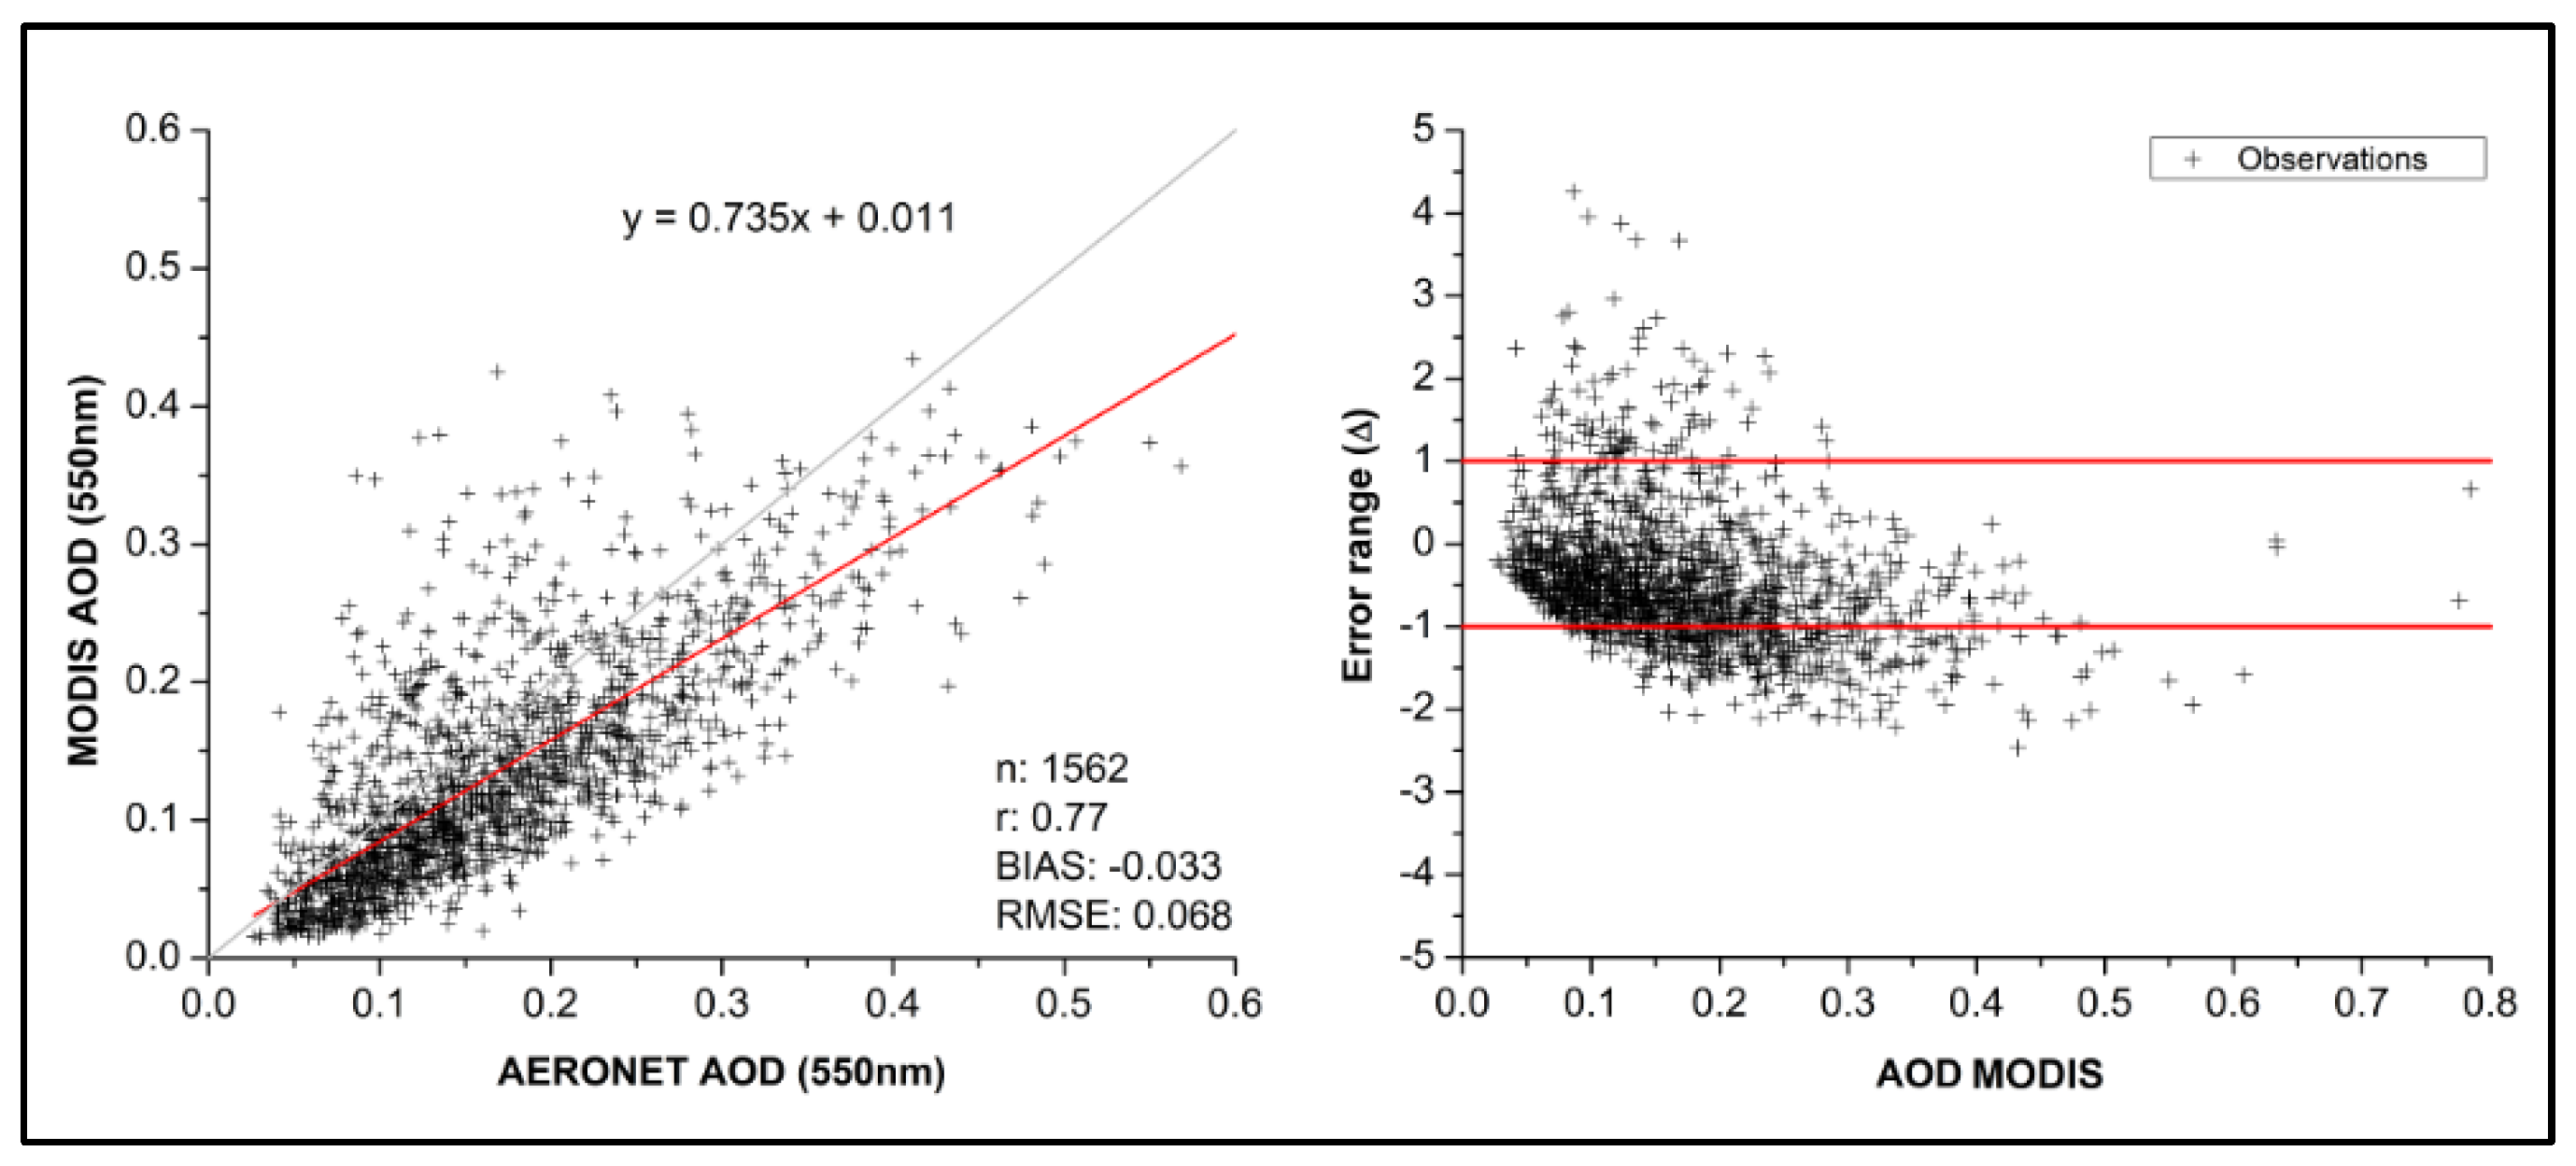
Figure 10 shows the linear correlation between satellite (MODIS MAIAC) and ground-based observations (AERONET) over Cluj-Napoca, Romania. The slope and intercept of the linear fit are known as good indicators of the robustness of the aerosol model assumptions and surface reflectance estimates, as part of the retrieval algorithm [32,49]. The slope (0.73) and negative bias (−0.03) indicate a slight underestimation of MAIAC AOD in overall low AOD conditions, averaging 0.17 observed by AERONET and 0.14 retrieved by MAIAC. The correlation coefficient r = 0.77 shows fairly good agreement between the two datasets, while the RMSE indicates a low value of 0.068.
The distribution of normalized errors is also presented in Figure 10. The expected error (EE) envelope contains the absolute (0.05) and relative (0.10) uncertainty estimates as described in [21], and should account for the majority of error sources. At the Cluj-Napoca site, 71% of errors fall within the EE, while 23% fall below and 6% fall above this threshold. This indicates that the MAIAC retrieval seems to overestimate the uncertainties in low AOD conditions. Since both AOD and error values were relatively small, we assessed the contribution of the AERONET uncertainty to the overall distribution of normalized errors. As such, there was only a 3% increase in the lower threshold, suggesting that the MAIAC error budget is somewhat pessimistic. Thus, at least for this location, a slight adjustment to the first coefficient of the EE expression is warranted.
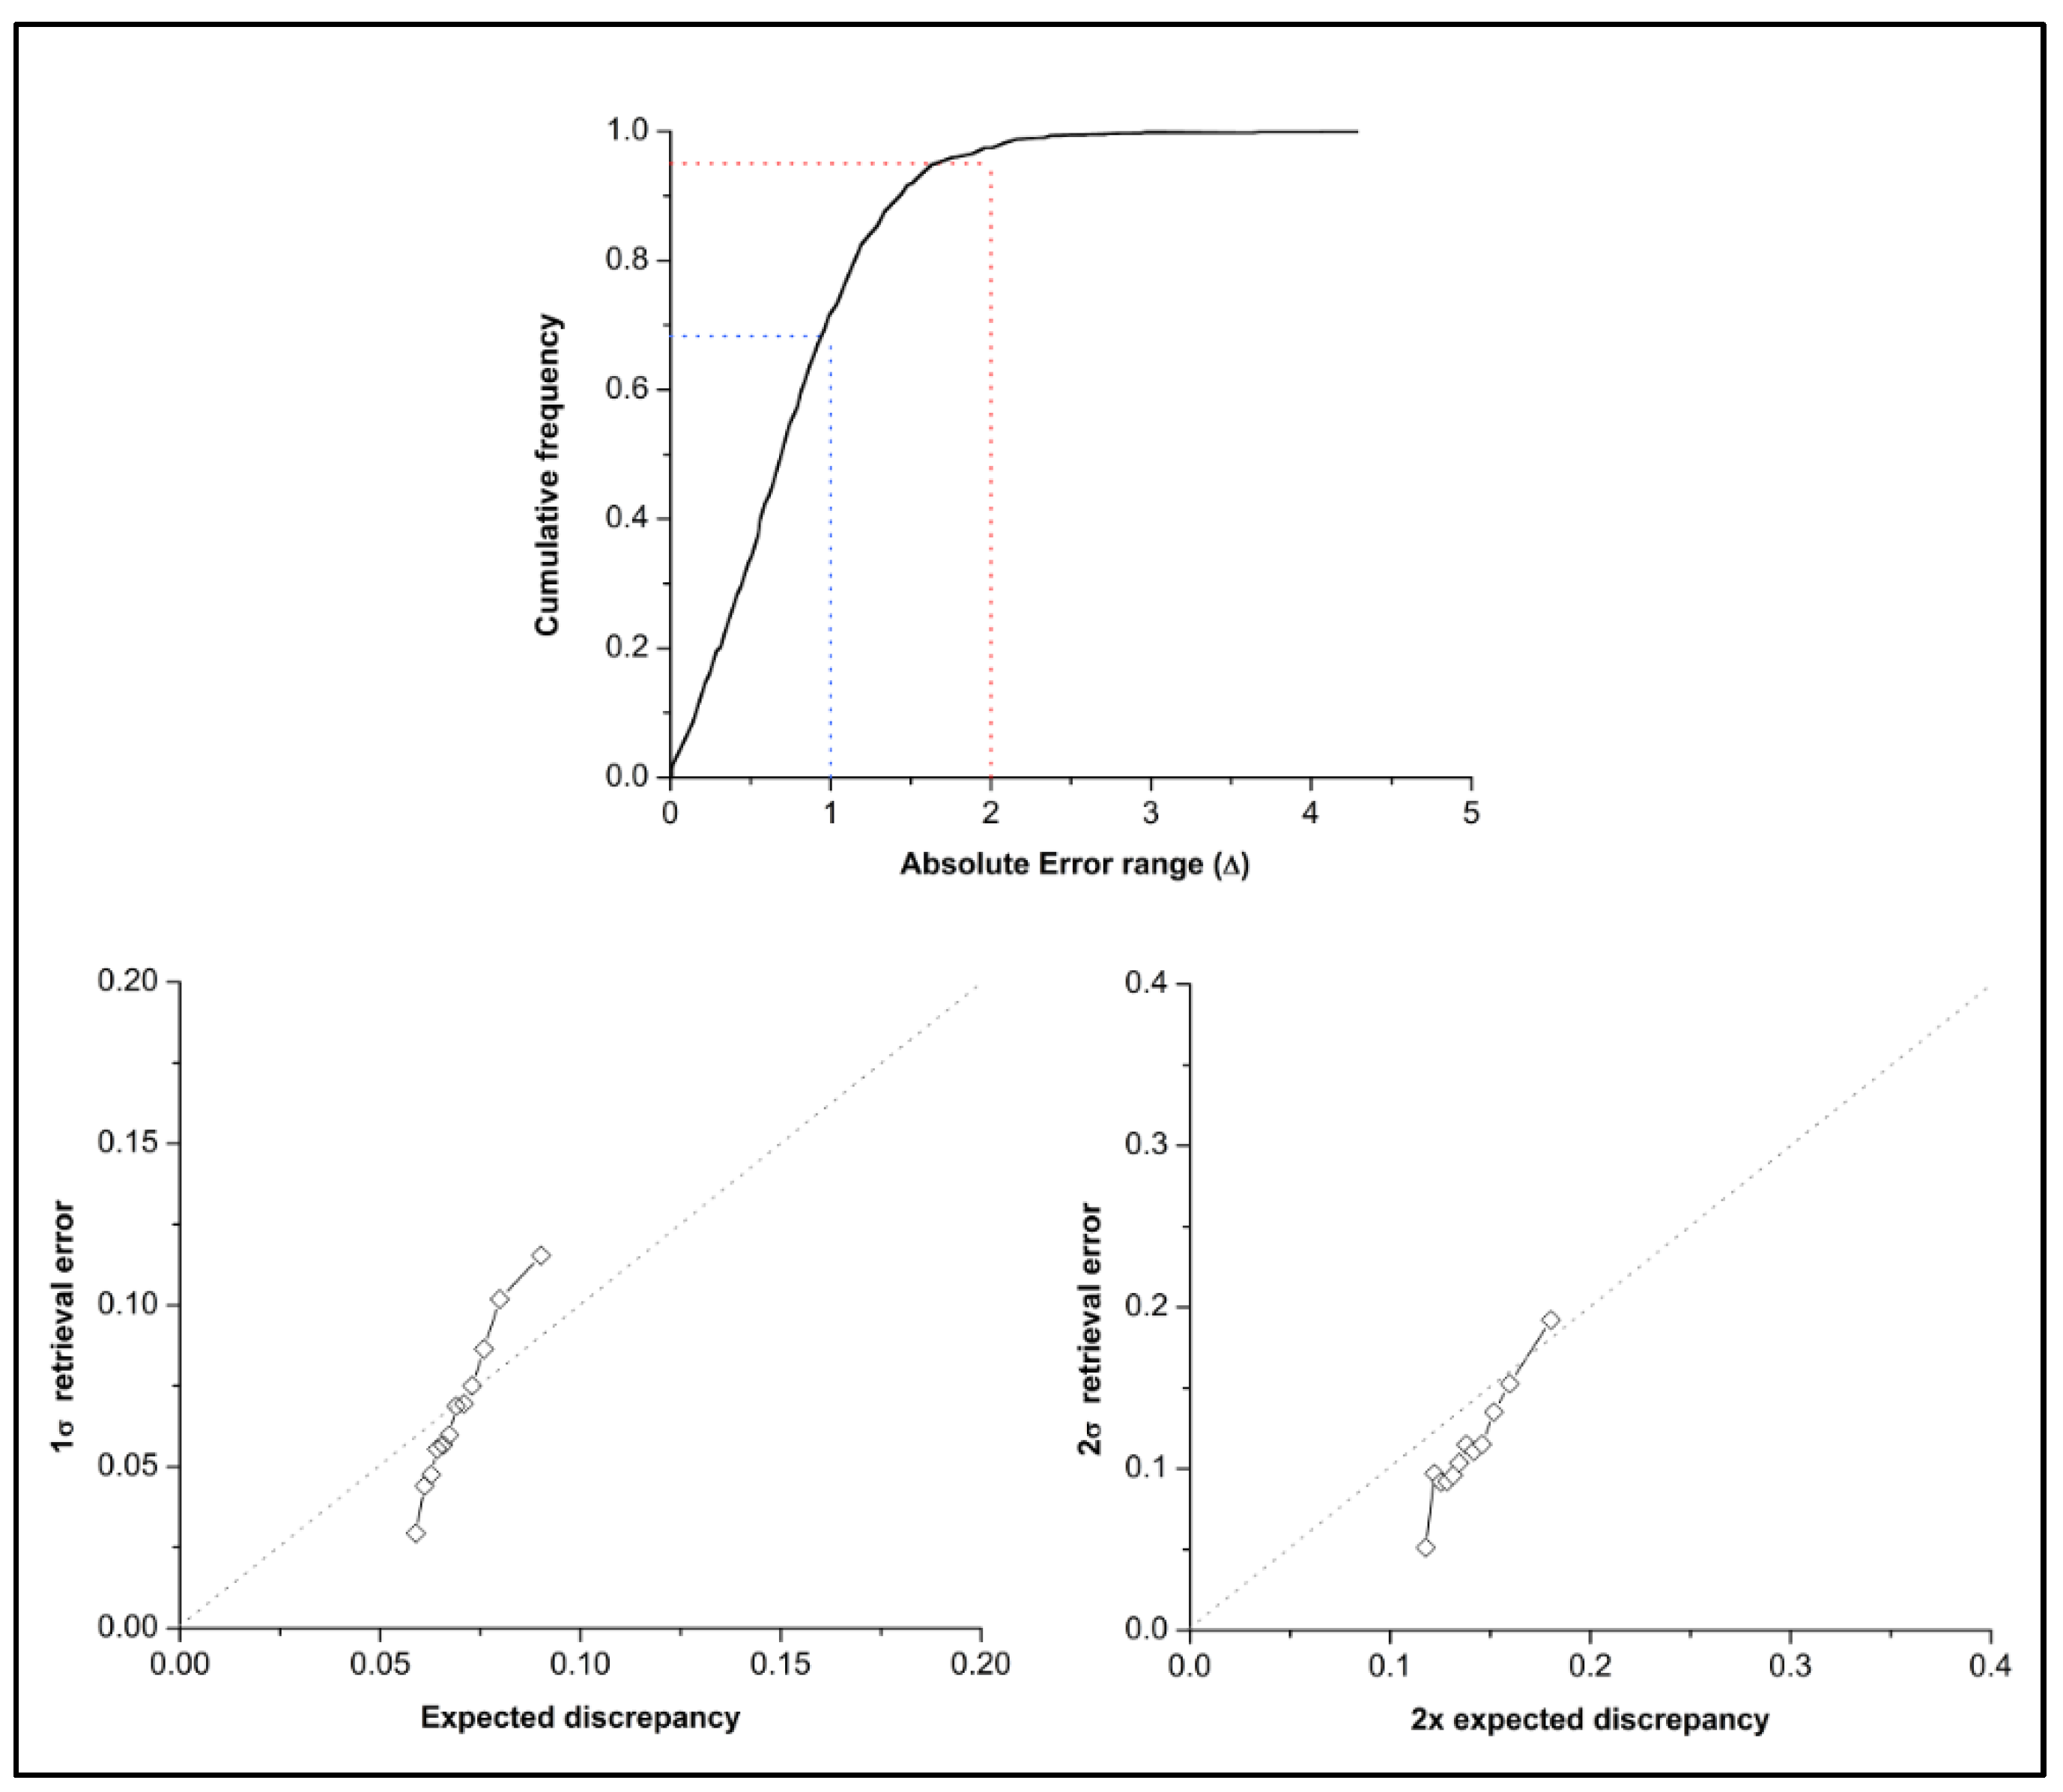
The cumulative distribution function (CDF) in Figure 11 suggests that the normalized errors are randomly distributed, with slight deviations from an ideal curve. The bottom row shows 12 equally divided bins of the expected discrepancy vs. the 1σ retrieval errors and twice the expected discrepancy vs. the 2σ retrieval errors, as suggested in [59]. The MAIAC uncertainties seem to be overestimated on the low end and slightly underestimated on the high end, with the majority of values being clustered close to the 1:1 line. When assessing the 2σ retrieval errors, the overestimation of uncertainties at Cluj-Napoca is slightly more apparent, although the bin values seem to cluster more together, suggesting that the retrieval errors are roughly Gaussian. Overall, these findings indicate that the uncertainties of the MAIAC AOD retrievals over Cluj-Napoca are fairly well estimated.

4. Discussion

In this study, we used ground-based AERONET measurements taken between 2010 and 2020 to identify the dominant aerosol types and the interactions with meteorological factors. First, we characterized the meteorological parameters considering the monthly values of temperature, relative humidity and wind speed and direction. Secondly, we analyzed the optical parameters such as the AOD at 500 nm and the angstrom exponent, in order to determine the climatology of aerosols in the Cluj-Napoca region. The maximum average value of AOD was reached in July and August and the minimum in December and January. This is in agreement with AERONET average values of AOD at stations from South East Europe [70,71]. The angstrom exponent showed minimum values in April and May and maximum values in August. The minimum is influenced by relatively frequent intrusions of mineral dust, as shown in other studies [20,39]. The maximum values from August are mainly due to the presence of smoke from wildfires, as other studies suggest [70].
Regarding the proportions of the primary aerosol classes, it is noteworthy to consider the similarities and differences with previous studies that utilized a similar methodology for classification. Similar to these study findings, the statistical analysis of 10 years of AERONET data from the station in Athens [15] showed that the most prevalent aerosol types were continental (19%), mixed (23%), and polluted aerosols (27%). Higher proportions of marine (11%) and dust aerosols (16%) were measured in Athens, a fact determined by the geographical positioning in a coastal area much closer to the African continent. A slightly smaller fraction of biomass-burning aerosols was identified over Athens (5%). Stefan et al., in a similar study of the aerosol optical characteristics over the Romanian Black Sea coast using AERONET data [71], showed the predominant presence of a fine fraction of aerosols of anthropogenic origin (mixed, polluted, and biomass). In a study examining the typology of long-range transported aerosols over Europe from 2008 to 2018, Ref. [70] reported that smoke, continental, polluted-continental, dust, and marine aerosols were present in Southeast Europe, with smoke being the most prevalent (43%), followed by continental (28%), polluted-continental (12%), marine aerosols (8%), and dust (4%). Ref. [72] classified the aerosol types at the AERONET sites in the Eastern Mediterranean and Black Sea, using a method based on the sensitivity of microphysical aerosol properties, and identified a higher proportion of marine aerosols, specific to coastal regions. Generally, Eastern Europe studies focused on the proportion of primary aerosol classes showed similar results, with variations that can be attributed to differences in geographical locations, meteorological conditions, and analytical techniques.
In low AOD conditions, such as the one presented in this study, it is worth noting that the MAIAC retrieval algorithm is known to exhibit a slight negative bias over urban areas, due to overestimations of surface reflectance. Additionally, this overestimation may be more prominent in areas dominated by absorbing aerosols, leading to a possible overestimation of the SSA [24,25,32]. The lowest AOD and SSA values in Cluj-Napoca are observed between October and March, see Figure 5 and Figure 7. This period typically coincides with the controlled biomass burnings in the Eastern European agricultural regions. Furthermore, during this time of the year, the increased precipitation in the Cluj-Napoca area contributes to an increase in the occurrences of low AOD (due to wet scavenging) and low SSA (caused by agricultural fires and residential wood burning) [63]. Figure 1 shows the land cover types present in the collocation area. The vast majority of land use is classified as urban, hence the predominantly bright surfaces. A negative bias in such conditions has been observed by [25,73], with similar RMSE values. Ref. [32] reported similar underestimations in the Western part of China for low-to-moderate AOD. Ref. [37] showed that negative bias for 0.1 < AOD > 0.3 is common, regardless of location, while lower correlations may result from retrievals over brighter surfaces. Ref. [24] showed slight underestimations in urban and mixed areas over South America for low AOD. Ref. [23] reported better overall correlations and lower RMSEs in urban areas of North America, with a similar slightly negative bias. Complex urban areas are known to impose challenges for satellite aerosol retrievals, where even slight errors in surface reflectance estimations may propagate and enhance overall bias [24,32]. In cases of low AOD, the static aerosol models used by the MAIAC retrieval algorithm may not account for on-site conditions with respect to spatio-temporal variations in environmental attributes and aerosol properties [21].
Similar findings regarding the distribution of uncertainties as reported in our study are consistent with [25], who reported 70% within the EE for low AOD over bright surfaces. Ref. [37] reported between 62% and 75% within the EE for low-AOD conditions, while [38] reported 74% within the EE over urban land. Ref. [24] reported between 45% and 57% within the EE for urban areas and 64% to 68% for mixed areas, although these values were indicative of a more stringent EE envelope of ±(0.05 + 0.05 × AOD). Neither of the authors reported a significant percentage below the EE for a low-AOD urban site. As such, these values may be indicative of complex absorbing-aerosol mixtures, as seen in Figure 8, and the seasonal variation of SSA, observed in Figure 7.

5. Conclusions

In this study, we analyzed a decade of AERONET measurements for the city of Cluj-Napoca, Romania, from 2010 to 2020. Version 3 Level 2.0 data have been used, except for SSA, where Level 1.5 data were used. Maximum AOD values are observed in July and August (0.23 and 0.21 ± 0.11, respectively), while the minimum values are recorded in December and January (0.15 ± 0.09). The overall mean value of the AE for the entire measurement period is 1.5 ± 0.29, with a maximum of 1.62 ± 0.26 in August, and a minimum of 1.33 ± 0.39 in April.
Based on the classification proposed by Dubovik et al. [47], the dominant types of aerosols in the Cluj-Napoca area are represented as mixed (32%), polluted (29.4%), and continental aerosols (19.1%).
The MAIAC algorithm was fairly well correlated with AERONET over the urban environment in Cluj-Napoca, Romania. The slightly negative bias in low-AOD conditions seems to be a common feature reported in the scientific literature, and may be indicative of complex absorbing-aerosol mixtures. The uncertainties roughly followed a Gaussian distribution, with small overestimations at the low end and some underestimations at the high end. Since the MAIAC retrieval algorithm utilizes static aerosol models, the spatio-temporal variations of aerosol properties in urban environments may not be sufficiently represented, thus inducing additional errors.
This study was carried out to complete and improve other similar studies from other regions. Further analyses of different sources of data could more clearly improve the signatures of aerosol types in the region.

Author Contributions

Conceptualization, H.I.Ș., A.R. and A.M.; methodology, A.R. and A.M.; validation, N.A.; formal analysis, A.R., V.A., H.C. and C.G.; investigation, H.C.; resources, D.C.; writing—original draft preparation, H.I.Ș., A.M. and A.R.; writing—review and editing, N.A., D.C. and C.B.; visualization, H.C.; supervision, N.A. All authors have read and agreed to the published version of the manuscript.

Funding

This research was funded by and supported by the 2021 and 2022 Development Fund of the UBB.

Data Availability Statement

Data from AERONET are publicly available on https://aeronet.gsfc.nasa.gov, accessed on 15 April 2023. The MODIS MAIAC 1 km aerosol product data presented in this study are openly available in [MCD19A2] at (DOI: https://doi.org/10.5067/MODIS/MCD19A2.006, accessed on 15 April 2023).

Acknowledgments

This work was supported by the project entitled “Strengthening the participation of the ACTRIS-RO consortium in the pan-European research infrastructure ACTRIS” SMIS CODE 107596, co-financed by the European Union through the Competitiveness Operational Programme 2014–2020. This work was supported by the Project entitled “Development of ACTRIS-UBB infrastructure with the aim of contributing to pan-European research on atmospheric composition and climate change” SMIS CODE 126436, co-financed by the European Union through the Competitiveness Operational Programme 2014–2020.

Conflicts of Interest

The authors declare no conflict of interest. The funders had no role in the design of the study; in the collection, analyses, or interpretation of data; in the writing of the manuscript; or in the decision to publish the results.

References

  1. Masson-Delmotte, V.; Zhai, P.; Pirani, A.; Connors, S.L.; Péan, C.; Berger, S.; Caud, N.; Chen, Y.; Goldfarb, L.; Gomis, M.I.; et al. Climate Change 2021: The Physical Science Basis. Contribution of Working Group I to the Sixth Assessment Report of the Intergovernmental Panel on Climate Change; Cambridge University Press: Cambridge, UK, 2021. [Google Scholar] [CrossRef]
  2. Cao, J. The Importance of Aerosols in the Earth System: Science and Engineering Perspectives. Aerosol Sci. Eng. 2017, 1, 1–6. [Google Scholar] [CrossRef]
  3. Díaz, J.; Linares, C.; Carmona, R.; Russo, A.; Ortiz, C.; Salvador, P.; Trigo, R.M. Saharan dust intrusions in Spain: Health impacts and associated synoptic conditions. Environ. Res. 2017, 156, 455–467. [Google Scholar] [CrossRef]
  4. Contini, D.; Lin, Y.-H.; Hänninen, O.; Viana, M. Contribution of Aerosol Sources to Health Impacts. Atmosphere 2021, 12, 730. [Google Scholar] [CrossRef]
  5. Al-Hemoud, A.; Al-Sudairawi, M.; Neelamanai, S.; Naseeb, A.; Behbehani, W. Socioeconomic effect of dust storms in Kuwait. Arab. J. Geosci. 2017, 10, 1–9. [Google Scholar] [CrossRef]
  6. Holben, B.N.; Eck, T.F.; Slutsker, I.; Tanré, D.; Buis, J.P.; Setzer, A.; Vermote, E.; Reagan, J.A.; Kaufman, Y.J.; Nakajima, T.; et al. AERONET—A Federated Instrument Network and Data Archive for Aerosol Characterization. Remote Sens. Environ. 1998, 66, 1–16. [Google Scholar] [CrossRef]
  7. Nakajima, T.; Yoon, S.-C.; Ramanathan, V.; Shi, G.-Y.; Takemura, T.; Higurashi, A.; Takamura, T.; Aoki, K.; Sohn, B.-J.; Kim, S.-W.; et al. Overview of the Atmospheric Brown Cloud East Asian Regional Experiment 2005 and a study of the aerosol direct radiative forcing in east Asia. J. Geophys. Res. Atmos. 2007, 112. [Google Scholar] [CrossRef]
  8. Kazadzis, S.; Kouremeti, N.; Nyeki, S.; Gröbner, J.; Wehrli, C. The World Optical Depth Research and Calibration Center (WORCC) quality assurance and quality control of GAW-PFR AOD measurements. Geosci. Instrum. Methods Data Syst. 2018, 7, 39–53. [Google Scholar] [CrossRef] [Green Version]
  9. Tu, Q.; Hao, Z.; Yan, Y.; Tao, B.; Chung, C.; Kim, S. Aerosol Optical Properties around the East China Seas Based on AERONET Measurements. Atmosphere 2021, 12, 642. [Google Scholar] [CrossRef]
  10. Yu, X.; Nichol, J.; Lee, K.H.; Li, J.; Wong, M.S. Analysis of Long-Term Aerosol Optical Properties Combining AERONET Sunphotometer and Satellite-Based Observations in Hong Kong. Remote Sens. 2022, 14, 5220. [Google Scholar] [CrossRef]
  11. Sun, X.; Fan, X.; Zhang, T.; Wang, Y.; Wang, Y.; Lyu, D.; Zheng, M. Tempo-Spatial Distributions and Transport Characteristics of Two Dust Events over Northern China in March 2021. Remote Sens. 2022, 14, 5967. [Google Scholar] [CrossRef]
  12. Dementeva, A.; Zhamsueva, G.; Zayakhanov, A.; Tcydypov, V. Interannual and Seasonal Variation of Optical and Microphysical Properties of Aerosol in the Baikal Region. Atmosphere 2022, 13, 211. [Google Scholar] [CrossRef]
  13. Carstea, E.; Fragkos, K.; Siomos, N.; Antonescu, B.; Belegante, L. Columnar aerosol measurements in a continental southeastern Europe site: Climatology and trends. Theor. Appl. Clim. 2019, 137, 3149–3159. [Google Scholar] [CrossRef]
  14. Evgenieva, T.; Gurdev, L.; Toncheva, E.; Dreischuh, T. Optical and Microphysical Properties of the Aerosol Field over Sofia, Bulgaria, Based on AERONET Sun-Photometer Measurements. Atmosphere 2022, 13, 884. [Google Scholar] [CrossRef]
  15. Raptis, I.-P.; Kazadzis, S.; Amiridis, V.; Gkikas, A.; Gerasopoulos, E.; Mihalopoulos, N. A Decade of Aerosol Optical Properties Measurements over Athens, Greece. Atmosphere 2020, 11, 154. [Google Scholar] [CrossRef] [Green Version]
  16. Voudouri, K.A.; Michailidis, K.; Siomos, N.; Chatzopoulou, A.; Kouvarakis, G.; Mihalopoulos, N.; Tzoumaka, P.; Kelessis, A.; Balis, D. Evaluation of Aerosol Typing with Combination of Remote Sensing Techniques with In Situ Data during the PANACEA Campaigns in Thessaloniki Station, Greece. Remote Sens. 2022, 14, 5076. [Google Scholar] [CrossRef]
  17. Markowicz, K.M.; Stachlewska, I.S.; Zawadzka-Manko, O.; Wang, D.; Kumala, W.; Chilinski, M.T.; Makuch, P.; Markuszewski, P.; Rozwadowska, A.K.; Petelski, T.; et al. A Decade of Poland-AOD Aerosol Research Network Observations. Atmosphere 2021, 12, 1583. [Google Scholar] [CrossRef]
  18. Damiano, R.; Sannino, A.; Amoruso, S.; Boselli, A. Aerosol Characterization with Long-Term AERONET Sun-Photometer Measurements in the Naples Mediterranean Area. Atmosphere 2022, 13, 2078. [Google Scholar] [CrossRef]
  19. Millet, T.; Bencherif, H.; Bounhir, A.; Bègue, N.; Lamy, K.; Ranaivombola, M.; Benkhaldoun, Z.; Portafaix, T.; Duflot, V. Aerosol Distributions and Transport over Southern Morocco from Ground-Based and Satellite Observations (2004–2020). Atmosphere 2022, 13, 923. [Google Scholar] [CrossRef]
  20. Țîmpu, S.; Sfîcă, L.; Dobri, R.-V.; Cazacu, M.-M.; Nita, A.-I.; Birsan, M.-V. Tropospheric Dust and Associated Atmospheric Circulations over the Mediterranean Region with Focus on Romania’s Territory. Atmosphere 2020, 11, 349. [Google Scholar] [CrossRef] [Green Version]
  21. Lyapustin, A.; Wang, Y.; Korkin, S.; Huang, D. MODIS Collection 6 MAIAC algorithm. Atmos. Meas. Tech. 2018, 11, 5741–5765. [Google Scholar] [CrossRef] [Green Version]
  22. Superczynski, S.D.; Kondragunta, S.; Lyapustin, A.I. Evaluation of the multi-angle implementation of atmospheric correction (MAIAC) aerosol algorithm through intercomparison with VIIRS aerosol products and AERONET. J. Geophys. Res. Atmos. 2017, 122, 3005–3022. [Google Scholar] [CrossRef] [Green Version]
  23. Jethva, H.; Torres, O.; Yoshida, Y. Accuracy assessment of MODIS land aerosol optical thickness algorithms using AERONET measurements over North America. Atmos. Meas. Tech. 2019, 12, 4291–4307. [Google Scholar] [CrossRef] [Green Version]
  24. Martins, V.S.; Lyapustin, A.; Carvalho, L.A.S.; Barbosa, C.C.F.; Novo, E.M.L.M. Validation of high-resolution MAIAC aerosol product over South America. J. Geophys. Res. Atmos. 2017, 122, 7537–7559. [Google Scholar] [CrossRef]
  25. Mhawish, A.; Banerjee, T.; Sorek-Hamer, M.; Lyapustin, A.; Broday, D.M.; Chatfield, R. Comparison and evaluation of MODIS Multi-angle Implementation of Atmospheric Correction (MAIAC) aerosol product over South Asia. Remote Sens. Environ. 2019, 224, 12–28. [Google Scholar] [CrossRef]
  26. Arvani, B.; Pierce, R.B.; Lyapustin, A.I.; Wang, Y.; Ghermandi, G.; Teggi, S. Seasonal monitoring and estimation of regional aerosol distribution over Po valley, northern Italy, using a high-resolution MAIAC product. Atmos. Environ. 2016, 141, 106–121. [Google Scholar] [CrossRef] [Green Version]
  27. Zhdanova, E.Y.; Chubarova, N.Y.; Lyapustin, A.I. Assessment of urban aerosol pollution over the Moscow megacity by the MAIAC aerosol product. Atmos. Meas. Tech. 2020, 13, 877–891. [Google Scholar] [CrossRef] [Green Version]
  28. Stafoggia, M.; Schwartz, J.; Badaloni, C.; Bellander, T.; Alessandrini, E.; Cattani, G.; Donato, F.D.; Gaeta, A.; Leone, G.; Lyapustin, A.; et al. Estimation of daily PM10 concentrations in Italy (2006–2012) using finely resolved satellite data, land use variables and meteorology. Environ. Int. 2017, 99, 234–244. [Google Scholar] [CrossRef] [PubMed]
  29. Lee, S.; Pinhas, A.; Alexandra, C.A. Aerosol pattern changes over the dead sea from west to east—Using high-resolution satellite data. Atmos. Environ. 2020, 243, 117737. [Google Scholar] [CrossRef]
  30. Emili, E.; Lyapustin, A.; Wang, Y.; Popp, C.; Korkin, S.; Zebisch, M.; Wunderle, S.; Petitta, M. High spatial resolution aerosol retrieval with MAIAC: Application to mountain regions. J. Geophys. Res. Atmos. 2011, 116. [Google Scholar] [CrossRef] [Green Version]
  31. Shaylor, M.; Brindley, H.; Sellar, A. An Evaluation of Two Decades of Aerosol Optical Depth Retrievals from MODIS over Australia. Remote Sens. 2022, 14, 2664. [Google Scholar] [CrossRef]
  32. Tao, M.; Wang, J.; Li, R.; Wang, L.; Wang, L.; Wang, Z.; Tao, J.; Che, H.; Chen, L. Performance of MODIS high-resolution MAIAC aerosol algorithm in China: Characterization and limitation. Atmos. Environ. 2019, 213, 159–169. [Google Scholar] [CrossRef]
  33. Zhang, Z.; Wu, W.; Fan, M.; Wei, J.; Tan, Y.; Wang, Q. Evaluation of MAIAC aerosol retrievals over China. Atmos. Environ. 2019, 202, 8–16. [Google Scholar] [CrossRef]
  34. Lee, H.J. Benefits of High Resolution PM2.5 Prediction using Satellite MAIAC AOD and Land Use Regression for Exposure Assessment: California Examples. Environ. Sci. Technol. 2019, 53, 12774–12783. [Google Scholar] [CrossRef] [PubMed]
  35. Just, A.C.; Wright, R.O.; Schwartz, J.; Coull, B.A.; Baccarelli, A.A.; Tellez-Rojo, M.M.; Moody, E.; Wang, Y.; Lyapustin, A.; Kloog, I. Using High-Resolution Satellite Aerosol Optical Depth To Estimate Daily PM2.5 Geographical Distribution in Mexico City. Environ. Sci. Technol. 2015, 49, 8576–8584. [Google Scholar] [CrossRef] [Green Version]
  36. Kloog, I.; Sorek-Hamer, M.; Lyapustin, A.; Coull, B.; Wang, Y.; Just, A.C.; Schwartz, J.; Broday, D.M. Estimating daily PM 2.5 and PM 10 across the complex geo-climate region of Israel using MAIAC satellite-based AOD data. Atmos. Environ. 2015, 122, 409–416. [Google Scholar] [CrossRef] [Green Version]
  37. Falah, S.; Mhawish, A.; Sorek-Hamer, M.; Lyapustin, A.I.; Kloog, I.; Banerjee, T.; Kizel, F.; Broday, D.M. Impact of environmental attributes on the uncertainty in MAIAC/MODIS AOD retrievals: A comparative analysis. Atmos. Environ. 2021, 262, 118659. [Google Scholar] [CrossRef]
  38. Qin, W.; Fang, H.; Wang, L.; Wei, J.; Zhang, M.; Su, X.; Bilal, M.; Liang, X. MODIS high-resolution MAIAC aerosol product: Global validation and analysis. Atmos. Environ. 2021, 264, 118684. [Google Scholar] [CrossRef]
  39. Ajtai, N.; Ștefănie, H.; Mereuță, A.; Radovici, A.; Botezan, C. Multi-Sensor Observation of a Saharan Dust Outbreak over Transylvania, Romania in April 2019. Atmosphere 2020, 11, 364. [Google Scholar] [CrossRef] [Green Version]
  40. Chereches, I.A.; Arion, I.D.; Muresan, I.C.; Gaspar, F. Study of the Effects of the COVID-19 Pandemic on Air Quality: A Case Study in Cluj-Napoca, Romania. Sustainability 2023, 15, 2549. [Google Scholar] [CrossRef]
  41. Environmental Protection Agency. Annual Reports on the State of the Environment in Cluj County. 2023. Available online: http://www.anpm.ro/web/apm-cluj/rapoarte-anuale1?fbclid=IwAR2tUl-tSkSEHc6CWmseFKBvBh1IftbmCqdI63KM6RuFzAb-2u2SpO993Ss (accessed on 20 May 2023).
  42. Bărcăcianu, F.; Istrate, V.; Bocancea, R.S. The influence of absolute thermal inversion on the relative humidity in the lower troposphere. Geogr. Tech. 2016, 11, 6–12. [Google Scholar] [CrossRef] [Green Version]
  43. Ajtai, N.; Stefanie, H.; Arghius, V.; Meltzer, M.; Costin, D. Characterization of aerosol optical and microphysical properties over north-western romania in correlation with predominant atmospheric circulation patterns. Int. Multidiscip. Sci. GeoConf. SGEM 2017, 17, 375–382. [Google Scholar] [CrossRef]
  44. Wang, Y.; Yang, L.; Xie, D.; Hu, Y.; Cao, D.; Huang, H.; Zhao, D. Investigation of Spatiotemporal Variation and Drivers of Aerosol Optical Depth in China from 2010 to 2020. Atmosphere 2023, 14, 477. [Google Scholar] [CrossRef]
  45. Romanian National Environmental Protection Agency. Average Annual Air Temperature at Cluj-Napoca Weather Station (2010–2019). 2023. Available online: http://www.anpm.ro/web/apm-cluj/rapoarte-anuale1 (accessed on 3 April 2023).
  46. Romanian National Meteorological Administration. Average Monthly air Temperature at Cluj-Napoca Weather Station (1961–2019). 2023. Available online: https://www.meteoromania.ro/clim/caracterizare-multianuala/index.html (accessed on 3 April 2023).
  47. Dubovik, O.; Holben, B.; Eck, T.F.; Smirnov, A.; Kaufman, Y.J.; King, M.D.; Tanré, D.; Slutsker, I. Variability of Absorption and Optical Properties of Key Aerosol Types Observed in Worldwide Locations. J. Atmos. Sci. 2002, 59, 590–608. [Google Scholar] [CrossRef]
  48. Hsu, N.C.; Jeong, M.-J.; Bettenhausen, C.; Sayer, A.M.; Hansell, R.; Seftor, C.S.; Huang, J.; Tsay, S.-C. Enhanced Deep Blue aerosol retrieval algorithm: The second generation. J. Geophys. Res. Atmos. 2013, 118, 9296–9315. [Google Scholar] [CrossRef]
  49. Levy, R.C.; Mattoo, S.; Munchak, L.A.; Remer, L.A.; Sayer, A.M.; Patadia, F.; Hsu, N.C. The Collection 6 MODIS aerosol products over land and ocean. Atmos. Meas. Tech. 2013, 6, 2989–3034. [Google Scholar] [CrossRef] [Green Version]
  50. Tanré, D.; Kaufman, Y.J.; Herman, M.; Mattoo, S. Remote sensing of aerosol properties over oceans using the MODIS/EOS spectral radiances. J. Geophys. Res. Atmos. 1997, 102, 16971–16988. [Google Scholar] [CrossRef]
  51. Hsu, N.C.; Tsay, S.-C.; King, M.D.; Herman, J.R. Aerosol Properties Over Bright-Reflecting Source Regions. IEEE Trans. Geosci. Remote Sens. 2004, 42, 557–569. [Google Scholar] [CrossRef]
  52. Remer, L.A.; Mattoo, S.; Levy, R.C.; Munchak, L.A. MODIS 3 km aerosol product: Algorithm and global perspective. Atmos. Meas. Tech. 2013, 6, 1829–1844. [Google Scholar] [CrossRef] [Green Version]
  53. Lyapustin, A.; Wang, Y.; Laszlo, I.; Kahn, R.; Korkin, S.; Remer, L.; Levy, R.; Reid, J.S. Multiangle implementation of atmospheric correction (MAIAC): Part 2. Aerosol algorithm. J. Geophys. Res. 2011, 116. [Google Scholar] [CrossRef]
  54. Cooper, M.J.; Martin, R.V.; Lyapustin, A.I.; McLinden, C.A. Assessing snow extent data sets over North America to inform and improve trace gas retrievals from solar backscatter. Atmos. Meas. Tech. 2018, 11, 2983–2994. [Google Scholar] [CrossRef] [Green Version]
  55. Giles, D.M.; Sinyuk, A.; Sorokin, M.G.; Schafer, J.S.; Smirnov, A.; Slutsker, I.; Eck, T.F.; Holben, B.N.; Lewis, J.R.; Campbell, J.R.; et al. Advancements in the Aerosol Robotic Network (AERONET) Version 3 database–automated near-real-time quality control algorithm with improved cloud screening for Sun photometer aerosol optical depth (AOD) measurements. Atmos. Meas. Tech. 2019, 12, 169–209. [Google Scholar] [CrossRef] [Green Version]
  56. Eck, T.F.; Holben, B.N.; Reid, J.S.; Dubovik, O.; Smirnov, A.; O’Neill, N.T.; Slutsker, I.; Kinne, S. Wavelength Dependence of the Optical Depth of Biomass Burning, Urban, and Desert Dust Aerosols. J. Geophys. Res. Atmos. 1999, 104, 31333–31349. [Google Scholar] [CrossRef]
  57. Ichoku, C.; Chu, D.A.; Mattoo, S.; Kaufman, Y.J.; Remer, L.A.; Tanré, D.; Slutsker, I.; Holben, B.N. A spatio-temporal approach for global validation and analysis of MODIS aerosol products. Geophys. Res. Lett. 2002, 29, 13206. [Google Scholar] [CrossRef] [Green Version]
  58. Wang, Y.; Wang, J.; Levy, R.C.; Xu, X.; Reid, J.S. MODIS Retrieval of Aerosol Optical Depth over Turbid Coastal Water. Remote Sens. 2017, 9, 595. [Google Scholar] [CrossRef] [PubMed] [Green Version]
  59. Sayer, A.M.; Govaerts, Y.; Kolmonen, P.; Lipponen, A.; Luffarelli, M.; Mielonen, T.; Patadia, F.; Popp, T.; Povey, A.C.; Stebel, K.; et al. A review and framework for the evaluation of pixel-level uncertainty estimates in satellite aerosol remote sensing. Atmos. Meas. Tech. 2020, 13, 373–404. [Google Scholar] [CrossRef] [Green Version]
  60. Sever, L.; Alpert, P.; Lyapustin, A.; Wang, Y.; Chudnovsky, A. An example of aerosol pattern variability over bright surface using high resolution MODIS MAIAC: The eastern and western areas of the Dead Sea and environs. Atmos. Environ. 2017, 165, 359–369. [Google Scholar] [CrossRef]
  61. Liu, N.; Zou, B.; Feng, H.; Wang, W.; Tang, Y.; Liang, Y. Evaluation and comparison of multiangle implementation of the atmospheric correction algorithm, Dark Target, and Deep Blue aerosol products over China. Atmos. Meas. Tech. 2019, 19, 8243–8268. [Google Scholar] [CrossRef] [Green Version]
  62. Meteoblue. Simulated Historical Climate & Weather Data for Cluj-Napoca. 2023. Available online: https://www.meteoblue.com/en/weather/historyclimate/climatemodelled/cluj-napoca_romania_681290 (accessed on 3 April 2023).
  63. Stefanie, H.; Radovici, A.; Mereuta, A.; Camarasan, H.; Ajtai, N. Detection of local and long-range transported aerosol intrusions over cluj-napoca, romania using multiwavelength lidar measurements in spring 2022. Int. Multidiscip. Sci. GeoConf. SGEM 2022, 22, 295–302. [Google Scholar] [CrossRef]
  64. Radovici, A.; Stefanie, H.I.; Ozunu, A.; Camarasan, H.; Ajtai, N. Analysis of a saharan dust intrusion over central and eastern europe, using ground-based remote sensing techniques. Int. Multidiscip. Sci. GeoConf. SGEM 2021, 21, 239–246. [Google Scholar] [CrossRef]
  65. Stefanie, H.; Ajtai, N.; Botezan, C.; Toanca, F.; Torok, Z.; Ozunu, A. Detection of a desert dust intrusion over Cluj-Napoca, Romania using an elastic backscatter LIDAR system. ECOTERRA J. Environ. Res. Prot. 2015, 12, 50–55. [Google Scholar]
  66. Nefedova, T. The 2010 Catastrophic Forest Fires in Russia: Consequence of Rural Depopulation? In The Demography of Disasters: Impacts for Population and Place; Karácsonyi, D., Taylor, A., Bird, D., Eds.; Springer International Publishing: Cham, Switzerland, 2021; pp. 71–79. [Google Scholar] [CrossRef]
  67. Ager, A.A.; Lasko, R.; Myroniuk, V.; Zibtsev, S.; Day, M.A.; Usenia, U.; Bogomolov, V.; Kovalets, I.; Evers, C.R. The wildfire problem in areas contaminated by the Chernobyl disaster. Sci. Total Environ. 2019, 696, 133954. [Google Scholar] [CrossRef]
  68. Lakyda, P.; Shvidenko, A.; Bilous, A.; Myroniuk, V.; Matsala, M.; Zibtsev, S.; Schepaschenko, D.; Holiaka, D.; Vasylyshyn, R.; Lakyda, I.; et al. Impact of Disturbances on the Carbon Cycle of Forest Ecosystems in Ukrainian Polissya. Forests 2019, 10, 337. [Google Scholar] [CrossRef] [Green Version]
  69. Bondur, V.G.; Mokhov, I.I.; Voronova, O.S.; Sitnov, S.A. Satellite Monitoring of Siberian Wildfires and Their Effects: Features of 2019 Anomalies and Trends of 20-Year Changes. Dokl. Earth Sci. 2020, 492, 370–375. [Google Scholar] [CrossRef]
  70. Nicolae, V.; Talianu, C.; Andrei, S.; Antonescu, B.; Ene, D.; Nicolae, D.; Dandocsi, A.; Toader, V.-E.; Ștefan, S.; Savu, T.; et al. Multiyear Typology of Long-Range Transported Aerosols over Europe. Atmosphere 2019, 10, 482. [Google Scholar] [CrossRef] [Green Version]
  71. Stefan, S.; Voinea, S.; Iorga, G. Study of the aerosol optical characteristics over the Romanian Black Sea Coast using AERONET data. Atmos. Pollut. Res. 2020, 11, 1165–1178. [Google Scholar] [CrossRef]
  72. Ozdemir, E.; Tuygun, G.T.; Elbir, T. Application of aerosol classification methods based on AERONET version 3 product over eastern Mediterranean and Black Sea. Atmos. Pollut. Res. 2020, 11, 2226–2243. [Google Scholar] [CrossRef]
  73. Osgouei, P.E.; Roberts, G.; Kaya, S.; Bilal, M.; Dash, J.; Sertel, E. Evaluation and comparison of MODIS and VIIRS aerosol optical depth (AOD) products over regions in the Eastern Mediterranean and the Black Sea. Atmos. Environ. 2022, 268, 118784. [Google Scholar] [CrossRef]
Figure 1. Site location of the AERONET measurements and the 5 km radius of MODIS collocation area.
Remotesensing 15 03072 g001
Figure 2. Average monthly temperature (bars) and relative humidity (orange line) (2010–2020).
Remotesensing 15 03072 g002
Figure 3. Seasonal variation of wind direction frequency and wind speed (m/s) against wind direction (%), 2010–2020, daytime conditions.
Remotesensing 15 03072 g003
Figure 4. Number of AERONET direct observations per month.
Remotesensing 15 03072 g004
Figure 5. Monthly variability of AOD at 500 nm.
Remotesensing 15 03072 g005
Figure 6. Monthly variability of angstrom exponent 440–870 nm.
Remotesensing 15 03072 g006
Figure 7. Monthly variability of Single Scattering Albedo (SSA) values at 440 nm with AERONET level 1.5.
Remotesensing 15 03072 g007
Figure 8. AOD at 440 nm against the angstrom exponent, classified according to Dubovik et al. [47] for the whole dataset (left). Pie chart of the classification for the whole dataset (right).
Remotesensing 15 03072 g008
Figure 9. Monthly distribution of observations for each aerosol class.
Remotesensing 15 03072 g009
Figure 10. Linear fit of MODIS MAIAC AOD and AERONET AOD at 550 nm (left); Distribution of normalized errors ΔN vs. MODIS MAIAC AOD values (right).
Remotesensing 15 03072 g010
Figure 11. Evaluation of MODIS MAIAC AOD uncertainty estimates for Cluj-Napoca, Romania. The upper row shows a CDF of the absolute normalized retrieval error |ΔN|, with the 68th (blue dash line) and 95th percentiles (red dash line) drawn as reference points. The lower row shows binned values of 1σ retrieval error vs. expected discrepancy (left) and 2σ retrieval error vs. twice the expected discrepancy (right); the 1:1 line is indicated as dashed in grey.
Remotesensing 15 03072 g011
Disclaimer/Publisher’s Note: The statements, opinions and data contained in all publications are solely those of the individual author(s) and contributor(s) and not of MDPI and/or the editor(s). MDPI and/or the editor(s) disclaim responsibility for any injury to people or property resulting from any ideas, methods, instructions or products referred to in the content.