
Remote Sensing Data for Digital Soil Mapping in French Research—A Review

 , ,
, ,  ,
,  , , , , ,
  , ,
, ,  and
and 
Abstract
1. Introduction
- Summarize the main soil properties and threats that have been studied on a large scale over the last decade using RS by the French research community;
- Synthesize the main recent methodological advances of DSM related to the use of RS products in France or elsewhere from French research;
- Highlight the complementarity of the new RS products and the other covariates currently used in DSM.
2. General Considerations on the Relative Permanence of Soil Properties
3. Developments Related to the Extraction of Soil Properties from Remote Sensing Data
3.1. Use of RS Data as a Substitute for Soil Properties’ Measurement
- −
- −
- −
- −
- −
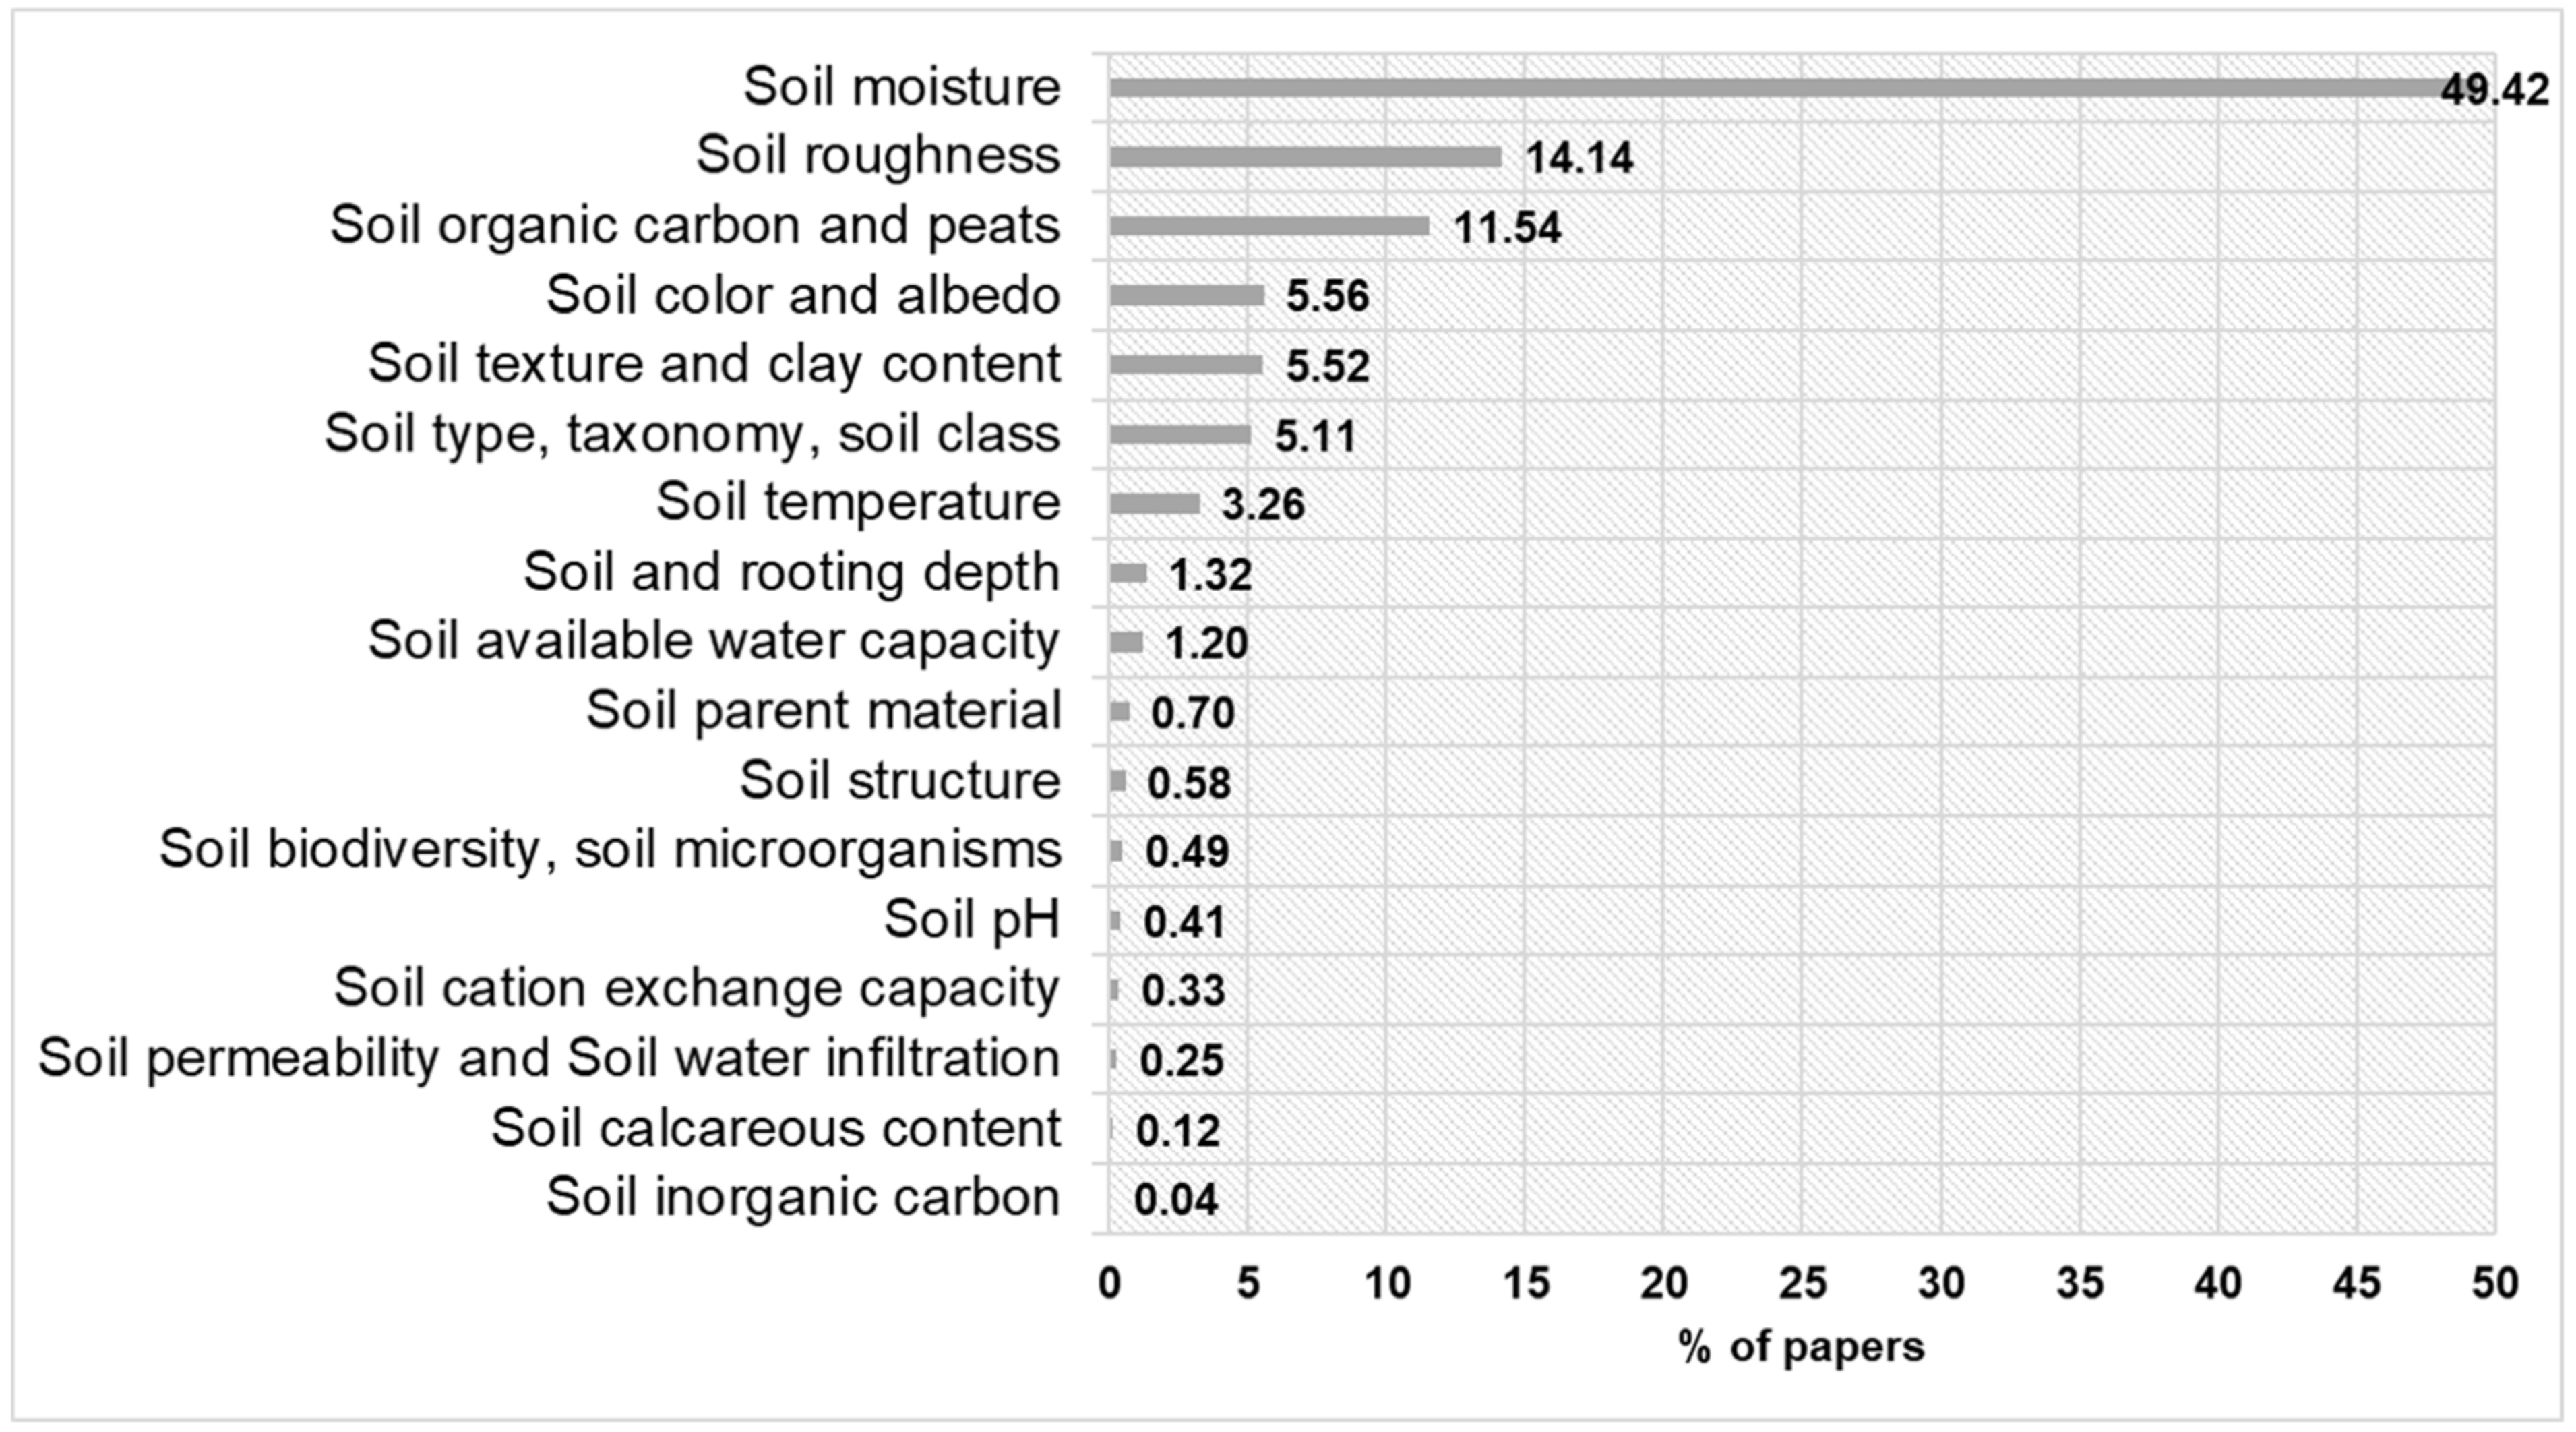
3.2. Most Studied Soil Properties in French Remote Sensing Research
3.3. Trends in French Remote Sensing Research in Relation to Threats to Soil
3.4. Remote Sensing of Soil Properties as Training Data for Digital Soil Mapping
4. Incorporating RS as Covariates in DSM
4.1. Soil Property Maps Using Remote Sensing on Bare Soils as Covariates in DSM
4.2. Remote Sensing Data as Proxies of Soil Properties Controlling Factors in the SCORPAN DSM Model
4.2.1. Climate
4.2.2. Land-Cover and Vegetation Characteristics
4.2.3. Relief, Topography, and Landforms
4.2.4. Parent Material
4.2.5. Age
4.2.6. Soil Management Practices
- Crop succession (i.e., the sequence of crops or fallows in consecutive years at the field scale);
- Cropping patterns (e.g., temporal sequence and spatial arrangement of crop, fallows, and landscape features in a particular land area);
- Cropping techniques (e.g., irrigation, organic amendment, crop residue management, tillage, harvesting, duration of bare soil, grazing of moving cattle feed, and implemented on a piece of land).
5. Use of Remote Sensing to Design the Sampling Strategy for DSM
6. Limitations and Challenges
6.1. Using RS Products to Predict Soil Properties
- How do we discriminate bare soil from vegetated soil, e.g., what NDVI threshold should we use? Which unmixing method should we use for partly vegetated pixels?
- How do we distinguish bare soil from soil covered with dead vegetation residues? Additionally, what threshold should we use?
- How do we take into account the complex effects of different soil properties at a given time/location (e.g., vegetation, residues, moisture, roughness, SOC, and clay or lime content)?
- How do we extend the coverage of bare soils? Mosaicking is now well developed, but what time period should we take? What are the limitations related to mosaicking? How can we take into account the fact that different dates are usually associated with different situational conditions (e.g., moisture and roughness)?
- In many cropped regions, more and more soil will no longer be bare due to the implementation of cover crops and/or seeding under a vegetative cover.
- How do we take advantage of various RS products and sensors, depending on their resolution (in space, time, and spectral domain), remoteness and related perturbing factors?
- At the field or farm-scale, responding to these questions may imply using several RS sensors. For example, using UAV RS enables the selection of the most adapted dates to obtain bare soil imagery together with minimizing the perturbing factors of soil spectral data. This is, however, not feasible for broad-scale monitoring. The effect of some perturbing factors may also be studied using airborne imagery. Thus, studies comparing laboratory spectra, proximal sensing, UAV, or airborne data to satellite imagery, should be conducted in order to estimate/reduce the errors due to changes in spectral resolution/remoteness and to improve the criteria for selecting the relevant satellites data (e.g., [324,325,326]).
6.2. Most RS Products Only Capture Topsoil Information
6.3. Relative Permanence of Soil Properties and Revisit Time for Soil Monitoring
7. Main Progresses, Perspectives, and Prospects
7.1. The Increasing Availability of Remote Sensors and of Their Spatial, Spectral, and Temporal Resolution over Time
7.2. The Increasing Importance of RS Data in DSM
- The use of RS products as surrogates for in situ measurements.
- The incorporation of RS products as covariates for DSM.
7.2.1. Use of RS Products as Surrogates for In Situ Measurements
7.2.2. Incorporation of RS Products as Covariates in DSM
Author Contributions
Funding
Data Availability Statement
Acknowledgments
Conflicts of Interest
Abbreviations
| AVIRIS | Airborne Visible/Infrared Imaging Spectrometer |
| AWC | Available Water Capacity |
| CES | Scientific Expertise Center |
| CHIME | Copernicus Hyperspectral Imaging Mission for the Environment |
| CLAPAS | CLAssement des PAysages et Segmentation |
| cLHS | conditionnal Latin Hypercube Sampling |
| CNES | Centre National d’Etudes Spatiales (French Space Agency) |
| CNS | Cartographie Numérique des Sols (=DSM) |
| COP21 | 21st Conference Of the Parties of UN Climate Change Conferences |
| DEM | Digital Elevation Model |
| DSA | Digital Soil Assessment |
| DSM | Digital Soil Mapping |
| EnMAP | Environmental Mapping and Analysis Program |
| ESA | European Space Agency |
| ETM+ | Enhanced Thematic Mapper Plus |
| EU | European Union |
| GSD | Ground Sampling Distance |
| HISUI | Hyperspectral Imager SUIte |
| INRAE | Institut national de recherche pour l’agriculture, l’alimentation et l’environnement (France) |
| IPCC | Intergovernmental Panel on Climate Change |
| L-MEB | L-band Microwave Emission of the Biosphere |
| LST | Land Surface Temperature |
| MIR | Middle Infrared |
| MIRS | Middle Infrared Spectroscopy |
| MODIS | Moderate Resolution Imaging Spectroradiometer |
| MW | MicroWave |
| NDVI | Normalized Difference Vegetation Index |
| NIR | Near Infra-Red |
| PLSR | Partial Least Squares Regression |
| PRISMA | PRecursore IperSpettrale della Missione Applicativa |
| PTF | PedoTransfer Function |
| RMSH | Root Mean Surface Height |
| RS | Remote Sensing |
| RZSM | Root Zone Soil Moisture |
| SAR | Synthetic Aperture Radar |
| SHALOM | Spaceborne Hyperspectral Applicative Land and Ocean Mission |
| SM | Soil Moisture |
| SMOS | Soil Moisture and Ocean Salinity |
| SOC | Soil Organic Carbon |
| SOM | Soil Organic Matter |
| SPOT | Système Probatoire d’Observation de la Terre/Satellite Pour l’Observation de la Terre |
| SRTM | Shuttle Radar Topographic Mission |
| TIR | Thermal Infra-Red |
| TSAVI | Transformed Soil-Adjusted Vegetation Index |
| UAV | Unmanned Aerial Vehicle |
| UN | United Nations |
| USGS | United States Geological Survey |
| Vis-NIR | Visible and Near Infra-Red |
| VOD | Vegetation Optical Depth |
References
- McBratney, A.; Field, D.J.; Koch, A. The Dimensions of Soil Security. Geoderma 2014, 213, 203–213. [Google Scholar] [CrossRef]
- Amundson, R.; Berhe, A.A.; Hopmans, J.W.; Olson, C.; Sztein, A.E.; Sparks, D.L. Soil and Human Security in the 21st Century. Science 2015, 348, 1261071. [Google Scholar] [CrossRef] [PubMed]
- FAO-ITPS. Status of the World’s Soil Resources (SWSR). Main Report. Technical Panel on Soils; Food and Agriculture Organization of the United Nations and Intergovernmental: Rome, Italy, 2015; p. 94. [Google Scholar]
- Montanarella, L.; Pennock, D.J.; McKenzie, N.; Badraoui, M.; Chude, V.; Baptista, I.; Mamo, T.; Yemefack, M.; Singh Aulakh, M.; Yagi, K.; et al. World’s Soils Are under Threat. SOIL 2016, 2, 79–82. [Google Scholar] [CrossRef]
- Bouma, J.; Montanarella, L. Facing Policy Challenges with Inter- and Transdisciplinary Soil Research Focused on the UN Sustainable Development Goals. SOIL 2016, 2, 135–145. [Google Scholar] [CrossRef]
- Keesstra, S.D.; Bouma, J.; Wallinga, J.; Tittonell, P.; Smith, P.; Cerdà, A.; Montanarella, L.; Quinton, J.N.; Pachepsky, Y.; van der Putten, W.H.; et al. The Significance of Soils and Soil Science towards Realization of the United Nations Sustainable Development Goals. SOIL 2016, 2, 111–128. [Google Scholar] [CrossRef]
- Bouma, J. How to Communicate Soil Expertise More Effectively in the Information Age When Aiming at the UN Sustainable Development Goals. Soil Use Manag. 2019, 35, 32–38. [Google Scholar] [CrossRef]
- Bonfante, A.; Basile, A.; Bouma, J. Targeting the Soil Quality and Soil Health Concepts When Aiming for the United Nations Sustainable Development Goals and the EU Green Deal. SOIL 2020, 6, 453–466. [Google Scholar] [CrossRef]
- Panagos, P.; Montanarella, L. Soil Thematic Strategy: An Important Contribution to Policy Support, Research, Data Development and Raising the Awareness. Curr. Opin. Environ. Sci. Health 2018, 5, 38–41. [Google Scholar] [CrossRef]
- European Commission. EU Soil Strategy for 2030, Section 3.2.2. 2022. Available online: https://eur-lex.europa.eu/legal-content/EN/TXT/?uri=CELEX%3A52021DC0699 (accessed on 29 May 2023).
- McBratney, A.B.; Mendonça Santos, M.L.; Minasny, B. On Digital Soil Mapping. Geoderma 2003, 117, 3–52. [Google Scholar] [CrossRef]
- Minasny, B.; McBratney, A.B. Digital Soil Mapping: A Brief History and Some Lessons. Geoderma 2016, 264, 301–311. [Google Scholar] [CrossRef]
- Arrouays, D.; Lagacherie, P.; Hartemink, A.E. Digital Soil Mapping across the Globe. Geoderma Reg. 2017, 9, 1–4. [Google Scholar] [CrossRef]
- Lagacherie, P.; McBratney, A.B.; Voltz, M. (Eds.) Digital Soil Mapping: An Introductory Perspective, 1st ed.; Developments in Soil Science; Elsevier: Amsterdam, The Netherlands, 2006; ISBN 978-0-444-52958-9. [Google Scholar]
- Jenny, H. Factors of Soil Formation: A System of Quantitative Pedology; McGraw-Hill: New York, NY, USA, 1941; ISBN 978-0-486-68128-3. [Google Scholar]
- Grunwald, S. Multi-Criteria Characterization of Recent Digital Soil Mapping and Modeling Approaches. Geoderma 2009, 152, 195–207. [Google Scholar] [CrossRef]
- Minasny, B.; McBratney, A.B. Methodologies for Global Soil Mapping. In Digital Soil Mapping. Bridging Research, Environmental Application and Operation; Boettinger, J.L., Howell, D.W., Moore, A.C., Hartemink, A.E., Kienast-Brown, S., Eds.; Springer: Dordrecht, The Netherlands, 2010. [Google Scholar]
- Zhang, G.; Liu, F.; Song, X. Recent Progress and Future Prospect of Digital Soil Mapping: A Review. J. Integr. Agric. 2017, 16, 2871–2885. [Google Scholar] [CrossRef]
- Wadoux, A.M.J.-C.; Minasny, B.; McBratney, A.B. Machine Learning for Digital Soil Mapping: Applications, Challenges and Suggested Solutions. Earth-Sci. Rev. 2020, 210, 103359. [Google Scholar] [CrossRef]
- Arrouays, D.; McBratney, A.; Bouma, J.; Libohova, Z.; Richer-de-Forges, A.C.; Morgan, C.L.S.; Roudier, P.; Poggio, L.; Mulder, V.L. Impressions of Digital Soil Maps: The Good, the Not so Good, and Making Them Ever Better. Geoderma Reg. 2020, 20, e00255. [Google Scholar] [CrossRef]
- Chen, S.; Arrouays, D.; Leatitia Mulder, V.; Poggio, L.; Minasny, B.; Roudier, P.; Libohova, Z.; Lagacherie, P.; Shi, Z.; Hannam, J.; et al. Digital Mapping of GlobalSoilMap Soil Properties at a Broad Scale: A Review. Geoderma 2022, 409, 115567. [Google Scholar] [CrossRef]
- Dvorakova, K.; Heiden, U.; Pepers, K.; Staats, G.; van Os, G.; van Wesemael, B. Improving Soil Organic Carbon Predictions from a Sentinel–2 Soil Composite by Assessing Surface Conditions and Uncertainties. Geoderma 2023, 429, 116128. [Google Scholar] [CrossRef]
- Zhang, C.; Valente, J.; Kooistra, L.; Guo, L.; Wang, W. Orchard Management with Small Unmanned Aerial Vehicles: A Survey of Sensing and Analysis Approaches. Precis. Agric. 2021, 22, 2007–2052. [Google Scholar] [CrossRef]
- Ustin, S.L.; Middleton, E.M. Current and Near-Term Advances in Earth Observation for Ecological Applications. Ecol. Process. 2021, 10, 1. [Google Scholar] [CrossRef]
- Heiden, U.; d’Angelo, P.; Schwind, P.; Karlshöfer, P.; Müller, R.; Zepp, S.; Wiesmeier, M.; Reinartz, P. Soil Reflectance Composites—Improved Thresholding and Performance Evaluation. Remote Sens. 2022, 14, 4526. [Google Scholar] [CrossRef]
- Segalen, P. L’interprétation Des Photographies Aériennes En Vue de La Cartographie Pédologique; IRCAM: Yaoundé, Cameroon, 1961; p. 20. [Google Scholar]
- Maignien, R. La Photo-Interprétation En Pédologie. Cah. ORSTOM 1963, 3, 8–16. [Google Scholar]
- Dupuis, P.; Callot, M. De l’utilisation de La Photographie Aérienne En Cartographie Pédologique. Bull. A.F.E.S. Paris 1965, 12, 424–446. [Google Scholar]
- Pouquet, J. Les Sciences de La Terre à l’heure Des Satellites; Presses Universitaires de France: Paris, France, 1971. [Google Scholar]
- Verger, F. L’observation de la terre par les satellites, Presses universitaires de France, coll. «Que sais-je?», n 1989, 128 p. Géographie Phys. Quat. 1982, 36, 128. [Google Scholar] [CrossRef]
- Girard, M.C.; Girard, C.M. Applications de La Télédétection à l’étude de La Biosphère; Masson: Paris, France, 1974. [Google Scholar]
- Girard, M.C.; Girard, C.M. Télédétection Appliquée: Zones Tempérées et Intertropicales; Collection Sciences Agronomiques; Masson: Paris, France, 1989; ISBN 978-2-225-81202-6. [Google Scholar]
- Girard, M.C.; Girard, C.M. Processing of Remote Sensing Data; Oxford & IBH Publishing, Co.: New Delhi, India, 2003. [Google Scholar]
- Scanvic, J.-Y. Utilisation de La Télédétection Dans Les Sciences de La Terre; Manuels et Méthodes; BRGM: Orléans, France, 1983; ISBN 978-2-7159-0021-9. [Google Scholar]
- Cervelle, B.; Malézieux, J.-M.; Caye, R. Expression quantitative de la couleur, liée à la réflectance diffuse, de quelques roches et minéraux. Bull. Société Française Minéralogie Cristallogr. 1977, 100, 185–191. [Google Scholar] [CrossRef]
- Cervelle, B.; Lévy, C.; Henry, N.-F.-M.; Shadlun, T.N. Développement récents dans la mesure au microscope des réflectances spectrales des minéraux opaques. Bull. Minéralogie 1978, 101, 234–244. [Google Scholar] [CrossRef]
- Ducasse, E.; Adeline, K.; Briottet, X.; Hohmann, A.; Bourguignon, A.; Grandjean, G. Montmorillonite Estimation in Clay-Quartz-Calcite Samples from Laboratory SWIR Imaging Spectroscopy: A Comparative Study of Spectral Preprocessings and Unmixing Methods. Remote Sens. 2020, 12, 1723. [Google Scholar] [CrossRef]
- de Cailleux, A. Mesure simple de l’albédo en géographie. Ann. Géographie 1974, 83, 569–585. [Google Scholar] [CrossRef]
- Girard, M.-C. Emploi de La Télédétection Pour l’étude de l’humidité Des Sols. Houille Blanche 1978, 64, 533–539. [Google Scholar] [CrossRef]
- Courault, D. A Study on the Degradation of the Land Surface by Remote Sensing. Spectral, Spatial and Temporal Analysis. Ph.D. Thesis, University of Paris, Paris, France, 1989. [Google Scholar]
- Mougenot, B. Effets Des Sels Sur La Réflectance et Télédétection Des Sols Salés. Cah. ORSTOM 1993, 28, 45–54. [Google Scholar]
- Chanzy, A. Basic Soil Surface Characteristics Derived from Active Microwave Remote Sensing. Remote Sens. Rev. 1993, 7, 303–319. [Google Scholar] [CrossRef]
- Lagacherie, P.; Baret, F.; Feret, J.; Netto, J.; Robbez-Masson, J. Estimation of Soil Clay and Calcium Carbonate Using Laboratory, Field and Airborne Hyperspectral Measurements. Remote Sens. Environ. 2008, 112, 825–835. [Google Scholar] [CrossRef]
- Liu, W.; Baret, F.; Gu, X.; Zhang, B.; Tong, Q.; Zheng, L. Evaluation of Methods for Soil Surface Moisture Estimation from Reflectance Data. Int. J. Remote Sens. 2003, 24, 2069–2083. [Google Scholar] [CrossRef]
- Liu, W.; Baret, F.; Gu, X.; Tong, Q.; Zheng, L.; Zhang, B. Relating Soil Surface Moisture to Reflectance. Remote Sens. Environ. 2002, 81, 238–246. [Google Scholar]
- Escadafal, R.; Girard, M.-C.; Courault, D. Modelling the Relationships between Munsell Soil Color and Soil Spectral Properties. Int. Agrophysics 1988, 4, 249–261. [Google Scholar]
- Wassenaar, T.; Andrieux, P.; Baret, F.; Robbez-Masson, J. Soil Surface Infiltration Capacity Classification Based on the Bi-Directional Reflectance Distribution Function Sampled by Aerial Photographs. The Case of Vineyards in a Mediterranean Area. CATENA 2005, 62, 94–110. [Google Scholar] [CrossRef]
- Mougenot, B.; Pouget, M.; Epema, G.F. Remote Sensing of Salt Affected Soils. Remote Sens. Rev. 1993, 7, 241–259. [Google Scholar] [CrossRef]
- Escadafal, R. Remote Sensing of Arid Soil Surface Color with Landsat Thematic Mapper. Adv. Space Res. 1989, 9, 159–163. [Google Scholar] [CrossRef]
- Escadafal, R.; Huete, A. Etude des propriétés spectrales des sols arides appliquée à l’amélioration des indices de végétation obtenus par télédétection. Comptes Rendus L’académie Sci. 1991, 312, 1385–1391. [Google Scholar]
- Mathieu, R.; Pouget, M.; Cervelle, B.; Escadafal, R. Relationships between Satellite-Based Radiometric Indices Simulated Using Laboratory Reflectance Data and Typic Soil Color of an Arid Environment. Remote Sens. Environ. 1998, 66, 17–28. [Google Scholar] [CrossRef]
- Baret, F.; Guyot, G. Potentials and Limits of Vegetation Indexes for LAI and APAR Assessment. Remote Sens. Environ. 1991, 35, 161–173. [Google Scholar] [CrossRef]
- Baret, F.; Jacquemoud, S.; Hanocq, J.F. About the Soil Line Concept in Remote Sensing. Adv. Space Res. 1993, 13, 281–284. [Google Scholar] [CrossRef]
- Cierniewski, J.; Baret, F.; Verbrugghe, M.; Hanocq, J.; Jacquemoud, S. Geometrical Modelling of Soil Bidirectional Reflectance Incorporating Specular Effects. Int. J. Remote Sens. 1996, 17, 3691–3704. [Google Scholar] [CrossRef]
- Cierniewski, J.; Verbrugghe, M. Influence of Soil Surface Roughness on Soil Bidirectional Reflectance. Int. J. Remote Sens. 1997, 18, 1277–1288. [Google Scholar] [CrossRef]
- Jacquemoud, S.; Baret, F.; Hanocq, J.F. Modeling Spectral and Bidirectional Soil Reflectance. Remote Sens. Environ. 1992, 41, 123–132. [Google Scholar] [CrossRef]
- Bablet, A.; Vu, P.; Jacquemoud, S.; Viallefont-Robinet, F.; Fabre, S.; Briottet, X.; Sadeghi, M.; Whiting, M.; Baret, F.; Tian, J. MARMIT: A Multilayer Radiative Transfer Model of Soil Reflectance to Estimate Surface Soil Moisture Content in the Solar Domain (400–2500 nm). Remote Sens. Environ. 2018, 217, 1–17. [Google Scholar] [CrossRef]
- Dupiau, A.; Jacquemoud, S.; Briottet, X.; Fabre, S.; Viallefont-Robinet, F.; Philpot, W.; Di Biagio, C.; Hebert, M.; Formenti, P. MARMIT-2: An Improved Version of the MARMIT Model to Predict Soil Reflectance as a Function of Surface Water Content in the Solar Domain. Remote Sens. Environ. 2022, 272, 112951. [Google Scholar] [CrossRef]
- Lesaignoux, A.; Fabre, S.; Briottet, X.; Olioso, A. Soil Moisture Impact on Lab Measured Reflectance of Bare Soils in the Optical Domain [0.4–15 μM]. In Proceedings of the 2009 IEEE International Geoscience and Remote Sensing Symposium, Cape Town, South Africa, 12–17 July 2009; p. 1824. [Google Scholar]
- Verbrugghe, M.; Cierniewski, J. Influence and Modelling of View Angles and Microrelief on Surface Temperature Measurements of Bare Agricultural Soils. ISPRS J. Photogramm. Remote Sens. 1998, 53, 166–173. [Google Scholar] [CrossRef]
- Girard, M.C. Apport de l’interprétation Visuelle Des Images Satellitaires Pour l’analyse Spatiale Des Sols. Un Exemple Dans La Région de Lodève. Etude Gest. Sols 1995, 2, 7–24. [Google Scholar]
- Girard, M.-C.; Rogala, J.-P. Analyse de l’environnement par traitement informatique des données Landsat. Un exemple: L’humidité des sols. Intern. Arch. Photogram. 1980, XXIII, 335–344. [Google Scholar]
- Escadafal, R.; Mtimet, A. Apport de La Télédétection Spatiale à La Cartographie Des Sols de La Région de Médénine (Sud-Tunisien); Etudes Spéciales—Division des Sols; Direction des Sols, DRES: Tunis, Tunisia, 1981; p. 40. [Google Scholar]
- Arrouays, D.; Guyon, D.; Riom, J. Différenciation Par l’humidité et La Matière Organique de Deux Sols Sableux à Partir de Données Radiométriques et Photographiques. Colloq. INRA 1984, 23, 81–89. [Google Scholar]
- King, C. Etude Des Sols et Des Formations Superficielles Par Télédétection: Approche de Leurs Caractéristiques Spectrales Spatiales et Temporelles Dans Le Visible et Le Proche Infra-Rouge. Ph.D. Thesis, INA-PG, Paris, France, 1985. [Google Scholar]
- Dosso, M. Analyse Structurale d’une Unité de Modelé Latéritique Comme Référence Pour La Recherche d’informations Pédologiques d’ordre Structural Contenues Dans Les Images de Télédétection Correspondantes; ORSTOM: Douala, Cameroun, 1986; pp. 211–220. [Google Scholar]
- Dosso, M.; Seyler, F.; Bocquier, G.; Ruellan, A. Analysis of Soil Organization; Regional Mapping Using Remote Sensing; Examples in Brittany (France) and French Guiana. XII AISS Congress; Hamburg, Germany, 13–20 August 1986; pp. 1099–1100. [Google Scholar]
- Arrouays, D. Un Exemple D’utilisation de La Télédétection Pour La Réalisation D’une Carte Des Sols à Moyenne Échelle. In Proceedings of the Actes du Séminaire INRA Projet Télédétection, Monetier-les-Bains, Hautes-Alpes, France, 12–16 January 1987; pp. 275–280. [Google Scholar]
- Courault, D.; Girard, M.C. Analyse Des Hétérogénéités Intraparcellaires Des Sols Par Télédétection. Sci. Sol. 1988, 26, 1–12. [Google Scholar]
- El-Hady, A.M.A.; Rognon, P.; Escadafal, R.; Pouget, M. Contribution of Landsat Data (MSS) to Soil Survey: Application to the Soil of Southwestern Sinai (Egypt). Int. J. Remote Sens. 1991, 12, 1053–1061. [Google Scholar] [CrossRef]
- Rudant, J.P.; Derotn, J.P.; Polidori, L. Multi-Resolution Analysis of Radar Images and Its Application to Lithological and Structural Mapping; Larzac (Southern France) Test Site. Int. J. Remote Sens. 1994, 15, 2451–2468. [Google Scholar] [CrossRef]
- Vaudour, E.; Girard, M.-C.; Bremond, L.-M.; Lurton, L. Spatial terroir characterization and grape composition in the Southern Côtes-du-Rhône vineyard (Nyons-Valreas Basin). OENO One 1998, 32, 169. [Google Scholar] [CrossRef]
- Kouame, J.L.; Classeau, N.; Rudant, J.-P.; Trebossen, H. Evaluation of the Potential of Radar ENVISAT Data for the Updating of Numerical Thematic Maps on the Coastal Fringe of French Guyana. In Proceedings of the IGARSS 2003, IEEE International Geoscience and Remote Sensing Symposium, Toulouse, France, 21–25 July 2003; pp. 3718–3720. [Google Scholar]
- Vaudour, E. Les Terroirs Viticoles: Définitions, Caractérisation et Protection; Dunod: Paris, France, 2003; ISBN 978-2-10-006454-0. [Google Scholar]
- Vaudour, E. Remote Sensing of Red Mediterranean Soils: A Case Study in the Viticultural Southern Rhone Valley Using SPOT Satellite Imagery. Geocarto Int. 2008, 23, 197–216. [Google Scholar] [CrossRef]
- Bou Kheir, R.; Girard, M.; Khawlie, M. Use of the OASIS structural classification system for mapping the landscape unites in a representative region of Lebanon. Can. J. Remote Sens. 2004, 30, 617–630. [Google Scholar] [CrossRef]
- Vaudour, E.; Carey, V.A.; Gilliot, J.M. Digital Zoning of South African Viticultural Terroirs Using Bootstrapped Decision Trees on Morphometric Data and Multitemporal SPOT Images. Remote Sens. Environ. 2010, 114, 2940–2950. [Google Scholar] [CrossRef]
- Lesaignoux, A.; Fabre, S.; Briottet, X. Influence of Soil Moisture Content on Spectral Reflectance of Bare Soils in the 0.4-14 Mu m Domain. Int. J. Remote Sens. 2013, 34, 2268–2285. [Google Scholar] [CrossRef]
- Fabre, S.; Briottet, X.; Lesaignoux, A. Estimation of Soil Moisture Content from the Spectral Reflectance of Bare Soils in the 0.4–2.5 Μm Domain. Sensors 2015, 15, 3262–3281. [Google Scholar] [CrossRef]
- Escadafal, R.; Girard, M.-C.; Courault, D. Munsell Soil Color and Soil Reflectance in the Visible Spectral Bands of Landsat MSS and TM Data. Remote Sens. Environ. 1989, 27, 37–46. [Google Scholar] [CrossRef]
- Bernard, R.; Martin, P.; Thony, J.-L.; Vauclin, M.; Vidal-Madjar, D. C-Band Radar for Determining Surface Soil Moisture. Remote Sens. Environ. 1982, 12, 189–200. [Google Scholar] [CrossRef]
- Brun, C.; Vidal-Madjar, D.; Gascuel-Odoux, C.; Merot, P.; Duchesne, J.; Nicolas, H. Locating Saturated Areas over a Watershed by Using Helicopter-Borne C-Band Scatterometer. Water Resour. Res. 1987, 26, 945–955. [Google Scholar]
- Muller, E.; Decamps, H. Modeling Soil Moisture-Reflectance. Remote Sens. Environ. 2001, 76, 173–180. [Google Scholar] [CrossRef]
- Pellarin, T.; Wigneron, J.; Calvet, J.; Berger, M.; Douville, H.; Ferrazzoli, P.; Kerr, Y.; Lopez-Baeza, E.; Pulliainen, J.; Simmonds, L.; et al. Two-Year Global Simulation of L-Band Brightness Temperatures over Land. IEEE Trans. Geosci. Remote Sens. 2003, 41, 2135–2139. [Google Scholar] [CrossRef]
- Parde, M.; Wigneron, J.-P.; Chanzy, A.; Waldteufel, P.; Schmidl, S.; Skou, N. Soil Moisture Retrieval from L-Band Measurements over a Variety of Agricultural Crops. In Proceedings of the IGARSS 2003, IEEE International Geoscience and Remote Sensing Symposium, Toulouse, France, 21–25 July 2003; pp. 914–916. [Google Scholar]
- El Hajj, M.; Baghdadi, N.; Zribi, M.; Bazzi, H. Synergic Use of Sentinel-1 and Sentinel-2 Images for Operational Soil Moisture Mapping at High Spatial Resolution over Agricultural Areas. Remote Sens. 2017, 9, 1292. [Google Scholar] [CrossRef]
- Boissard, P.; Pointel, J.-G.; Renaux, B.; Begon, J.-C. Zonage et Quantification de La Stabilité Structurale de Sols Cultivés Basés Sur Des Données Du Satellite Landsat-TM, Application Au Cas d’une Parcelle d’orge En Beauce. Comptes Rendus L’académie Sci. Paris Série II Pédologie 1989, 309, 145–152. [Google Scholar]
- de Jong, S.M. Derivation of Vegetative Variables from a Landsat Tm Image for Modelling Soil Erosion. Earth Surf. Process. Landf. 1994, 19, 165–178. [Google Scholar] [CrossRef]
- Arrouays, D.; King, C.; Vion, I.; Le Bissonnais, Y. Detection of Soil Crusting Risks Related to Low Soil Organic Carbon Contents by Using Discriminant Analysis on Thematic Mapper Data. Geocarto Int. 1996, 11, 11–16. [Google Scholar] [CrossRef]
- Biard, F.; Baret, F. CRIM: Crop Residue Index to Monitor Erosion. In Proceedings of the Seventh International Symposium on Physical Measurements and Signatures in Remote Sensing, Courchevel, France, 7–11 April 1997; Guyot, G., Phulpin, T., Eds.; Routledge & CRC Press Balkema: Rotterdam, The Netherlands; Volume 2, pp. 421–429.
- de Jong, S.M.; Paracchini, M.L.; Bertolo, F.; Folving, S.; Megier, J.; de Roo, A.P.J. Regional Assessment of Soil Erosion Using the Distributed Model SEMMED and Remotely Sensed Data. CATENA 1999, 37, 291–308. [Google Scholar] [CrossRef]
- Baghdadi, N.; King, C.; Bourguignon, A.; Remond, A. Potential of ERS and RADARSAT Data for Surface Roughness Monitoring over Bare Agricultural Fields Affected by Excessive Runoff. In Proceedings of the IGARSS 2000, IEEE 2000 International Geoscience and Remote Sensing Symposium, Taking the Pulse of the Planet: The Role of Remote Sensing in Managing the Environment, Honolulu, HI, USA, 24–28 July 2000; pp. 1907–1909. [Google Scholar]
- Baghdadi, N.; King, C.; Bourguignon, A.; Remond, A. Potential of ERS and Radarsat Data for Surface Roughness Monitoring over Bare Agricultural Fields: Application to Catchments in Northern France. Int. J. Remote Sens. 2002, 23, 3427–3442. [Google Scholar] [CrossRef]
- Coulombe-Simoneau, J.; Hardy, S.; Baghdadi, N.; King, C.; Bonn, F.; Le Bissonnais, Y. Radarsat Based Monitoring of Soil Roughness over an Agricultural Area Affected by Excessive Runoff. In Proceedings of the International Symposium on Remote Sensing and Hydrology 2000, Santa Fé, NM, USA, 2–8 April 2000; pp. 362–364. [Google Scholar]
- Gay, M.; Cheret, V.; Denux, J. Remote sensed data contribution to erosion risks identification. Houille Blanche-Rev. Int. L’eau 2002, 88, 81–86. [Google Scholar] [CrossRef]
- Houet, T.; Hubert-Moy, L.; Mercier, G.; Gouery, P. Estimation and Monitoring of Bare Soil/Vegetation Ratio with SPOT Vegetation and HRVIR. In Proceedings of the Centre National de la Recherche Scientifique (CNRS), Toulouse, France, 21–25 July 2003; pp. 3248–3250. [Google Scholar]
- Souchère, V.; Cerdan, O.; Dubreuil, N.; Le Bissonnais, Y.; King, C. Modelling the Impact of Agri-Environmental Scenarios on Runoff in a Cultivated Catchment (Normandy, France). CATENA 2005, 61, 229–240. [Google Scholar] [CrossRef]
- Aubert, M.; Baghdadi, N.; Zribi, M.; Douaoui, A.; Loumagne, C.; Baup, F.; El Hajj, M.; Garrigues, S. Analysis of TerraSAR-X Data Sensitivity to Bare Soil Moisture, Roughness, Composition and Soil Crust. Remote Sens. Environ. 2011, 115, 1801–1810. [Google Scholar] [CrossRef]
- Mougenot, B.; Zante, P.; Montoroi, J.-P. Détection et Évolution Saisonnière Des Sols Salés et Acidifiés Du Domaine Fluvio-Marin de Basse Casamance Au Sénégal, Par Imagerie Satellitai. In Apports de la Télédétection à la Lutte Contre la Sécheresse; Lafrance, P., Dubois, J.M., Eds.; J. Libbey editions: Paris, France, 1990. [Google Scholar]
- Mougenot, B.; Cailleau, D. Identification par télédétection des sols dégradés d’un domaine sahélien au Niger. In Surveillance des Sols Dans L’environnement Par Télédétection et Systèmes D’information Géographiques: Actes du Symposium International AISS,…, Ouagadougou, Burkina Faso, Du 6 Au 10 Février 1995 = Monitoring Soils in the Environment with Remote Sensing and Gis: Proceedings of the ISSS International Symposium,…, Ouagadougou, Burkina Faso, 6–10 February 1995; Escadafal, R., Mulders, M.A., Thiombiano, L., Association Internationale de la Science du Sol, Eds.; Collection Colloques et Séminaires; ORSTOM: Paris, France, 1996; ISBN 978-2-7099-1331-7. [Google Scholar]
- Moussa, I.; Walter, C.; Michot, D.; Adam Boukary, I.; Nicolas, H.; Pichelin, P.; Guéro, Y. Soil Salinity Assessment in Irrigated Paddy Fields of the Niger Valley Using a Four-Year Time Series of Sentinel-2 Satellite Images. Remote Sens. 2020, 12, 3399. [Google Scholar] [CrossRef]
- Ouerghemmi, W.; Gomez, C.; Naceur, S.; Lagacherie, P. Applying Blind Source Separation on Hyperspectral Data for Clay Content Estimation over Partially Vegetated Surfaces. Geoderma 2011, 163, 227–237. [Google Scholar] [CrossRef]
- Qi, J.; Chehbouni, A.; Huete, A.; Kerr, Y.; Sorooshian, S. A Modified Soil Adjusted Vegetation Index. Remote Sens. Environ. 1994, 48, 119–126. [Google Scholar] [CrossRef]
- Rondeaux, G.; Steven, M.; Baret, F. Optimization of Soil-Adjusted Vegetation Indices. Remote Sens. Environ. 1996, 55, 95–107. [Google Scholar] [CrossRef]
- Vaudour, E.; Girard, M. Pédologie. Chapitre 23; In Traitement des Images de Télédétection; Girard, M., Girard, C., Eds.; Dunod: Paris, France, 2010. [Google Scholar]
- Ben-Dor, E.; Irons, J.A.; Epema, A. Soil Spectroscopy. In Manual of Remote Sensing; Rencz, A., Ed.; John Wiley & Sons: New York, NY, USA, 1999; pp. 111–188. [Google Scholar]
- Ben-Dor, E.; Chabrillat, S.; Demattê, J.A.M.; Taylor, G.R.; Hill, J.; Whiting, M.L.; Sommer, S. Using Imaging Spectroscopy to Study Soil Properties. Remote Sens. Environ. 2009, 113, S38–S55. [Google Scholar] [CrossRef]
- Ben-Dor, E. Quantitative Remote Sensing of Soil Properties. Adv. Agron. 2002, 75, 173–243. [Google Scholar]
- Mulder, V.L.; de Bruin, S.; Schaepman, M.E.; Mayr, T.R. The Use of Remote Sensing in Soil and Terrain Mapping—A Review. Geoderma 2011, 162, 1–19. [Google Scholar] [CrossRef]
- Demattê, J.A.M.; Morgan, C.; Chabrillat, S.; Rizzo, R.; Franceschini, M.H.D.; Terra, F.D.S.; Vasques, G.M.; Wetterlind, J. Spectral Sensing from Ground to Space in Soil Science: State of the Art, Applications, Potential, and Perspectives. In Land Resources Monitoring, Modeling, and Mapping with Remote Sensing; CRC Press-Taylor & Francis Group: Boca Raton, FL, USA, 2016. [Google Scholar]
- Chabrillat, S.; Ben-Dor, E.; Cierniewski, J.; Gomez, C.; Schmid, T.; van Wesemael, B. Imaging Spectroscopy for Soil Mapping and Monitoring. Surv. Geophys. 2019, 40, 361–399. [Google Scholar] [CrossRef]
- Tziolas, N.; Tsakiridis, N.; Chabrillat, S.; Demattê, J.A.M.; Ben-Dor, E.; Gholizadeh, A.; Zalidis, G.; van Wesemael, B. Earth Observation Data-Driven Cropland Soil Monitoring: A Review. Remote Sens. 2021, 13, 4439. [Google Scholar] [CrossRef]
- Richer-de-Forges, A.C.; Lagacherie, P.; Arrouays, D.; Bialkowski, A.; Bourennane, H.; Briottet, X.; Fouad, Y.; Gomez, C.; Jacquemoud, S.; Lemercier, B.; et al. The Theia “Digital Soil Mapping” Scientific Expertise Centre of France. Pedometron 2022, 46, 4–8. [Google Scholar]
- Richer-de-Forges, A.C.; Lagacherie, P.; Arrouays, D.; Bialkowski, A.; Bourennane, H.; Briottet, X.; Bustillo, V.; Fouad, Y.; Gomez, C.; Jacquemoud, S.; et al. The Theia “Digital Soil Mapping” Scientific Expertise Centre of France. In Proceedings of the Soil Mapping for a Sustainable Future, 2nd Joint Workshop of the IUSS Working Groups Digital Soil Mapping and Global Soil Map, Orléans, France, 7–9 February 2023. [Google Scholar]
- Droogers, P.; Bouma, J. Soil Survey Input in Exploratory Modeling of Sustainable Soil Management Practices. Soil Sci. Soc. Am. J. 1997, 61, 1704–1710. [Google Scholar] [CrossRef]
- IUSS Working Group. WRB World Reference Base for Soil Resources 2014, Update 2015.International Soil Classification System for Naming Soils and Creating Legends for Soil Maps. World Soil Resources Reports No. 106. FAO, Rome. 2015. Available online: https://www.fao.org/3/i3794en/I3794en.pdf (accessed on 29 May 2023).
- Bouma, J.; Droogers, P. Comparing Different Methods for Estimating the Soil Moisture Supply Capacity of a Soil Series Subjected to Different Types of Management. Geoderma 1999, 92, 185–197. [Google Scholar] [CrossRef]
- Sonneveld, M.P.W.; Bouma, J.; Veldkamp, A. Refining Soil Survey Information for a Dutch Soil Series Using Land Use History. Soil Use Manag. 2002, 18, 157–163. [Google Scholar] [CrossRef]
- Stevenson, B.A.; McNeill, S.; Hewitt, A.E. Characterising Soil Quality Clusters in Relation to Land Use and Soil Order in New Zealand: An Application of the Phenoform Concept. Geoderma 2015, 239–240, 135–142. [Google Scholar] [CrossRef]
- Rossiter, D.G.; Bouma, J. A New Look at Soil Phenoforms—Definition, Identification, Mapping. Geoderma 2018, 314, 113–121. [Google Scholar] [CrossRef]
- Peng, J.; Albergel, C.; Balenzano, A.; Brocca, L.; Cartus, O.; Cosh, M.; Crow, W.; Dabrowska-Zielinska, K.; Dadson, S.; Davidson, M.; et al. A Roadmap for High-Resolution Satellite Soil Moisture Applications—Confronting Product Characteristics with User Requirements. Remote Sens. Environ. 2021, 252, 112162. [Google Scholar] [CrossRef]
- Ward, K.J.; Chabrillat, S.; Brell, M.; Castaldi, F.; Spengler, D.; Foerster, S. Mapping Soil Organic Carbon for Airborne and Simulated EnMAP Imagery Using the LUCAS Soil Database and a Local PLSR. Remote Sens. 2020, 12, 3451. [Google Scholar] [CrossRef]
- Vaudour, E.; Gomez, C.; Fouad, Y.; Lagacherie, P. Sentinel-2 Image Capacities to Predict Common Topsoil Properties of Temperate and Mediterranean Agroecosystems. Remote Sens. Environ. 2019, 223, 21–33. [Google Scholar] [CrossRef]
- Gomez, C.; Lagacherie, P.; Bacha, S. Using an VNIR/SWIR Hyperspectral Image to Map Topsoil Properties over Bare Soil Surfaces in the Cap Bon Region (Tunisia). In Digital Soil Assessments and Beyond; Minasny, B., Malone, B.P., McBratney, A.B., Eds.; Springer: Berlin/Heidelberg, Germany, 2012; pp. 387–392. [Google Scholar]
- Ivushkin, K.; Bartholomeus, H.; Bregt, A.K.; Pulatov, A.; Kempen, B.; de Sousa, L. Global Mapping of Soil Salinity Change. Remote Sens. Environ. 2019, 231, 111260. [Google Scholar] [CrossRef]
- Gomez, C.; Lagacherie, P.; Coulouma, G. Regional Predictions of Eight Common Soil Properties and Their Spatial Structures from Hyperspectral Vis–NIR Data. Geoderma 2012, 189–190, 176–185. [Google Scholar] [CrossRef]
- Gomez, C.; Gholizadeh, A.; Borůvka, L.; Lagacherie, P. Using Legacy Data for Correction of Soil Surface Clay Content Predicted from VNIR/SWIR Hyperspectral Airborne Images. Geoderma 2016, 276, 84–92. [Google Scholar] [CrossRef]
- Vaudour, E.; Gomez, C.; Lagacherie, P.; Loiseau, T.; Baghdadi, N.; Urbina-Salazar, D.; Loubet, B.; Arrouays, D. Temporal Mosaicking Approaches of Sentinel-2 Images for Extending Topsoil Organic Carbon Content Mapping in Croplands. Int. J. Appl. Earth Obs. Geoinf. 2021, 96, 102277. [Google Scholar] [CrossRef]
- Urbina-Salazar, D.; Vaudour, E.; Baghdadi, N.; Ceschia, E.; Richer-de-Forges, A.C.; Lehmann, S.; Arrouays, D. Using Sentinel-2 Images for Soil Organic Carbon Content Mapping in Croplands of Southwestern France. The Usefulness of Sentinel-1/2 Derived Moisture Maps and Mismatches between Sentinel Images and Sampling Dates. Remote Sens. 2021, 13, 5115. [Google Scholar] [CrossRef]
- Gasmi, A.; Gomez, C.; Lagacherie, P.; Zouari, H. Surface Soil Clay Content Mapping at Large Scales Using Multispectral (VNIR-SWIR) ASTER Data. Int. J. Remote Sens. 2019, 40, 1506–1533. [Google Scholar] [CrossRef]
- Lagacherie, P.; Arrouays, D.; Bourennane, H.; Gomez, C.; Nkuba-Kasanda, L. Analysing the Impact of Soil Spatial Sampling on the Performances of Digital Soil Mapping Models and Their Evaluation: A Numerical Experiment on Quantile Random Forest Using Clay Contents Obtained from Vis-NIR-SWIR Hyperspectral Imagery. Geoderma 2020, 375, 114503. [Google Scholar] [CrossRef]
- Lagacherie, P.; Arrouays, D.; Bourennane, H.; Gomez, C.; Martin, M.; Saby, N.P.A. How Far Can the Uncertainty on a Digital Soil Map Be Known?: A Numerical Experiment Using Pseudo Values of Clay Content Obtained from Vis-SWIR Hyperspectral Imagery. Geoderma 2019, 337, 1320–1328. [Google Scholar] [CrossRef]
- Wigneron, J.; Kerr, Y.; Waldteufel, P.; Saleh, K.; Escorihuela, M.; Richaume, P.; Ferrazzoli, P.; de Rosnay, P.; Gurney, R.; Calvet, J.; et al. L-Band Microwave Emission of the Biosphere (L-MEB) Model: Description and Calibration against Experimental Data Sets over Crop Fields. Remote Sens. Environ. 2007, 107, 639–655. [Google Scholar] [CrossRef]
- Shellito, P.J.; Small, E.E.; Cosh, M.H. Calibration of Noah Soil Hydraulic Property Parameters Using Surface Soil Moisture from SMOS and Basinwide In Situ Observations. J. Hydrometeorol. 2016, 17, 2275–2292. [Google Scholar] [CrossRef]
- Lacoste, M.; Lemercier, B.; Walter, C. Regional Mapping of Soil Parent Material by Machine Learning Based on Point Data. Geomorphology 2011, 133, 90–99. [Google Scholar] [CrossRef]
- Samuel-Rosa, A.; Heuvelink, G.B.M.; Vasques, G.M.; Anjos, L.H.C. Do More Detailed Environmental Covariates Deliver More Accurate Soil Maps? Geoderma 2015, 243–244, 214–227. [Google Scholar] [CrossRef]
- Brus, D.J. Spatial Sampling with R, 1st ed.; Chapman and Hall/CRC: Boca Raton, FL, USA, 2022; ISBN 978-1-00-325894-0. [Google Scholar]
- Mulder, V.L.; Lacoste, M.; Richer-de-Forges, A.C.; Martin, M.P.; Arrouays, D. National versus Global Modelling the 3D Distribution of Soil Organic Carbon in Mainland France. Geoderma 2016, 263, 16–34. [Google Scholar] [CrossRef]
- Lemercier, B.; Lagacherie, P.; Amelin, J.; Sauter, J.; Pichelin, P.; Richer-de-Forges, A.C.; Arrouays, D. Multiscale Evaluations of Global, National and Regional Digital Soil Mapping Products in France. Geoderma 2022, 425, 116052. [Google Scholar] [CrossRef]
- Chen, S.; Mulder, V.L.; Martin, M.P.; Walter, C.; Lacoste, M.; Richer-de-Forges, A.C.; Saby, N.P.A.; Loiseau, T.; Hu, B.; Arrouays, D. Probability Mapping of Soil Thickness by Random Survival Forest at a National Scale. Geoderma 2019, 344, 184–194. [Google Scholar] [CrossRef]
- Loiseau, T.; Arrouays, D.; Richer-de-Forges, A.C.; Lagacherie, P.; Ducommun, C.; Minasny, B. Density of Soil Observations in Digital Soil Mapping: A Study in the Mayenne Region, France. Geoderma Reg. 2021, 24, e00358. [Google Scholar] [CrossRef]
- McKenzie, N.J.; Ryan, P.J. Spatial Prediction of Soil Properties Using Environmental Correlation. Geoderma 1999, 89, 67–94. [Google Scholar] [CrossRef]
- Arrouays, D.; Leenaars, J.G.B.; Richer-de-Forges, A.C.; Adhikari, K.; Ballabio, C.; Greve, M.; Grundy, M.; Guerrero, E.; Hempel, J.; Hengl, T.; et al. Soil Legacy Data Rescue via GlobalSoilMap and Other International and National Initiatives. GeoResJ 2017, 14, 1–19. [Google Scholar] [CrossRef]
- Grinand, C.; Arrouays, D.; Laroche, B.; Martin, M.P. Extrapolating Regional Soil Landscapes from an Existing Soil Map: Sampling Intensity, Validation Procedures, and Integration of Spatial Context. Geoderma 2008, 143, 180–190. [Google Scholar] [CrossRef]
- Lagacherie, P.; Legros, J.P.; Burfough, P.A. A Soil Survey Procedure Using the Knowledge of Soil Pattern Established on a Previously Mapped Reference Area. Geoderma 1995, 65, 283–301. [Google Scholar] [CrossRef]
- Nauman, T.W.; Thompson, J.A. Semi-Automated Disaggregation of Conventional Soil Maps Using Knowledge Driven Data Mining and Classification Trees. Geoderma 2014, 213, 385–399. [Google Scholar] [CrossRef]
- Vincent, S.; Lemercier, B.; Berthier, L.; Walter, C. Spatial Disaggregation of Complex Soil Map Units at the Regional Scale Based on Soil-Landscape Relationships. Geoderma 2018, 311, 130–142. [Google Scholar] [CrossRef]
- Richer-de-Forges, A.C.; Arrouays, D.; Poggio, L.; Chen, S.; Lacoste, M.; Minasny, B. Hand-Feel Soil Texture Observations to Evaluate the Accuracy of Digital Soil Maps for Local Prediction of Particle Size Distribution. A Case Study in Central France. Pedosphere 2022, in press. [Google Scholar] [CrossRef]
- Raju, S.; Chanzy, A.; Wigneron, J.-P.; Calvet, J.-C.; Kerr, Y.; Laguerre, L. Soil Moisture and Temperature Profile Effects on Microwave Emission at Low Frequencies. Remote Sens. Environ. 1995, 54, 85–97. [Google Scholar] [CrossRef]
- Wigneron, J.; Schmugge, T.; Chanzy, A.; Calvet, J.; Kerr, Y. Use of Passive Microwave Remote Sensing to Monitor Soil Moisture. Agronomie 1998, 18, 27–43. [Google Scholar] [CrossRef]
- Wigneron, J.; Ferrazzoli, P.; Calvet, J.; Kerr, Y.; Bertuzzi, P. A Parametric Study on Passive and Active Microwave Observations over a Soybean Crop. IEEE Trans. Geosci. Remote Sens. 1999, 37, 2728–2733. [Google Scholar] [CrossRef]
- Wigneron, J.; Laguerre, L.; Kerr, Y. A Simple Parameterization of the L-Band Microwave Emission from Rough Agricultural Soils. IEEE Trans. Geosci. Remote Sens. 2001, 39, 1697–1707. [Google Scholar] [CrossRef]
- Wigneron, J.; Jackson, T.; O’Neill, P.; De Lannoy, G.; de Rosnay, P.; Walker, J.; Ferrazzoli, P.; Mironov, V.; Bircher, S.; Grant, J.; et al. Modelling the Passive Microwave Signature from Land Surfaces: A Review of Recent Results and Application to the L-Band SMOS & SMAP Soil Moisture Retrieval Algorithms. Remote Sens. Environ. 2017, 192, 238–262. [Google Scholar] [CrossRef]
- Cros, S.; Chanzy, A.; Pellarin, T.; Calvet, J.-C.; Wigneron, J.-P. Using Optical Satellite Based Data to Improve Soil Moisture Retrieval from SMOS Mission. In Proceedings of the 2006 IEEE International Symposium on Geoscience and Remote Sensing, Denver, CO, USA, 31 July–4 August 2006; p. 2021. [Google Scholar]
- Escorihuela, M.; Chanzy, A.; Wigneron, J.; Kerr, Y. Effective Soil Moisture Sampling Depth of L-Band Radiometry: A Case Study. Remote Sens. Environ. 2010, 114, 995–1001. [Google Scholar] [CrossRef]
- Kerr, Y.; Al-Yaari, A.; Rodriguez-Fernandez, N.; Parrens, M.; Molero, B.; Leroux, D.; Bircher, S.; Mahmoodi, A.; Mialon, A.; Richaume, P.; et al. Overview of SMOS Performance in Terms of Global Soil Moisture Monitoring after Six Years in Operation. Remote Sens. Environ. 2016, 180, 40–63. [Google Scholar] [CrossRef]
- Baghdadi, N.; El Hajj, M.; Choker, M.; Zribi, M.; Bazzi, H.; Vaudour, E.; Gilliot, J.; Bousbih, S.; Mwampongo, D. Potential of Sentinel-1 for Estimating the Soil Roughness over Agricultural Soils. In Proceedings of the IGARSS 2018—2018 IEEE International Geoscience and Remote Sensing Symposium, Valencia, Spain, 22–27 July 2018; pp. 7516–7519. [Google Scholar]
- Al-Yaari, A.; Ducharne, A.; Cheruy, F.; Crow, W.; Wigneron, J. Satellite-Based Soil Moisture Provides Missing Link between Summertime Precipitation and Surface Temperature Biases in CMIP5 Simulations over Conterminous United States. Sci. Rep. 2019, 9, 1657. [Google Scholar] [CrossRef]
- Gruber, A.; de Lannoy, G.; Albergel, C.; Al-yaari, A.; Brocca, L.; Calvet, J.-C.; Colliander, A.; Cosh, M.; Crow, W.T.; Dorigo, W.; et al. Validation Practices for Satellite Soil Moisture Retrievals: What Are (the) Errors? Remote Sens. Environ. 2020, 244, 111806. [Google Scholar] [CrossRef]
- Wigneron, J.-P.; Kerr, Y.; Chanzy, A.; Jin, Y.-Q. Inversion of Surface Parameters from Passive Microwave Measurements over a Soybean Field. Remote Sens. Environ. 1993, 46, 61–72. [Google Scholar] [CrossRef]
- Wigneron, J.; Chanzy, A.; Calvet, J.; Bruguier, W. A Simple Algorithm to Retrieve Soil-Moisture and Vegetation Biomass Using Passive Microwave Measurements over Crop Fields. Remote Sens. Environ. 1995, 51, 331–341. [Google Scholar] [CrossRef]
- Wigneron, J.; Waldteufel, P.; Chanzy, A.; Calvet, J.; Kerr, Y. Two-Dimensional Microwave Interferometer Retrieval Capabilities over Land Surfaces (SMOS Mission). Remote Sens. Environ. 2000, 73, 270–282. [Google Scholar] [CrossRef]
- Kerr, Y.; Waldteufel, P.; Wigneron, J.; Martinuzzi, J.; Font, J.; Berger, M. Soil Moisture Retrieval from Space: The Soil Moisture and Ocean Salinity (SMOS) Mission. IEEE Trans. Geosci. Remote Sens. 2001, 39, 1729–1735. [Google Scholar] [CrossRef]
- Baghdadi, N.; El Hajj, M.; Choker, M.; Zribi, M.; Bazzi, H.; Vaudour, E.; Gilliot, J.-M.; Ebengo, D. Potential of Sentinel-1 Images for Estimating the Soil Roughness over Bare Agricultural Soils. Water 2018, 10, 131. [Google Scholar] [CrossRef]
- Albergel, C.; Rudiger, C.; Pellarin, T.; Calvet, J.; Fritz, N.; Froissard, F.; Suquia, D.; Petitpa, A.; Piguet, B.; Martin, E. From Near-Surface to Root-Zone Soil Moisture Using an Exponential Filter: An Assessment of the Method Based on in-Situ Observations and Model Simulations. Hydrol. Earth Syst. Sci. 2008, 12, 1323–1337. [Google Scholar] [CrossRef]
- Sadeghi, M.; Babaeian, E.; Tuller, M.; Jones, S.B. The Optical Trapezoid Model: A Novel Approach to Remote Sensing of Soil Moisture Applied to Sentinel-2 and Landsat-8 Observations. Remote Sens. Environ. 2017, 198, 52–68. [Google Scholar] [CrossRef]
- Petropoulos, G.P.; Ireland, G.; Barrett, B. Surface Soil Moisture Retrievals from Remote Sensing: Current Status, Products & Future Trends. Phys. Chem. Earth 2015, 83–84, 36–56. [Google Scholar] [CrossRef]
- Sandholt, I.; Rasmussen, K.; Andersen, J. A Simple Interpretation of the Surface Temperature/Vegetation Index Space for Assessment of Surface Moisture Status. Remote Sens. Environ. 2002, 79, 213–224. [Google Scholar] [CrossRef]
- Hassan-Esfahani, L.; Torres-Rua, A.; Jensen, A.; Mckee, M. Spatial Root Zone Soil Water Content Estimation in Agricultural Lands Using Bayesian-Based Artificial Neural Networks and High- Resolution Visual, NIR, and Thermal Imagery: Remote Sensing of Agricultural Soil Moisture Using UAV. Irrig. Drain. 2017, 66, 273–288. [Google Scholar] [CrossRef]
- Li, F.; Crow, W.T.; Kustas, W.P. Towards the Estimation Root-Zone Soil Moisture via the Simultaneous Assimilation of Thermal and Microwave Soil Moisture Retrievals. Adv. Water Resour. 2010, 33, 201–214. [Google Scholar] [CrossRef]
- King, C.; Lecomte, V.; Le Bissonnais, Y.; Baghdadi, N.; Souchere, V.; Cerdan, O. Remote-Sensing Data as an Alternative Input for the “STREAM” Runoff Model. CATENA 2005, 62, 125–135. [Google Scholar] [CrossRef]
- Bretar, F.; Arab-Sedze, M.; Champion, J.; Pierrot-Deseilligny, M.; Heggy, E.; Jacquemoud, S. An Advanced Photogrammetric Method to Measure Surface Roughness: Application to Volcanic Terrains in the Piton de La Fournaise, Reunion Island. Remote Sens. Environ. 2013, 135, 1–11. [Google Scholar] [CrossRef]
- Gilliot, J.M.; Vaudour, E.; Michelin, J. Soil Surface Roughness Measurement: A New Fully Automatic Photogrammetric Approach Applied to Agricultural Bare Fields. Comput. Electron. Agric. 2017, 134, 63–78. [Google Scholar] [CrossRef]
- Parrens, M.; Wigneron, J.; Richaume, P.; Mialon, A.; Al Bitar, A.; Fernandez-Moran, R.; Al-Yaari, A.; Kerr, Y. Global-Scale Surface Roughness Effects at L-Band as Estimated from SMOS Observations. Remote Sens. Environ. 2016, 181, 122–136. [Google Scholar] [CrossRef]
- Baghdadi, N.; Cerdan, O.; Zribi, M.; Auzet, V.; Darboux, F.; El Hajj, M.; Kheir, R. Operational Performance of Current Synthetic Aperture Radar Sensors in Mapping Soil Surface Characteristics in Agricultural Environments: Application to Hydrological and Erosion Modelling. Hydrol. Process. 2008, 22, 9–20. [Google Scholar] [CrossRef]
- Paustian, K.; Lehmann, J.; Ogle, S.; Reay, D.; Robertson, G.P.; Smith, P. Climate-Smart Soils. Nature 2016, 532, 49–57. [Google Scholar] [CrossRef]
- Minasny, B.; Malone, B.P.; McBratney, A.B.; Angers, D.A.; Arrouays, D.; Chambers, A.; Chaplot, V.; Chen, Z.-S.; Cheng, K.; Das, B.S.; et al. Soil Carbon 4 per Mille. Geoderma 2017, 292, 59–86. [Google Scholar] [CrossRef]
- Minasny, B.; Arrouays, D.; McBratney, A.B.; Angers, D.A.; Chambers, A.; Chaplot, V.; Chen, Z.-S.; Cheng, K.; Das, B.S.; Field, D.J.; et al. Rejoinder to Comments on Minasny et al., 2017 Soil Carbon 4 per Mille Geoderma 292, 59–86. Geoderma 2018, 309, 124–129. [Google Scholar] [CrossRef]
- Chenu, C.; Angers, D.A.; Barré, P.; Derrien, D.; Arrouays, D.; Balesdent, J. Increasing Organic Stocks in Agricultural Soils: Knowledge Gaps and Potential Innovations. Soil Tillage Res. 2019, 188, 41–52. [Google Scholar] [CrossRef]
- Angelopoulou, T.; Tziolas, N.; Balafoutis, A.; Zalidis, G.; Bochtis, D. Remote Sensing Techniques for Soil Organic Carbon Estimation: A Review. Remote Sens. 2019, 11, 676. [Google Scholar] [CrossRef]
- Vaudour, E.; Gholizadeh, A.; Castaldi, F.; Saberioon, M.; Borůvka, L.; Urbina-Salazar, D.; Fouad, Y.; Arrouays, D.; Richer-De-Forges, A.; Biney, J.; et al. Satellite Imagery to Map Topsoil Organic Carbon Content over Cultivated Areas: An Overview. Remote Sens. 2022, 14, 2917. [Google Scholar] [CrossRef]
- Vaudour, E.; Gomez, C.; Loiseau, T.; Baghdadi, N.; Loubet, B.; Arrouays, D.; Ali, L.; Lagacherie, P. The Impact of Acquisition Date on the Prediction Performance of Topsoil Organic Carbon from Sentinel-2 for Croplands. Remote Sens. 2019, 11, 2143. [Google Scholar] [CrossRef]
- Castaldi, F.; Chabrillat, S.; Don, A.; van Wesemael, B. Soil Organic Carbon Mapping Using LUCAS Topsoil Database and Sentinel-2 Data: An Approach to Reduce Soil Moisture and Crop Residue Effects. Remote Sens. 2019, 11, 2121. [Google Scholar] [CrossRef]
- Vaudour, E.; Gilliot, J.M.; Bel, L.; Lefevre, J.; Chehdi, K. Regional Prediction of Soil Organic Carbon Content over Temperate Croplands Using Visible Near-Infrared Airborne Hyperspectral Imagery and Synchronous Field Spectra. Int. J. Appl. Earth Obs. Geoinf. 2016, 49, 24–38. [Google Scholar] [CrossRef]
- Gomez, C.; Rossel, R.; McBratney, A. Soil Organic Carbon Prediction by Hyperspectral Remote Sensing and Field Vis-NIR Spectroscopy: An Australian Case Study. Geoderma 2008, 146, 403–411. [Google Scholar] [CrossRef]
- Vaudour, E.; Bel, L.; Gilliot, J.M.; Coquet, Y.; Hadjar, D.; Cambier, P.; Michelin, J.; Houot, S. Potential of SPOT Multispectral Satellite Images for Mapping Topsoil Organic Carbon Content over Peri-Urban Croplands. Soil Sci. Soc. Am. J. 2013, 77, 2122–2139. [Google Scholar] [CrossRef]
- Berthier, L.; Pitres, J.C.; Vaudour, E. Prédiction Spatiale Des Teneurs En Carbone Organique Des Sols Par Spectroscopie Visible-Proche Infrarouge et Télédétection Satellitale SPOT. Exemple Au Niveau d’un Périmètre d’alimentation En Eau Potable En Beauce. Etude Gest. Sols 2008, 15, 161–172. [Google Scholar]
- Bsaibes, A.; Courault, D.; Baret, F.; Weiss, M.; Olioso, A.; Jacob, F.; Hagolle, O.; Marloie, O.; Bertrand, N.; Desfond, V.; et al. Albedo and LAI Estimates from FORMOSAT-2 Data for Crop Monitoring. Remote Sens. Environ. 2009, 113, 716–729. [Google Scholar] [CrossRef]
- Gomez, C.; Lagacherie, P.; Coulouma, G. Continuum Removal versus PLSR Method for Clay and Calcium Carbonate Content Estimation from Laboratory and Airborne Hyperspectral Measurements. Geoderma 2008, 148, 141–148. [Google Scholar] [CrossRef]
- Nouri, M.; Gomez, C.; Gorretta, N.; Roger, J.M. Clay Content Mapping from Airborne Hyperspectral Vis-NIR Data by Transferring a Laboratory Regression Model. Geoderma 2017, 298, 54–66. [Google Scholar] [CrossRef]
- Bousbih, S.; Zribi, M.; Pelletier, C.; Gorrab, A.; Lili-Chabaane, Z.; Baghdadi, N.; Ben Aissa, N.; Mougenot, B. Soil Texture Estimation Using Radar and Optical Data from Sentinel-1 and Sentinel-2. Remote Sens. 2019, 11, 1520. [Google Scholar] [CrossRef]
- Gomez, C.; Dharumarajan, S.; Féret, J.-B.; Lagacherie, P.; Ruiz, L.; Sekhar, M. Use of Sentinel-2 Time-Series Images for Classification and Uncertainty Analysis of Inherent Biophysical Property: Case of Soil Texture Mapping. Remote Sens. 2019, 11, 565. [Google Scholar] [CrossRef]
- Gomez, C.; Vaudour, E.; Féret, J.-B.; de Boissieu, F.; Dharumarajan, S. Topsoil Clay Content Mapping in Croplands from Sentinel-2 Data: Influence of Atmospheric Correction Methods across a Season Time Series. Geoderma 2022, 423, 115959. [Google Scholar] [CrossRef]
- Chabrillat, S.; Goetz, A.F.H.; Krosley, L.; Olsen, H.W. Use of Hyperspectral Images in the Identification and Mapping of Expansive Clay Soils and the Role of Spatial Resolution. Remote Sens. Environ. 2002, 82, 431–445. [Google Scholar] [CrossRef]
- Escadafal, R.; Pouget, M. Cartographie Des Formations Superficielles En Zone Aride (Tunisie Méridionale) Avec Landsat TM. Photo-Interprétation 1987, 4, 9–15. [Google Scholar]
- de Martonne, E. Photogrammétrie et photographie aérienne: À propos du congrès et de l’exposition internationale de photogrammétrie. Ann. Géographie 1935, 44, 65–70. [Google Scholar] [CrossRef]
- Lagacherie, P.; Robbez-Masson, J.M.; Nguyen-The, N.; Barthès, J.P. Mapping of Reference Area Representativity Using a Mathematical Soilscape Distance. Geoderma 2001, 101, 105–118. [Google Scholar] [CrossRef]
- Hamdi-Aïssa, B.; Girard, M.-C. Utilisation de La Télédétection En Régions Sahariennes, Pour l’analyse et l’extrapolation Spatiale Des Pédopaysages. Sci. Chang. Planétaires Sécheresse 2000, 11, 179–188. [Google Scholar]
- Girard, M.-C. Recherche d’une Modélisation En Vue d’une Représentation Spatiale de La Couverture Pédologique. Ph.D. Thesis, Institut National Agronomique Paris-Grignon, Paris, France, 1983. [Google Scholar]
- Girard, M.-C.; King, D. Un Algorithme Interactif Pour La Classification Des Horizons de La Couverture Pédologique. Sci. Sol 1988, 26, 81–102. [Google Scholar]
- Girard, M.; Mougenot, B.; Rananoson, A. Présentation d’un Modèle d’organisation et D’analyse de La Structure Des Informations Spatialisées: OASIS; ORSTOM: Paris, France, 1990. [Google Scholar]
- Robbez-Masson, J.-M.; Foltete, J.-C.; Cabello, L.; Flitti, M. Prise en compte du contexte spatial dans l’instrumentation de la notion de paysage—Application à une segmentation géographique assistée. Rev. Int. Géomatique 1999, 9, 173–195. [Google Scholar]
- Robbez-Masson, J.-M. Reconnaissance et Délimitation de Motifs D’organisation Spatiale—Application à la Cartographie de Pédopaysages. Ph.D. Thesis, Ecole Nationale Supérieure Agronomique de Montpellier, Montpellier, France, 1994. [Google Scholar]
- Lehmann, S.; Bégon, J.-C.; Eimberck, M.; Daroussin, J.; Wynns, R.; Arrouays, D. Utilisation du logiciel CLAPAS pour l’aide à la délimitation de pédopaysages. Un test sur la carte des sols de Mirande (Gers, France). Etude Gest. Sols 2007, 14, 135–151. [Google Scholar]
- Bourget, É.; Le Dû-Blayo, L. Définition d’unités Paysagères Par Télédétection En Bretagne: Méthodes et Critiques. Norois 2010, 216, 69–83. [Google Scholar] [CrossRef]
- Le Dû-Blayo, L.; Gouery, P.; Corpetti, T.; Michel, K.; Lemercier, B.; Walter, C. Improving the Input of Remotely-Sensed Data and Information into Digital Soil Maps. In Digital Soil Mapping with Limited Soil Data; Hartemink, A.E., Ed.; Developments in Soil Science; Elsevier: Amsterdam, The Netherlands, 2008; pp. 337–348. [Google Scholar]
- United States Geological Survey. Landsat Data Access. 2023. Available online: https://www.usgs.gov/landsat-missions/landsat-data-access (accessed on 29 May 2023).
- IPCC. Climate Change 2007: Synthesis Report. Contribution of Working Groups I, II and III to the Fourth Assessment Report of the Intergovernmental Panel on Climate Change; Core Writing Team, Pachauri, R.K., Reisinger, A., Eds.; IPCC: Geneva, Switzerland, 2007; 104p. [Google Scholar]
- Stenberg, B.; Viscarra Rossel, R.A.; Mouazen, A.M.; Wetterlind, J. Visible and Near Infrared Spectroscopy in Soil Science. Adv. Agron. 2010, 107, 163–215. [Google Scholar] [CrossRef]
- Barthès, B.G.; Chotte, J. Infrared Spectroscopy Approaches Support Soil Organic Carbon Estimations to Evaluate Land Degradation. Land Degrad. Dev. 2021, 32, 310–322. [Google Scholar] [CrossRef]
- European Commission. Communication from the Commission to the European Parliament, the Council, the European Economic and Social Committee and the Committee of the Regions. EU Soil Strategy for 2030. Reaping the Benefits of Healthy Soils for People, Food, Nature and Climate; European Commission: Brussels, Belgium, 2021. [Google Scholar]
- Smith, P. Monitoring and Verification of Soil Carbon Changes under Article 3.4 of the Kyoto Protocol. Soil Use Manag. 2006, 20, 264–270. [Google Scholar] [CrossRef]
- Smith, P.; Soussana, J.-F.; Angers, D.; Schipper, L.; Chenu, C.; Rasse, D.P.; Batjes, N.H.; van Egmond, F.; Mcneill, S.; Kuhnert, M.; et al. How to Measure, Report and Verify Soil Carbon Change to Realise the Potential of Soil Carbon Sequestration for Atmospheric Greenhouse Gas Removal. Glob. Change Biol. 2020, 26, 219–241. [Google Scholar] [CrossRef]
- Soussana, J.-F.; Lutfalla, S.; Ehrhardt, F.; Rosenstock, T.; Lamanna, C.; Havlík, P.; Richards, M.; Wollenberg, E.L.; Chotte, J.-L.; Torquebiau, E.; et al. Matching Policy and Science: Rationale for the ‘4 per 1000—Soils for Food Security and Climate’ Initiative. Soil Tillage Res. 2019, 188, 3–15. [Google Scholar] [CrossRef]
- Martin, M.P.; Dimassi, B.; Román Dobarco, M.; Guenet, B.; Arrouays, D.; Angers, D.A.; Blache, F.; Huard, F.; Soussana, J.; Pellerin, S. Feasibility of the 4 per 1000 Aspirational Target for Soil Carbon: A Case Study for France. Glob. Change Biol. 2021, 27, 2458–2477. [Google Scholar] [CrossRef] [PubMed]
- Rabot, E.; Keller, C.; Ambrosi, J.-P.; Robert, S. Revue des méthodes multiparamétriques pour l’estimation de la qualité des sols, dans le cadre de l’aménagement du territoire. Etude Gest. Sols 2017, 24, 59–72. [Google Scholar]
- Cabral, P.; Feger, C.; Levrel, H.; Chambolle, M.; Basque, D. Assessing the Impact of Land-Cover Changes on Ecosystem Services: A First Step toward Integrative Planning in Bordeaux, France. Ecosyst. Serv. 2016, 22, 318–327. [Google Scholar] [CrossRef]
- Stoian, A.; Poulain, V.; Inglada, J.; Poughon, V.; Derksen, D. Land Cover Maps Production with High Resolution Satellite Image Time Series and Convolutional Neural Networks: Adaptations and Limits for Operational Systems. Remote Sens. 2019, 11, 1986. [Google Scholar] [CrossRef]
- Cerdan, O.; Delmas, M.; Négrel, P.; Mouchel, J.-M.; Petelet-Giraud, E.; Salvador-Blanes, S.; Degan, F. Contribution of Diffuse Hillslope Erosion to the Sediment Export of French Rivers. Comptes Rendus Geosci. 2012, 344, 636–645. [Google Scholar] [CrossRef]
- Gay, A.; Cerdan, O.; Delmas, M.; Desmet, M. Variability of Suspended Sediment Yields within the Loire River Basin (France). J. Hydrol. 2014, 519, 1225–1237. [Google Scholar] [CrossRef]
- Patault, E.; Ledun, J.; Landemaine, V.; Soulignac, A.; Richet, J.-B.; Fournier, M.; Ouvry, J.-F.; Cerdan, O.; Laignel, B. Analysis of Off-Site Economic Costs Induced by Runoff and Soil Erosion: Example of Two Areas in the Northwestern European Loess Belt for the Last Two Decades (Normandy, France). Land Use Policy 2021, 108, 105541. [Google Scholar] [CrossRef]
- King, C.; Baghdadi, N.; Lecomte, V.; Cerdan, O. The Application of Remote-Sensing Data to Monitoring and Modelling of Soil Erosion. CATENA 2005, 62, 79–93. [Google Scholar] [CrossRef]
- Desprats, J.; Raclot, D.; Rousseau, M.; Cerdan, O.; Garcin, M.; Le Bissonnais, Y.; Ben Slimane, A.; Fouche, J.; Monfort-Climent, D. Mapping Linear Erosion Features Using High and Very High Resolution Satellite Imagery. Land Degrad. Dev. 2013, 24, 22–32. [Google Scholar] [CrossRef]
- Pineux, N.; Lisein, J.; Swerts, G.; Bielders, C.L.; Lejeune, P.; Colinet, G.; Degré, A. Can DEM Time Series Produced by UAV Be Used to Quantify Diffuse Erosion in an Agricultural Watershed? Geomorphology 2017, 280, 122–136. [Google Scholar] [CrossRef]
- Abass Saley, A.; Baratoux, D.; Baratoux, L.; Ahoussi, K.E.; Yao, K.A.; Kouamé, K.J. Evolution of the Koma Bangou Gold Panning Site (Niger) From 1984 to 2020 Using Landsat Imagery. Earth Space Sci. 2021, 8, e2021EA001879. [Google Scholar] [CrossRef]
- Hong, Y.; Shen, R.; Cheng, H.; Chen, S.; Chen, Y.; Guo, L.; He, J.; Liu, Y.; Yu, L.; Liu, Y. Cadmium Concentration Estimation in Pen-Urban Agricultural Soils: Using Reflectance Spectroscopy, Soil Auxiliary Information, or a Combination of Both? Geoderma 2019, 354, 113875. [Google Scholar] [CrossRef]
- Lever, V.; Foucher, P.; Briottet, X.; Poutier, L.; Deliot, P.; Viallefont, F.; Dubucq, D. IEEE Estimation of Hydrocarbon Content in Airborne Hyperspectral Images by a Pls Regression Model Calibrated on Synthetic Airborne Spectral Database; National Office for Aerospace Studies & Research (ONERA): Palaiseau, France, 2015; pp. 1737–1740. [Google Scholar]
- Lever, V.; Foucher, P.; Briottet, X.; Dubucq, D.; Carrio, R.; Poutier, L.; Achard, V.; Deliot, P. Joint Lab, Field and Airborne Spectral Database for the Quantification of Soil Hydrocarbon Content. In Proceedings of the National Office for Aerospace Studies & Research (ONERA), Los Angeles, CA, USA, 21–24 August 2016. [Google Scholar]
- Lassalle, G.; Fabre, S.; Credoz, A.; Dubucq, D.; Elger, A. Monitoring Oil Contamination in Vegetated Areas with Optical Remote Sensing: A Comprehensive Review. J. Hazard. Mater. 2020, 393, 122427. [Google Scholar] [CrossRef]
- Faulques, E.; Kalashnyk, N.; Massuyeau, F.; Perry, D. Spectroscopic Markers for Uranium (VI) Phosphates: A Vibronic Study. RSC Adv. 2015, 5, 71219–71227. [Google Scholar] [CrossRef]
- Xu, D.; Zhao, R.; Li, S.; Chen, S.; Jiang, Q.; Zhou, L.; Shi, Z. Multi-Sensor Fusion for the Determination of Several Soil Properties in the Yangtze River Delta, China. Eur. J. Soil Sci. 2019, 70, 162–173. [Google Scholar] [CrossRef]
- Martelet, G.; Drufin, S.; Tourliere, B.; Saby, N.P.A.; Perrin, J.; Deparis, J.; Prognon, F.; Jolivet, C.; Ratié, C.; Arrouays, D. Regional Regolith Parameter Prediction Using the Proxy of Airborne Gamma Ray Spectrometry. Vadose Zone J. 2013, 12, 1–14. [Google Scholar] [CrossRef]
- Wetterlind, J.; Tourliere, B.; Martelet, G.; Deparis, J.; Saby, N.; Richer de Forges, A.; Arrouays, D. Are There Any Effects of the Agricultural Use of Chemical Fertiliser on Elements Detected by Airborne Gamma-Spectrometric Surveys? Geoderma 2012, 173, 34–41. [Google Scholar] [CrossRef]
- Lassalle, G.; Fabre, S.; Credoz, A.; Dubucq, D.; de Souza Filho, C.R. Remote Sensing of Oil in Vegetated Regions: An Overview of Recent Advances and Future Challenges Toward Operational Applications. In Proceedings of the IGARSS 2020—2020 IEEE International Geoscience and Remote Sensing Symposium, Waikoloa, HI, USA, 26 September–2 October 2020; pp. 4045–4048. [Google Scholar]
- Achard, V.; Foucher, P.; Dubucq, D. Hydrocarbon Pollution Detection and Mapping Based on the Combination of Various Hyperspectral Imaging Processing Tools. Remote Sens. 2021, 13, 1020. [Google Scholar] [CrossRef]
- Tabet, D.; Vidal, A.; Zimmer, D.; Asif, S.; Aslam, M.; Kuper, M.; Strosser, P. Soil Salinity Characterisation in SPOT Images: A Case Study in One Irrigation System of the Punjab, Pakistan. In Proceedings of the Seventh International Symposium on Physical Measurements and Signatures in Remote Sensing, Courchevel, France, 7–11 April 1997; pp. 795–800. [Google Scholar]
- Douaoui, A.; Nicolas, H.; Walter, C. Detecting Salinity Hazards within a Semiarid Context by Means of Combining Soil and Remote-Sensing Data. Geoderma 2006, 134, 217–230. [Google Scholar] [CrossRef]
- Saby, N.P.A.; Arrouays, D.; Antoni, V.; Lemercier, B.; Follain, S.; Walter, C.; Schvartz, C. Changes in Soil Organic Carbon in a Mountainous French Region, 1990–2004. Soil Use Manag. 2008, 24, 254–262. [Google Scholar] [CrossRef]
- Lagacherie, P.; Gomez, C.; Bailly, J.; Baret, F.; Coulouma, G. The Use of Hyperspectral Imagery for Digital Soil Mapping in Mediterranean Areas. In Digital Soil Mapping; Boettinger, J., Howell, D., Moore, A., Hartemink, A., Kienast-Brown, S., Eds.; Springer: Dordrecht, The Netherlands, 2010; Volume 2, pp. 93–102. [Google Scholar]
- Lagacherie, P.; Gomez, C. Vis-NIR-SWIR Remote Sensing Products as New Soil Data for Digital Soil Mapping. In PEDOMETRICS; McBratney, A., Minasny, B., Stockmann, U., Eds.; Springer: Berlin/Heidelberg, Germany, 2018; pp. 415–437. ISBN 2352-4774. [Google Scholar]
- Loiseau, T.; Chen, S.; Mulder, V.L.; Román Dobarco, M.; Richer-de-Forges, A.C.; Lehmann, S.; Bourennane, H.; Saby, N.P.A.; Martin, M.P.; Vaudour, E.; et al. Satellite Data Integration for Soil Clay Content Modelling at a National Scale. Int. J. Appl. Earth Obs. Geoinf. 2019, 82, 101905. [Google Scholar] [CrossRef]
- Ouerghemmi, W.; Gomez, C.; Naceur, S.; Lagacherie, P. Semi-Blind Source Separation for the Estimation of the Clay Content over Semi-Vegetated Areas Using VNIR/SWIR Hyperspectral Airborne Data. Remote Sens. Environ. 2016, 181, 251–263. [Google Scholar] [CrossRef]
- Urbina-Salazar, D.; Vaudour, E.; Richer-de-Forges, A.C.; Chen, S.; Martelet, G.; Baghdadi, N.; Arrouays, D. Sentinel-2 and Sentinel-1 Bare Soil Temporal Mosaics of 6-Year Periods for Soil Organic Carbon Content Mapping in Central France. Remote Sens. 2023, 15, 2410. [Google Scholar] [CrossRef]
- Glinka, K.D. Dokuchaiev’s Ideas in the Development of Pedology and the Cognate Sciences; The Academy: Saint Petersburg, Russia, 1927. [Google Scholar]
- Gerasimov, I.P. VV Dokuchaev’s Doctrine of Natural Zones. Pochvovedenie 1946, 6, 353–360. [Google Scholar]
- Gregoryev, A.A.; Gerasimov, I.P. (Eds.) VV Dokuchaev and Geography; Academy of Science: Moscow, Russia, 1946. [Google Scholar]
- Simonson, R.W. Early Teaching in USA of Dokuchaiev Factors of Soil Formation. Soil Sci. Soc. Am. J. 1997, 61, 11–16. [Google Scholar] [CrossRef]
- Batjes, N.H. Total Carbon and Nitrogen in the Soils of the World. Eur. J. Soil Sci. 1996, 47, 151–163. [Google Scholar] [CrossRef]
- Poggio, L.; de Sousa, L.M.; Batjes, N.H.; Heuvelink, G.B.M.; Kempen, B.; Ribeiro, E.; Rossiter, D. SoilGrids 2.0: Producing Soil Information for the Globe with Quantified Spatial Uncertainty. SOIL 2021, 7, 217–240. [Google Scholar] [CrossRef]
- Martin, M.P.; Wattenbach, M.; Smith, P.; Meersmans, J.; Jolivet, C.; Boulonne, L.; Arrouays, D. Spatial Distribution of Soil Organic Carbon Stocks in France. Biogeosciences 2011, 8, 1053–1065. [Google Scholar] [CrossRef]
- Meersmans, J.; Martin, M.P.; De Ridder, F.; Lacarce, E.; Wetterlind, J.; De Baets, S.; Le Bas, C.; Louis, B.P.; Orton, T.G.; Bispo, A.; et al. A Novel Soil Organic C Model Using Climate, Soil Type and Management Data at the National Scale in France. Agron. Sustain. Dev. 2012, 32, 873–888. [Google Scholar] [CrossRef]
- Martin, M.P.; Orton, T.G.; Lacarce, E.; Meersmans, J.; Saby, N.P.A.; Paroissien, J.B.; Jolivet, C.; Boulonne, L.; Arrouays, D. Evaluation of Modelling Approaches for Predicting the Spatial Distribution of Soil Organic Carbon Stocks at the National Scale. Geoderma 2015, 223–225, 97–107. [Google Scholar] [CrossRef]
- Chen, S.; Arrouays, D.; Angers, D.A.; Chenu, C.; Barré, P.; Martin, M.P.; Saby, N.P.A.; Walter, C. National Estimation of Soil Organic Carbon Storage Potential for Arable Soils: A Data-Driven Approach Coupled with Carbon-Landscape Zones. Sci. Total Environ. 2019, 666, 355–367. [Google Scholar] [CrossRef]
- Grosset, Y.; Richer-de-Forges, A.C.; Demartini, J.; Saby, N.P.A.; Martin, M.P.; Meersmans, J.; Arrouays, D. Une Analyse Des Facteurs de Contrôle de La Distribution Des Teneurs En Carbone Des Horizons Superficiels Des Sols de Corse. Etude Gest. Sols 2011, 18, 247–258. [Google Scholar]
- Landré, A.; Cornu, S.; Meunier, J.-D.; Guerin, A.; Arrouays, D.; Caubet, M.; Ratié, C.; Saby, N.P.A. Do Climate and Land Use Affect the Pool of Total Silicon Concentration? A Digital Soil Mapping Approach of French Topsoils. Geoderma 2020, 364, 114175. [Google Scholar] [CrossRef]
- Le Bissonnais, Y.; Montier, C.; Jamagne, M.; Daroussin, J.; King, D. Mapping Erosion Risk for Cultivated Soil in France. CATENA 2002, 46, 207–220. [Google Scholar] [CrossRef]
- Arrouays, D.; Deslais, W.; Badeau, V. The Carbon Content of Topsoil and Its Geographical Distribution in France. Soil Use Manag. 2006, 17, 7–11. [Google Scholar] [CrossRef]
- Meersmans, J.; Martin, M.P.; Lacarce, E.; De Baets, S.; Jolivet, C.; Boulonne, L.; Lehmann, S.; Saby, N.P.A.; Bispo, A.; Arrouays, D. A High Resolution Map of French Soil Organic Carbon. Agron. Sustain. Dev. 2012, 32, 841–851. [Google Scholar] [CrossRef]
- Mulder, V.L.; Lacoste, M.; Richer-de-Forges, A.C.; Arrouays, D. GlobalSoilMap France: High-Resolution Spatial Modelling the Soils of France up to Two Meter Depth. Sci. Total Environ. 2016, 573, 1352–1369. [Google Scholar] [CrossRef]
- Chen, S.; Martin, M.P.; Saby, N.P.A.; Walter, C.; Angers, D.A.; Arrouays, D. Fine Resolution Map of Top- and Subsoil Carbon Sequestration Potential in France. Sci. Total Environ. 2018, 630, 389–400. [Google Scholar] [CrossRef]
- Chen, S.; Arrouays, D.; Angers, D.A.; Martin, M.P.; Walter, C. Soil Carbon Stocks under Different Land Uses and the Applicability of the Soil Carbon Saturation Concept. Soil Tillage Res. 2019, 188, 53–58. [Google Scholar] [CrossRef]
- Villanneau, E.J.; Saby, N.P.A.; Orton, T.G.; Jolivet, C.C.; Boulonne, L.; Caria, G.; Barriuso, E.; Bispo, A.; Briand, O.; Arrouays, D. First Evidence of Large-Scale PAH Trends in French Soils. Environ. Chem. Lett. 2013, 11, 99–104. [Google Scholar] [CrossRef]
- Froger, C.; Quantin, C.; Bordier, L.; Monvoisin, G.; Evrard, O.; Ayrault, S. Quantification of Spatial and Temporal Variations in Trace Element Fluxes Originating from Urban Areas at the Catchment Scale. J. Soils Sediments 2020, 20, 4055–4069. [Google Scholar] [CrossRef]
- Froger, C.; Saby, N.P.A.; Jolivet, C.C.; Boulonne, L.; Caria, G.; Freulon, X.; de Fouquet, C.; Roussel, H.; Marot, F.; Bispo, A. Spatial Variations, Origins, and Risk Assessments of Polycyclic Aromatic Hydrocarbons in French Soils. SOIL 2021, 7, 161–178. [Google Scholar] [CrossRef]
- Mathieu, R.; King, C.; Le Bissonnais, Y. Contribution of Multi-Temporal SPOT Data to the Mapping of a Soil Erosion Index. The Case of the Loamy Plateaux of Northern France. Soil Technol. 1997, 10, 99–110. [Google Scholar] [CrossRef]
- Souchère, V.; King, C.; Dubreuil, N.; Lecomte-Morel, V.; Le Bissonnais, Y.; Chalat, M. Grassland and Crop Trends: Role of the European Union Common Agricultural Policy and Consequences for Runoff and Soil Erosion. Environ. Sci. Policy 2003, 6, 7–16. [Google Scholar] [CrossRef]
- Souchère, V.; Cerdan, O.; Ludwig, B.; Le Bissonnais, Y.; Couturier, A.; Papy, F. Modelling Ephemeral Gully Erosion in Small Cultivated Catchments. CATENA 2003, 50, 489–505. [Google Scholar] [CrossRef]
- Courault, D.; Bertuzzi, P.; Girard, M.-C. Monitoring Surface Changes of Bare Soils Due to Slaking Using Spectral Measurements. Soil Sci. Soc. Am. J. 1993, 57, 1595–1601. [Google Scholar] [CrossRef]
- Hill, J.; Mégier, J.; Mehl, W. Land Degradation, Soil Erosion and Desertification Monitoring in Mediterranean Ecosystems. Remote Sens. Rev. 1995, 12, 107–130. [Google Scholar] [CrossRef]
- Cerdan, O.; Bissonnais, Y.L.; Souchère, V.; Martin, P.; Lecomte, V. Sediment Concentration in Interrill Flow: Interactions between Soil Surface Conditions, Vegetation and Rainfall. Earth Surf. Process. Landf. 2002, 27, 193–205. [Google Scholar] [CrossRef]
- Cerdan, O.; Le Bissonnais, Y.; Couturier, A.; Saby, N. Modelling Interrill Erosion in Small Cultivated Catchments. Hydrol. Process. 2002, 16, 3215–3226. [Google Scholar] [CrossRef]
- Chen, S.; Richer-de-Forges, A.C.; Leatitia Mulder, V.; Martelet, G.; Loiseau, T.; Lehmann, S.; Arrouays, D. Digital Mapping of the Soil Thickness of Loess Deposits over a Calcareous Bedrock in Central France. CATENA 2021, 198, 105062. [Google Scholar] [CrossRef]
- Myneni, R.B.; Hall, F.G.; Sellers, P.J.; Marshak, A.L. The Interpretation of Spectral Vegetation Indexes. IEEE Trans. Geosci. Remote Sens. 1995, 33, 481–486. [Google Scholar] [CrossRef]
- Seguin, B.; Itier, B. Using Midday Surface Temperature to Estimate Daily Evaporation from Satellite Thermal IR Data. Int. J. Remote Sens. 1983, 4, 371–383. [Google Scholar] [CrossRef]
- Courault, D.; Lagouarde, J.P.; Aloui, B. Evaporation for Maritime Catchment Combining a Meteorological Model with Vegetation Information and Airborne Surface Temperatures. Agric. For. Meteorol. 1996, 82, 93–117. [Google Scholar] [CrossRef]
- Delogu, E.; Olioso, A.; Alliès, A.; Demarty, J.; Boulet, G. Evaluation of Multiple Methods for the Production of Continuous Evapotranspiration Estimates from TIR Remote Sensing. Remote Sens. 2021, 13, 1086. [Google Scholar] [CrossRef]
- Román Dobarco, M.; Bourennane, H.; Arrouays, D.; Saby, N.P.A.; Cousin, I.; Martin, M.P. Uncertainty Assessment of GlobalSoilMap Soil Available Water Capacity Products: A French Case Study. Geoderma 2019, 344, 14–39. [Google Scholar] [CrossRef]
- Richer-de-Forges, A.C.; Arrouays, D.; Chen, S.; Román Dobarco, M.; Libohova, Z.; Roudier, P.; Minasny, B.; Bourennane, H. Hand-Feel Soil Texture and Particle-Size Distribution in Central France. Relationships and Implications. CATENA 2022, 213, 106155. [Google Scholar] [CrossRef]
- Varella, H.; Guérif, M.; Buis, S.; Beaudoin, N. Soil Properties Estimation by Inversion of a Crop Model and Observations on Crops Improves the Prediction of Agro-Environmental Variables. Eur. J. Agron. 2010, 33, 139–147. [Google Scholar] [CrossRef]
- Ferrant, S.; Bustillo, V.; Burel, E.; Salmon-Monviola, J.; Claverie, M.; Jarosz, N.; Yin, T.; Rivalland, V.; Dedieu, G.; Demarez, V.; et al. Extracting Soil Water Holding Capacity Parameters of a Distributed Agro-Hydrological Model from High Resolution Optical Satellite Observations Series. Remote Sens. 2016, 8, 154. [Google Scholar] [CrossRef]
- Dewaele, H.; Munier, S.; Albergel, C.; Planque, C.; Laanaia, N.; Carrer, D.; Calvet, J.-C. Parameter Optimisation for a Better Representation of Drought by LSMs: Inverse Modelling vs. Sequential Data Assimilation. Hydrol. Earth Syst. Sci. 2017, 21, 4861–4878. [Google Scholar] [CrossRef]
- Lagacherie, P.; Bailly, J.S.; Monestiez, P.; Gomez, C. Using Scattered Hyperspectral Imagery Data to Map the Soil Properties of a Region. Eur. J. Soil Sci. 2012, 63, 110–119. [Google Scholar] [CrossRef]
- Walker, E.; Monestiez, P.; Gomez, C.; Lagacherie, P. Combining Measured Sites, Soilscapes Map and Soil Sensing for Mapping Soil Properties of a Region. Geoderma 2017, 300, 64–73. [Google Scholar] [CrossRef]
- Alkassem, M.; Buis, S.; Coulouma, G.; Jacob, F.; Lagacherie, P.; Prevot, L. Estimating Soil Available Water Capacity within a Mediterranean Vineyard Watershed Using Satellite Imagery and Crop Model Inversion. Geoderma 2022, 425, 116081. [Google Scholar] [CrossRef]
- Cousin, I.; Buis, S.; Lagacherie, P.; Doussan, C.; Le Bas, C.; Guérif, M. Available Water Capacity from a Multidisciplinary and Multiscale Viewpoint. A Review. Agron. Sustain. Dev. 2022, 42, 46. [Google Scholar] [CrossRef]
- Arrouays, D.; Grundy, M.G.; Hartemink, A.E.; Hempel, J.W.; Heuvelink, G.B.M.; Hong, S.Y.; Lagacherie, P.; Lelyk, G.; McBratney, A.B.; McKenzie, N.J.; et al. GlobalSoilMap: Toward a fine-resolution global grid of soil properties. Adv. Agron. 2014, 125, 93–134. [Google Scholar]
- Sanchez, P.A.; Ahamed, S.; Carre, F.; Hartemink, A.E.; Hempel, J.; Huising, J.; Lagacherie, P.; McBratney, A.B.; McKenzie, N.J.; Mendonca-Santos, M.d.L.; et al. Digital soil map of the world. Science 2009, 325, 680681. [Google Scholar] [CrossRef]
- Saez, J.L.; Corona, C.; Stoffel, M.; Rovéra, G.; Astrade, L.; Berger, F. Mapping of Erosion Rates in Marly Badlands Based on a Coupling of Anatomical Changes in Exposed Roots with Slope Maps Derived from LiDAR Data: Dendrogeomorphic Quantification of Erosion Rates in Marly Badlands. Earth Surf. Process. Landf. 2011, 36, 1162–1171. [Google Scholar] [CrossRef]
- Bretar, F.; Chauve, A.; Bailly, J.-S.; Mallet, C.; Jacome, A. Terrain Surfaces and 3-D Landcover Classification from Small Footprint Full-Waveform Lidar Data: Application to Badlands. Hydrol. Earth Syst. Sci. 2009, 13, 1531–1544. [Google Scholar] [CrossRef]
- Vaysse, K.; Lagacherie, P. Using Quantile Regression Forest to Estimate Uncertainty of Digital Soil Mapping Products. Geoderma 2017, 291, 55–64. [Google Scholar] [CrossRef]
- Zaouche, M.; Bel, L.; Vaudour, E. Geostatistical Mapping of Topsoil Organic Carbon and Uncertainty Assessment in Western Paris Croplands (France). Geoderma Reg. 2017, 10, 126–137. [Google Scholar] [CrossRef]
- Bourennane, H.; King, D.; Chéry, P.; Bruand, A. Improving the Kriging of a Soil Variable Using Slope Gradient as External Drift. Eur. J. Soil Sci. 1996, 47, 473–483. [Google Scholar] [CrossRef]
- Bourennane, H.; King, D. Using Multiple External Drifts to Estimate a Soil Variable. Geoderma 2003, 114, 1–18. [Google Scholar] [CrossRef]
- Martins, B.H.; Suzuki, M.; Yastika, P.E.; Shimizu, N. Ground Surface Deformation Detection in Complex Landslide Area—Bobonaro, Timor-Leste—Using SBAS DInSAR, UAV Photogrammetry, and Field Observations. Geosciences 2020, 10, 245. [Google Scholar] [CrossRef]
- Ghorbanzadeh, O.; Didehban, K.; Rasouli, H.; Kamran, K.; Feizizadeh, B.; Blaschke, T. An Application of Sentinel-1, Sentinel-2, and GNSS Data for Landslide Susceptibility Mapping. ISPRS Int. J. Geo-Inf. 2020, 9, 561. [Google Scholar] [CrossRef]
- te Brake, B.; Hanssen, R.F.; van der Ploeg, M.J.; de Rooij, G.H. Satellite-Based Radar Interferometry to Estimate Large-Scale Soil Water Depletion from Clay Shrinkage: Possibilities and Limitations. Vadose Zone J. 2013, 12, 1–13. [Google Scholar] [CrossRef]
- Deffontaines, B.; Kaveh, F.; Fruneau, B.; Arnaud, A.; Duro, J. Monitoring Swelling Soils in Eastern Paris (France) Through DinSAR and PSI Interferometry: A Synthesis. In Engineering Geology for Society and Territory—Volume 5; Lollino, G., Manconi, A., Guzzetti, F., Culshaw, M., Bobrowsky, P., Luino, F., Eds.; Springer International Publishing: Cham, Switzerland, 2015; pp. 195–202. ISBN 978-3-319-09047-4. [Google Scholar]
- MacMillan, R.A.; Jones, R.K.; McNabb, D.H. Defining a Hierarchy of Spatial Entities for Environmental Analysis and Modeling Using Digital Elevation Models (DEMs). Comput. Environ. Urban Syst. 2004, 28, 175–200. [Google Scholar] [CrossRef]
- Dobos, E.; Daroussin, J.; Montanarella, L. An SRTM-Based Procedure to Delineate SOTER Terrain Units on 1:1 and 1:5 Million Scales; Office for Official Publications of the European Communities: Luxembourg, 2005. [Google Scholar]
- Institute for Environment and Sustainability (European Commission. Joint Research Centre). Developments in Soil Science. In Geomorphometry: Concepts, Software, Applications, 1st ed.; Hengl, T., Reuter, H.I., Eds.; Elsevier: Amsterdam, The Netherlands, 2009; ISBN 978-0-12-374345-9. [Google Scholar]
- Minár, J.; Evans, I.S. Elementary Forms for Land Surface Segmentation: The Theoretical Basis of Terrain Analysis and Geomorphological Mapping. Geomorphology 2008, 95, 236–259. [Google Scholar] [CrossRef]
- Martelet, G.; Truffert, C.; Tourliere, B.; Ledru, P.; Perrin, J. Classifying Airborne Radiometry Data with Agglomerative Hierarchical Clustering: A Tool for Geological Mapping in Context of Rainforest (French Guiana). Int. J. Appl. Earth Obs. Geoinf. 2006, 8, 208–223. [Google Scholar] [CrossRef]
- Coulouma, G.; Caner, L.; Loonstra, E.H.; Lagacherie, P. Analysing the Proximal Gamma Radiometry in Contrasting Mediterranean Landscapes: Towards a Regional Prediction of Clay Content. Geoderma 2016, 266, 127–135. [Google Scholar] [CrossRef]
- Tissoux, H.; Prognon, F.; Martelet, G.; Tourlière, B.; Despriée, J.; Liard, M.; Lacquement, F. Contribution de la spectrométrie gamma aéroportée à la caractérisation et à la cartographie des dépôts silico-clastiques fluviatiles dans le val de loire et en sologne (Centre, France). Quaternaire 2017, 28, 87–103. [Google Scholar] [CrossRef]
- Loiseau, T.; Richer-de-Forges, A.C.; Martelet, G.; Bialkowski, A.; Nehlig, P.; Arrouays, D. Could Airborne Gamma-Spectrometric Data Replace Lithological Maps as Co-Variates for Digital Soil Mapping of Topsoil Particle-Size Distribution? A Case Study in Western France. Geoderma Reg. 2020, 22, e00295. [Google Scholar] [CrossRef]
- Launeau, P.; Girardeau, J.; Sotin, C.; Tubia, J. Comparison between Field Measurements and Airborne Visible and Infrared Mapping Spectrometry (AVIRIS and HyMap) of the Ronda Peridotite Massif (South-West Spain). Int. J. Remote Sens. 2004, 25, 2773–2792. [Google Scholar] [CrossRef]
- Tyler, A.N.; Sanderson, D.C.W.; Scott, E.M. Estimating and Accounting for 137Cs Source Burial through In-Situ Gamma Spectrometry in Salt Marsh Environments. J. Environ. Radioact. 1996, 33, 195–212. [Google Scholar] [CrossRef]
- Wakefield, R.; Tyler, A.N.; McDonald, P.; Atkin, P.A.; Gleizon, P.; Gilvear, D. Estimating Sediment and Caesium-137 Fluxes in the Ribble Estuary through Time-Series Airborne Remote Sensing. J. Environ. Radioact. 2011, 102, 252–261. [Google Scholar] [CrossRef] [PubMed]
- Bégué, A.; Arvor, D.; Bellon, B.; Betbeder, J.; de Abelleyra, D.; Ferraz, R.; Lebourgeois, V.; Lelong, C.; Simoes, M.; Veron, S. Remote Sensing and Cropping Practices: A Review. Remote Sens. 2018, 10, 99. [Google Scholar] [CrossRef]
- Bégué, A.; Arvor, D.; Lelong, C.; Vintrou, E.; Simoes, M. Agricultural Systems Studies Using Remote Sensing. In Remote Sensing Handbook. Vol. II: Land Resources: Monitoring, Modeling, and Mapping; Thenkabail, P.S., Ed.; CRC Press: Boca Raton, FL, USA; Taylor and Francis Group: London, UK; New York, NY, USA, 2015; pp. 113–130. [Google Scholar]
- d’Andrimont, R.; Verhegghen, A.; Lemoine, G.; Kempeneers, P.; Meroni, M.; van der Velde, M. From Parcel to Continental Scale—A First European Crop Type Map Based on Sentinel-1 and LUCAS Copernicus in-Situ Observations. Remote Sens. Environ. 2021, 266, 112708. [Google Scholar] [CrossRef]
- Ghassemi, B.; Dujakovic, A.; Żółtak, M.; Immitzer, M.; Atzberger, C.; Vuolo, F. Designing a European-Wide Crop Type Mapping Approach Based on Machine Learning Algorithms Using LUCAS Field Survey and Sentinel-2 Data. Remote Sens. 2022, 14, 541. [Google Scholar] [CrossRef]
- Soussana, J.-F.; Loiseau, P.; Vuichard, N.; Ceschia, E.; Balesdent, J.; Chevallier, T.; Arrouays, D. Carbon Cycling and Sequestration Opportunities in Temperate Grasslands. Soil Use Manag. 2006, 20, 219–230. [Google Scholar] [CrossRef]
- Bailly, J.S.; Lagacherie, P.; Millier, C.; Puech, C.; Kosuth, P. Agrarian Landscapes Linear Features Detection from LiDAR: Application to Artificial Drainage Networks. Int. J. Remote Sens. 2008, 29, 3489–3508. [Google Scholar] [CrossRef]
- Bellón, B.; Bégué, A.; Lo Seen, D.; de Almeida, C.; Simões, M. A Remote Sensing Approach for Regional-Scale Mapping of Agricultural Land-Use Systems Based on NDVI Time Series. Remote Sens. 2017, 9, 600. [Google Scholar] [CrossRef]
- Richer-de-Forges, A.C.; Arrouays, D.; Bardy, M.; Bispo, A.; Lagacherie, P.; Laroche, B.; Lemercier, B.; Sauter, J.; Voltz, M. Mapping of Soils and Land-Related Environmental Attributes in France: Analysis of End-Users’ Needs. Sustainability 2019, 11, 2940. [Google Scholar] [CrossRef]
- Arrouays, D.; Mulder, V.L.; Richer-de-Forges, A.C. Soil Mapping, Digital Soil Mapping and Soil Monitoring over Large Areas and the Dimensions of Soil Security—A Review. Soil Secur. 2021, 5, 100018. [Google Scholar] [CrossRef]
- Minasny, B.; McBratney, A.B. A Conditioned Latin Hypercube Method for Sampling in the Presence of Ancillary Information. Comput. Geosci. 2006, 32, 1378–1388. [Google Scholar] [CrossRef]
- Roudier, P.; Hewitt, A.; Beaudette, D.E. A Conditioned Latin Hypercube Sampling Algorithm Incorporating Operational Constraints. In Digital Soil Assessments and Beyond: Proceedings of the 5th Global Workshop on Digital Soil Mapping 2012, Sydney, Australia; McBratney, A., Ed.; CRC Press: Boca Raton, FL, USA, 2012; ISBN 978-0-415-62155-7. [Google Scholar]
- Jourdan, A.; Franco, J. Optimal Latin Hypercube Designs for the Kullback–Leibler Criterion. AStA Adv. Stat. Anal. 2010, 94, 341–351. [Google Scholar] [CrossRef]
- Mulder, V.L.; de Bruin, S.; Schaepman, M.E. Representing Major Soil Variability at Regional Scale by Constrained Latin Hypercube Sampling of Remote Sensing Data. Int. J. Appl. Earth Obs. Geoinf. 2013, 21, 301–310. [Google Scholar] [CrossRef]
- Wadoux, A.M.J.-C.; Brus, D.J.; Heuvelink, G.B.M. Sampling Design Optimization for Soil Mapping with Random Forest. Geoderma 2019, 355, 113913. [Google Scholar] [CrossRef]
- Orgiazzi, A.; Ballabio, C.; Panagos, P.; Jones, A.; Fernández-Ugalde, O. LUCAS Soil, the Largest Expandable Soil Dataset for Europe: A Review. Eur. J. Soil Sci. 2018, 69, 140–153. [Google Scholar] [CrossRef]
- Casa, R.; Castaldi, F.; Pascucci, S.; Palombo, A.; Pignatti, S. A Comparison of Sensor Resolution and Calibration Strategies for Soil Texture Estimation from Hyperspectral Remote Sensing. Geoderma 2013, 197–198, 17–26. [Google Scholar] [CrossRef]
- Gomez, C.; Oltra-Carrio, R.; Bacha, S.; Lagacherie, P.; Briottet, X. Evaluating the Sensitivity of Clay Content Prediction to Atmospheric Effects and Degradation of Image Spatial Resolution Using Hyperspectral VNIR/SWIR Imagery. Remote Sens. Environ. 2015, 164, 1–15. [Google Scholar] [CrossRef]
- Gholizadeh, A.; Žižala, D.; Saberioon, M.; Borůvka, L. Soil Organic Carbon and Texture Retrieving and Mapping Using Proximal, Airborne and Sentinel-2 Spectral Imaging. Remote Sens. Environ. 2018, 218, 89–103. [Google Scholar] [CrossRef]
- Bityukova, L.; Scholger, R.; Birke, M. Magnetic Susceptibility as Indicator of Environmental Pollution of Soils in Tallinn. Phys. Chem. Earth Part Solid Earth Geod. 1999, 24, 829–835. [Google Scholar] [CrossRef]
- Blaha, U.; Appel, E.; Stanjek, H. Determination of Anthropogenic Boundary Depth in Industrially Polluted Soil and Semi-Quantification of Heavy Metal Loads Using Magnetic Susceptibility. Environ. Pollut. 2008, 156, 278–289. [Google Scholar] [CrossRef] [PubMed]
- Declercq, Y.; Samson, R.; Castanheiro, A.; Spassov, S.; Tack, F.M.G.; Van De Vijver, E.; De Smedt, P. Evaluating the Potential of Topsoil Magnetic Pollution Mapping across Different Land Use Classes. Sci. Total Environ. 2019, 685, 345–356. [Google Scholar] [CrossRef] [PubMed]
- Fialová, H.; Maier, G.; Petrovský, E.; Kapička, A.; Boyko, T.; Scholger, R. Magnetic Properties of Soils from Sites with Different Geological and Environmental Settings. J. Appl. Geophys. 2006, 59, 273–283. [Google Scholar] [CrossRef]
- Hanesch, M.; Scholger, R. The Influence of Soil Type on the Magnetic Susceptibility Measured throughout Soil Profiles. Geophys. J. Int. 2005, 161, 50–56. [Google Scholar] [CrossRef]
- Hanesch, M.; Rantitsch, G.; Hemetsberger, S.; Scholger, R. Lithological and Pedological Influences on the Magnetic Susceptibility of Soil: Their Consideration in Magnetic Pollution Mapping. Sci. Total Environ. 2007, 382, 351–363. [Google Scholar] [CrossRef]
- Ellili-Bargaoui, Y.; Malone, B.P.; Michot, D.; Minasny, B.; Vincent, S.; Walter, C.; Lemercier, B. Comparing Three Approaches of Spatial Disaggregation of Legacy Soil Maps Based on the Disaggregation and Harmonisation of Soil Map Units Through Resampled Classification Trees (DSMART) Algorithm. SOIL 2020, 6, 371–388. [Google Scholar] [CrossRef]
- Häring, T.; Dietz, E.; Osenstetter, S.; Koschitzki, T.; Schröder, B. Spatial Disaggregation of Complex Soil Map Units: A Decision-Tree Based Approach in Bavarian Forest Soils. Geoderma 2012, 185–186, 37–47. [Google Scholar] [CrossRef]
- Odgers, N.P.; Sun, W.; McBratney, A.B.; Minasny, B.; Clifford, D. Disaggregating and Harmonising Soil Map Units through Resampled Classification Trees. Geoderma 2014, 214–215, 91–100. [Google Scholar] [CrossRef]
- Ellili-Bargaoui, Y.; Walter, C.; Michot, D.; Lemercier, B. Mapping Soil Properties at Multiple Depths from Disaggregated Legacy Soil Maps in the Brittany Region, France. Geoderma Reg. 2020, 23, e00342. [Google Scholar] [CrossRef]
- Padarian, J.; Stockmann, U.; Minasny, B.; McBratney, A.B. Monitoring Changes in Global Soil Organic Carbon Stocks from Space. Remote Sens. Environ. 2022, 281, 113260. [Google Scholar] [CrossRef]
- Viscarra Rossel, R.A.; Hicks, W.S. Soil Organic Carbon and Its Fractions Estimated by Visible-near Infrared Transfer Functions: Vis-NIR Estimates of Organic Carbon and Its Fractions. Eur. J. Soil Sci. 2015, 66, 438–450. [Google Scholar] [CrossRef]
- Baldock, J.A.; Hawke, B.; Sanderman, J.; Macdonald, L.M. Predicting Contents of Carbon and Its Component Fractions in Australian Soils from Diffuse Reflectance Mid-Infrared Spectra. Soil Res. 2013, 51, 577. [Google Scholar] [CrossRef]
- Nocita, M.; Stevens, A.; Van Wesemael, B.; Aitkenhead, M.; Bachmann, M.; Barthès, B.; Ben Dor, E.; Brown, D.J.; Clairotte, M.; Csorba, A.; et al. Soil Spectroscopy: An Alternative to Wet Chemistry for Soil Monitoring. In Advances in Agronomy; Elsevier: Amsterdam, The Netherlands, 2015; Volume 132, pp. 139–159. ISBN 978-0-12-802135-4. [Google Scholar]
- Gallo, B.; Demattê, J.; Rizzo, R.; Safanelli, J.; Mendes, W.; Lepsch, I.; Sato, M.; Romero, D.; Lacerda, M. Multi-Temporal Satellite Images on Topsoil Attribute Quantification and the Relationship with Soil Classes and Geology. Remote Sens. 2018, 10, 1571. [Google Scholar] [CrossRef]
- Drusch, M.; Del Bello, U.; Carlier, S.; Colin, O.; Fernandez, V.; Gascon, F.; Hoersch, B.; Isola, C.; Laberinti, P.; Martimort, P.; et al. Sentinel-2: ESA’s Optical High-Resolution Mission for GMES Operational Services. Remote Sens. Environ. 2012, 120, 25–36. [Google Scholar] [CrossRef]
- Castaldi, F.; Palombo, A.; Santini, F.; Pascucci, S.; Pignatti, S.; Casa, R. Evaluation of the Potential of the Current and Forthcoming Multispectral and Hyperspectral Imagers to Estimate Soil Texture and Organic Carbon. Remote Sens. Environ. 2016, 179, 54–65. [Google Scholar] [CrossRef]
- Adeline, K.R.M.; Gomez, C.; Gorretta, N.; Roger, J.-M. Predictive Ability of Soil Properties to Spectral Degradation from Laboratory Vis-NIR Spectroscopy Data. Geoderma 2017, 288, 143–153. [Google Scholar] [CrossRef]
- Gomez, C.; Adeline, K.; Bacha, S.; Driessen, B.; Gorretta, N.; Lagacherie, P.; Roger, J.M.; Briottet, X. Sensitivity of Clay Content Prediction to Spectral Configuration of VNIR/SWIR Imaging Data, from Multispectral to Hyperspectral Scenarios. Remote Sens. Environ. 2018, 204, 18–30. [Google Scholar] [CrossRef]
- Ben-Dor, E.; Patkin, K.; Banin, A.; Karnieli, A. Mapping of Several Soil Properties Using DAIS-7915 Hyperspectral Scanner Data—A Case Study over Clayey Soils in Israel. Int. J. Remote Sens. 2002, 23, 1043–1062. [Google Scholar] [CrossRef]
- Mandal, A.; Majumder, A.; Dhaliwal, S.S.; Toor, A.S.; Mani, P.K.; Naresh, R.K.; Gupta, R.K.; Mitran, T. Impact of Agricultural Management Practices on Soil Carbon Sequestration and Its Monitoring through Simulation Models and Remote Sensing Techniques: A Review. Crit. Rev. Environ. Sci. Technol. 2022, 52, 1–49. [Google Scholar] [CrossRef]
- Bannari, A.; Pacheco, A.; Staenz, K.; McNairn, H.; Omari, K. Estimating and Mapping Crop Residues Cover on Agricultural Lands Using Hyperspectral and IKONOS Data. Remote Sens. Environ. 2006, 104, 447–459. [Google Scholar] [CrossRef]
- Defourny, P.; Bontemps, S.; Bellemans, N.; Cara, C.; Dedieu, G.; Guzzonato, E.; Hagolle, O.; Inglada, J.; Nicola, L.; Rabaute, T.; et al. Near Real-Time Agriculture Monitoring at National Scale at Parcel Resolution: Performance Assessment of the Sen2-Agri Automated System in Various Cropping Systems around the World. Remote Sens. Environ. 2019, 221, 551–568. [Google Scholar] [CrossRef]
- Gomez, C.; Dharumarajan, S.; Lagacherie, P.; Riotte, J.; Ferrant, S.; Sekhar, M.; Ruiz, L. Mapping of Tank Silt Application Using Sentinel-2 Images over the Berambadi Catchment (India). Geoderma Reg. 2021, 25, e00389. [Google Scholar] [CrossRef]
- Diek, S.; Schaepman, M.; de Jong, R. Creating Multi-Temporal Composites of Airborne Imaging Spectroscopy Data in Support of Digital Soil Mapping. Remote Sens. 2016, 8, 906. [Google Scholar] [CrossRef]
- Gasmi, A.; Gomez, C.; Lagacherie, P.; Zouari, H.; Laamrani, A.; Chehbouni, G. Mean Spectral Reflectance from Bare Soil Pixels along a Landsat-TM Time Series to Increase Both the Prediction Accuracy of Soil Clay Content and Mapping Coverage. Geoderma 2021, 388, 114864. [Google Scholar] [CrossRef]
- Benninga, H.-J.F.; van der Velde, R.; Su, Z. Soil Moisture Content Retrieval over Meadows from Sentinel-1 and Sentinel-2 Data Using Physically Based Scattering Models. Remote Sens. Environ. 2022, 280, 113191. [Google Scholar] [CrossRef]
- Amazirh, A.; Merlin, O.; Er-Raki, S.; Gao, Q.; Rivalland, V.; Malbeteau, Y.; Khabba, S.; Escorihuela, M. Retrieving Surface Soil Moisture at High Spatio-Temporal Resolution from a Synergy between Sentinel-1 Radar and Landsat Thermal Data: A Study Case over Bare Soil. Remote Sens. Environ. 2018, 211, 321–337. [Google Scholar] [CrossRef]
- Ojha, N.; Merlin, O.; Molero, B.; Suere, C.; Olivera-Guerra, L.; Hssaine, B.; Amazirh, A.; Al Bitar, A.; Escorihuela, M.; Er-Raki, S. Stepwise Disaggregation of SMAP Soil Moisture at 100 m Resolution Using Landsat-7/8 Data and a Varying Intermediate Resolution. Remote Sens. 2019, 11, 1863. [Google Scholar] [CrossRef]
- Ojha, N.; Merlin, O.; Suere, C.; Escorihuela, M.J. Extending the Spatio-Temporal Applicability of DISPATCH Soil Moisture Downscaling Algorithm: A Study Case Using SMAP, MODIS and Sentinel-3 Data. Front. Environ. Sci. 2021, 9, 555216. [Google Scholar] [CrossRef]
- Sabaghy, S.; Walker, J.P.; Renzullo, L.J.; Akbar, R.; Chan, S.; Chaubell, J.; Das, N.; Dunbar, R.S.; Entekhabi, D.; Gevaert, A.; et al. Comprehensive Analysis of Alternative Downscaled Soil Moisture Products. Remote Sens. Environ. 2020, 239, 111586. [Google Scholar] [CrossRef]
- Loizzo, R.; Guarini, R.; Longo, F.; Scopa, T.; Formaro, R.; Facchinetti, C.; Varacalli, G. Prisma: The Italian Hyperspectral Mission. In Proceedings of the IGARSS 2018—2018 IEEE International Geoscience and Remote Sensing Symposium, Valencia, Spain, 22–27 July 2018; pp. 175–178. [Google Scholar]
- Gasmi, A.; Gomez, C.; Chehbouni, A.; Dhiba, D.; El Gharous, M. Using PRISMA Hyperspectral Satellite Imagery and GIS Approaches for Soil Fertility Mapping (FertiMap) in Northern Morocco. Remote Sens. 2022, 14, 4080. [Google Scholar] [CrossRef]
- Guanter, L.; Kaufmann, H.; Segl, K.; Foerster, S.; Rogass, C.; Chabrillat, S.; Kuester, T.; Hollstein, A.; Rossner, G.; Chlebek, C.; et al. The EnMAP Spaceborne Imaging Spectroscopy Mission for Earth Observation. Remote Sens. 2015, 7, 8830–8857. [Google Scholar] [CrossRef]
- Matsunaga, T.; Iwasaki, A.; Tsuchida, S.; Iwao, K.; Nakamura, R.; Yamamoto, H.; Kato, S.; Obata, K.; Kashimura, O.; Tanii, J.; et al. Hisui Status Toward FY2019 Launch. In Proceedings of the IGARSS 2018—2018 IEEE International Geoscience and Remote Sensing Symposium, Valencia, Spain, 22–27 July 2018; pp. 160–163. [Google Scholar]
- Ben-Dor, E.; Kafri, A.; Varacalli, G. SHALOM: An Italian–Israeli Hyperspectral Orbital Mission—Update. In Proceedings of the International Geoscience and Remote Sensing Symposium, Quebec, QC, Canada, 13–18 July 2014. [Google Scholar]
- Lee, C.M.; Cable, M.L.; Hook, S.J.; Green, R.O.; Ustin, S.L.; Mandl, D.J.; Middleton, E.M. An Introduction to the NASA Hyperspectral InfraRed Imager (HyspIRI) Mission and Preparatory Activities. Remote Sens. Environ. 2015, 167, 6–19. [Google Scholar] [CrossRef]
- Hook, S.J.; Green, R.O. MASTER: HyspIRI Airborne Campaign, Western USA, Summer 2018. 2022. Available online: https://daac.ornl.gov/MASTER/guides/MASTER_HyspIRI_Summer_2018.html (accessed on 29 May 2023).
- Gascon, F.; Rast, M.; Celesti, M.; Bogaarts, C.; Nieke, J. Chime: A Copernicus Hyperspectral Imaging Mission for the Environment. Rev. Française Photogrammétrie Télédétection 2022, 224, 5–8. [Google Scholar] [CrossRef]


Disclaimer/Publisher’s Note: The statements, opinions and data contained in all publications are solely those of the individual author(s) and contributor(s) and not of MDPI and/or the editor(s). MDPI and/or the editor(s) disclaim responsibility for any injury to people or property resulting from any ideas, methods, instructions or products referred to in the content. |
© 2023 by the authors. Licensee MDPI, Basel, Switzerland. This article is an open access article distributed under the terms and conditions of the Creative Commons Attribution (CC BY) license (https://creativecommons.org/licenses/by/4.0/).
Share and Cite
Richer-de-Forges, A.C.; Chen, Q.; Baghdadi, N.; Chen, S.; Gomez, C.; Jacquemoud, S.; Martelet, G.; Mulder, V.L.; Urbina-Salazar, D.; Vaudour, E.; et al. Remote Sensing Data for Digital Soil Mapping in French Research—A Review. Remote Sens. 2023, 15, 3070. https://doi.org/10.3390/rs15123070
Richer-de-Forges AC, Chen Q, Baghdadi N, Chen S, Gomez C, Jacquemoud S, Martelet G, Mulder VL, Urbina-Salazar D, Vaudour E, et al. Remote Sensing Data for Digital Soil Mapping in French Research—A Review. Remote Sensing. 2023; 15(12):3070. https://doi.org/10.3390/rs15123070
Chicago/Turabian StyleRicher-de-Forges, Anne C., Qianqian Chen, Nicolas Baghdadi, Songchao Chen, Cécile Gomez, Stéphane Jacquemoud, Guillaume Martelet, Vera L. Mulder, Diego Urbina-Salazar, Emmanuelle Vaudour, and et al. 2023. "Remote Sensing Data for Digital Soil Mapping in French Research—A Review" Remote Sensing 15, no. 12: 3070. https://doi.org/10.3390/rs15123070
APA StyleRicher-de-Forges, A. C., Chen, Q., Baghdadi, N., Chen, S., Gomez, C., Jacquemoud, S., Martelet, G., Mulder, V. L., Urbina-Salazar, D., Vaudour, E., Weiss, M., Wigneron, J.-P., & Arrouays, D. (2023). Remote Sensing Data for Digital Soil Mapping in French Research—A Review. Remote Sensing, 15(12), 3070. https://doi.org/10.3390/rs15123070