
Analysis of the Characteristics and Ideas of Ancient Urban Land-Use Based on GIS and an Algorithm: A Case Study of Chang’an City in the Sui and Tang Dynasties


Abstract
:
1. Introduction
1.1. The Extraction and Quantitative Analysis of Data on Ancient Urban Land Use
1.2. The Intelligent Exploration and Interpretation of Planning Ideas Based on Land Use Characteristics
2. Background
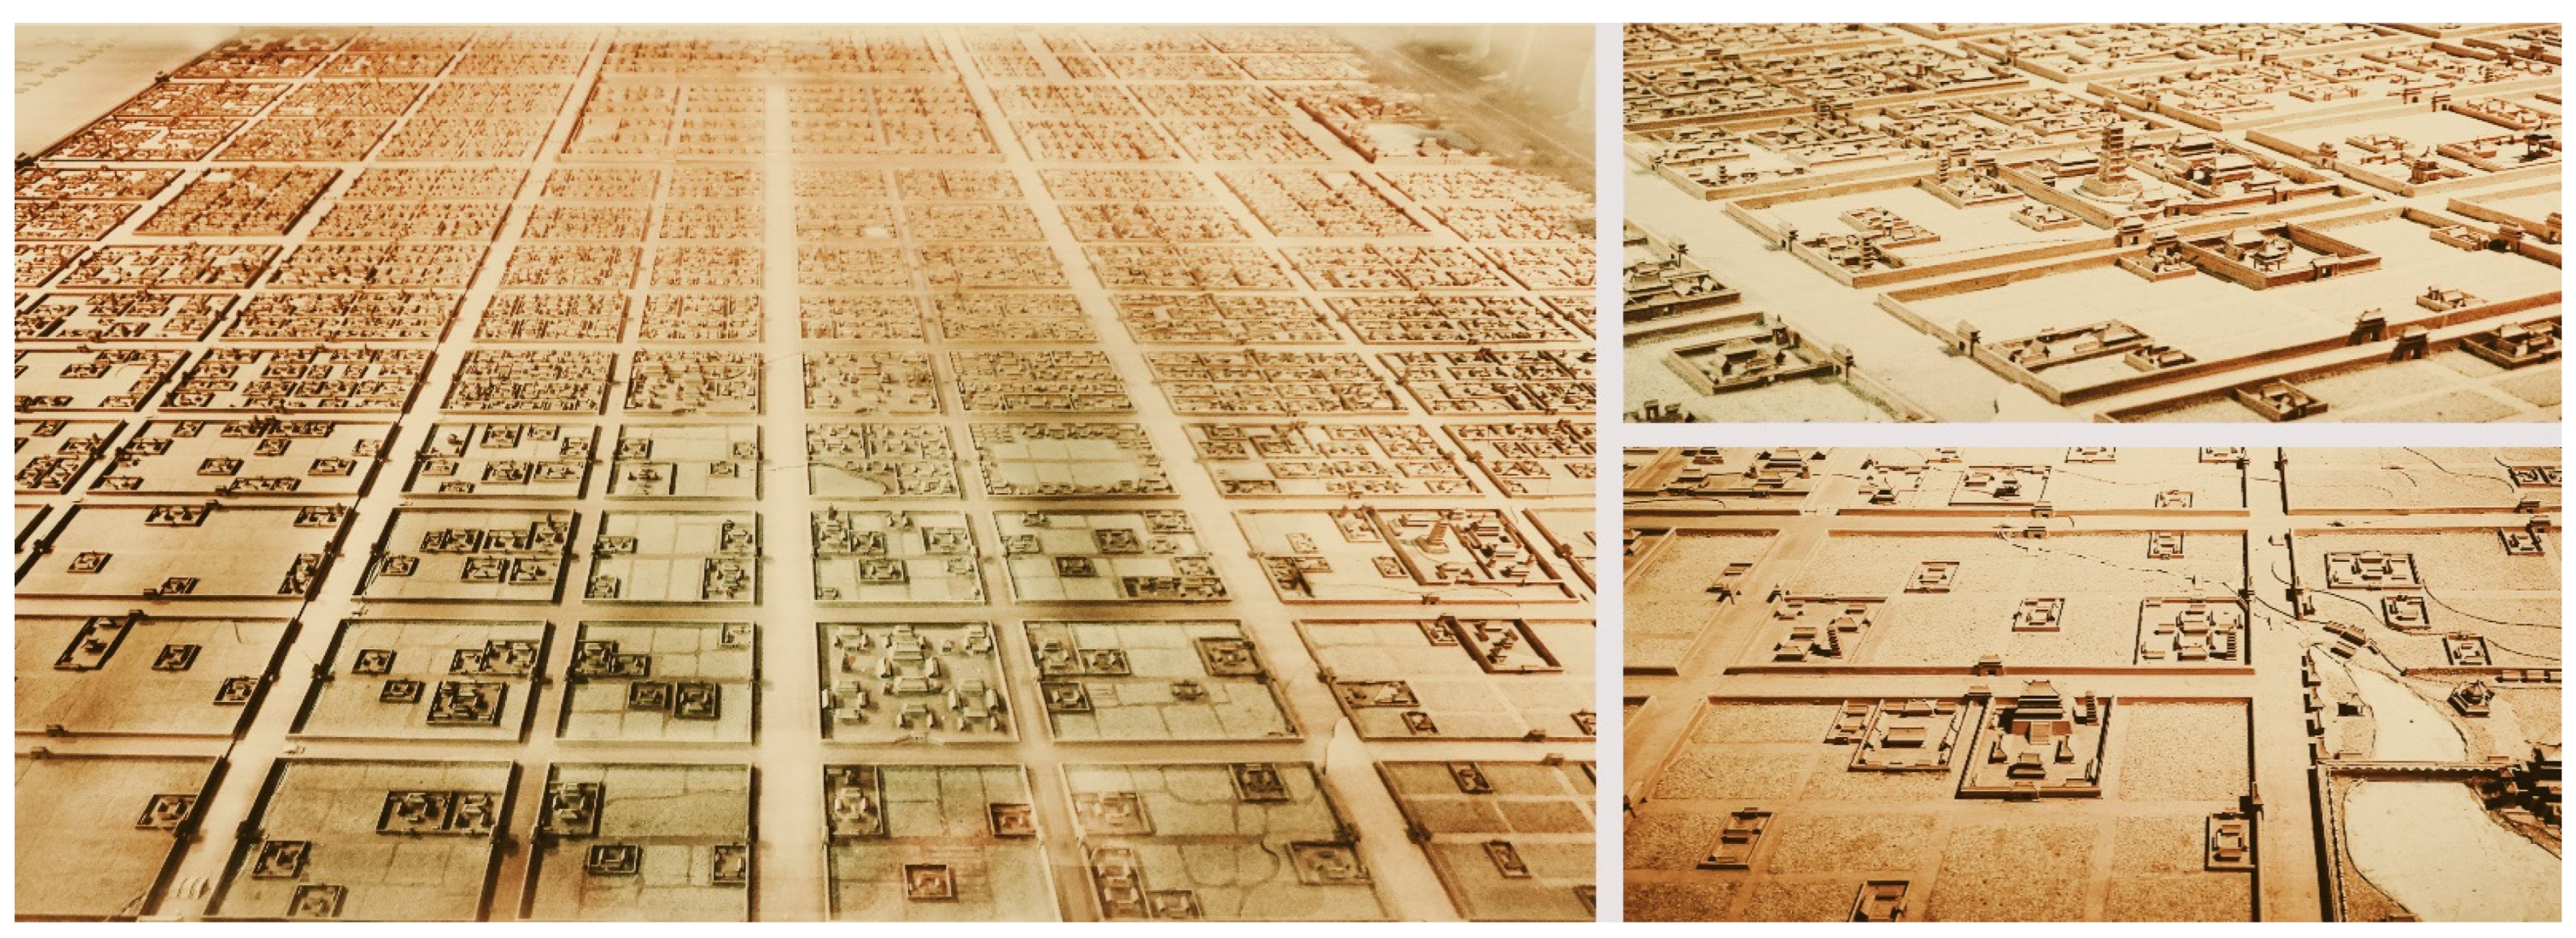
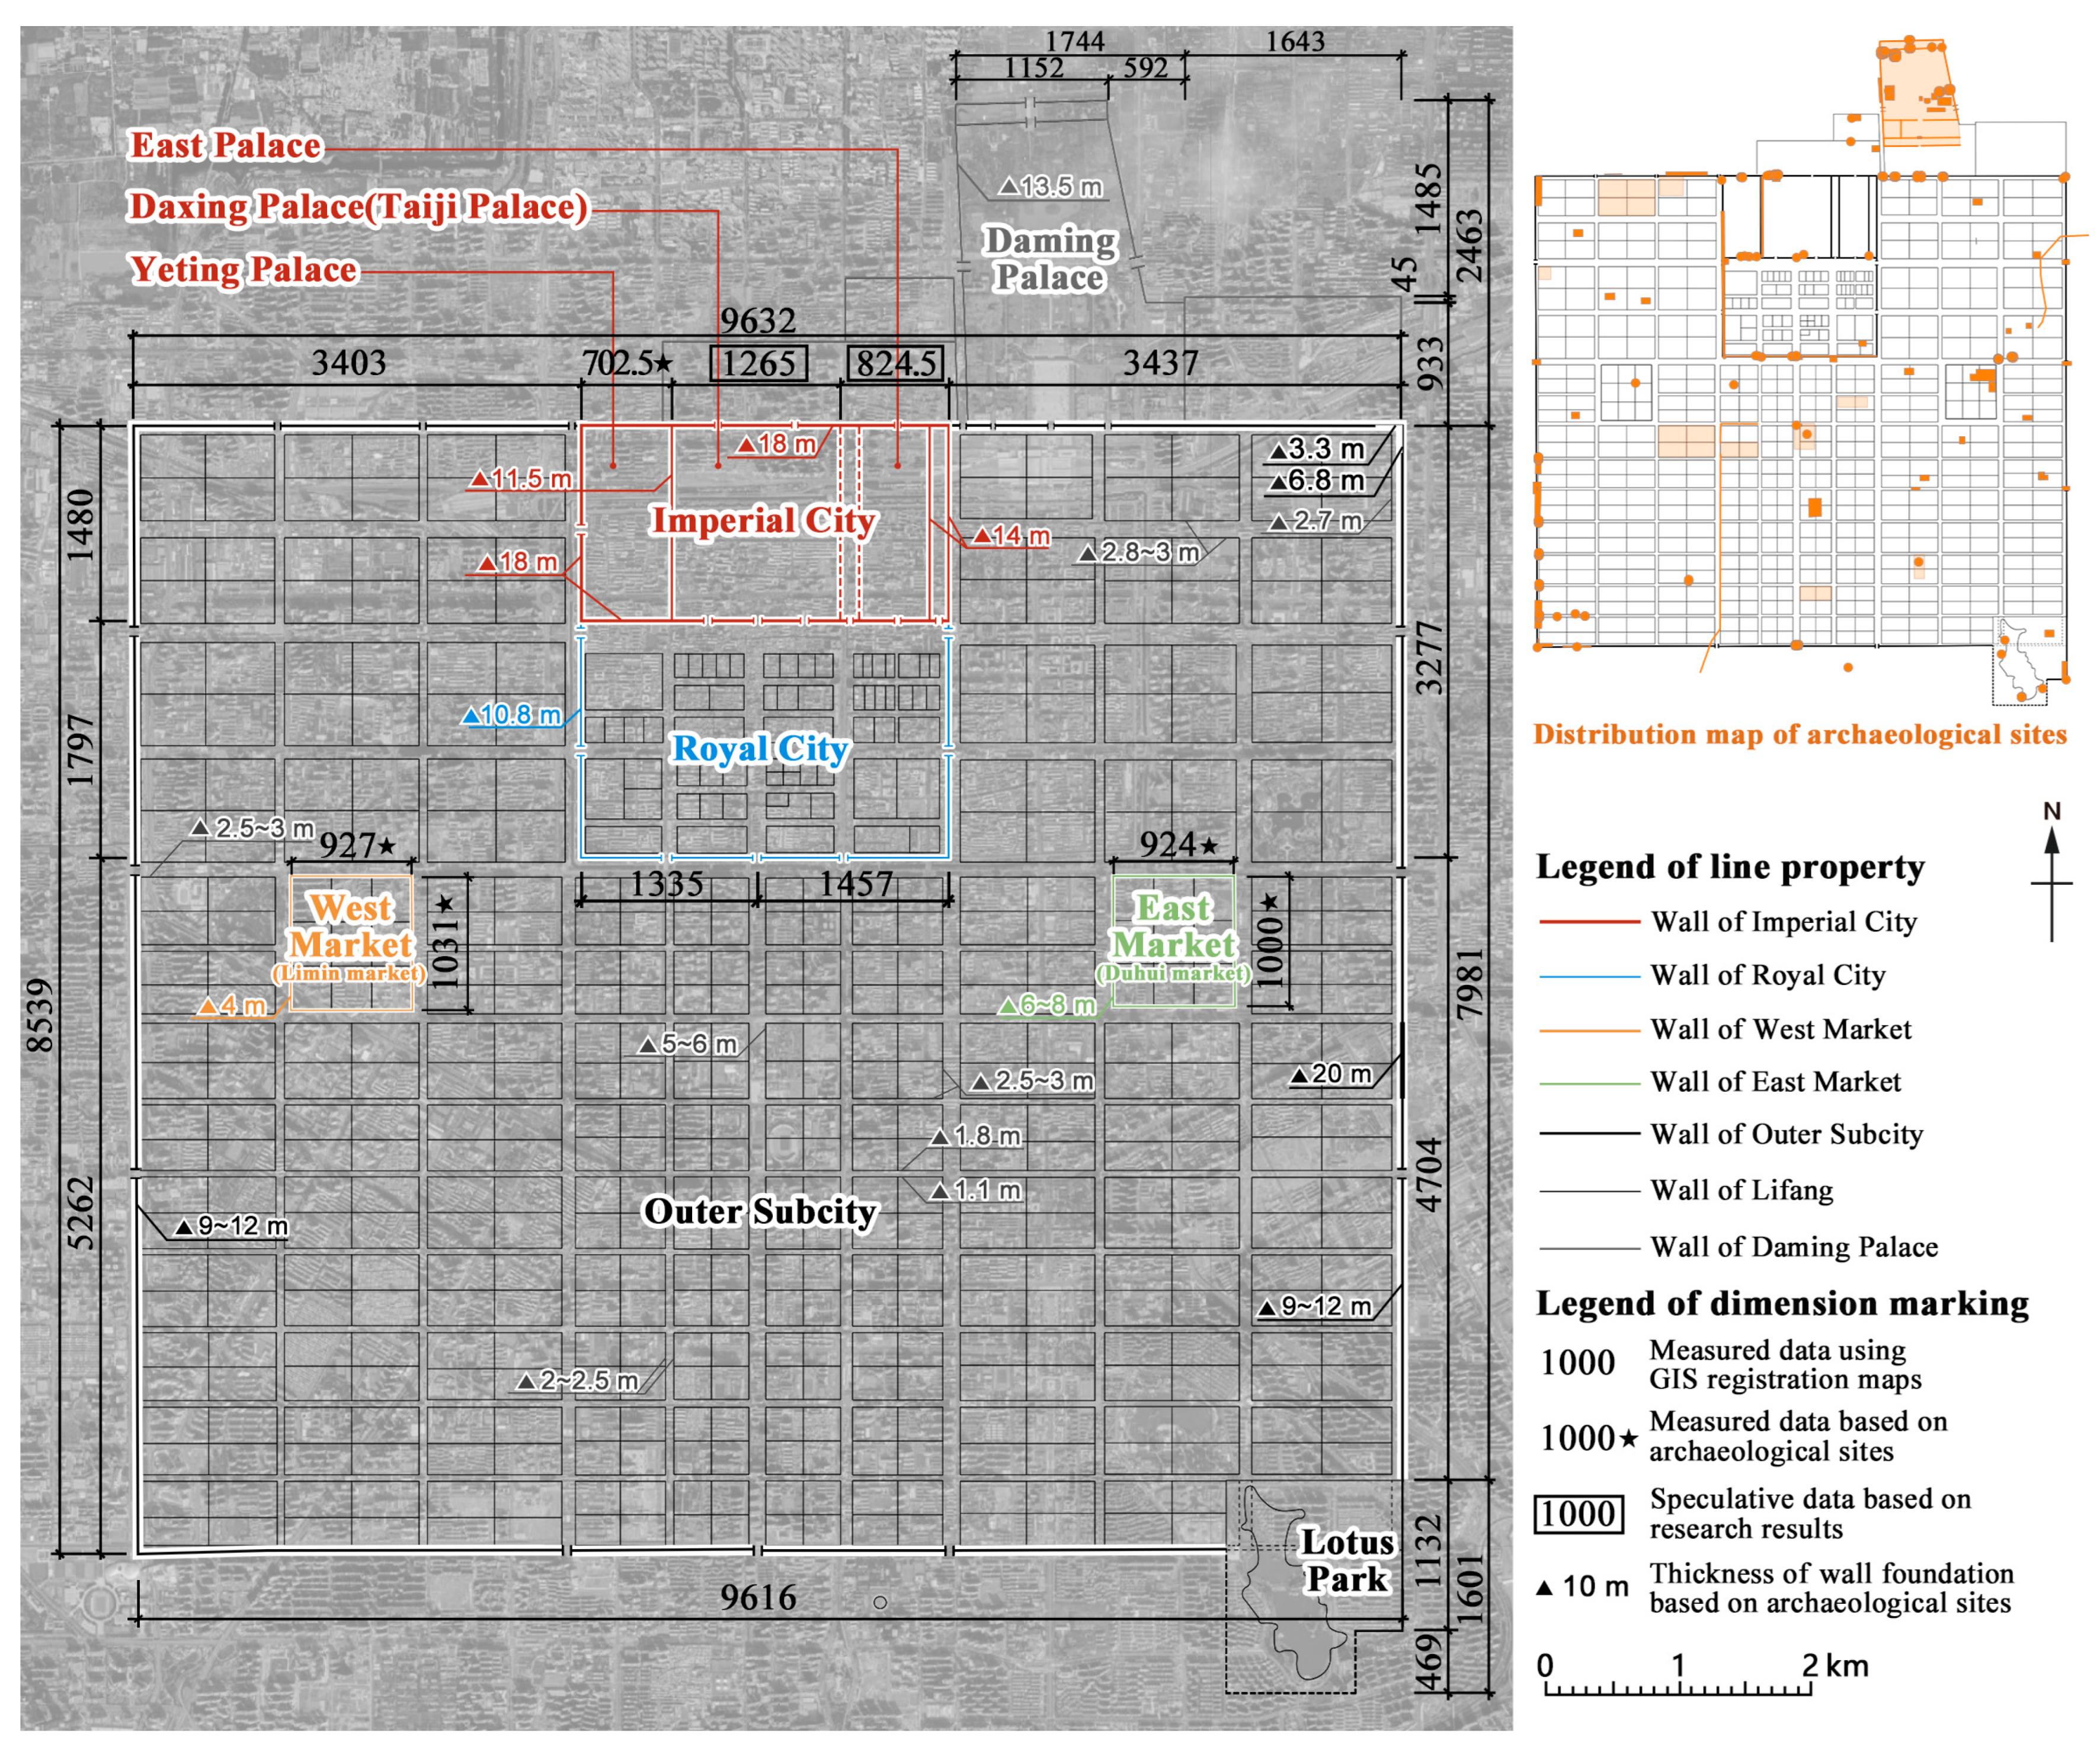
2.1. Overview of Chang’an City of the Sui and Tang Dynasties
2.2. Research Objects and Current Problems
- How does one quantize, quickly extract, and efficiently calculate the massive quantities of land use information in urban objects?
- How does one establish a clear comparison relation between the calculation results and cultural ideas in order to make intelligent judgments?
- How does one abstract from specific problems a more universal algorithm that is suitable for multiple urban objects?
3. Research Strategies
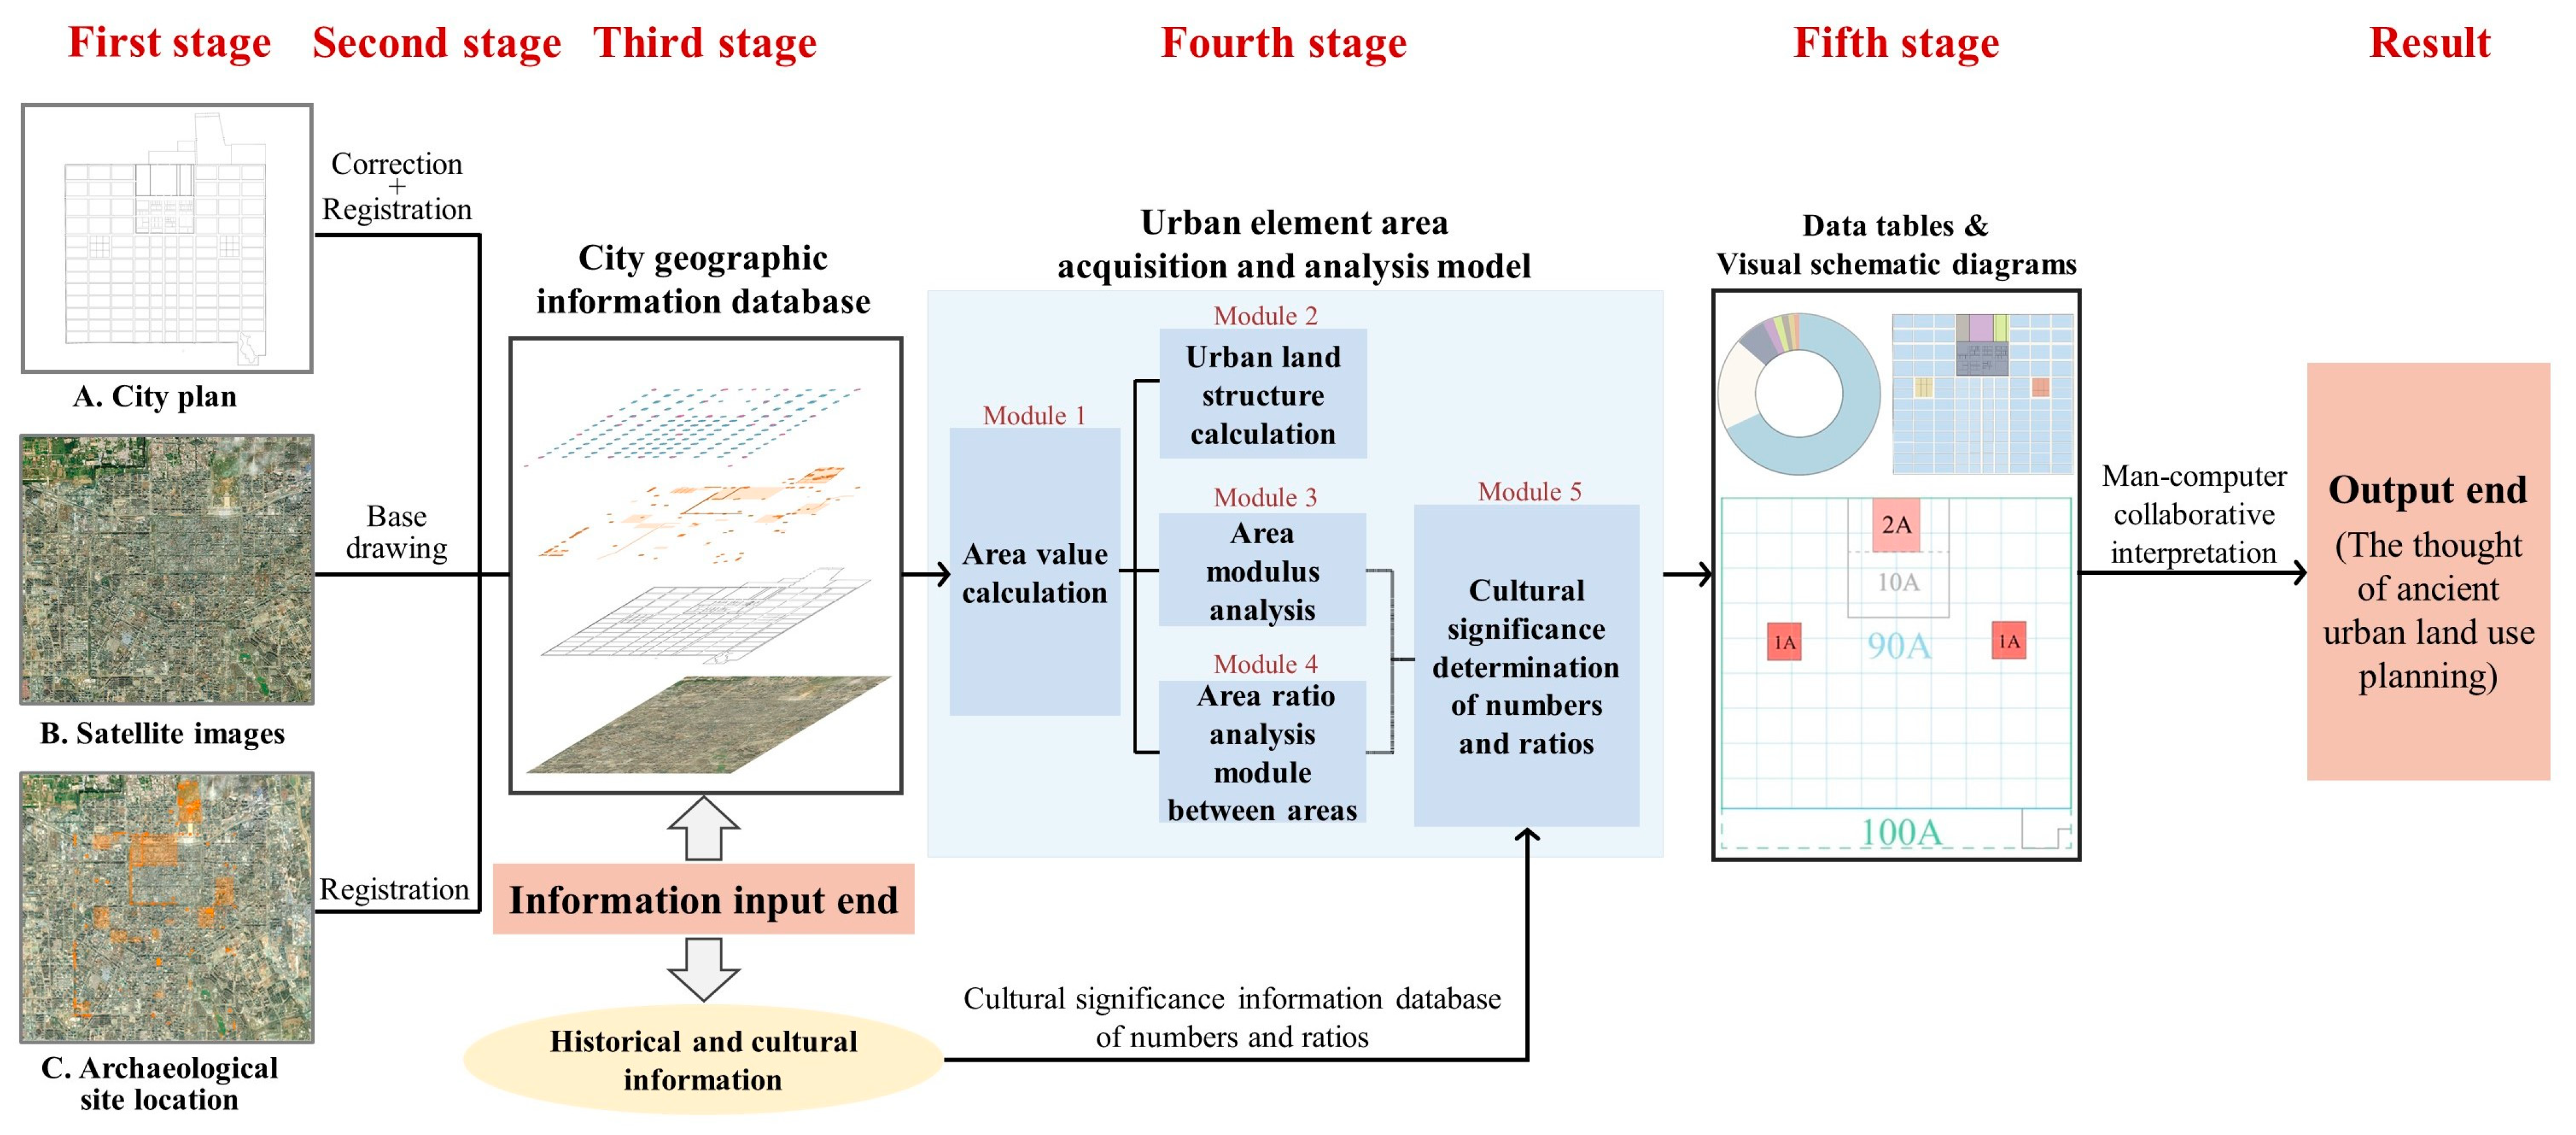
3.1. Technical Flow Chart and Technical Defects
- In the first stage, collect the relevant data and draw the city plan in AutoCAD.
- In the second stage, import the city plan into the QGIS platform and perform calibration and registration by matching known sites of the same name.
- In the third stage, mark the object attributes in QGIS, determine a number of urban functional areas and designated study areas according to the research needs, and mark all the boundary points of the objects involved in each area.
- In the fourth stage, construct the “urban element area acquisition and analysis model”, including the five modules of area value calculation, urban land structure calculation, area modulus analysis, area ratio analysis between areas, and the cultural significance determination of numbers and ratios. Then, set the main parameters (coincidence threshold, culturally significant numbers and numerical ratios, etc.) for the model, with full reference to historical literature, cultural concepts, and the academic consensus.
- In the fifth stage, embed the decision model into the platform to run and output visual schematic diagrams and data tables. Based on the results and characteristic rules obtained by the computer, the researchers use professional thinking for human–computer collaborative interpretation and finally form a complete conclusion (i.e., an academic view).
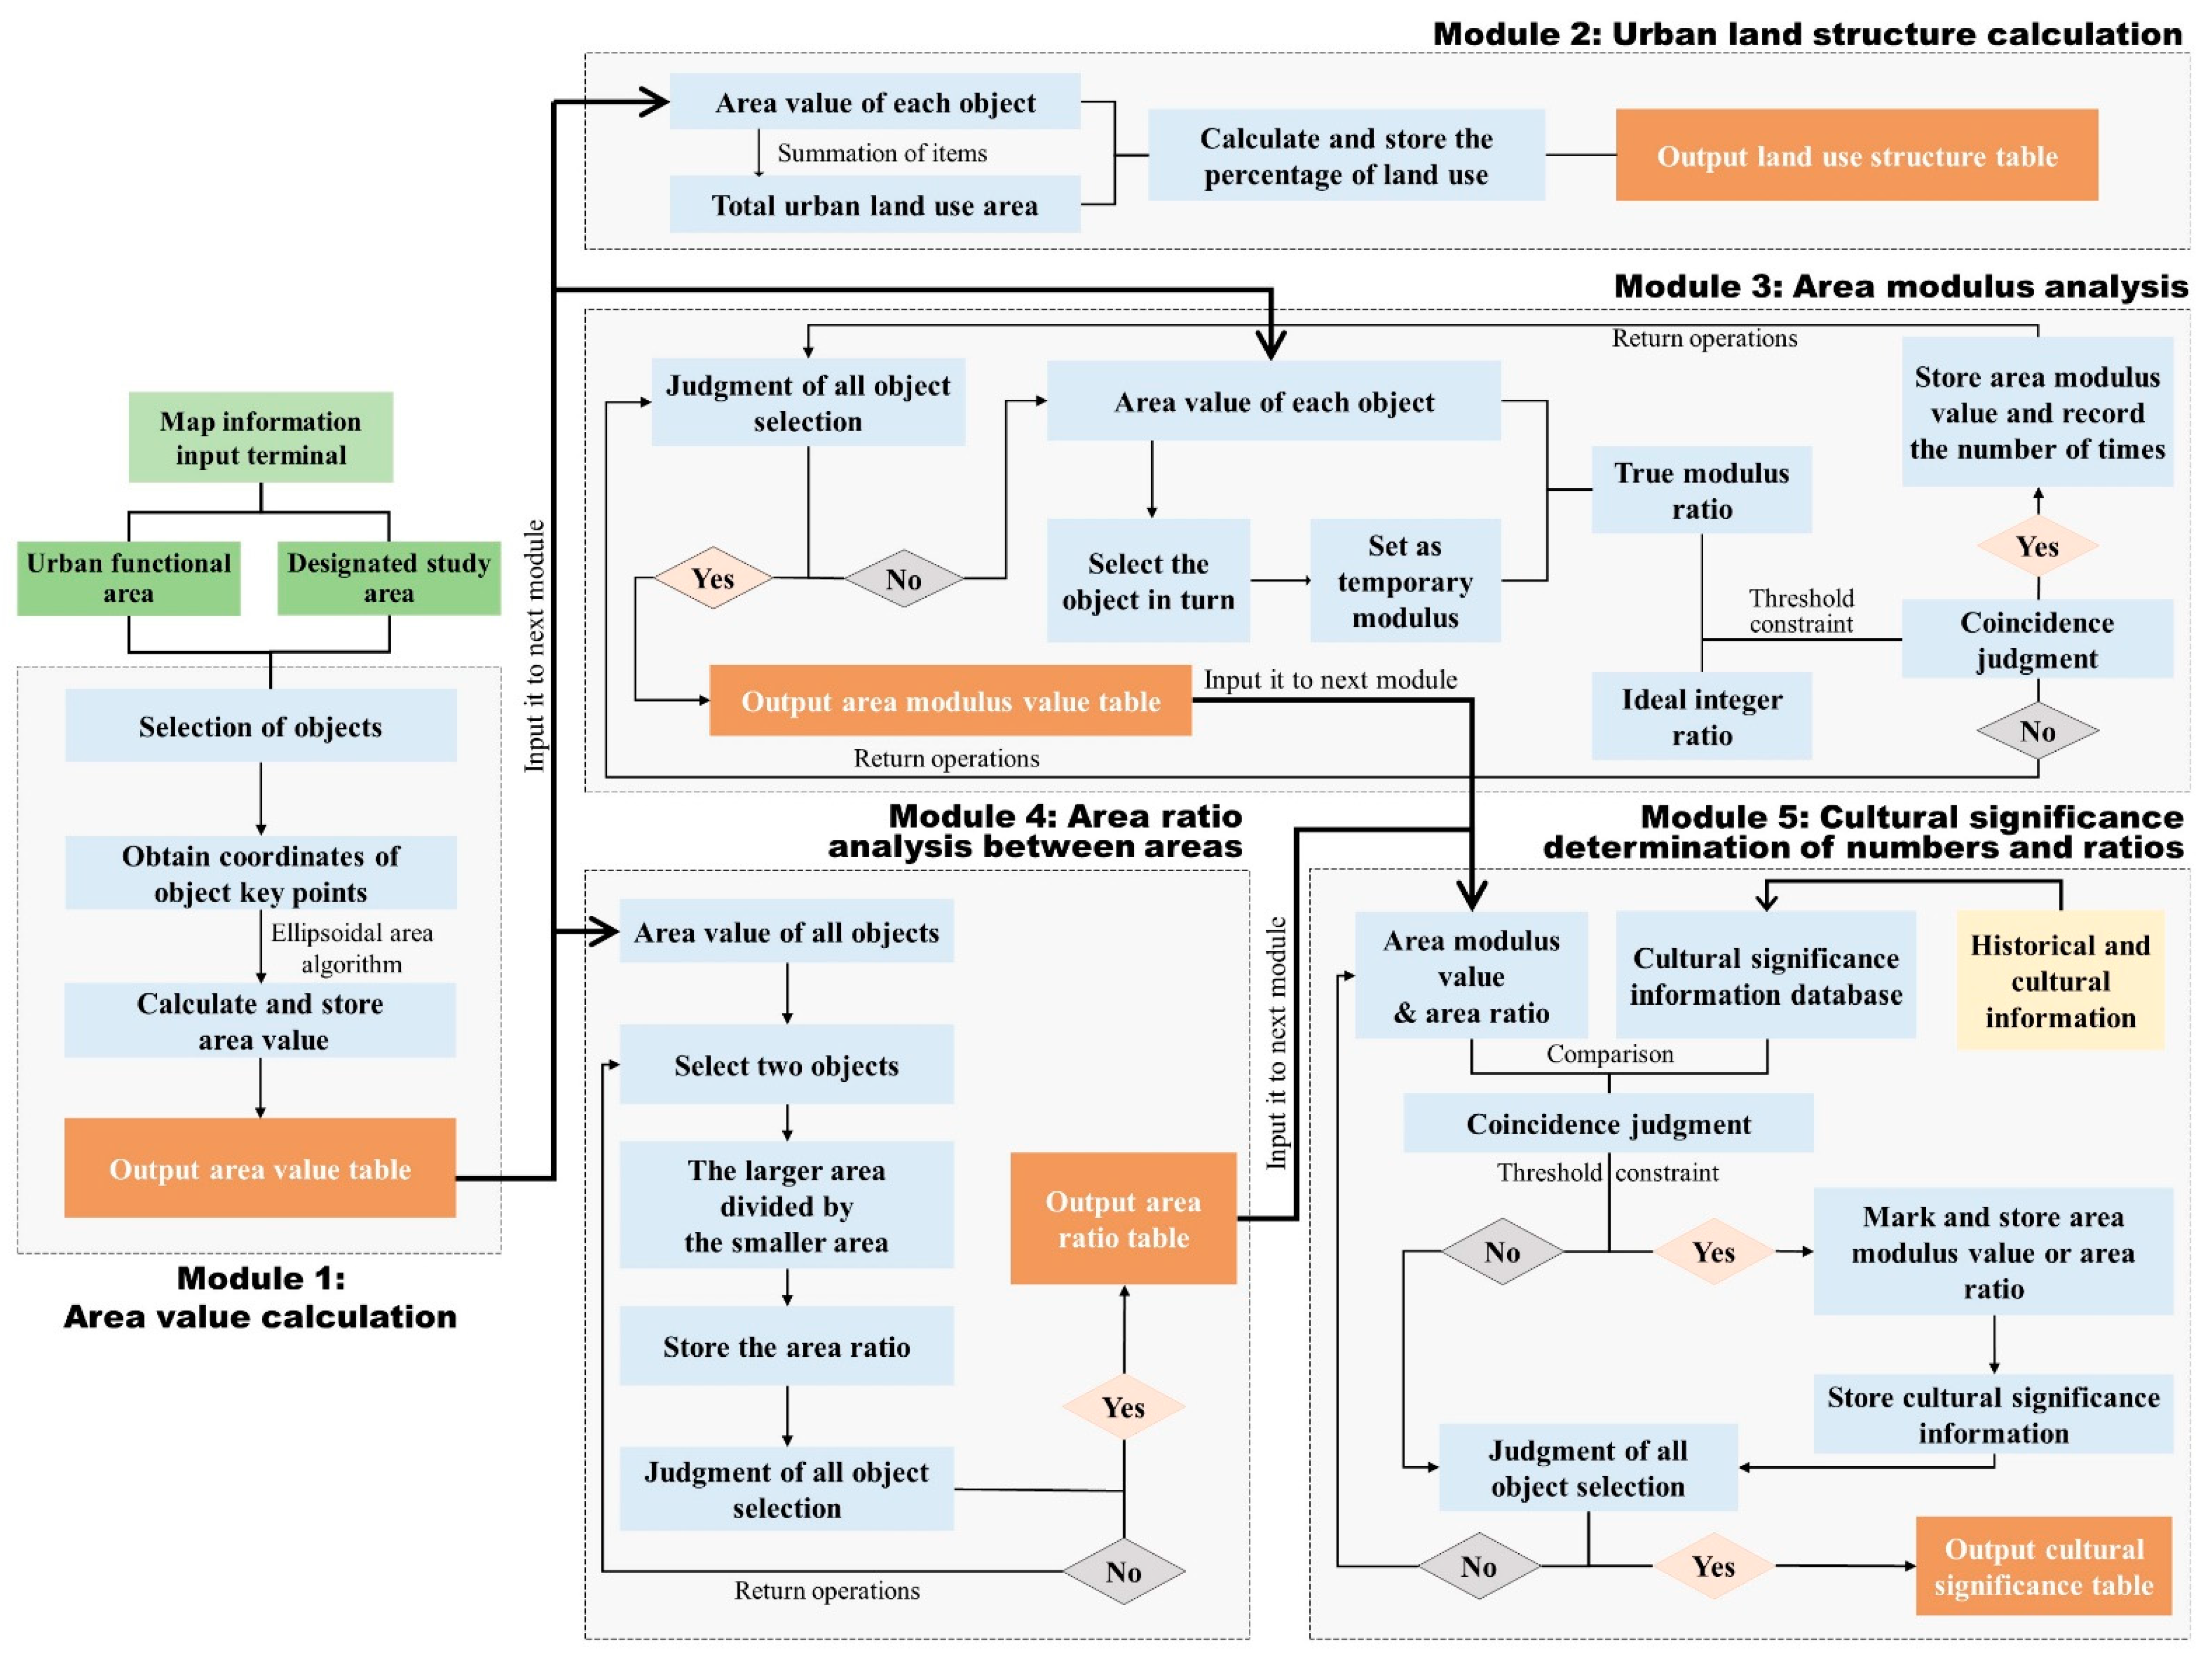
3.2. Specific Implementation Processes
3.2.1. Collect the Relevant Data and Draw the City Plan
3.2.2. Import the City Plan into the GIS Platform for Correction and Registration
3.2.3. Mark the Area Object Information
3.2.4. Construct the “Urban Element Area Calculation Analysis and Cultural Significance Determination Model” and Set Parameters
3.2.5. Embed the Decision Model into the Platform for Operation and Human–Computer Collaborative Interpretation
4. Results
4.1. Urban Land Use Composition Table
4.2. Analysis Table of the Modulus and Numerical Cultural Significance of the Urban Area
4.3. Analysis Table of the Area Ratio and Cultural Significance between Urban Areas
4.4. Urban Land Area Planning Analysis Chart
4.5. Validation Results of Other City Cases
5. Results Discussion
5.1. Land Planning Characteristics and Concepts of Chang’an City of the Sui and Tang Dynasties
- (1)
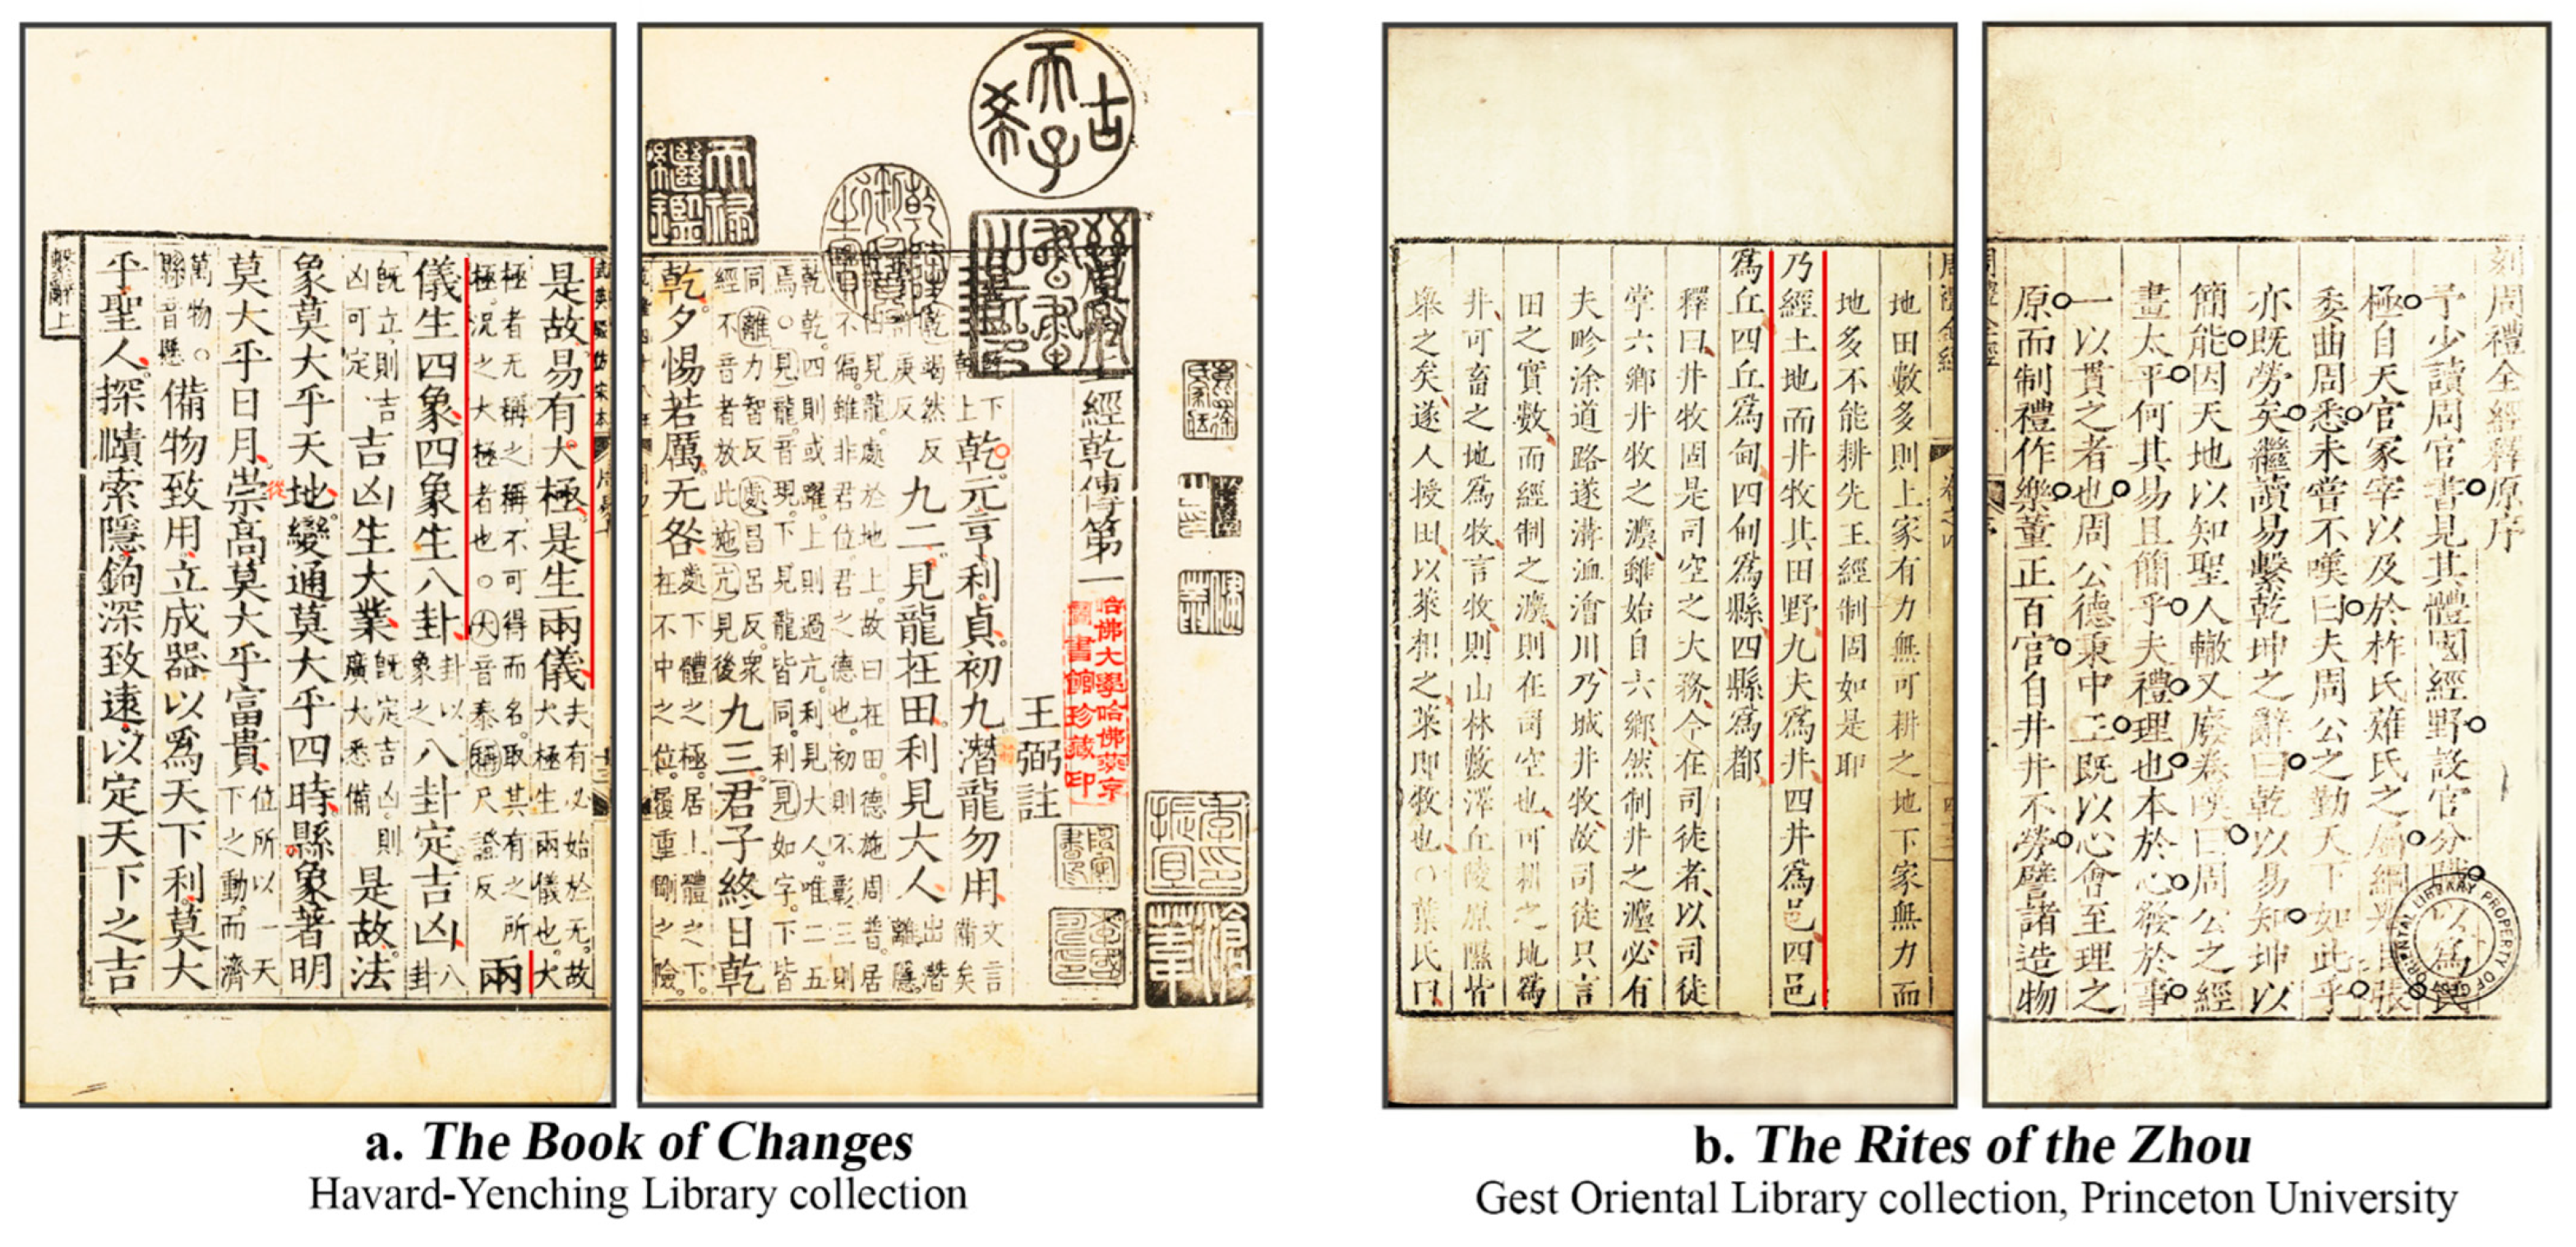
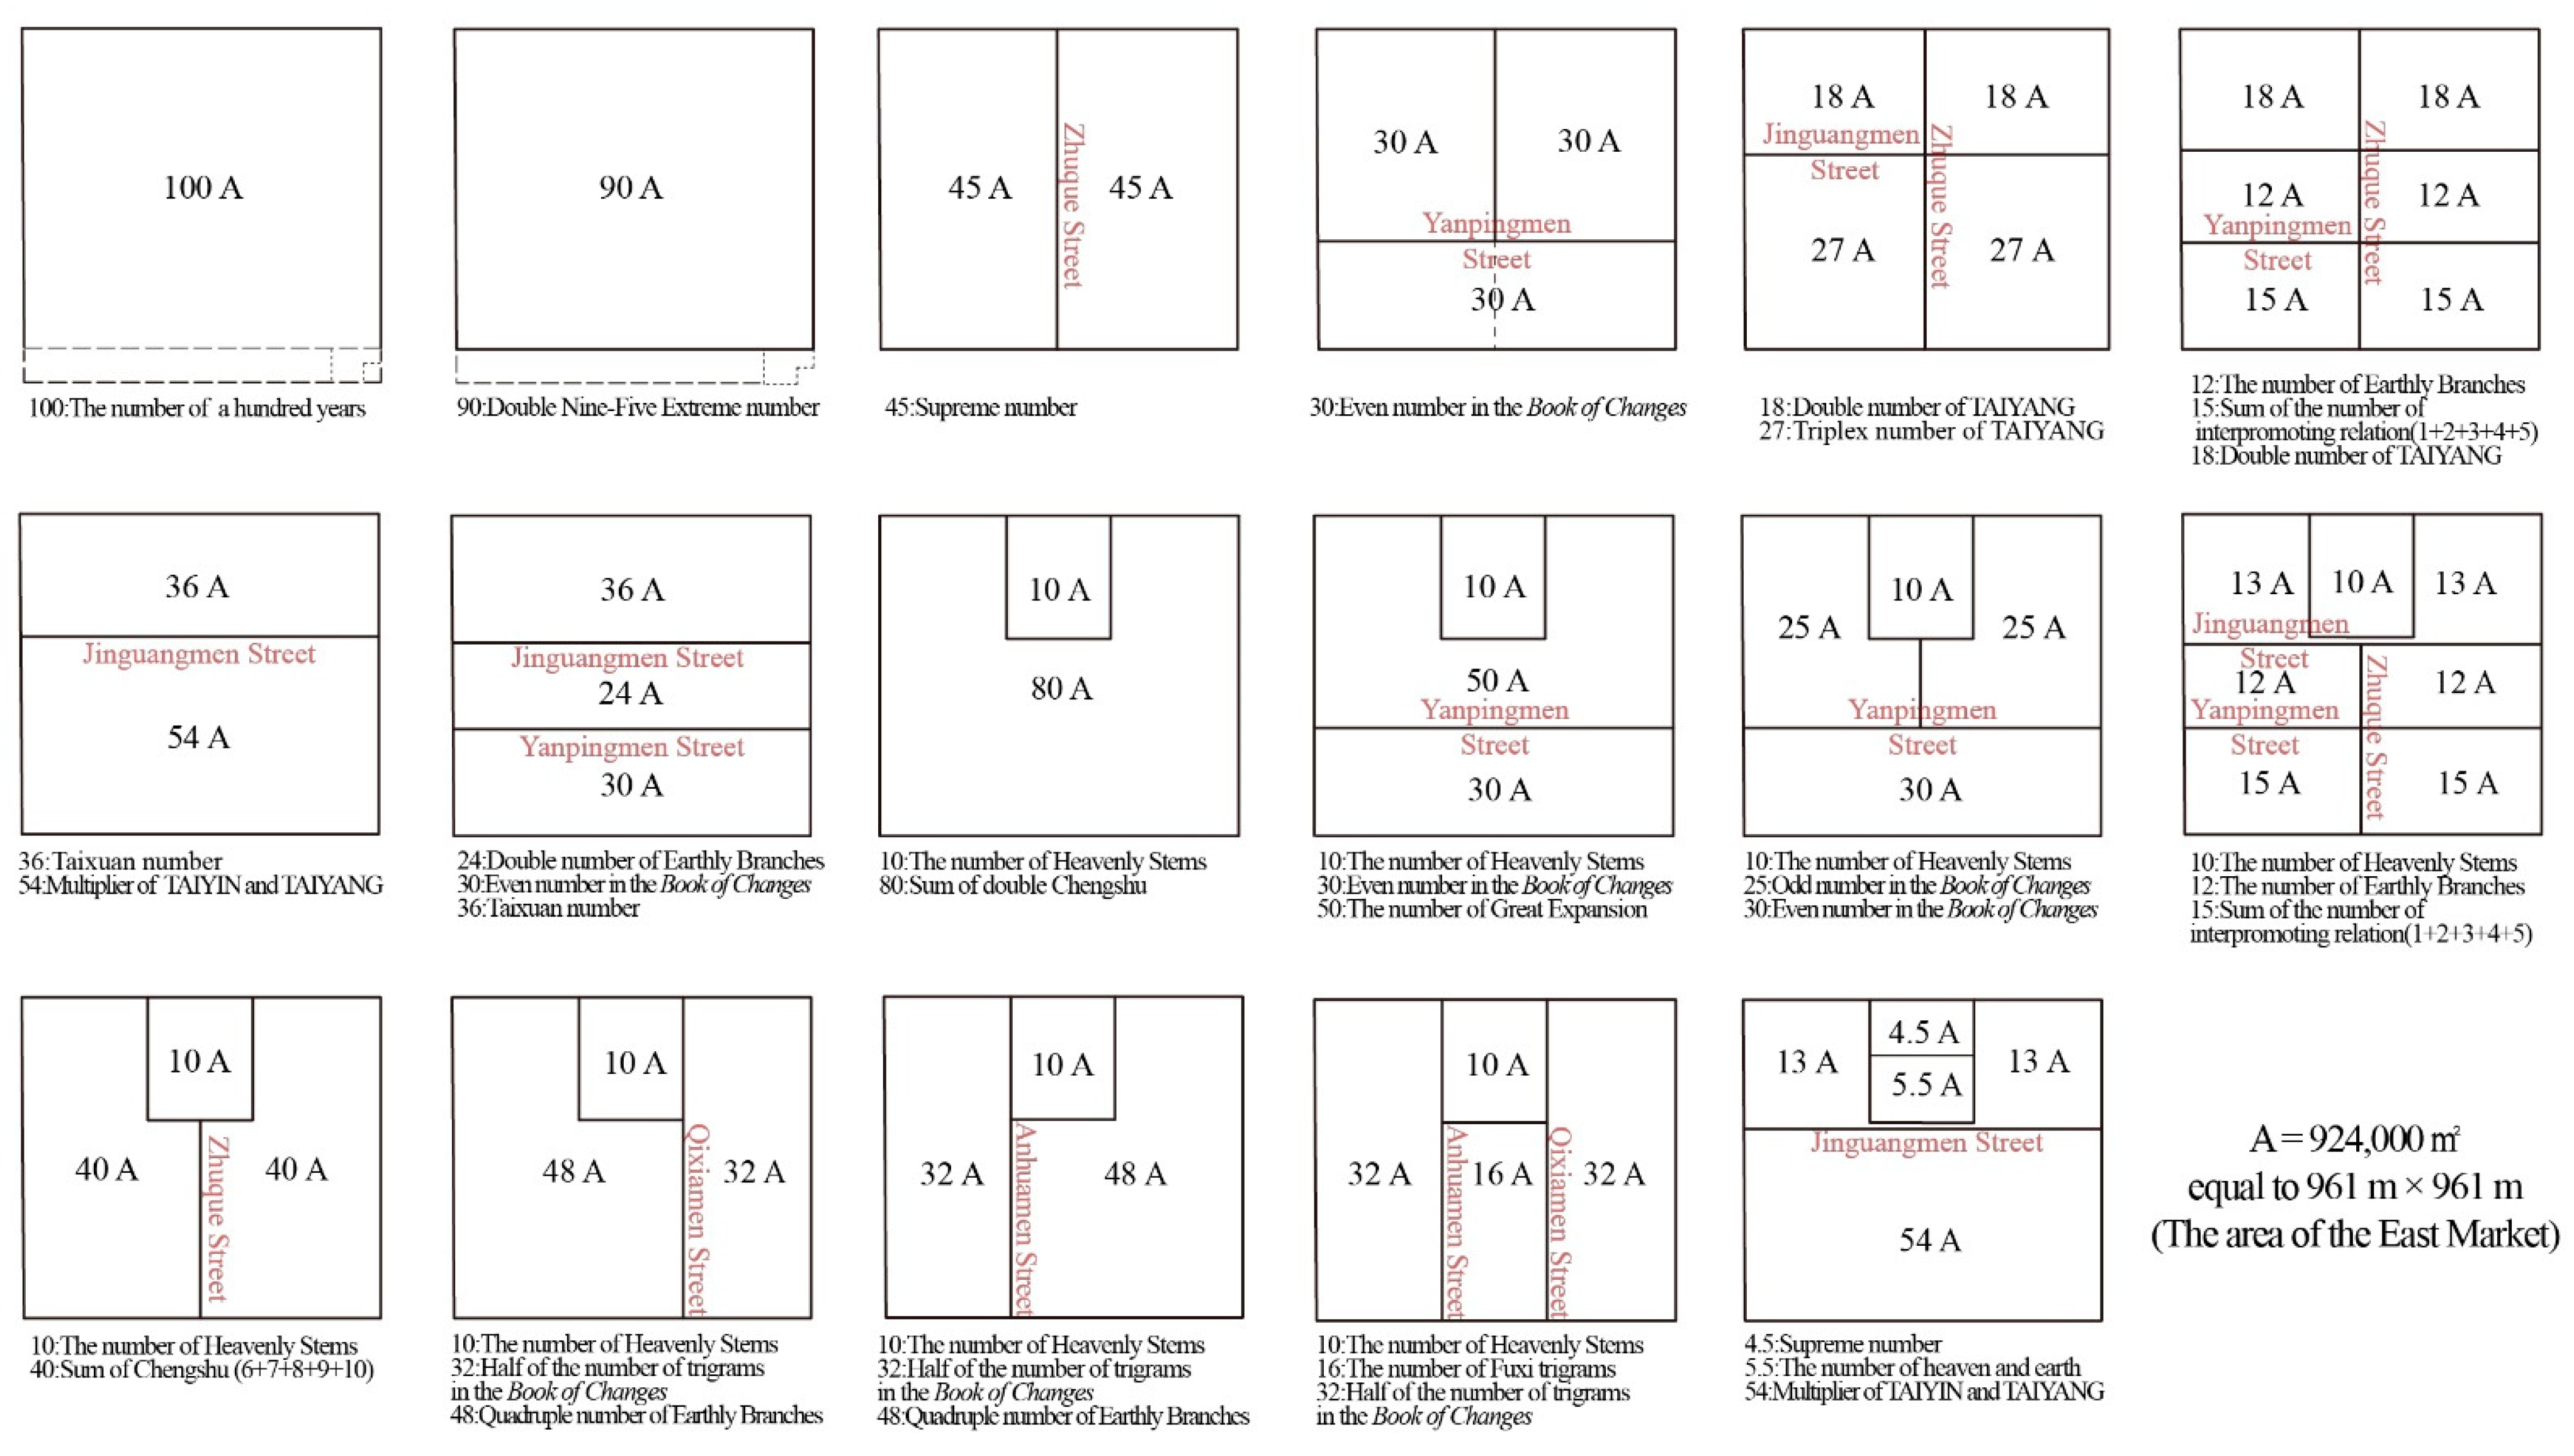
- In terms of land use management in Chang’an City of the Sui and Tang Dynasties, there is a very strict area planning method, which sets the area modulus (minimum unit) and consciously ensures that the area of each area conforms to the integral multiple of the modulus value A. This practice of dividing urban areas may be influenced by the “well field system” (a system of dividing land into several square plots of equal size and distributing them to different people) and related ideas that had developed since the Zhou Dynasty [40]. This is an effective way of controlling urban land resources. Specifically, if the area of the East Market is taken as the modulus, the area of the whole scope of the city is 100A. Meanwhile, the total area of the rectangular urban area is slightly smaller than 90A (88.84A), which is equivalent to removing the southernmost cells from the standard grid of squares. The size of the area modulus A is 924,000 m2 (equivalent to the square area of 961 m × 961 m); 1 Li (里) in the Sui and Tang Dynasties is generally believed to be 530~540 m, so the area modulus was probably designed in accordance with the square area of 1.8 Li × 1.8 Li, and the whole city area is equivalent to the square grid of 18 Li × 18 Li. If the total area of the rectangular urban area is measured according to the square grid of 18 Li × 16 Li (Figure 7), it is equivalent to 88.84A, which is exactly consistent with the measured value. This shows that the urban designers not only considered the total area value but also accounted for the fact that the city’s side length should conform to the length of the integral multiple of the Li. In addition, the objects most likely to be used as the area modulus are the East Market and Daxing Palace, the area ratio of which is very close to 1:2 (98.71%). The ratio of the area of the West Market, which is a little larger than the East Market, to the area of Daxing Palace is also close to 1:2 (coincidence: 97.95%). These phenomena show that in the initial design, the areas of East Market and West Market were intended to be equal, and they were set as the area modulus (A) of the whole capital city. The area of Daxing Palace is twice that of the market as the expanded modulus (2A); the area of other areas of the city should be determined on this basis. Moving from the Eastern Market area (1A) to the Daxing Palace area (2A) to the small city area (10A) is achieved by the constant integer multiple magnification of the area modulus. After the magnification of different integer multiples for the three areas, the rectangular urban area (90A) and outermost enclosed square area (100A) of the city can be generated, and the area of the urban area divided by main streets (such as 30A, 50A) also emerges, so that the whole city becomes a complete logical system (Figure 16). From the perspective of governance needs and convenient operations, the area planning of ancient capital cities may precede the shape design to solve the key problem of resource allocation; then, the spatial position of each functional block is determined through geometric shape design (the problem can be solved by the square and circular graphic operation method [28]). These findings suggest that the design of Chang’an City is complex and was obtained after comprehensively considering all kinds of issues.
- (2)
- Previous scholars found that Chang’an City of the Sui and Tang Dynasties was formed using the lengths of the Imperial City and the Royal City as the module [29] or the shape of Daxing Palace as the expanded module [30], which proves the dominance and importance of the Imperial City to the whole capital city. The research results show that there may also be a design technique for Chang’an City that takes the market area value as the basic modulus and the Daxing Palace area as the expanded modulus (twice the modulus). Daxing Palace is the most important element in the Imperial City; it is located in the center of the central axis of the capital and represents the royal family. The market is the most important element in the Outer Subcity; it is located on the east and west sides of the central axis of the capital and represents the general public. The study further reveals that the ancients tried to establish a close relationship and mutual transformation between the royal family and the public. Selecting the market as the module perhaps expresses a “people-oriented” concept; however, in order not to reduce the authority of the emperor, the designer consciously made the area of the Imperial City twice the area of the market and placed the Imperial City in the center and the market on both sides, expressing the supremacy of imperial power over civil rights.
- (3)
- There are two types of areas with different attributes in the city, namely the functional area with specific functions, and the designated study area, which is divided by streets. In previous studies, more attention was paid to urban functional areas, while less was paid to non-specific functional areas divided by streets. The results of this study show that the objects in the two areas generally have harmonious mathematical proportional relations, which means that they are effectively unified in the same system. In Chang’an City, the areas divided by main streets, such as Zhuque Street (north–south), Anhuamen Street (north–south), Qixiamen Street (north–south), Jinguangmen Street (east–west), and Yanpingmen Street (east–west), have specific rules in terms of area. They are not only integral multiples of the area modulus (i.e., the area of the East Market), but there is also a specific proportional relationship between the formed areas, indicating that streets are non-negligible elements in the capital and that the positions of streets in the capital were carefully arranged to meet the needs of form and space division.
- (4)
- In the planning of Chang’an City of the Sui and Tang Dynasties, a large number of numerical values and numerical ratios with cultural significance were used. In terms of numbers, these include the supreme number (4.5), the number of heaven and earth (5.5), the number of Heavenly Stems (10), the number of heaven (25), and the number of earth (30) from The Book of Changes, as well as the sum of double Chengshu (80), the double Nine-Five Extreme number (90), the number of a hundred years, the ten–ten multiplier (100), etc. In terms of ratios, these include the ratio of Earthly Branches to Heavenly Stems (12:10), the golden ratio (1.618:1), the ratio of the supreme number (9:5, 45:1), the ratio of the number of Yin and Yang (2:1), the ratio of Taiyang to Shaoyang (9:7), the used number of the Great Expansion (49:10), the ratio of Heaven and Earth (3:2), etc. Moreover, the objects with these numerical values or ratios are almost always the key elements in the capital, such as the Imperial City, the Royal City, and the market. These reflect the fact that that ancient urban planners tried to integrate pure numbers, regular geometric forms, cultural significance, and the actual functions of various objects to form a whole with complex connotations. This fully reflects the design rationality, cultural supremacy, and other characteristics of ancient Chinese capital cities.
5.2. Comparison of Chang’an City of Sui and Tang Dynasty with Roman Timgad and Japanese Heijo-kyo
5.3. Feasibility and Transferability of the Research Method
5.4. Discussion of the Results’ Accuracy and Numerical Coincidence
6. Conclusions
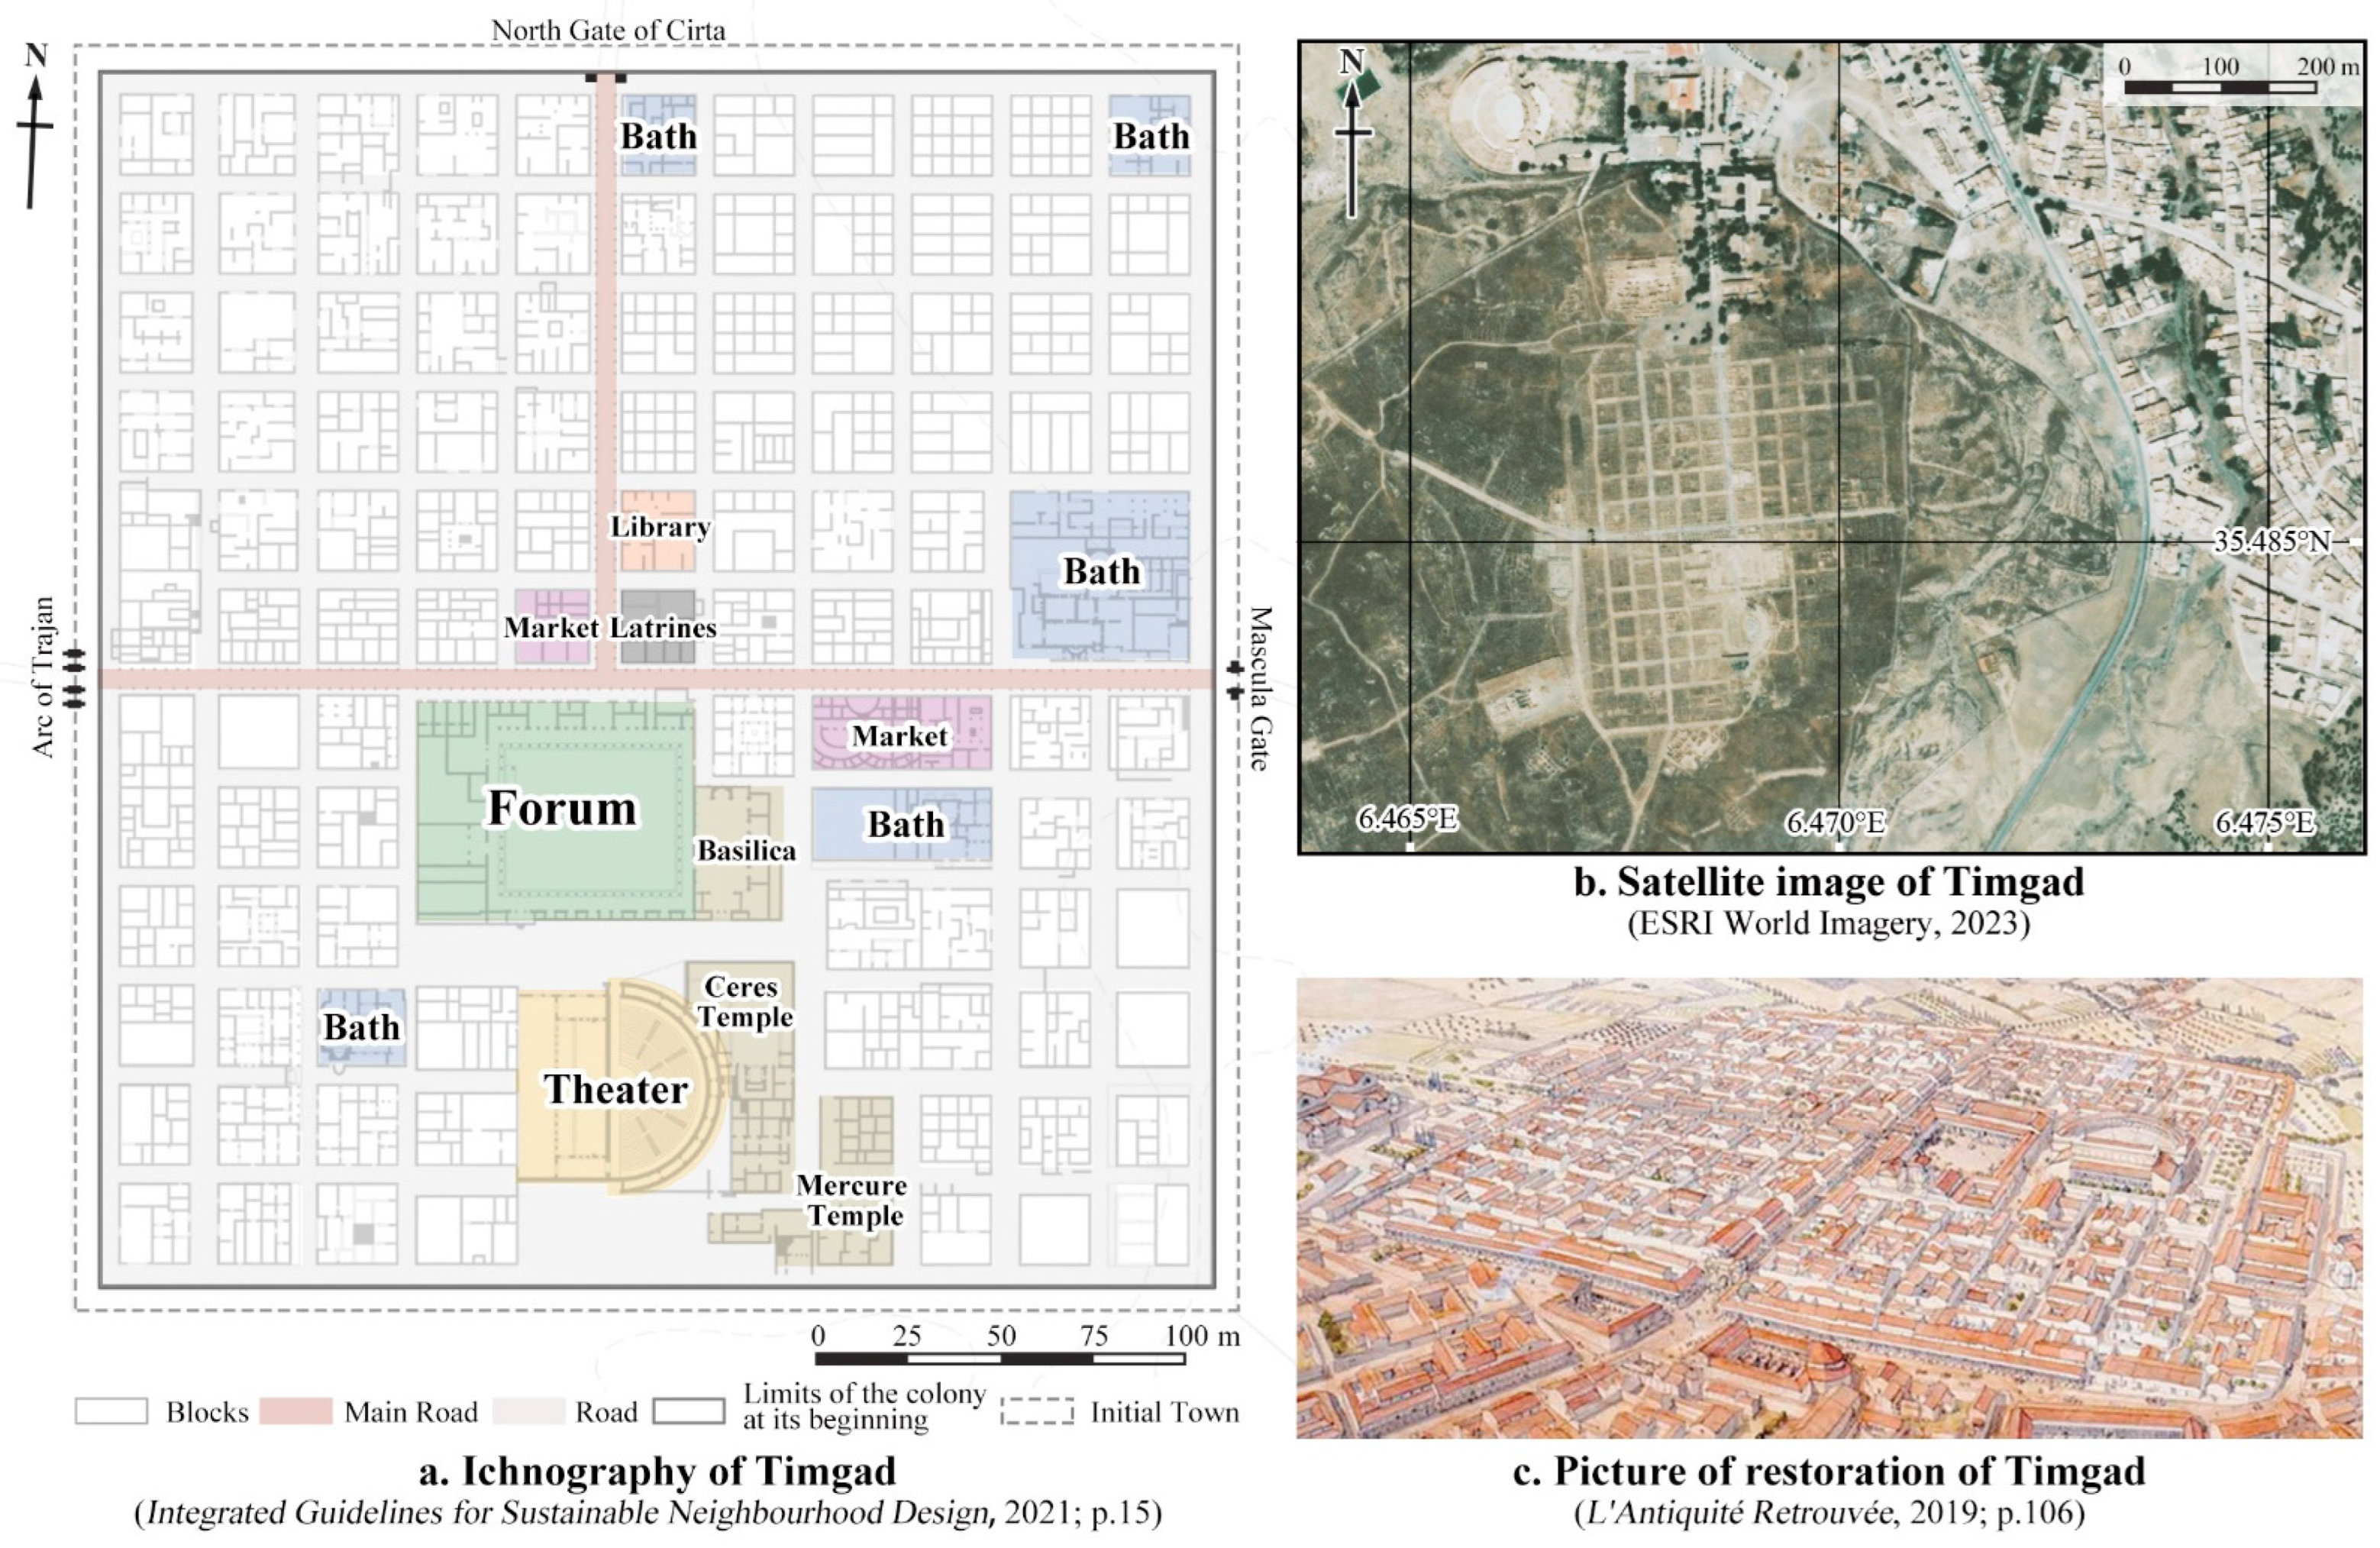
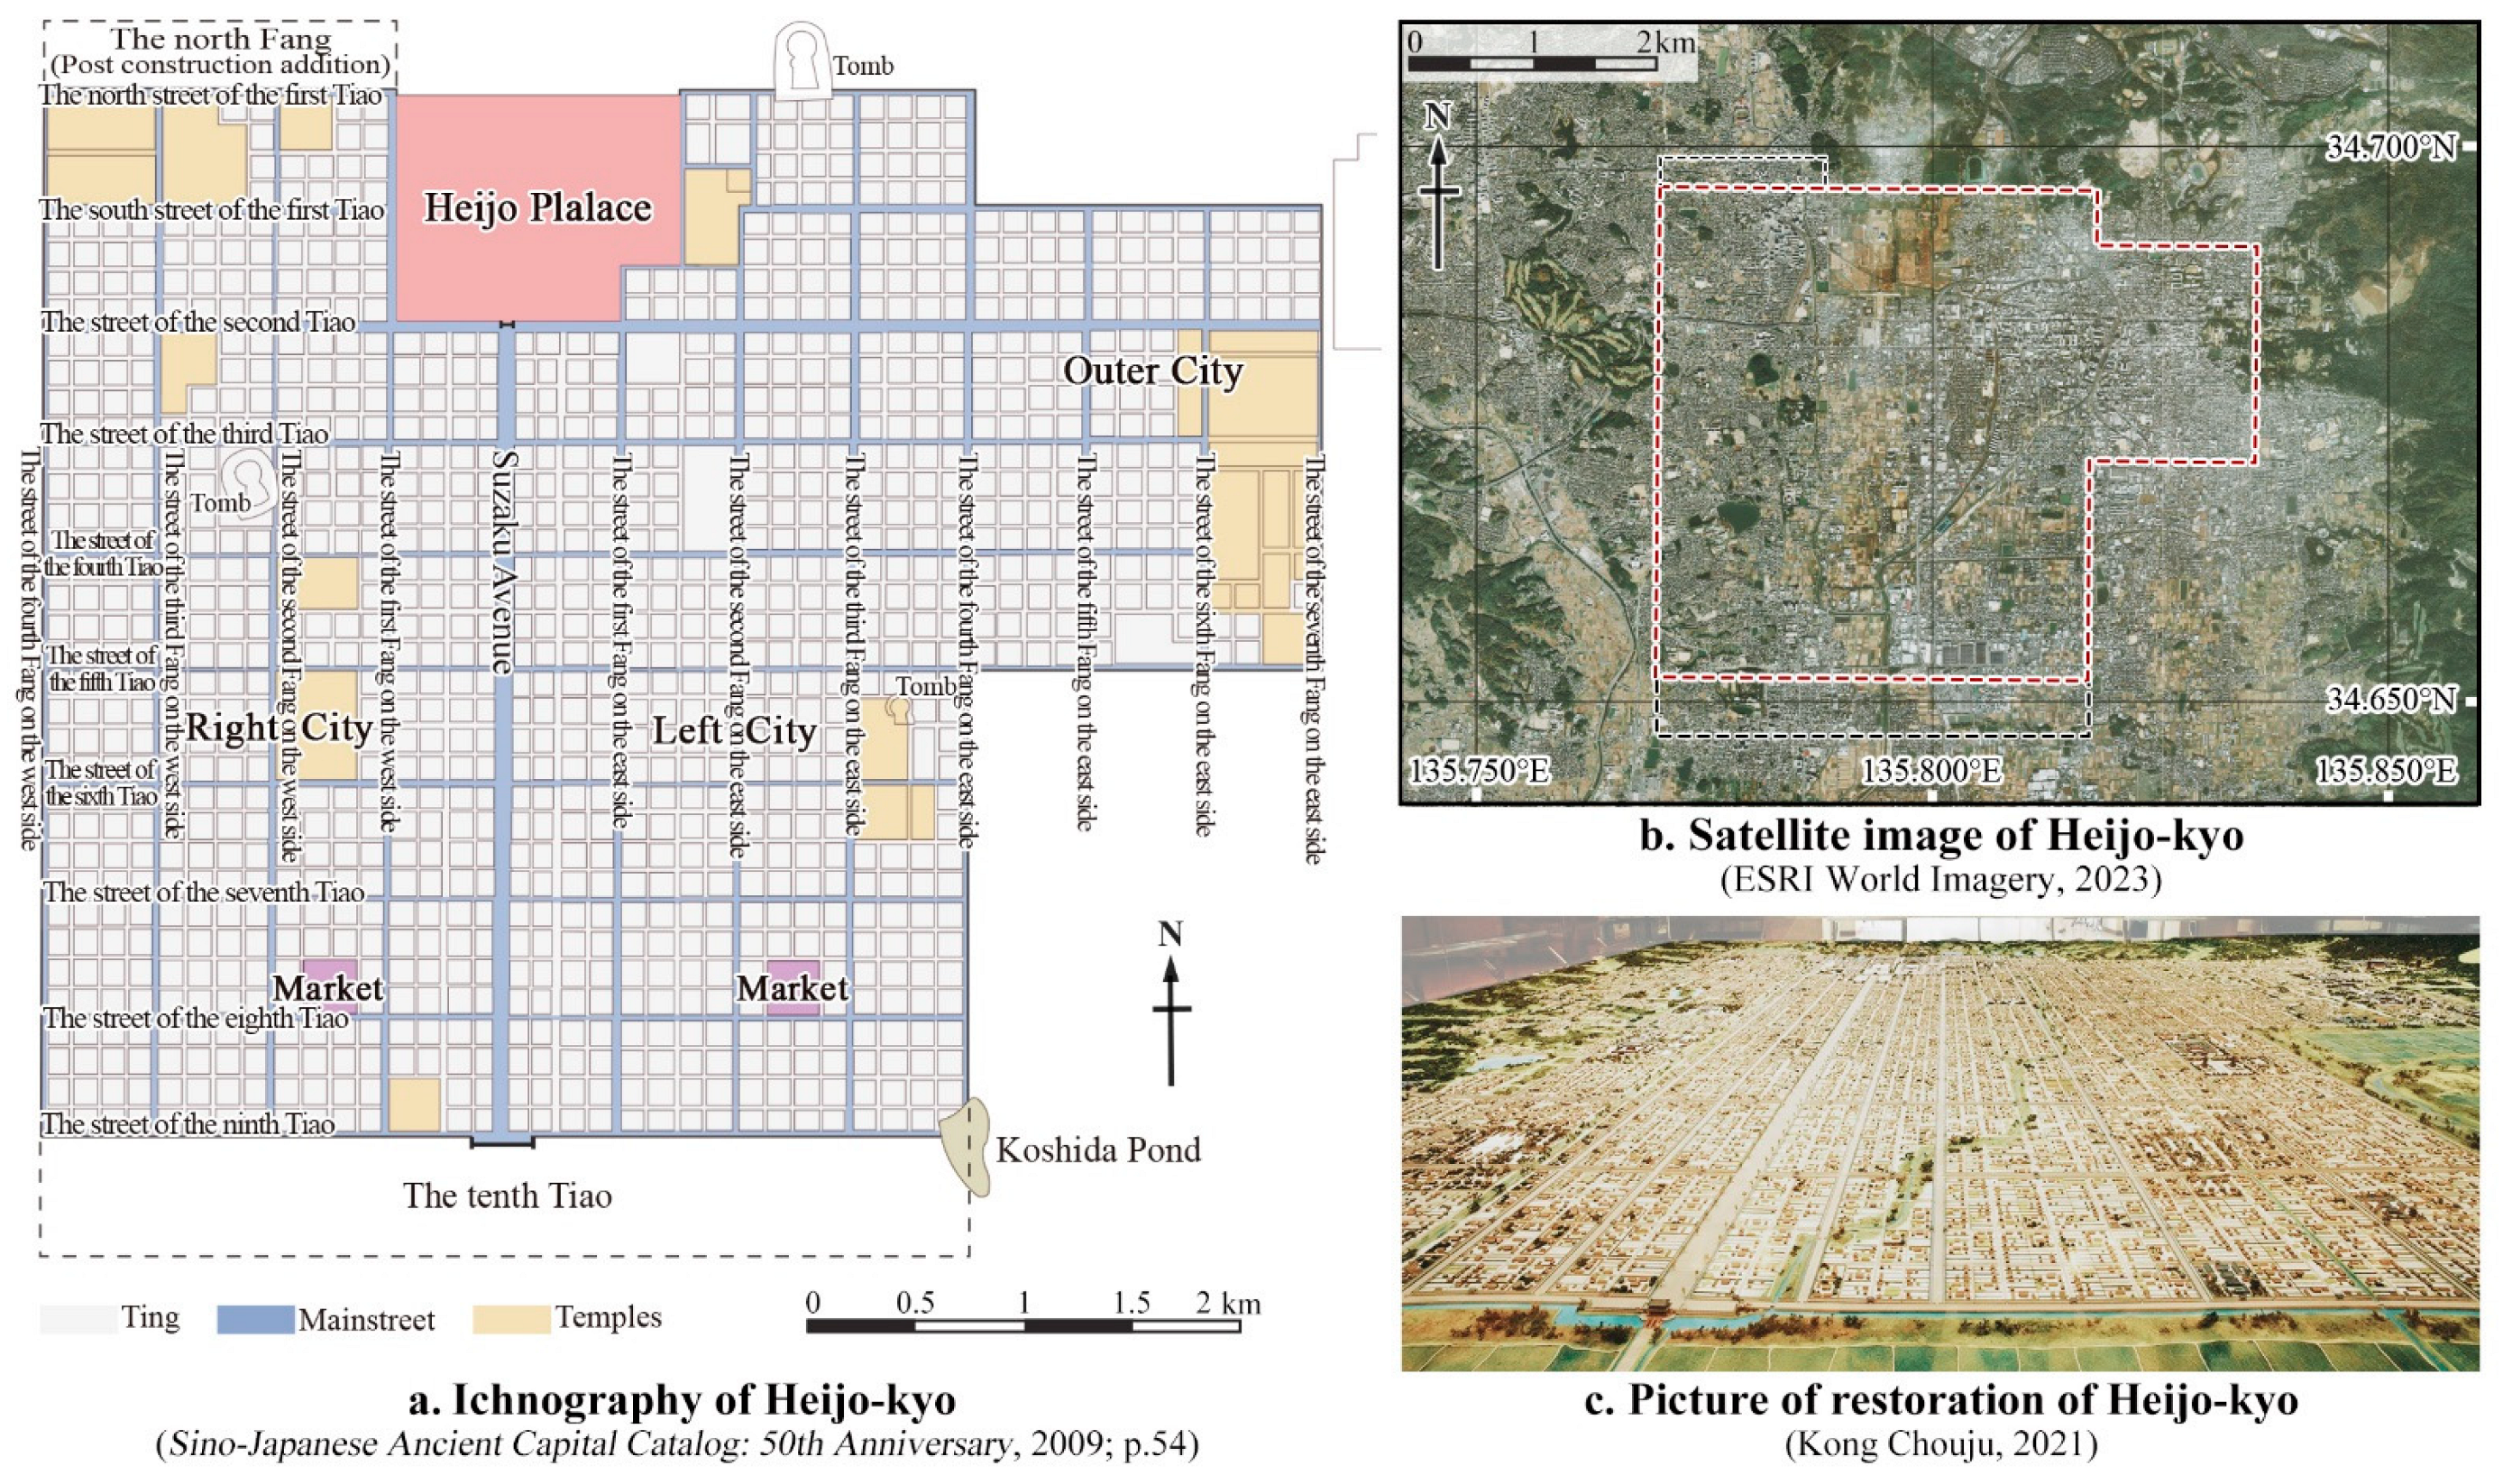
- An innovative method of urban land use planning analysis based on GIS and an area algorithm was proposed in this study, which can improve researchers’ analytical abilities regarding urban land use features and help them reveal the cultural significance and planning ideas reflected by these features. This method is different from those in previous research that relied solely on manual calculations and intuitive interpretation. In essence, it realizes the efficient mining of massive quantities of urban data through human–computer collaboration, which can eliminate a significant amount of the uncertainty generated by previous analysis based solely on scholars’ experience, as well as improving the scientificity, accuracy, efficiency, manageability, and portability of relevant research. This method was proven to be feasible and effective based on the analysis and testing of the case of Chang’an City of the Sui and Tang Dynasties. Through the analysis of Timgad in ancient Rome and Heijo-kyo in Japan, it was demonstrated that this method has a wide range of applicability and can be extended to other city case studies.
- The “urban element area acquisition and analysis model” was constructed for the first time in this study; it can support five important operations, including urban area value calculations, land use structure calculations, area modulus analysis, area ratio analysis between areas, and determining the cultural significance of numbers and ratios. In this model, the object data, core algorithm, and adjustable parameters were managed separately, which makes the original complex research process clear and easy to manage and adjust. A large number of easily overlooked or confused operations were quickly and accurately completed by computer. The two operation behaviors of data entry with low operation difficulty and data analysis with high operation difficulty were separated, making multi-person labor-division collaboration possible.
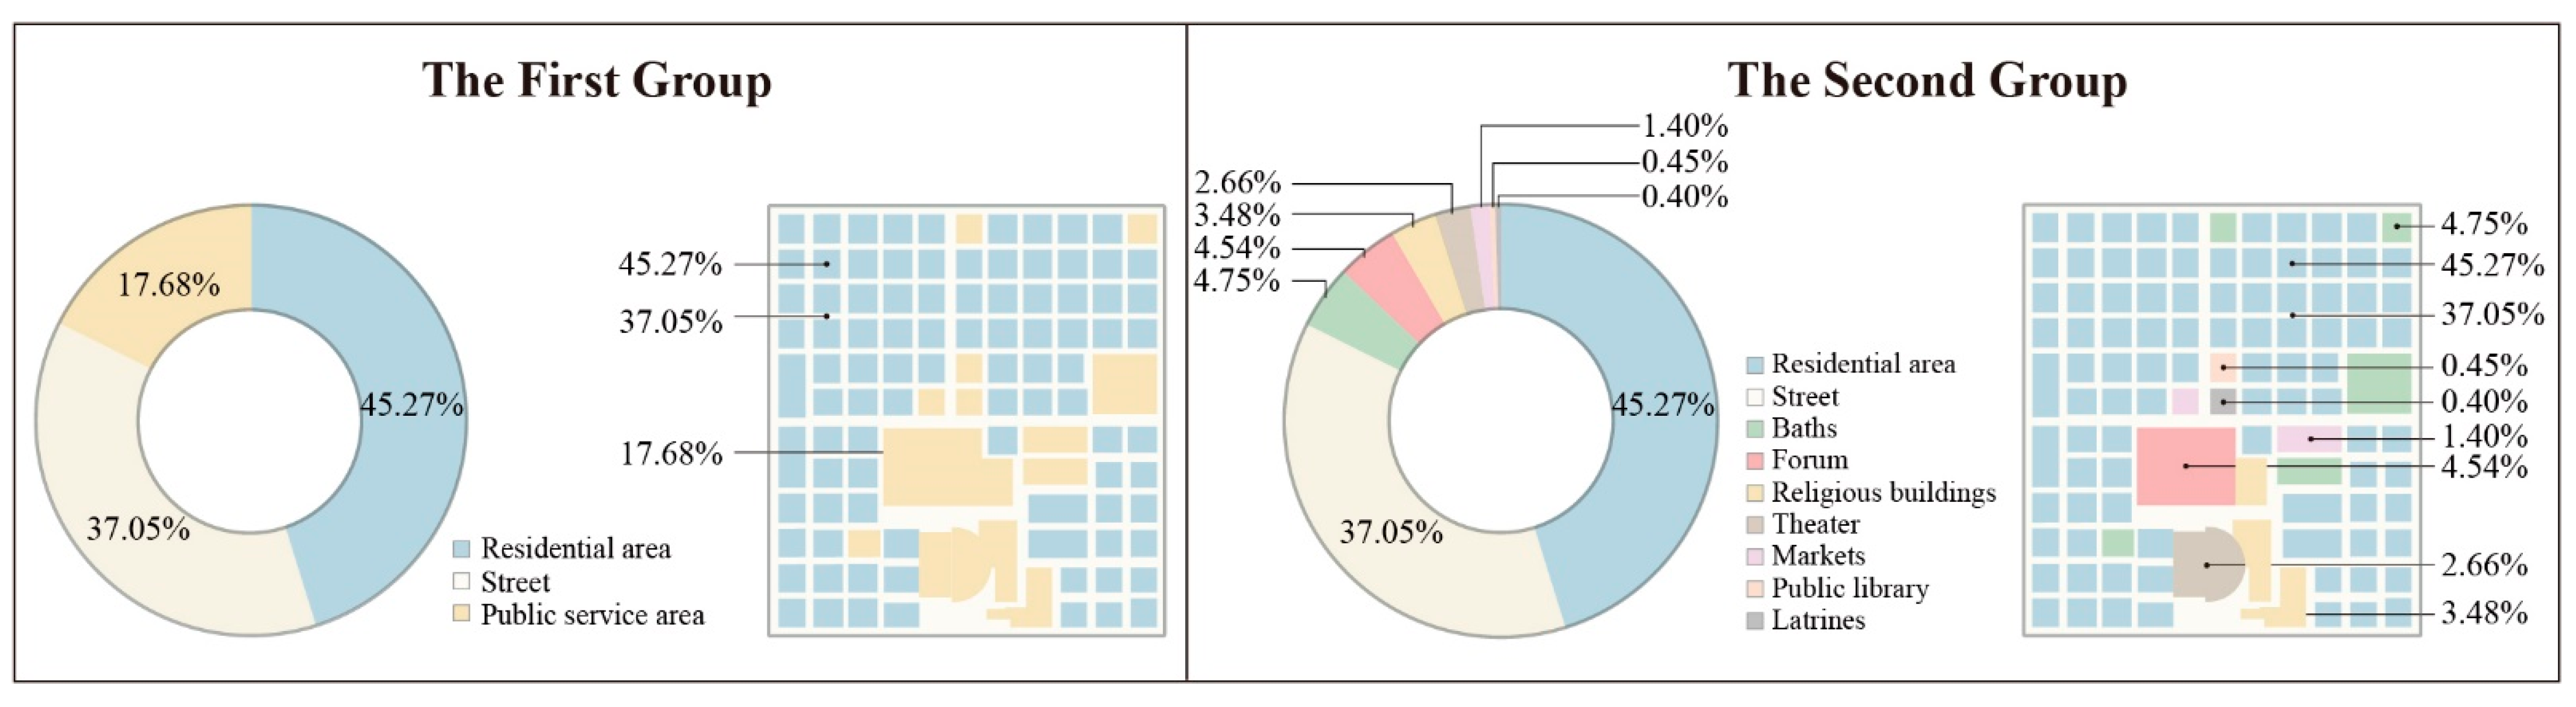
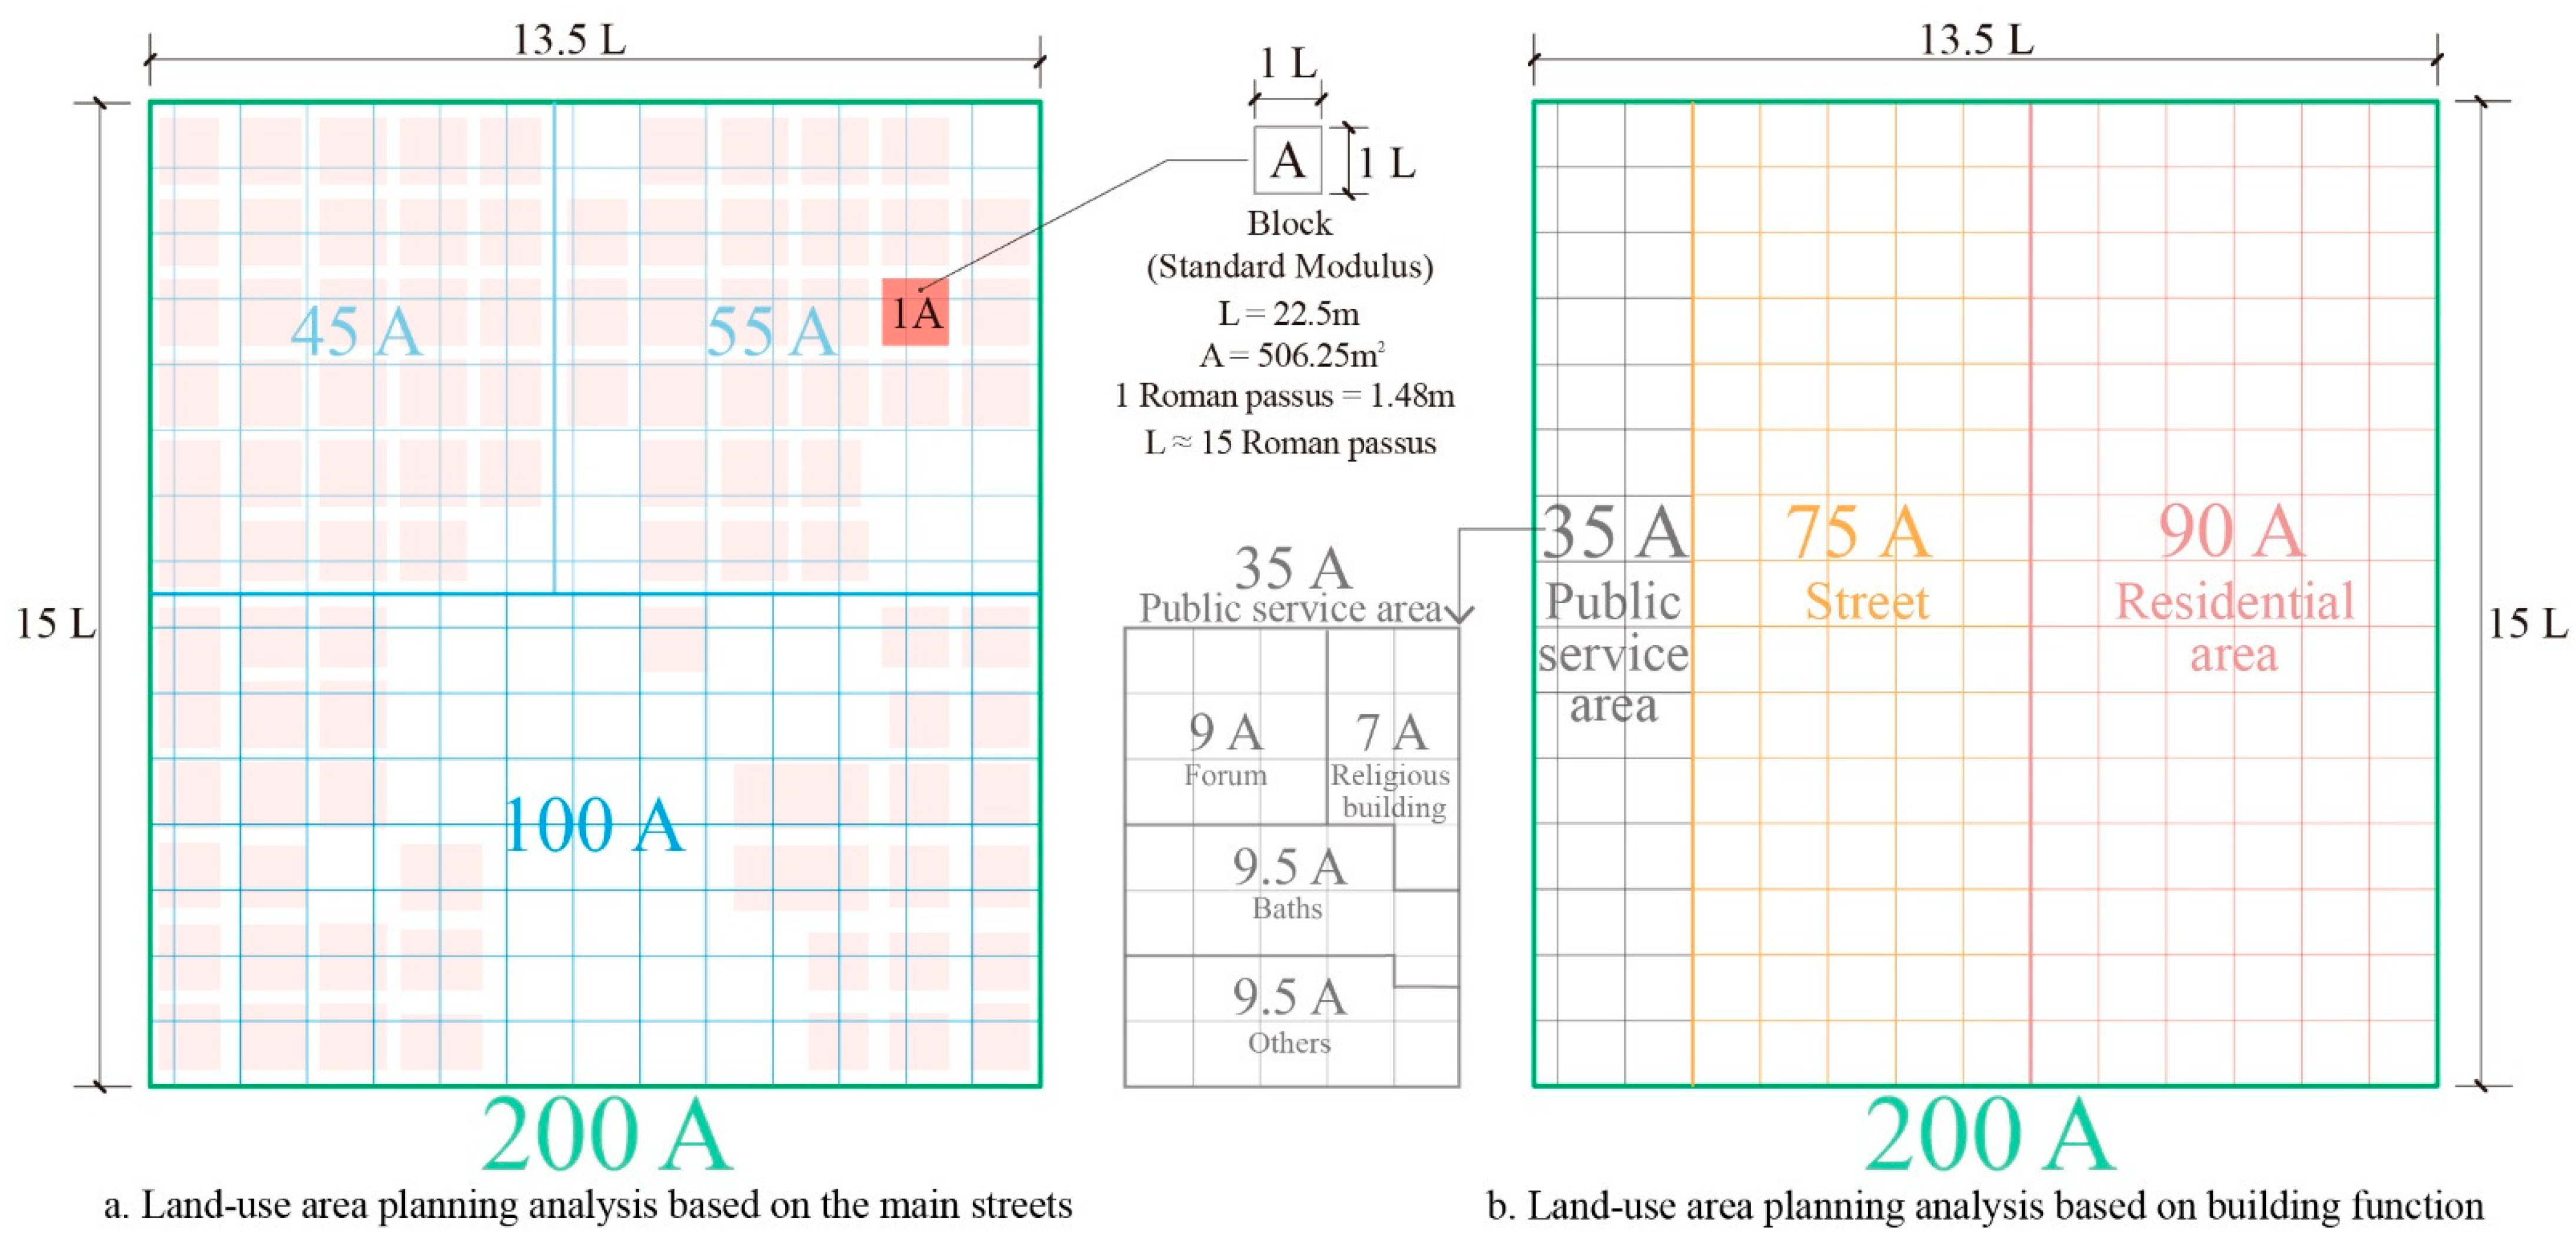
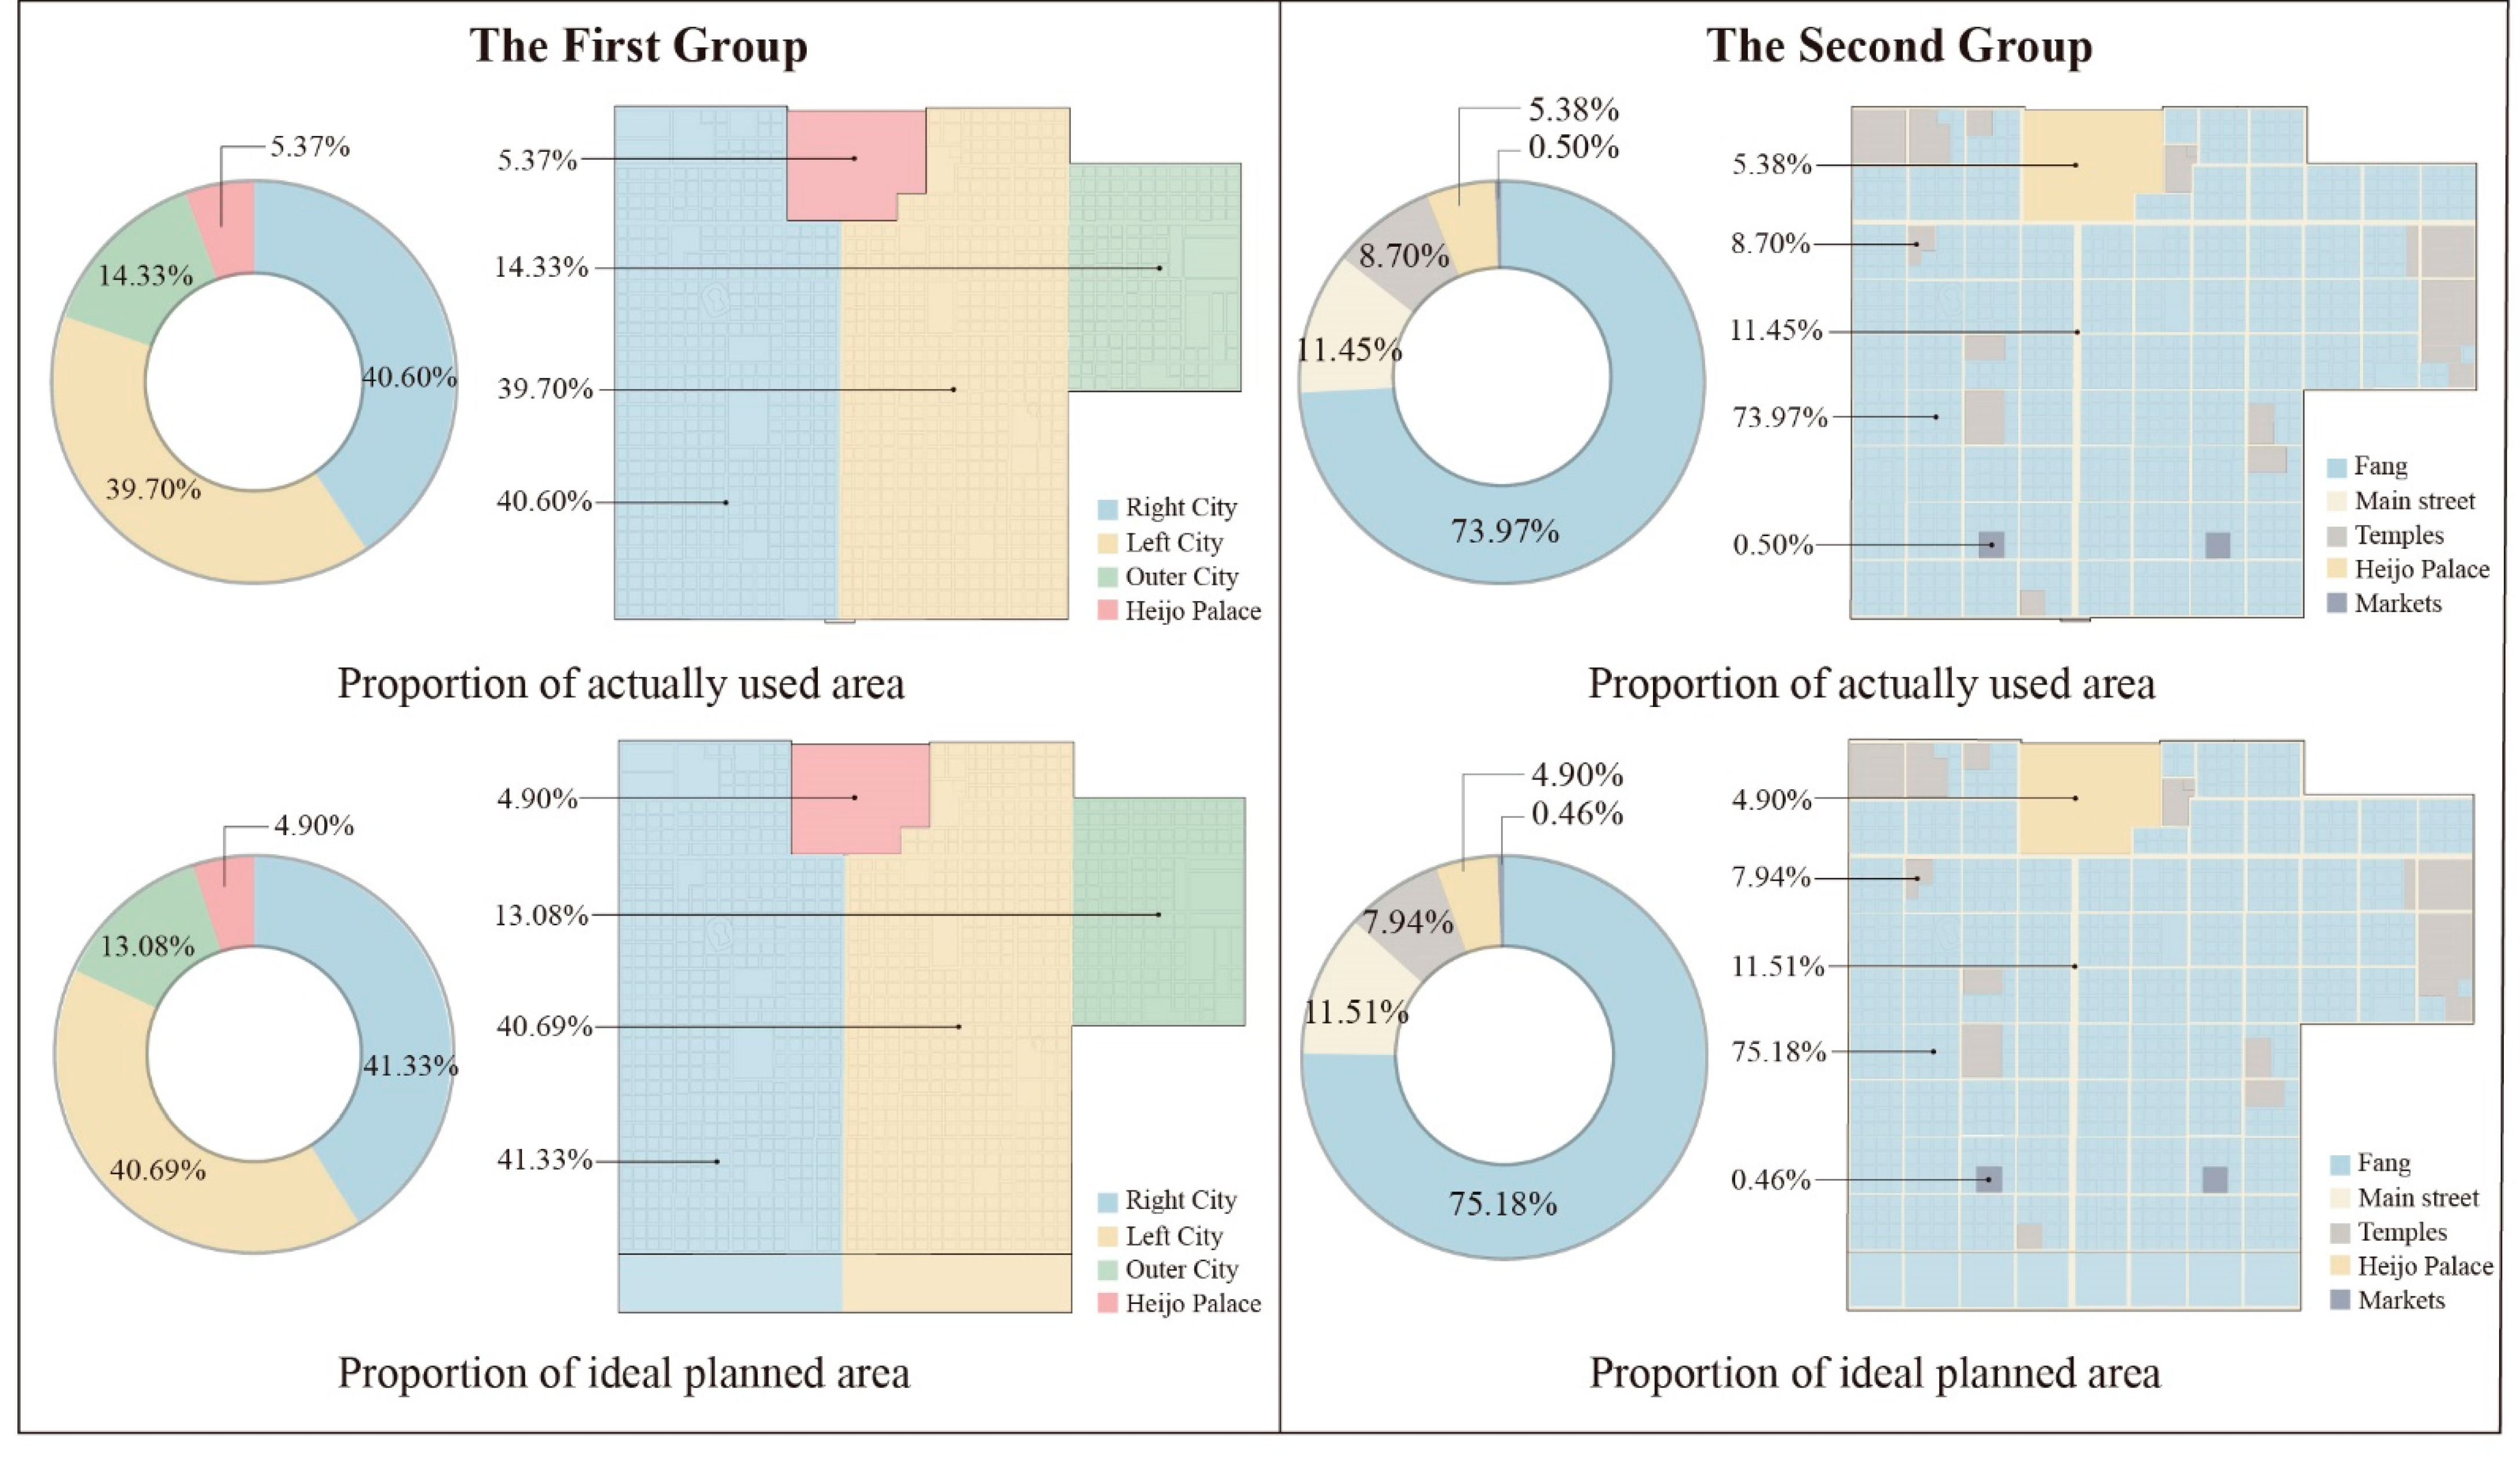
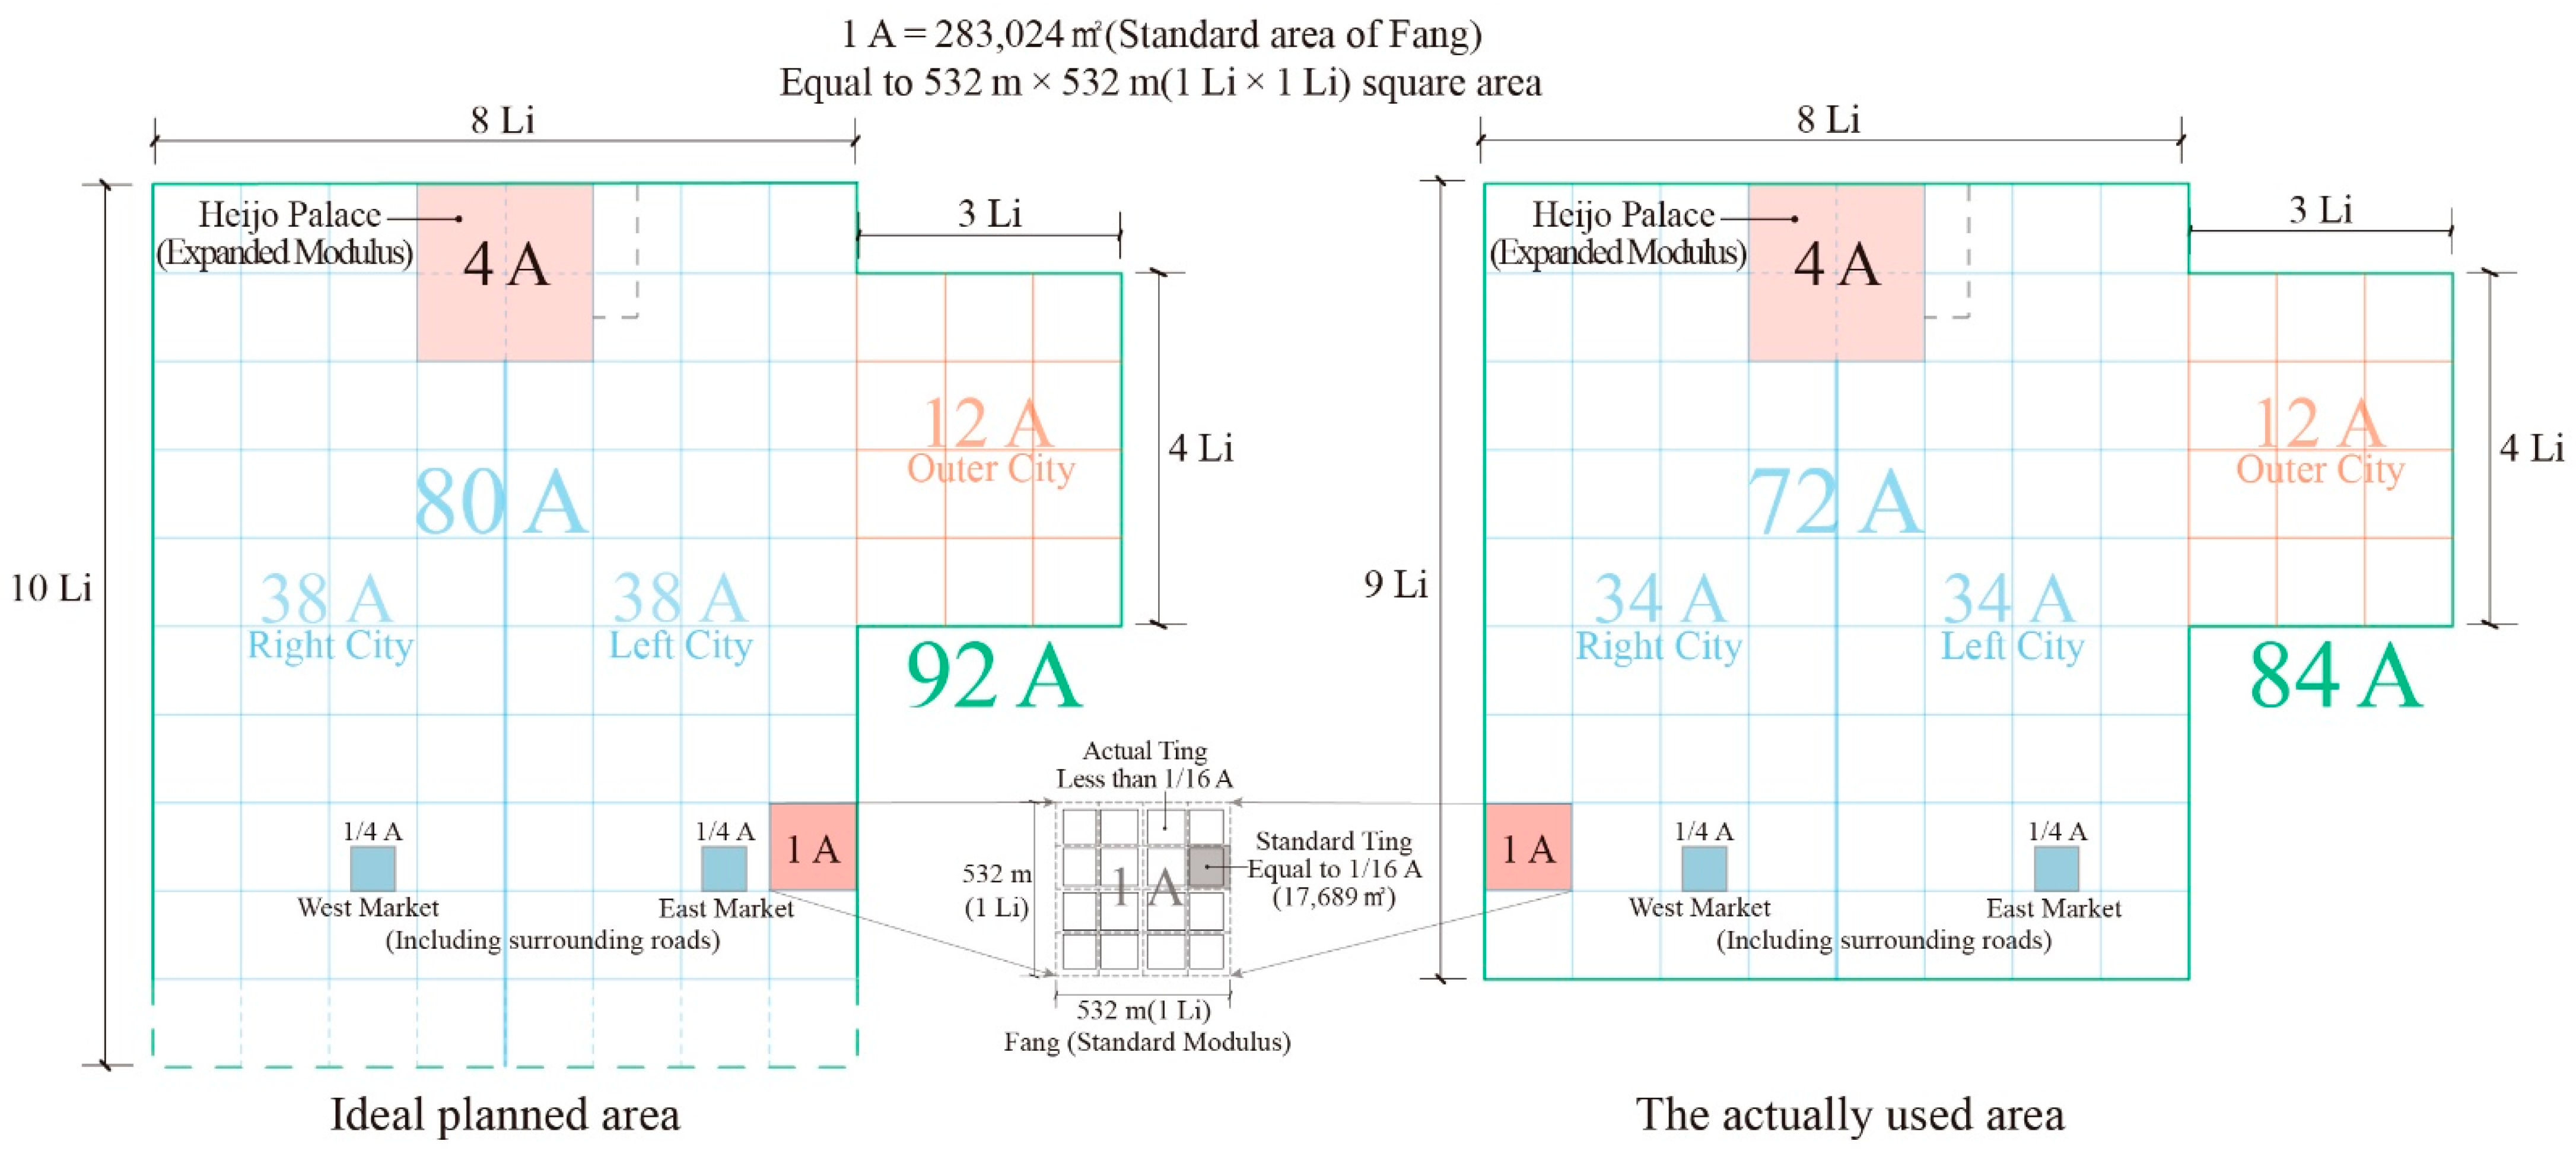
- Ancient urban heritage contains wisdom in urban designing and land planning, which is still enlightening to us today. This method pays special attention to the area modulus as the basic unit in the city, which requires the designer to carefully select the objects corresponding to the modulus and set its area values and to intentionally match the area values of major areas within the city to integer multiples of the modulus. Through area planning, the distribution of the city’s land resources became reasonable and orderly, and it also carried more cultural significance. For the Chang’an City of the Sui and Tang Dynasties, the area of the market (East Market) was taken as the modulus A (its area was equivalent to the area of a square with a side length of 1.8 Li), the area of Daxing Palace was the expanded modulus 2A, the area of the rectangular urban area was about 90A, and the square area enclosed by the outermost of the capital was 100A; the area of important areas in the city were an integral multiple or half of the modulus value (such as 10A, 30A, 45A). This gave all of the key values (4.5, 5.5, 10, 25, 30, 100, etc.) and numerical ratios (12:10, 1.618:1, 9:5, 45:1, 2:1, etc.) cultural significance (most of them are closely related to cosmology and imperial supremacy), and the corresponding measured values have a high degree of coincidence with the ideal values. These reflect the unique capital design concepts and highly advanced construction abilities of the ancients in the Sui and Tang Dynasties. In addition, there are similar phenomena in some cities around the world. In Timgad in ancient Rome, the area of a block was taken as the modulus A (its area was the area of a square of land with sides of 15 Roman passus), the area of the whole city was 200A, the area of the residential area was 90A, the area of the streets was 75A, and the area of the public services was 35A (the areas of the forum, bathhouse, religion, and other buildings were all integral multiples or half of the modulus value). In Heijo-kyo in Japan, the area of Fang was taken as the modulus A (its area was the area of a square with a side length of 1 Li), and the area of the whole city was 84A, of which the area of Heijo-kyo as the expanded modulus was 4A, the area of both the Left City and Right City was 34A, and the area of the Outer City was 12A.
- For a city, both urban form design and land use planning are very important, playing simultaneous roles. The former pays more attention to the style of the city’s plan, applying specific geometric shapes (such as squares, rectangles, circles, etc.) and the size modulus (well known by scholars), as well as other related concepts. The latter pays more attention to the method of resource distribution in the city. From our research cases, many ancient cities have the concept of area modulus, and the areas of their main regions also comply with integer multiples of the modulus value, which reflect rational design thought. From a practical perspective, it is necessary for the designers to first determine the overall scale of the city and the land occupation scale of its various elements to meet the real needs of a specific number of people for resources. Therefore, land use planning may have temporal priority compared to urban form design. Additionally, under the same construction cost, the area enclosed by a square of equal side length is larger than that of a rectangular and other irregular shape. The square plot has relatively higher efficiency in resource utilization, which better explains why ancient cities often have a grid-shape form, and why the shapes of their basic units are mostly close to squares. This is an important reflection of how land use planning thinking influences urban form design. Of course, more changes may occur in the subsequent city form design process, and the objects that exist in large quantities in the city may not necessarily be the objects corresponding to the area modulus. For example, in Chang’an city of the Sui and Tang dynasties, there are hundreds of residential areas called “Lifang”, which vary in size and are not the objects corresponding to the area modulus. However, in ancient Roman Timgad and Japanese Heijo-kyo, the residential unit plots are indeed the objects corresponding to the area modulus of their respective cities. The grid-shaped cities, by setting area modulus and modulus values of each region, effectively achieved rational land distribution and order establishment, which significantly helped in advancing ancient civilizations. If we fully recognized the role of land use planning, it would have a positive significance for better understanding and protecting the heritage of ancient cities and could also provide insights for solving real urban problems.
- Remote sensing technology, which is constantly developing, provides important help for the understanding of urban heritage and historical geography. It is often closely combined with GIS, making it possible to carry out detailed academic research on a large spatial scale through clear satellite images and accurate positioning. It is also able to integrate with humanities to give monotonous data a special meaning belonging to different civilizations. Multidisciplinary methods and knowledge create more open and efficient systems to help researchers dig deeper into historical information and ancient ideas, thereby revealing the rich value of urban heritage in a more comprehensive way, strengthening the work related to heritage conservation and display, and promoting the harmonious development of human beings.
Author Contributions
Funding
Data Availability Statement
Acknowledgments
Conflicts of Interest
References
- Donati, J.C. The Identification of Land Divisions in the Ancient Mediterranean through Integrated Remote Sensing and GIS Applications; LAC2014 Proceedings; Vrije Universiteit Amsterdam: Amsterdam, The Netherlands, 2020. [Google Scholar]
- Hammer, E.; Stone, E.; McMahon, A. The structure and hydrology of the early dynastic city of lagash (tell al-hiba) from satellite and aerial images. Iraq 2022, 84, 103–127. [Google Scholar] [CrossRef]
- Xin, L.; Chen, B.; Guo, Y. Preliminary Report in 2022 excavation of the northeastern corner double-walled city and the Shiwangzhai site. Relics Mus. 2023, 1, 3–9. [Google Scholar]
- Maier, J. Rome Measured and Imagined: Early Modern Maps of the Eternal City; University of Chicago Press: Chicago, IL, USA, 2015. [Google Scholar]
- Baker, H.D. Urban form in the first millennium BC. In The Babylonian World; Gwendolyn Leick; Routledge: New York, NY, USA; London, UK, 2009; pp. 66–77. [Google Scholar]
- Bachagha, N.; Wang, X.; Luo, L.; Li, L.; Khatteli, H.; Lasaponara, R. Remote sensing and GIS techniques for reconstructing the military fort system on the Roman boundary (Tunisian section) and identifying archaeological sites. Remote Sens. Environ. 2020, 236, 111418. [Google Scholar] [CrossRef]
- Wang, S.S. The structure of ancient Chinese urban construction land from Hejin and Hancheng. J. Xi’an Univ. Archit. Technol. Nat. Sci. Ed. 2009, 3, 391–396. [Google Scholar]
- Li, X.X.; Wang, S.S.; Wang, L. The Change of Urban Functions from the Evolution of Construction Land Structure: Taking Chengcheng County in Shaanxi Province as an Example. Mod. Urban Stud. 2016, 10, 53–60. [Google Scholar]
- Wang, X.K. Space Research on Ancient City of Guangfu Based on Spatial Syntax. Master’s Thesis, Hebei University of Engineering, Handan, China, 2020. [Google Scholar]
- Jiang, J.L.; Xu, X.Y.; Sun, D.Q.; Li, Y. Research on Spatial Evolution of Ancient City of Guangzhou in Modern Times Based on Improved Space Syntax. Areal Res. Dev. 2018, 37, 54–59. [Google Scholar]
- Wang, J.F.; Guo, J.P.; Yuan, Y. Spatial Morphological Analysis and Landscape Design of Ancient City: A Case Study of Taigu Ancient City Space. J. Agron. 2016, 6, 60–67. [Google Scholar]
- Zou, L.L.; Wang, J.Y. Analysis of Spatial Structure of Old Town Land Based on Spatial Syntax: A Case Study of Quanzhou Ancient City. China Land Sci. 2016, 30, 63–70. [Google Scholar]
- Kang, D. Inside and Outside of the Silla Capital: An Analysis of Urban Spatial Structure Using GIS. J. Korean Bus. Exam. 2020, 108, 61–92. [Google Scholar] [CrossRef]
- Silvestru, C.; Wien, T. The late medieval street layout of Vienna: Digital 2D reconstruction and Space Syntax analysis of the public space. In Proceedings of the 2013 Digital Heritage International Congress (Digital Heritage), Marseille, France, 28 October–1 November 2013. [Google Scholar]
- Yin, L.; Wang, T.; Adeyeye, K. A Comparative Study of Urban Spatial Characteristics of the Capitals of Tang and Song Dynasties Based on Space Syntax. Urban Sci. 2021, 2, 34. [Google Scholar] [CrossRef]
- Abdelhalim, A.; Ammar, M. Spatial configuration analysis via digital tools of the archeological Roman town Timgad, Algeria. Mediterr. Archaeol. Archaeom. 2021, 21, 71–84. [Google Scholar]
- Garau, C.; Annunziata, A.; Claudia, Y. Investigating the socio-spatial logic of historic urban areas through space syntax: A comparative analysis of the Roman towns Cosa, Nora, Timgad and Thuburbo Majus. TEMA 2023, 16, 201–219. [Google Scholar]
- Bill, H.; Julienne, H. The Social Logic of Space; Cambridge University Press: Cambridge, UK, 1989. [Google Scholar]
- Hillier, B. Cities as movement economies. In Intelligent Environments; North-Holland: Amsterdam, The Netherlands, 1997; Volume 1, pp. 295–344. [Google Scholar]
- Yang, C. Research on the composition and scale of urban land-use in Yuandu based on ArcGIS. Beijing Hist. 2019, 2, 119–140. [Google Scholar]
- Su, Y. Study on the Urban Functional Structure and Land-Use Scale of Xi’an in the Ming and Qing Dynasties. Master’s Thesis, Xi’an University of Architecture and Technology, Xi’an, China, 2015. [Google Scholar]
- Lin, Y.N.; Jin, X.B.; Yang, X.H.; Long, Y.; Guo, B.B.; Han, J.; Zhou, Y.K. Data set establishment and spatial reconstruction of built-up area in the Mid Qing Dynasty: Method and case study. Geogr. Res. 2015, 12, 2329–2342. [Google Scholar]
- Jin, X.; Pan, Q.; Yang, X.; Bai, Q.; Zhou, Y. Reconstructing the historical spatial land-use pattern for Jiangsu Province in mid-Qing Dynasty. J. Geogr. Sci. 2016, 26, 1689–1706. [Google Scholar] [CrossRef]
- He, F.; Ge, Q.; Zheng, J.J. Reckoning the areas of urban land-use and their comparison in the Qing Dynasty in China. Acta Geogr. Sin. Chin. Ed. 2002, 57, 709–716. [Google Scholar]
- Ai, W.; Zhuang, D.F.; Liu, Y.Z. Analysis of 100-year changes in urban land-use in Beijing. Geo-Inf. Sci. 2008, 4, 489–494. [Google Scholar]
- Palladio, A. The Four Books of Architecture; Dover Publications Inc.: Mineola, NY, USA, 1968. [Google Scholar]
- Spiro, K. The City Shaped: Urban Patterns and Meanings Through History; Thames & Hudson Press: London, UK, 1999. [Google Scholar]
- Wang, N. A Study on the Composition Proportion of Ancient Chinese Capitals, Architectural Complexes and Individual Buildings; China City Publishing House, China Architecture & Building Press: Beijing, China, 2018. [Google Scholar]
- Fu, X.N. A discussion of the planning techniques of Luoyang City in Chang’an, Sui and Tang Dynasties. Cult. Relics 1995, 3, 48–63. [Google Scholar]
- Wang, S.S. An analysis of the planning techniques of Chang’an City in the Sui and Tang Dynasties. Urban Plan. 2009, 33, 55–58. [Google Scholar]
- Peixoto, R.F.; Florenzano, M.B.B. A Gulliverian orthogonal planning: A modular reading of Classical Thourioi. UFF Hist. Dep. Time Rev. 2021, 1, 1–27. [Google Scholar]
- Park, E.; Shaikh, J.M. A Blockchain Model (BCM) study of the Syntactic and Semantic grid in Urban History and its origin from the Indus Script Pictorial Form. South. J. Res. 2023, 3, 28–37. [Google Scholar]
- Institute of Archaeology of Chinese Academy of Social Sciences; Xi’an Chang’an Site Protection Center of Sui and Tang Dynasties; Xi’an World Heritage Monitoring and Management Center. Archaeological Data of Chang’an City Site in Sui and Tang Dynasties; Cultural Relics Publishing House: Beijing, China, 2017. [Google Scholar]
- Wu, T.H. Regulation: Spatial Planning and Habitat Construction in China; China City Press: Beijing, China, 2020. [Google Scholar]
- Zhang, J. Ancient Chinese Spatial Culture Tracing; Tsinghua University Press: Beijing, China, 2016. [Google Scholar]
- Wu, L.Y. History of Chinese Habitat; China Architecture & Building Press: Beijing, China, 2014. [Google Scholar]
- Wu, H.Y. Numerical Culture in China; Yuelu Press: Changsha, China, 2013. [Google Scholar]
- Chen, Y.L. Exploration on the Cultural Connotation of English and Chinese Numerical Digits. Adv. Soc. Sci. Educ. Humanit. Res. 2018, 103, 552–555. [Google Scholar]
- Ji, C. The I Ching or Book of Changes; Richard, W., Cary, F.B., Eds.; Princeton University Press: Princeton, NJ, USA, 1997. [Google Scholar]
- Zhou, G. The Rites of the Zhou; Xu, Z.Y., Chang, P.Y., Eds.; China Book Bureau Press: Beijing, China, 2014. [Google Scholar]
- Anonymous. Chou Pei Suan Ching; Jiang., X.Y., Xie., J., Eds.; Liaoning Education Press: Shenyang, China, 1996. [Google Scholar]
- Liu, A. Huainanzi; Gu, Q., Ed.; Zhonghua Book Company: Beijing, China, 2009. [Google Scholar]
- Chen, S.; Xu, X.; Sun, K.; Dong, Y.; Yu, M.; Hu, Q.; Gong, J. New Archaeological Discoveries Based on Spatial Information Technology and Cultural Analysis: Taking the Study of the Spatial Relationship between Ancient Chinese Capitals and the Natural Environment as an Example. Remote Sens. 2022, 14, 3298. [Google Scholar] [CrossRef]
- Su, B.; Tang, S. Chang’an City and Luoyang City. Archaeology 1978, 6, 409–425. [Google Scholar]
- Ma, D.Z.; Yang, H.X. Discussion on the scope of Tang Chang’an Donggong. Archaeology 1978, 1, 60–64. [Google Scholar]
- Salat, S. Integrated Guidelines for Sustainable Neighbourhood Design; Urban Morphology and Complex Systems Institution: Paris, France, 2021; p. 15. [Google Scholar]
- William, L. The Britannica Guide to Numbers and Measurement; The Rosen Publishing Group: New York, NY, USA, 2010; p. 206. [Google Scholar]
- Wei, Z. A Study on the Spatial Form and Migration Process of the Nara Era Capital in Japan. Ph.D. Thesis, Northeast Normal University, Changchun, China, 2022. [Google Scholar]
- Nara National Research Institute for Cultural Properties. Sino-Japanese Ancient Capital Catalog: 50th Anniversary; Gubapro: Tokyo, Japan, 2009. [Google Scholar]
- Yamatokoriyama City Board of Education; Gangoji Institute for Research of Cultural Property. Heijokyo Jujo Excavation Survey Report; Yamatokoriyama City Board of Education: Nara, Japan, 2014. [Google Scholar]
- Hui, W. The Transformation of Tiaofang Planning in Japanese Historical Capital Cities. Urban Plan. Int. 2007, 1, 77–83. [Google Scholar]


| Designated Study Area Number (i) | Group | Area Name |
|---|---|---|
| 1 | Group 1 of functional areas | Imperial City |
| 2 | Royal City | |
| 3 | Outer Subcity | |
| 4 | Group 2 of functional areas | Daxing Palace |
| 5 | East Palace | |
| 6 | Yeting Palace | |
| 7 | Royal City | |
| 8 | West Market | |
| 9 | East Market | |
| 10 | Residential Area | |
| 11 | Outer Subcity Street |
| Designated Study Area Number (j) | Area Name | Designated Study Area Number (j) | Area Name |
|---|---|---|---|
| 1 | The outermost enclosed square area of the city (from the southernmost to the south boundary of Lotus Park) | 20 | Urban area to the east of Qixiamen Street |
| 2 | Rectangular urban area (the sum of urban functional areas) | 21 | Area to the east of Anhuamen Street, the west of Qixiamen Street, and the south of Jinguangmen Street |
| 3 | Small city area (Imperial City and Royal City area) | 22 | Urban area to the north of Yanpingmen Street and the west of Zhuque Street |
| 4 | Two markets area | 23 | Urban area to the north of Yanpingmen Street and the east of Zhuque Street |
| 5 | Imperial City, Royal City, two markets area | 24 | Outer Subcity area to the north of Yanpingmen Street |
| 6 | East Palace and Yeting Palace area | 25 | Outer Subcity area to the north of Yanpingmen Street and the west of Zhuque Street |
| 7 | Urban area to the east of Zhuque Street | 26 | Outer Subcity area to the north of Yanpingmen Street and the east of Zhuque Street |
| 8 | Urban area to the west of Zhuque Street | 27 | Area to the north of Jinguangmen Street and the west of Zhuque Street |
| 9 | Outer Subcity area to the east of Zhuque Street | 28 | Area to the north of Jinguangmen Street and the east of Zhuque Street |
| 10 | Outer Subcity area to the west of Zhuque Street | 29 | Area to the south of Jinguangmen Street and the east of Zhuque Street |
| 11 | Urban area to the north of Jinguangmen Street | 30 | Area to the south of Jinguangmen Street and the west of Zhuque Street |
| 12 | Urban area to the south of Jinguangmen Street | 31 | Area to the south of Yanpingmen Street and the east of Zhuque Street |
| 13 | Urban area to the north of Yanpingmen Street | 32 | Area to the south of Yanpingmen Street and the west of Zhuque Street |
| 14 | Urban area to the south of Yanpingmen Street | 33 | Outer Subcity area to the north of Jinguangmen Street and the west of Zhuque Street |
| 15 | Urban area to the west of Anhuamen Street | 34 | Outer Subcity area to the north of Jinguangmen Street and the east of Zhuque Street |
| 16 | Urban area to the east of Anhuamen Street | 35 | Area to the south of Jinguangmen Street and the north of Yanpingmen Street |
| 17 | Outer Subcity area to the east of Anhuamen Street | 36 | Area to the north of Yanpingmen Street, the south of Jinguangmen Street, and the west of Zhuque Street |
| 18 | Outer Subcity area to the west of Qixiamen Street | 37 | Area to the north of Yanpingmen Street, the south of Jinguangmen Street, and the east of Zhuque Street |
| 19 | Urban area to the west of Qixiamen Street | 38 | Outer Subcity area to the north of Jinguangmen Street |
| NO (n) | Commonly Used Numbers or Numerical Ratios in Ancient Times (Rn) | Cultural Significance | NO (n) | Commonly Used Numbers or Numerical Ratios in Ancient Times (Rn) | Cultural Significance |
|---|---|---|---|---|---|
| 1 | 1 (1:1) | The number of Taiji (太极) | 33 | 60 (60:1) | The number of heavenly stems and earthly branches (天干地支), double number of earth |
| 2 | 2 (2:1) | The number of Yin (阴) and Yang (阳) | 34 | 64 (64:1) | The number of trigrams (卦) in The Book of Changes, the eight–eight multiplier |
| 3 | 3 (3:1) | The number of three forces (三才) | 35 | 72 (72:1) | Multiplier of Shaoyin and Taiyang |
| 4 | 4 (4:1) | The number of four images (四象), the two–two multiplier | 36 | 80 (80:1) | The sum of double Chengshu |
| 5 | 5 (5:1) | The number of five elements (五行) | 37 | 81 (81:1) | The number of Huangzhong (黄钟), the ninety-nine multiplier |
| 6 | 6 (6:1) | The number of Taiyin (太阴) | 38 | 90 (90:1) | Double Nine-Five Extreme number |
| 7 | 7 (7:1) | The number of Shaoyang (少阳) | 39 | 100 (100:1) | The number of a hundred years, the ten–ten multiplier |
| 8 | 8 (8:1) | The number of Shaoyin (少阴) | 40 | 360 (360:1) | The number of circumference of The sum of the number of Qianzhice (乾之策, the number is 216) and Kunzhice (坤之策, the number is 144), the number of the universe (周天) |
| 9 | 9 (9:1) | The number of Taiyang (太阳), the three–three multiplier | 41 | 1.125 (9:8) | The ratio of Taiyang to Shaoyin |
| 10 | 10 (10:1) | The number of Heavenly Stems (天干) | 42 | 1.155 (2:√3) | The ratio of side length to height of regular triangle, close to the ratio of Shaoyin to Shaoyang |
| 11 | 12 (12:1) | The number of Earthly Branches (地支) | 43 | 1.167 (7:6) | The ratio of Shaoyang to Taiyin |
| 12 | 14 (14:1) | Double number of Shaoyang | 44 | 1.2 (12:10) | The ratio of Earthly Branches to Heavenly Stems |
| 13 | 15 (15:1) | The sum of the number of Shengshu (生数, 1 + 2 + 3 + 4 + 5), the three–five multiplier | 45 | 1.286 (9:7) | The ratio of Taiyang to Shaoyang |
| 14 | 16 (16:1) | The number of Fuxi (伏羲) trigrams, the four–four multiplier | 46 | 1.414 (√2:1) | The ratio of the number of round sky and square earth (ratio of the circle diameter to side length of the inscribed square) |
| 15 | 18 (18:1) | Double number of Taiyang (太阳) | 47 | 1.5 (3:2) | The ratio of Heaven and Earth, the ratio of Taiyang to Taiyin |
| 16 | 20 (20:1) | The number of double tens | 48 | 1.6 (16:10) | The number of Fuxi trigrams, the four–four multiplier |
| 17 | 24 (24:1) | Double number of Earthly Branches (地支) | 49 | 1.618 (√5/2–1/2) | Golden ratio |
| 18 | 25 (25:1) | The number of heaven (天数) in The Book of Changes (the sum of the odd numbers of 1–10), the five–five multiplier | 50 | 1.667 (5:3) | The ratio of the number of five elements to the number of three forces, approximate golden ratio |
| 19 | 27 (27:1) | Triplex number of Taiyang (太阳) | 51 | 1.8 (9:5) | The ratio of the supreme number |
| 20 | 28 (28:1) | Number of Twenty-eight stars (二十八宿) | 52 | 2.5 (25:10) | The number of heaven in The Book of Changes, the five–five multiplier |
| 21 | 30 (30:1) | The number of earth (地数) in The Book of Changes (the sum of the even numbers of 1–10) | 53 | 3.2 (32:10) | Half of the number of trigrams in The Book of Changes |
| 22 | 32 (32:1) | Half of the number of trigrams in The Book of Changes | 54 | 3.6 (36:10) | Taixuan number, the sixth–six multiplier |
| 23 | 36 (36:1) | Taixuan (太玄) number, the six–six multiplier | 55 | 4.2 (42:10) | Multiplier of Taiyin and Shaoyang |
| 24 | 40 (40:1) | The sum of the numbers of Chengshu (成数, 6 + 7 + 8 + 9 + 10), the five–eight multiplier | 56 | 4.5 (45:10) | Supreme number, the sum of the number of the venation map |
| 25 | 42 (42:1) | Multiplier of Taiyin and Shaoyang | 57 | 4.9 (49:10) | The used number of Great Expansion, the seven–seven multiplier |
| 26 | 45 (45:1) | Supreme number (九五至尊之数), the sum of the number of the venation map (洛书) | 58 | 5.4 (54:10) | Multiplier of Taiyin and Taiyang |
| 27 | 48 (48:1) | Quadruple number of Earthly Branches (地支) | 59 | 5.5 (55:10) | The number of heaven and earth, the sum of the number of the galaxy map |
| 28 | 49 (49:1) | The used number of Great Expansion (大衍所用之数), the seven–seven multiplier | 60 | 5.6 (56:10) | Multiplier of Shaoyin and Shaoyang |
| 29 | 50 (50:1) | The number of Great Expansion (大衍之数), double number of heaven | 61 | 6.4 (64:10) | The number of trigrams in The Book of Changes, the eight–eight multiplier |
| 30 | 54 (54:1) | Multiplier of Taiyin and Taiyang | 62 | 7.2 (72:10) | Multiplier of Shaoyin and Taiyang |
| 31 | 55 (55:1) | The number of heaven and earth (天地之数), the sum of the number of the galaxy map (河图) | 63 | 7.5 (75:10) | Half of the number of Taiyin and Taiyang |
| 32 | 56 (56:1) | Multiplier of Shaoyin and Shaoyang | 64 | 8.1 (81:10) | The number of Huangzhong, the ninety-nine multiplier |
| Group | Name of the Element or Area | Measured Area Value | Proportion of the Rectangular Urban Area (%) | Name of the Element or Area | Measured Area Value | Proportion of the Irregular Urban Area (Including Lotus Park) (%) |
|---|---|---|---|---|---|---|
| Group 1 | Imperial City | 4,132,160 m2 | 5.04 | Imperial City | 4,132,160 m2 | 4.96 |
| Royal City | 5,017,224 m2 | 6.11 | Royal City | 5,017,224 m2 | 6.02 | |
| Outer Subcity | 72,934,520 m2 | 88.85 | Outer Subcity (including Lotus Park) | 74,210,559 m2 | 89.02 | |
| Group 2 | Daxing Palace | 1,872,200 m2 | 2.28 | Daxing Palace | 1,872,200 m2 | 2.25 |
| East Palace | 1,220,260 m2 | 1.49 | East Palace | 1,220,260 m2 | 1.46 | |
| Yeting Palace | 1,039,700 m2 | 1.27 | Yeting Palace | 1,039,700 m2 | 1.25 | |
| Royal City | 5,017,224 m2 | 6.11 | Royal City | 5,017,224 m2 | 6.02 | |
| West Market | 955,737 m2 | 1.16 | West Market | 955,737 m2 | 1.15 | |
| East Market | 924,000 m2 | 1.13 | East Market | 924,000 m2 | 1.11 | |
| Residential area (regardless of Lotus Park, the vacancy is complemented in a symmetrical position) | 56,050,150 m2 | 68.28 | Residential area (considering the influence of the north of Lotus Park) | 55,479,109 m2 | 66.55 | |
| Outer Subcity Street | 15,004,633 m2 | 18.28 | Outer Subcity Street (considering the influence of the north of Lotus Park) | 14,873,262 m2 | 17.84 | |
| Lotus Park area | 1,978,451 m2 | 2.37 | ||||
| The Overall Chang’an City of the Sui and Tang Dynasties | Regular rectangular city | 82,083,904 m2 | 100.00 | Irregular city (including Lotus Park in the southeast corner of the city) | 83,359,943 m2 | 100.00 |
| The above data were used in this study. | The above data were not used in this study and are for reference only. | |||||
| Functional Area Name | The Number of Objects Whose Modulus Values Have Cultural Significance under the Threshold of 98.5% | The Number of Objects Whose Modulus Values Have Cultural Significance under the Threshold of 99.5% |
|---|---|---|
| East Market | 27 | 8 |
| Daxing Palace | 14 | 9 |
| (called Taiji Palace in the Tang Dynasty) | 13 | 5 |
| Yeting Palace | 12 | 4 |
| Small city area (Imperial City and Royal City area) | 10 | 4 |
| Royal City | 10 | 5 |
| East Palace | 9 | 3 |
| West Market | 8 | 2 |
| Area Type | Name of the Element or Area | Area Modulus Value (Take the Measured Area of 924,000 m2 of East Market as Modulus A) | Cultural Significance of the Value | Area Value Converted by the Modulus Value | Measured Area Value | Coincidence (%) |
|---|---|---|---|---|---|---|
| Urban functional area | East Market | 1 A | The number of Taiji (太极) | 924,000 m2 | 924,000 m2 | 100.00 |
| Imperial City | 4.5 A | Supreme number (至尊之数), the sum of the number of the venation map (洛书) | 4,158,000 m2 | 4,132,160 m2 | 99.38 | |
| Royal City | 5.5 A | The number of heaven and earth (天地之数), the sum of the number of the galaxy map (河图) | 5,082,000 m2 | 5,017,224 m2 | 98.73 | |
| Outer Subcity | 80 A | The sum of double Chengshu (成数) | 73,920,000 m2 | 72,934,520 m2 | 98.67 | |
| Daxing Palace | 2 A | The number of Yin (阴) and Yang (阳) | 1,848,000 m2 | 1,872,200 m2 | 98.71 | |
| Residential Area | 60 A | The number of heavenly stems and earthly branches (天干地支) | 55,440,000 m2 | 56,050,150 m2 | 98.91 | |
| Outer Subcity Street | 16 A | The number of Fuxi (伏羲) trigrams, the four–four multiplier | 14,784,000 m2 | 15,004,633 m2 | 98.53 | |
| Designated study area | Rectangular urban area (the sum of urban functional areas) | 90 A | Double Nine-Five extreme number | 83,160,000 m2 | 82,083,904 m2 | 98.71 |
| The outermost enclosed square area of the city (from the southernmost to the south boundary of Lotus Park) | 100 A | The number of a hundred years, the ten–ten multiplier | 92,400,000 m2 | 92,448,224 m2 | 99.95 | |
| Small city area (Imperial City and Royal City area) | 10 A | The number of Heavenly Stems (天干) | 9,240,000 m2 | 9,149,384 m2 | 99.02 | |
| Imperial City, Royal City, two markets area | 12 A | The number of Earthly Branches (地支) | 11,088,000 m2 | 11,029,121 m2 | 99.47 | |
| Area to the south of Yanpingmen Street and the east of Zhuque Street | 15 A | The sum of the number of Shengshu (生数, 1 + 2 + 3 + 4 + 5), the three–five multiplier | 13,860,000 m2 | 13,994,917 m2 | 99.04 | |
| Area to the east of Anhuamen Street, the west of Qixiamen Street, and the south of Jinguangmen Street | 16 A | The number of Fuxi (伏羲) trigrams, the four–four multiplier | 14,784,000 m2 | 14,979,351 m2 | 98.70 | |
| Area to the north of Jinguangmen Street and the east of Zhuque Street | 18 A | Double number of Taiyang (太阳) | 16,632,000 m2 | 16,486,171 m2 | 99.12 | |
| Outer Subcity area to the north of Yanpingmen Street and the west of Zhuque Street | 24 A | Double number of Earthly Branches (地支) | 22,176,000 m2 | 22,410,620 m2 | 98.95 | |
| Area to the south of Jinguangmen Street and the north of Yanpingmen Street | 24 A | Ditto | 22,176,000 m2 | 22,139,776 m2 | 99.84 | |
| Outer Subcity area to the north of Yanpingmen Street and the west of Zhuque Street | 25 A | The number of heaven (天数) in The Book of Changes (the sum of the odd numbers of 1–10), the five–five multiplier | 23,100,000 m2 | 22,987,647 m2 | 99.51 | |
| Outer Subcity area to the north of Jinguangmen Street | 25 A | Ditto | 23,100,000 m2 | 23,252,712 m2 | 99.34 | |
| Area to the south of Jinguangmen Street and the east of Zhuque Street | 27 A | Triplex number of Taiyang (太阳) | 24,948,000 m2 | 25,272,886 m2 | 98.71 | |
| Urban area to the south of Yanpingmen Street | 30 A | The number of earth (地数) in The Book of Changes (the sum of the even numbers of 1–10) | 27,720,000 m2 | 27,542,067 m2 | 99.36 | |
| Urban area to the west of Anhuamen Street | 30 A | Ditto | 27,720,000 m2 | 28,081,209 m2 | 98.71 | |
| Urban area to the north of Yanpingmen Street and the east of Zhuque Street | 30 A | Ditto | 27,720,000 m2 | 27,764,140 m2 | 99.84 | |
| Urban area to the east of Qixiamen Street | 32 A | Half of the number of trigrams in The Book of Changes | 29,568,000 m2 | 29,325,777 m2 | 99.18 | |
| Outer Subcity area to the east of Zhuque Street | 40 A | The sum of Chengshu (成数, 6 + 7 + 8 + 9 + 10), the five–eight multiplier | 36,960,000 m2 | 36,982,570 m2 | 99.94 | |
| Urban area to the east of Zhuque Street | 45 A | Supreme number (九五至尊之数), the sum of the number of venation map (洛书) | 41,580,000 m2 | 41,759,055 m2 | 99.57 | |
| Outer Subcity area to the east of Anhuamen Street | 49 A | The used number of Great Expansion (大衍所用之数), the seven–seven multiplier | 45,276,000 m2 | 44,858,711 m2 | 99.08 | |
| Outer Subcity area to the north of Yanpingmen Street | 49 A | Ditto | 45,276,000 m2 | 45,392,480 m2 | 99.74 | |
| Urban area to the south of Jinguangmen Street | 54 A | Multiplier of Taiyin (太阴) and Taiyang (太阳) | 49,896,000 m2 | 49,681,837 m2 | 99.57 |
| Area Type | Name of the Element or Area | Area Modulus Value (Taking the Area of 1,872,200 m2 of Daxing Palace as Modulus A’) | Cultural Significance of the Value | Area Value Converted by the Modulus Value | Measured Area Value | Coincidence (%) |
|---|---|---|---|---|---|---|
| Urban functional area | Daxing Palace | 1 A’ | The number of Taiji (太极) | 1,872,200 m2 | 1,872,200 m2 | 100.00 |
| Outer Subcity Street | 8 A’ | The number of Shaoyin (少阴) | 14,977,600 m2 | 15,004,633 m2 | 99.82 | |
| Residential Area | 30 A’ | The number of earth (地数) in The Book of Changes (the sum of the even numbers of 1–10) | 56,166,000 m2 | 56,050,150 m2 | 99.79 | |
| Designated study area | Two markets area | 1 A’ | The number of Taiji (太极) | 1,872,200 m2 | 1,879,73 7m2 | 99.60 |
| Area to the north of Yanpingmen Street, the south of Jinguangmen Street, and the east of Zhuque Street | 6 A’ | The number of Taiyin (太阴) | 11,233,200 m2 | 11,277,969 m2 | 99.60 | |
| Area to the south of Yanpingmen Street and the east of Zhuque Street | 7.5 A’ | Half of the number of Taiyin (太阴) and Taiyang (太阳) | 14,041,500 m2 | 13,994,917 m2 | 99.67 | |
| Area to the east of Anhuamen Street, the west of Qixiamen Street, and the south of Jinguangmen Street | 8 A’ | The number of Shaoyin (少阴) | 14,977,600 m2 | 14,979,351 m2 | 99.99 | |
| Outer Subcity area to the north of Yanpingmen Street and the west of Zhuque Street | 12 A’ | The number of Earthly Branches (地支) | 22,466,400 m2 | 22,410,620 m2 | 99.75 | |
| Area to the south of Jinguangmen Street and the north of Yanpingmen Street | 12 A’ | Ditto | 22,466,400 m2 | 22,139,776 m2 | 98.55 | |
| Urban area to the west of Anhuamen Street | 15 A’ | The sum of the number of Shengshu (1 + 2 + 3 + 4 + 5), the three–five multiplier | 28,083,000 m2 | 28,081,209 m2 | 99.99 | |
| Area to the south of Yanpingmen Street and the east of Zhuque Street | 15 A’ | Ditto | 28,083,000 m2 | 27,764,140 m2 | 98.86 | |
| Outer Subcity area to the east of Zhuque Street | 20 A’ | The number of double tens | 37,444,000 m2 | 36,982,570 m2 | 98.77 | |
| Outer Subcity area to the north of Yanpingmen Street | 24 A’ | Double number of Earthly Branches (地支) | 44,932,800 m2 | 45,392,480 m2 | 98.99 | |
| Outer Subcity area to the east of Anhuamen Street | 24 A’ | Ditto | 44,932,800 m2 | 44,858,711 m2 | 99.84 | |
| The outermost enclosed square area of the city (from the southernmost to the south boundary of Lotus Park) | 49 A’ | The used number of the Great Expansion (大衍所用之数), the seven–seven multiplier | 91,737,800 m2 | 92,448,224 m2 | 99.23 |
| Area Type | Name of the Element or Area | Area Modulus Value (Taking the Area of 1,857,400 m2 of Daxing Palace as Modulus A’’) | Cultural Significance of the Value | Area Value Converted by the Modulus Value | Measured Area Value | Coincidence (%) |
|---|---|---|---|---|---|---|
| Urban functional area | Daxing Palace | 1 A’’ | The number of Taiji (太极) | 1,857,400 m2 | 1,857,400 m2 | 100.00 |
| Outer Subcity Street | 8 A’’ | The number of Shaoyin (少阴) | 14,859,200 m2 | 15,004,633 m2 | 99.03 | |
| Residential area | 30 A’’ | The number of earth (地数) in The Book of Changes (the sum of the even numbers of 1–10) | 55,722,001 m2 | 56,050,150 m2 | 99.41 | |
| Designated study area | Two markets area | 1 A’’ | The number of Taiji (太极) | 1,857,400 m2 | 1,879,737 m2 | 98.81 |
| Small city area (Imperial City and Royal City area) | 5 A’’ | The number of five elements (五行) | 9,287,000 m2 | 9,149,384 m2 | 98.52 | |
| Imperial City, Royal City, Two markets area | 6 A’’ | The number of Taiyin (太阴) | 11,144,400 m2 | 11,029,121 m2 | 98.97 | |
| Area to the north of Yanpingmen Street, the south of Jinguangmen Street, and the east of Zhuque Street | 6 A’’ | Ditto | 11,144,400 m2 | 11,277,969 m2 | 98.82 | |
| Area to the south of Yanpingmen Street and the east of Zhuque Street | 7.5 A’’ | Half of the number of Taiyin (太阴) and Taiyang (太阳) | 13,930,500 m2 | 13,994,917 m2 | 99.54 | |
| Area to the east of Anhuamen Street, the west of Qixiamen Street, and the south of Jinguangmen Street | 8 A’’ | The number of Shaoyin (少阴) | 14,859,200 m2 | 14,979,351 m2 | 99.20 | |
| Area to the north of Jinguangmen Street and the east of Zhuque Street | 9 A’’ | The number of Taiyang (太阳), the three-three multiplier | 16,716,600 m2 | 16,486,171 m2 | 98.62 | |
| Outer Subcity area to the north of Yanpingmen Street and the west of Zhuque Street | 12 A’’ | The number of Earthly Branches (地支) | 22,288,800 m2 | 22,410,620 m2 | 99.46 | |
| Area to the south of Jinguangmen Street and the north of Yanpingmen Street | 12 A’’ | Ditto | 22,288,800 m2 | 22,139,776 m2 | 99.33 | |
| Urban area to the south of Yanpingmen Street | 15 A’’ | The sum of the number of Shengshu (生数,1 + 2 + 3 + 4 + 5), the three–five multiplier | 27,861,001 m2 | 27,542,067 m2 | 98.86 | |
| Urban area to the west of Anhuamen Street | 15 A’’ | Ditto | 27,861,001 m2 | 28,081,209 m2 | 99.22 | |
| Urban area to the north of Yanpingmen Street and the east of Zhuque Street | 15 A’’ | Ditto | 27,861,001 m2 | 27,764,140 m2 | 99.65 | |
| Urban area to the east of Qixiamen Street | 16 A’’ | The number of Fuxi (伏羲) trigrams, the four–four multiplier | 29,718,401 m2 | 29,325,777 m2 | 98.68 | |
| Outer Subcity area to the east of Zhuque Street | 20 A’’ | The number of double tens | 37,148,001 m2 | 36,982,570 m2 | 99.55 | |
| Outer Subcity area to the east of Anhuamen Street | 24 A’’ | Double number of Earthly Branches (地支) | 44,577,601 m2 | 44,858,711 m2 | 99.37 | |
| Urban area to the south of Jinguangmen Street | 27 A’’ | Triplex number of Taiyang (太阳) | 50,149,801 m2 | 49,681,837 m2 | 99.07 | |
| The outermost enclosed square area of the city (from the southernmost to the south boundary of Lotus Park) | 50 A’’ | The number of the Great Expansion (大衍之数), double number of heaven | 92,870,002 m2 | 92,448,224 m2 | 99.55 |
| Ratio Value | Cultural Significance of the Ratio | The Number of Objects (Groups) That Meet a Specific Ratio under the Threshold Condition of 98.5% | The Number of Objects (Groups) That Meet a Specific Ratio under the Threshold Condition of 99.5% |
|---|---|---|---|
| 1.2 (12:10) | The ratio of Earthly Branches (天干) to Heavenly Stems (地支) | 26 | 10 |
| 1.618 (√5/2–1/2) | Golden ratio | 21 | 5 |
| 1.8 (9:5) | The ratio of the supreme number (至尊之比) | 21 | 12 |
| 2 (2:1) | The number of Yin (阴) and Yang (阳) | 19 | 5 |
| 1.286 (9:7) | The ratio of Taiyang (太阳) to Shaoyang (少阳) | 19 | 7 |
| 4.9 (49:10) | The used number of Great Expansion (大衍所用之数), the seven–seven multiplier | 19 | 6 |
| 1.5 (3:2) | The ratio of Heaven to Earth, the ratio of Taiyang (太阳) to Taiyin (太阴) | 18 | 7 |
| 1.125 (9:8) | The ratio of Taiyang (太阳) to Shaoyin (少阴) | 17 | 9 |
| 1.414 (√2:1) | The ratio of the number of round sky and square earth (the ratio of circle diameter to side length of the inscribed square) | 12 | 5 |
| 5.5 (55:10) | The number of heaven and earth, the sum of the number of the galaxy map (河图) | 9 | 3 |
| Comparison Objects | Comparison Objects | Measured Area Ratio (The Ratio of the Former to the Latter) | Ideal Area Ratio | Coincidence (%) | Cultural Significance of the Ratio |
|---|---|---|---|---|---|
| The outermost enclosed square area of the city | Small city area (Imperial City and Royal City area) | 10.10:1 | 10:1 | 98.97 | The number of Heavenly Stems (天干) |
| Rectangular urban area | Small city area (Imperial City and Royal City area) | 8.97:1 | 9:1 | 99.68 | The number of Taiyang (太阳), the three–three multiplier |
| Outer Subcity | Small city area (Imperial City and Royal City area) | 7.97:1 | 8:1 | 99.64 | The number of Shaoyin (少阴) |
| Urban area to the north of Yanpingmen Street | Small city area (Imperial City and Royal City area) | 5.96:1 | 6:1 | 99.35 | The number of Taiyin (太阴) |
| Outer Subcity area to the north of Yanpingmen Street | Small city area (Imperial City and Royal City area) | 4.96:1 | 5:1 | 99.23 | The number of five elements (五行) |
| Urban area to the west of Zhuque Street | Small city area (Imperial City and Royal City area) | 4.04:1 | 4:1 | 98.96 | The number of four images (四象), the two–two multiplier |
| Urban area to the south of Yanpingmen Street | Small city area (Imperial City and Royal City area) | 3.01:1 | 3:1 | 99.66 | The number of three forces (三才) |
| Urban area to the south of Jinguangmen Street | Royal City | 9.90:1 | 10:1 | 99.02 | The number of Heavenly Stems (天干) |
| Outer Subcity area to the north of Yanpingmen Street | Royal City | 9.05:1 | 9:1 | 99.48 | The number of Taiyang (太阳), the three–three multiplier |
| Outer Subcity Street | Royal City | 2.99:1 | 3:1 | 99.69 | The number of three forces (三才) |
| Rectangular urban area | Imperial City | 19.86:1 | 20:1 | 99.32 | The number of double tens |
| Urban area to the south of Jinguangmen Street | Imperial City | 12.02:1 | 12:1 | 99.81 | The number of Earthly Branches (地支) |
| Urban area to the east of Zhuque Street | Imperial City | 10.11:1 | 10:1 | 98.95 | The number of Heavenly Stems (天干) |
Disclaimer/Publisher’s Note: The statements, opinions and data contained in all publications are solely those of the individual author(s) and contributor(s) and not of MDPI and/or the editor(s). MDPI and/or the editor(s) disclaim responsibility for any injury to people or property resulting from any ideas, methods, instructions or products referred to in the content. |
© 2023 by the authors. Licensee MDPI, Basel, Switzerland. This article is an open access article distributed under the terms and conditions of the Creative Commons Attribution (CC BY) license (https://creativecommons.org/licenses/by/4.0/).
Share and Cite
Chen, S.; Dong, Y.; Chen, X.; Xu, X.; Gong, J. Analysis of the Characteristics and Ideas of Ancient Urban Land-Use Based on GIS and an Algorithm: A Case Study of Chang’an City in the Sui and Tang Dynasties. Remote Sens. 2023, 15, 2962. https://doi.org/10.3390/rs15122962
Chen S, Dong Y, Chen X, Xu X, Gong J. Analysis of the Characteristics and Ideas of Ancient Urban Land-Use Based on GIS and an Algorithm: A Case Study of Chang’an City in the Sui and Tang Dynasties. Remote Sensing. 2023; 15(12):2962. https://doi.org/10.3390/rs15122962
Chicago/Turabian StyleChen, Siliang, Yue Dong, Xiangyu Chen, Xinyue Xu, and Jiangbo Gong. 2023. "Analysis of the Characteristics and Ideas of Ancient Urban Land-Use Based on GIS and an Algorithm: A Case Study of Chang’an City in the Sui and Tang Dynasties" Remote Sensing 15, no. 12: 2962. https://doi.org/10.3390/rs15122962
APA StyleChen, S., Dong, Y., Chen, X., Xu, X., & Gong, J. (2023). Analysis of the Characteristics and Ideas of Ancient Urban Land-Use Based on GIS and an Algorithm: A Case Study of Chang’an City in the Sui and Tang Dynasties. Remote Sensing, 15(12), 2962. https://doi.org/10.3390/rs15122962