Abstract
In this paper, a method for joint sea surface rainfall intensity (RI), wind speed, and wave height retrieval based on spaceborne global navigation satellite system reflectometry (GNSS-R) data is proposed, which especially considers the effects between these two parameters. A method of rainfall detection (RD) according to different wind speed ranges is also proposed by mitigating the impact of swell and wind speed. The results, with data collected over the oceans near Southeast Asia, show that the RD method has a detection accuracy of up to 81.74%. The RI retrieval accuracy can reach about 2 mm/h by simultaneously correcting the effects of wind speed and swell. The accuracy of wind speed retrieval is improved by about 5% after removing rainfall interference through RD in advance. After considering the influence of wind speed and eliminating rainfall interference, the retrieval accuracy of significant wave height (SWH) is improved by about 18%. Finally, the deep convolutional neural network (DCNN) model is built to estimate the SWH of the swell. The results show that the retrieval accuracy of the swell height is better than 0.20 m after excluding rainfall interference. The proposed joint retrieval method provides an important reference for the future acquisition of multiple high-precision marine geophysical parameters by spaceborne GNSS-R technology.
1. Introduction
Rainfall is an important factor in the study of watershed or regional hydrological cycle systems. It is one of the most important components of water resources and the main atmospheric forcing variable that drives surface hydrological processes and land surface processes. Reliable rainfall information is of great significance for hydrological climatology research, industrial and agricultural production, transportation, forestry, ecology, environment, and drought and flood forecasting [1,2,3,4]. The measurement of wave height and wind speed is of great significance to the safety of coastal countries and the development of various marine resources [5,6,7]. China is one of the countries that is seriously affected by marine disasters around the world. In recent years, marine disasters in China’s coastal areas have occurred frequently, mainly storm surges, waves, and sea ice disasters, which have directly caused casualties and property losses. The “Bulletin of China Marine Disaster” is the most authoritative data source for publicly reporting marine disaster events in China. According to the 2021 Bulletin of China Marine Disaster, the most serious direct economic losses were caused by storm surge disasters, which account for 80% of total direct economic losses. The largest number of deaths and disappearances was caused by wave disasters, accounting for 93% of the total number of deaths and disappearances. The provinces most affected by marine disasters were mainly Zhejiang, Jiangsu, Shandong, Fujian, Guangdong, and Hainan. Therefore, it is of great significance to actively carry out ocean observation, early warning and forecasting, and risk prevention for China’s oceans.
The retrieval of rainfall intensity, wind speed, and wave height is actually a joint retrieval problem, but few studies have investigated this problem. Since 2022, this problem has attracted a great deal of attention from some scholars. Wan et al. studied the joint retrieval method of wave and wind field parameters by combining synthetic aperture radar (SAR) and spectrometer data. The results show that the joint method has better applicability in low and medium sea conditions [8]. Later, Wan et al. proposed a method for the joint retrieval of wind field and wave parameters based on Sentinel-1 SAR single look complex (SLC) data. The results show that the retrieval results of wind field and wave parameters are in good agreement with ERA5 data in medium and high sea conditions [9]. Li et al. proposed a joint retrieval method of wind speed and significant wave height (SWH) using the China Tiangong-2 interferometric imaging radar altimeter, which can accurately realize the joint retrieval of wind speed and SWH [10]. Unfortunately, these studies have not considered whether rainfall will affect wind speed and wave height measurements. However, in the retrieval of wind speed or wave height using X-band radar images, studies have shown that rainfall has an impact on wind speed and wave height measurements, so the influence of rainfall should be considered in the retrieval of wind speed and wave height [11]. Similarly, in the field of global navigation satellite system reflectometry (GNSS-R), existing studies also show that rainfall can affect the measurement results of wind speed [12,13,14]. However, there is no literature in the GNSS-R field to report whether rainfall will affect wave height measurements. In fact, sea surface roughness changes due to rainfall [14,15,16], resulting in reduced measurement accuracy of wind and waves. Therefore, when sea surface rainfall occurs, it will bring challenges to wind wave measurements. For wind wave measurement, no effective algorithm has been developed to mitigate the effects of rainfall [17]. Therefore, a possible effective solution is to use an appropriate method to identify the data contaminated by rainwater and exclude it from the measurement or to provide an algorithm specifically for correcting the data contaminated by rainwater for wind wave parameter measurement [18]. In addition, Soisuvarn et al. proved that under sea conditions where swells occur, especially when the wind speed is less than 6 m/s, the surge will also have a significant impact on the measurement of the wind speed of the spaceborne GNSS-R [19]. Therefore, it is necessary to develop a new algorithm or provide a new solution to solve multi-parameter joint retrieval.
Compared with satellites dedicated to spaceborne GNSS-R applications, the observation cost of these satellites is higher, and the revisit time of satellites is long. Recent spaceborne GNSS-R missions (such as CYGNSS, TDS-1, Bufeng-1 A/B, and FY-3E) provide a powerful alternative to marine disaster monitoring in the oceans near China. Compared with TDS-1 data, the GNSS-R data observed by the CYGNSS satellite is more suitable for studying the retrieval of meteorological and dynamic environmental parameters in the oceans near China. Because the observation data of the CYGNSS satellite has higher time and space coverage, in this paper, we select the oceans near China as the study area and propose a joint retrieval method suitable for spaceborne GNSS-R sea surface rainfall and wind waves.
The rest of this article is arranged as follows. Section 2 introduces the principles and methods. Section 3 describes the data sets used, data preprocessing, and the experimental design. Section 4 introduces sea surface rainfall detection of the spaceborne GNSS-R considering wind speed and swell. Section 5 introduces the retrieval of sea surface rainfall intensity based on a feedforward neural network model at low wind speed. Section 6 introduces the retrieval of sea surface wind speed considering the combined effects of rainfall and swell. Section 7 introduces the retrieval of sea surface wave height considering the influence of rainfall. Section 8 gives the conclusion of this paper.
2. Principles and Methods
2.1. Elfouhaily Model
The sea surface is affected by waves and fluctuates up and down, which can be regarded as a random process. Generally, the wave spectrum is used to describe its statistical characteristics. The Elfouhaily wave spectrum takes into account the impact of wind regions on energy, and is widely used for retrieving sea surface wind fields, which can be expressed as [20]
where represents the isotropic portion of the wave spectrum; is the corresponding directional spreading function; is the wave number; and is the wave direction.
Figure 1 shows the wind-driven wave spectrum for wind speeds from 3 m/s to 21 m/s with a 2 m/s step. As shown in the figure, the cut-off wave number is about 1–10 rad/m. The cut-off wave number divides the spectrum into two parts, the part less than the cut-off wave number is large-scale roughness, and the part greater than the cut-off wave number is small-scale roughness. With the increase in wind speed, the total energy of the wind wave increases, the spectral peak moves towards the direction of large-scale roughness, and the diffuse reflection increases.
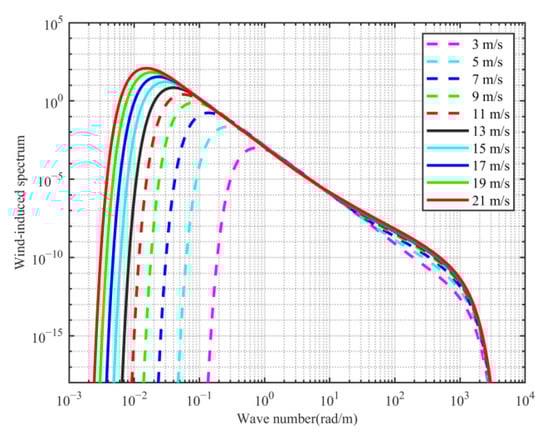
Figure 1.
Wind-driven wave spectrum for wind speeds from 3 m/s to 21 m/s with a 2 m/s step.
2.2. Rainfall Spectrum Model
The impact of rainfall on the sea surface produces a capillary gravity wave loop, resulting in changes in surface roughness [15]. The modeling method used to describe the impact of raindrops on water surfaces follows the widely used idea of first-order superposition of the annular wave spectrum generated by rain and the Elfouhaily elevation spectrum affected by wind. The annular spectrum is a logarithmic Gaussian model described as
where is given by the dispersion relation , with , , , and being radian frequency, the acceleration due to gravity (~980 cm s−2), the wave number, and density of water and water surface tension (~74 cm3 s−2), respectively. is the group velocity at wave number
, is the power law spectral model given by cm2 Hz−1. Hz, and Hz. The model coefficients were estimated by Bliven et al. [15] to represent ring-waves in the frequency range of 2.75 to 12 Hz (wavelengths from 1.94 to 20.8 cm).
2.3. Swell Spectrum Model
Unlike wind waves, swells are usually waves that propagate from other wind fields, continue to move, and are no longer affected by local winds. In the ocean, there are very few cases where only wind waves or swells occur, and in most cases, they occur in the form of mixed waves [21]. Therefore, considering the impact of swells is very necessary for retrieving the wave height of spaceborne GNSS-R. The swell can be modeled as a narrowband Gaussian process, and the surge spectrum model is as follows [22]
where and are the
and components of the wave number , is the height variance of the swell, and are the spectral standard deviations, and and are the peak wave numbers of the spectral of the swell in the and directions, respectively. Generally, is taken as 4, where wavelength is 400 m, and m−1 [23].
The wave spectrum driven by swell mainly forms large-scale rough sea surfaces that have a significant impact on GNSS sea surface reflection signals, and the impact of swell is more significant at low wind speeds. Thus, the presence of swells will bring significant errors, thereby reducing the accuracy of wind speed retrieval.
2.4. A Bibasic Electromagnetic Scattering Model Disturbed by Wind Speed, Swell, and Rainfall
Voronovich and Zavorotny [24] demonstrated that GNSS signals reflected by the ocean can be considered diffuse reflection except at low incident angles. The scattering coefficient is commonly used to describe the strength of the scattering of incident signals from the sea surface. Kirchhoff approximation-geometric optics (KA-GO), small perturbation method (SPM), small slope approximation (SSA), and two-scale method (TSM) [25] have been proposed to calculate electromagnetic scattering. The KA-GO method is often used in the study of GNSS reflected signals, but it requires the curvature radius of the sea surface roughness to be greater than the wavelength, which cannot reflect the impact of small-scale roughness. According to [1,2], swell and wind speed mainly affect the low wave number portion of the ocean wave spectrum, i.e., large-scale rough seas. Rainfall mainly affects small-scale rough seas. Therefore, a more intuitive and accurate dual-scale model is adopted. The dual-scale model divides the sea surface into large and small-scale roughness, the scattering coefficients of large-scale wind speed and swell are calculated using the KA-GO approximation method, while the scattering coefficients of small-scale rainfall are calculated using the SPM method, and its scattering coefficient can be expressed as [26]
where , and are the scattering coefficients of the large-scale rough sea surface affected by wind speed and swell, and the scattering coefficients of the small-scale rough sea surface affected by rainfall, respectively. and are calculated using the KA-GO approximation method [27].
where is Fresnel reflection coefficient, which can be calculated using Equation (6). is perpendicular to the surface and is parallel to the local tangent plane, is the scattering unit vector, and is the probability density function (PDF).
with
where is the incidence angle, and is the complex permittivity. , , , and represent right-hand circular polarization (RHCP), left-hand circular polarization (LHCP), vertical polarization, and horizontal polarization, respectively.
can be calculated by the small perturbation method as [28]
where is the signal scattering angle; is the rainfall-driven wave spectrum.
The cut-off wave number for limiting the wavelength range of the surface waves to distinguish large- and small-scale is given as [29]
where is the navigation signal wavelength. According to Equation (10), the cut-off wave number of the GNSS signal can be obtained. The wave number which is less than the cut-off wave number, is associated with large-scale, and vice versa.
From Equation (10), it can be seen that waves larger than three times the signal wavelength form a large-scale rough sea surface. The mean square slope corresponding to wind speed and swell can be obtained by integrating Elfouhaily wave spectrum and swell-driven wave spectrum, respectively.
2.5. Description of Retrieval Methods for Sea Surface Rainfall Intensity, Wind Speed, and Wave Height
The purpose of rainfall detection is to distinguish the data with and without rain. The CNN model proposed by Bu et al. [30] is used for rainfall detection. When the rain data are obtained, they are used to retrieve the rainfall intensity. As shown in Figure 2, a machine learning method based on a feedforward neural network (FFNN) is used to retrieve rainfall intensity in this paper.
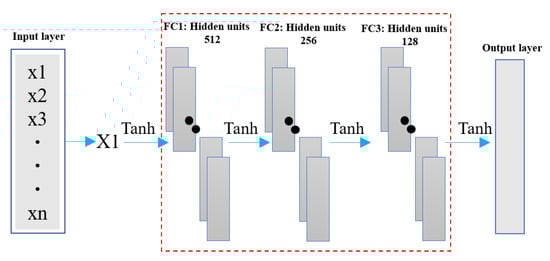
Figure 2.
FFNN model for rainfall intensity retrieval. Red dashed boxes represent hidden layers.
In addition to determining the rainfall intensity on the sea surface, this study also retrieves the sea surface wind speed. Therefore, we propose a deep convolutional neural network model incorporating an attention mechanism (AM-DCNN) for wind speed retrieval, which is an improved version of the GloWS-Net model proposed by Bu et al. [31], that is, the attention mechanism is introduced into the GloWS-Net framework. In neural network learning, the more parameters a model has, the stronger its expressive power is and the greater the amount of information stored in the model, which can lead to the issues of information overload. Attention mechanism is a resource allocation scheme, and it is the main means to solve the problem of information overload. It allocates computing resources to more important tasks to improve the efficiency and accuracy of task processing. The AM-DCNN model designed in this study is shown in Figure 3.
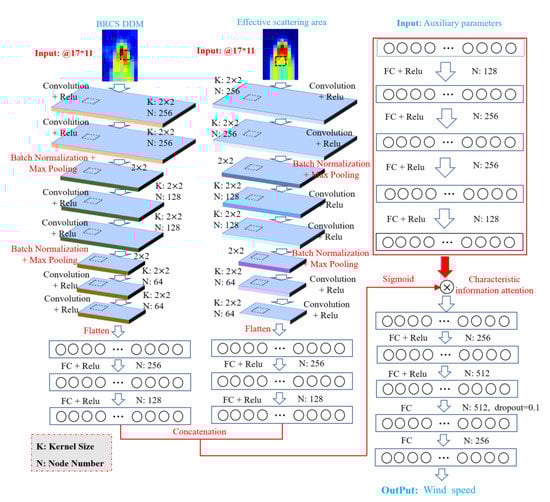
Figure 3.
AM-DCNN model for wind speed retrieval.
This paper also aims to propose a wave height retrieval method considering the influence of rainfall. In view of the advantages of deep learning in multi-parameter modeling, this article uses the proposed DCNN model architecture for SWH and swell height retrieval, as shown in Figure 4.
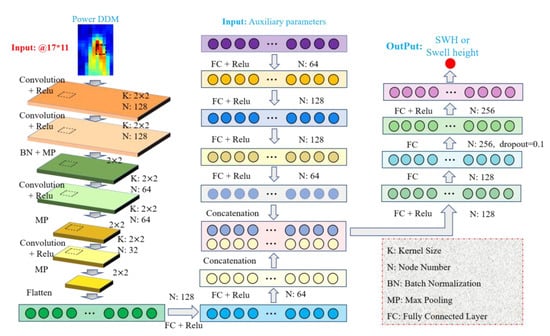
Figure 4.
DCNN model for wave height retrieval.
When training the rainfall intensity, wind speed, and wave height retrieval models, it is necessary to select appropriate loss functions to evaluate the training performance of the model. In this paper, mean square error is selected as the loss function, and its expression is as follows [32]
where is the number of data samples, is the IMERG rainfall intensity, ERA5 wind speed, or ERA5 wave height, and is the network’s estimation.
3. Data Description, Data Preprocessing, and Experimental Design
3.1. Data Description
The GNSS-R data of the oceans near China observed by the CYGNSS satellite are selected. Figure 5 shows the trajectory of the GNSS reflection point of the oceans near China observed by the CYGNSS satellite. The red line in the map indicates the coastline, the track of blue point is the track of the GNSS reflection point, the green spot indicates the land, and the area except the green spot is the ocean. This article only studies all oceans from 70° east longitude to 150° east longitude and from 0° north latitude to 60° north latitude, and other oceans outside this range are not covered by this article. The observation data cover the period from 1 April 2019 to 15 June 2021.
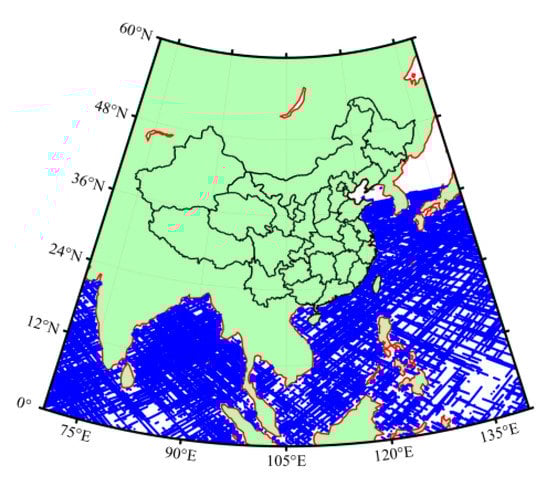
Figure 5.
GNSS reflection point trajectories observed by CYGNSS satellites in the oceans near China.
A total of nine datasets were used in this paper, namely GNSS-R data from L1 V3.0 product collected by the CYGNSS mission, ERA5 reanalysis SWH from European Center for Medium-Range Weather Forecasts (ECMWF), swell height, wind wave SWH, wind speed, water depth, wave direction and wind direction data, and Integrated Multi-Satellite Retrievals for Global Precipitation Measurement (GPM-IMERG) rainfall data.
- (1)
- GNSS-R data from the L1 V3.0 product collected by the CYGNSS mission
In 2016, the National Aeronautics and Space Administration (NASA) launched a CYGNSS satellite system consisting of eight microsatellites (namely, CY01, CY02, CY03, CY04, CY05, CY06, CY07, and CY08), and carried a Delay Doppler Mapping Instrument (DDMI) on the eight CYGNSS satellites, specifically for receiving DDM data obtained from GNSS reflection measurements. Currently, users can download three levels of CYGNSS data products (level 1, level 2, and level 3) for free on the official CYGNSS website. This article uses L1 level data from V3.1, which mainly includes GNSS-R data from 1 August 2018 (DOY 213) to February 2023. It is available for free from the website (https://podaac.jpl.nasa.gov/dataset/CYGNSS_L1_V3.1, accessed on 1 December 2022). The CYGNSS L1 V3.1 data records the characteristic parameters (such as normalized bistatic radar cross section (NBRCS), leading edge slope (LES), signal-to-noise ratio (SNR), DDM, specular point coordinates, receiver antenna gain, and transmitter position) of eight CYGNSS satellites. In addition, CYGNSS L1 V3.1 also provides a variety of DDM products (such as brcs, raw_counts, and power_analog). This article uses brcs and power_analog products.
- (2)
- ERA5 reanalysis data from ECMWF
The Copernicus climate change service (C3S) climate database provides users with ECMWF reanalysis data products. ERA5 is the fifth-generation atmospheric reanalysis product launched by ECMWF. It contains multiple types of data sets. In this article, the ERA5 hourly data on single levels from 1940 to the present is used, and the dataset is available for downloading at https://cds.climate.copernicus.eu/cdsapp#!/dataset/reanalysis-era5-single-levels, accessed on 1 December 2022, including 2 m air temperature, 2 m dew point temperature, total precipitation, average sea level pressure, surface pressure, 10 m u wind component and 10 m v wind component, wind direction, water depth, boundary layer height, and sea surface wave heights information. We used ERA5 wind speed, wind direction, water depth, wave direction, and wave height data. Among them, the ERA5 wave height data include three types: SWH of combined wind waves and swell, SWH of wind waves, and SWH of swell. In this paper, three types of wave height data are used to study wave height retrieval, among which ERA5 SWH of combined wind waves and swell and SWH of swell are used for training and testing of the sea surface wave height retrieval model. It should be mentioned that the spatial resolution of ERA5 wind direction data, water depth data, wave direction, and wave height data is 0.5° × 0.5°, with a temporal resolution of 1 h. The spatial resolution of the 10 m U wind component and the 10 m V wind component is 0.25° × 0.25°, with a time resolution of 1 h. The 10 m U wind component and 10 m V wind component data are matched with other data through spatial bilinear interpolation and temporal linear interpolation, and then wind synthesis is performed. The composite wind speed is used as a reference for the actual sea surface wind speed at 10 m above the sea surface, and is used for training and testing of the sea surface wind speed retrieval model.
- (3)
- GPM-IMERG rainfall data
GPM-IMERG was launched in 2014, and GPM-IMERG is a follow-up project of the Tropical Rainfall Measuring Mission (TRMM). GPM-IMERG uses a three-level multi-satellite precipitation algorithm that combines intermittent precipitation estimates from all constellation microwave sensors, infrared observation data from geostationary satellites, and monthly precipitation data from rain gauges. The latest data version is IMERG-V6. GPM-IMERG has three types of products, namely IMERG Early Run (IMERG-E) (real-time product with a delay of about 4 h), IMERG Late Run (IMERG-L) (near real-time processing product with a delay of about 14 h), and IMERG Final Run (IMERG-F). The spatial resolution of all three types of products is 0.1° × 0.1°, all with a time resolution of 1 month, 1 day, and 30 min. This article uses the IMERG-F products with a time resolution of 30 min, which can be downloaded from the GPM website (https://gpm.nasa.gov/data/directory, accessed on 1 December 2022). GPM-IMERG products are used for training and testing the rainfall intensity retrieval model.
3.2. Data Preprocessing and Experimental Design
The specific implementation steps of the joint retrieval method of sea surface wind wave and rainfall parameters of spaceborne GNSS-R are as follows.
Step 1: Data set preprocessing, including the spatio-temporal matching of datasets, spaceborne GNSS-R DDM denoising, quality control, data filtering, and DDM observables extraction. For DDM denoising, this article first uses the noise floor subtraction method for denoising [33], and then applies a two-dimensional wavelet transform to denoise as performed in [1]. To ensure the quality of the CYGNSS data, the L1B measurements are quality controlled and filtered before the model training and testing. The initial quality control is mainly based on the following criteria [32,34]. First, all NaN values of observables are discarded. Second, all negative values of observables are discarded. Third, the uncertainty of BRCS (ddm_brcs_uncert) is below 1. Fourth, the receive antenna gain in the direction of the specular point (sp_rx_gain) is larger than 0 dBi. Fifth, the RCG values should be higher than 3. In addition, the standard quality control (QC) flags in the CYGNSS L1B data are also used in data filtering. Instead of using the overall QC flag bit (“poor_overall_quality”, the least significant bit or bit 0), the data filtering is applied by using individual QC flag bits. This discards cases in which the spacecraft has large attitude error or attitude anomalies (bit 2, 3, and 28), the transmitter power or antenna gain has high uncertainties (bit 16 and 27), the DDM is invalid or has anomalies (e.g., black body load and test pattern DDMs indicated by bit 4, 7, 8, 9, 10, 15, and 17–20), or there are some other instrumental data transmission and calibration issues (bit 1, 5, 6, 13, 14, and 21–26). It is noted that the L1B observables from GPS IIF satellites are removed due to the QC flag “low_quality_gps_ant_knowledge” (bit 27). Moreover, the QC flags “sp_very_near_land” (bit 11) and “sp_near_land” (bit 12) are also used in data filtering to remove the data collected when signals are reflected from land. Furthermore, we calculate GNSS-R observables from the high-quality DDM [35].
Step 2: Data sets are divided into groups. For all the data sets that have undergone quality control, the data with a wind speed of less than 10 m/s and a swell height of less than 2 m are assigned to group 1, and the remaining data are put into group 2.
Step 3: Data samples from group 1 undergo rainfall detection. If the data are marked as rain-contaminated, the rainy data samples from group 1 will be used for the retrieval of rainfall intensity. If the data are marked as rain-free, the rain-free data samples from group 1 are combined with the data samples from group 2 to form group 3. The data samples from group 3 obtained at this time are regarded as the data samples that do not contain rainfall information (that is, they are not disturbed by rainfall or are very little disturbed by rainfall). However, these data samples may contain swell storm information. Moreover, the data samples from group 2 actually contain rainfall information, but because the data correspond to a wind speed greater than 10 m/s. According to existing research, in the case of high wind speed, rainfall is easily suppressed by high wind. In this case, the influence of rainfall on wind speed measurement is very low or even almost does not lead to deviations in the retrieval of wind speed [12,18].
Step 4: It is necessary to consider whether there is swell information in the data samples from group 3. If there is no swell information or the swell is very weak (the swell height is less than 2 m), the retrieval of wind speed is considered to be unaffected by swell or very little affected by swell. On the contrary, if the retrieval of wind speed is performed in the presence of swell, the retrieval results of wind speed may be affected by swell. Similarly, if the second and third steps are not carried out first, and the effects of rainfall are not taken into account, the retrieved wind speed may also be affected by rainfall. Therefore, the retrieval of wind speed may be affected by rainfall and (or) swell, which should be considered in practical applications. This point is taken into account in the joint retrieval algorithm proposed in this paper.
Step 5: If the sea surface is affected by both wind waves and swells, the SWH of mixed waves (that is SWH) is usually used to characterize the sea states. At this time, the retrieval of mixed waves can be performed based on the spaceborne GNSS-R technology. If the sea surface is dominated by swell, the retrieval of swell height is performed, and the wind wave and swell components are separated by the spectral integration method [21].
Intuitively, the flow of the joint retrieval algorithm of sea surface rainfall and wind waves based on spaceborne GNSS-R is shown in Figure 6. The implementation of the algorithm is mainly divided into four stages. The first stage is the preprocessing of spaceborne GNSS-R data (as shown in the black dashed rectangular box) and the spatio-temporal matching of all data sets. The second stage is the detection of sea surface rainfall and retrieval of intensity (as shown in the red dashed rectangular box). The third stage is the retrieval of sea surface wind speed. The fourth stage is the retrieval of sea surface wave height, including the retrieval of SWH and the retrieval of swell height. The retrieval model of the relevant parameters is also trained in the second, third, and fourth stages, and the performance of the model is evaluated to verify the feasibility of the proposed algorithm. In order to evaluate the generalization ability of relevant network models on blind data sets, we selected the data samples from 1 April 2019 to 1 June 2020 as the training set, and the data samples from 2 June 2020 to 15 June 2021 as the test set. Details of each stage are provided below.
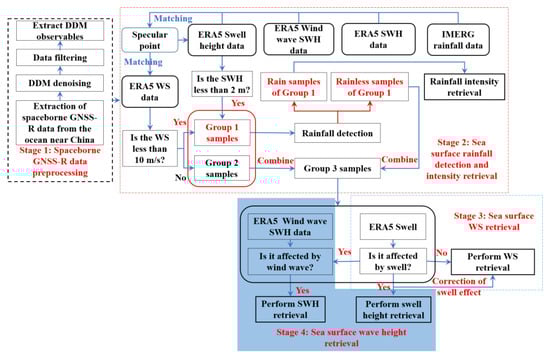
Figure 6.
Flow chart of joint retrieval method for sea surface rainfall intensity, wind speed, and wave height based on spaceborne GNSS-R.
4. Spaceborne GNSS-R Sea Surface Rainfall Detection Considering Wind Speed and Swell
As mentioned above, for the retrieval of sea surface wind speed and wave, the existence of rainfall affects its retrieval accuracy. For hydroclimatic research and drought and flood forecasting, rainfall detection and intensity retrieval are of far-reaching significance. Therefore, before the retrieval of sea surface wind speed and wave, it is necessary to carry out rainfall detection in advance to eliminate the data interfered by rainfall, so as to improve the retrieval accuracy of wind speed and wave. In this section, we first perform rainfall detection based on spaceborne GNSS-R technology, then perform the retrieval of rainfall intensity (see Section 5 for details), and finally analyze the performance of rainfall detection and intensity retrieval before and after correction of wind speed and swell effects.
4.1. Performance Analysis of Sea Surface Rainfall Detection before and after Correction of Wind Speed and Swell Influence
This article uses three indicators (precision, recall, and F-Measure) to evaluate the effectiveness of rainfall detection. The accuracy rate describes the accuracy of the prediction results for the correct classification of positive samples. The recall rate refers to the correctness of the correctly classified samples among all positive samples. The F1 value balances the accuracy rate and the recall rate and is commonly used as the only measure of the overall effectiveness of a test. The calculation formulas for accuracy, recall, and F1 value can be found in [30].
Bu et al. [1] demonstrated that in rainfall detection, it is necessary to eliminate the impact of wind speed and swell. Therefore, we first discuss and consider the impact of wind speed and swell on rainfall detection. However, there is no effective method to directly eliminate the influence of wind speed and swell, but this problem can be solved by screening data or establishing a correction model. Therefore, before rainfall detection, we only considered data with wind speeds of less than 10 m/s and swell heights of less than 2 m in order to minimize the effects of wind or swell on rainfall. In fact, although the wind speed and swell are controlled very small, the wind speed or swell still has a certain influence on the DDM observations during modeling, so its influence should not be ignored. The existing rainfall detection methods (such as the PDF method) cannot effectively solve the influence of wind speed or swell on rainfall detection. On the contrary, the deep learning method provides the ability to correct the impact of errors, and the sea surface rainfall detection of spaceborne GNSS-R can benefit from deep learning. Therefore, the CNN model proposed by Bu et al. [30] is used for rainfall detection.
Table 1 shows the performance of rainfall detection when the wind speed is less than 5 m/s and the swell height is less than 2 m, without correction of wind speed and swell effects, only considering the influence of wind speed or swell, and considering both wind speed and swell. It can be seen from the figure that although the wind speed or swell is very small when only one of the two effects is considered, the performance of rainfall detection is not significantly improved compared to the results without considering the two. However, when the influence of wind speed and swell is considered together, better detection accuracy of rainfall can be obtained. The precision, recall, and F1 value are 87.04%, 85.04%, and 85.44%, respectively. This shows that although the wind speed or swell is very small, considering the correction of both effects can improve the detection accuracy of rainfall.

Table 1.
Rainfall detection performance before and after correction considering the influence of wind speed and swell.
4.2. Performance Analysis of Sea Surface Rainfall Detection in Different Wind Speed Ranges
In this section, we discuss whether it is necessary to perform rainfall detection in different wind speed sections when the effects of wind speed and swell are corrected. Table 2 shows the performance of sea surface rainfall detection in different wind speed ranges. In the Table, the wind speed ranges are 0~5, 5~8, 8~10, and 0~10 m/s, respectively.
Table 2.
Detection performance of sea surface rainfall in different wind speed ranges.
Obviously, the performance of rainfall detection varies greatly in different wind speed ranges, and the rainfall detection accuracy is the highest when the wind speed is between 0~5 m/s. As the wind speed increases, the accuracy of rainfall detection decreases. It should be noted that although it has been emphasized in [35] that DDM observations are very sensitive to rainfall when wind speeds are less than 5 m/s, it is more practical to study rainfall detection for larger wind speeds, such as less than 10 m/s. Therefore, rainfall detection with wind speeds of less than 10 m/s is attempted here whenever possible. From the results in the table, it is necessary to detect the rainfall in the wind speed section because the influence is more complex in the case of large wind speeds, and the whole wind speed range does not necessarily reflect the final detection performance. It may even reduce performance at very low wind speeds (such as less than 5 m/s). Therefore, for rainfall detection with a wind speed of less than 10 m/s, it is feasible to detect rainfall in different sections of wind speed.
5. Retrieval of Ocean Surface Rainfall Intensity Based on Feedforward Neural Network Model under Very Low Wind Speed
The purpose of rainfall detection is to screen out the data with and without rain. When the rain data are obtained, the rain data are used to retrieve the rainfall intensity. The machine learning method based on the feedforward neural network (FFNN) model is applied to rainfall intensity [36]. In addition, in this section, we try to retrieve rainfall intensity with a wind speed of less than 10 m/s as much as possible. The following will focus on the discussion and analysis of the retrieval performance of sea surface rainfall intensity before and after considering the influence of wind speed or (and) swell. We selected four indicators: root mean square error (RMSE), mean absolute error, Pearson correlation coefficient (CC), and mean absolute percentage error (MAPE) to evaluate the performance of the proposed retrieval model. Their calculation formulas can be referred to in [7,35].
5.1. Performance Analysis of Retrieval of Sea Surface Rainfall Intensity before and after Correction of Wind Speed Effect
Figure 7 shows the scatter density plots of retrieved rainfall intensity and IMERG-F rainfall intensity before correction of the influence of swell and wind speed, and scatter density plots of retrieved rainfall intensity and IMERG-F rainfall intensity after correction of wind speed influence. The statistical results of RMSE, MAE, CC, and MAPE that retrieved rainfall intensity before correction for the influence of swell and wind speed and after correction for the influence of wind speed are shown Table 3.
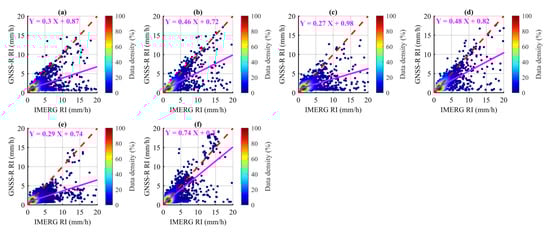
Figure 7.
Scatter density plots of inverted rainfall intensity before correction of swell and wind speed effect and after correction of wind speed effect and IMERG-F rainfall intensity. The left panel is the result before the correction of the swell and wind speed effect and the right panel is after the correction of the wind speed effect. (a,b) the wind speed range is 0–10 m/s; (c,d) the wind speed range is 5–10 m/s; (e,f) the wind speed range is 0–5 m/s.
Table 3.
Statistical results of RMSE, MAE, CC, and MAPE of rainfall intensity retrieved before swell and wind speed impact correction and after wind speed impact correction. (The table also shows the evaluation results of rainfall intensity retrieved by FFNN model when rainfall intensity is less than 10 mm/h, greater than 10 mm/h, between 5~10 mm/h, and between 0~30 mm/h, respectively.).
(1) After the influence of wind speed is corrected, the retrieval performance of rainfall intensity is significantly better than before the correction. When the wind speed is between 0~5 m/s, after the influence of wind speed is corrected, the four metrics: RMSE, MAE, CC, and MAPE are increased by 30.30%, 34.85%, 32.26%, and 25.59%, respectively. When the wind speed is between 5~10 m/s, after the influence of wind speed is corrected, the four metrics: RMSE, MAE, CC, and MAPE are increased by 20.13%, 34.25%, 28.57%, and 37.35%, respectively. When the wind speed is between 0~10 m/s, after the influence of wind speed is corrected, the four metrics: RMSE, MAE, CC, and MAPE are increased by 15.19%, 26.27%, 24.56%, and 27.11%, respectively.
(2) The retrieval performance of the FFNN model decreases as rainfall intensity increases, especially when rainfall intensity is greater than 10 mm/h, mainly because only a small number of samples with high rainfall intensity are used. In addition, when the rainfall intensity is less than 10 mm/h, the retrieval accuracy is high, mainly due to the large number of data samples distributed in this range, especially concentrated in the rainfall intensity of less than 5 mm/h.
(3) When the rainfall intensity is greater than 10 mm/h, the retrieval accuracy of the wind speed range of 5~10 m/s and 0~10 m/s is significantly worse than that of the wind speed range of 0~5 m/s. This shows that the greater the wind speed, the worse the retrieval performance for the greater rainfall intensity. Therefore, it is very difficult to solve the retrieval of rainfall intensity under a larger wind speed. This problem may only be solved when the wind speed is not very high and the rainfall intensity is not very strong [37].
5.2. Performance Analysis of Retrieval of Sea Surface Rainfall Intensity Considering the Influence of Swell and Wind Speed
Figure 8 shows the scatter density plots of retrieved rainfall intensity and IMERG-F rainfall intensity after correction of the swell effect and after correction considering both swell and wind speed effects. The metrics (RMSE, MAE, CC, and MAPE) of retrieved rainfall intensity after correction of swell impact and taking into account both correction of swell and wind speed influence are shown in Table 4.
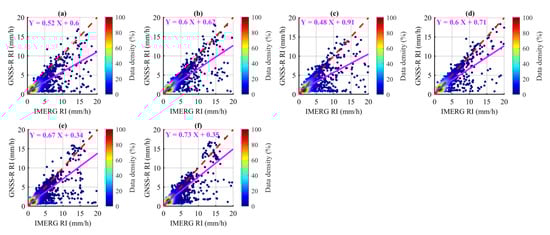
Figure 8.
Scatter density plots of inverted rainfall intensity after correction of swell effect and considering the effect of swell and wind speed and IMERG-F rainfall intensity. The left panel is the result after correction of swell effect and the right panel is after correction for swell and wind speed influences. (a,b) the wind speed range is 0–10 m/s; (c,d) the wind speed range is 5–10 m/s; (e,f) the wind speed range is 0–5 m/s.
Table 4.
Statistical results of RMSE, MAE, CC, and MAPE of retrieved rainfall intensity after the correction of swell influence and the correction of swell and wind speed influence. (The table also shows the evaluation results of rainfall intensity retrieval using the FFNN model when the rainfall intensity is less than 10 mm/h, greater than 10 mm/h, or between 5~10 mm/h and 0~30 mm/h.).
A comparison of Figure 7 and Table 3 in the previous section and Figure 8 and Table 4 in this section shows:
(1) Compared with wind speed, swell has a greater impact on the retrieval accuracy of rainfall intensity.
(2) After the correction of wind speed and swell effects together, the retrieval performance of rainfall intensity is significantly better than that after correction of only the wind speed or swell effect. Compared with the retrieval performance after the correction of the swell effect, the four metrics of RMSE, MAE, CC, and MAPE are significantly improved after the correction of the wind speed and swell effect together. When the wind speed is between 0~5 m/s, the four metrics of RMSE, MAE, CC, and MAPE are improved by 12.79%, 11.66%, 4.90%, and 5.13% respectively. When the wind speed is between 5~10 m/s, the four metrics of RMSE, MAE, CC, and MAPE are improved by 12.11%, 21.82%, 8.04%, and 18.61%, respectively. When the wind speed is between 0~10 m/s, the four metrics of RMSE, MAE, CC, and MAPE are improved by 11.90%, 23.50%, 6.28%, and 19.63%, respectively.
(3) With the increase in rainfall intensity, the retrieval performance of the FFNN model in different wind speed ranges decreases. In particular, similar to the previous section, the high retrieval accuracy when the rainfall intensity is less than 10 mm/h is mainly due to the large number of data samples distributed in this range, especially concentrated in the rainfall intensity of less than 5 mm/h. Therefore, the calculated retrieval accuracy does not necessarily reflect the performance of this range because data imbalance is the biggest problem and challenge for machine learning models (such as FFNN models) [32]. In contrast, the rainfall intensity in the range of 5~10 mm/h is more representative for assessing retrieval accuracy because the distribution of rainfall intensity in this range tends to be relatively mean and uniform. Therefore, when the rainfall intensity is in the range of 5~10 mm/h, we can see that in different ranges of wind speed, the correction of wind speed and swell effect can obtain a similar retrieval accuracy of rainfall intensity, although the wind speed range of 0~5 m/s is better than the wind speed range of 5~10 m/s and 0~10 m/s.
The above analysis shows that it is very difficult to use spaceborne GNSS-R technology to retrieve rainfall intensity when it is affected by wind speed and swell. One of the reasons is that sea surface winds are usually dominant in sea surface roughness, so it is difficult to extract the characteristics of rainfall, especially in the case of strong winds. Another reason is that when the rainfall is strong, the sea surface roughness may be insensitive to changes in rainfall intensity or sensitivity saturation. Therefore, this problem may only be solved if the wind speed is not very high and the rainfall intensity is not very strong. Although it is emphasized in [1,35] that the retrieval accuracy of rainfall intensity may be reliable when the wind speed is less than 5 m/s. However, according to the analysis results in this section, when the rainfall intensity is not very large (e.g., less than 10 mm/h), the FFNN model can be used to obtain satisfactory performance by correcting the effects of wind speed and swell when the wind speed is less than 10 m/s. Compared with previous studies, the FFNN model can obtain a retrieval accuracy of about 2 mm/h under larger wind speed (less than 10 m/s).
6. Retrieval of Sea Surface Wind Speed Considering the Combined Effects of Rainfall and Swell
The rain and rainless data screened by the above rainfall detection are used for the retrieval of sea surface wind speed. In order to compare with the retrieval results of sea surface wind speed considering the combined effects of rainfall and swell, we designed six case tests under different conditions. For clarity, six cases were set up, that is:
Case 1: In the case of rain, without considering the impact of rainfall and swell;
Case 2: In the case of rain, the impact of swell is considered but the impact of rainfall is not considered;
Case 3: In the case of rainless, the impact of swell is not considered;
Case 4: In the case of rainless, considering the impact of swell;
Case 5: In the case of rain, the impact of rainfall is considered but the impact of swell is not considered;
Case 6: In the case of rain, considering the effects of rainfall and swell.
Figure 9 shows the distribution of ERA5 wind speed in the oceans near China. As can be seen from the figure, the wind speeds of samples are mainly concentrated in the middle and low wind speeds, and the number of data samples with large wind speeds is relatively small. The wind speed samples contain rainfall or swell information. In this case, in order to obtain high-precision and high-reliability retrieval results of wind speed, it is necessary to take into account the effects of rainfall and swell on the retrieval of wind speed.
Figure 9.
ERA5 wind speed distribution in the oceans near China.
To solve this problem, Pascual et al. used SWH information as external reference data to improve the retrieval results of sea surface wind speeds measured by CYGNSS satellites [38], and they built a lookup table (LUT) that included information on ECMWF wind speed and SWH. In fact, the LUT method for correcting spaceborne GNSS-R data using SWH was proposed by Clarizia et al. back in 2017 [39] but was not implemented because at that time CYGNSS did not have enough data to establish a robust SWH table including all combinations of wind speed and SWH. On the contrary, this work used the Bayesian method, which was not tested with CYGNSS data, but with TDS-1 satellite data. It should be emphasized that SWH is a wave composed of wind waves and swells, in which wind waves are usually closely related to local winds, while swells are not affected by local winds. They are from other sea areas on the sea surface, local winds that rapidly weaken and fade, or waves left on the sea surface after the wind direction changes [6]. Therefore, it may not be reasonable to directly correct wind speeds retrieved by spaceborne GNSS-R via SWH, despite the fact that swells have a significant input of more than 75% to SWH [40]. Previous studies have shown that swells can affect the retrieval accuracy of wind speed of spaceborne GNNS-R [34,41], so it is more reasonable to model a swell height (rather than a mixed-wave SWH) in combination with a reference wind speed. In addition, although Said et al. have shown that rainfall will affect the retrieval accuracy of wind speed of spaceborne GNSS-R [12], they have not corrected the impact of rainfall in the implementation of wind retrieval or excluded the observation data affected by rainfall. On the contrary, the influence of rainfall is considered and corrected in the retrieval of wind speed in this paper.
Based on the above analysis, this section aims to propose a retrieval method of sea surface wind speed that takes into account the comprehensive effects of rainfall and swell. The retrieval of wind speed of spaceborne GNSS-R based on the GMF method in complex marine environments is challenging [41]. However, the deep learning method has advantages in modeling considering the influence of multiple factors, which can improve the retrieval accuracy of the model. For clarity, the auxiliary input parameters of wind speed retrieval in different cases are listed in Table 5.
Table 5.
Auxiliary input parameters for wind speed retrieval in different cases. (The input auxiliary parameters of Case 1 and Case 3 in the table are the same, the difference is that Case 1 is affected by rainfall, while Case 3 is not affected by rainfall. Similarly, the auxiliary input parameters of Case 2 and Case 4 are the same. Case 2 is affected by rainfall and Case 4 is not affected by rainfall.).
6.1. Performance Analysis of Retrieval of Sea Surface Wind Speed before and after Rainfall Impact
Figure 10 shows the retrieval results of sea surface wind speed before and after considering the influence of rainfall in some randomly selected sample data, corresponding to Case 1 and Case 5, respectively, described above. The figure also shows the RMSE (blue letters) and MAE (gray letters) of the wind speed retrieved by the GNSS-R method without taking into account the influence of rainfall and ERA5 wind speed, and the RMSE (magenta letters) and MAE (green letters) of the wind speed retrieved by the GNSS-R method after taking into account the influence of rainfall and ERA5 wind speed.
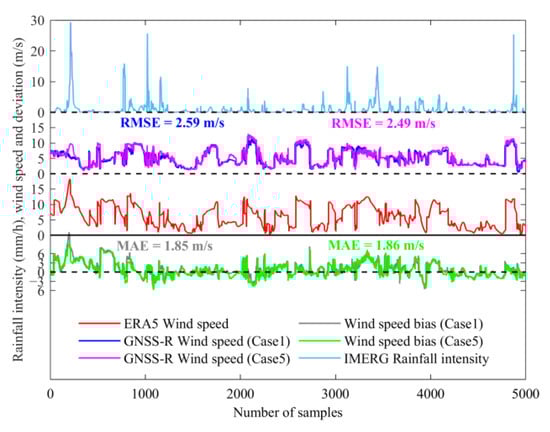
Figure 10.
Retrieval results of sea surface wind speed before and after considering the influence of rainfall (the impact of swell is not considered).
From Figure 10, without considering the impact of swell on the retrieval of spaceborne GNSS-R wind speed, we can see that the retrieval accuracy of wind speed of Case 5 is better than that of Case 1, which indicates that the retrieved accuracy of wind speed by spaceborne GNSS-R method is improved after considering the influence of rainfall, although the improvement is not obvious (about 3.8%).
Figure 11 shows the scattered density plot of retrieved wind speed before and after taking into account the influence of rainfall and ERA5 wind speed. From the figure, when the influence of rainfall is not taken into account, in the wind speed range of 10~20 m/s, some scattered data points appear along the 1:1 reference line, and this situation is improved after considering the impact of rainfall, and this part of the data points accumulates along the y = x line. This shows that the retrieval accuracy of spaceborne GNSS-R wind speed is improved by taking into account the influence of rainfall.
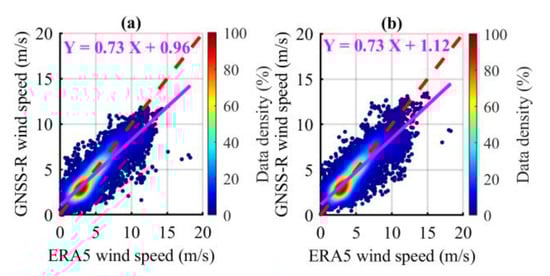
Figure 11.
Scatter density plots of retrieved wind speed and ERA5 wind speed before and after considering the influence of rainfall (the impact of swell is not considered). (a) Case 1. (b) Case5.
6.2. Performance Analysis of Retrieval of Sea Surface Wind Speed before and after Considering the Influence of Swell
Figure 12a shows the retrieval results of some randomly selected sample data on the sea surface wind speed before and after considering the influence of swell, which correspond to Case 1 and Case 2 described above, respectively. These two cases do not take into account the impact of rainfall on wind speed retrieval of spaceborne GNSS-R. The figure also shows the RMSE (blue letters) and MAE (gray letters) of the wind speed retrieved by the GNSS-R method without considering the impact of swell and ERA5 wind speed, and the RMSE (magenta letters) and MAE (green letters) of the wind speed retrieved by the GNSS-R method, considering the impact of swell and ERA5 wind speed. It can be seen from the figure that the retrieval accuracy of wind speed in Case 2 is significantly better than that in Case 1, which indicates that the retrieval accuracy of wind speed by the spaceborne GNSS-R method is significantly improved by more than 51% after considering the influence of swell. In addition, it can also be seen from the diagram that when there is a swell on the sea surface, the deviation of the retrieved wind speed will be very large without considering the influence of the swell. However, after considering the correction of the swell height, the deviation of wind speed is reduced. Compared with considering the influence of rainfall on wind speed, this improvement is significant. Note that since the wind speed of the sample data is mainly distributed in the middle and low wind speed sections, the RMSE value shown here is relatively small. This phenomenon is common in the current wind speed retrieval of spaceborne GNSS-R based on machine learning and deep learning [41]. In general, both the deep learning network with other model architectures and the deep learning model architecture proposed in this paper can obtain high accuracy for the retrieval of medium and low wind speeds.
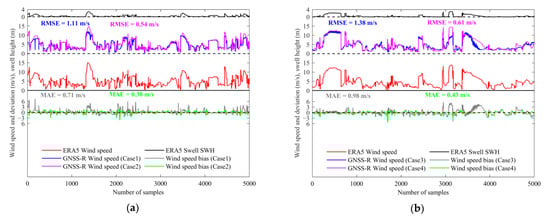
Figure 12.
Retrieval results of sea surface wind speed before and after considering the influence of swell. (a) The impact of rainfall is not considered. (b) No rainfall impact.
Figure 12b shows the retrieval results of sea surface wind speed before and after considering the influence of swells in the case of randomly selected sample data that are not affected by rainfall, which correspond to Case 3 and Case 4, respectively. The figure also shows the RMSE (blue letters) and MAE (gray letters) of the wind speed retrieved by the GNSS-R method without considering the influence of surge and the ERA5 wind speed, and the RMSE (magenta letters) and MAE (green letters) of the wind speed retrieved by the GNSS-R method after considering the influence of surge and the ERA5 wind speed. It can be seen from the figure that the retrieval accuracy of wind speed in Case 4 is obviously better than that in Case 3. After considering the influence of swell, the retrieval accuracy of wind speed by the spaceborne GNSS-R method is improved by more than 55%. Compared with the results in Figure 12a, it is found that rainfall does affect the wind speed retrieval of spaceborne GNSS-R, which also confirms the reliability of the results in Figure 10, although the effect of rainfall is not obvious.
6.3. Performance Analysis of Retrieval of Sea Surface Wind Speed Considering Both Rainfall and Swell Effects
Figure 13 shows the retrieval results of sea surface wind speed before and after the influence of swells in randomly selected sample data taking into account the influence of rainfall, corresponding to Case 5 and Case 6, respectively, described above. The figure also shows the RMSE (blue letters) and MAE (gray letters) of the wind speed retrieved by the GNSS-R method without considering the influence of surge and the ERA5 wind speed, and the RMSE (magenta letters) and MAE (green letters) of the wind speed retrieved by the GNSS-R method after considering the influence of swell and the ERA5 wind speed. As can be seen from the figure, the retrieval accuracy of the wind speed of Case 6 is significantly better than that of Case 5. After considering the influence of swell, the accuracy of the spaceborne GNSS-R method is improved by more than 67%. The results show that even if the influence of rainfall on wind speed retrieval is considered and corrected, the accuracy improvement is limited. The possible reason is that the sea surface rainfall is usually very small, or the sea surface wind speed is usually very large to suppress the rainfall, resulting in the influence of rainfall on wind speed is not very obvious. However, it is very important to consider the impact of swells, especially in the case of low wind speeds (less than 6 m/s), usually sea conditions with low wind speeds are more susceptible to swells [19].
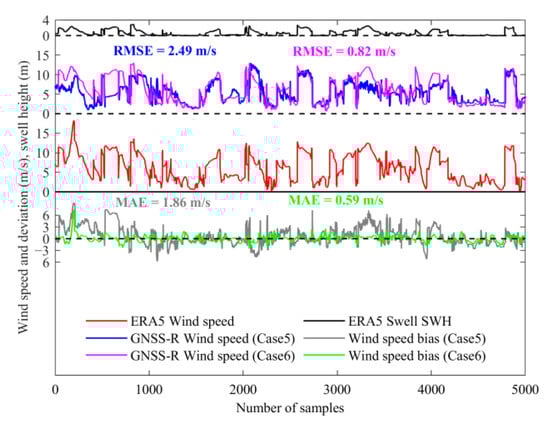
Figure 13.
Retrieval results of sea surface wind speed before and after considering the influence of swell (considering the impact of rainfall).
The above analysis results show that rainfall and swell do have an impact on the retrieval performance of wind speed using spaceborne GNSS-R technology, especially the impact of swell height. Therefore, special consideration should be given to modeling. It should be noted that in this paper, the joint retrieval method proposed in Figure 6 takes into account the effects of rainfall and swell on wind speed retrieval and eliminates or corrects them to obtain high-precision retrieval results of wind speed. In fact, we can see from the retrieval process in Figure 6 above that when a large amount of data contaminated by rainfall has been excluded after the second phase of rainfall detection, the retrieval results of wind speed are almost unaffected by rainfall, and the key to improving the retrieval accuracy of wind speed is to correct or eliminate the impact of swells. Therefore, the third-stage retrieval results of wind speed shown in Figure 6 above correspond to Case 3 and Case 4 discussed in Section 6.2.
Table 6 shows a comparison of the retrieval results of wind speed in Case 3, Case 4, and other Cases. The retrieval accuracy of wind speed in different cases is evaluated by four metrics: RMSE, MAE, CC, and MAPE. It can be seen from the table that the retrieval accuracy of wind speed is significantly improved by about 60% after correction for swell height. The retrieval accuracy of wind speed is not improved obviously after correction for rainfall. However, when the data containing rainfall information are excluded and not corrected by swell height, the retrieval accuracy is improved by about 8%. Compared with the situation that the data containing rainfall information are not excluded and not corrected by swell height, the proposed joint retrieval method has about a 5% contribution to the retrieval accuracy after excluding rainfall information data. This means that when modeling or testing data contains rainfall information, the retrieval accuracy of spaceborne GNSS-R wind speed is reduced by approximately 5%.
Table 6.
RMSE, MAE, CC, and MAPE for retrieving wind speed based on different cases.
The above analysis shows that the impact of swell on the retrieval accuracy of wind speed is significant, especially for low-speed wind. Although currently there is no effective algorithm that can reasonably eliminate the impact of swells, using a deep learning algorithm, it is possible to build a mathematical model between swell and wind speed and establish a correction model for the error caused by swell, thereby reducing the impact of swell on wind speed retrieval. Figure 14 shows the distribution of retrieved wind speed of spaceborne GNSS-R method before and after eliminating the influence of rainfall, which corresponds to Case 1 and Case 4. Among them, the retrieval results of wind speed of Case 4 have been corrected by surge SWH. It can be seen from the diagram that the retrieval results of wind speed without excluding data affected by rainfall and without SWH correction are very poor, especially under the condition of medium and high wind speed, the retrieved wind speed is very different from ERA5. On the contrary, when the data affected by rainfall is excluded and the swell height is corrected, the distribution of retrieved wind speed is very consistent with the ERA5 wind speed distribution. The feasibility and reliability of the proposed method are further confirmed.
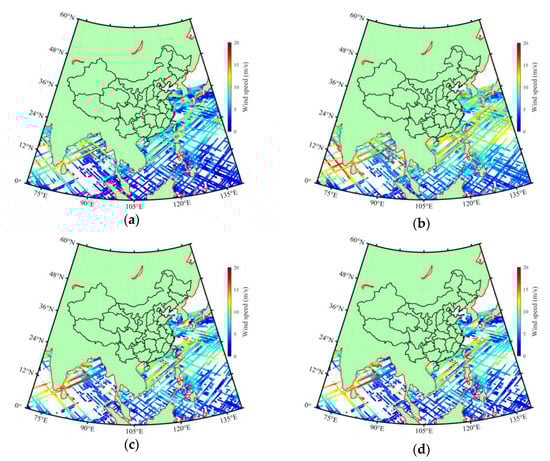
Figure 14.
Retrieval wind speed distribution maps before and after eliminating the influence of rainfall and correcting swell influence. (a) Reference wind speed of Case 1. (b) Inverted wind speed in Case 1. (c) Reference wind speed of Case 4. (d) Inverted wind speed in Case 4.
7. Retrieval of Sea Surface Wave Height Considering Rainfall
The data with and without rain information screened by rainfall detection above are used for the retrieval of sea surface wave height, respectively. This paper focuses on the retrieval for two kinds of wave height, namely SWH and swell height. In this section, in order to compare with the retrieval results of the sea surface SWH considering the effects of rainfall, we designed six case studies in six different situations. For clarity, six cases were set up, that is:
Case 1: In the case of rain, without considering the impact of rainfall and wind speed;
Case 2: In the case of rain, the impact of wind speed is considered but the impact of rainfall is not considered;
Case 3: In the case of rainless, the impact of wind speed is not considered;
Case 4: In the case of rainless, considering the impact of wind speed;
Case 5: In case of rain, the impact of rainfall is considered but the impact of wind speed is not considered;
Case 6: In the case of rain, considering the effects of rainfall and wind speed.
For clarity, the auxiliary input parameters for different cases of SWH retrieval are listed in Table 7.
Table 7.
Auxiliary input parameters for significant wave height retrieval in different cases. (The auxiliary input parameters of Case 1 and Case 3 in the Table are the same, the difference is that Case 1 is affected by rainfall, while Case 3 is not affected by rainfall. Similarly, the auxiliary input parameters of Case 2 and Case 4 are the same. Case 2 is affected by rainfall and Case 4 is not affected by rainfall, respectively.).
7.1. Performance Analysis of Retrieval of Sea Surface SWH before and after Considering Rainfall
Figure 15 (top) shows the retrieval results of sea surface SWH before and after the influence of rainfall is taken into account for randomly selected partial sample data, corresponding to Case 1 and Case 5, respectively. The figure also shows the RMSE of the retrieved SWH using GNSS-R method and the SWH of ERA5 before and after considering the influence of rainfall (magenta letters), the RMSE of the swell height of ERA5 and the SWH of ERA5 (blue letters), and the RMSE of the wind wave SWH of ERA5 and the SWH of ERA5 (black letters). In addition, for the convenience of analysis, the rainfall intensity and wind speed information are also given in the figure. Note that wind speed is not used as an input parameter of the DCNN model in these two cases. Figure 15 (bottom) shows that when the wind speed is used as the input parameter of the DCNN model, the retrieval results of sea surface SWH before and after considering the influence of rainfall correspond to Case 2 and Case 6 described above. The reason for considering wind speed as an input parameter here is that it is the driving force of the waves, especially at high wind speeds [42].
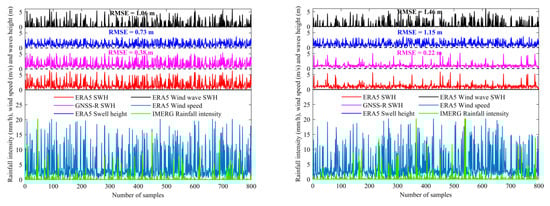
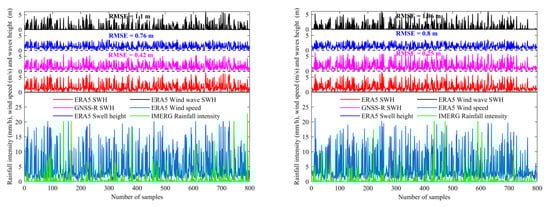
Figure 15.
Retrieval results of sea surface SWH before (Left) and after (Right) considering the influence of rainfall. (Top): Wind speed is not taken as an input parameter; (Bottom): Wind speed as an input parameter.
It can be seen from Figure 15 that when the wind speed is not used as the input parameter of the DCNN model, the accuracy of the SWH retrieved by the GNSS-R method is improved by about 42% after considering the influence of rainfall. When the wind speed is used as the input parameter of the DCNN model, the accuracy of the SWH retrieved by the GNSS-R method is improved by about 40% after considering the influence of rainfall. This shows that when the wind speed is used as an input parameter, the retrieval accuracy of SWH is not significantly improved, and the main reason is that, compared to SWH caused by wind, SWH caused by sea surface swell is dominant, and the contribution of swell to SWH is greater. The correlation between wind wave SWH and ERA5 SWH is low. It is emphasized that from the perspective of the improvement rate of retrieval accuracy after considering the influence of rainfall, the influence of rainfall on the SWH of spaceborne GNSS-R is significantly greater than the influence of wind speed. Therefore, special consideration should be given to the modeling of SWH retrieval. It should be noted that in this paper, the joint retrieval method presented in Figure 6 specifically considers the effect of rainfall on the retrieval of SWH, that is, the fourth-stage retrieval results of SWH shown in Figure 6 above corresponds to Case 4 discussed in Section 7.2 below.
7.2. Performance Analysis of Sea Surface SWH Retrieval without Rainfall Influence
When the joint retrieval method is adopted, since rainfall detection has been carried out in the second stage and the data contaminated by rainfall has been excluded, the influence of rainfall on the retrieval of SWH has been almost eliminated. At this time, the retrieval of sea surface SWH mainly considers the contribution of wind speed input to the retrieval performance of the DCNN model. Therefore, in this section, we focus on Case 3 and Case 4.
Figure 16 shows the retrieval results of sea surface SWH without the rainfall effect in some randomly selected sample data, namely the retrieval results of Case 3 and Case 4. It can be seen from the figure that the retrieval accuracy of SWH is higher without rainfall interference. However, when the wind speed is used as the input parameter of the DCNN model, the retrieval accuracy is not significantly improved. The main reason is the characteristics of the selected data samples. The wind speed in the figure is mainly distributed around 5 m/s. In this case, the swell height is obviously dominant compared with the wind wave SWH. Another interesting phenomenon can be observed from the figure: when the wind speed suddenly increases, the wind wave SWH increases significantly. This indicates that wind speed contributes to SWH. However, swell height usually does not change significantly with wind speed. By comparing the retrieved SWH of GNSS-R with ERA5 SWH and ERA5 swell height, it can be found that the difference between the three is very small, which further indicates the feasibility and reliability of the proposed method.
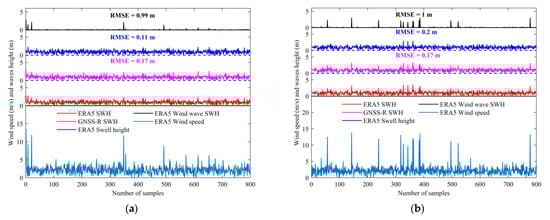
Figure 16.
Retrieval results of sea surface SWH without rainfall influence. (a) Wind speed is not taken as input parameter. (b) Wind speed as input parameter.
For the convenience of comparison, Table 8 also gives the statistical results of the retrieval performance of Case 3, Case 4, and other Cases. The retrieval accuracy of different cases is evaluated by the four metrics of RMSE, MAE, CC, and MAPE. It can be seen from the table that the retrieval accuracy of SWH is improved by about 18% after eliminating or correcting the influence of rainfall. When the sea surface wind speed is large or changes rapidly, the accuracy can be improved by using the wind speed as the input parameter of the DCNN model. However, if the sea surface wind speed is small or slow, the wind speed as an input parameter of the DCNN model has little improvement on the retrieval accuracy.
Table 8.
RMSE, MAE, CC, and MAPE for retrieving SWH based on different cases.
7.3. Performance Analysis of Retrieval of Sea Surface Swell SWH before and after Considering Rainfall Effect
In this section, the DCNN model architecture is used to retrieve the swell height. three cases are analyzed to discuss whether rainfall will affect the retrieval of swell height of spaceborne GNSS-R. That is:
Case 1: In the case of rain, without considering the impact of rainfall;
Case 2: In the case of rain, the impact of rainfall is considered;
Case 3: In the case of rainless.
The auxiliary input parameters of swell SWH retrieval in different cases are listed in Table 9.
Table 9.
Auxiliary input parameters for swell height retrieval in different cases. (The auxiliary input parameters of Case 1 and Case 3 in the Table are the same. The difference is that Case 1 is affected by rainfall, while Case 3 is not affected by rainfall. In addition, Case 2 corrects the impact of rainfall when it is affected by rainfall.).
Figure 17 shows the retrieval results of sea surface swell height based on different cases of randomly selected sample data. For comparison, Table 10 also gives the statistical results of the retrieval performance of three cases. As can be seen from Figure 17 and Table 10, the proposed joint retrieval method has an improvement of about 5% in retrieval accuracy after excluding data with rainfall information. It should be noted that there is no significant difference between the retrieval results obtained after adjusting for the impact of rainfall (e.g., Case 2) and the results not affected by rainfall (e.g., Case 3), mainly because the distribution of rainfall intensity in the study dataset is relatively small. In fact, if the rainfall intensity is large, even if correction of the rainfall impact is performed, the retrieval accuracy will be at least 5% lower than the results that are not affected by rainfall.
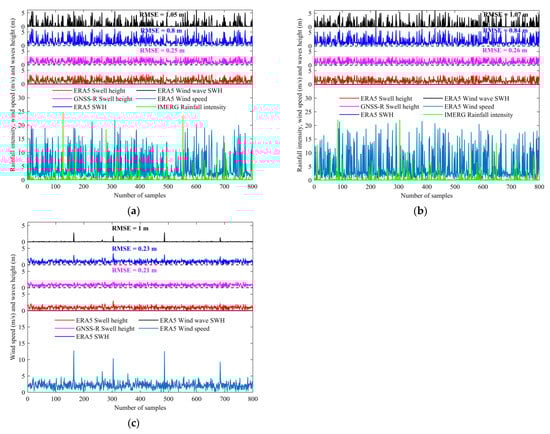
Figure 17.
Retrieval results of sea surface swell height based on different cases. (a) Case 1. (b) Case 2. (c) Case 3.
Table 10.
RMSE, MAE, CC, and MAPE for retrieving swell height based on different cases.
Through the above analysis, although the influence of rainfall reduces the retrieval accuracy of the swell height by only about 5%. However, in practice, it may have a greater impact, especially the retrieval of swell height under heavy rainfall conditions. Therefore, in the retrieval of swell height, it is very important to improve the retrieval accuracy of swell height by detecting rainfall and removing data with rainfall information or correcting the rainfall effect.
8. Conclusions
Aiming at the problem of multi-parameter joint retrieval, we propose a joint retrieval method applicable to the sea surface rainfall and wind waves of spaceborne GNSS-R. The proposed joint retrieval method especially considers the effects between these parameters and realizes the joint retrieval of sea surface rainfall and wind waves with high precision and high reliability by using spaceborne GNSS-R technology.
In view of the problem that rainfall detection at a wide range of wind speeds (<10 m/s) easily reduces the detection accuracy at very low wind speeds (such as <5 m/s), especially considering the impact of swell and wind speed and correcting them, a method of rainfall detection according to different wind speed ranges is proposed, and the results show that the method has high rainfall detection accuracy. By taking into account the combined effects of swell and wind speed, the accuracy of the FFNN model in retrieving rainfall intensity in a wider range of wind speed (<10 m/s) is about 2 mm/h. After eliminating rainfall interference through rainfall detection in advance, the retrieval accuracy of spaceborne GNSS-R wind speed can be improved by about 5%. After considering the influence of rainfall and wind speed, the retrieval accuracy of SWH is improved by about 18%. Finally, based on the DCNN model, the inversion of swell height is studied. The results show that the retrieval accuracy of swell height is better than 0.20 m after excluding rainfall interference. The above analysis results further confirm the importance and feasibility of the proposed joint retrieval method.
In the future, it is necessary to continue to improve the joint retrieval method to enhance retrieval accuracy under high sea conditions. It is also necessary to focus on the use of joint retrieval methods based on spaceborne GNSS-R technology for sea condition perception, marine observation, and marine disaster monitoring to ensure the safety of marine navigation, coastal cities, and people. Meanwhile, wind speed and swell are the main interfering factors in rainfall retrieval. Eliminating or mitigating the impact of wind speed and swell on rainfall intensity retrieval is a key challenge that needs to be addressed in the next step. More importantly, the impact of raindrops relies on their size, which not only depends on the rainfall intensity but also on the type of cloud. This means that they may vary with seasons (e.g., Meiyu rainy season) and locations (e.g., tropical and arctic areas). Moreover, the combination of wind speed and rainfall intensity may also limit the rainfall types. However, the use of spaceborne GNSS-R technology to detect rainfall is still in the initial stage of experimentation, and the current level of technology cannot solve the problem of estimating raindrop size and retrieving rainfall types. Therefore, we will focus on addressing the above issues in future research.
Author Contributions
All authors have made significant contributions to this manuscript. J.B. partly designed the improved method, analyzed the data, wrote the initial version of paper, and validated the improved method; K.Y., X.Z. and W.H. conceived the improved method, wrote the revised version of the paper, and provided supervision; J.B., K.Y., F.Z., X.Z. and W.H. checked and revised this paper. All authors have read and agreed to the published version of the manuscript.
Funding
This work was supported in part by the National Natural Science Foundation of China under Grants 42161067 and 42174022, Major scientific and technological projects of Yunnan Province: Research on Key Technologies of ecological environment monitoring and intelligent management of natural resources in Yunnan under Grant 202202AD080010, in part by the Postgraduate Research & Practice Innovation Program of Jiangsu Province under Grant KYCX20_2003, in part by the Future Scientists Program of China University of Mining and Technology under Grant 2020WLKXJ049, in part by the China Scholarship Council (CSC) through a State Scholarship Fund (No.202106420009).
Data Availability Statement
Not applicable.
Acknowledgments
We would like to thank NASA for providing CYGNSS data, the European Center for Medium-Range Weather Forecasts (ECMWF) for providing wind speed, wind direction, water depth, wave direction and wave height data, and NASA for providing GPM-IMERG rainfall data. The authors also thank the anonymous reviewers for their in-depth reviews and helpful suggestions that have largely contributed to improving this paper.
Conflicts of Interest
The authors declare no conflict of interest.
References
- Bu, J.; Yu, K.; Han, S.; Qian, N.; Lin, Y.; Wang, J. Retrieval of Sea Surface Rainfall Intensity Using Spaceborne GNSS-R Data. IEEE Trans. Geosci. Remote Sens. 2022, 60, 5803116. [Google Scholar] [CrossRef]
- Huang, L.; Zhu, G.; Peng, H.; Liu, L.; Ren, C.; Jiang, W. An improved global grid model for calibrating zenith tropospheric delay for GNSS applications. GPS Solut. 2022, 27, 17. [Google Scholar] [CrossRef]
- Zhou, W.; Liu, Y.; Huang, L.; Ji, B.; Liu, L.; Bian, S. Multi-constellation GNSS interferometric reflectometry for the correction of long-term snow height retrieval on sloping topography. GPS Solut. 2022, 26, 140. [Google Scholar] [CrossRef]
- Huang, L.; Wang, X.; Xiong, S.; Li, J.; Liu, L.; Mo, Z.; Fu, B.; He, H. High-precision GNSS PWV retrieval using dense GNSS sites and in-situ meteorological observations for the evaluation of MERRA-2 and ERA5 reanalysis products over China. Atmos. Res. 2022, 276, 106247. [Google Scholar] [CrossRef]
- Bu, J.; Yu, K. A New Integrated Method of CYGNSS DDMA and LES Measurements for Significant Wave Height Estimation. IEEE Geosci. Remote Sens. Lett. 2022, 19, 1505605. [Google Scholar] [CrossRef]
- Bu, J.; Yu, K.; Park, H.; Huang, W.; Han, S.; Yan, Q.; Qian, N.; Lin, Y. Estimation of Swell Height Using Spaceborne GNSS-R Data from Eight CYGNSS Satellites. Remote Sens. 2022, 14, 4634. [Google Scholar] [CrossRef]
- Bu, J.; Yu, K.; Zhu, Y.; Qian, N.; Chang, J. Developing and Testing Models for Sea Surface Wind Speed Estimation with GNSS-R Delay Doppler Maps and Delay Waveforms. Remote Sens. 2020, 12, 3760. [Google Scholar] [CrossRef]
- Wan, Y.; Zhang, X.; Fan, C.; Qu, R.; Ma, E. A Joint Method for Wave and Wind Field Parameter Inversion Combining SAR with Wave Spectrometer Data. Remote Sens. 2022, 14, 3601. [Google Scholar] [CrossRef]
- Wan, Y.; Qu, R.; Shi, X.; Dai, Y. A Joint Inversion Method of Wave and Wind Field Parameters Based on SAR SLC Data. IEEE Geosci. Remote Sens. Lett. 2022, 19, 1–5. [Google Scholar] [CrossRef]
- Li, G.; Zhang, Y.; Dong, X. Approaches for Joint Retrieval of Wind Speed and Significant Wave Height and Further Improvement for Tiangong-2 Interferometric Imaging Radar Altimeter. Remote Sens. 2022, 14, 1930. [Google Scholar] [CrossRef]
- Yang, Z.; Huang, W.; Chen, X. Mitigation of Rain Effect on Wave Height Measurement Using X-Band Radar Sensor. IEEE Sens. J. 2022, 22, 5929–5938. [Google Scholar] [CrossRef]
- Said, F.; Jelenak, Z.; Park, J.; Chang, P.S. The NOAA Track-Wise Wind Retrieval Algorithm and Product Assessment for CyGNSS. IEEE Trans. Geosci. Remote Sens. 2022, 60, 4202524. [Google Scholar] [CrossRef]
- Asgarimehr, M.; Zavorotny, V.; Wickert, J.; Reich, S. Can GNSS Reflectometry Detect Precipitation Over Oceans? Geophys. Res. Lett. 2018, 45, 12585–12592. [Google Scholar] [CrossRef]
- Balasubramaniam, R.; Ruf, C. Characterization of rain impact on L-Band GNSS-R ocean surface measurements. Remote Sens. Environ. 2020, 239, 111607. [Google Scholar] [CrossRef]
- Bliven, L.F.; Sobieski, P.W.; Craeye, C. Rain generated ring-waves: Measurements and modelling for remote sensing. Int. J. Remote Sens. 1997, 18, 221–228. [Google Scholar] [CrossRef]
- Craeye, C.; Sobieski, P.W.; Bliven, L.F. Scattering by artificial wind and rain roughened water surfaces at oblique incidences. Int. J. Remote Sens. 1997, 18, 2241–2246. [Google Scholar] [CrossRef]
- Huang, W.; Liu, X.; Gill, E.W. Ocean Wind and Wave Measurements Using X-Band Marine Radar: A Comprehensive Review. Remote Sens. 2017, 9, 1261. [Google Scholar] [CrossRef]
- Chen, X.; Huang, W.; Zhao, C.; Tian, Y. Rain Detection From X-Band Marine Radar Images: A Support Vector Machine-Based Approach. IEEE Trans. Geosci. Remote Sens. 2020, 58, 2115–2123. [Google Scholar] [CrossRef]
- Soisuvarn, S.; Jelenak, Z.; Said, F.; Chang, P.S.; Egido, A. The GNSS Reflectometry Response to the Ocean Surface Winds and Waves. IEEE J. Sel. Top. Appl. Earth Observ. Remote Sens. 2016, 9, 4678–4699. [Google Scholar] [CrossRef]
- Elfouhaily, T.; Chapron, B.; Katsaros, K.; Vandemark, D. A unified directional spectrum for long and short wind-driven waves. J. Geophys. Res. Ocean. 1997, 102, 15781–15796. [Google Scholar] [CrossRef]
- Hwang, P.A.; Ocampo-Torres, F.J.; García-Nava, H. Wind Sea and Swell Separation of 1D Wave Spectrum by a Spectrum Integration Method. J. Atmos. Oceanic Technol. 2012, 29, 116–128. [Google Scholar] [CrossRef]
- Durden, S.; Vesecky, J. A physical radar cross-section model for a wind-driven sea with swell. IEEE J. Ocean. Eng. 1985, 10, 445–451. [Google Scholar] [CrossRef]
- Ghavidel, A.; Camps, A. Impact of Rain, Swell, and Surface Currents on the Electromagnetic Bias in GNSS-Reflectometry. IEEE J. Sel. Top. Appl. Earth Observ. Remote Sens. 2016, 9, 4643–4649. [Google Scholar] [CrossRef]
- Voronovich, A.G.; Zavorotny, V.U. Bistatic Radar Equation for Signals of Opportunity Revisited. IEEE Trans. Geosci. Remote Sens. 2018, 56, 1959–1968. [Google Scholar] [CrossRef]
- Leader, J.C. Incoherent backscatter from rough surfaces: The two-scale model reexamined. Radio Sci. 1978, 13, 441–457. [Google Scholar] [CrossRef]
- Li, B.; Yang, L.; Zhang, B.; Yang, D.; Wu, D. Modeling and Simulation of GNSS-R Observables With Effects of Swell. IEEE J. Sel. Top. Appl. Earth Observ. Remote Sens. 2020, 13, 1833–1841. [Google Scholar] [CrossRef]
- Huang, F.; Garrison, J.L.; Leidner, S.M.; Annane, B.; Hoffman, R.N.; Grieco, G.; Stoffelen, A. A Forward Model for Data Assimilation of GNSS Ocean Reflectometry Delay-Doppler Maps. IEEE Trans. Geosci. Remote Sens. 2021, 59, 2643–2656. [Google Scholar] [CrossRef]
- Wang, F.; Yang, D.; Zhang, B.; Li, B.; Zhang, G. Modeling and simulation of spaceborne GNSS ocean-reflectometry. J. Beijing Univ. Aeronaut. Astronaut. 2022, 48, 419–429. [Google Scholar] [CrossRef]
- Brown, G.S. Backscattering from a Gaussian-distributed perfectly conducting rough surface. IEEE Trans. Antennas Propag. 1978, 26, 472–482. [Google Scholar] [CrossRef]
- Bu, J.; Yu, K.; Ni, J.; Yan, Q.; Han, S.; Wang, J.; Wang, C. Machine learning-based methods for sea surface rainfall detection from CYGNSS delay-doppler maps. GPS Solut. 2022, 26, 132. [Google Scholar] [CrossRef]
- Bu, J.; Yu, K.; Zuo, X.; Ni, J.; Li, Y.; Huang, W. GloWS-Net: A Deep Learning Framework for Retrieving Global Sea Surface Wind Speed Using Spaceborne GNSS-R Data. Remote Sens. 2023, 15, 590. [Google Scholar] [CrossRef]
- Asgarimehr, M.; Arnold, C.; Weigel, T.; Ruf, C.; Wickert, J. GNSS reflectometry global ocean wind speed using deep learning: Development and assessment of CyGNSSnet. Remote Sens. Environ. 2022, 269, 112801. [Google Scholar] [CrossRef]
- Li, C.; Huang, W. An Algorithm for Sea-Surface Wind Field Retrieval From GNSS-R Delay-Doppler Map. IEEE Geosci. Remote Sens. Lett. 2014, 11, 2110–2114. [Google Scholar] [CrossRef]
- Li, X.; Yang, D.; Yang, J.; Zheng, G.; Han, G.; Nan, Y.; Li, W. Analysis of coastal wind speed retrieval from CYGNSS mission using artificial neural network. Remote Sens. Environ. 2021, 260, 112454. [Google Scholar] [CrossRef]
- Bu, J.; Yu, K. Sea Surface Rainfall Detection and Intensity Retrieval Based on GNSS-Reflectometry Data From the CYGNSS Mission. IEEE Trans. Geosci. Remote Sens. 2022, 60, 5802015. [Google Scholar] [CrossRef]
- Asgarimehr, M.; Zhelavskaya, I.; Foti, G.; Reich, S.; Wickert, J. A GNSS-R Geophysical Model Function: Machine Learning for Wind Speed Retrievals. IEEE Geosci. Remote Sens. Lett. 2020, 17, 1333–1337. [Google Scholar] [CrossRef]
- Yu, K.; Han, S.; Bu, J.; An, Y.; Zhou, Z.; Wang, C.; Tabibi, S.; Cheong, J.W. Spaceborne GNSS Reflectometry. Remote Sens. 2022, 14, 1605. [Google Scholar] [CrossRef]
- Pascual, D.; Clarizia, M.P.; Ruf, C.S. Improved CYGNSS Wind Speed Retrieval Using Significant Wave Height Correction. Remote Sens. 2021, 13, 4313. [Google Scholar] [CrossRef]
- Clarizia, M.P.; Ruf, C.S. Bayesian Wind Speed Estimation Conditioned on Significant Wave Height for GNSS-R Ocean Observations. J. Atmos. Oceanic Technol. 2017, 34, 1193–1202. [Google Scholar] [CrossRef]
- Semedo, A.; Sušelj, K.; Rutgersson, A.; Sterl, A. A global view on the wind sea and swell climate and variability from ERA-40. J. Clim. 2011, 24, 1461–1479. [Google Scholar] [CrossRef]
- Guo, W.; Du, H.; Guo, C.; Southwell, B.J.; Cheong, J.W.; Dempster, A.G. Information fusion for GNSS-R wind speed retrieval using statistically modified convolutional neural network. Remote Sens. Environ. 2022, 272, 112934. [Google Scholar] [CrossRef]
- Wang, F.; Yang, D.; Yang, L. Retrieval and Assessment of Significant Wave Height from CYGNSS Mission Using Neural Network. Remote Sens. 2022, 14, 3666. [Google Scholar] [CrossRef]
Disclaimer/Publisher’s Note: The statements, opinions and data contained in all publications are solely those of the individual author(s) and contributor(s) and not of MDPI and/or the editor(s). MDPI and/or the editor(s) disclaim responsibility for any injury to people or property resulting from any ideas, methods, instructions or products referred to in the content. |
© 2023 by the authors. Licensee MDPI, Basel, Switzerland. This article is an open access article distributed under the terms and conditions of the Creative Commons Attribution (CC BY) license (https://creativecommons.org/licenses/by/4.0/).