
Probabilistic Wildfire Segmentation Using Supervised Deep Generative Model from Satellite Imagery


 , ,
, ,
Abstract
1. Introduction
2. Methodology
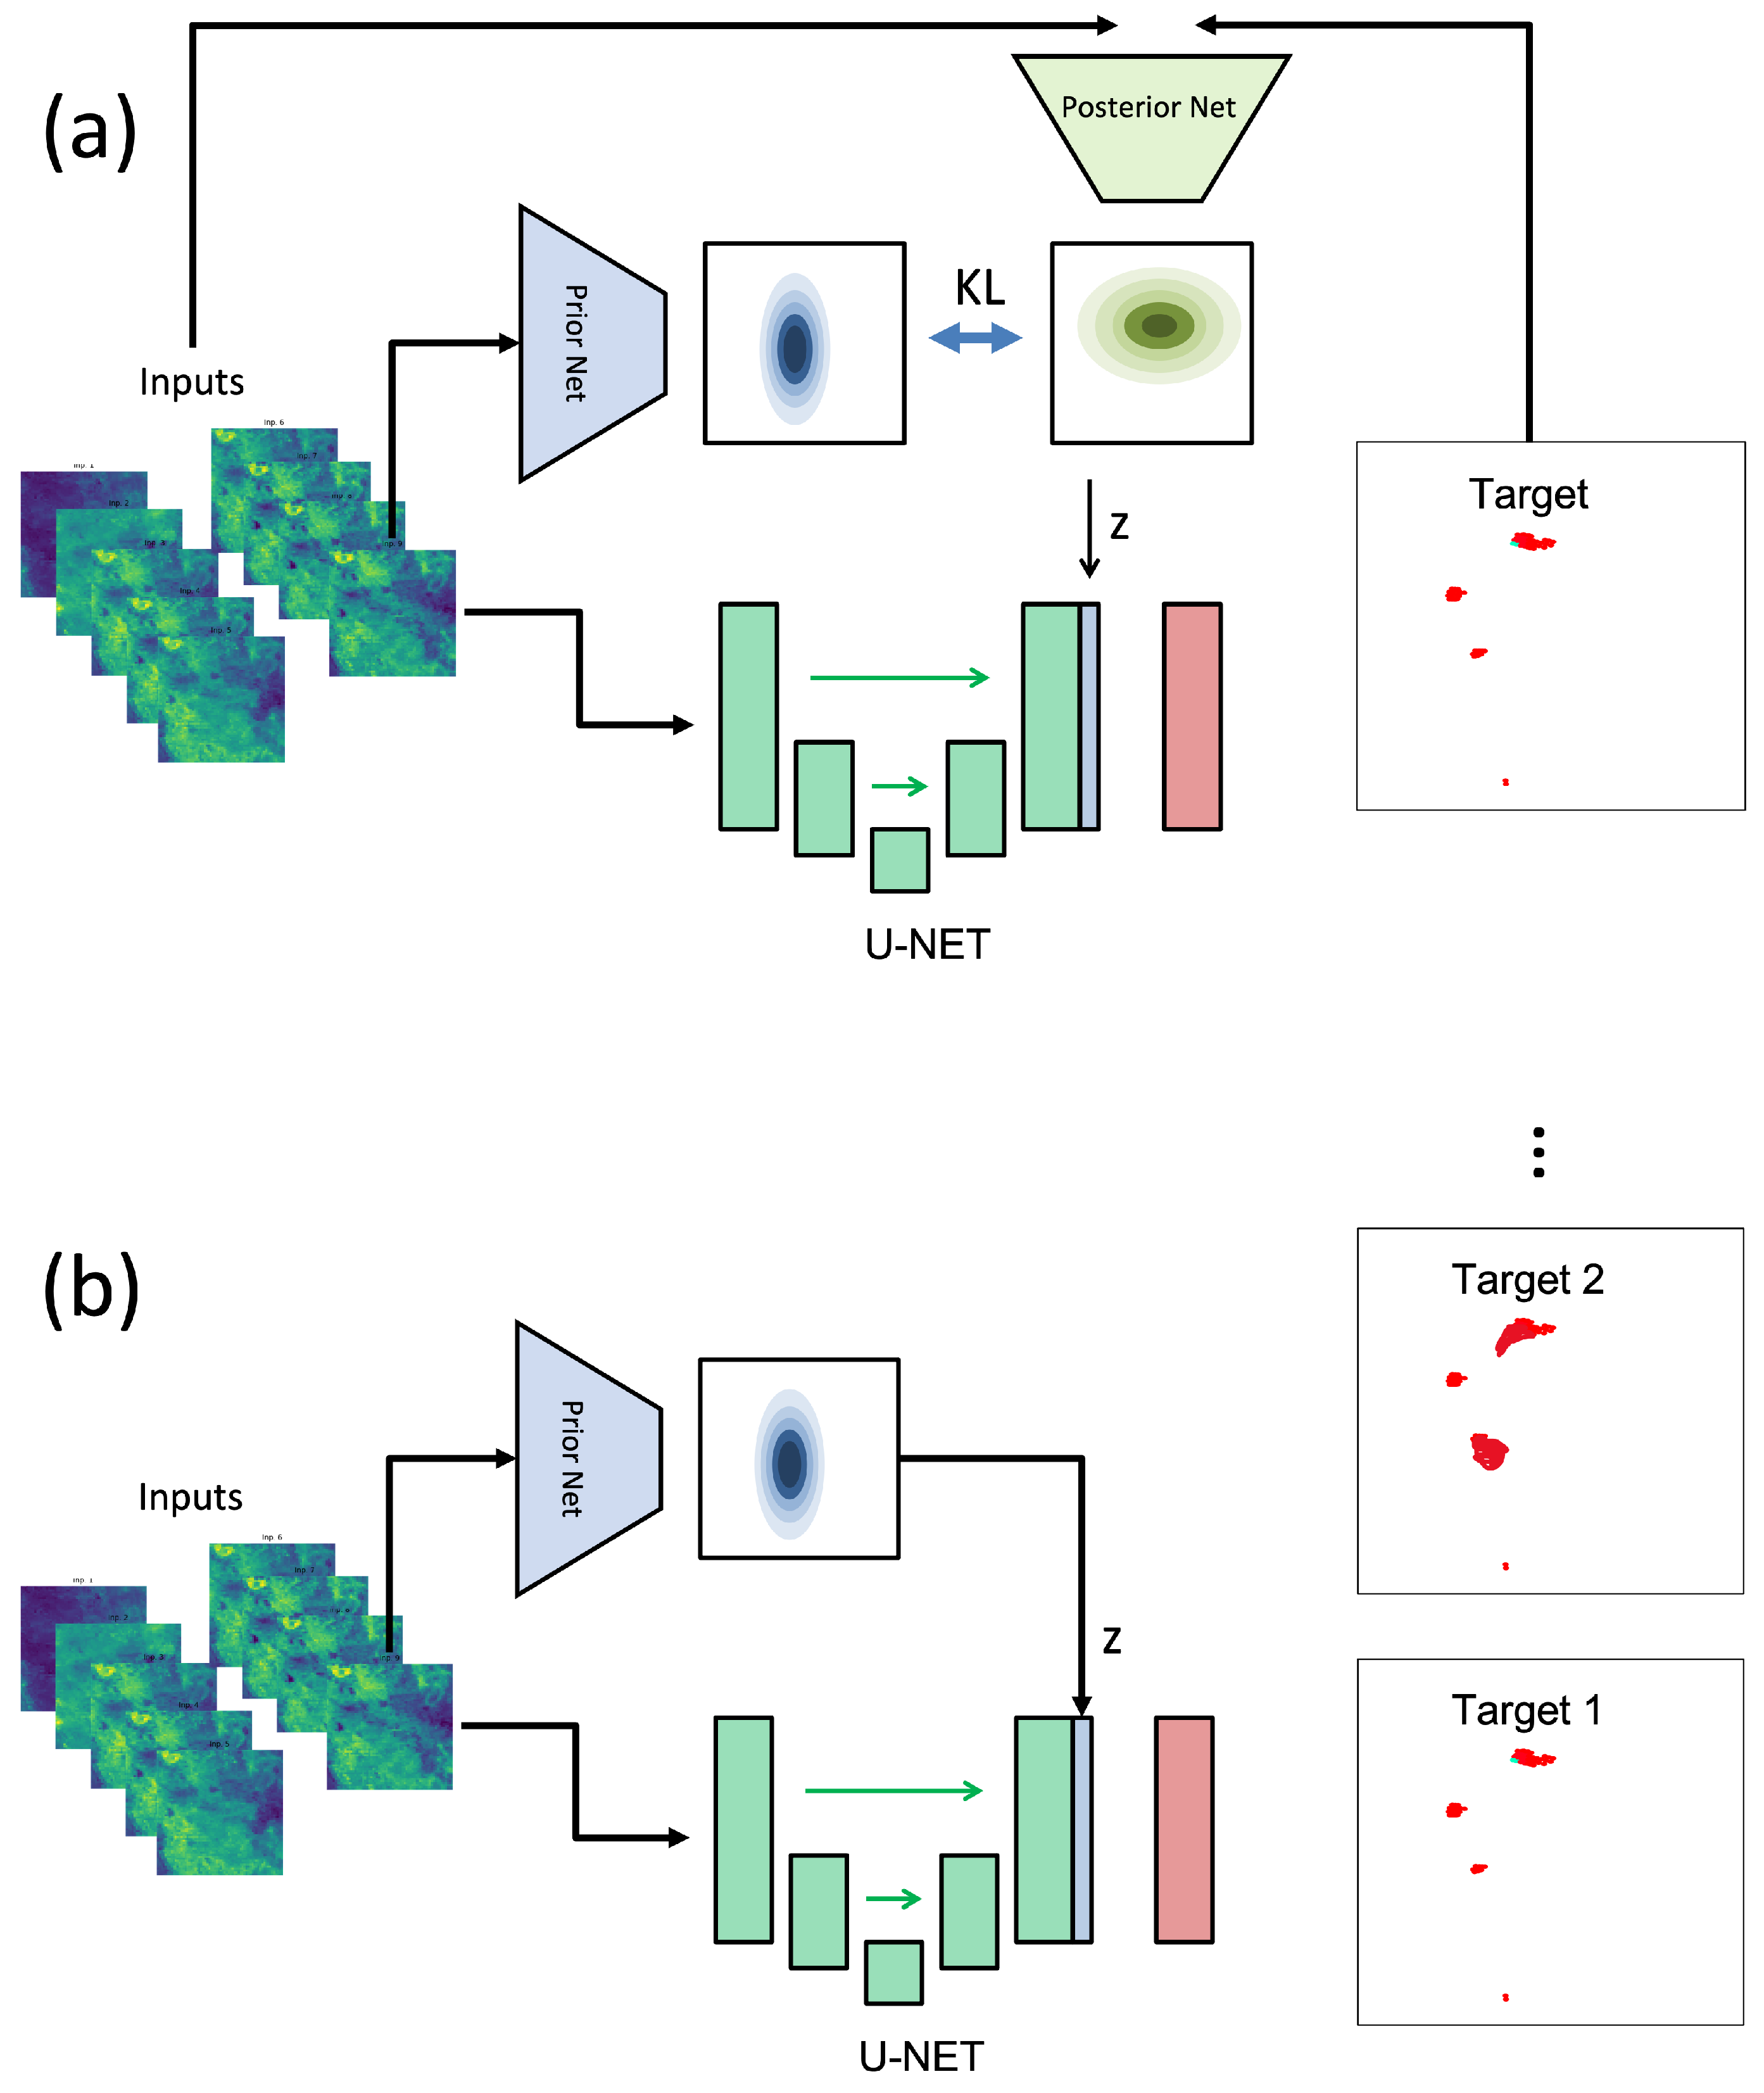
2.1. Variational Autoencoder
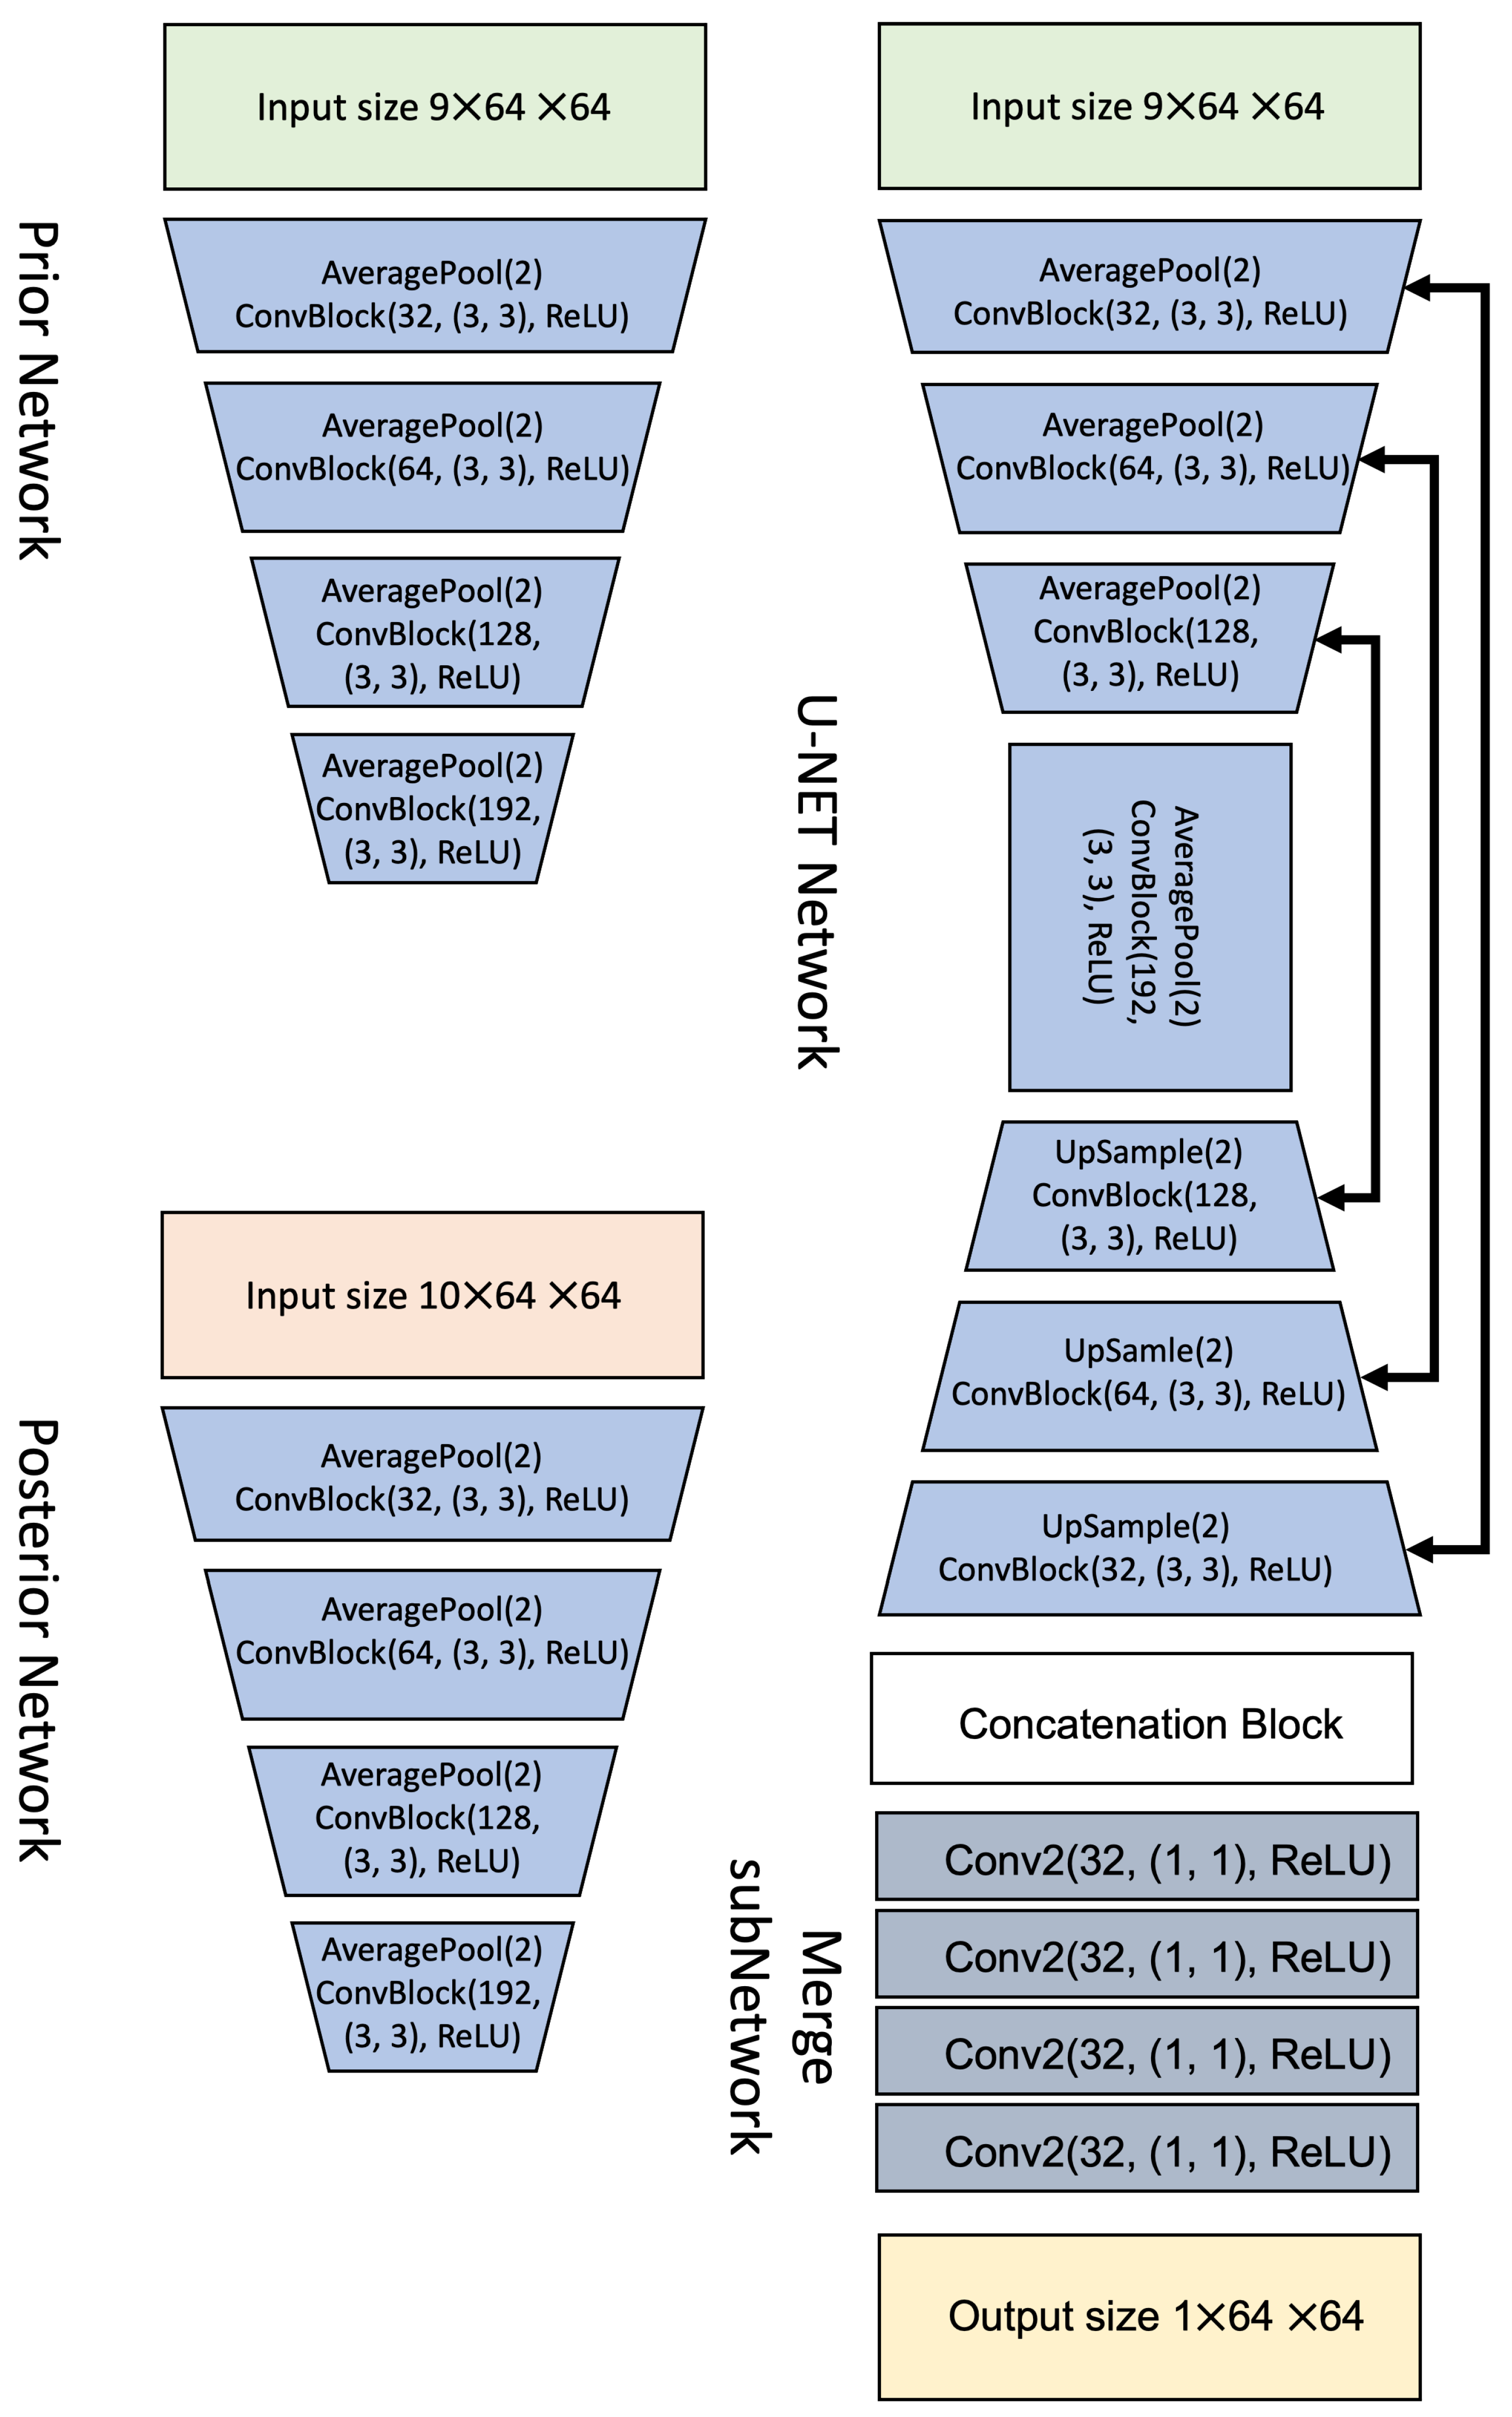
2.2. Proposed Approach
2.3. Baseline Methods
2.3.1. U-Net with Dropout
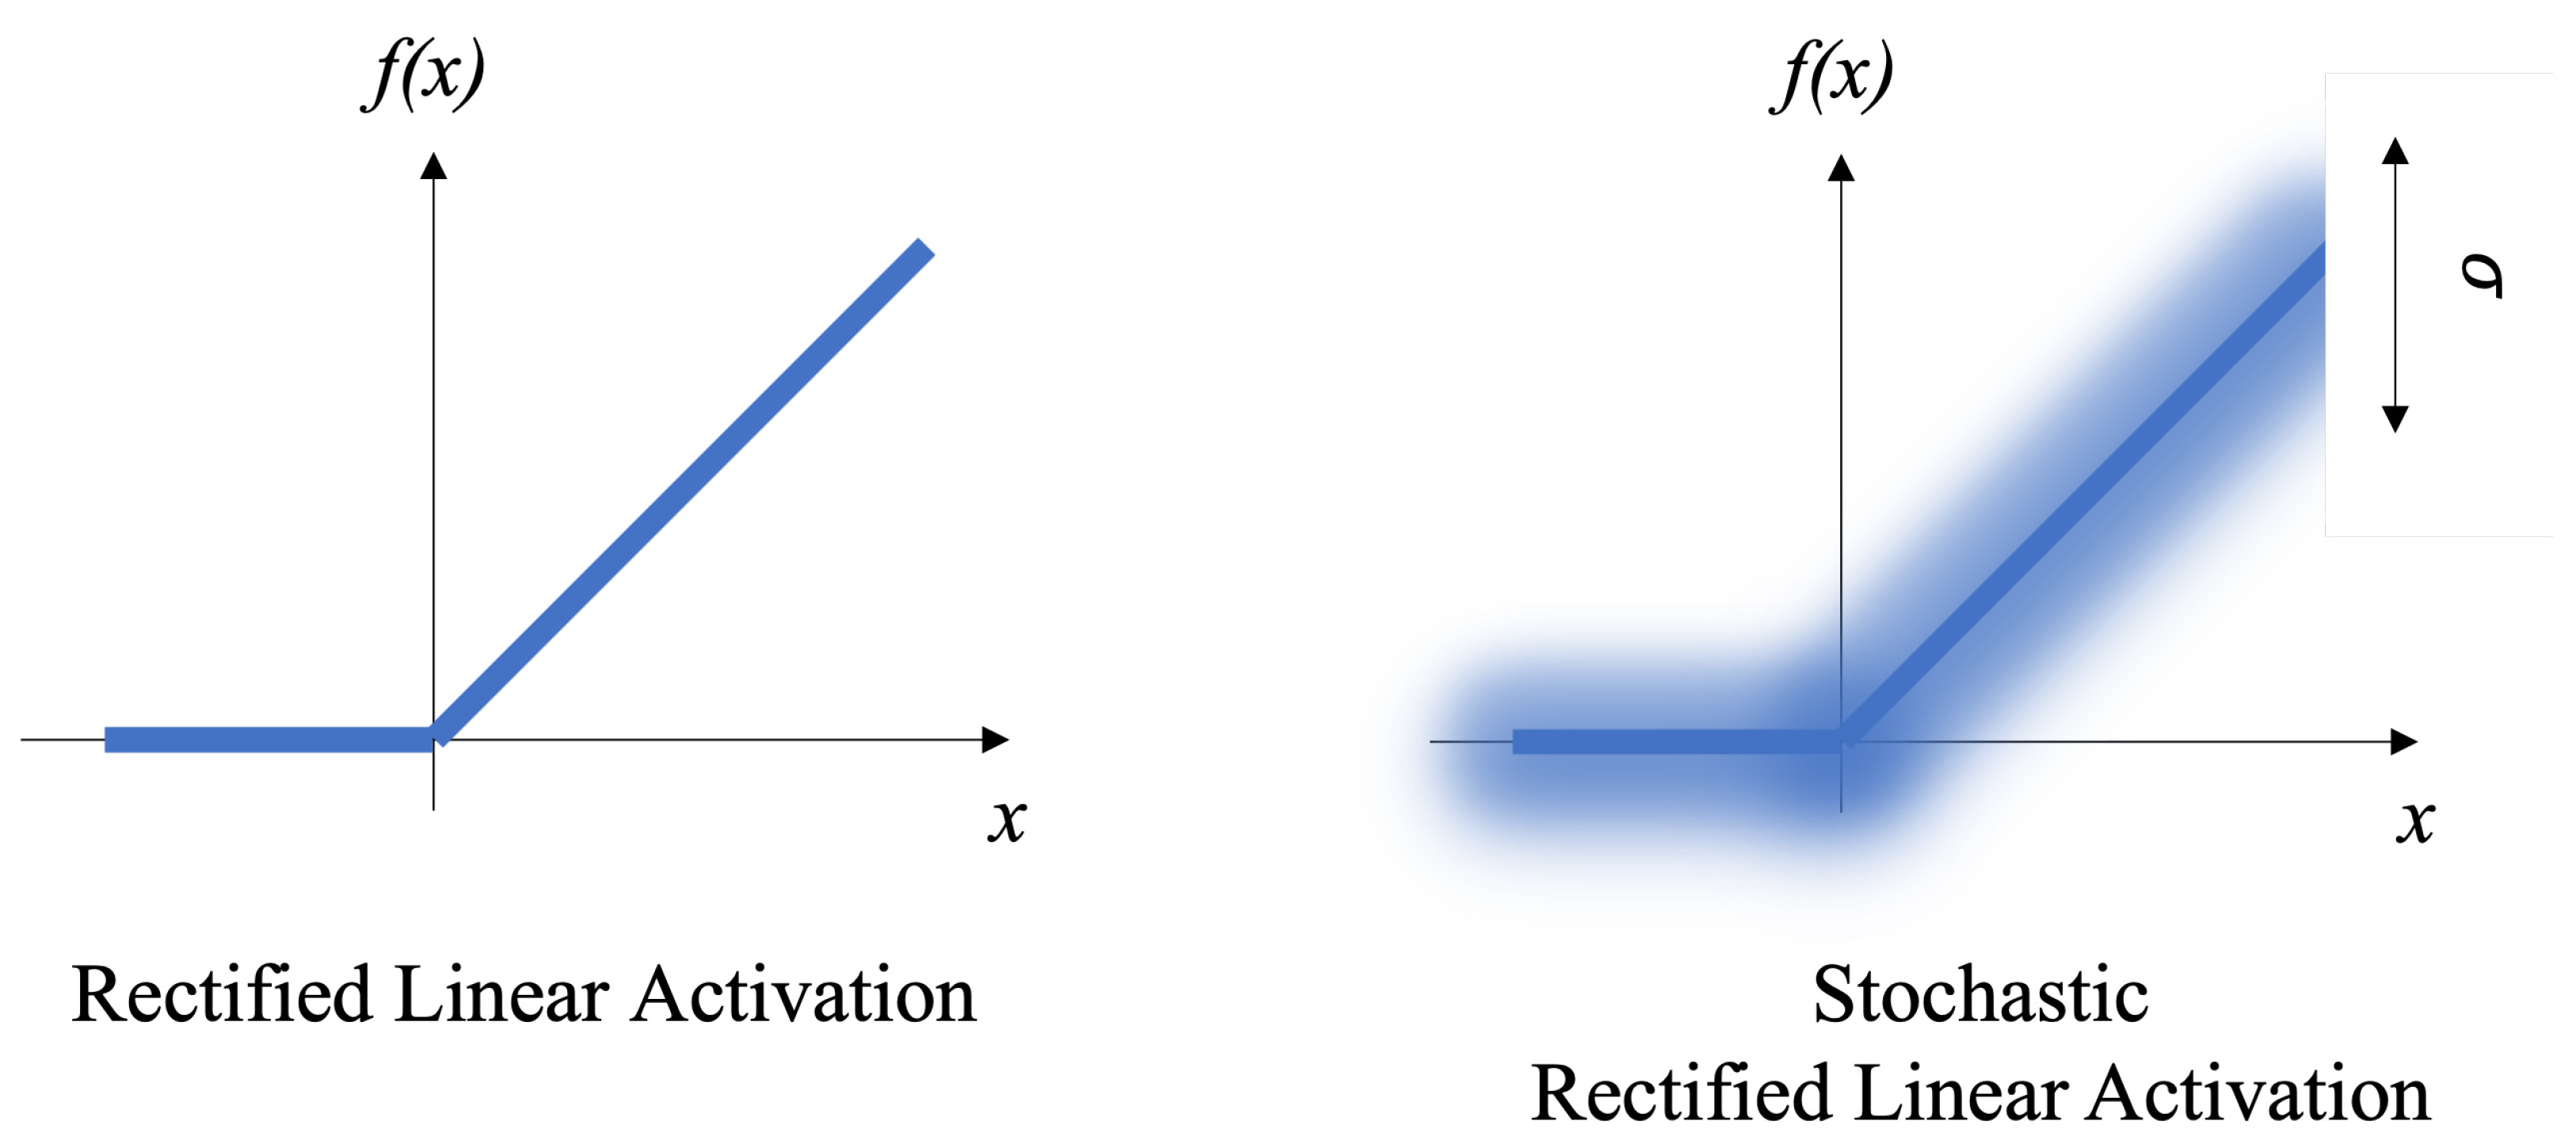
2.3.2. U-Net with Stochastic Activations
2.4. Statistical Metrics
3. Experiments
3.1. Dataset
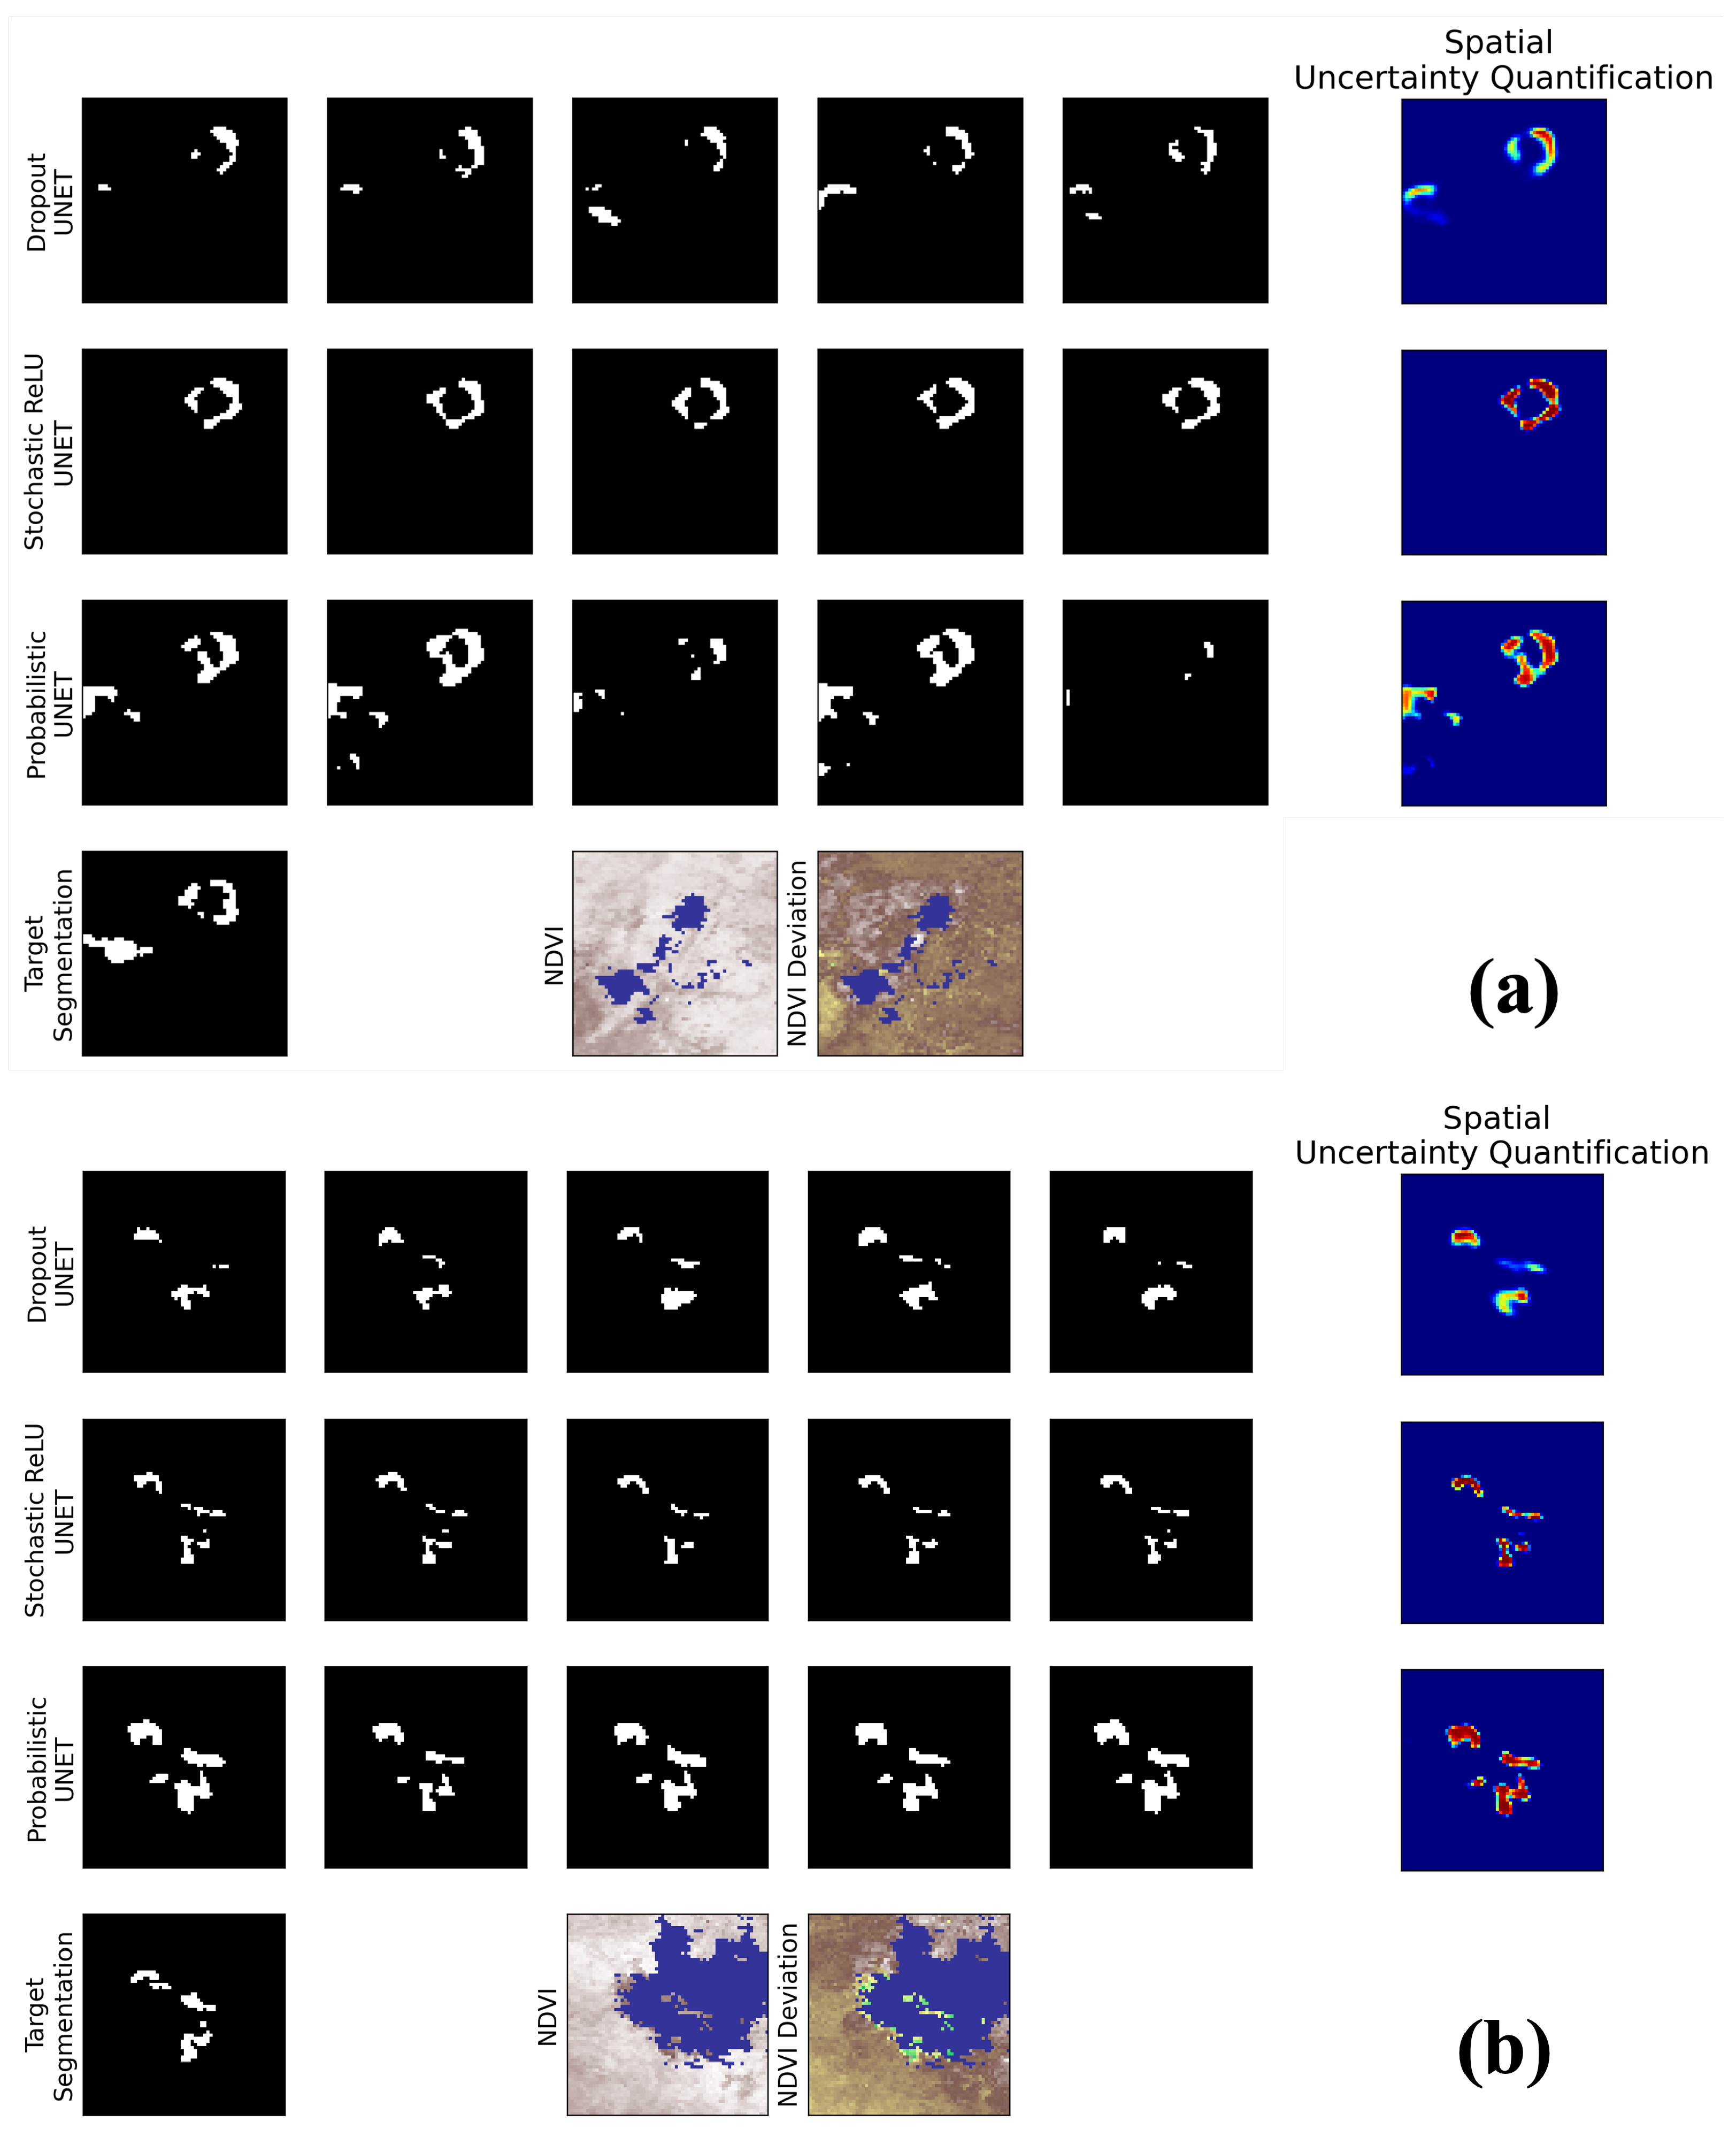
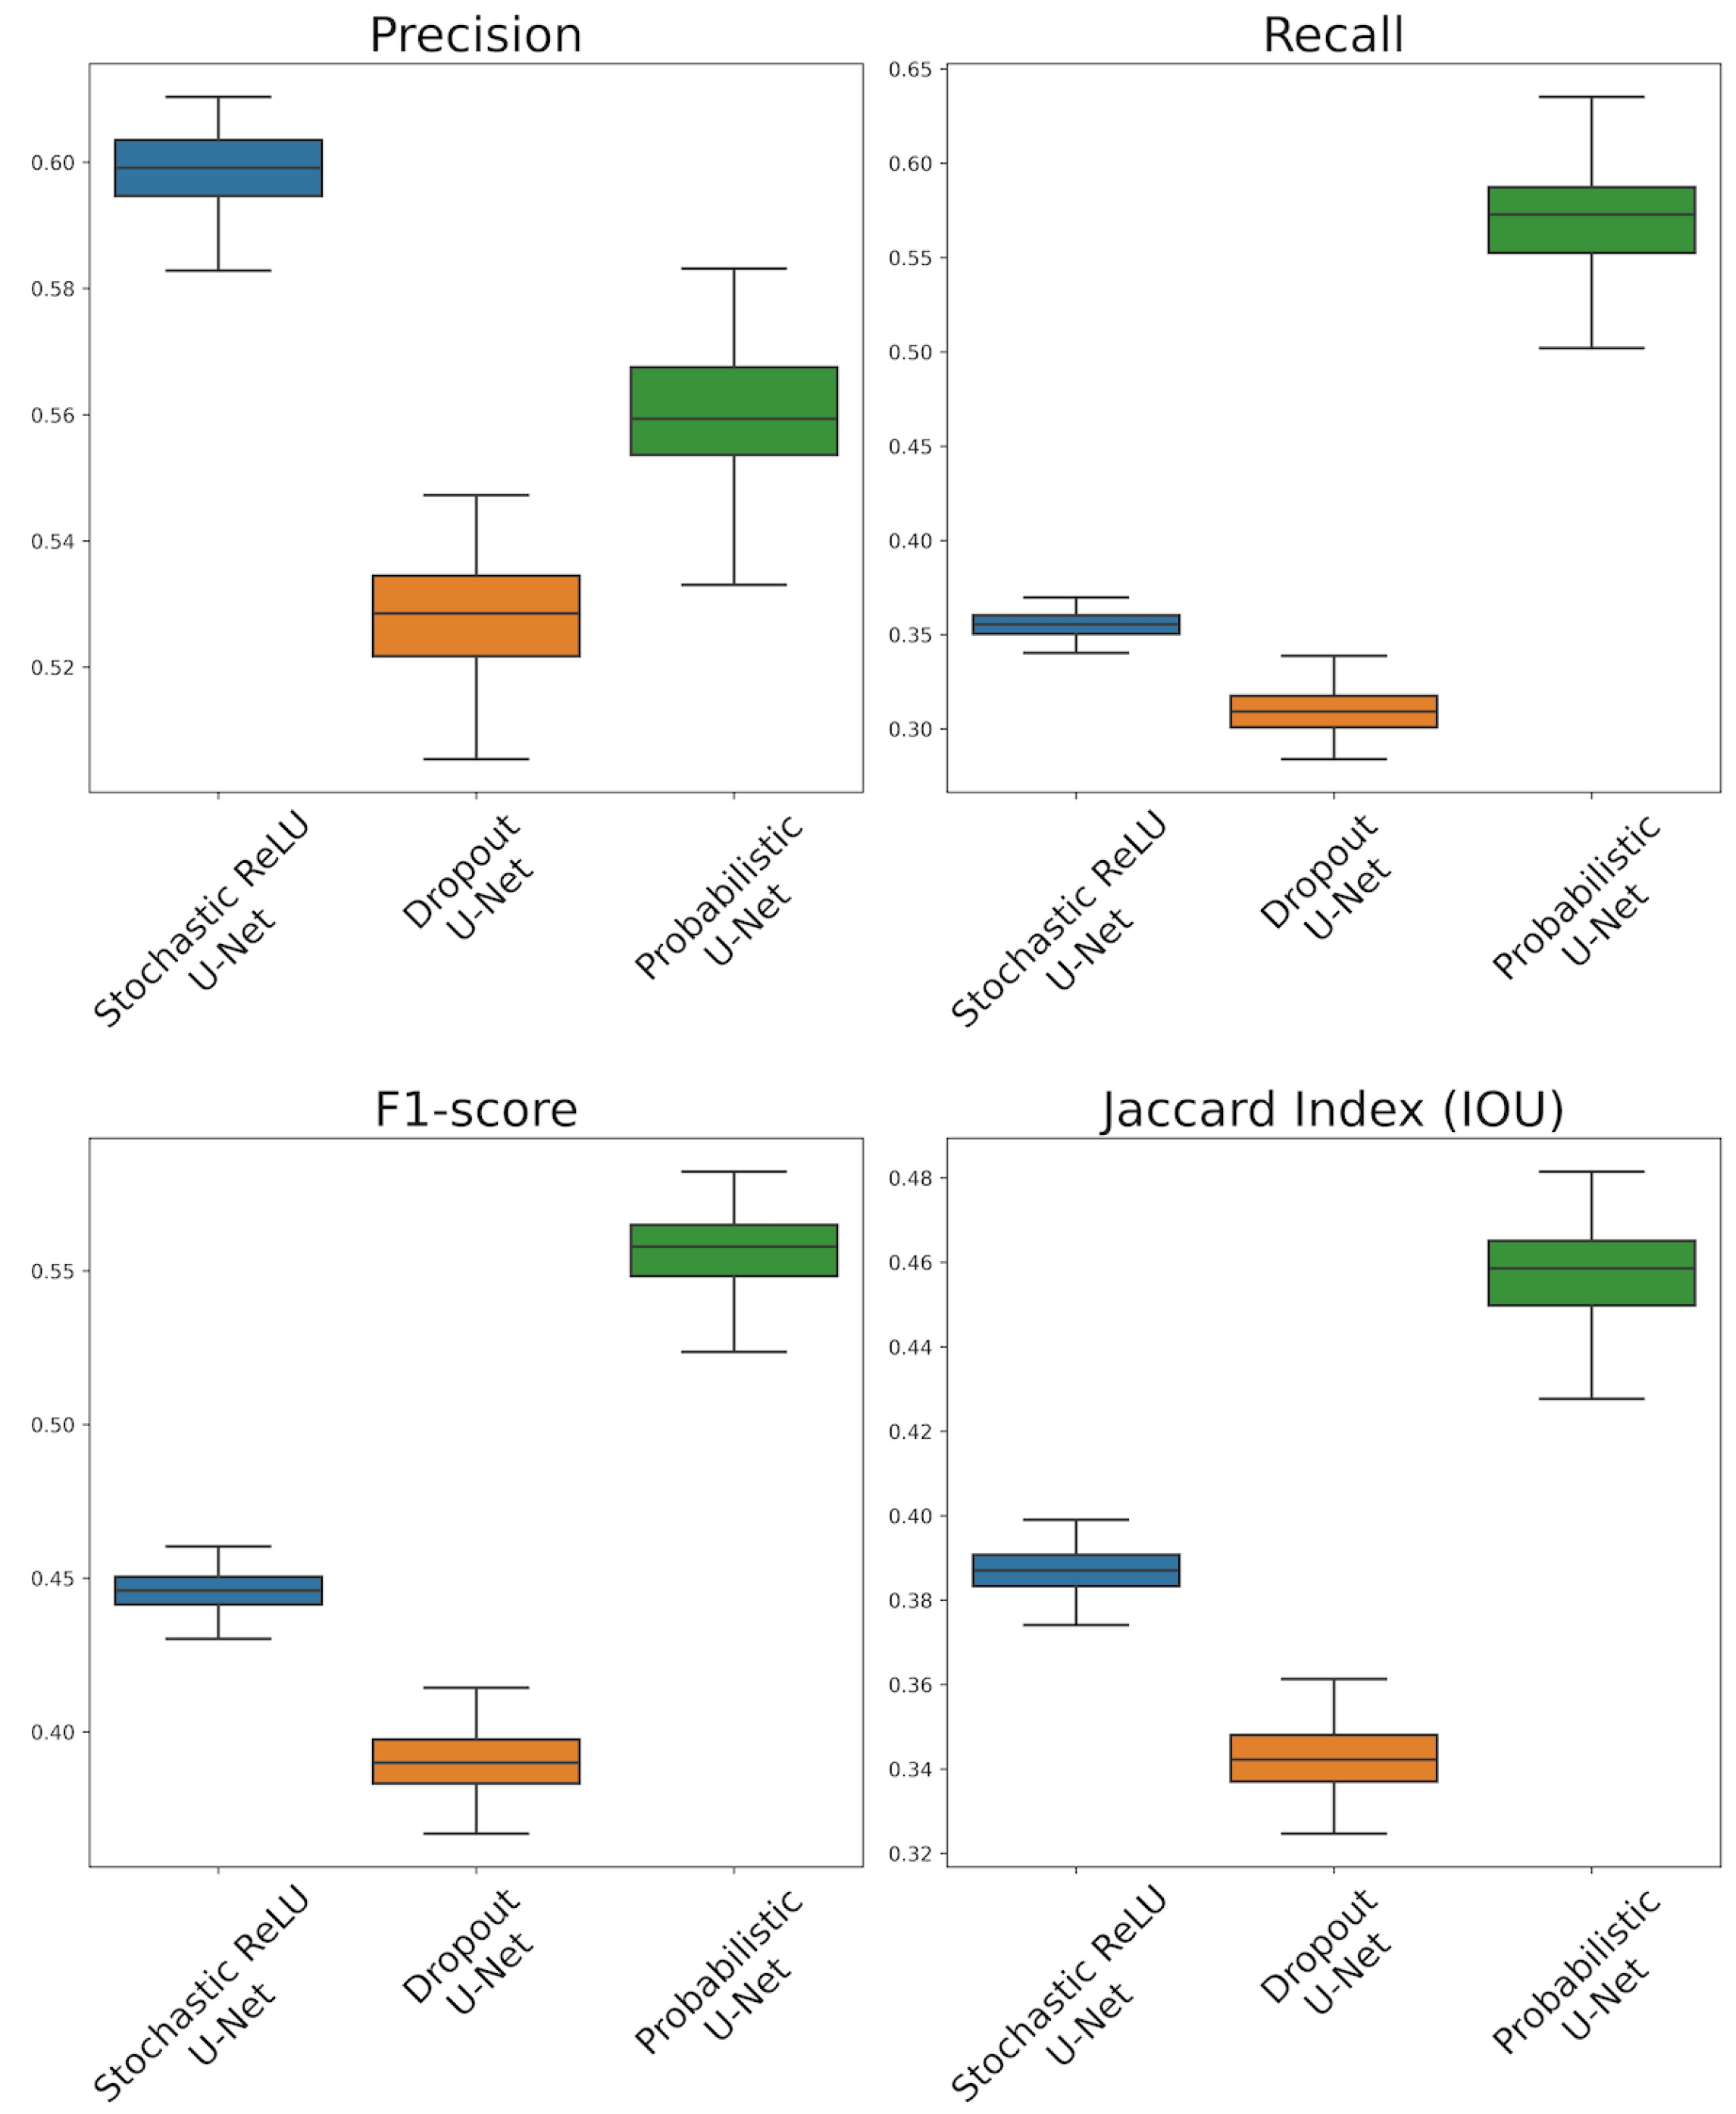
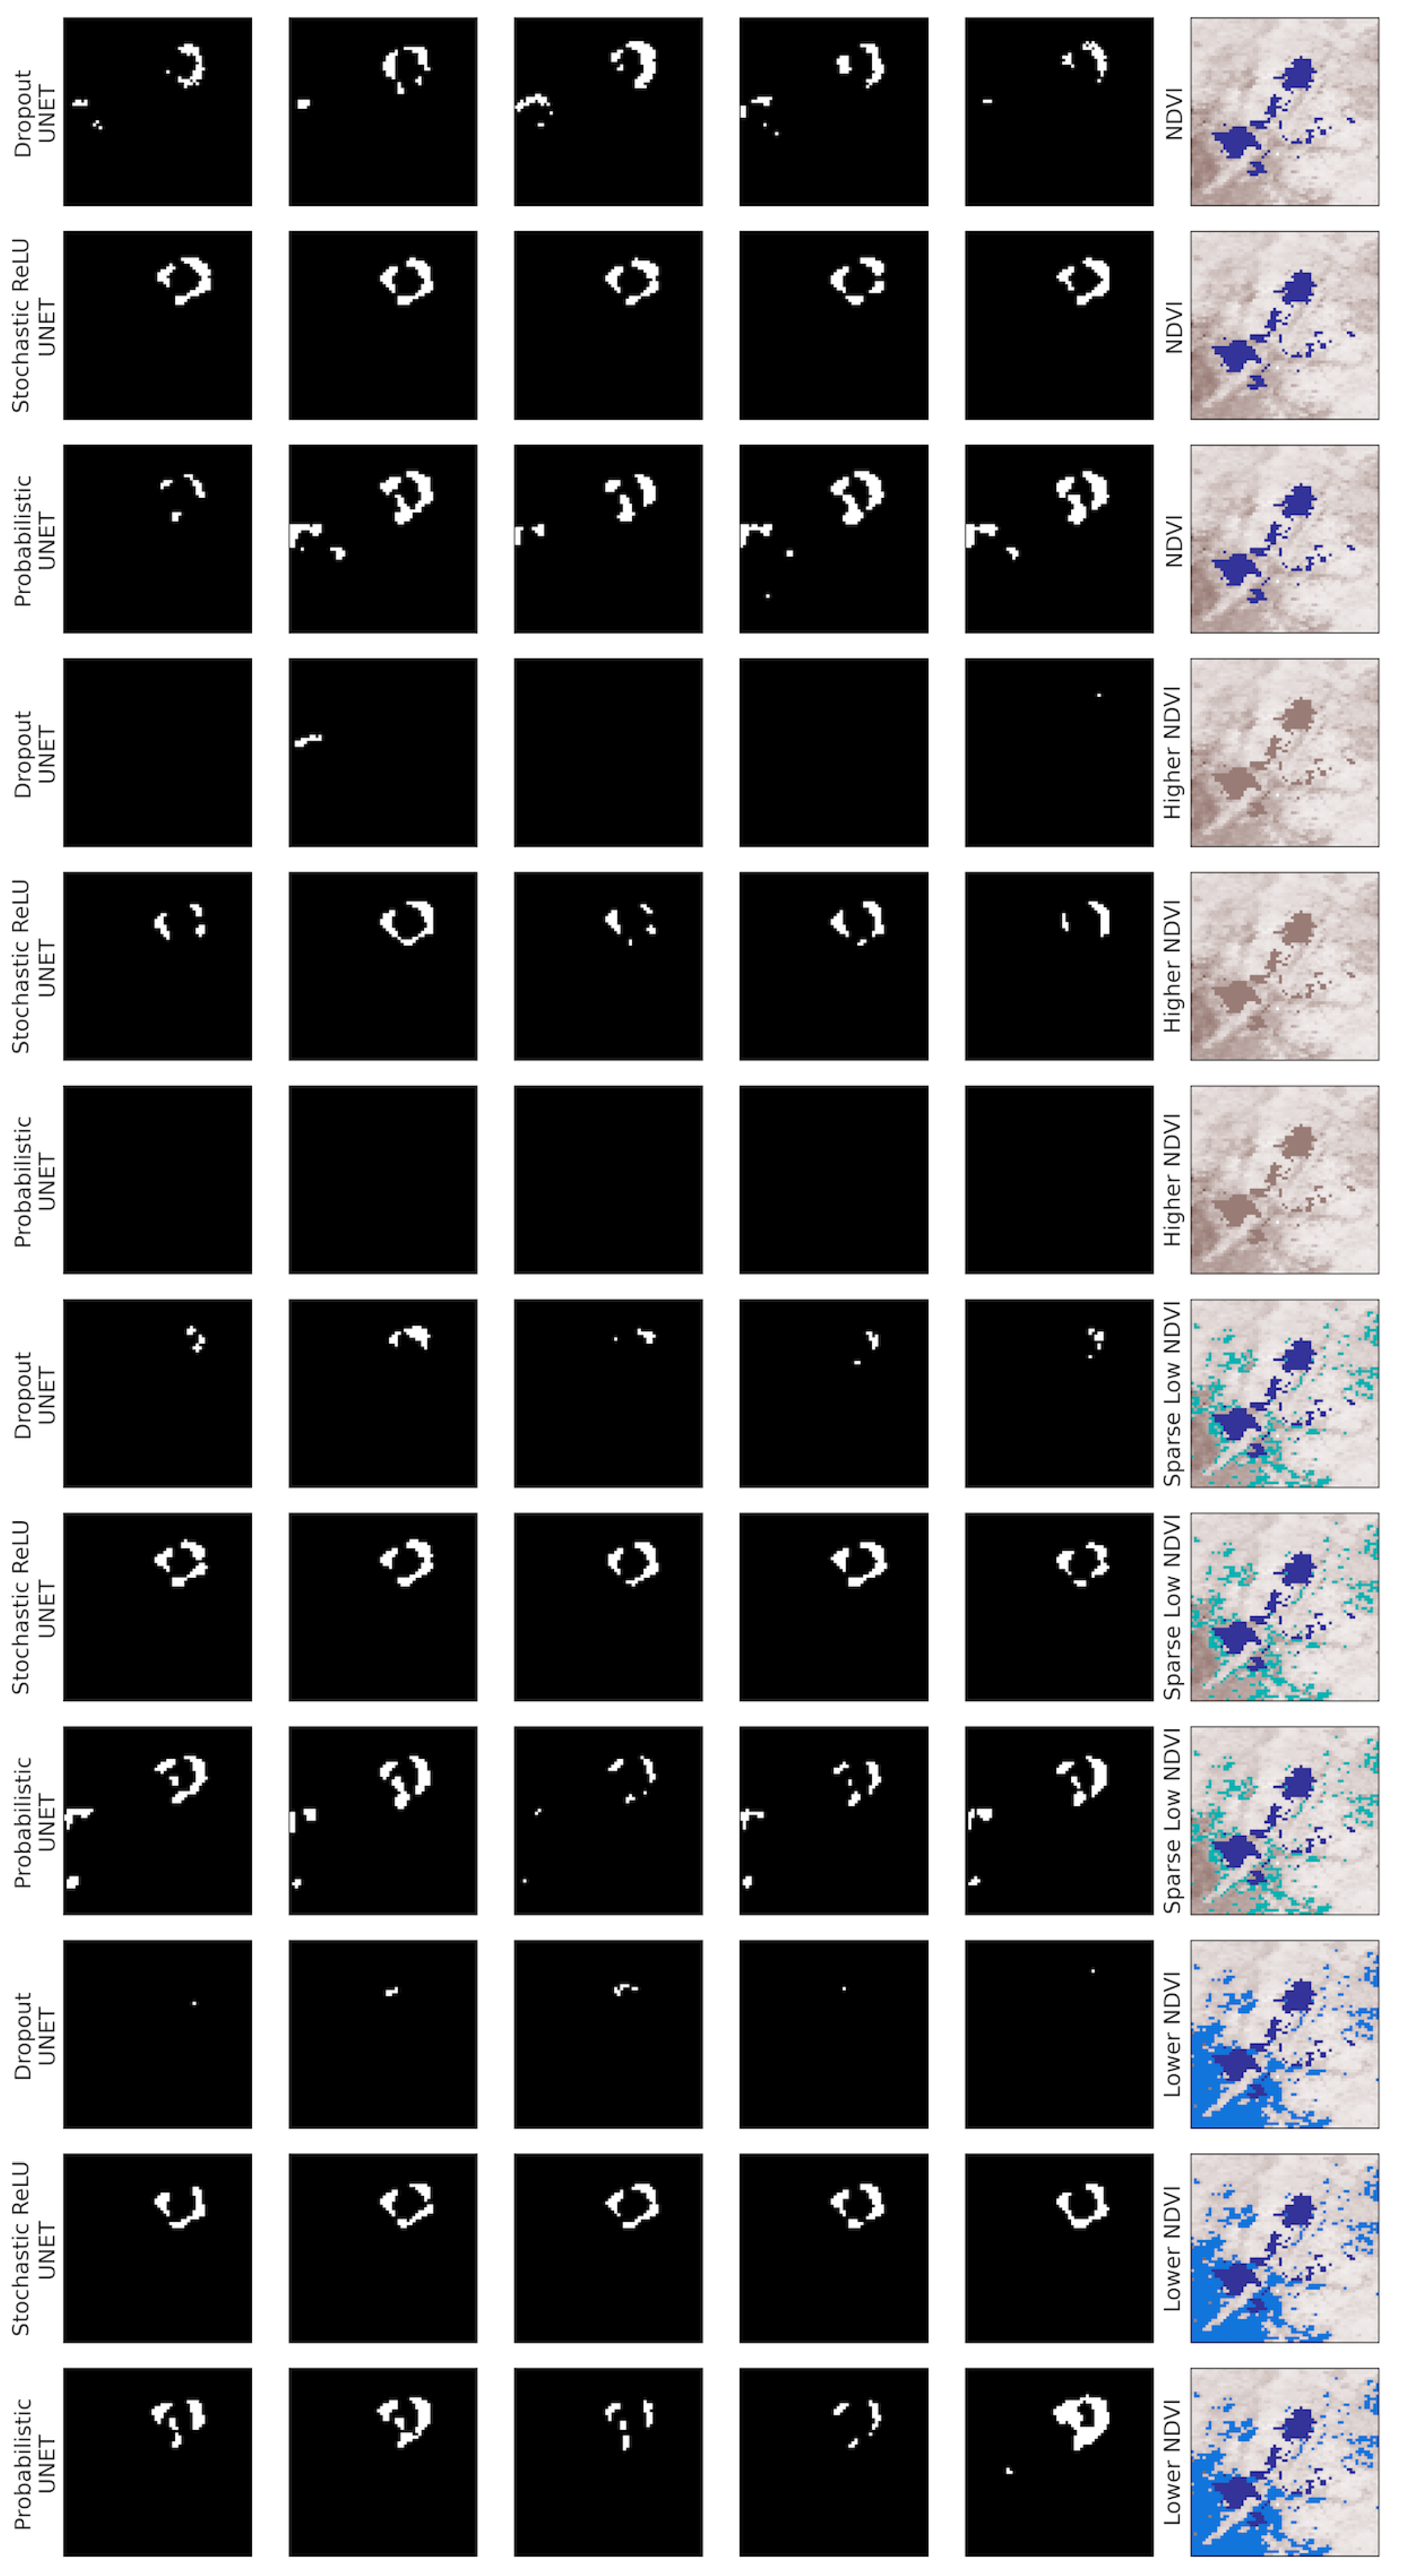
3.2. Results
3.3. Discussion
4. Conclusions
Author Contributions
Funding
Conflicts of Interest
References
- Agee, J.K.; Finney, M.; Gouvenain, R.D. Forest fire history of desolation peak, Washington. Can. J. For. Res. 1990, 20, 350–356. [Google Scholar] [CrossRef]
- Alizadeh, M.R.; Abatzoglou, J.T.; Luce, C.H.; Adamowski, J.F.; Farid, A.; Sadegh, M. Warming enabled upslope advance in western US forest fires. Proc. Natl. Acad. Sci. USA 2021, 118, e2009717118. [Google Scholar] [CrossRef]
- Barros, A.M.; Ager, A.A.; Day, M.A.; Krawchuk, M.A.; Spies, T.A. Wildfires managed for restoration enhance ecological resilience. Ecosphere 2018, 9, e02161. [Google Scholar] [CrossRef]
- Calkin, D.E.; Thompson, M.P.; Finney, M.A. Negative consequences of positive feedbacks in US wildfire management. For. Ecosyst. 2015, 2, 1–10. [Google Scholar] [CrossRef]
- Chas-Amil, M.L.; Prestemon, J.P.; McClean, C.J.; Touza, J. Human-ignited wildfire patterns and responses to policy shifts. Appl. Geogr. 2015, 56, 164–176. [Google Scholar] [CrossRef]
- Dennison, P.E.; Brewer, S.C.; Arnold, J.D.; Moritz, M.A. Large wildfire trends in the western United States, 1984–2011. Geophys. Res. Lett. 2014, 41, 2928–2933. [Google Scholar] [CrossRef]
- Hoover, K.; Hanson, L.A. Wildfire Statistics; Technical Report; Congressional Research Service: Washington, DC, USA, 2021. [Google Scholar]
- Giglio, L.; Boschetti, L.; Roy, D.P.; Humber, M.L.; Justice, C.O. The Collection 6 MODIS burned area mapping algorithm and product. Remote Sens. Environ. 2018, 217, 72–85. [Google Scholar] [CrossRef]
- Jain, P.; Coogan, S.C.; Subramanian, S.G.; Crowley, M.; Taylor, S.; Flannigan, M.D. A review of machine learning applications in wildfire science and management. Environ. Rev. 2020, 28, 478–505. [Google Scholar] [CrossRef]
- Carmo, M.; Moreira, F.; Casimiro, P.; Vaz, P. Land use and topography influences on wildfire occurrence in northern Portugal. Landsc. Urban Plan. 2011, 100, 169–176. [Google Scholar] [CrossRef]
- Narayanaraj, G.; Wimberly, M.C. Influences of forest roads on the spatial patterns of human-and lightning-caused wildfire ignitions. Appl. Geogr. 2012, 32, 878–888. [Google Scholar] [CrossRef]
- Ghali, R.; Akhloufi, M.A.; Jmal, M.; Souidene Mseddi, W.; Attia, R. Wildfire segmentation using deep vision transformers. Remote Sens. 2021, 13, 3527. [Google Scholar] [CrossRef]
- Green, M.E. Some Results on a Set of Data Driven Stochastic Wildfire Models; The University of Vermont and State Agricultural College: Burlington, VT, USA, 2020. [Google Scholar]
- Khryashchev, V.; Larionov, R. Wildfire segmentation on satellite images using deep learning. In Proceedings of the 2020 Moscow Workshop on Electronic and Networking Technologies (MWENT), Moscow, Russia, 11–13 March 2020; pp. 1–5. [Google Scholar]
- Rashkovetsky, D.; Mauracher, F.; Langer, M.; Schmitt, M. Wildfire detection from multisensor satellite imagery using deep semantic segmentation. IEEE J. Sel. Top. Appl. Earth Obs. Remote Sens. 2021, 14, 7001–7016. [Google Scholar] [CrossRef]
- Poole, D.; Raftery, A.E. Inference for deterministic simulation models: The Bayesian melding approach. J. Am. Stat. Assoc. 2000, 95, 1244–1255. [Google Scholar] [CrossRef]
- Cencerrado, A.; Cortés, A.; Margalef, T. Response time assessment in forest fire spread simulation: An integrated methodology for efficient exploitation of available prediction time. Environ. Model. Softw. 2014, 54, 153–164. [Google Scholar] [CrossRef]
- Toan, N.T.; Cong, P.T.; Hung, N.Q.V.; Jo, J. A deep learning approach for early wildfire detection from hyperspectral satellite images. In Proceedings of the 2019 7th International Conference on Robot Intelligence Technology and Applications (RiTA), Daejeon, Republic of Korea, 1–3 November 2019; pp. 38–45. [Google Scholar]
- Sayad, Y.O.; Mousannif, H.; Al Moatassime, H. Predictive modeling of wildfires: A new dataset and machine learning approach. Fire Saf. J. 2019, 104, 130–146. [Google Scholar] [CrossRef]
- Couce, E.; Knorr, W. Statistical parameter estimation for a cellular automata wildfire model based on satellite observations. WIT Trans. Ecol. Environ. 2010, 137, 47–55. [Google Scholar]
- Quill, R.; Sharples, J.J.; Wagenbrenner, N.S.; Sidhu, L.A.; Forthofer, J.M. Modeling wind direction distributions using a diagnostic model in the context of probabilistic fire spread prediction. Front. Mech. Eng. 2019, 5, 5. [Google Scholar] [CrossRef]
- Palmer, T.; Shutts, G.; Hagedorn, R.; Doblas-Reyes, F.; Jung, T.; Leutbecher, M. Representing model uncertainty in weather and climate prediction. Annu. Rev. Earth Planet. Sci. 2005, 33, 163–193. [Google Scholar] [CrossRef]
- Artés, T.; Cencerrado, A.; Cortés, A.; Margalef, T. Time aware genetic algorithm for forest fire propagation prediction: Exploiting multi-core platforms. Concurr. Comput. Pract. Exp. 2017, 29, e3837. [Google Scholar] [CrossRef]
- Denham, M.; Laneri, K. Using efficient parallelization in graphic processing units to parameterize stochastic fire propagation models. J. Comput. Sci. 2018, 25, 76–88. [Google Scholar] [CrossRef]
- Ramirez, J.; Monedero, S.; Silva, C.A.; Cardil, A. Stochastic decision trigger modelling to assess the probability of wildland fire impact. Sci. Total Environ. 2019, 694, 133505. [Google Scholar] [CrossRef]
- Valero, M.M.; Jofre, L.; Torres, R. Multifidelity prediction in wildfire spread simulation: Modeling, uncertainty quantification and sensitivity analysis. Environ. Model. Softw. 2021, 141, 105050. [Google Scholar] [CrossRef]
- Li, F.; Zhang, X.; Kondragunta, S.; Csiszar, I. Comparison of fire radiative power estimates from VIIRS and MODIS observations. J. Geophys. Res. Atmos. 2018, 123, 4545–4563. [Google Scholar] [CrossRef]
- Allison, R.S.; Johnston, J.M.; Craig, G.; Jennings, S. Airborne optical and thermal remote sensing for wildfire detection and monitoring. Sensors 2016, 16, 1310. [Google Scholar] [CrossRef]
- Schultz, C.J.; Nauslar, N.J.; Wachter, J.B.; Hain, C.R.; Bell, J.R. Spatial, temporal and electrical characteristics of lightning in reported lightning-initiated wildfire events. Fire 2019, 2, 18. [Google Scholar] [CrossRef]
- Bengio, Y.; Courville, A.; Vincent, P. Representation learning: A review and new perspectives. IEEE Trans. Pattern Anal. Mach. Intell. 2013, 35, 1798–1828. [Google Scholar] [CrossRef]
- Akbari Asanjan, A.; Das, K.; Li, A.; Chirayath, V.; Torres-Perez, J.; Sorooshian, S. Learning instrument invariant characteristics for generating high-resolution global coral reef maps. In Proceedings of the 26th ACM SIGKDD International Conference on Knowledge Discovery & Data Mining, Virtual Event, 6–10 July 2020; pp. 2617–2624. [Google Scholar]
- Ronneberger, O.; Fischer, P.; Brox, T. U-net: Convolutional networks for biomedical image segmentation. In Medical Image Computing and Computer-Assisted Intervention—MICCAI 2015: 18th International Conference, Munich, Germany, 5–9 October 2015; Springer International Publishing: Berlin/Heidelberg, Germany, 2015; pp. 234–241. [Google Scholar]
- Shu, R.; Brofos, J.; Zhang, F.; Bui, H.H.; Ghavamzadeh, M.; Kochenderfer, M. Stochastic video prediction with conditional density estimation. In Proceedings of the ECCV Workshop on Action and Anticipation for Visual Learning, Amsterdam, The Netherlands, 8–10 October 2016; Volume 2, p. 2. [Google Scholar]
- Kohl, S.; Romera-Parades, B.; Meyer, C.; De Fauw, J.; Ledsam, J.; Maier-Hein, K.; Eslami, S.; Rezende, D.; Ronneberger, O. A Probabilistic U-Net for Segmentation of Ambiguous Images. NeurIPS 2018, 31, 6965–6975. [Google Scholar]
- Kingma, D.; Welling, M. Auto-encoding variational bayes. arXiv 2013, arXiv:1312.6114. [Google Scholar]
- Kingma, D.; Rezende, D.; Mohamed, S.; Welling, M. Semi-supervised learning with deep generative models. Adv. Neural Inf. Process. Syst. 2014, 27. [Google Scholar]
- Sohn, K.; Lee, H.; Yan, X. Learning structured output representation using deep conditional generative models. Adv. Neural Inf. Process. Syst. 2015, 28, 3483–3491. [Google Scholar]
- Frazier-Logue, N.; Hanson, S.J. Dropout is a special case of the stochastic delta rule: Faster and more accurate deep learning. arXiv 2018, arXiv:1808.03578. [Google Scholar]
- Hanson, S.J. A stochastic version of the delta rule. Phys. D Nonlinear Phenom. 1990, 42, 265–272. [Google Scholar] [CrossRef]
- Kendall, A.; Badrinarayanan, V.; Cipolla, R. Bayesian segnet: Model uncertainty in deep convolutional encoder-decoder architectures for scene understanding. arXiv 2015, arXiv:1511.02680. [Google Scholar]
- Gulcehre, C.; Moczulski, M.; Denil, M.; Bengio, Y. Noisy activation functions. In Proceedings of the International Conference on Machine Learning, New York, NY, USA, 20–22 June 2016; pp. 3059–3068. [Google Scholar]
- Shridhar, K.; Lee, J.; Hayashi, H.; Mehta, P.; Iwana, B.K.; Kang, S.; Uchida, S.; Ahmed, S.; Dengel, A. Probact: A probabilistic activation function for deep neural networks. arXiv 2019, arXiv:1905.10761. [Google Scholar]
- Schroeder, W.; Oliva, P.; Giglio, L.; Csiszar, I.A. The New VIIRS 375 m active fire detection data product: Algorithm description and initial assessment. Remote Sens. Environ. 2014, 143, 85–96. [Google Scholar] [CrossRef]
- Liu, Y.; Stanturf, J.; Goodrick, S. Wildfire potential evaluation during a drought event with a regional climate model and NDVI. Ecol. Inform. 2010, 5, 418–428. [Google Scholar] [CrossRef]
- Dasgupta, S.; Qu, J.J.; Hao, X.; Bhoi, S. Evaluating remotely sensed live fuel moisture estimations for fire behavior predictions in Georgia, USA. Remote Sens. Environ. 2007, 108, 138–150. [Google Scholar] [CrossRef]
- Huete, A.R. A soil-adjusted vegetation index (SAVI). Remote Sens. Environ. 1988, 25, 295–309. [Google Scholar] [CrossRef]
- Matsushita, B.; Yang, W.; Chen, J.; Onda, Y.; Qiu, G. Sensitivity of the enhanced vegetation index (EVI) and normalized difference vegetation index (NDVI) to topographic effects: A case study in high-density cypress forest. Sensors 2007, 7, 2636–2651. [Google Scholar] [CrossRef]
- Pereira-Pires, J.E.; Aubard, V.; Ribeiro, R.A.; Fonseca, J.M.; Silva, J.M.; Mora, A. Fuel Break Vegetation Monitoring with Sentinel-2 NDVI Robust to Phenology and Environmental Conditions. In Proceedings of the 2021 IEEE International Geoscience and Remote Sensing Symposium IGARSS, Brussels, Belgium, 11–16 July 2021; pp. 6264–6267. [Google Scholar]
- Mazeh, F.; El Sahili, J.; Zaraket, H. Low-Cost NDVI Platform for Land Operation: Passive and Active. IEEE Sens. Lett. 2021, 5, 1–4. [Google Scholar] [CrossRef]
- Quan, X.; Xie, Q.; He, B.; Luo, K.; Liu, X. Corrigendum to: Integrating remotely sensed fuel variables into wildfire danger assessment for China. Int. J. Wildland Fire 2021, 30, 822. [Google Scholar] [CrossRef]
- Holsinger, L.; Parks, S.A.; Miller, C. Weather, fuels, and topography impede wildland fire spread in western US landscapes. For. Ecol. Manag. 2016, 380, 59–69. [Google Scholar] [CrossRef]


| Input | Bandwidth |
|---|---|
| Land/Cloud/Aerosols Boundary | 620–670 |
| 841–876 | |
| Land/Cloud/Aerosols Properties | 459–79 |
| 545–565 | |
| 1230–1250 | |
| 1628–1652 | |
| 2105–2155 | |
| NDVI | N/A |
| NDVI Derivation | N/A |
Disclaimer/Publisher’s Note: The statements, opinions and data contained in all publications are solely those of the individual author(s) and contributor(s) and not of MDPI and/or the editor(s). MDPI and/or the editor(s) disclaim responsibility for any injury to people or property resulting from any ideas, methods, instructions or products referred to in the content. |
© 2023 by the authors. Licensee MDPI, Basel, Switzerland. This article is an open access article distributed under the terms and conditions of the Creative Commons Attribution (CC BY) license (https://creativecommons.org/licenses/by/4.0/).
Share and Cite
Akbari Asanjan, A.; Memarzadeh, M.; Lott, P.A.; Rieffel, E.; Grabbe, S. Probabilistic Wildfire Segmentation Using Supervised Deep Generative Model from Satellite Imagery. Remote Sens. 2023, 15, 2718. https://doi.org/10.3390/rs15112718
Akbari Asanjan A, Memarzadeh M, Lott PA, Rieffel E, Grabbe S. Probabilistic Wildfire Segmentation Using Supervised Deep Generative Model from Satellite Imagery. Remote Sensing. 2023; 15(11):2718. https://doi.org/10.3390/rs15112718
Chicago/Turabian StyleAkbari Asanjan, Ata, Milad Memarzadeh, Paul Aaron Lott, Eleanor Rieffel, and Shon Grabbe. 2023. "Probabilistic Wildfire Segmentation Using Supervised Deep Generative Model from Satellite Imagery" Remote Sensing 15, no. 11: 2718. https://doi.org/10.3390/rs15112718
APA StyleAkbari Asanjan, A., Memarzadeh, M., Lott, P. A., Rieffel, E., & Grabbe, S. (2023). Probabilistic Wildfire Segmentation Using Supervised Deep Generative Model from Satellite Imagery. Remote Sensing, 15(11), 2718. https://doi.org/10.3390/rs15112718