


Analysis of Relationship between Grain Yield and NDVI from MODIS in the Fez-Meknes Region, Morocco
 , ,
, ,  ,
,  ,
,
Abstract
1. Introduction
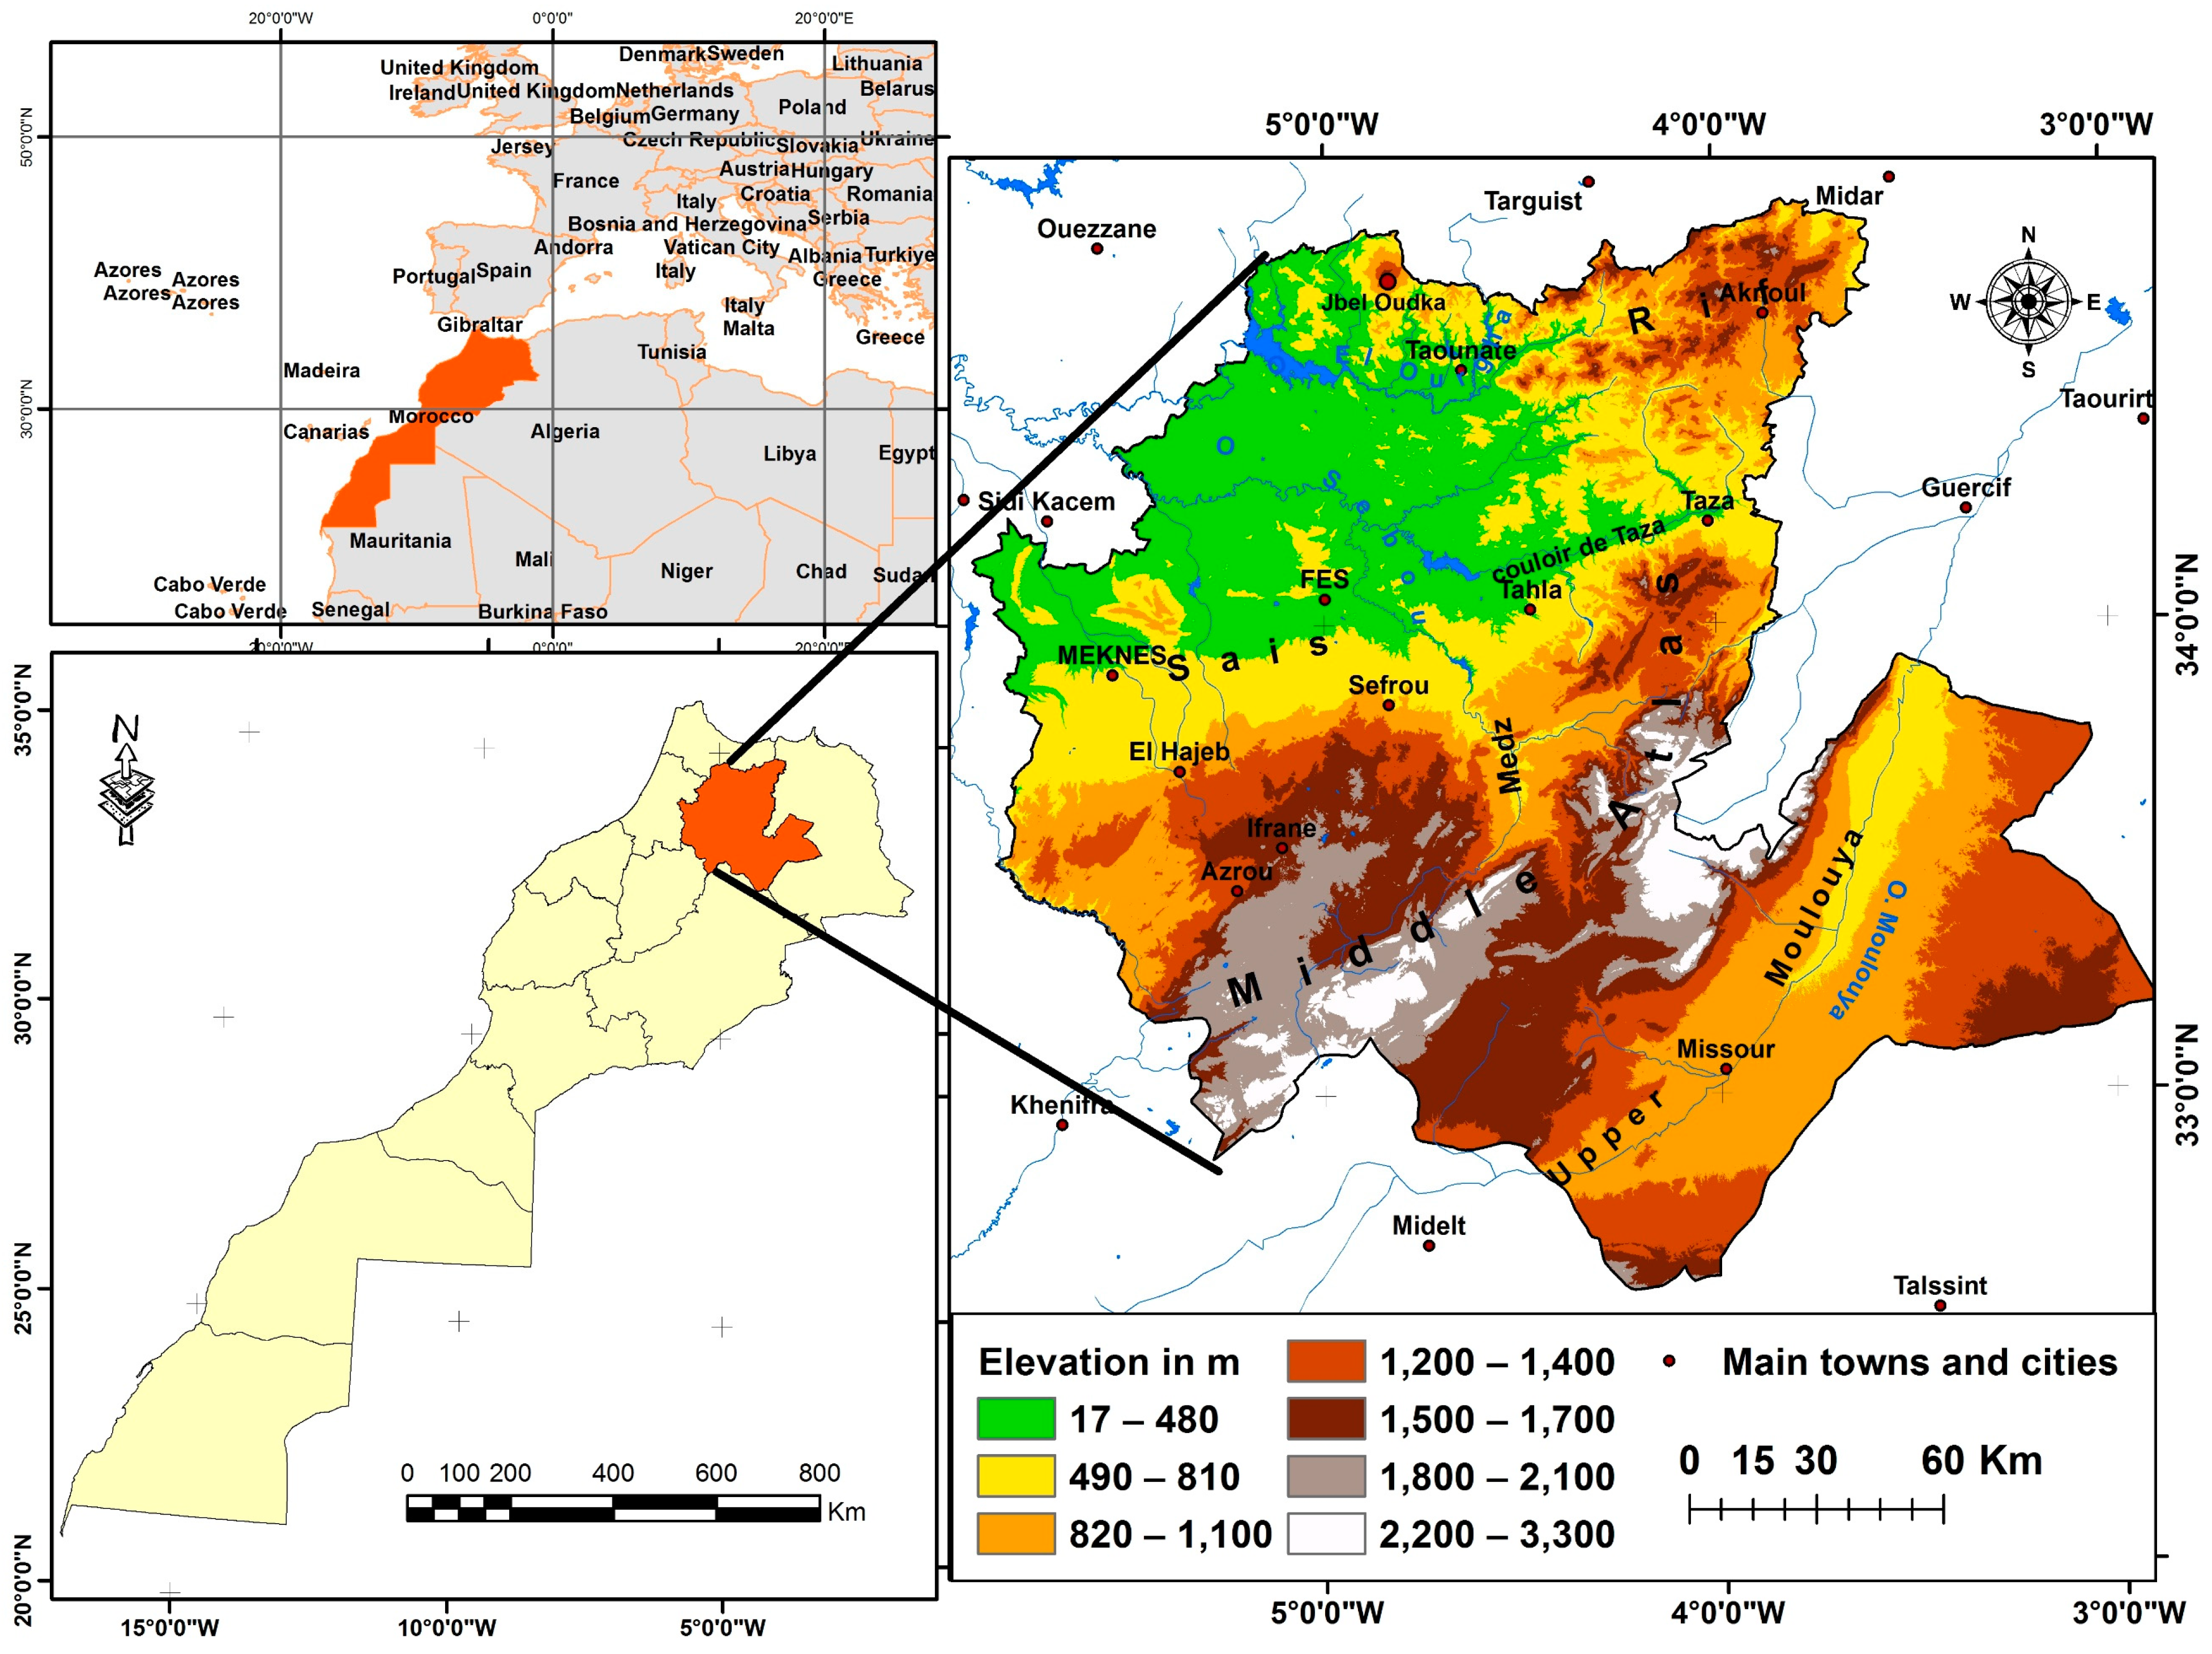
2. Study Area
3. Materials and Methods
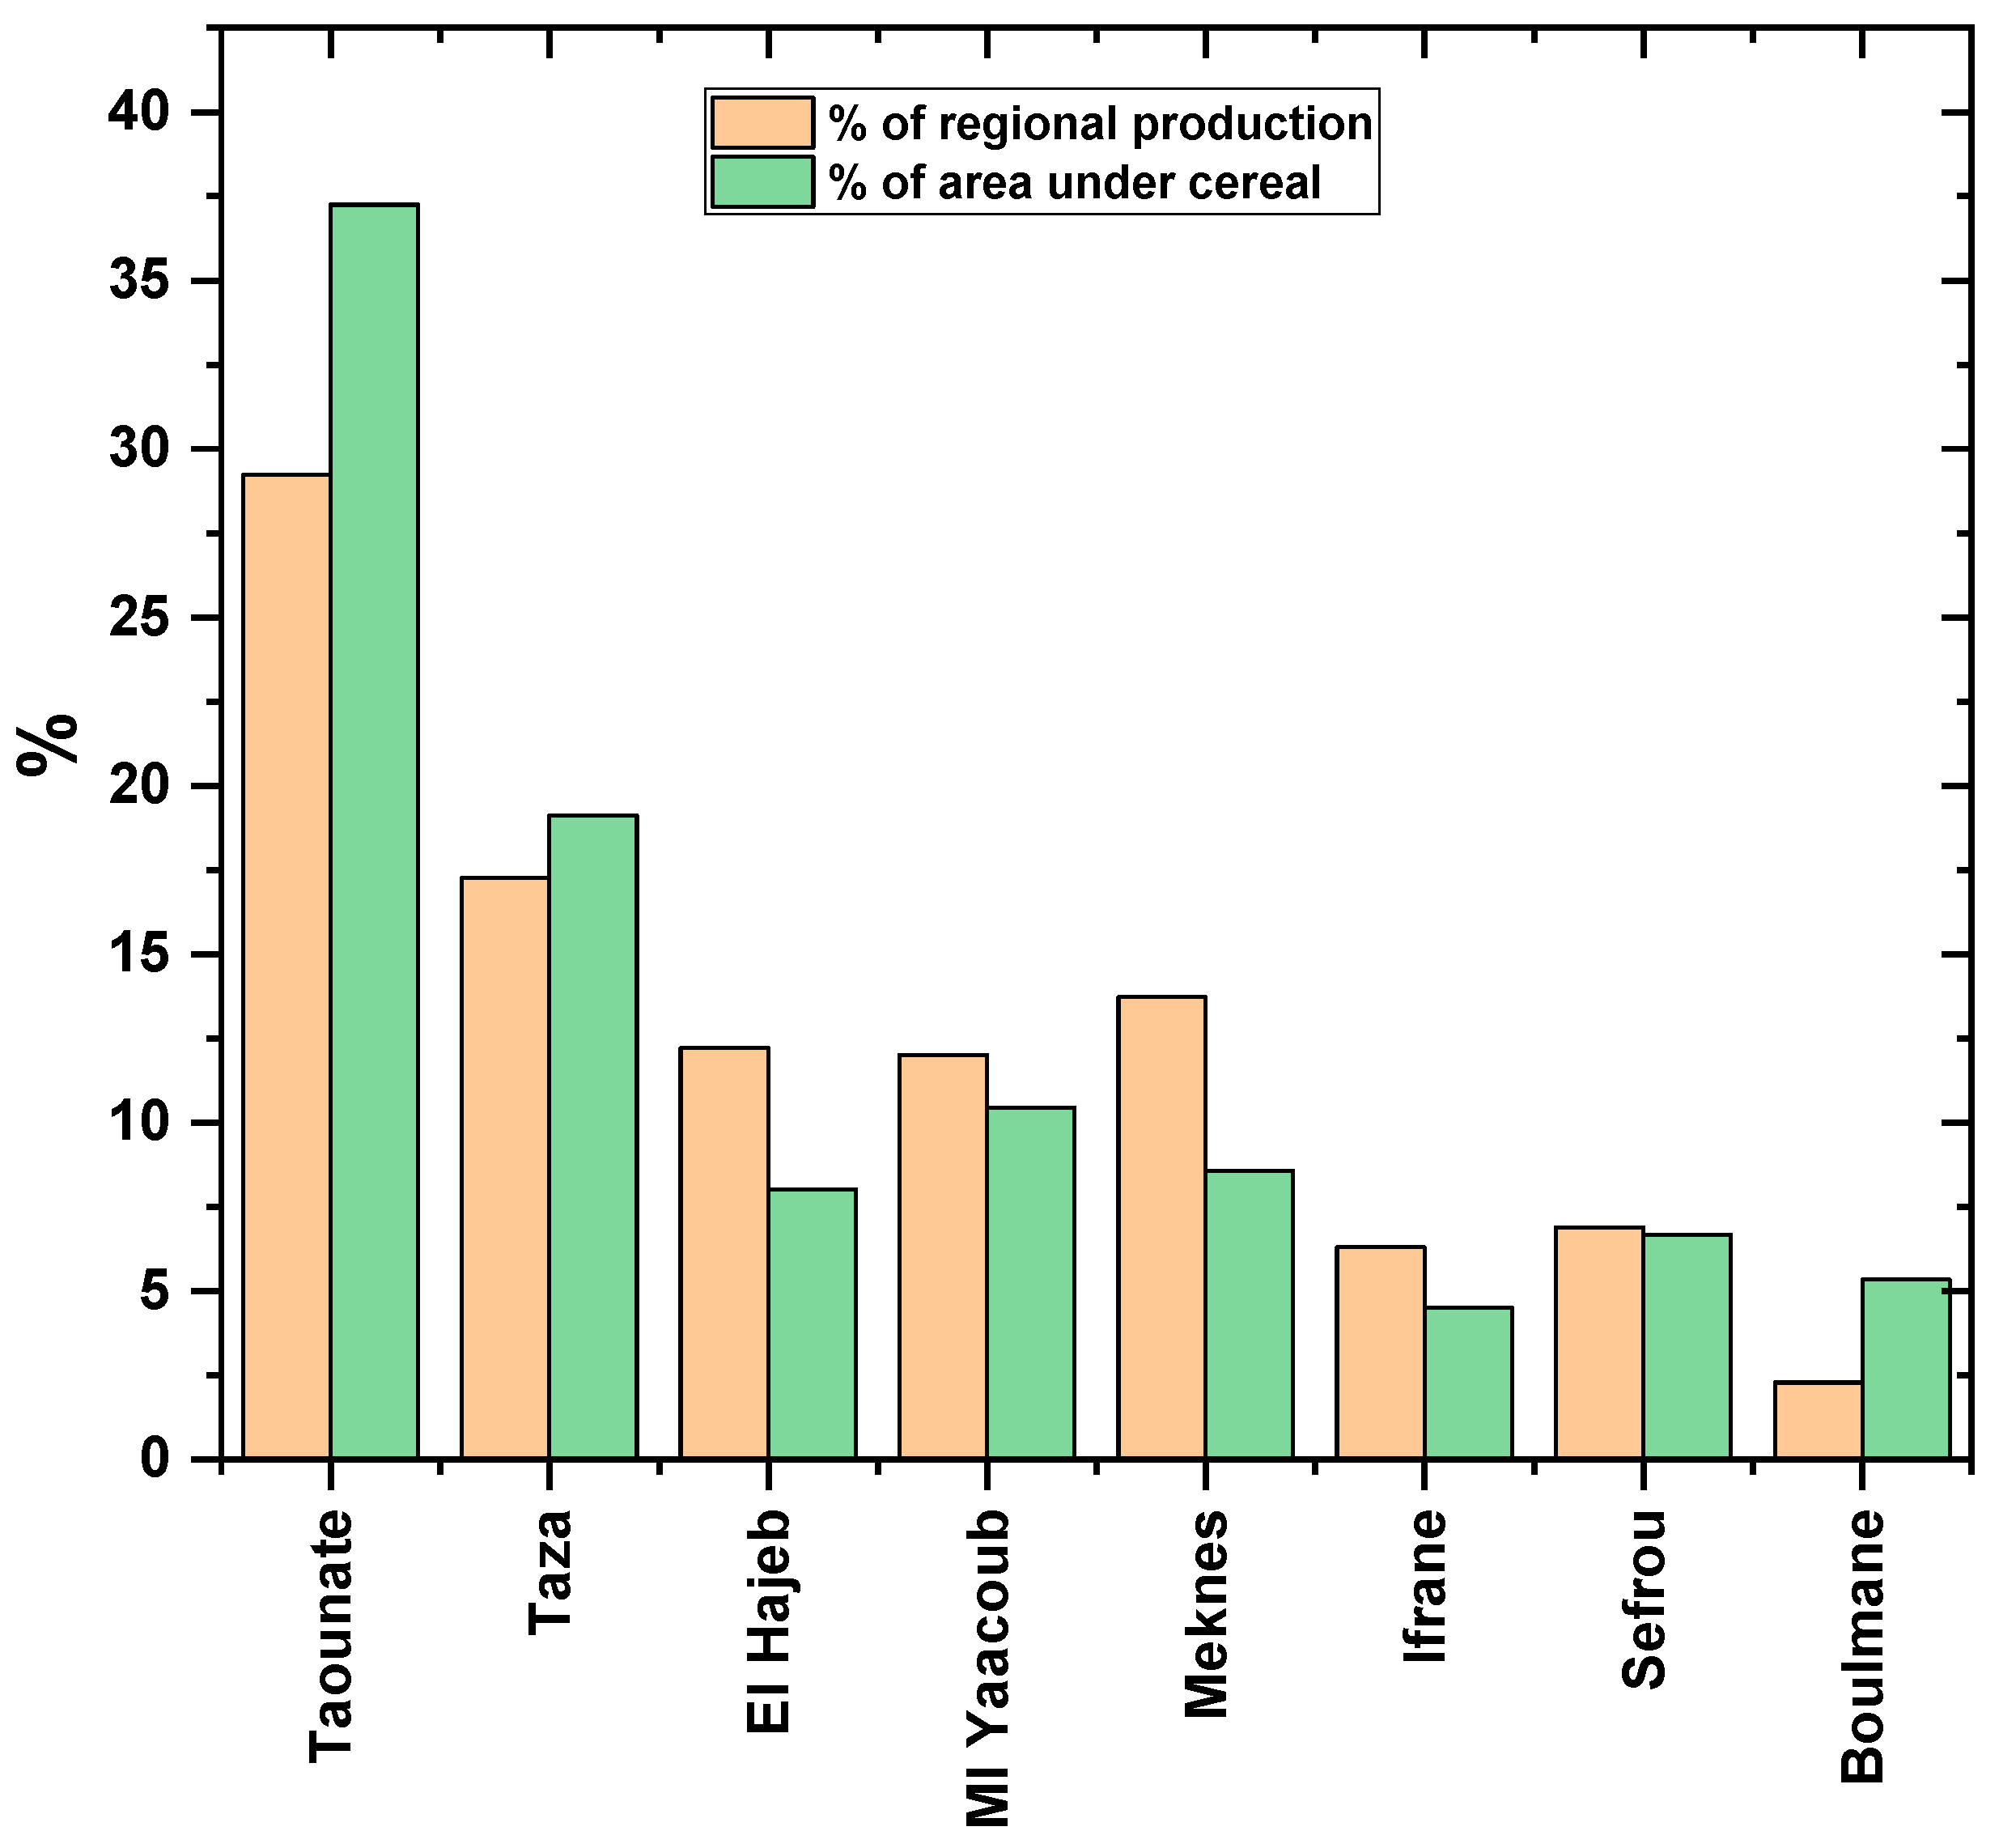
3.1. Yield Data for Main Cereals
3.2. Remote Sensing Data
3.3. Statistical Analysis
4. Results
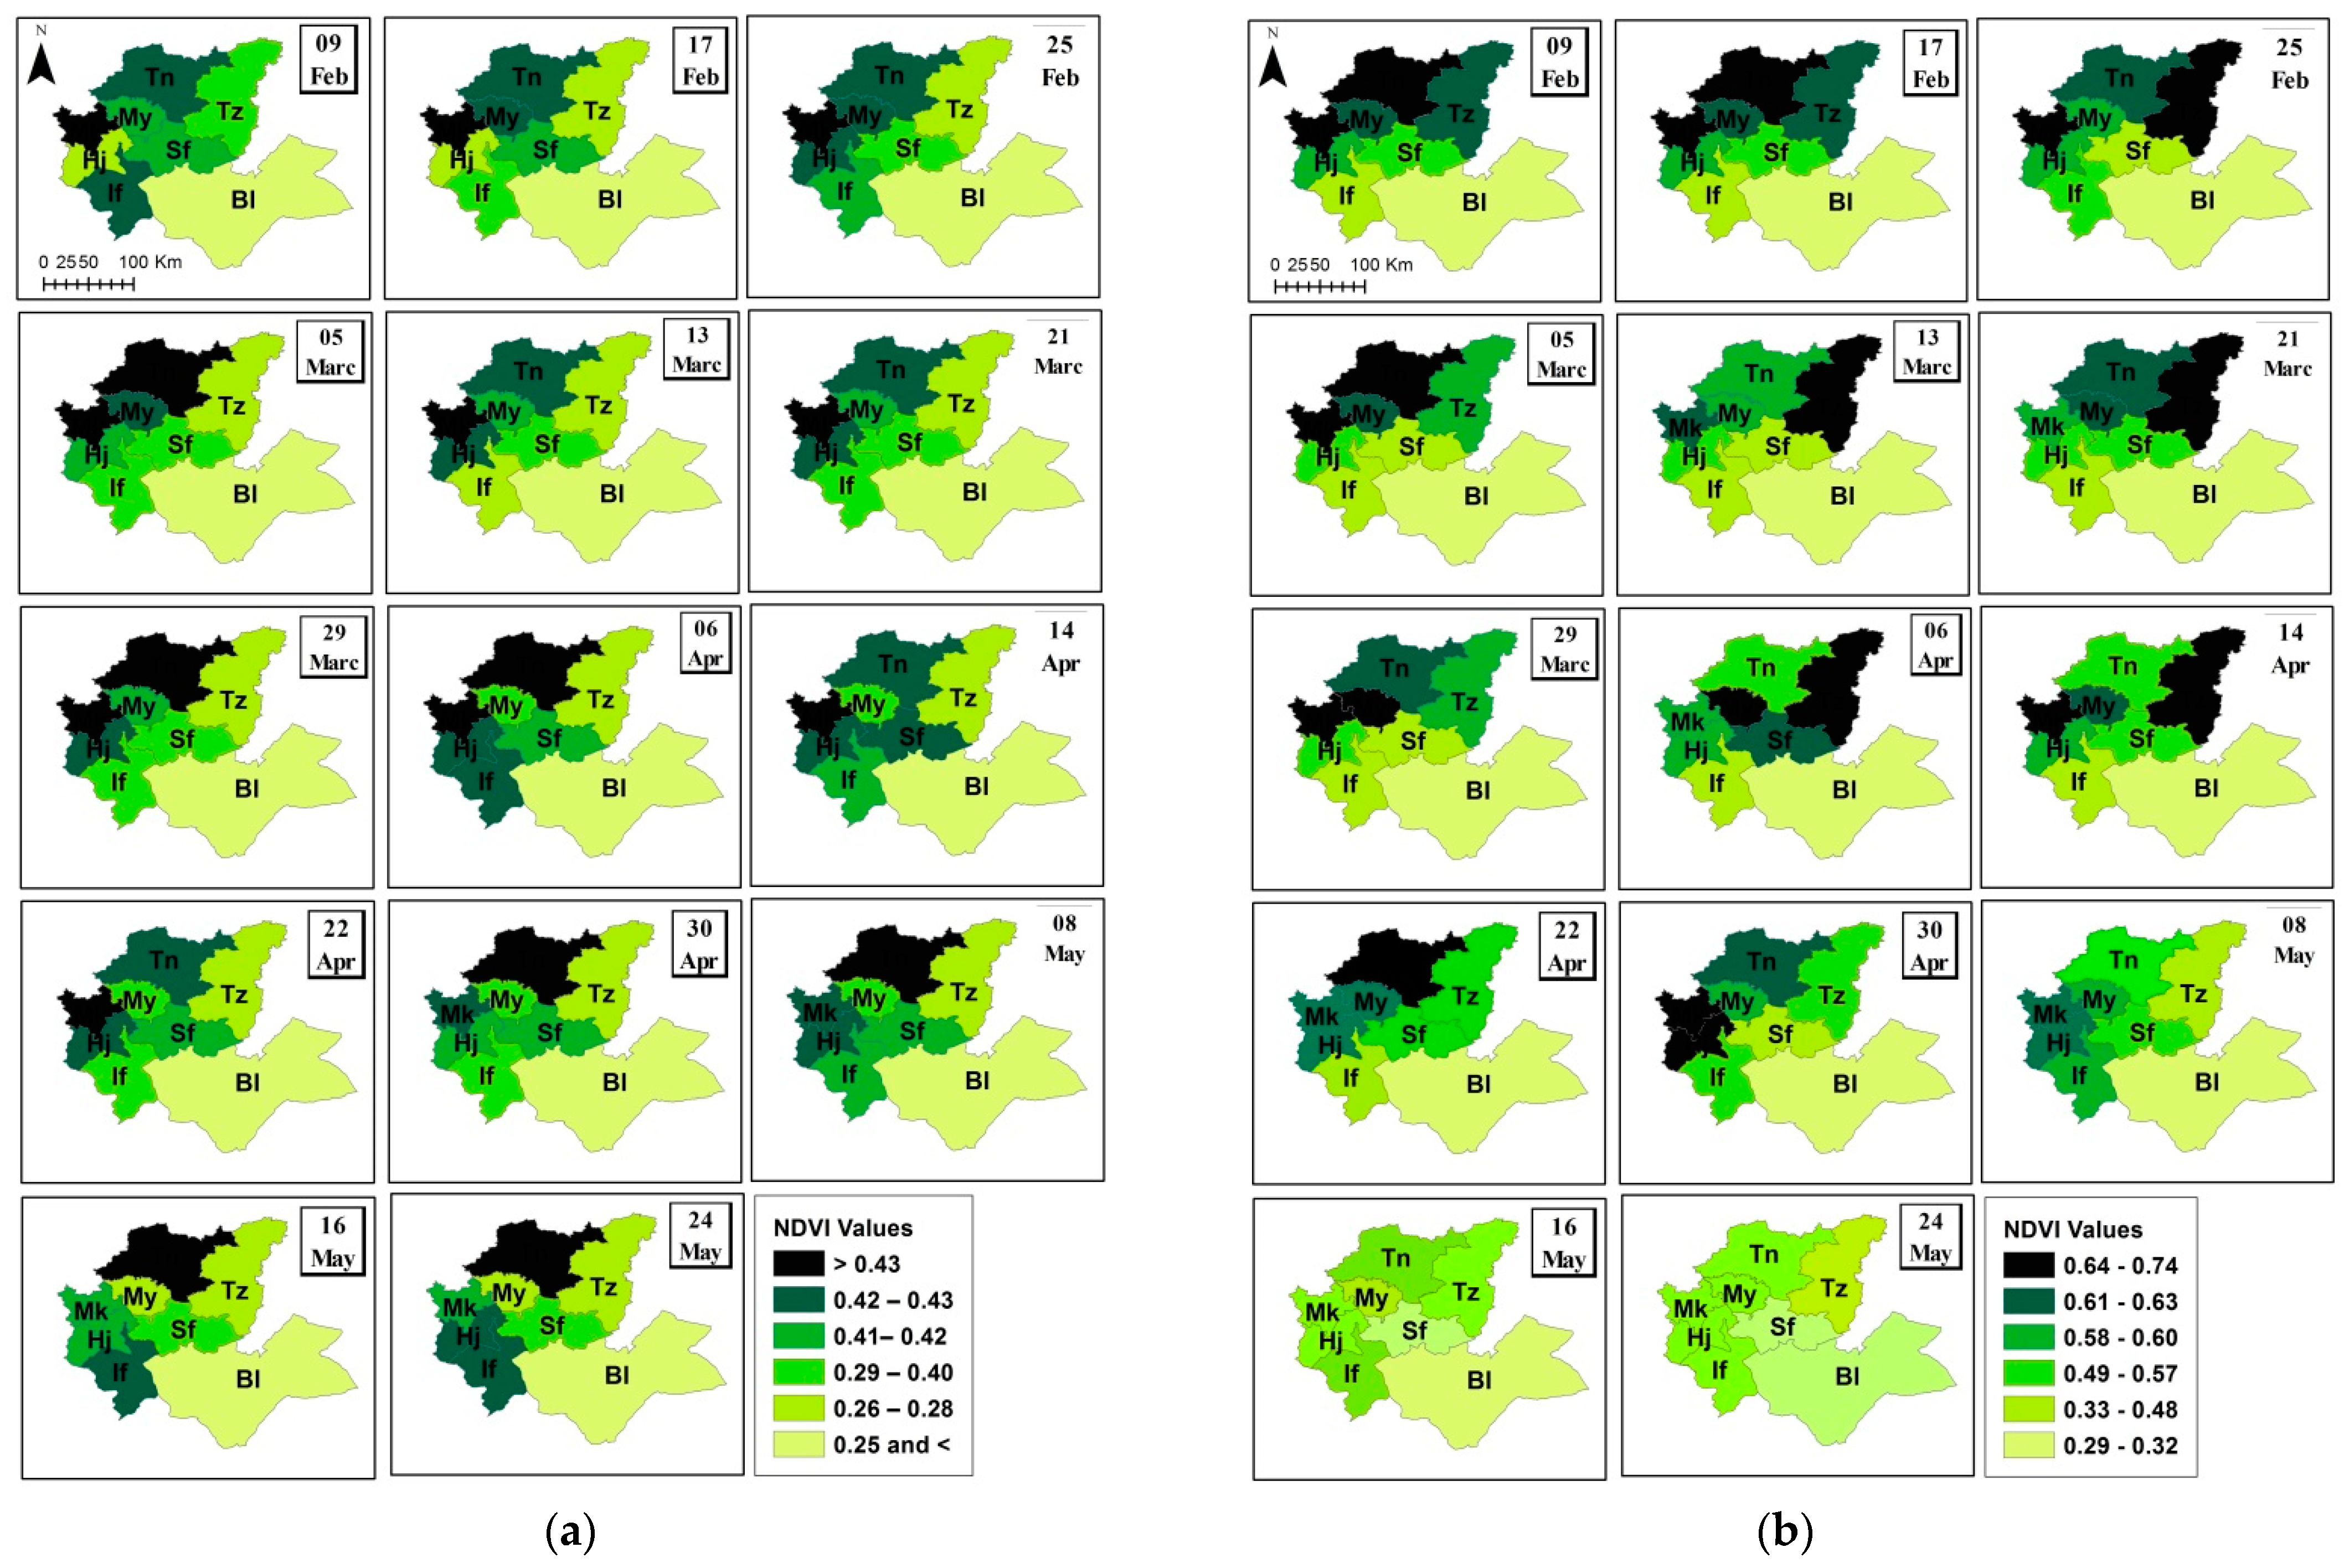
4.1. Spatial and Temporal Variability of Grain Yield and NDVI
4.2. Links between Grain Yield and NDVI at Different Dates
5. Discussion
6. Conclusions
Author Contributions
Funding
Data Availability Statement
Acknowledgments
Conflicts of Interest
References
- Elboukhary El Intidami, M.; Benamar, F. Adoption de la technologie d’irrigation localisée (TIL) par les agriculteurs de la province de Zagora: Rôles des perceptions aux attributs de la technologie. Int. J. Account. Financ. Audit. Manag. Econ. 2020, 1, 210–229. [Google Scholar] [CrossRef]
- World Bank. Agriculture and Food. 2021. Available online: https://www.banquemondiale.org/fr/topic/agriculture/overview (accessed on 26 February 2022).
- Harbouze, R.; Pellissier, J.-P.; Rolland, J.-P.; Khechimi, W. Rapport de Synthèse sur l’agriculture au Maroc, CIHEAM-IAMM, Research Report. 2019. Available online: https://hal.archives-ouvertes.fr/hal-02137637 (accessed on 12 June 2021).
- MAPMEFDR. Agriculture en Chiffres. 2019. Available online: https://www.agriculture.gov.ma/fr/publications/agriculture-en-chiffres-2018-edition-2019 (accessed on 23 June 2022).
- Balaghi, R. Wheat Grain Yield Forecasting Models for Food Security in Morocco; Université de Liège: Liège, Belgique, 2006. [Google Scholar] [CrossRef]
- Bishaw, Z.; Yigezu, Y.A.; Niane, A.; Telleria, R.J.; Najjar, D. Political Economy of the Wheat Sector in Morocco: Seed Systems, Varietal Adoption, and Impacts; International Center for Agricultural Research in the Dry Areas: Beirut, Lebanon, 2019; p. 300. [Google Scholar]
- ONICL. Importations_Cereales. 2022. Available online: https://www.onicl.org.ma/portail/sites/default/files/FichierPage/importations_cereales.pdf (accessed on 23 June 2021).
- Pettorelli, N.; Vik, J.O.; Mysterud, A.; Gaillard, J.-M.; Tucker, C.J.; Stenseth, N.C. Using the satellite-derived NDVI to assess ecological responses to environmental change. Trends Ecol. Evol. 2005, 20, 503–510. [Google Scholar] [CrossRef] [PubMed]
- Pande, C.B.; Kadam, S.A.; Rajesh, J.; Gorantiwar, S.D.; Shinde, M.G. Predication of Sugarcane Yield in the Semi-Arid Region Based on the Sentinel-2 Data Using Vegetation’s Indices and Mathematical Modeling. In Climate Change Impacts on Natural Resources, Ecosystems and Agricultural Systems; Pande, C.B., Moharir, K.N., Singh, S.K., Pham, Q.B., Elbeltagi, A., Eds.; Springer International Publishing: Cham, Switzerland, 2023; pp. 327–343. [Google Scholar] [CrossRef]
- Idrissi, A.; Nadem, S.; Boudhar, A.; Benabdlouahab, T. Review of wheat yield estimating methods in Morocco. Afr. J. Land Policy Geospat. Sci. 2022, 5, 818–831. [Google Scholar]
- Bent Salama Erhili, S. Using Remote Sensing Technology to Monitor and Detect Changes in Vegetation Cover in the Area between the Cities of Makkah and Taif. J. Geogr. Lett. 2013, 403, 1–45. (In Arabic) [Google Scholar]
- Son, N.; Chen, C.; Minh, V.; Trung, N. A comparative analysis of multitemporal MODIS EVI and NDVI data for large-scale rice yield estimation. Agric. For. Meteorol. 2014, 197, 52–64. [Google Scholar] [CrossRef]
- Bolton, D.K.; Friedl, M.A. Forecasting crop yield using remotely sensed vegetation indices and crop phenology metrics. Agric. For. Meteorol. 2013, 173, 74–84. [Google Scholar] [CrossRef]
- Wu, B.; Zhang, M.; Zeng, H.; Tian, F.; Potgieter, A.B.; Qin, X.; Yan, N.; Chang, S.; Zhao, Y.; Dong, Q.; et al. Challenges and opportunities in remote sensing-based crop monitoring: A review. Natl. Sci. Rev. 2022, 10, nwac290. [Google Scholar] [CrossRef] [PubMed]
- Al-Ansari, N.; Abed, S.A.; Ewaid, S.H. Agriculture in Iraq. J. Earth Sci. Geo Eng. 2021, 11, 223–241. [Google Scholar] [CrossRef]
- Benedetti, R.; Rossini, P. On the use of NDVI profiles as a tool for agricultural statistics: The case study of wheat yield estimate and forecast in Emilia Romagna. Remote Sens. Environ. 1993, 45, 311–326. [Google Scholar] [CrossRef]
- DeFries, R.S.; Townshend, J.R.G. NDVI-derived land cover classifications at a global scale. Int. J. Remote Sens. 1994, 15, 3567–3586. [Google Scholar] [CrossRef]
- Hakam, O.; Baali, A.; Azennoud, K.; Lyazidi, A.; Bourchachen, M. Assessments of Drought Effects on Plant Production Using Satellite Remote Sensing Technology, GIS and Observed Climate Data in Northwest Morocco, Case of the Lower Sebou Basin. Int. J. Plant Prod. 2023, 1–16. [Google Scholar] [CrossRef]
- Jayawardhana, W.; Chathurange, V. Extraction of Agricultural Phenological Parameters of Sri Lanka Using MODIS, NDVI Time Series Data. Procedia Food Sci. 2016, 6, 235–241. [Google Scholar] [CrossRef]
- Jaziri, B.; Samaali, H.; Mjejra, M. L’apport des indices SPI et NDVI pour l’évaluation des conditions du risque de sécheresse aux alentours du Barrage Sejnane (Tunisie Septentrionale). In Analale Universitatii Bucuresti. Seria Geografie; Editura Universitatii din Oradea: Oradea, Romania, 2018; pp. 63–89. Available online: https://www.researchgate.net/profile/Brahim-Jaziri/publication/335821897 (accessed on 15 February 2023).
- Lloyd, D. A phenological classification of terrestrial vegetation cover using shortwave vegetation index imagery. Int. J. Remote Sens. 1990, 11, 2269–2279. [Google Scholar] [CrossRef]
- Panek, E.; Gozdowski, D. Analysis of relationship between cereal yield and NDVI for selected regions of Central Europe based on MODIS satellite data. Remote Sens. Appl. Soc. Environ. 2020, 17, 100286. [Google Scholar] [CrossRef]
- Ali, S.; Basit, A.; Makanda, T.A.; Inamullah; Khan, F.U.; Sajid, M.; Riaz, T.; Abbasi, H.F.; Manzoor; Sohail, A. Improving drought mitigation strategies and disaster risk reduction through MODIS and TRMM-based data in relation to climate change over Pakistan. Environ. Sci. Pollut. Res. 2023, 30, 40563–40575. [Google Scholar] [CrossRef]
- Kumari, N.; Srivastava, A.; Dumka, U.C. A Long-Term Spatiotemporal Analysis of Vegetation Greenness over the Himalayan Region Using Google Earth Engine. Climate 2021, 9, 109. [Google Scholar] [CrossRef]
- Tian, F.; Fensholt, R.; Verbesselt, J.; Grogan, K.; Horion, S.; Wang, Y.J. Evaluating temporal consistency of long-term global NDVI datasets for trend analysis. Remote Sens. Environ. 2015, 163, 326–340. [Google Scholar] [CrossRef]
- Ren, J.; Chen, Z.; Zhou, Q.; Tang, H. Regional yield estimation for winter wheat with MODIS-NDVI data in Shandong, China. Int. J. Appl. Earth Obs. Geoinf. 2008, 10, 403–413. [Google Scholar] [CrossRef]
- Matsushita, B.; Yang, W.; Chen, J.; Onda, Y.; Qiu, G. Sensitivity of the Enhanced Vegetation Index (EVI) and Normalized Difference Vegetation Index (NDVI) to Topographic Effects: A Case Study in High-density Cypress Forest. Sensors 2007, 7, 2636–2651. [Google Scholar] [CrossRef]
- Kumari, N.; Saco, P.M.; Rodriguez, J.F.; Johnstone, S.A.; Srivastava, A.; Chun, K.P.; Yetemen, O. The Grass Is Not Always Greener on the Other Side: Seasonal Reversal of Vegetation Greenness in Aspect-Driven Semiarid Ecosystems. Geophys. Res. Lett. 2020, 47, e2020GL088918. [Google Scholar] [CrossRef]
- Viana, C.M.; Oliveira, S.; Oliveira, S.C.; Rocha, J. Land Use/Land Cover Change Detection and Urban Sprawl Analysis. In Spatial Modeling in GIS and R for Earth and Environmental Sciences; Pourghasemi, H.R., Gokceoglu, C., Eds.; Elsevier: Amsterdam, The Netherlands, 2019; pp. 621–651. [Google Scholar] [CrossRef]
- Rouse, J.W.; Haas, R.H.; Deering, D.W.; Schell, J.A.; Harlan, J.C. Monitoring the Vernal Advancement and Retrogradation (Green Wave Effect) of Natural Vegetation. E75-10354; November 1974. Available online: https://ntrs.nasa.gov/citations/19750020419 (accessed on 12 August 2022).
- Balaghi, R.; Tychon, B.; Eerens, H.; Jlibene, M. Empirical regression models using NDVI, rainfall and temperature data for the early prediction of wheat grain yields in Morocco. Int. J. Appl. Earth Obs. Geoinf. 2008, 10, 438–452. [Google Scholar] [CrossRef]
- Bouras, E.H.; Jarlan, L.; Er-Raki, S.; Albergel, C.; Richard, B.; Balaghi, R.; Khabba, S. Linkages between Rainfed Cereal Production and Agricultural Drought through Remote Sensing Indices and a Land Data Assimilation System: A Case Study in Morocco. Remote Sens. 2020, 12, 4018. [Google Scholar] [CrossRef]
- Mkhabela, M.; Bullock, P.; Raj, S.; Wang, S.; Yang, Y. Crop yield forecasting on the Canadian Prairies using MODIS NDVI data. Agric. For. Meteorol. 2011, 151, 385–393. [Google Scholar] [CrossRef]
- Gandhi, G.M.; Parthiban, S.; Thummalu, N.; Christy, A. Ndvi: Vegetation Change Detection Using Remote Sensing and Gis—A Case Study of Vellore District. Procedia Comput. Sci. 2015, 57, 1199–1210. [Google Scholar] [CrossRef]
- Ghorbanian, A.; Mohammadzadeh, A.; Jamali, S. Linear and Non-Linear Vegetation Trend Analysis throughout Iran Using Two Decades of MODIS NDVI Imagery. Remote. Sens. 2022, 14, 3683. [Google Scholar] [CrossRef]
- Rahman, A.; Roytman, L.; Krakauer, N.Y.; Nizamuddin, M.; Goldberg, M. Use of vegetation health data for estimation of Aus rice yield in Bangladesh. Sensors 2009, 9, 2968–2975. [Google Scholar] [CrossRef]
- Sruthi, S.; Aslam, M.M. Agricultural Drought Analysis Using the NDVI and Land Surface Temperature Data; a Case Study of Raichur District. Aquat. Procedia 2015, 4, 1258–1264. [Google Scholar] [CrossRef]
- Tenreiro, T.R.; García-Vila, M.; Gómez, J.A.; Jiménez-Berni, J.A.; Fereres, E. Using NDVI for the assessment of canopy cover in agricultural crops within modelling research. Comput. Electron. Agric. 2021, 182, 106038. [Google Scholar] [CrossRef]
- Ed-Daoudi, R.; Alaoui, A.; Ettaki, B.; Zerouaoui, J. Improving Crop Yield Predictions in Morocco Using Machine Learning Algorithms. J. Ecol. Eng. 2023, 24, 392–400. [Google Scholar] [CrossRef]
- Zhou, Y.; Sommer, M.L.; Hochholdinger, F. Cold response and tolerance in cereal roots. J. Exp. Bot. 2021, 72, 7474–7481. [Google Scholar] [CrossRef]
- Karrou, M.; Theib, O. Assessment of the severity and impact of drought spells on rainfed cereals in Morocco. Afr. J. Agric. Res. 2014, 9, 3519–3530. [Google Scholar]
- Barakat, F.; Handoufe, A. Approche agroclimatique de la sécheresse agricole au Maroc. Sci. Chang. Planétaires/Sécheresse 1998, 9, 201–210. [Google Scholar]
- Ministère de l’Intérieur, Direction Générale des Collectivités Locales. La Monographie de la Région Fès-Meknès. 2015. Available online: http://www.equipement.gov.ma/Carte-Region/RegionFes/Presentation-de-la-region/Monographie/Pages/Monographie-de-la-region.aspx (accessed on 20 May 2022).
- Kessabi, R.; Hanchane, M.; Guijarro, J.A.; Krakauer, N.Y.; Addou, R.; Sadiki, A.; Belmahi, M. Homogenization and Trends Analysis of Monthly Precipitation Series in the Fez-Meknes Region, Morocco. Climate 2022, 10, 64. [Google Scholar] [CrossRef]
- Haut-Commissariat au Plan. Monographie de la Région de Fès-Meknès. 2020. Available online: https://www.hcp.ma/region-fes/Annuaires-et-Monographies_r2.html (accessed on 25 March 2023).
- Haut-Commissariat au Plan. Comptes Régionaux Produit Intérieur Brut et Dépenses de Consommation Finale des Ménages 2020. Available online: https://www.hcp.ma/Les-comptes-regionaux-Produit-interieur-brut-et-depenses-de-consommation-finale-des-menages-2020_a3572.html (accessed on 29 December 2022).
- Chambre D’Agriculture De Fès-Meknès, le secteur agricole dans la région de Fès-meknès. Chamb. D’Agric. De Fès Mekès 2019, 1, 74.
- Ministère de l’Agriculture MAPMEFDR de la Pêche Maritime, du Développement Rural et des Eaux et Forêts, “la production des céréales au Maroc”. 2021; [Fichier de données Excel, non publier].
- Tucker, C.; Pack, E. Global Agricultural Monitoring System. GIMMS Glob. Agric. Monit. 2000. Available online: https://glam1.gsfc.nasa.gov/api/doc/about (accessed on 16 December 2022).
- Kahimba, F.C.; Bullock, P.R.; Sri Ranjan, R.; Cutforth, H.W. Evaluation of the SolarCalc model for simulating hourly and daily incoming solar radiation in the Northern Great Plains of Canada. Can. Biosyst. Eng. 2009, 51, 1–11. [Google Scholar]
- Meroni, M.; Marinho, E.; Sghaier, N.; Verstrate, M.M.; Leo, O. Remote Sensing Based Yield Estimation in a Stochastic Framework — Case Study of Durum Wheat in Tunisia. Remote Sens. 2013, 5, 539–557. [Google Scholar] [CrossRef]
- Bognár, P.; Ferencz, C.; Pásztor, S.; Molnár, G.; Timár, G.; Hamar, D.; Lichtenberger, J.; Székely, B.; Steinbach, P.; Ferencz, O.E. Yield forecasting for wheat and corn in Hungary by satellite remote sensing. Int. J. Remote Sens. 2011, 32, 4759–4767. [Google Scholar] [CrossRef]
- Nagy, A.; Fehér, J.; Tamás, J. Wheat and maize yield forecasting for the Tisza river catchment using MODIS NDVI time series and reported crop statistics. Comput. Electron. Agric. 2018, 151, 41–49. [Google Scholar] [CrossRef]


| Meknes | Ml Yaacoub | Taza | Taounate | El Hajeb | Sefrou | Boulmane | Ifrane | |||||||||
|---|---|---|---|---|---|---|---|---|---|---|---|---|---|---|---|---|
| NDVI PERIOD | r | p-Value | r | p-Value | r | p-Value | r | p-Value | r | p-Value | r | p-Value | r | p-Value | r | p-Value |
| 18 Dec | 0.32 | 0.163 | 0.42 | 0.066 | 0.35 | 0.13 | 0.32 | 0.172 | 0.14 | 0.563 | 0.28 | 0.239 | 0.34 | 0.15 | 0.11 | 0.64 |
| 26 Dec | 0.40 | 0.083 | 0.49 | 0.026 * | 0.46 | 0.043 * | 0.48 | 0.032 * | 0.20 | 0.410 | 0.30 | 0.204 | −0.15 | 0.52 | −0.01 | 0.96 |
| 03 Jan | 0.37 | 0.113 | 0.49 | 0.029 * | 0.59 | 0.006 ** | 0.46 | 0.041 * | 0.23 | 0.337 | 0.35 | 0.129 | 0.07 | 0.78 | 0.30 | 0.21 |
| 08 Jan | 0.50 | 0.023 * | 0.59 | 0.006 ** | 0.57 | 0.008 ** | 0.54 | 0.014 * | 0.32 | 0.164 | 0.45 | 0.044 * | 0.34 | 0.14 | 0.30 | 0.20 |
| 16 Jan | 0.64 | 0.002 ** | 0.68 | 0.00 *** | 0.72 | 0.00 *** | 0.71 | 0.00 *** | 0.30 | 0.193 | 0.52 | 0.02 * | 0.44 | 0.054 * | 0.37 | 0.11 |
| 24 Jan | 0.58 | 0.007 ** | 0.66 | 0.00 *** | 0.71 | 0.00 *** | 0.68 | 0.00 *** | 0.39 | 0.092 * | 0.47 | 0.037 * | 0.21 | 0.38 | 0.33 | 0.15 |
| 01 Feb | 0.65 | 0.002 ** | 0.76 | 0.00 *** | 0.76 | 0.00 *** | 0.78 | 0.00 *** | 0.60 | 0.005 ** | 0.56 | 0.01 ** | 0.46 | 0.039 * | 0.31 | 0.18 |
| 09 Feb | 0.55 | 0.011 ** | 0.75 | 0.00 *** | 0.79 | 0.00 *** | 0.75 | 0.00 *** | 0.70 | 0.00 *** | 0.63 | 0.002 ** | 0.46 | 0.040 * | 0.29 | 0.22 |
| 17 Feb | 0.66 | 0.00 *** | 0.78 | 0.00 *** | 0.89 | 0.00 *** | 0.79 | 0.00 *** | 0.77 | 0.00 *** | 0.60 | 0.005 ** | 0.41 | 0.07 | 0.16 | 0.51 |
| 25 Feb | 0.66 | 0.00 *** | 0.78 | 0.00 *** | 0.82 | 0.00 *** | 0.83 | 0.00 *** | 0.72 | 0.00 *** | 0.61 | 0.004 ** | 0.23 | 0.34 | 0.32 | 0.17 |
| 05 Mar | 0.70 | 0.00 *** | 0.80 | 0.00 *** | 0.87 | 0.00 *** | 0.85 | 0.00 *** | 0.75 | 0.00 *** | 0.71 | 0.00 *** | 0.57 | 0.009 ** | 0.59 | 0.005 ** |
| 13 Mar | 0.73 | 0.00 *** | 0.84 | 0.00 *** | 0.85 | 0.00 *** | 0.89 | 0.00 *** | 0.70 | 0.00 *** | 0.70 | 0.00 *** | 0.58 | 0.007 ** | 0.62 | 0.003 ** |
| 21 Mar | 0.69 | 0.00 *** | 0.82 | 0.00 *** | 0.83 | 0.00 *** | 0.88 | 0.00 *** | 0.70 | 0.00 *** | 0.74 | 0.00 *** | 0.57 | 0.008 ** | 0.57 | 0.009 ** |
| 29 Mar | 0.81 | 0.00 *** | 0.85 | 0.00 *** | 0.83 | 0.00 *** | 0.84 | 0.00 *** | 0.68 | 0.00 *** | 0.76 | 0.00 *** | 0.62 | 0.003 ** | 0.53 | 0.015 * |
| 06 Apr | 0.78 | 0.00 *** | 0.84 | 0.00 *** | 0.74 | 0.00 *** | 0.76 | 0.00 *** | 0.70 | 0.00 *** | 0.82 | 0.00 *** | 0.61 | 0.004 ** | 0.72 | 0.00 *** |
| 14 Apr | 0.70 | 0.00 *** | 0.76 | 0.00 *** | 0.71 | 0.00 *** | 0.75 | 0.00 *** | 0.75 | 0.00 *** | 0.76 | 0.00 *** | 0.64 | 0.002 ** | 0.57 | 0.008 ** |
| 22 Apr | 0.59 | 0.005 ** | 0.57 | 0.008 ** | 0.57 | 0.008 ** | 0.50 | 0.026 * | 0.62 | 0.003 ** | 0.64 | 0.002 ** | 0.71 | 0.000 *** | 0.59 | 0.005 ** |
| 30 Apr | 0.40 | 0.08 | 0.59 | 0.006 ** | 0.32 | 0.16 | 0.34 | 0.14 | 0.56 | 0.010 * | 0.57 | 0.008 ** | 0.61 | 0.004 ** | 0.71 | 0.00 *** |
| 08 May | 0.17 | 0.48 | 0.34 | 0.15 | 0.20 | 0.39 | 0.20 | 0.39 | 0.42 | 0.066 | 0.23 | 0.329 | 0.65 | 0.002 ** | 0.61 | 0.004 ** |
| 16 May | 0.14 | 0.56 | 0.32 | 0.17 | 0.05 | 0.83 | −0.11 | 0.63 | 0.32 | 0.174 | 0.21 | 0.375 | 0.62 | 0.003 ** | 0.61 | 0.004 ** |
| 24 May | 0.20 | 0.40 | 0.37 | 0.11 | 0.14 | 0.54 | 0.12 | 0.60 | 0.29 | 0.213 | 0.23 | 0.335 | 0.73 | 0.000 *** | 0.58 | 0.007 ** |
| 01 Jun | 0.26 | 0.26 | 0.38 | 0.10 | 0.06 | 0.81 | 0.12 | 0.61 | 0.26 | 0.275 | 0.20 | 0.409 | 0.55 | 0.012 * | 0.53 | 0.015 * |
Disclaimer/Publisher’s Note: The statements, opinions and data contained in all publications are solely those of the individual author(s) and contributor(s) and not of MDPI and/or the editor(s). MDPI and/or the editor(s) disclaim responsibility for any injury to people or property resulting from any ideas, methods, instructions or products referred to in the content. |
© 2023 by the authors. Licensee MDPI, Basel, Switzerland. This article is an open access article distributed under the terms and conditions of the Creative Commons Attribution (CC BY) license (https://creativecommons.org/licenses/by/4.0/).
Share and Cite
Belmahi, M.; Hanchane, M.; Krakauer, N.Y.; Kessabi, R.; Bouayad, H.; Mahjoub, A.; Zouhri, D. Analysis of Relationship between Grain Yield and NDVI from MODIS in the Fez-Meknes Region, Morocco. Remote Sens. 2023, 15, 2707. https://doi.org/10.3390/rs15112707
Belmahi M, Hanchane M, Krakauer NY, Kessabi R, Bouayad H, Mahjoub A, Zouhri D. Analysis of Relationship between Grain Yield and NDVI from MODIS in the Fez-Meknes Region, Morocco. Remote Sensing. 2023; 15(11):2707. https://doi.org/10.3390/rs15112707
Chicago/Turabian StyleBelmahi, Mohamed, Mohamed Hanchane, Nir Y. Krakauer, Ridouane Kessabi, Hind Bouayad, Aziz Mahjoub, and Driss Zouhri. 2023. "Analysis of Relationship between Grain Yield and NDVI from MODIS in the Fez-Meknes Region, Morocco" Remote Sensing 15, no. 11: 2707. https://doi.org/10.3390/rs15112707
APA StyleBelmahi, M., Hanchane, M., Krakauer, N. Y., Kessabi, R., Bouayad, H., Mahjoub, A., & Zouhri, D. (2023). Analysis of Relationship between Grain Yield and NDVI from MODIS in the Fez-Meknes Region, Morocco. Remote Sensing, 15(11), 2707. https://doi.org/10.3390/rs15112707