Technical Note

Three-Dimensional Deformation of the 2023 Turkey Mw 7.8 and Mw 7.7 Earthquake Sequence Obtained by Fusing Optical and SAR Images

1
School of Geosciences and Info-Physics, Central South University, Changsha 410083, China
2
School of Earth Sciences and Spatial Information Engineering, Hunan University of Science and Technology, Xiangtan 411199, China
*
Author to whom correspondence should be addressed.
Remote Sens. 2023, 15(10), 2656; https://doi.org/10.3390/rs15102656
Submission received: 29 April 2023 / Revised: 15 May 2023 / Accepted: 17 May 2023 / Published: 19 May 2023

Abstract

:
In February 2023, Mw 7.8 and Mw 7.7 earthquakes struck southeastern Turkey. Generating a coseismic 3D deformation field that can directly reflect the characteristics of surface deformation is important for revealing the movement mode of a seismogenic fault and analyzing the focal mechanism. Optical image sub-pixel correlation (SPC) only captures deformation in the horizontal direction, and SAR image pixel offset tracking (POT) obtains range deformation that is not sensitive to north–south deformation signals. Thus, neither of them can capture the complete 3D deformation alone. Combining them may be able to allow the monitoring of 3D deformation. In this study, we used Sentinel-2 optical images to obtain the horizontal deformation (east–west and north–south) and Sentinel-1 and ALOS-2 data to extract the range and azimuth offsets. The least-squares method was used to fuse the optical and SAR offsets to obtain the 3D deformation field of the 2023 Turkey earthquake sequence, which indicates that the two events were both left-lateral strike-slip earthquakes. The surface deformation caused by the two large earthquakes is mainly in the east–west direction. In the vertical direction, the two earthquakes caused a small-magnitude uplift and subsidence. The findings in this paper can be used as a reference for the study of coseismic 3D deformation.

Graphical Abstract

1. Introduction

On 6 February 2023, two powerful earthquakes struck southern Turkey near the Syrian border. The first earthquake, an Mw 7.8, occurred at 1:17 a.m., followed by an Mw 7.7 nine hours later at 10:24 a.m. The first earthquake, with a source depth of 14.9 km, ruptured the southwestern segment of the East Anatolian Fault (EAF), and the second earthquake, located near the Cardak Fault to the north of the first earthquake, ruptured two secondary faults, with a source depth of 13.5 km (GCMT, https://www.globalcmt.org/, accessed on 1 April 2023). They were both left-lateral strike-slip earthquakes. Two strong earthquakes in a short period were rare for the EAF. The earthquake sequence caused an obvious rupture on the surface and led to devastating damage, with over 44,000 casualties reported on the 20th day after the earthquake and numerous buildings collapsing within a 300 km radius of the epicenter (https://en.afad.gov.tr/, accessed on 10 April 2023). Accurate coseismic deformation fields are important for earthquake research [1]; understanding seismic hazards, fault geometry, energy release, and deformation trends; and providing guidance and references for earthquake emergency relief and post-disaster reconstruction [2,3,4].
Many efforts have been made to monitor coseismic deformation after this earthquake sequence. The Geospatial Information Authority of Japan used Advanced Land Observing Satellite 2 (ALOS-2) data to reveal the spatial distribution characteristics of the surface deformation (https://www.gsi.go.jp/, accessed on 26 February 2023) and observed over 5 m displacements on the EAF and over 4 m displacements on the Cardak Fault. The China Earthquake Administration used Sentinel-1 data to obtain the interferometric synthetic aperture radar (InSAR) line-of-sight (LOS) deformation and range offset of the two earthquakes (https://www.cea.gov.cn/, accessed on 22 March 2023), which showed that the two earthquakes produced rupture zones of more than 300 km and 150 km, respectively, and the LOS deformation is seriously decoherent in the near field. Sentinel-1 images provide high-accuracy range offsets but low-accuracy azimuth offsets. ALOS-2 images have high-precision azimuth offsets. Combining these two data sources can provide high-accuracy range and azimuth offsets. Optical images, such as Sentinel-2 images, are very sensitive to horizontal deformation [5]. The sub-pixel correlation (SPC) of optical images combined with SAR pixel offset tracking (POT) can address the decoherence due to large deformation gradients [6,7]. Fusing the optical and SAR offsets to obtain the 3D deformation field allows for more effective signals in the near field, which can help to interpret the deformation characteristics of the earthquake and understand the motion of the fault. This is also an important way to obtain the location and intensity of the rupture fault.
In this study, we processed optical images from Sentinel-2 and SAR data from Sentinel-1 and ALOS-2 by using POT and SPC technology, respectively, to obtain the 2D deformation. Then, we fused the 2D deformation results by using the weighted least-squares method to obtain the 3D deformation field of the 2023 Turkey earthquake sequence. By analyzing the rupture and deformation of the seismic sequence, we obtained the geometric characteristics and deformation magnitude of the rupture fault and compared them with GPS data. The 3D deformation provides crucial information about the deformation trend and geometric characteristics of the coseismic deformation field, supporting the interpretation of surface ruptures caused by earthquakes and the analysis of seismogenic structures.

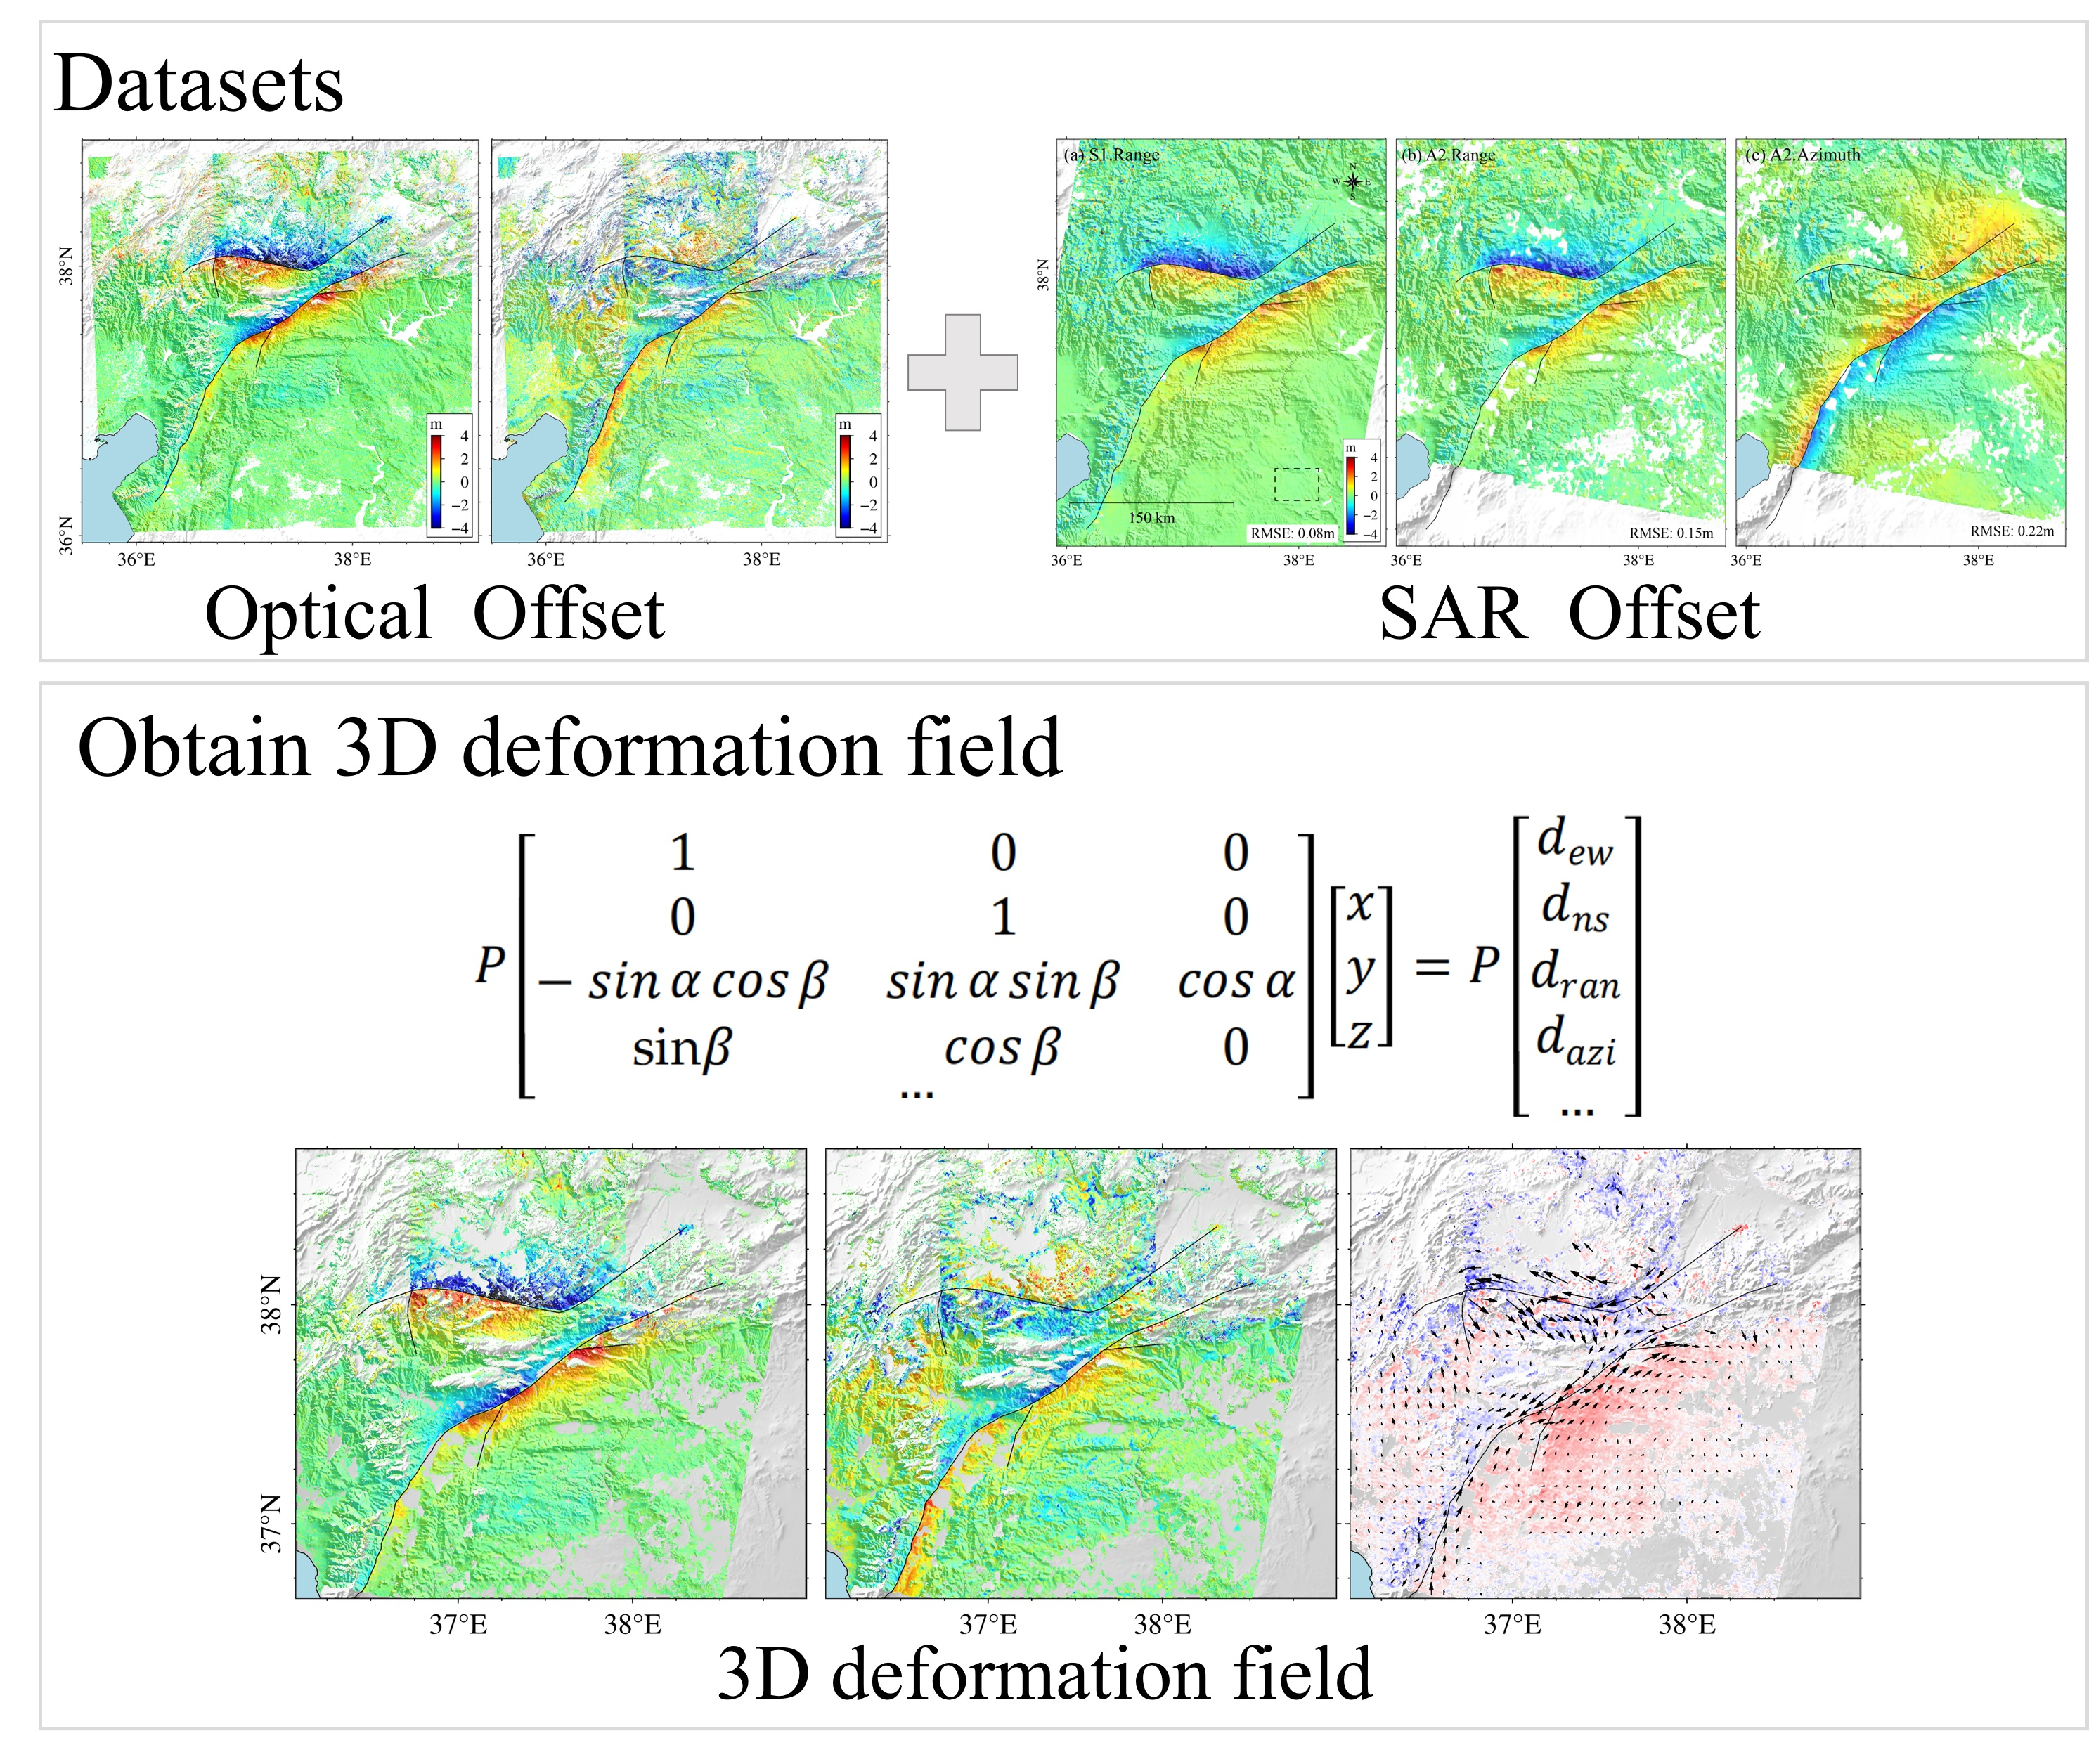
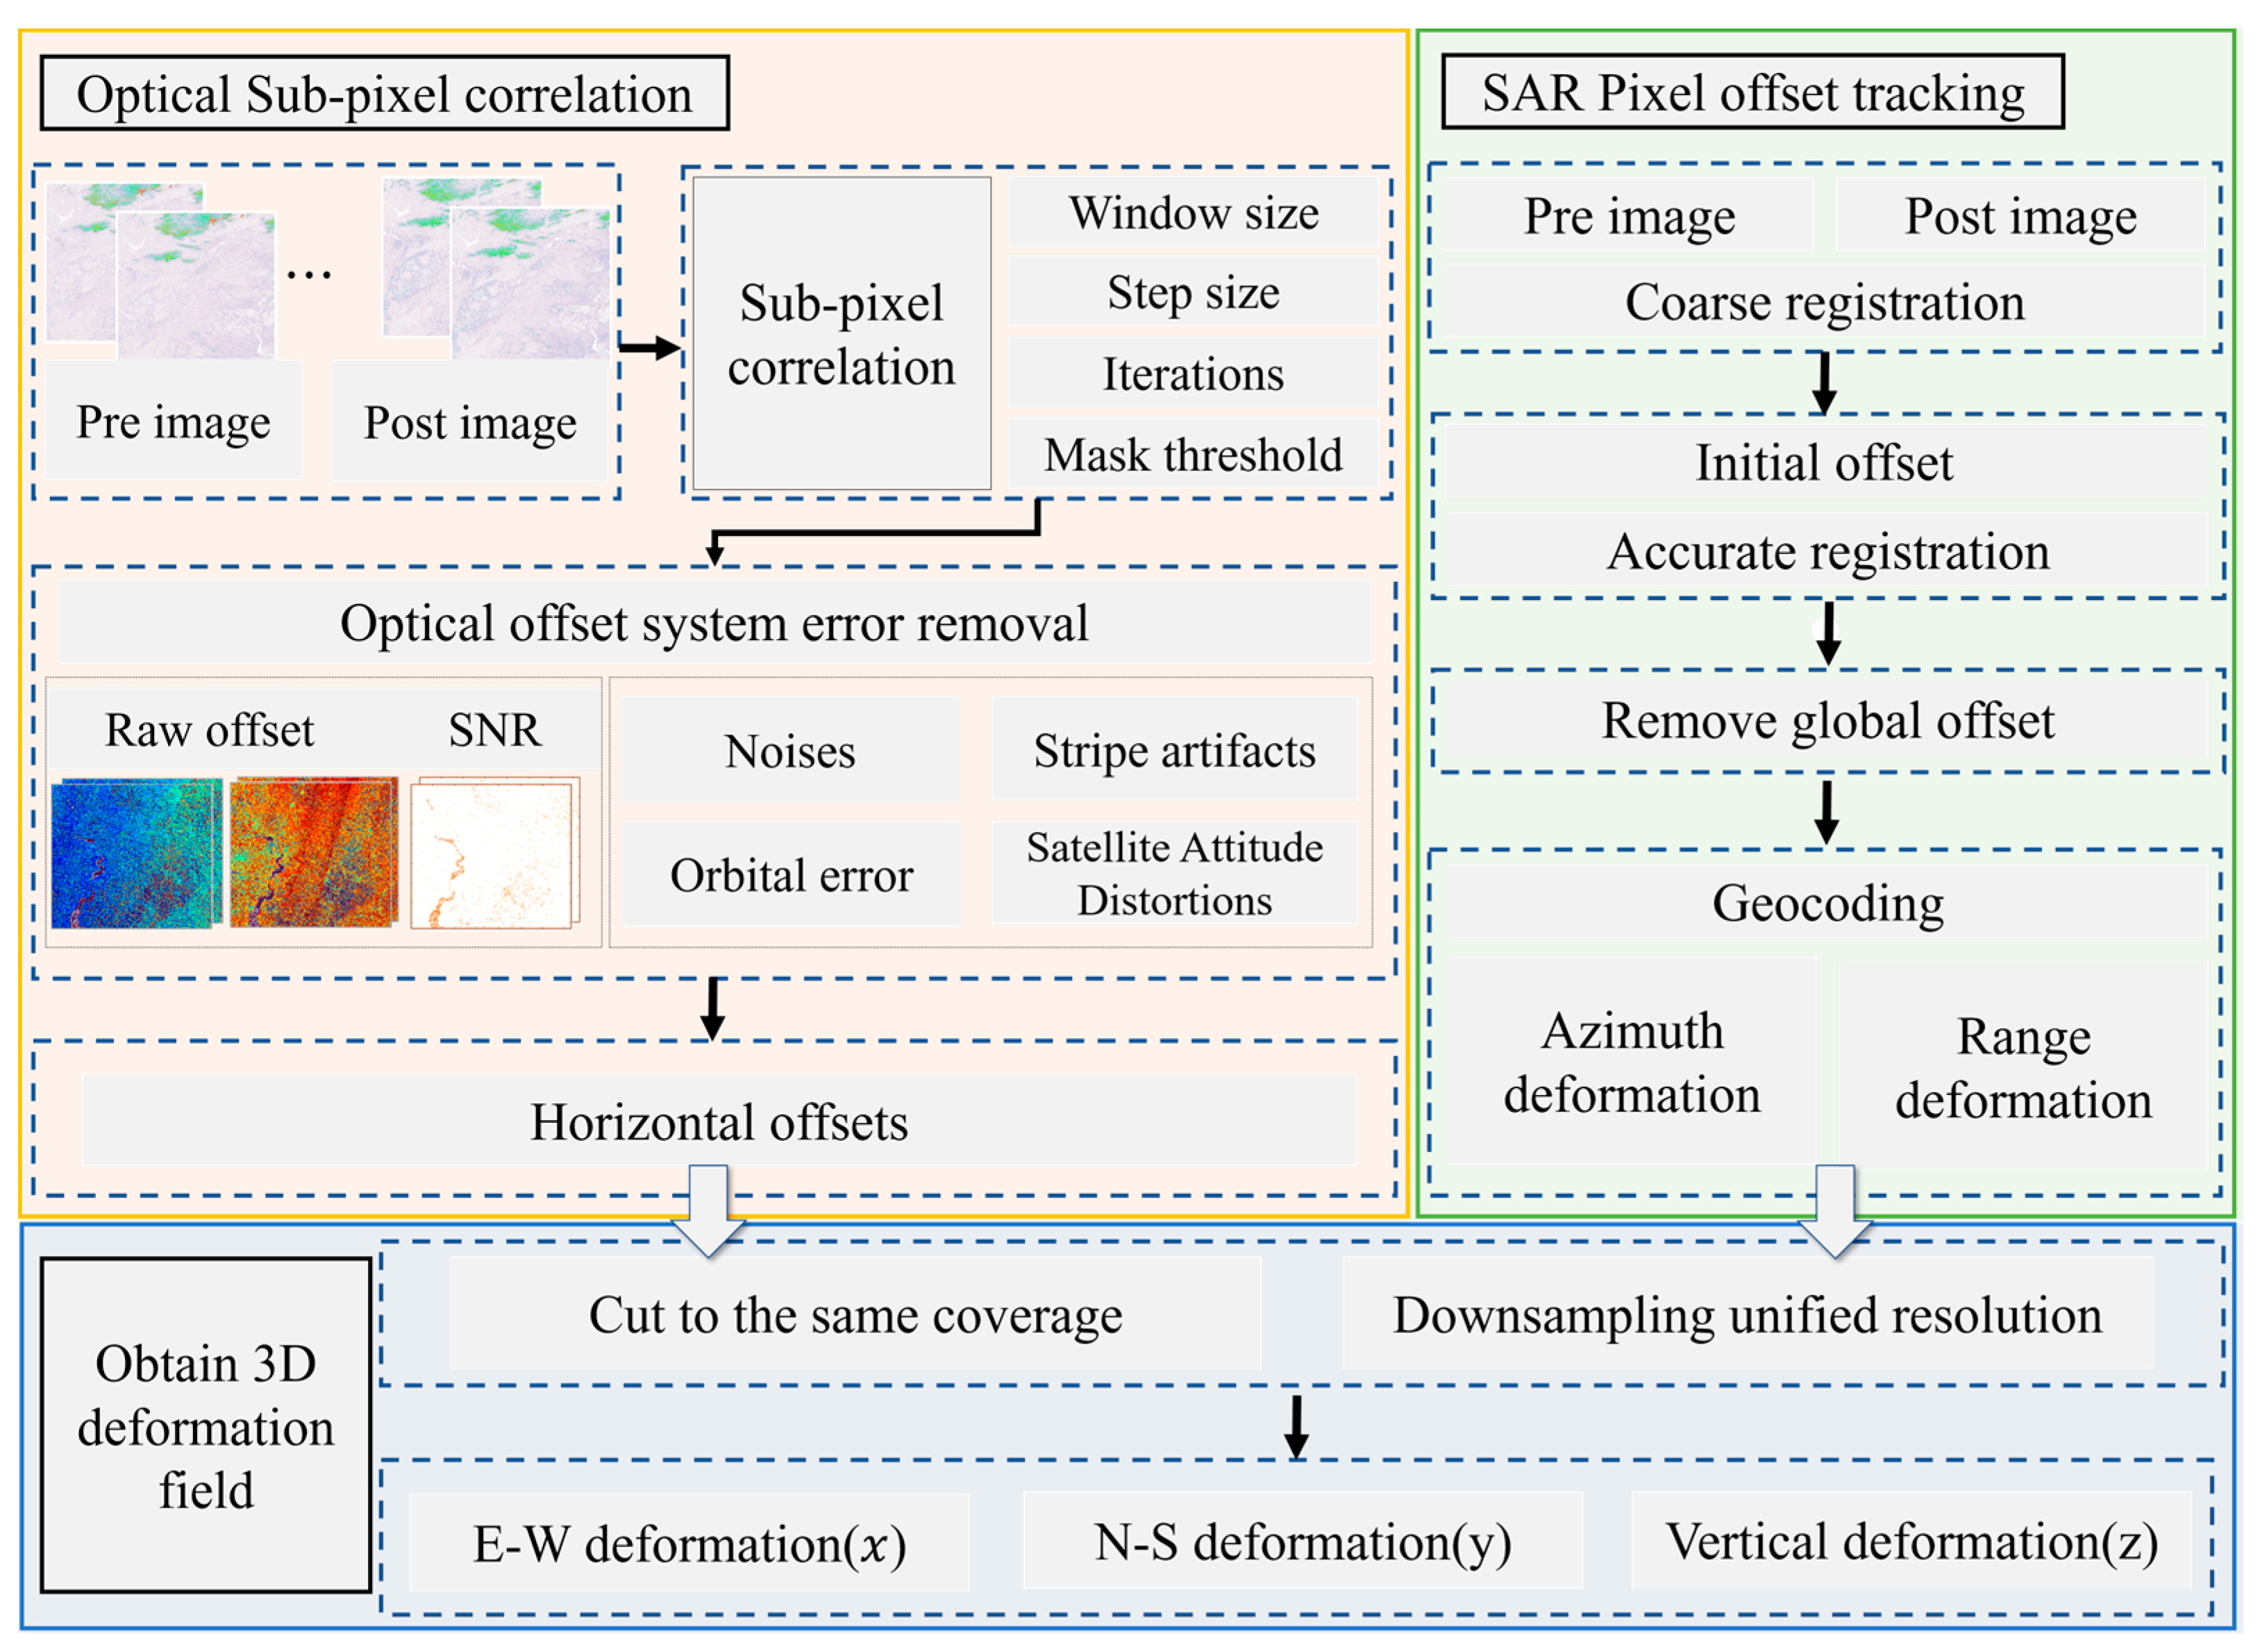
2. Methods and Processes

POT applies the registration method of amplitude correlation [8,9] and fringe visibility to overcome the limitations of InSAR in one-dimensional LOS monitoring [10]. POT has an accuracy of between 1/10 and 1/30 pixel size, so it can capture signals with large deformation magnitudes [11]. A common method for SAR offset acquisition is the correlation technique based on image intensity information. It uses the intensity relationship between two images and is suitable for monitoring large gradient deformations. The registration process involves coarse registration and sub-pixel registration. Coarse registration uses the Normalized Correlation Coefficient (NCC) method to determine the initial offset of the homonymous points in the image. After sub-pixel fine matching, the offset still contains the orbital error, terrain error, etc., which can be eliminated by polynomial fitting as well as terrain-assisted matching. The specific process is shown in Figure 1, and it includes four steps: (1) selecting master and slave images for coarse alignment; (2) accurate registration; (3) offset tracking and error removal; (4) geocoding, distance extraction, and azimuth deformation.
SPC is able to accurately capture the ground deformation in the horizontal directions (E-W, N-S). Its accuracy and reliability in wide-area and large-scale deformation detection [12] are ensured by the image sub-pixel correlation matching algorithm, which captures deformation information by comparing changes in surface texture information, with a theoretical accuracy of 1/20 to 1/50 pixel size [13]. Optical correlation has been widely applied to glacier velocity extraction [14], dune migration monitoring [15], landslide deformation measurement, and coseismic deformation extraction [16]. By providing accurate deformation monitoring in the horizontal dimension [17], optical imagery has become an important data source in the field of surface deformation monitoring. The mainstream optical image correlation computation platform is the COSI-Corr software, which is based on the sub-pixel phase correlation algorithm published by the California Institute of Technology (http://www.tectonics.caltech.edu, accessed on 26 February 2023). The main process is shown in Figure 1 and includes (1) the selection of master–slave image pairs; (2) pre-processing and sub-pixel correlation matching; (3) post-processing and error post-processing; (4) coordinate transformation and output of east–west and north–south deformations.
Processed by POT and SPC, respectively, SAR and optical images provide an accurate 2D deformation field. However, the single-observation geometry of SAR and optical imaging cannot obtain the complete three-dimensional deformation alone. Combining ascending and descending SAR data [18] and multi-directional D-InSAR observations [19] with different incident angles and azimuth angles can capture the 3D deformation. Nevertheless, the near-polar orbit operation mode of the SAR satellite limits its sensitivity to north–south deformation signals [20]. Thus, fusing SAR and optical offsets is an important way to estimate the 3D deformation. The 3D deformation field offers key information on the seismogenic structure and deformation magnitude [21]. The offsets from optical and SAR images can be fused to generate the 3D deformation field by using the weighted least-squares method as follows:
P 1 0 0 0 1 0 sin α cos β sin α sin β cos α sin β cos β 0 x y z = P d e w d n s d r a n d a z i
where α and β represent the incident angle and azimuth angle of the SAR sensor, respectively. x , y , and z are the E-W, N-S, and vertical deformations, respectively. P is the weight matrix. We consider the mean square error of the stable region to determine the weight (excluding null values and outliers). d e w , d n s , d r a n , and d a z i are E-W, N-S, range, and azimuth deformations, respectively.
Equation (1) can be written in the form of a matrix:
P A X = P L
Using the weighted least-squares method to calculate Equation (2), the 3D deformation field can be obtained as follows:
X = A T P A 1 A T P L
SAR and optical images have different spatial resolutions and coverages, so we have to unify the spatial resolution and coverage before estimating the three-dimensional deformation, as shown in Figure 1.

3. Data Processing

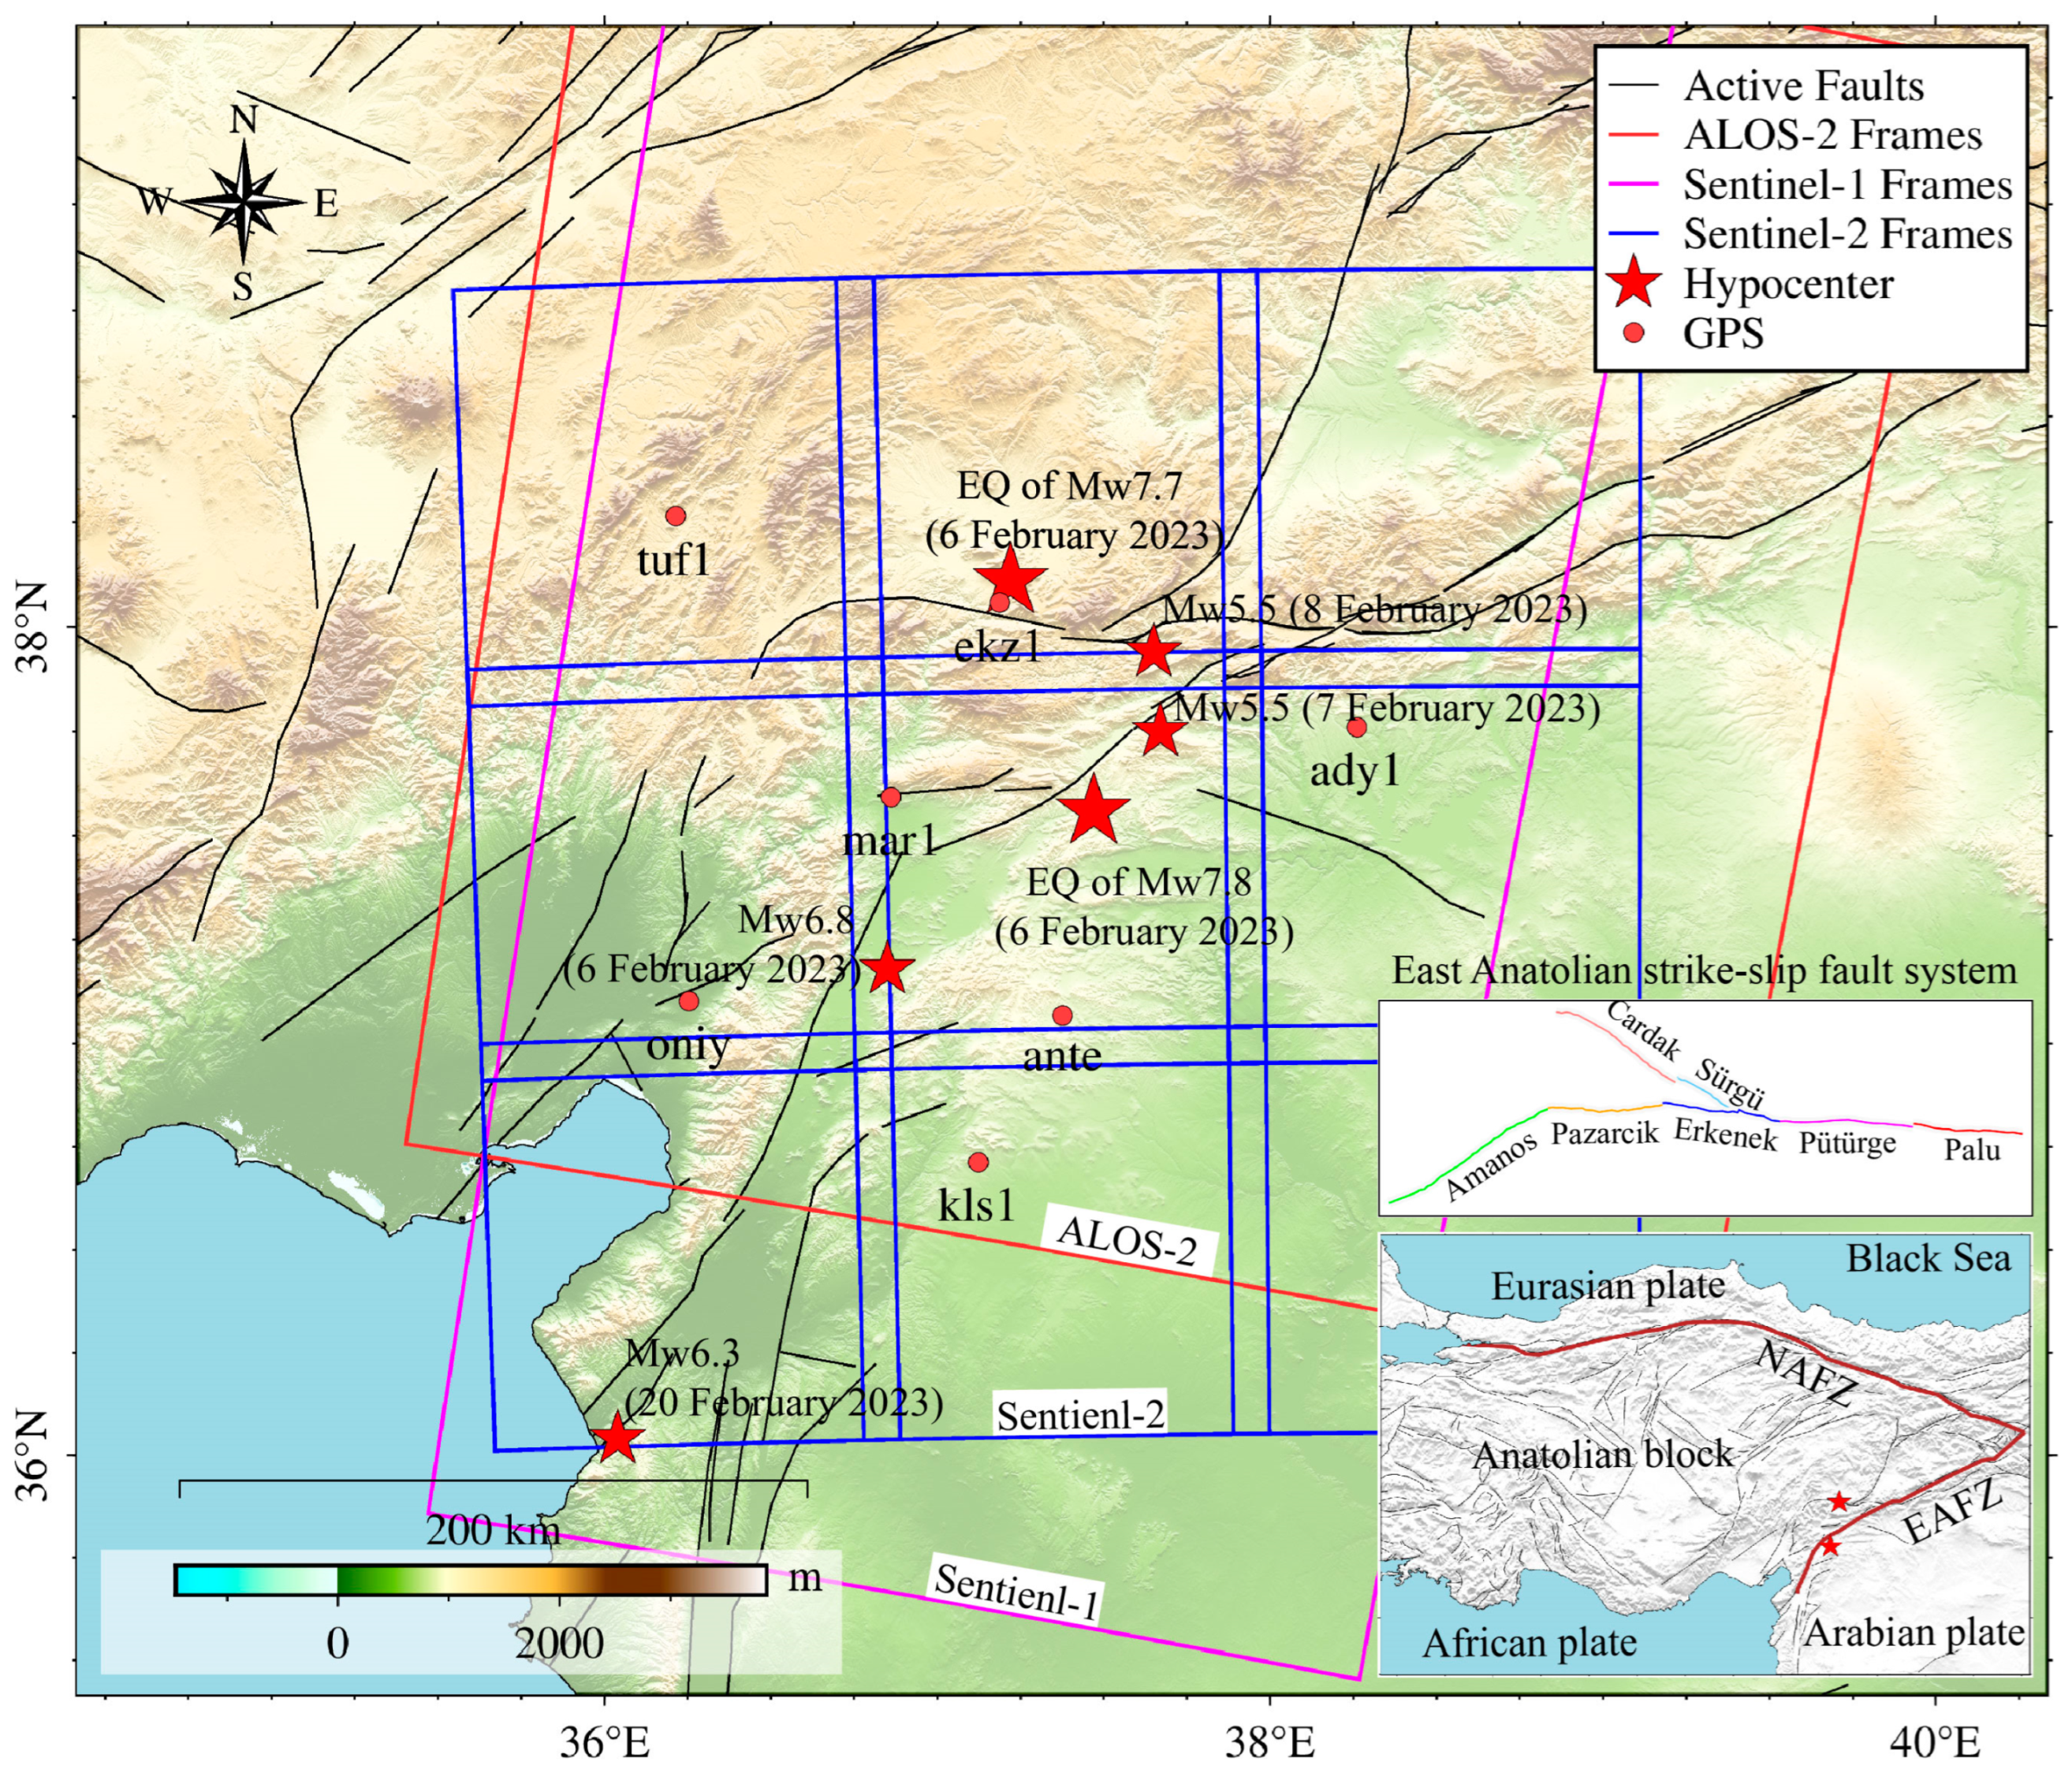
3.1. Geodynamic Setting of the Study Area

Turkey is highly prone to earthquakes due to its location at the intersection of multiple tectonic plates [22], including the Arabian, African, Eurasian, and Anatolian plates. The geological movements in Central Turkey are characterized by the counter-clockwise rotation and westward displacement of the Anatolian plate [23]. The Anatolian plate was formed and extruded by the North Anatolian Fault (NAF) and Eastern Anatolian Fault (EAF) and is affected by the collisional compression of the Arabian plate and the Eurasian plate and the subduction of the African plate [24]. The NAF and EAF together cause the westward compressional tectonic motion of the Anatolian plate, which is also controlled by the northwestward subduction of the Arabian plate. The counter-clockwise movement of the Arabian plate causes the Anatolian plate to move westward. The Anatolian plate is decoupled from the Eurasian continent along the right-slip NAF [25,26]. Seismic activity is particularly high around the NAF, especially in south-central Turkey [27]. The EAF, on the other hand [28], experiences fewer earthquakes [29,30]. However, the February 2023 Turkey earthquake sequence occurred mainly in the southwest segment of the EAF, with two mainshocks ≥ Mw 7.7 and four aftershocks (as of 20 February 2023). These are double-shock-type earthquakes of the swarm earthquake. The two mainshocks occurred near the Pazarcik Fault and the Cardak Fault, as shown in Figure 2.

3.2. Datasets

In this study, to obtain the 3D deformation field of the Turkish earthquake, we used three datasets: Sentinel-1 C-band data in Terrain Observation by Progressive Scans (TOPS) mode, ALOS-2 L-band data in Scanning SAR (ScanSAR) mode, and optical image data from the Sentinel-2 satellite in the 8-band. GPS data were used to verify the deformation trends. The spatial coverage of these images is shown in Figure 2.
The Sentinel series comprises two satellites, A/B, in repetitive orbits. Sentinel-2 carries the Multi-Spectral Imager (MSI) in push-sweep imaging mode with a spatial resolution of up to 10 m across 13 multi-spectral bands. The near-infrared band (Band 8) has the widest bandwidth (115 nm), which is more suitable for surface deformation monitoring than several other bands (Bands 2/3/4) at the equivalent resolution [31]. The Sentinel-1 satellite is equipped with a C-band SAR sensor with four imaging modes. All Sentinel-1/2 image data are available from the Copernicus Center managed by the European Commission (https://www.copernicus.eu/en, accessed on 22 March 2023). ALOS-2 is an L-band SAR satellite, and its data can be obtained from the Japan Aerospace Exploration Agency.
Sentinel-2 images excel in capturing horizontal deformation. The ALOS-2 satellite is sensitive to azimuth deformation signals. To obtain a complete 3D deformation field for this seismic sequence, we combined Seninel-2 (Band 8) optical data (9 covers) with the SAR data from Seninel-1 and ALOS-2 to calculate the 3D deformation. The satellite image data information is shown in Table 1.

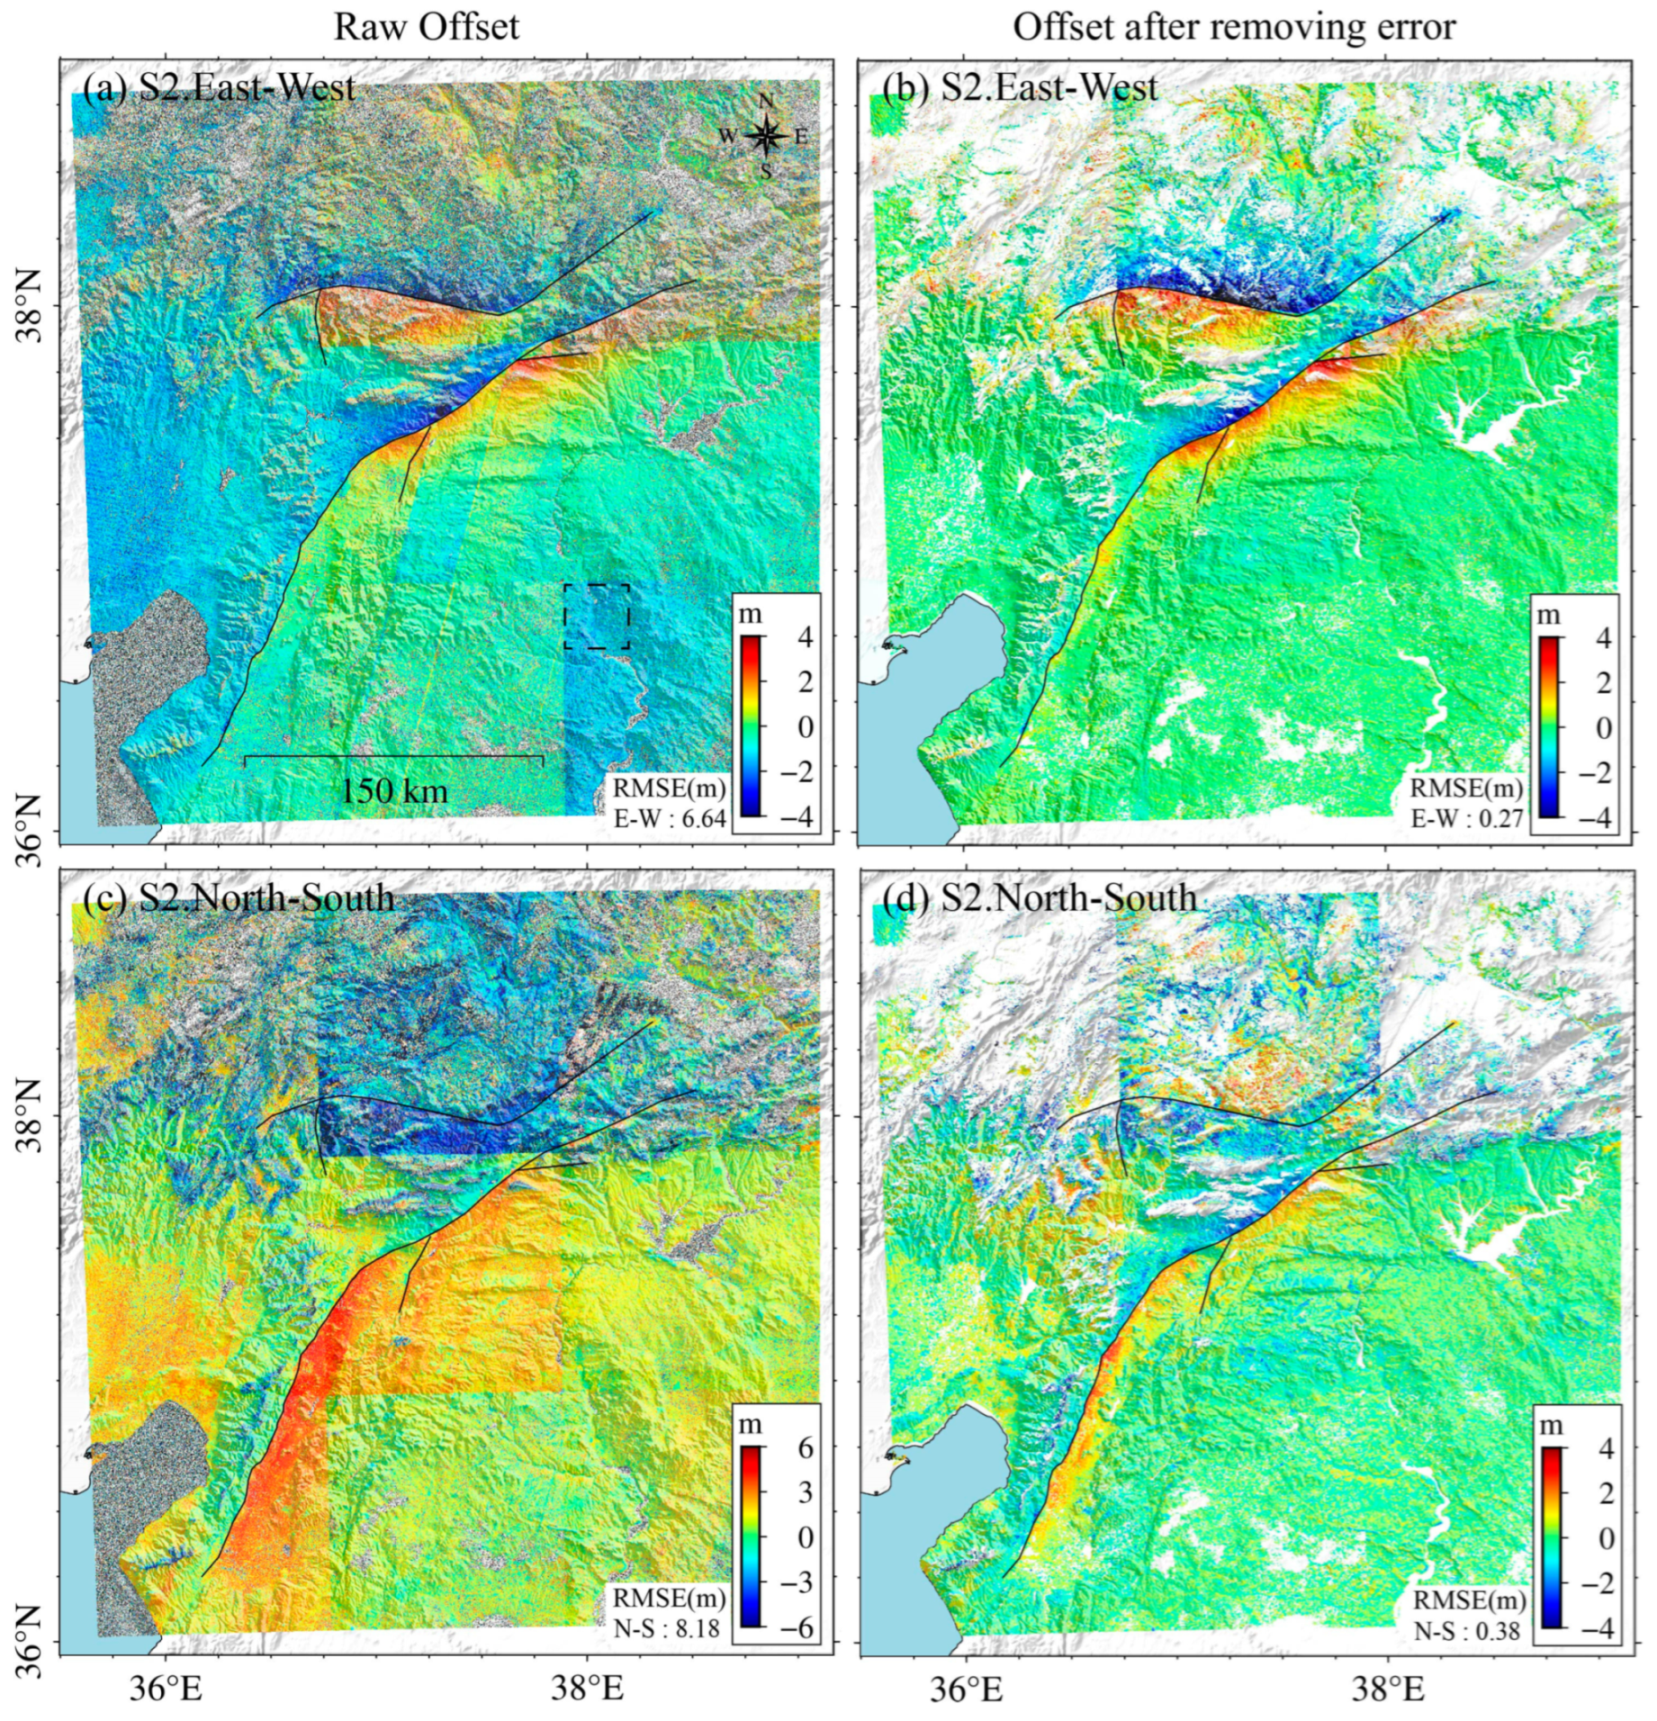
3.3. Optical Image Processing

We selected Sentinel-2 8-band images with minimal cloud interference acquired before and after the strong earthquake for the experiment. Using the COSI-Corr software, we processed these data based on SPC. The processing parameters are as follows: initial sliding window of 64 × 64, final sliding window of 32 × 32, move step size of 3 pixels (30 m), 2 iterations, and mask threshold of 0.90. The optical offset results cover the whole earthquake sequence but have significant decorrelation noise, orbital error, stripe artifacts, and satellite attitude distortions (Figure 3a,c), which need further processing.
This earthquake occurred in February, so the optical images were heavily disturbed by snow and cloud cover, resulting in a large amount of decorrelation noise on the northern side of the Cardak Fault, which can be removed by setting a signal-to-noise ratio threshold. The Sentinel-2 image without rigorous ortho-rectification and geometric correction will introduce an orbital error, and they can be eliminated by establishing a polynomial surface fitting model. The linear stripe artifacts that show a uniform distribution along the orbital direction can be canceled by mean-sum subtraction [32]. The satellite attitude distortions uniformly distributed along the cross-track direction can be reduced by using the improved mean subtraction method. The initial offset fields in Figure 3a,c display jumps in the individual inter-coverage errors, which are caused by discontinuities in the acquisition time of each image pair.
After removing the errors, the optical offset results contain only the deformations caused by the two strong earthquakes, with positive values denoting the east and north deformation and negative values denoting the west and south deformations. The north–south offset is disturbed by the terrain shadow, and the interpretation of the overall deformation is not affected. The deformation field of the second Mw 7.7 earthquake is weakened to a certain due to interference by snow and clouds, resulting in a signal loss on both sides of the fault when the decoherence point is removed. By splicing the optical offset results of 9 coverages (the overlap area was averaged), we found the rupture range and displacement magnitude caused by the two strong earthquakes. The two strong earthquakes have obvious left-lateral strike-slip characteristics, as shown in Figure 3b,d. We assume that the deformation in the far-field region is close to 0. For the selected areas, the root-mean-square error (RMSE) values of the east–west and north–south deformations (as shown in the black rectangle in Figure 3a) are 0.27 m and 0.38 m, respectively, meeting the accuracy level of SPC.

3.4. SAR Image Processing

We used GAMMA software to process the Sentinel-1 data and ALOS-2 data to extract the range and azimuth offsets. For the Sentinel-1 data, we first coarsely registered the data and set the multi-look ratio as 20:4 (range × azimuth) to suppress noise. The search window size was 300 × 60, and the sliding step size was 20 and 4 pixels. The 30 m resolution digital elevation model was used to correct the terrain phase component. To obtain a high signal-to-noise ratio in the interferogram, we used the improved Goldstein filtering method to filter the interferogram [33]. Polynomial fitting was employed to remove the offsets caused by orbital errors. After that, the results were geocoded. For ALOS-2 data, we set the multi-look ratio as 3:16 (range × azimuth), the search window size as 60 × 320, and the sliding step size as 3 and 16 pixels.
The results show that the azimuth offset of Sentinel-1 is seriously disturbed by ionospheric errors, but the range offset captures the deformation characteristics of the ruptured fault. The fault rupture trend and deformation magnitude align with the offset obtained from Sentinel-2 optical images. Combining the range offset with the optical offset can improve the accuracy of the 3D deformation estimation. In addition, introducing ALOS-2 data can compensate for the defects of Sentinel-1. Thus, we did not consider the Sentinel-1 azimuth offset. We selected the far-field region (the black rectangle in Figure 4a) to calculate the RMSE and obtained 0.08 m. The results for the ALOS-2 offset are 0.15 m and 0.22 m for the range and azimuth offsets, respectively, meeting the POT accuracy level.

4. Coseismic 3D Deformation Field

4.1. 3D Deformation Solution

Since SAR and optical images have different coverages and spatial resolutions, we used the overlapping area of optical and SAR data as the cutting boundary, cut it to the same coverage area, and downsampled them to obtain the same resolution (60 m) for the data fusion calculation (Figure 5a–e). We used the optical images to capture the horizontal deformation and combined it with the offset of the SAR data to generate the 3D deformation of the Turkey earthquake sequence using Equation (3) (Figure 5f–h).
The results show that the two left-lateral strike-slip earthquakes caused surface ruptures spanning over 200 km. The Mw 7.8 earthquake caused ruptures longer than 300 km and deformations of more than 5 m on both sides of the fault. The vertical deformation is small. The western end of the north side of the Mw 7.7 earthquake fault has some subsidence. The deformation field suggests that the displacements induced by these two strong earthquakes are predominant in the east–west direction.

4.2. Accuracy Verification

We used GPS data to assess the reliability of the 3D deformation field [34,35], as there are some GPS stations distributed in the vicinity of the earthquake faults in Turkey. Since GPS data provide reliable results for the horizontal axis only, we focused on comparing the deformation trends. To evaluate the system error removal and the accuracy of the 3D deformation calculation, we collected the GPS data from 7 sites (GPS data provided by TUSAGA-Aktif system, https://www.tusaga-aktif.gov.tr/, accessed on 14 February 2023) around the fault and within the coverage of ALOS-2 and Sentinel-1/2. We extracted the displacements caused by the earthquake from the GPS observations; Sentinel-1/2 and ALOS-2 were not able to separate the deformations caused by the two earthquakes, so we combined the deformations observed by GPS and plotted them as vectors to compare with the horizontal displacement vectors, as shown in Figure 6. We found good agreement between the vectors obtained by GPS (red vectors in Figure 6a) and the horizontal vectors (black vectors in Figure 6a). The offsets at the ante and tuf1 points were not compared due to residual terrain-shading errors and missing data. GPS data also show no large vertical deformations (Figure 6b). The results demonstrate that fusing optical and SAR data is effective in generating the 3D deformation fields, and the observations from both types of data capture the surface motion signal well.

5. Discussion

5.1. Three-Dimensional Deformation Characteristics

The generated coseismic 3D deformation field shows that the Mw 7.8 earthquake ruptured four segments of the EAF, spanning over 300 km from south to north: Pazarcik, Erkenek, Pütürge, and Amanos. The west and east parts of the seismogenic fault move southwest and northeast, respectively (Figure 5h), showing a left-slip rupture feature. The analysis of the east–west horizontal deformation profile shows that the horizontal deformation is concentrated in the near-field area of the Pazarcik and Erkenek segments, with cross-fault deformation volumes reaching 6.2 m and 5.7 m, respectively. The vertical deformation reveals a predominant uplift in the near-field area on the east side of the Pazarcik and Erkenek segments, with a maximum value of 0.8 m, indicating that the earthquake had a thrust component. The 3D deformation shows that the rupture is dominated by a left-lateral strike-slip with a thrust component, consistent with the focal mechanism from the GCMT (sliding angle of 11 degrees). Nalbant et al. [36] analyzed the regional Coulomb stress changes and found that the two seismic gaps on the EAF, namely, the Pazarcik and Erkenek segments, experienced a large stress increase in 2002. They reported that these seismic gaps have the potential to produce earthquakes of magnitude 7.3 or above. The occurrence of the Mw 7.8 earthquake confirmed this speculation.
The Mw 7.7 earthquake in the earthquake sequence ruptured three secondary faults on the west side of the EAF, including the nearly east–west-trending Cardak Fault, the northeast-trending Dogansehir Fault, and a 30 km nearly north–south-trending segment that had not ruptured previously. The total rupture length is more than 200 km. The horizontal deformation shows that the earthquake was characterized by a left-lateral strike-slip rupture, with the south and north parts of the seismogenic fault moving southeastward and northwestward, respectively (Figure 5h). The horizontal deformation is most pronounced in the near-field area of the Cardak and Dogansehir segments, with the cross-fault deformation of the Cardak segment reaching 8.1 m. The vertical deformation shows subsidence in the near-field area to the northwest of the Cardak segment, with a value of 0.7 m. The 3D deformation field shows that the earthquake rupture is dominated by a left-lateral strike-slip with a normal dip-slip component, which aligns with the focal mechanism (slip angle of −8 degrees) given by GCMT.
We analyzed six profiles from the horizontal deformation, as shown in Figure 7g. The surface deformation is mainly in the E-W direction. The new rupture segment resulting from the Mw 7.8 earthquake shows two jumps in profile F-F1, with over 3.2 m deformation in the E-W direction (Figure 7f). Additionally, profiles A-A1 and B-B1 show that the Mw 7.7 earthquake caused 7.8 m and 5 m deformations in the E-W direction, respectively (Figure 7a,b). Profile E-E1 shows that the Mw 7.8 earthquake caused over 5.8 m E-W deformation (Figure 7e).

5.2. Fusion of Optical and SAR Data

Fusing SAR and optical offsets is an important way to estimate 3D deformation. However, the accuracy of the obtained 3D deformation can be limited by the quality of SAR and optical data, original image resolution, system error removal, and the determination of weight. Using the Sentinel-1 images in TOPS mode, we can obtain high-precision range offsets. The ALOS-2 images in ScanSAR mode are sensitive to deformation in the azimuth direction. Combining these two data sources offers high-precision range and azimuth offsets. Image geodesy offers advantages over traditional methods, allowing for large-scale, long-term, and high-accuracy observations of the Earth. The optical satellite has a short revisit period and can provide a large amount of archive data, compensating for the deformation that large terrain undulations and terrain shadows will mask. Multi-coverage optical images can also meet the monitoring requirements of wide-area deformation monitoring [37]. The offsets of multiple coverages can be spliced after systematic error removal. With the advances made in removing remote sensing satellite system errors, the rapid capturing of surface deformation has become possible. Image geodesy has become an important method for deformation monitoring, particularly in the case of large-scale deformations caused by earthquakes, landslides, and other disasters [38,39].

6. Conclusions

In this study, the POT and SPC methods were used to extract the coseismic deformation field of the February 2023 Turkey earthquake sequence. The sub-pixel-level horizontal deformation was obtained from optical images, and the range and azimuth deformations were extracted from SAR images. These offsets were fused by the weighted least-squares method to generate a 3D deformation field. The results show the following: (1) Fusing SAR and optical images can reveal the large and complex rupture and surface deformation caused by the Turkey earthquake. Multi-coverage optical images can be used for monitoring surface deformation over a large area. The optical image offsets are susceptible to interference from topographic shadows, particularly in the N-S offset. The combination of Sentinel-1 and ALOS-2 provides excellent range and azimuthal observations. (2) The generated coseismic 3D deformation field shows that the Mw 7.8 earthquake ruptured four segments of the EAF, with a cross-fault deformation of over 5 m. The Mw 7.7 earthquake ruptured three secondary faults on the west side of the EAF, with cross-fault deformation exceeding 8 m. (3) The two ≥ Mw 7.7 earthquakes were both left-lateral strike-slip earthquakes, causing predominant E-W surface deformation and slight vertical deformation. These findings can be used to constrain sliding inversion models, evaluate dynamic stress changes, analyze the spatial location as well as the intensity of the earthquake source, and understand the geometric properties of the seismogenic fault. Fusing SAR and optical images enables the rapid acquisition of deformation signals in geohazard monitoring, especially for hazards with large deformation gradients and rupture areas.

Author Contributions

Conceptualization, Q.A. and G.F.; funding acquisition, G.F.; methodology, Q.A. and G.F.; writing—original draft, Q.A.; writing—review and editing, Q.A., G.F., L.H., Z.X., H.L., X.W. and J.W. All authors have read and agreed to the published version of the manuscript.

Funding

This work was supported by the Natural Science Foundation of Hunan Province (2021JJ30807) and the National Natural Science Foundation of China (No. 42174039).

Data Availability Statement

The Sentinel-1/2 data used in this study are copyrighted by the European Space Agency (http://scihub.copernicus.eu/dhus, accessed on 1 March 2023). The moment tensor solution is from the Global Centroid Moment Tensor (http://www.globalcmt.org/CMTsearch.html, accessed on 1 April 2023). The GAMMA commercial software was obtained from https://www.gamma-rs.ch/software, accessed on 22 February 2023.

Acknowledgments

The authors would like to thank the European Space Agency (ESA) for providing the free Sentinel-1/2 data. The figures were generated by the Generic Mapping Tools (GMT 6) software package.

Conflicts of Interest

The authors declare no conflict of interest.

References

  1. Ozawa, S.; Nishimura, T.; Suito, H.; Kobayashi, T.; Tobita, M.; Imakiire, T. Imakiire. Coseismic and postseismic slip of the 2011 magnitude-9 tohoku-oki earthquake. Nature 2011, 475, 373–376. [Google Scholar] [CrossRef]
  2. Bechor, N.B.D.; Zebker, H.A. Measuring two-dimensional movements using a single insar pair. Geophys. Res. Lett. 2006, 33, L16311. [Google Scholar] [CrossRef]
  3. He, L.; Feng, G.; Hu, J.; Xu, W.; Liu, J.; Li, Z.; Feng, Z.; Wang, Y.; Lu, H. Surface displacement and source model separation of the two strongest earthquakes during the 2019 ridgecrest sequence: Insights from insar, gps, and optical data. J. Geophys. Res. Solid Earth 2022, 127, e2021JB022779. [Google Scholar] [CrossRef]
  4. Simons, M.; Fialko, Y.; Rivera, L. Coseismic deformation from the 1999 mw 7.1 hector mine, california, earthquake as inferred from insar and gps observations. Bull. Seismol. Soc. Am. 2002, 92, 1390–1402. [Google Scholar] [CrossRef]
  5. Scherler, D.; Leprince, S.; Strecker, M.R. Glacier-surface velocities in alpine terrain from optical satellite imagery—Accuracy improvement and quality assessment. Remote Sens. Environ. 2008, 112, 3806–3819. [Google Scholar] [CrossRef]
  6. Strozzi, T.; Luckman, A.; Murray, T.; Wegmuller, U.; Werner, C. Glacier motion estimation using sar offset-tracking procedures. IEEE Trans. Geosci. Remote Sens. 2002, 40, 2384–2391. [Google Scholar] [CrossRef]
  7. Zinke, R.; Hollingsworth, J.; Dolan, J.F.; Van Dissen, R. Three-dimensional surface deformation in the 2016 mw7.8 kaikōura, new zealand, earthquake from optical image correlation: Implications for strain localization and long-term evolution of the pacific-australian plate boundary. Geochem. Geophys. Geosyst. 2019, 20, 1609–1628. [Google Scholar] [CrossRef]
  8. Gray, A.; Short, N.; Mattar, K.; Jezek, K. Velocities and flux of the filchner ice shelf and its tributaries determined from speckle tracking interferometry. Can. J. Remote Sens. 2014, 27, 193–206. [Google Scholar] [CrossRef]
  9. Rott, H.; Stuefer, M.; Siegel, A.; Skvarca, P.; Eckstaller, A. Mass fluxes and dynamics of moreno glacier, southern patagonia icefield. Geophys. Res. Lett. 1998, 25, 1407–1410. [Google Scholar] [CrossRef]
  10. Hu, J.; Li, Z.; Ding, X.; Zhu, J.; Zhang, L.; Sun, Q. Zhang and Q. Sun. Resolving three-dimensional surface displacements from insar measurements: A review. Earth-Sci. Rev. 2014, 133, 1–17. [Google Scholar] [CrossRef]
  11. Michel, R.; Avouac, J.-P.; Taboury, J. Measuring near field coseismic displacements from sar images: Application to the landers earthquake. Geophys. Res. Lett. 1999, 26, 3017–3020. [Google Scholar] [CrossRef]
  12. Van Puymbroeck, N.; Michel, R.; Binet, R.; Avouac, J.P.; Taboury, J. Measuring earthquakes from optical satellite images. Applied optics. Appl. Opt. 2000, 39, 3017–3020. [Google Scholar] [CrossRef] [PubMed]
  13. Leprince, S.; Barbot, S.; Ayoub, F.; Avouac, J.-P. Automatic and precise orthorectification, coregistration, and subpixel correlation of satellite images, application to ground deformation measurements. IEEE Trans. Geosci. Remote Sens. 2007, 45, 1529–1558. [Google Scholar] [CrossRef]
  14. Heid, T.; Kääb, A.E. Evaluation of existing image matching methods for deriving glacier surface displacements globally from optical satellite imagery. Remote Sens. Environ. 2012, 118, 339–355. [Google Scholar] [CrossRef]
  15. Hermas, E.; Leprince, S.; El-Magd, I.A. Retrieving sand dune movements using sub-pixel correlation of multi-temporal optical remote sensing imagery, northwest sinai peninsula, egypt. Remote Sens. Environ. 2012, 121, 51–60. [Google Scholar] [CrossRef]
  16. Taylor, M.H.; Leprince, S.; Avouac, J.-P.; Sieh, K. Detecting co-seismic displacements in glaciated regions: An example from the great november 2002 denali earthquake using spot horizontal offsets. Earth Planet. Sci. Lett. 2008, 270, 209–220. [Google Scholar] [CrossRef]
  17. Ding, C.; Feng, G.; Liao, M.; Tao, P.; Zhang, L.; Xu, Q. Displacement history and potential triggering factors of baige landslides, china revealed by optical imagery time series. Remote Sens. Environ. 2021, 254, 112253. [Google Scholar] [CrossRef]
  18. Wright, T.J. Toward mapping surface deformation in three dimensions using insar. Geophys. Res. Lett. 2004, 31, 169–178. [Google Scholar] [CrossRef]
  19. Jung, H.-S.; Yun, S.-H.; Jo, M.-J. An improvement of multiple-aperture sar interferometry performance in the presence of complex and large line-of-sight deformation. IEEE J. Sel. Top. Appl. Earth Obs. Remote Sens. 2015, 8, 1743–1752. [Google Scholar] [CrossRef]
  20. Hu, J.; Li, Z.; Zhu, J.; Ren, X.; Ding, X. Inferring three-dimensional surface displacement field by combining sar interferometric phase and amplitude information of ascending and descending orbits. Sci. China Earth Sci. 2010, 53, 550–560. [Google Scholar] [CrossRef]
  21. Fialko, Y.; Sandwell, D.; Simons, M.; Rosen, P. Three-dimensional deformation caused by the bam, iran, earthquake and the origin of shallow slip deficit. Nature 2005, 435, 295–299. [Google Scholar] [CrossRef] [PubMed]
  22. Gökkaya, K. Geographic analysis of earthquake damage in turkey between 1900 and 2012. Geomat. Nat. Hazards Risk 2016, 7, 1948–1961. [Google Scholar] [CrossRef]
  23. McClusky, S.; Balassanian, S.; Barka, A.; Demir, C.; Ergintav, S.; Georgiev, I.; Gurkan, O.; Hamburger, M.; Hurst, K.; Kahle, H.; et al. Global positioning system constraints on plate kinematics and dynamics in the eastern mediterranean and caucasus. J. Geophys. Res. 2000, 105, 5695–5719. [Google Scholar] [CrossRef]
  24. Dogru, F. The importance of atmospheric corrections on insar surveys over turkey case study of tectonic deformation of bodrum-kos earthquake. Pure Appl. Geophys 2020, 117, 5761–5780. [Google Scholar] [CrossRef]
  25. Lazos, I.; Sboras, S.; Pikridas, C.; Pavlides, S.; Chatzipetros, A. Geodetic analysis of the tectonic crustal deformation pattern in the north aegean sea, greece. Mediterr. Geosci. Rev. 2021, 3, 79–94. [Google Scholar] [CrossRef]
  26. Imamoglu, M.; Kahraman, F.; Cakir, Z.; Sanli, F.B. Ground deformation analysis of bolvadin (w. Turkey) by means of multi-temporal insar techniques and sentinel-1 data. Remote Sens 2019, 11, 1069. [Google Scholar] [CrossRef]
  27. Xu, J.; Liu, C.; Xiong, X. Xiong. Source process of the 24 january 2020 mw 6.7 east anatolian fault zone, turkey, earthquake. Seismol. Res. Lett. 2020, 91, 3120–3128. [Google Scholar] [CrossRef]
  28. Duman, T.Y.; Emre, Ö. The east anatolian fault: Geometry, segmentation and jog characteristics. Geol. Soc. Lond. Spec. Publ. 2013, 372, 495–529. [Google Scholar] [CrossRef]
  29. Dal Zilio, L.; Ampuero, J.-P. Earthquake doublet in Turkey and Syria. Commun. Earth Environ. 2023, 4, 71. [Google Scholar] [CrossRef]
  30. Gülerce, Z.; Shah, S.T.; Menekşe, A.; Özacar, A.A.; Kaymakci, N.; Çetin, K.Ö. Probabilistic seismic-hazard assessment for east anatolian fault zone using planar fault source models. Bull. Seismol. Soc. Am. 2017, 107, 2353–2366. [Google Scholar] [CrossRef]
  31. Lijia, H.; Guangcai, F.; Zhixiong, F.; Hua, G. Coseismic displacements of 2016 mw7. 8 kaikoura, new zealand earthquake, using sentinel-2 optical images. Acta Geod. Cartogr. Sin. 2019, 48, 339–351. [Google Scholar] [CrossRef]
  32. Michel, R.; Avouac, J.-P. Coseismic surface deformation from air photos: The kickapoo step over in the 1992 landers rupture. J. Geophys. Res. Solid Earth 2006, 111, B03408. [Google Scholar] [CrossRef]
  33. Li, Z.; Ding, X.; Huang, C.; Zhu, J.; Chen, Y. Improved filtering parameter determination for the goldstein radar interferogram filter. ISPRS J. Photogramm. Remote Sens. 2008, 63, 621–634. [Google Scholar] [CrossRef]
  34. Sudhaus, H.; Jónsson, S. Improved source modelling through combined use of insar and gps under consideration of correlated data errors: Application to the june 2000 kleifarvatn earthquake, iceland. Geophys. J. Int. 2009, 176, 389–404. [Google Scholar] [CrossRef]
  35. Magen, Y.; Ziv, A.; Inbal, A.; Baer, G.; Hollingsworth, J. Fault rerupture during the July 2019 ridgecrest earthquake pair from joint slip inversion of insar, optical imagery, and gps. Bull. Seismol. Soc. Am. 2020, 110, 1627–1643. [Google Scholar] [CrossRef]
  36. Nalbant, S.S.; McCloskey, J.; Steacy, S.; Barka, A.A. Stress accumulation and increased seismic risk in eastern turkey. Earth Planet. Sci. Lett. 2002, 195, 291–298. [Google Scholar] [CrossRef]
  37. Necsoiu, M.; Leprince, S.; Hooper, D.M.; Dinwiddie, C.L.; McGinnis, R.N.; Walter, G.R. Monitoring migration rates of an active subarctic dune field using optical imagery. Remote Sens. Environ. 2009, 113, 2441–2447. [Google Scholar] [CrossRef]
  38. Bontemps, N.; Lacroix, P.; Doin, M.-P. Inversion of deformation fields time-series from optical images, and application to the long term kinematics of slow-moving landslides in Peru. Remote Sens. Environ. 2018, 210, 144–158. [Google Scholar] [CrossRef]
  39. Xiong, Z.; Feng, G.; Feng, Z.; Miao, L.; Wang, Y.; Yang, D.; Luo, S. Pre- and post-failure spatial-temporal deformation pattern of the baige landslide retrieved from multiple radar and optical satellite images. Eng. Geol. 2020, 279, 105880. [Google Scholar] [CrossRef]
Figure 1. The workflow for solving three-dimensional surface deformation by combining optical and SAR offsets.
Remotesensing 15 02656 g001
Figure 2. Overview of the study area and image coverage on a color-shaded elevation map. The red pentagram indicates the hypocenter of Turkey’s strong February 2023 earthquake sequence from GCMT. Black lines indicate active faults in the region, and the red circles are GPS stations in the region.
Remotesensing 15 02656 g002
Figure 3. Surface displacement by optical image sub-pixel correlation of Sentinel-2 data in the east–west and north–south directions. Images in (a,c) represent the initial offsets, and the black rectangle in (a) was selected to calculate RMSE. Images in (b,d) represent the offsets after removing the errors.
Remotesensing 15 02656 g003
Figure 4. Coseismic deformation obtained from Sentinel-1 (S1) and ALOS-2 (A2) images. Images in (a,b) represent the range offsets, and the image in (c) represents the azimuth offset. Black lines indicate seismogenic faults. The dotted rectangle in (a) was selected to calculate RMSE.
Remotesensing 15 02656 g004
Figure 5. Seismic deformation field of the Turkey earthquake sequence in February 2023. Images in (ae) represent the optical and SAR offsets with the same resolution and coverage. Images in (fh) represent the obtained 3D deformation field, and the vector in (h) represents the horizontal displacement.
Remotesensing 15 02656 g005
Figure 6. Comparison of the generated 3D deformation field with GPS vectors. (a) Horizontal deformation. Black arrows represent the horizontal vector in the 3D deformation field, and red arrows are the GPS vector. (b) Vertical deformation. The red vector represents uplift and blue arrow represents subsidence.
Remotesensing 15 02656 g006
Figure 7. The deformation along the profiles (a) A-A1, (b) B-B1, (c) C-C1, (d) D-D1, (e) E-E1, (f) F-F1. (g) Locations of these profiles.
Remotesensing 15 02656 g007
Table 1. Information for the selected SAR and optical data.
SensorMaster ImageCloudSlave ImageCloudFrame NumberData Processing Method
Sentinel-220 January 20230.0011 March 202316.88T37SBCSPC
25 January 20230.0751 March 20236.188T37SBB
25 January 20230.1061 March 20230.280T37SBA
10 January 20230.0189 February 20230.056T37SCC
25 January 20230.1651 March 20235.402T37SCB
20 January 20230.43819 February 20235.924T37SCA
13 November 20220.79416 February 202313.63T37SDC
22 January 20230.10521 February 20230.582T37SDB
22 January 202312.0816 February 20230.104T37SDA
Sentinel-129 January 202321 February 2023Frame 471 Path 21POT
29 January 202321 February 2023Frame 465 Path 21
29 January 202321 February 2023Frame 460 Path 21
ALOS-216 September 202217 February 2023Row 2850 Path 77
Disclaimer/Publisher’s Note: The statements, opinions and data contained in all publications are solely those of the individual author(s) and contributor(s) and not of MDPI and/or the editor(s). MDPI and/or the editor(s) disclaim responsibility for any injury to people or property resulting from any ideas, methods, instructions or products referred to in the content.

