Abstract
With the development of sensor technology and point cloud generation techniques, there has been an increasing amount of high-quality forest RGB point cloud data. However, popular clustering-based point cloud segmentation methods are usually only suitable for pure forest scenes and not ideal for scenes with multiple ground features or complex terrain. Therefore, this study proposes a single-tree point cloud extraction method that combines deep semantic segmentation and clustering. This method first uses a deep semantic segmentation network, Improved-RandLA-Net, which is developed based on RandLA-Net, to extract point clouds of specified tree species by adding an attention chain to improve the model’s ability to extract channel and spatial features. Subsequently, clustering is employed to extract single-tree point clouds from the segmented point clouds. The feasibility of the proposed method was verified in the Gingko site, the Lin’an Pecan site, and a Fraxinus excelsior site in a conference center. Finally, semantic segmentation was performed on three sample areas using pre- and postimproved RandLA-Net. The experiments demonstrate that Improved-RandLA-Net had significant improvements in Accuracy, Precision, Recall, and F1 score. At the same time, based on the semantic segmentation results of Improved-RandLA-Net, single-tree point clouds of three sample areas were extracted, and the final single-tree recognition rates for each sample area were 89.80%, 75.00%, and 95.39%, respectively. The results demonstrate that our proposed method can effectively extract single-tree point clouds in complex scenes.
1. Introduction
Forests are an important natural resource on Earth, and their management is crucial for both human well-being and ecological health [1]. Forest inventory and the extraction of forest structural parameters are the primary tasks in forest management. In recent years, remote-sensing technology has developed rapidly, and the use of unmanned aerial vehicles (UAVs) to collect remote-sensing images has gradually become the main way to obtain forest remote-sensing data. UAV-based remote-sensing image acquisition platforms have the characteristics of low cost and easy portability [2], and researchers can obtain data from forest land in the study area on a large scale in a short period of time [3]. However, traditional remote-sensing image data can only obtain horizontal structural information and cannot obtain information on the vertical structure level [4], which is crucial for extracting various single-tree parameters. Currently, three-dimensional point cloud data are widely used in forest inventory. Compared with 2D remote-sensing image data, point cloud data provide richer three-dimensional information, which can effectively collect the morphological characteristics of trees and improve the accuracy of forest inventory. Therefore, the collection of high spatial resolution aerial three-dimensional remote-sensing data based on unmanned aerial UAV platforms have gradually become an effective technology for conducting forest surveys, thanks to its wide coverage and regular data collection cycles [5].
In forest inventory, if high-precision single-tree point cloud information can be separated from a large amount of point cloud data, it will be of great significance for subsequent extraction of single-tree structural parameters and provide strong support for subsequent forest biomass inversion and forest three-dimensional model construction [6]. Existing point cloud-based single-tree extraction methods are generally divided into two categories: one is a raster-based single-tree extraction method, which converts raw point cloud data into rasterized images and usually requires the generation of CHM or DSM models to find local maxima and treat them as the tops of trees. Currently, raster-based point cloud segmentation methods are generally single-tree point cloud extraction algorithms that are improved for specific application scenarios; those commonly used include the watershed algorithm [7], region growing algorithm [8], their improved algorithms [9,10,11], etc. Although raster-based methods are relatively mature and fast, they cannot make full use of the three-dimensional characteristics of point clouds and are easily affected by nontree objects during single-tree segmentation, leading to a decrease in detection accuracy [12].
The other type of method uses three-dimensional algorithms to directly extract single-tree point clouds, which can better utilize the three-dimensional characteristics of point clouds. Wang et al. (2008) [13] used voxel spacing algorithms to segment the entire study area into small research units using grid networks, realizing the structural analysis of forest point clouds in the vertical direction of the tree canopy and segmentation of three-dimensional single-tree point clouds. Reitberger et al. (2009) [14] used a combination of trunk detection and normalized segmentation algorithms to achieve three-dimensional segmentation of single trees, and compared with the standard watershed segmentation program, and the result was higher by 12% in the best case. Gupta et al. (2010) [15] improved the K-means [16] algorithm using external seed points and reduced height to initialize the clustering process achieving the extraction of single-tree point clouds. Hu et al. (2017) [17] proposed an adaptive kernel bandwidth Meanshift [18] algorithm, which realized single-tree point cloud segmentation of evergreen broadleaf forests. Ayrey et al. (2017) [19] proposed a layer stacking algorithm to slice the forest point cloud in layers at specific height intervals, obtain the single-tree contours in each layer and synthesize them, and finally obtain the complete single-tree point clouds. Tang et al. (2022) [20] proposed an optimized Meanshift algorithm that integrates both the red-green-blue (RGB) and luminance-bandwidth-chrominance model (i.e., YUV color space) for identifying oil tea fruit point clouds.
In summary, the current research on single-tree point cloud segmentation is constantly advancing, and its accuracy is continuously improving. However, most of these research methods are clustering-based and do not utilize the color information of point clouds, which is only applicable to pure forest scenes and has a narrow application range. Point cloud clustering usually uses only its characteristic attributes, such as density, distance, elevation, intensity, etc., to segment the point clouds with different attributes. Currently, the main point cloud clustering algorithms include OPTICS [21], Spectral Clustering [22], Meanshift, DBSCAN [23], K-means, etc. With the development of UAV data acquisition platforms and the widespread use of high-performance and large-capacity computers, the use of RGB point cloud data is becoming more and more common, and the quality of detail expression in complex scenes is also increasing. Currently, these high-quality point clouds only exist as visualization products, because clustering methods are unable to automatically learn the features of the data like deep learning does, thereby failing to effectively represent the complex relationships between the data. Therefore, there is an urgent need to explore deep learning methods for better performance when dealing with data such as RGB point clouds.
To address this issue, this paper combines the point cloud clustering algorithm Meanshift with the deep semantic segmentation network Improved-RandLA-Net to achieve single-tree extraction from RGB point clouds in complex scenes. This paper studies three experimental areas, which include Ginkgo data and Pecan data in Lin’an District, Hangzhou City, Zhejiang Province, China, as well as Fraxinus excelsior data from the Orlando Convention Center in the STPLS3D [24] dataset. All data are obtained from photogrammetry. Ultimately, our method achieved good results in different types of scenes. The innovative points of this paper are: (1) use of a single-tree point cloud extraction method based on deep semantic segmentation-clustering; and (2) the improvement of the point cloud semantic segmentation network RandLA-Net into Improved-RandLA-Net, which improves the accuracy of point cloud semantic segmentation.
2. Materials
2.1. Study Area Overview
The experimental areas are located in Lin’an District, Hangzhou City, Zhejiang Province (118°51′~119°52′E, 29°56′~30°23′N). Lin’an is located in the western part of Hangzhou City and has a central subtropical monsoon climate. The warm and humid conditions, abundant sunshine, plentiful rainfall, and distinct seasons are very favorable for plant growth. The area is characterized by a diverse range of plant species, including Ginkgo, Cinnamomum camphora, Lin’an Pecan, Liriodendron chinense, Zelkova serrata, Torreya jackii, and others. Based on the distribution of major tree species and differences in forest density in the study area, two experimental areas were selected for this study within the region, focusing on Ginkgo and Lin’an Pecan. Data were collected from Zhejiang A&F University Donghu Campus and Xiguping Forest Farm, as shown in Figure 1. In addition, a portion of the STPLS3D public dataset was selected as an experimental area to evaluate the effectiveness of the proposed method.
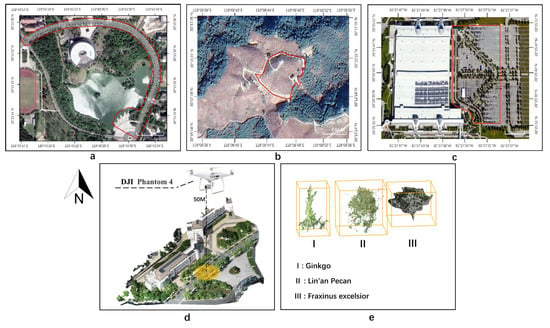
Figure 1.
(a–c) shows the geographical location and tree distribution of the three study areas; the red lines are the limit of the study areas. (d) Schematic diagram of data collection. (e) Schematic diagram of the single-tree sections of the three tree species.
In this paper, the experimental areas were divided into three, the Ginkgo dataset (Area 1), the Lin’an Pecan dataset (Area 2), and the Fraxinus excelsior data from the STPLS3D dataset (Area 3).
Area 1 was collected on 12 July 2022, on the campus of Zhejiang A&F University’s Donghu Campus under clear and well-lit conditions. Area 2 was collected on 9 October 2021, within the Lin’an Xiguping Forest Farm. All flights were conducted at a height of 50 m with a lateral overlap and longitudinal overlap of 85% under clear and well-lit conditions.
2.2. UAV Data Acquisition System
In this paper, we utilized the DJI Phantom 4 RTK drone as a data acquisition platform. This device provides real-time centimeter-level positioning data and possesses professional route planning applications. Additionally, equipped with a 20-megapixel RGB high-definition camera, it can provide high-precision data for complex measurement, mapping, and inspection tasks. Further details regarding the drone parameters can be found in Table 1.

Table 1.
UAV data acquisition system.
2.3. Dataset Production
The point cloud data in this paper were generated using the UAV mapping software Pix4Dmapper 4.8.4. Visual interpretation and manual labeling of corresponding tree point clouds within the study area were conducted using the point cloud processing software CloudCompare 2.13. and remote-sensing images. During the data set production process, only point clouds of the studied tree species in each experimental area were labeled, while other point clouds were labeled as background. In total, 157 ginkgo trees were obtained in Area 1, including 108 training data and 49 testing data; 166 lin’an pecan trees were obtained in Area 2, including 110 training data and 56 testing data; and 165 fraxinus excelsior trees were obtained in Area 3, including 100 training data and 65 testing data.
All datasets in this study were produced with reference to the Stanford3dDataset _v1.2_Aligned_Version format standard of the point cloud semantic segmentation public dataset S3DIS, and the point cloud files were txt files containing color and coordinate information (RGBXYZ format).
3. Methods
3.1. Overview
Figure 2 summarizes the entire experimental process, which includes the following steps:
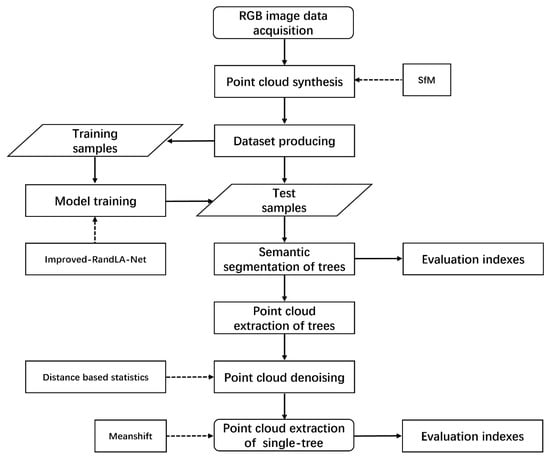
Figure 2.
Specific flow chart.
(1) Collected RGB image data and synthesized them into point cloud data based on the SfM method;
(2) Produced and partitioned the dataset;
(3) Input the point cloud data of the training sample into the Improved-RandLA-Net deep point cloud semantic segmentation network to obtain the trained network model;
(4) Used the trained model to perform semantic segmentation on the test sample, and obtain the point cloud segmentation result with classification labels;
(5) Extracted the target tree point cloud based on the semantic segmentation label category;
(6) Used the distance-based point cloud denoising method to denoise the extracted tree point cloud;
(7) Used the point cloud clustering method Meanshift to extract single-tree point clouds.
3.2. Point Cloud Synthesis
Currently, there are two main sources of RGB point cloud data: (1) using algorithms such as SfM to reconstruct 3D point clouds from high-resolution RGB photos; and (2) collecting data simultaneously with a laser scanner and a panoramic camera and matching point clouds and images through complex algorithms to obtain RGB point clouds. The point cloud data used in this paper were obtained through method (1). In this study, we utilized the DJI Phantom 4 RTK UAV for data acquisition, which offer high-precision positioning and measurement capabilities, providing accurate location information. Following data collection, we employed Pix4D software for point cloud generation and 3D reconstruction. Pix4D leverages a combination of the acquired images and photogrammetric equations, utilizing a general geometric correction model. It performs the transformation from image coordinates to three-dimensional coordinates in object space. Additionally, Pix4D automatically calibrates the camera sensor to correct for internal parameters and distortions using geometric correction models such as the Brown model and free-form deformation model, thereby enhancing the accuracy and precision of point cloud generation. By combining the DJI Phantom 4 RTK UAV with Pix4D software, we acquired point cloud data of the experimental area and conducted tree segmentation tasks.
SfM [25] (Structure from Motion) is an offline algorithm that utilizes a series of highly overlapping images in both horizontal and vertical directions, obtained from different viewpoints, to reconstruct a 3D point cloud [26]. The basic process involves detecting feature points in each image and matching feature points between pairs of images while preserving geometric constraints. Finally, the SfM method was iteratively executed to reconstruct the point cloud, thus recovering the original pose and scene geometry information of the camera and obtaining the RGB point cloud.
3.3. Deep Semantic Segmentation of Target Tree Point Clouds
The essence of semantic segmentation is classification, which manifests as classifying each point in point cloud data. Semantic segmentation of point clouds will eventually assign a single class to each point, and the classification will be based not only on the color value of each point but also on the location and interrelationship of the points.
With the continuous development of artificial intelligence technology, there are numerous deep learning-based point cloud semantic segmentation algorithms, such as PointNet [27,28,29], PointNet++ [30,31,32], and RandLA-Net [33,34,35]. Among them, the PointNet series is an instance segmentation network, but it is only suitable for small-scale indoor scenes, while RandLA-Net is a semantic segmentation model, which is suitable for large-scale outdoor scenes.
In this paper, a novel deep point cloud semantic segmentation network based on RandLA-Net was constructed using point coordinates (XYZ) and color attributes (RGB) as feature inputs. RandLA-Net is an efficient and lightweight model that can process large-scale point clouds more quickly and accurately than other networks. However, RandLA-Net has certain limitations in feature extraction from point clouds, which may result in the loss of some local features of point clouds [36]. Although it combines the coordinates and colors of the raw data to enhance feature extraction in the LFA process, the overall improvement is not significant. The main reason is the inability to effectively enhance important features in an adaptive manner, which play a crucial role in the model’s predictions. As trees, the target of single-tree segmentation, are affected by factors such as tree shape and terrain, the model needs to have stronger local feature learning capabilities. Therefore, this paper improved the LFA (local feature aggregation) module in RandLA-Net and proposes the Improved-RandLA-Net model. The improved model employed the random sampling (RS) and IMP-LFA (Improved Local Feature Aggregation) modules to effectively enhance and extract the channel features and spatial features of the input point cloud data through the attention mechanism [37,38], thus significantly improving the ability of the model to extract local features of the point cloud and the accuracy of the final semantic segmentation. The specific structure of the model is shown in Figure 3.
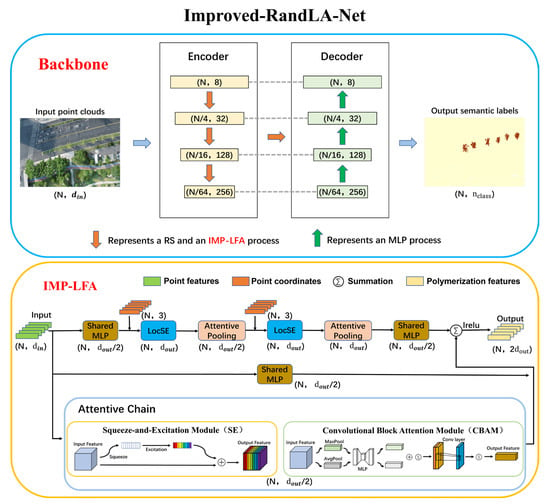
Figure 3.
Deep point cloud semantic segmentation network structure (Improved-RandLA-Net), Backbone is the main structure of the network, and IMP-LFA is an important part of Backbone. In the figure, N is the number of input points, and are the number of features of input and output points respectively, and indicates the number of point cloud classes. LocSE, full name Local Spatial Encoding, module is used to learn the local spatial features of each input point. The Attentive Pooling module is used to aggregate the features extracted by LocSE together to achieve feature aggregation. SE, full name is Squeeze-and-Excitation, is an attention mechanism used to enhance and extract channel features from the input point cloud. CBAM, full name Convolutional Block Attention Module, is an attention mechanism for enhancing and extracting channel and spatial features of the input point cloud. MLP and Shared MLP are used to modify the number of input points and the dimension of feature vectors.
3.3.1. Deep Point Cloud Semantic Segmentation Network
The structure of the backbone inherited from RandLA-Net is illustrated in Figure 3, comprising four encoding–decoding processes, each corresponding to a dashed line connection. The input data underwent four encoding layers, each supported by an RS and an IMP-LFA, reducing the number of input points to one-quarter while increasing the feature vector’s dimension to four times its original size. Subsequently, the data passed through four decoding layers that employed the K-Nearest Neighbors (KNN) algorithm. Semantic segmentation was then performed, and the output comprised the semantic labels of the point cloud.
3.3.2. LFA Improvement for Complex Forest Features (IMP-LFA)
The LFA module is the most important mechanism in RandLA-Net, whose primary function is to extract and aggregate the local features of each point. However, the original LFA module may lose some features during local feature extraction, resulting in incomplete feature learning by the model and affecting the accuracy of semantic segmentation. To address this issue, this paper proposes the Attentive Chain, which improves the original LFA module to IMP-LFA. As shown in Figure 3, the IMP-LFA module consists mainly of Local Spatial Encoding (LocSE), Attentive Pooling, and Attentive Chain. In addition to the original channels, the input point cloud passes through SE and CBAM modules on the attention chain, extracting local spatial and channel features and fusing them with features from other channels. SE, whose full name is Squeeze-and-Excitation, is an attention mechanism for enhancing and extracting channel features of the input point cloud. CBAM, whose full name is Convolutional Block Attention Module, is an attention mechanism for enhancing and extracting channel and spatial features of the input point cloud. In this paper, the channel features are represented by RGB, which indicates the color of each point, and the spatial dimension is represented by XYZ coordinates, which indicates the position of each point in the 3D space. The SE and CBAM modules function in the IMP-LFA as follows: First, the point cloud data went through the SE module. Through compression, the channel features were converted into a feature vector, and a convolutional layer was used to generate channel attention weights. These weights represent the importance of each channel across the entire point cloud. Finally, the channel attention weights were multiplied with the original channel features, resulting in a weighted channel feature map. This weighting process enabled the model to pay more attention to significant channel features, thereby enhancing feature extraction capabilities. Building upon the SE module, the CBAM module introduced spatial attention mechanisms. Following the channel attention in the SE module, it learned the correlations between different positions in the feature map through global average pooling and global maximum pooling operations. Subsequently, a set of fully connected layers generated a spatial attention weight map, which represents the importance of different positions. Next, the channel attention weights and spatial attention weights were applied to the feature map separately, producing the final weighted feature map. This weighting process enabled the model to better focus on essential channel features and spatial positions, further enhancing feature extraction capabilities. Finally, the point cloud features extracted by SE and CBAM were stitched with the point cloud features extracted using the original network to obtain the aggregated features of the final point cloud. This improved the model’s feature learning ability and semantic segmentation accuracy, while also effectively increasing the model’s learning efficiency by extracting richer local features from a single training sample [39]. This reduced the number of samples required for model training, enabling training and detection of smaller sample data.
3.4. Clustering-Based Extraction of Single-Tree Point Clouds
3.4.1. Point Cloud Denoising
Due to the fact that the semantic segmentation model cannot completely and accurately segment the target tree point cloud, the final segmentation result may contain a small amount of erroneously segmented points, i.e., noise points. In order to obtain more accurate results for single-tree point cloud extraction, this paper employed a point cloud denoising algorithm based on distance statistics [40] to remove noisy points. The basic principle of this algorithm is to calculate the average distance from each point to all neighboring points. Points with distance values beyond a certain threshold were considered noise points and removed.
3.4.2. Clustering Extraction of Point Clouds
Semantic segmentation resulted in a block of tree point clouds, rather than single-tree point clouds. As a solution, point cloud clustering was utilized for tree point cloud instance segmentation in this study.
In this paper, we used the Meanshift algorithm to extract single-tree point clouds. Meanshift is a density-based clustering algorithm that assumes that data sets of different clusters conform to different probability density distributions, and regions with high sample density correspond to the centers of clusters [41]. Therefore, when segmenting two slightly connected tree point clouds, the algorithm determines the clustering center based on the density of the point cloud and performs clustering. By utilizing the characteristics of dense and sparse regions in the tree point cloud, single-tree point clouds could be segmented accurately.
3.5. Evaluation Indexes
To better evaluate the performance of the model, this paper proposes different evaluation metrics for two parts: semantic segmentation accuracy of tree point cloud and clustering extraction of tree point cloud. For the semantic segmentation accuracy of tree point cloud, Accuracy, Precision, Recall, and F1-score were utilized as evaluation metrics to assess the semantic segmentation results and compare different models. The calculation of each evaluation metric is presented in Equations (1)–(4).
In the equations: TP indicates the number of points that were originally labeled tree points and were correctly predicted; TN indicates the number of points that were originally ground points (points other than tree points) and were correctly predicted; FP indicates the number of points that were originally labeled tree points but were incorrectly predicted as ground points; and FN indicates the number of points that were originally ground points but were incorrectly predicted as labeled tree points.
For the clustering extraction of tree point cloud, Precision was selected as the main evaluation metric, which reflects the completeness of single-tree point cloud extraction, and was calculated as shown in Equation (2). Meanwhile, Average Precision (AP) was calculated based on Precision, and Correct Quantities, Recognition Rate, Missing Quantities and Missing Rate were calculated according to Equations (5)–(8).
In the equations: Correct Quantities, meaning samples with Precision greater than or equal to 50% were considered as correctly segmented samples; Incorrect Quantity, meaning samples with Precision less than 50% were considered as incorrectly segmented samples; and Missed samples, meaning samples with Precision less than 5% were considered as Missed samples, which were used to calculate the Missing Quantities and the Missing Rate.
3.6. Experimental Environment and Parameters
The experimental setup in this paper used an Intel Core i7-12700K CPU, 32 GB RAM, and an NVIDIA RTX 3080 12 GB graphics card. The deep learning framework used includes CUDA 11.3, Python 3.6, and Tensorflow-gpu 2.6.0. The parameters of the experiments were set as follows: in the semantic segmentation part, all the experimental parameters were set to be uniform, the nearest neighbor value (K value) was 16, the size of a single input point cloud was 40,960 points, the initial learning rate was 0.01, momentum was 0.95, and the number of model iterations was 100. In the clustering extraction part, the parameters for point cloud denoising were neighbors = 400, ratio = 3, and the main parameters of Meanshift were composed of bandwidth and calculated through quantity and samples. The unified quantity was 0.0115, while samples were affected by the point cloud density, with samples = 1800 in Area 1 and Area 2 and 400 in Area 3.
4. Results
4.1. Target Tree Point Cloud Extraction (Semantic Segmentation)
In this paper, we employed the Improved-RandLA-Net to extract point clouds of trees belonging to the target species, and Table 2 presents the performance comparison of the two semantic segmentation models in different experimental regions before and after the proposed improvement. As seen from the results in Table 2, the Improved-RandLA-Net model outperforms the original network in semantic segmentation of each sample site, particularly in Area 2, where the terrain is uneven, and the canopy’s color is similar to that of the ground (as depicted in Figure 4b). The Recall of Improved-RandLA-Net increased from 47.34% before improvement to 79.10%, indicating that the model accurately extracted tree point clouds and significantly improved their integrity, which is critical for subsequent experiments.

Table 2.
Semantic segmentation results of the target tree point cloud in different experimental areas before and after the model improvement.
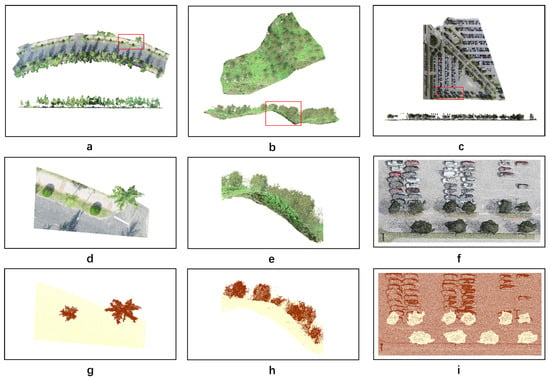
Figure 4.
(a–c) show the top and side views of the point cloud of experiment areas 1–3, and the red boxed part is the local enlargement; (d–f) show the original scene at the local enlargement of experiment areas 1–3; (g–i) show the predicted labels at the local enlargement of experiment areas 1–3.
Meanwhile, in both Area 1 and Area 2, all the evaluation metrics of Improved-RandLA-Net semantic segmentation exceed 75%, with Accuracy and Precision exceeding 90%. These two experimental areas represent small to medium-sized areas with flat terrain and complex feature types, and small to medium-sized areas with undulating terrain and single feature types, respectively. The research results indicate that the proposed model performs well in semantic segmentation even in small to medium-sized areas with significant terrain fluctuations and complex species and can maintain high accuracy. Area 3 is a large experimental area with complex terrain and diverse ground features, containing multiple types of trees, roads, streetlights, and cars. As shown in Table 2, the final semantic segmentation results in this area are all above 95%, with an Accuracy of 99.46%. Figure 4 displays the original point cloud and local zoom-in images of the three experimental areas, as well as the semantic segmentation results of the Improved-RandLA-Net model.
Comparing Figure 4d–i, it can be seen that in Area 1, the ginkgo tree canopy output by the model is basically complete, only a few target tree points are missing, and the number of incorrectly segmented points is also less, and there is no case of the whole tree not being segmented. This is due to the flat terrain of this area and the diverse size and shape of trees among different species, which make the semantic segmentation results more desirable. In contrast, Area 2 has more lost tree point clouds, with some trees only partially segmented and even whole trees not being detected, which did not occur in the other two areas. The undulating terrain and the similarity in color between tree and ground points pose challenges for the semantic segmentation model, which may mistakenly treat some tree points as ground points when they are in the same plane, leading to incorrect segmentation of the point cloud. In Area 3, there are fewer cases of partially segmented and unsegmented tree point clouds compared to the first two areas. The species diversity in this area is higher and the region is larger, but the distribution of trees is more scattered compared to the other two areas. Moreover, significant differences in color and shape between the point clouds of trees and other objects lead to more ideal semantic segmentation results. Overall, the results demonstrate that the proposed point cloud semantic segmentation network can achieve good results in both complex terrain and feature-rich environments.
As all experimental data were collected by UAV over the forest, trunk information was inadequately preserved. However, a small number of trunks were still preserved, and their colors were distinct from the canopy, as depicted in Figure 5a. During tree point cloud extraction, the model also partially preserved the tree trunk point cloud, as illustrated in Figure 5b. Therefore, the experimental results demonstrate that our model is highly robust and does not solely extract points with identical colors. Instead, it incorporates the local features of the point cloud (including channel features and spatial features) to learn as many features of the sample point cloud as possible and treats the canopy and trunk as a whole in the semantic segmentation.
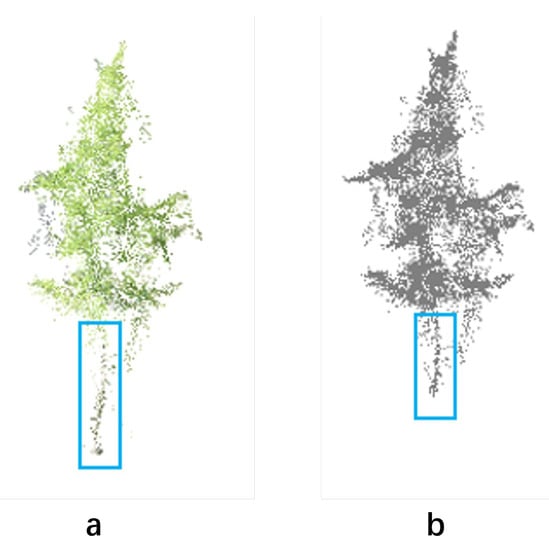
Figure 5.
(a,b) Shows the comparison before and after segmentation with the trunk point cloud, the blue boxed part is the tree trunk point cloud.
4.2. Single-Tree Point Cloud Extraction (Clustering Extraction)
Table 3 shows the results of applying our method to perform single-tree point cloud extraction using clustering after semantic segmentation. As shown in Table 3, the Average Precision of the three areas were 83.19%, 72.84%, and 95.11%, respectively, and the Recognition Rates were 89.8%, 75%, and 95.39%, respectively. In this study, clustering extraction was performed based on the results of point cloud semantic segmentation. Therefore, the results of cluster extraction and semantic segmentation reflect the same pattern: the size of the experimental area, terrain, and the complexity of ground objects all affect the accuracy of individual tree extraction. Among them, the complexity of ground objects in the experimental area is negatively correlated with the accuracy of individual tree extraction and has the greatest impact. On the other hand, the impact of the terrain and the size of the experimental area on the results is relatively small. Figure 6 compares the labeled single-tree point cloud with the extracted single-tree point cloud for the three areas.

Table 3.
Clustering Extraction results for different Areas (trees).
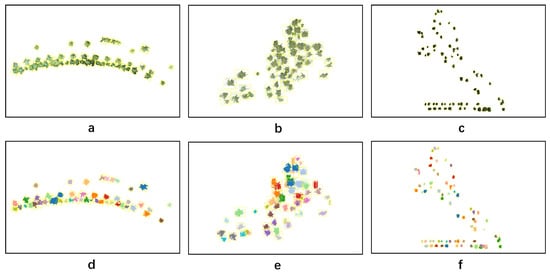
Figure 6.
Comparison of labeled single-tree point cloud and extracted single-tree point cloud. (a–c) are the original tree labels of Areas 1–3; (d–f) are the predicted labels of Areas 1–3.
4.3. Tree Overlap Analysis
Among all the areas tested in this study, Area 1 had the highest number of trees with overlapping canopies and the highest tree overlap rate, making it an ideal area for tree interlocking analysis. There were 49 trees tested in Area 1, of which 31 were interlocking and overlapping, accounting for 63.26% of the total number of trees in this area. Using a Precision greater than 50% as the threshold for correct detection, the method in this study correctly detected 26 overlapping trees, with a Recognition Rate of 83.87%. However, five trees were missed, including two undetected trees, resulting in a Missing Rate of 6.45%. These results demonstrate that the proposed method can effectively extract single-tree point clouds even in scenes with a high overlap rate. Figure 7 presents a comparison of some overlapping trees in Area 1 before and after segmentation.
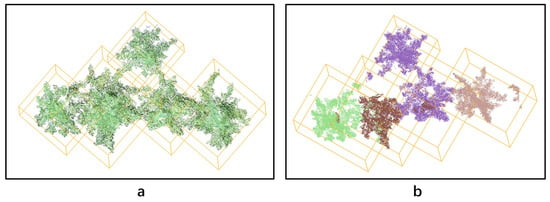
Figure 7.
Before and after segmentation comparison of some of the overlapping trees in Area 1, (a) is the labeled single-tree point cloud, (b) is the extracted single-tree point cloud.
4.4. Error Analysis
In this paper, the error analysis of both semantic segmentation and clustering extraction is performed on the experimental results, and Figure 8 shows the comparison between the incorrectly segmented samples and the original labeled samples. The errors in semantic segmentation include: (1) The entire tree not being segmented in some cases; and (2) A few single trees that are segmented may lose many points. The errors in clustering extraction include: (1) Splitting a single tree in a point cloud into multiple trees; and (2) Incorrectly merging multiple trees with connected canopies into a single tree.
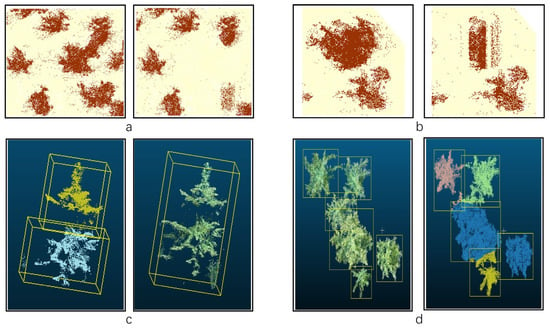
Figure 8.
(a,b) show the error comparison before and after segmentation of the semantic segmentation part; (c,d) show the error comparison before and after segmentation of the clustering extraction part. For better display effect, (a,b,d) is the top view, and (c) is the side view.
The spatial and color features of tree point clouds can assist neural networks in distinguishing different single trees, while the richness of the single-tree point cloud features is contingent upon the clarity and angle of the data acquisition equipment. PointCloud Reconstruction techniques may result in some errors in the restoration of color, geometry and spatial features of RGB point clouds, which also increase the likelihood of incorrect segmentation.
Despite researchers designing denser flight lines to decrease errors in data acquisition, in some experimental scenarios, some trees were too close to each other with overlapping branches and leaves, resulting in discontinuous and fragmented point clouds for some trees, as illustrated in Figure 8c. The problem of misidentifying multiple tree crowns as one due to excessive density is common in tree-crown detection. In this study, this problem is not serious because the point cloud data retain three-dimensional position information. However, if the overlap between two trees is too severe, the undulation between the tree crowns may disappear, which could lead to failure in detection and segmentation, as shown in Figure 8d.
5. Discussion
5.1. Evaluation of Our Approach
This paper proposes a novel method for extracting point clouds of single trees of a specified species from RGB point clouds. The method uses the deep point cloud semantic segmentation network Improved-RandLA-Net, which can recognize tree species well and extract the specified species’ point clouds. Then, point cloud clustering is used to segment the extraction results into single-tree point clouds. The proposed method achieved good segmentation results in three different experimental areas, indicating its feasibility and high robustness for single-tree point cloud extraction.
However, there are still some limitations in this work. For example, the datasets used in this paper are manually labeled by researchers, which is a very subjective process. Although most of the point labels in tree annotation are correct, there are still some errors in the areas where the trunk connects to the ground and where the tree crowns overlap. This can only be addressed by combining visual interpretation by researchers with the ortho-image.
5.2. Improved-RandLA-Net and RandLA-Net
This paper presents an improved version of the point cloud semantic segmentation network, RandLA-Net, known as Improved-RandLA-Net. The study demonstrates its superior performance compared to the original network in three experimental areas discussed in the paper. Notably, a significant improvement is observed in Area 2, which represents the Lin’an Pecan sample site. Unlike the other two relatively flat terrains, Area 2 exhibits substantial variations in topography, posing challenges for semantic segmentation. In certain instances, tree points and ground points align horizontally, making it difficult to distinguish between them. Additionally, the presence of dense grass covering the ground further complicates the segmentation task as the color of the ground closely resembles that of the trees. Consequently, the original network fails to achieve satisfactory semantic segmentation results. In contrast, Improved-RandLA-Net enhances the extraction of channel and spatial features by incorporating an Attention Chain mechanism, effectively capturing local point cloud features and improving segmentation accuracy.
5.3. Compared with Traditional Methods
Currently, most research on single-tree segmentation of point cloud data focuses on LiDAR-acquired data without color information. The main research steps include ground point removal, point cloud denoising, and single-tree segmentation. Common ground point removal methods, such as the RANSAC algorithm [42], Progressive TIN Densification [43], etc. perform well on relatively flat terrain but have limitations in areas with significant elevation differences. These methods struggle to preserve ground points on steep slopes or cliffs and may incorrectly identify other points as ground points, leading to inaccurate single-tree segmentation. Moreover, using point cloud clustering alone to extract complex terrain often leads to unsatisfactory results. For example, in the experimental area of this study, the results extracted by clustering were poor and therefore cannot be effectively analyzed.
To address these limitations, this paper proposes a novel approach that leverages RGB point cloud data and a deep point cloud semantic segmentation network to better learn the local features of tree point clouds. This approach effectively classifies and extracts tree point clouds, achieving a tree point cloud extraction rate of over 90% across three experimental areas. Additionally, the paper proposes a new single-tree point cloud segmentation method that combines point cloud clustering to solve some of the problems associated with traditional methods.
5.4. Future Research Directions
In future work, this project will focus on the following key areas: (1) Measurement of single-tree canopy volume. Compared to commonly used metrics, such as canopy width and area, canopy volume better reflects the ecological function of a tree. Based on this study, the calculation and validation of canopy volume can be successfully achieved. (2) By merging the forest canopy point cloud and the forest floor point cloud to create a complete point cloud, single-tree segmentation can be performed to obtain more single-tree structural parameters. In reality, tree density can be high, and collecting point clouds from above the canopy alone may not provide a complete representation of the tree. To address this issue, we aim to synthesize complete point clouds of the scene by collecting data from both above and beneath the tree canopy. These point clouds will be utilized to perform single-tree point cloud segmentation of multiple tree species, and extract their respective deconstruction parameters. (3) Classification study of multiple tree species. The method employed in this study has been verified to distinguish between trees and nontrees. Further verification of its ability to differentiate between different tree species would greatly advance the application of RGB point clouds.
6. Conclusions
This study implemented the extraction of RGB single-tree point clouds using the Improved-RandLA-Net and Meanshift algorithms. The recognition rates for single trees in the three experimental areas were 89.80%, 75.00%, and 95.39%, respectively. While the recognition rate varied with changes in terrain and the types of ground objects in each experimental area, the experimental results clearly demonstrate that this method is feasible, providing a new approach for current single-tree point cloud segmentation work and technical support for further extracting single-tree structural parameters in complex forest areas.
Author Contributions
Conceptualization, K.X.; methodology, K.X.; data curation, C.L.; software, C.L.; validation, C.L. and K.X.; investigation, S.D. and Y.Y.; resources, H.F.; writing—original draft preparation, C.L.; writing—review and editing, K.X. and C.L.; funding acquisition, K.X., S.D. and Y.Y. All authors have read and agreed to the published version of the manuscript.
Funding
This research was funded by the National Natural Science Foundation of China (32271869, 32101517); Zhejiang Provincial Natural Science Foundation of China (LQ20F020005); Key R&D Projects in Zhejiang Province (2022C02009, 2022C02044).
Data Availability Statement
The data presented in this study are available on request from the corresponding author. The data are not publicly available due to privacy restrictions.
Acknowledgments
The authors gratefully acknowledge the supports of various foundations. The authors are grateful to the editor and anonymous reviewers whose comments have contributed toimproving the quality of this study.
Conflicts of Interest
The authors declare no conflict of interest.
References
- Lister, A.J.; Andersen, H.; Frescino, T.; Gatziolis, D.; Healey, S.; Heath, L.S.; Liknes, G.C.; McRoberts, R.; Moisen, G.G.; Nelson, M.; et al. Use of Remote Sensing Data to Improve the Efficiency of National Forest Inventories: A Case Study from the United States National Forest Inventory. Forests 2020, 11, 1364. [Google Scholar] [CrossRef]
- Cai, Z.; Chang, X.; Li, M. A Cost-Efficient Platform Design for Distributed UAV Swarm Research. In ACM International Conference Proceeding Series, Proceedings of the 2021 3rd International Conference on Advanced Information Science and System, Sanya, China, 26 November 2021; Association for Computing Machinery: New York, NY, USA, 2021. [Google Scholar]
- Brede, B.; Lau, A.; Bartholomeus, H.M.; Kooistra, L. Comparing Riegl Ricopter Uav Lidar Derived Canopy Height and DBH with Terrestrial LiDAR. Sensors 2017, 17, 2371. [Google Scholar] [CrossRef] [PubMed]
- Cao, L.; Coops, N.C.; Hermosilla, T.; Innes, J.; Dai, J.; She, G. Using Small-Footprint Discrete and Full-Waveform Airborne LiDAR Metrics to Estimate Total Biomass and Biomass Components in Subtropical Forests. Remote. Sens. 2014, 6, 7110–7135. [Google Scholar] [CrossRef]
- Yang, W.; Liu, Y.; He, H.; Lin, H.; Qiu, G.; Guo, L. Airborne LiDAR and Photogrammetric Point Cloud Fusion for Extraction of Urban Tree Metrics According to Street Network Segmentation. IEEE Access 2021, 9, 97834–97842. [Google Scholar] [CrossRef]
- Hu, X.; Li, D. Research on a Single-Tree Point Cloud Segmentation Method Based on UAV Tilt Photography and Deep Learning Algorithm. IEEE J. Sel. Top. Appl. Earth Obs. Remote. Sens. 2020, 13, 4111–4120. [Google Scholar] [CrossRef]
- Vincent, L.; Soille, P. Watersheds in digital spaces: An efficient algorithm based on immersion simulations. IEEE Trans. Pattern Anal. Mach. Intell. 1991, 13, 583–598. [Google Scholar] [CrossRef]
- Feng, Z.; Sun, P. Image Segmentation Based on Improved Regional Growth Method. Int. J. Circuits Syst. Signal Process. 2019, 13, 162–169. [Google Scholar]
- Yang, J.; Kang, Z.; Cheng, S.; Yang, Z.; Akwensi, P.H. An Individual Tree Segmentation Method Based on Watershed Algo-rithm and Three-Dimensional Spatial Distribution Analysis from Airborne LiDAR Point Clouds. IEEE J. Sel. Top. Appl. Earth Obs. Remote Sens. 2020, 13, 1055–1067. [Google Scholar] [CrossRef]
- Wu, H.; Zhang, X.; Shi, W.; Song, S.; Cardenas-Tristan, A.; Li, K. An Accurate and Robust Region-Growing Algorithm for Plane Segmentation of TLS Point Clouds Using a Multiscale Tensor Voting Method. IEEE J. Sel. Top. Appl. Earth Obs. Remote. Sens. 2019, 12, 4160–4168. [Google Scholar] [CrossRef]
- Xu, Y.; Yao, W.; Hoegner, L.; Stilla, U. Segmentation of building roofs from airborne LiDAR point clouds using robust voxel-based region growing. Remote. Sens. Lett. 2017, 8, 1062–1071. [Google Scholar] [CrossRef]
- Ying, W.; Dong, T.; Ding, Z.; Zhang, X. PointCNN-Based Individual Tree Detection Using LiDAR Point Clouds. In Proceedings of the Lecture Notes in Computer Science (Including Subseries Lecture Notes in Artificial Intelligence and Lecture Notes in Bioinformatics); Springer Science and Business Media Deutschland GmbH: Berlin/Heidelberg, Germany, 2021; Volume 13002 LNCS, pp. 89–100. [Google Scholar]
- Wang, Y.; Weinacker, H.; Koch, B. A Lidar Point Cloud Based Procedure for Vertical Canopy Structure Analysis And 3D Single Tree Modelling in Forest. Sensors 2008, 8, 3938–3951. [Google Scholar] [CrossRef] [PubMed]
- Reitberger, J.; Schnörr, C.; Krzystek, P.; Stilla, U. 3D segmentation of single trees exploiting full waveform LIDAR data. ISPRS J. Photogramm. Remote. Sens. 2009, 64, 561–574. [Google Scholar] [CrossRef]
- Gupta, S.; Weinacker, H.; Koch, B. Comparative Analysis of Clustering-Based Approaches for 3-D Single Tree Detection Using Airborne Fullwave Lidar Data. Remote. Sens. 2010, 2, 968–989. [Google Scholar] [CrossRef]
- Likas, A.; Vlassis, N.; Verbeek, J.J. The global k-means clustering algorithm. Pattern Recognit. 2003, 36, 451–461. [Google Scholar] [CrossRef]
- Hu, X.; Chen, W.; Xu, W. Adaptive Mean Shift-Based Identification of Individual Trees Using Airborne LiDAR Data. Remote. Sens. 2017, 9, 148. [Google Scholar] [CrossRef]
- Cheng, Y. Mean Shift, Mode Seeking, and Clustering. IEEE Trans. Pattern Anal. Mach. Intell. 1995, 17, 790–799. [Google Scholar] [CrossRef]
- Ayrey, E.; Fraver, S.; Kershaw, J.A., Jr.; Kenefic, L.S.; Hayes, D.; Weiskittel, A.R.; Roth, B.E. Layer Stacking: A Novel Algorithm for Individual Forest Tree Segmentation from LiDAR Point Clouds. Can. J. Remote Sens. 2017, 43, 16–27. [Google Scholar] [CrossRef]
- Tang, J.; Jiang, F.; Long, Y.; Fu, L.; Sun, H. Identification of the Yield of Camellia oleifera Based on Color Space by the Optimized Mean Shift Clustering Algorithm Using Terrestrial Laser Scanning. Remote. Sens. 2022, 14, 642. [Google Scholar] [CrossRef]
- Ankerst, M.; Breunig, M.M.; Kriegel, H.-P.; Sander, J. OPTICS: Ordering Points to Identify the Clustering Structure. ACM Sigmod Rec. 1999, 28, 49–60. [Google Scholar] [CrossRef]
- Ng, A.Y.; Jordan, M.I.; Weiss, Y. On Spectral Clustering: Analysis and an Algorithm. Adv. Neural Inf. Process Syst. 2001, 14, 849–856. [Google Scholar]
- Ester, M.; Kriegel, H.-P.; Sander, J.; Xu, X. A Density-Based Algorithm for Discovering Clusters in Large Spatial Databases with Noise. In Proceedings of the 2nd International Conference on Knowledge Discovery and Data Mining—KDD-96, Portland, OR, USA, 2–4 August 1996; Volume 96, pp. 226–231. [Google Scholar]
- Chen, M.; Hu, Q.; Yu, Z.; Thomas, H.; Feng, A.; Hou, Y.; McCullough, K.; Ren, F.; Soibelman, L. STPLS3D: A Large-Scale Synthetic and Real Aerial Photogrammetry 3D Point Cloud Dataset. In Proceedings of the 33rd British Machine Vision Conference, London, UK, 21–24 November 2022; pp. 21–24. [Google Scholar]
- Ullman, S. The Interpretation of Structure from Motion. Proc. R. Soc. Lond. B. 1979, 203, 405–426. [Google Scholar] [PubMed]
- Dell, M.; Stone, C.; Osborn, J.; Glen, M.; McCoull, C.; Rimbawanto, A.; Tjahyono, B.; Mohammed, C. Detection of necrotic foliage in a young Eucalyptus pellita plantation using unmanned aerial vehicle RGB photography—A demonstration of concept. Aust. For. 2019, 82, 79–88. [Google Scholar] [CrossRef]
- Qi, C.R.; Su, H.; Mo, K.; Guibas, L.J. PointNet: Deep Learning on Point Sets for 3D Classification and Segmentation. In Proceedings of the IEEE Conference on Computer Vision and Pattern Recognition, Honolulu, HI, USA, 21–26 July 2017; pp. 652–660. [Google Scholar]
- Zhang, K.; Wang, J.; Fu, C. Directional PointNet: 3D Environmental Classification for Wearable Robotics. arXiv 2019, arXiv:1903.06846. [Google Scholar]
- Yu, T.; Hu, C.; Xie, Y.; Liu, J.; Li, P. Mature Pomegranate Fruit Detection and Location Combining Improved F-PointNet with 3D Point Cloud Clustering in Orchard. Comput. Electron. Agric. 2022, 200, 107233. [Google Scholar] [CrossRef]
- Briechle, S.; Krzystek, P.; Vosselman, G. Semantic Labeling of Als Point Clouds for Tree Species Mapping Using the Deep Neural Network Pointnet++. ISPRS Int. Arch. Photogramm. Remote. Sens. Spat. Inf. Sci. ISPRS Arch. 2019, 42, 951–955. [Google Scholar] [CrossRef]
- Zhu, Q.; Mu, Z. PointNet++ and Three Layers of Features Fusion for Occlusion Three-Dimensional Ear Recognition Based on One Sample per Person. Symmetry 2020, 12, 78. [Google Scholar] [CrossRef]
- Liu, B.; Chen, S.; Huang, H.; Tian, X. Tree Species Classification of Backpack Laser Scanning Data Using the PointNet++ Point Cloud Deep Learning Method. Remote. Sens. 2022, 14, 3809. [Google Scholar] [CrossRef]
- Hu, Q.; Yang, B.; Xie, L.; Rosa, S.; Guo, Y.; Wang, Z.; Trigoni, N.; Markham, A. RandLA-Net: Efficient Semantic Segmentation of Large-Scale Point Clouds. In Proceedings of the IEEE/CVF Conference on Computer Vision and Pattern Recognition, Long Beach, CA, USA, 15–20 June 2019; pp. 11108–11117. [Google Scholar]
- Chen, J.; Zhao, Y.; Meng, C.; Liu, Y. Multi-Feature Aggregation for Semantic Segmentation of an Urban Scene Point Cloud. Remote. Sens. 2022, 14, 5134. [Google Scholar] [CrossRef]
- Ma, Z.; Li, J.; Liu, J.; Zeng, Y.; Wan, Y.; Zhang, J. An Improved RandLa-Net Algorithm Incorporated with NDT for Automatic Classification and Extraction of Raw Point Cloud Data. Electronics 2022, 11, 2795. [Google Scholar] [CrossRef]
- Qiu, S.; Anwar, S.; Barnes, N. Semantic Segmentation for Real Point Cloud Scenes via Bilateral Augmentation and Adaptive Fusion. In Proceedings of the IEEE/CVF Conference on Computer Vision and Pattern Recognition, Nashville, TN, USA, 20–25 June 2021; pp. 1757–1767. [Google Scholar]
- Wen, C.; Hong, M.; Yang, X.; Jia, J. Pulmonary Nodule Detection Based on Convolutional Block Attention Module. In Proceedings of the 2019 Chinese Control Conference (CCC), Guangzhou, China, 27–30 July 2019; pp. 8583–8587. [Google Scholar]
- Hu, J.; Shen, L.; Albanie, S.; Sun, G.; Wu, E. Squeeze-and-Excitation Networks. In Proceedings of the IEEE Conference on Computer Vision and Pattern Recognition, Salt Lake City, UT, USA, 18–23 June 2018; pp. 7132–7141. [Google Scholar]
- Niu, Z.; Zhong, G.; Yu, H. A review on the attention mechanism of deep learning. Neurocomputing 2021, 452, 48–62. [Google Scholar] [CrossRef]
- Qu, Y.; Guo, F. Outlier detection algorithm based on density and distance. J. Phys. Conf. Ser. 2021, 1941, 012016. [Google Scholar] [CrossRef]
- Cui, J.; Wang, Y.; Wang, K. Key Technology of the Medical Image Wise Mining Method Based on the Meanshift Algorithm. Emerg. Med. Int. 2022, 2022, 6711043. [Google Scholar] [CrossRef] [PubMed]
- Li, X.; Liu, Y.; Wang, Y.; Yan, D. Computing Homography with RANSAC Algorithm: A Novel Method of Registration. In Proceedings of the Electronic Imaging and Multimedia Technology IV; SPIE: Bellingham, WA, USA, 2005; Volume 5637, p. 109. [Google Scholar]
- Zhao, X.; Guo, Q.; Su, Y.; Xue, B. Improved progressive TIN densification filtering algorithm for airborne LiDAR data in forested areas. ISPRS J. Photogramm. Remote. Sens. 2016, 117, 79–91. [Google Scholar] [CrossRef]
Disclaimer/Publisher’s Note: The statements, opinions and data contained in all publications are solely those of the individual author(s) and contributor(s) and not of MDPI and/or the editor(s). MDPI and/or the editor(s) disclaim responsibility for any injury to people or property resulting from any ideas, methods, instructions or products referred to in the content. |
© 2023 by the authors. Licensee MDPI, Basel, Switzerland. This article is an open access article distributed under the terms and conditions of the Creative Commons Attribution (CC BY) license (https://creativecommons.org/licenses/by/4.0/).