Article

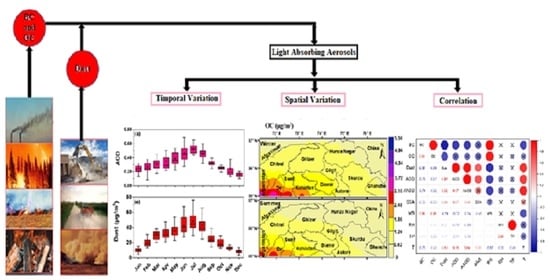
Exploring the Spatiotemporal Variation in Light-Absorbing Aerosols and Its Relationship with Meteorology over the Hindukush–Himalaya–Karakoram Region

1
Department of Physics, University of Peshawar, Peshawar 25120, Khyber Pakhtunkhwa, Pakistan
2
Higher Education Department, Peshawar 25000, Khyber Pakhtunkhwa, Pakistan
3
Collaborative Innovation Centre for Western Ecological Safety, College of Atmospheric Sciences, Lanzhou University, Lanzhou 730000, China
4
Department of Basic Sciences and Islamiat, University of Engineering and Technology, Peshawar 25120, Khyber Pakhtunkhwa, Pakistan
*
Author to whom correspondence should be addressed.
Remote Sens. 2023, 15(10), 2527; https://doi.org/10.3390/rs15102527
Submission received: 3 March 2023 / Revised: 11 April 2023 / Accepted: 20 April 2023 / Published: 11 May 2023

Abstract

:
Light-absorbing aerosols such as black carbon (BC), organic carbon (OC), and dust can cause the warming and melting of glaciers by absorbing sunlight. Further research is needed to understand the impact of light-absorbing aerosols on the Hindukush–Karakoram–Himalaya region in northern Pakistan. Therefore, spatiotemporal variation in absorbing surface mass concentration retrieved from Modern-Era Retrospective analysis for Research and Applications, optical properties such as aerosol optical depth (AOD) and absorption aerosol optical depth (AAOD) from the ozone monitoring instrument, and meteorological parameters from the European Centre for Medium-Range Weather Forecasts Reanalysis were investigated over northern Pakistan from 2001 to 2021. The BC concentration was lowest in May and highest in November, having a seasonal maximum peak in winter (0.31 ± 0.04 µg/m3) and minimum peak in spring (0.17 ± 0.01 µg/m3). In addition, OC concentration was found to be greater in November and smaller in April, with a seasonal higher peak in autumn (1.32 ± 0.32 µg/m3) and a lower peak in spring (0.73 ± 0.08 µg/m3). The monthly and seasonal variabilities in BC and OC concentrations are attributed to solid fuels, biomass burning, changes in vegetation, agricultural activities, and meteorology. In contrast, the dust concentration was high in July and low in December, with a seasonal average high concentration in summer (44 ± 9 µg/m3) and low concentration in winter (13 ± 2 µg/m3) due to drier conditions, dust activity, long-range transport, and human activities. Moreover, the seasonal variation in AOD and AAOD was identical and higher in the summer and lower in the winter due to dust aerosol loading and frequent dust activities. AOD and AAOD followed a similar pattern of spatial variation over the study area. Meteorological parameters greatly impact light-absorbing aerosols; therefore, low temperatures in winter increase BC and OC concentrations due to shallow boundary layers, while severe precipitation in spring decreases concentrations. During summer, dry conditions cause soil erosion and increase the amount of dust suspended in the atmosphere, leading to higher AOD and AAOD values. Conversely, higher precipitation rates and speedy winds disperse the dust aerosols in winter, resulting in lower AOD and AAOD values.

Graphical Abstract

1. Introduction

Aerosol particles are considered to play an essential role in global and regional climate changes, and can influence the energy balance of the Earth’s atmospheric system both directly and indirectly by scattering and absorbing solar radiation [1,2]. The absorption of solar radiation by these aerosols results in the heating of the atmosphere, while the scattering of radiation produces a cooling effect [3]. The radiative properties have a direct impact on climate change assessment and prediction which depends on the chemical, physical, and optical properties of the aerosols [4,5]. The chemical composition of aerosols and their optical properties vary spatially and temporally depending on regional meteorology and emission sources. Amongst these aerosols, black carbon (BC), organic carbon (OC), and mineral dust have received tremendous attention due to their ability to absorb solar and terrestrial radiations. They can be produced by anthropogenic and natural processes such as incomplete combustion of fossil fuel, biomass burning, viable microbes, disintegration and dispersion of plant materials, arid and semi-arid landscapes, and soil organic matter [6,7,8]. When these absorbing particles emit into the atmosphere, they produce a net positive climate force by decreasing the surface albedo, and hence contribute significantly to global warming [6,9,10]. Furthermore, when these absorbing aerosols settle on the glacier surface, they darken the surface, absorb solar and terrestrial radiation, and accelerate snow melting [11,12,13]. Moreover, these absorbing aerosols also drastically affect the monsoon cycle as well as the global climate system [14]. Therefore, there is increasing scientific interest in investigating the effects of short-lived climate forcers (BC, OC, dust) in cryospheric regions around the world [15,16,17].
Research on the glaciers of the Himalayas and Tibetan Plateau regions is very important because these glaciers serve as water storage towers for East and South Asia, and about one billion people would be affected by the decrease in water resources [18]. Additionally, globally, East Asia is the greatest source region of anthropogenic emission of absorbing aerosols, which significantly influences the Asian monsoon water cycle [19]. The deposition of absorbing aerosols has increased on the Tibetan and Himalayan glaciers in the last two decades, playing a major role in the rapid melting of glaciers [20,21]. Furthermore, these absorbing aerosols, particularly BC, have been found to play an important role in decreasing the extent of snow cover and shortening the time duration of the snow cover season by several days [22]. Presently, the world’s two largest emission source regions of absorbing aerosols are considered to be East and South Asia [23]. These absorbing aerosols are transported during the summer monsoon season from eastern Asia towards the northeast, hence affecting the life of snow-covered areas and glaciers [24]. In addition, the temperature increasing trend (global warming) has been observed in the last decade, because of which frozen water resources and ice mass are decreasing continuously in the northern part of Pakistan [25]. Moreover, the glaciers located in northern Pakistan are exposed more to absorbing aerosols, as compared to the other areas, because of the long-range transport of these aerosols from both Central and South Asia as well as from the Middle East [24]. The water that comes from the snow melting these glaciers flows through the Indus river, and plays a significant role in the economy of Pakistan [24]. Water supplies to the regional areas are regulated by the glaciers that serve as freshwater reservoirs and are significant resources that feed rivers in Pakistan. The economy of Pakistan mainly depends on the water that comes from glaciers melting, and glacier depletion can affect hydroelectric power, drinking water supplies, agriculture, and ecological habitats. Moreover, the melting of permanent glaciers and seasonal snowfall have not only caused flash floods in many areas, but also a reduction in the water resources of Pakistan [26].
Therefore, studying the absorbing aerosols over northern Pakistan is crucial in order to gain better knowledge about their concentration levels, optical properties, and other effects in northern Pakistan that have received less attention in previous studies. The current literature includes limited temporal and spatial investigations that are mainly focused on single particle analysis, which is insufficient to fully understand the climate effects of absorbing aerosols in this region. In addition, the rapid population growth in northern Pakistan in recent years has also uplifted the anthropogenic emission sources, which have significantly affected the regional atmosphere and air quality. Therefore, the present study aims to fulfill the scientific gap by conducting a long-term (2001–2021) comprehensive investigation of the spatiotemporal pattern of light-absorbing aerosols (BC, OC, mineral dust), mass concentrations, and their optical properties on the whole region of northern Pakistan based on re-analysis and observation datasets.

2. Study Area and Meteorological Conditions

2.1. Study Area

The study area chosen for the present research is the northern area of Pakistan (71.12°N–77.05°N and 34.52°E–37.16°E), as shown in Figure 1, which includes eleven regions (i.e., Astore, Diamir, Chanche, Ghizer, Gilgit, Hunza Nagar, Swat, Skardu, Chitral, Dir, and Kohistan). Table 1 shows the covered area, population, and population density of these regions based on the Census (c) 15 March 2017 obtained from website (https://www.citypopulation.de/en/pakistan/cities/, accessed on 06 July 2022). The northern areas of Pakistan are the most fascinating and spectacular region of the country in which the three well known mountainous ranges (Himalayas, Karakorum’s, and Hindukush) meet. The range is named after the historic Karakoram Pass, an ancient trading route between northern Pakistan and Xinjiang, China, which forms the watershed between the Indus and Central Asian deserts. This entire area is made up of tall, snow-covered mountains, isolated valleys, and strong rivers. More than one hundred high mountain peaks (Raka Posh, K-2, Nanga Parbat, etc.) are located within a radius of less than 100 square miles, and numerous significant passes are situated between the hills. This region includes various large glaciers (Baltoro, Hispar, Biafo, etc.), some of which are the biggest outside of the polar regions. In addition, extreme weather and temperatures are common in the northern region, and this region is outside the monsoon range due to high mountain walls, which results in a lower precipitation rate. However, heavy snowfall in winter compensates for the comparatively scanty rainfall (https://www.nazariapak.info/Research-corner/Geo.php, accessed on 10 September 2022).

2.2. Local Meteorology

The existence of high mountains, large glaciers, steep valleys, and harsh weather has a great influence on aerosol accumulation and concentration. The study region is also prone to frequent and heavy snowfall, particularly in the winter and autumn months. Hence, the unique topography, geography, and altitude of the study area make it complex in terms of meteorology [27]. Therefore, the monthly average data of surface meteorological parameters, i.e., wind speed (WS), relative humidity (RH), total precipitation (TP), and temperature (T) were taken at a resolution of 0.25° × 0.25° from the European Centre for Medium-Range Weather Forecasts (ECMWF) Reanalysis 5th Generation (ERA5) over the study region from 2001 to 2021. The whole study period was divided into four seasons: winter (December, January, and February), spring (March, April, and May), summer (June, July, and August), and autumn (September, October, and November). The monthly and seasonal variations in surface meteorological parameters obtained by taking the average for each month and season over the study period are shown in Figure 2a,b. It is clear from Figure 2a that the WS was lower between March and October, with a minimum speed of 1.22 m/s in the spring season and a higher speed from November to February, with a maximum speed of 1.5 m/s in November and with a seasonal peak of 1.43 m/s in winter (Figure 2b). The monthly TP was found to have an increasing trend from the month of January (1.8 mm) to attain its maximum value in April (2.7 mm), and then it followed a decreasing pattern to achieve its minimum value in August and September (0.4 mm). Hence, the seasonal maximum peak was detected in spring (2.6 mm) and the minimum peak was observed in summer (0.9 mm). The RH is directly related to the TP rate [28], and was found to be minimum in August and September (46%), while the maximum value was detected in May (67%), which resulted in greater humidity in spring (65%) and lower humidity in the summer season (53%). In addition, the T showed its minimum value (12 °C) in January and maximum value (25 °C) in July and August. Seasonally, the T was found to be warmer in summer (25 °C) and colder in winter (13 °C).

3. Data Sets and Methods

3.1. Modern-Era Retrospective Analysis for Research and Applications Version 2

Modern-Era Retrospective analysis for Research and Applications version 2 (MERRA-2) is a form of reanalysis data based on the Goddard Earth Observing System Model version 5 (GEOS-5 model). These datasets have provided data on the characteristics of cloud, various aerosol, and other atmospheric products since 1979. The aerosol products of MERRA-2 are obtained by the assimilation of data from AErosol RObotic NETwork (AERONET) stations, Moderate Resolution Imaging Spectroradiometer MODIS), and many other station data [29]. MERRA-2 datasets include global observable parameters and aerosol diagnostics with different times (1 month, 3 h, and 1 h) at spatial resolutions (0.5° × 0.625°). In addition, from the surface to 0.01 hPa, the vertical structure is divided into 72 hybrid-eta levels. This data have been available since 1980 and can be utilized to discover the aerosol effect on air quality, climate, and atmospheric circulation [30,31], which can be accessed on the GIOVANNI (Goddard Earth Sciences Data and Information Services Center) web portal [32].
In this study, we utilized the monthly averaged temporal and spatial data of surface mass concentration of absorbing aerosols such as BC, OC, and dust from the MERRA-2 at a spatial resolution of 0.5° × 0.625°.

3.2. Ozone Monitoring Instrument Analysis

The ozone monitoring instrument (OMI) on board the Aqua satellite is one of the remarkable instruments that can differentiate absorbing aerosols such as BC, dust, smoke, etc. [33]. OMI is a nadir-viewing spectrometer onboard the Aura satellite that can monitor solar backscatter radiation in the visible and UV ranges [34]. In OMI observations, two types of aerosol algorithms are used: the OMI multi-wavelength (OMAERO) algorithm and the OMAERUV method. OMAERUV products are acquired by observation in two near-UV channels, whereas OMAERO products are obtained using multi-wavelength information. More details about the OMI data sets are available on the website (https://aura.gsfc.nasa.gov/omi.html, accessed on 15 June 2019). This research utilizes OMAERUV Level 3 products with a spatial resolution of 1° × 1° from 2005 to 2021, including daily average aerosol optical depth (AOD), absorption aerosol optical depth (AAOD), and single-scattering albedo (SSA) at 500 nm. The relationship between AOD, AAOD, and SSA is given as AAOD = (1 − SSA) × AOD [19,35]. In the OMAERUV products, AAOD is the most reliable parameter because of OMI’s high sensitivity in the near-UV spectrum, with a less than 0.01 root-mean-square error [19].

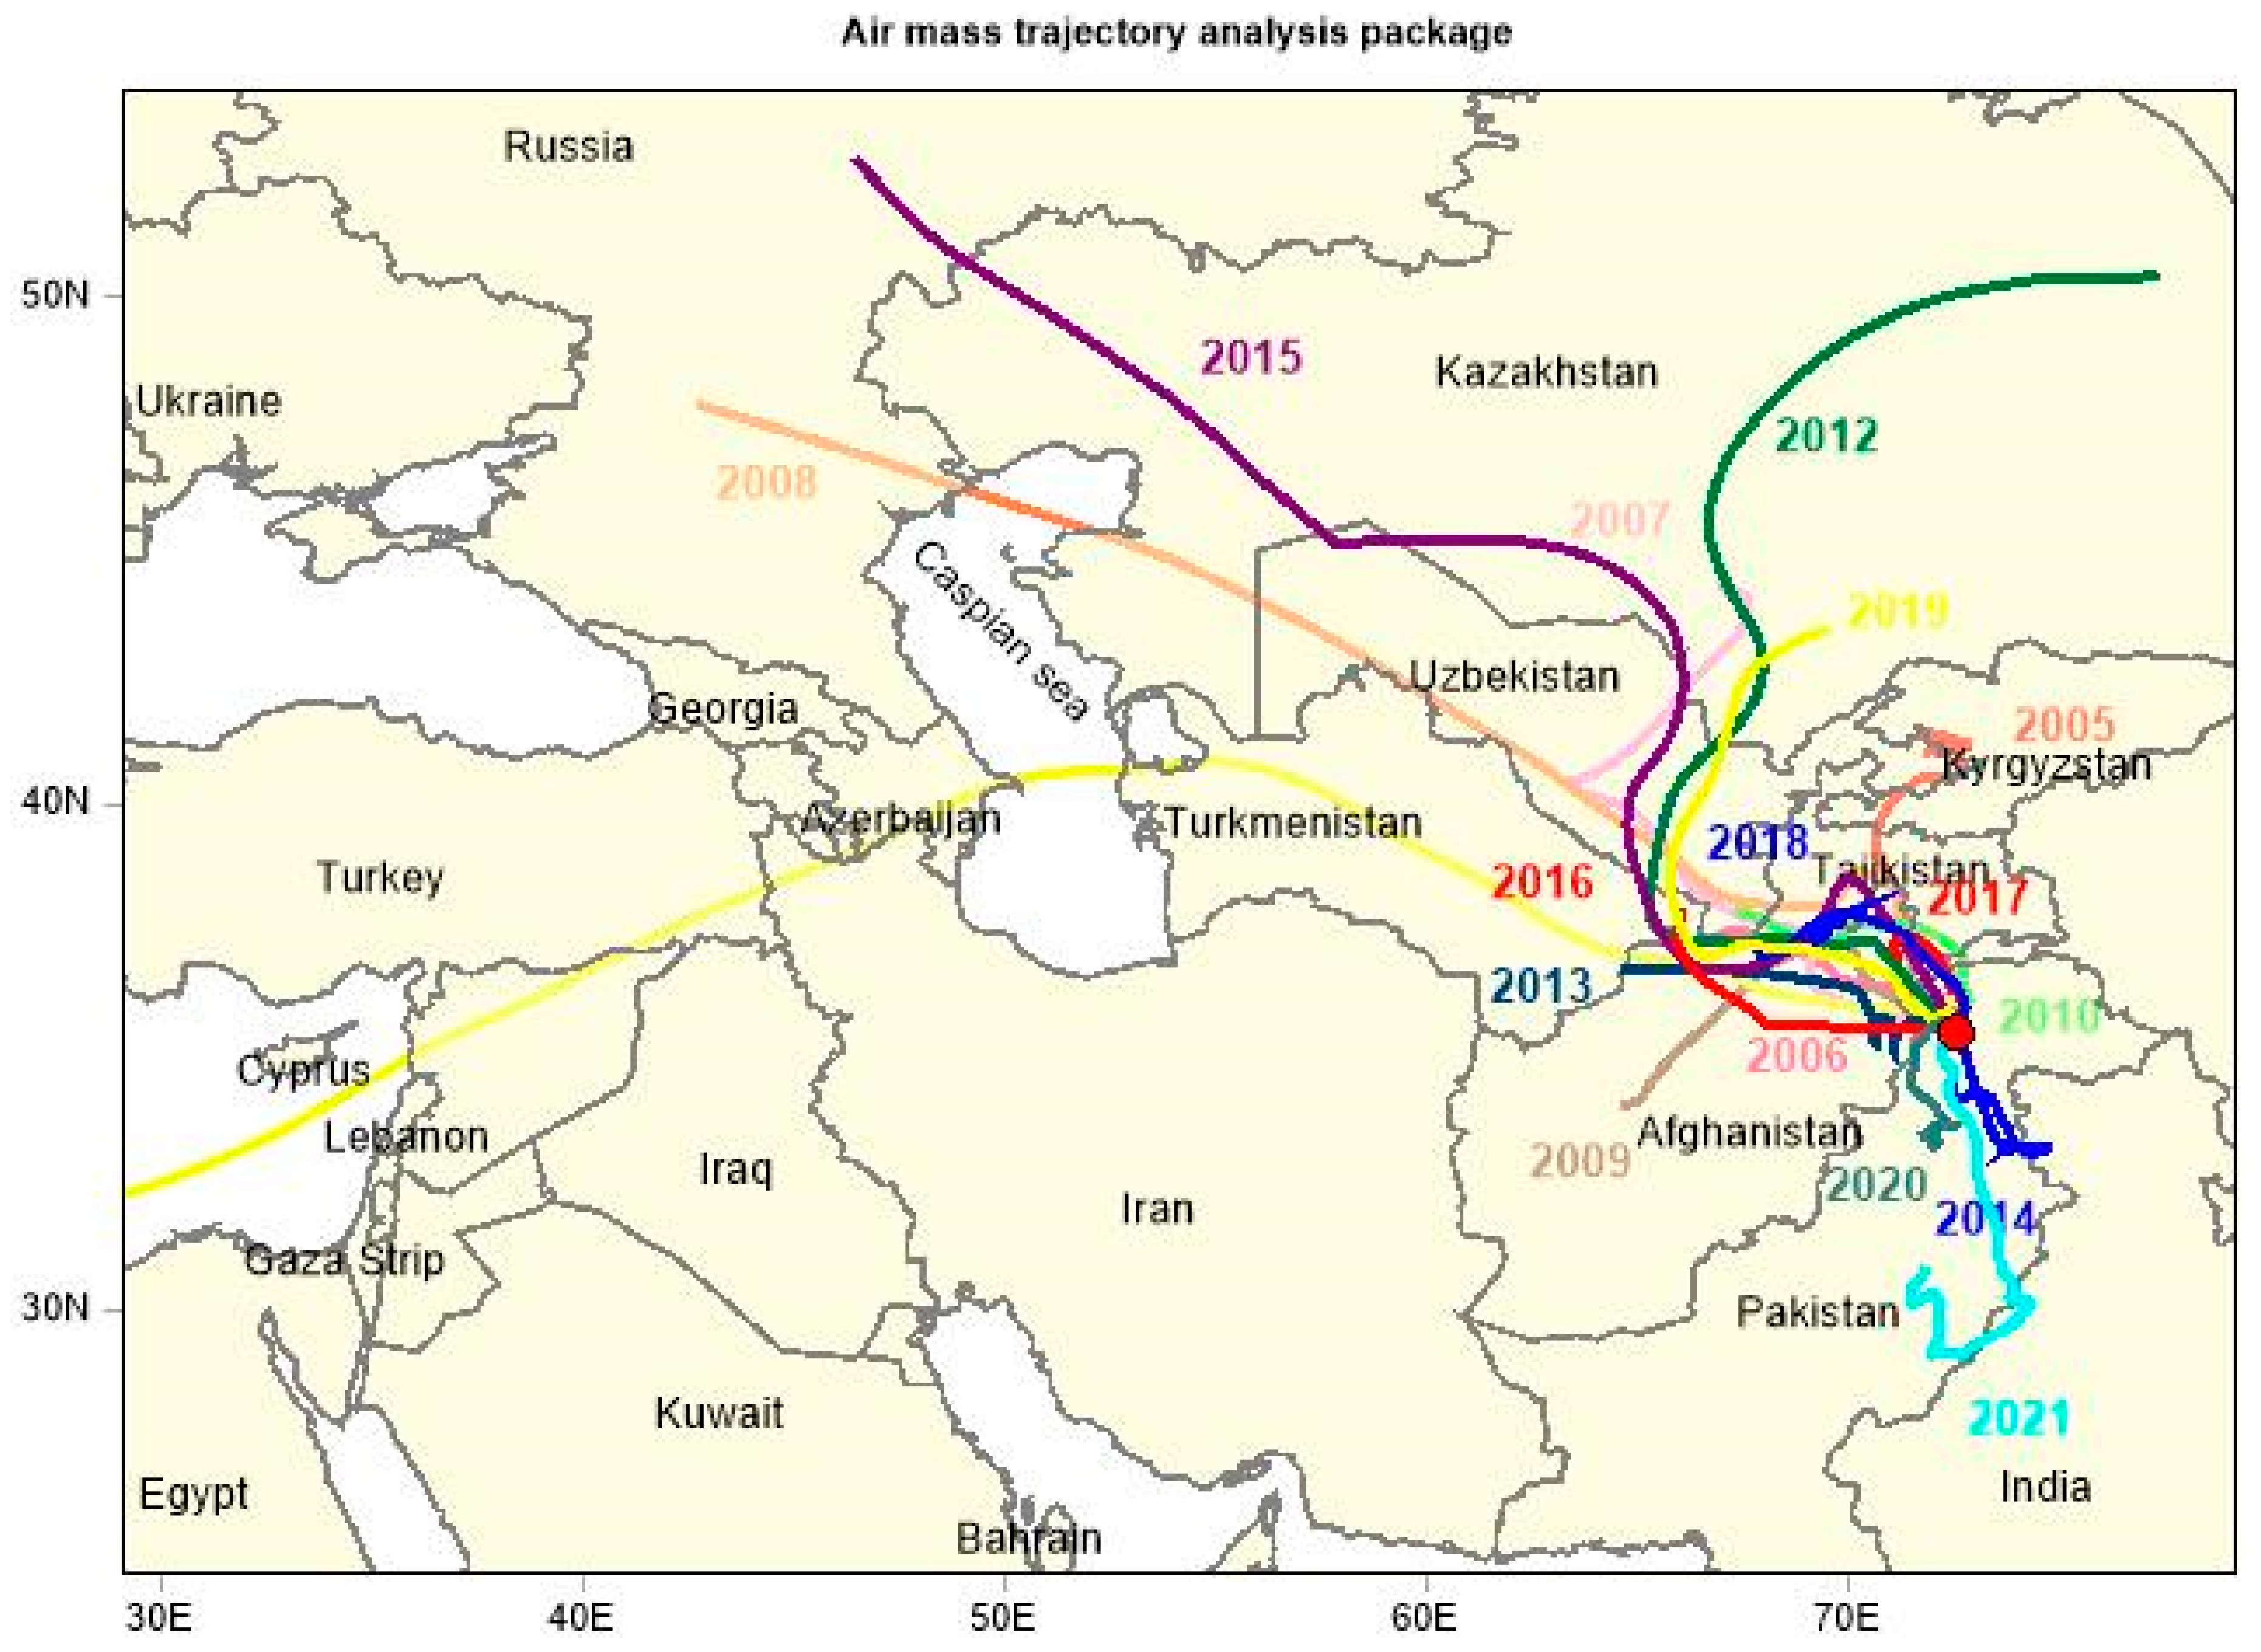
3.3. Air Mass Trajectory Analysis

The air mass trajectory analysis is carried out worldwide to understand the contribution of atmospheric particles that have travelled long distances to reach the receptor region. This analysis aids in statistically identifying the source regions and possible pathways followed by the pollutants [36,37,38]. In this study, the data of meteorological inputs were retrieved from the National Centers for Environmental Prediction (NCEP) Global Data Assimilation System (GDAS) with a horizontal resolution of 1.0° × 1.0°. The data were obtained from the website (https://www.ready.noaa.gov/ready2-bin/extract/extracta.pl, accessed on 20 March 2021). These data were used as an input into the TrajStat, which is a geographical information-based software (GIS) that determines the direction and distance travelled by the air masses [39].

4. Results and Discussions

4.1. Temporal Variation in Surface Mass Concentration of Light-Absorbing Aerosols

Figure 3 shows the monthly and seasonal averaged temporal variation in surface mass concentration of BC, OC, and dust over the study region from 2001 to 2021. The monthly averaged BC and OC surface mass concentration showed a decreasing pattern from January to attain its lowest values in April and May, and then gradually increased to achieve its maximum value in November. The seasonal averaged BC surface mass concentration was found to be highest in winter (0.31 ± 0.04 µg/m3), followed by autumn (0.29 ± 0.06 µg/m3), summer (0.18 ± 0.01 µg/m3), and the lowest BC concentration occurred in spring (0.17 ± 0.01 µg/m3) (Figure 3a,b). Meanwhile, the maximum OC concentration occurred in autumn (1.32 ± 0.32 µg/m3), followed by winter (1.16 ± 0.17 µg/m3), summer (0.90 ± 0.089 µg/m3), and the lowest OC concentration was detected in spring (0.73 ± 0.08 µg/m3) (Figure 3c,d). The higher BC and OC surface mass concentrations in winter and autumn are attributed to the lower temperature, which results in the shallowing of the surface boundary layer; hence, pollutants are trapped in a lesser volume. Moreover, the greater usage of wood and coal for indoor cooking and heating purposes in these seasons increases BC and OC concentrations [25,40]. In addition, hazy and foggy conditions can trap pollutants in the atmosphere and increase their surface mass concentration. The slightly higher surface mass concentration of OC than BC in autumn shows the dominance of the biomass burning process over fossil fuel combustion in this season, as biomass burning emits more OC than BC [41]. In contrast, the lower concentrations of BC and OC in spring were due to the uplifting of the planetary boundary layer height, resulting in the dispersion of pollutants. Furthermore, the anthropogenic emissions of BC and OC from fossil fuel combustion and biomass burning processes are significantly lower in the spring season. Moreover, the lowest concentrations of BC and OC observed in spring are also associated with washout processes caused by the severe precipitation in this season (Figure 2b).
In contrast, the monthly averaged dust surface mass concentration was significantly higher compared to BC and OC, and showed the opposite variational pattern, having its highest peak in July (48 ± 12 µg/m3) and lowest peak in December (8 ± 2 µg/m3). Additionally, the seasonal averaged dust surface mass concentration was greatest in summer (44 ± 9 µg/m3), followed by spring (34 ± 6 µg/m3), autumn (19 ± 4 µg/m3), and the smallest dust surface mass concentration occurred in winter (13 ± 2 µg/m3) (Figure 3e,f). The highest surface mass concentration of dust in summer was attributed to the dust storms or events that occurred in arid regions and were transported to the study area. Furthermore, the density of tourists in the summer season in these regions is greater as compared to other seasons, which significantly contributes to road resuspension dust. In addition, more agriculture activities, construction, and demolition of roads and buildings, etc., are carried out in the summer season and also contribute to dust elevation during this season. In addition, due to the dry weather in the summer (Figure 2), the soil is more susceptible to erosion, which increases the dust surface mass concentration in the atmosphere. Moreover, dry conditions can cause vegetation to die off or become less robust, which can leave the soil more exposed and susceptible to erosion. When soil is exposed, it can be more easily carried away by the wind, resulting in more dust in the air. The higher concentration of these absorbing aerosols, especially mineral dust, is quite alarming and has a direct impact on the melting of the glaciers. The increased dust surface mass concentration can darken the surface of the snow and hence enhance the absorption of solar radiation, which can accelerate the melting process [42].

4.2. Spatial Variation in Surface Mass Concentration of Light-Absorbing Aerosols

The spatial variation in BC, OC, and dust surface mass concentration on a seasonal and monthly basis during 2001–2021 over the study area of northern Pakistan is shown in Figure 4a–c (see supplementary material in Figures S1–S3 for monthly spatial distribution of BC, OC, and dust). The spatial variation in BC mass concentration showed an elevation from northeast to southwest, having a range from 0.0 to 1.26 µg/m3 over the study area. The southwest regions such as Dir, Swat, Kohistan, and Diamir were found to have a high BC surface mass concentration, while the northeast regions such as Hunza Nagar, Skardu, and Ghizir were found to have a low BC surface mass concentration. Furthermore, the spatial variation in BC mass concentration was much more prominent in the winter and autumn seasons, while the variation in concentration between these regions was less significant during the spring and summer seasons. Moreover, the surface mass concentration of OC varied spatially from 0.0 to 5.58 µg/m3, and showed a similar variation to that of BC, having a higher concentration in the southwest regions (Dir, Swat, Kohistan, and Diamir) as compared to the northeast regions (Hunza Nagar, Skardu, and Ghizir). Additionally, the differences in spatial variations were more obvious in the winter and autumn seasons as compared to spring and summer. These results also support the temporal variation in BC and OC surface mass concentration, as discussed earlier. The elevation in BC and OC concentration from northeast to southwest regions is attributed significantly to the huge difference in population density between these regions (Table 1). The greater population density of Dir, Swat, Kohistan, and Diamir has led to an increase in the anthropogenic activities, such as biomass burning, biofuels, and fossil fuel consumption [43,44,45]. In addition, the spatial variation in BC and OC surface mass concentration is influenced by the long-range transportation, especially anthropogenic emitted atmospheric aerosols. The southwest regions such as Chitral, Kohistan, Swat, and Dir are highly exposed to long range transportation, as compared to northeast regions which are mainly covered by big and high mountains, impeding the long-range transportation of atmospheric pollutants. Moreover, the similar spatial variation in OC mass concentration with that in BC concentration is because both are produced from the same origin [46].
The spatial variation in dust mass concentration on a seasonal basis is shown in Figure 4c (see supplementary material in Figure S3 for monthly spatial variation in dust mass concentration). In general, the seasonal averaged concentration of dust varied spatially from 0 to 120 µg/m3. The dust concentration was higher in the southwest regions (Dir, Swat, Kohistan, and Diamir), while being lower in the northeast regions (Gilgit, Hunza Nagar, Skardu, and Ghizir) of the study area, except in the northeast corner (China). The high concentrations of dust in the southwest regions of the study area such as Dir, Swat, Kohistan, and Diamir are attributed to its closeness to the central Asian regions, especially Tajikistan, Uzbekistan, as well as Afghanistan. These regions consist of many deserts; hence, the transportation of dust occurs over a distant range from these regions to southwest regions of the study site, which is further confirmed by air mass trajectory analysis [47]. Furthermore, the population density of the southwest regions of the study area is high, which contributes to dust mass concentration due to re-suspended road dust, agricultural activities, construction, and demolition [48]. The high dust concentration in the northeast corner (China) of the study area is because of its proximity to the Taklimakan Desert [43]. Moreover, the monthly and seasonal spatial variation in dust surface mass concentration was high in summer and low in winter, which is consistent with the monthly and seasonal temporal variations in dust mass concentration over the study area.

4.3. Temporal Variation in Optical Properties of Light-Absorbing Aerosols

Figure 5a–d shows the monthly and seasonal averaged temporal variation in light-absorbing aerosol optical characteristics (AOD, AAOD, SSA) over the study region from 2005 to 2021. The results revealed that the AOD showed an increasing trend from January to attain its highest monthly averaged value (0.52 ± 0.06) during July, and then started to decrease, achieving its lowest value (0.16 ± 0.07) during December. Therefore, the AOD was higher during summer (0.48 ± 0.05), followed by spring (0.35 ± 0.07), autumn (0.28 ± 0.05), and was lowest in the winter (0.23 ± 0.09). A similar variational pattern to AOD was detected for AAOD, having the maximum monthly averaged value during July (0.028 ± 0.005) and the minimum in December (0.013 ± 0.008). Furthermore, the AAOD value was higher during summer (0.029 ± 0.002), followed by spring (0.023 ± 0.003), autumn (0.021 ± 0.004), and was lowest in the winter (0.016 ± 0.006) season (Figure 5c,d). Dust is a major contributor to the AOD and AAOD, as compared to other types of aerosol (BC and OC etc.) [15]. AAOD and AOD follow similar seasonal patterns due to their relationship with dust aerosols in the atmosphere (see Figure 6). Therefore, the elevated values of AOD and AAOD during the summer are attributed to high concentrations of dust, as observed in Figure 3e,f. Furthermore, higher AOD and AAOD values in summer are due to less precipitation and higher temperatures, as depicted in Figure 2, leading to drier conditions that cause more dust to be suspended in the air. Additionally, there are more human activities such as construction and agriculture, which contribute to higher AOD and AAOD. Moreover, the long-range transportation of dust by westerly winds from different regions, such as the Thar Desert, Sahara Desert, Middle East, and West Asia, and its travel over the Indo-Gangetic Plain where it eventually arrives to the Himalaya region, increases the AOD and AAOD [15]. In contrast, during winter, there is generally more precipitation and the temperatures are lower (Figure 2), which makes it harder for dust and other aerosols to become airborne. Therefore, winter has the lowest values of AOD and AAOD. In addition, the speedy winds in the winter (Figure 2) season favored the dispersion of the dust aerosols, which resulted in a reduction in AOD and AAOD. Furthermore, many outdoor activities such as agriculture and construction are decreased during winter.
The scattering coefficient to extinction coefficient ratio is specified as SSA, with theoretical values ranging from 0 to 1. In the visible and UV spectrums, SSA is typically between 0.5 and 1.0, and variations in SSA can lead to changes in aerosol radiative forcing, which influence climate [19]. The monthly SSA value was greatest in May (0.939 ± 0.011) and smallest in October (0.923 ± 0.007). Additionally, SSA values were higher during summer (0.936 ± 0.003), followed by spring (0.932 ± 0.009), winter (0.932 ± 0.016), and lowest in the autumn (0.926 ± 0.004) season. During summer, SSA values were high due to the coarse particles that enhance aerosol scattering efficiency [3,19]. Low SSA values in autumn indicate that local fine pollution aerosols might contribute more to SSA than dust [3].

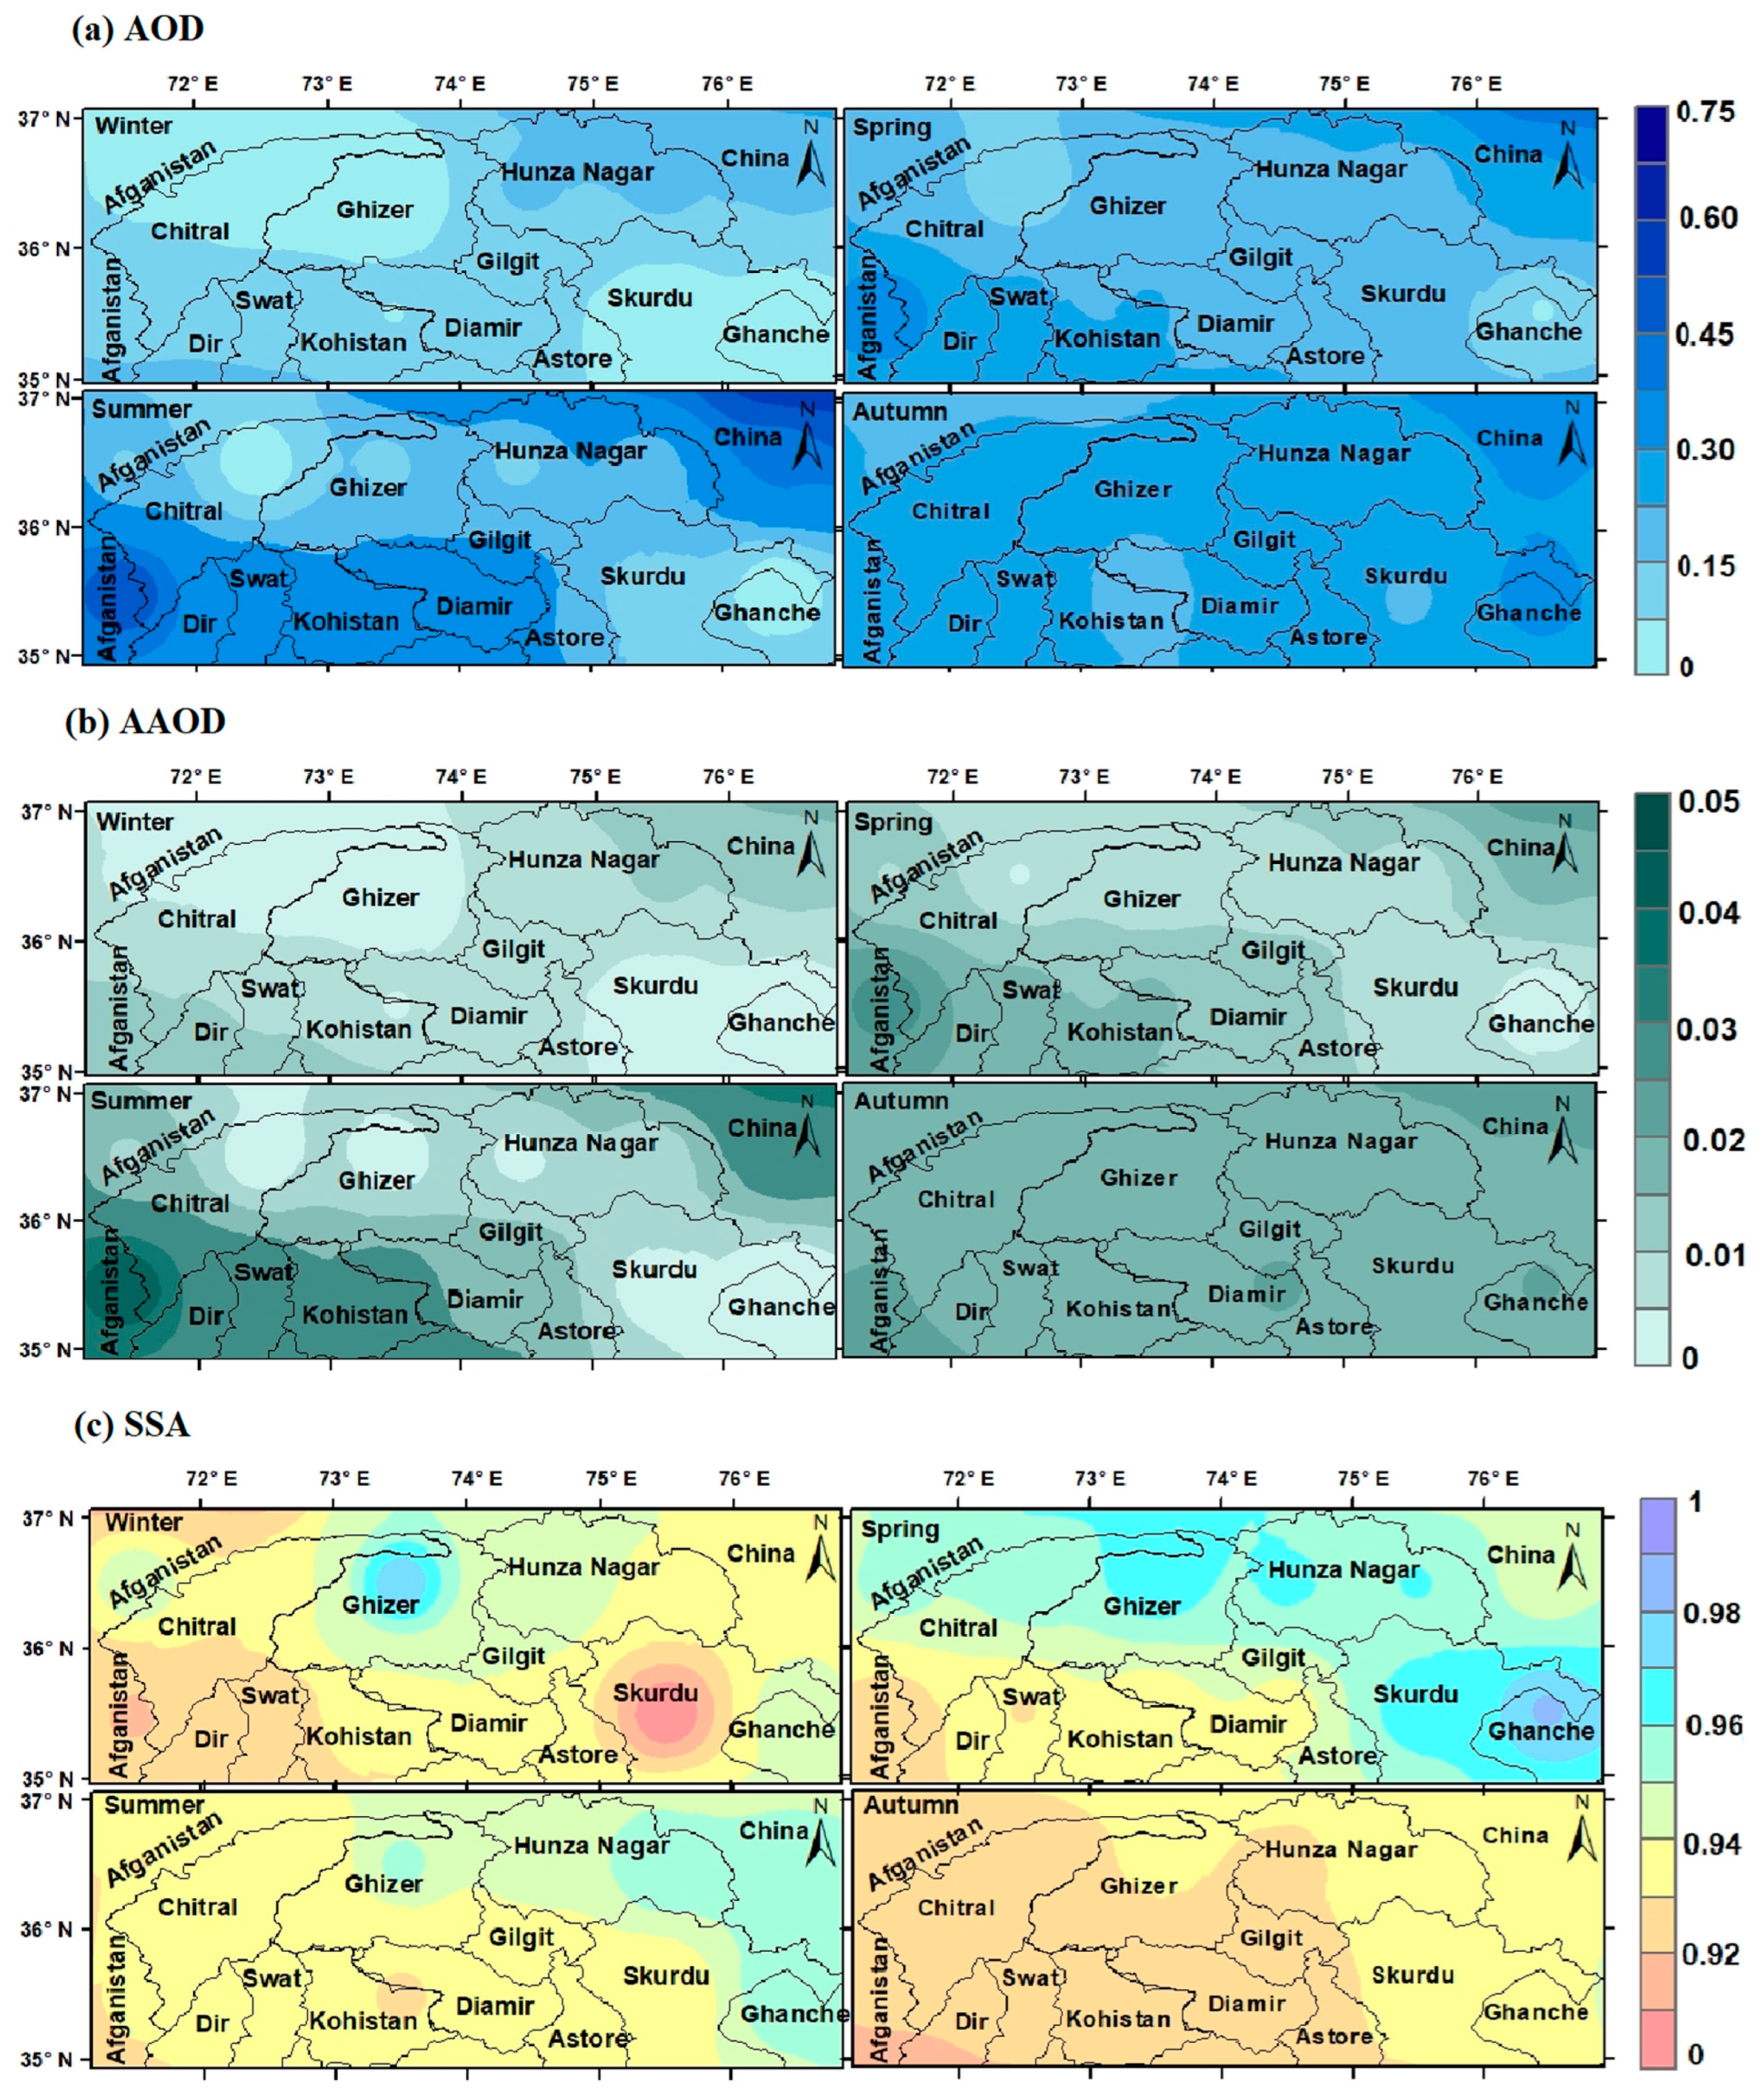
4.4. Spatial Variation in Optical Properties of Light-Absorbing Aerosols

The seasonal maps of spatial variation in AOD, AAOD, and SSA are presented in Figure 6a–c (see supplementary material in Figures S4–S6 for monthly spatial distribution of AOD, AAOD, and SSA). The spatial distribution of AOD and AAOD values indicated the distinct features of aerosol loadings and followed a similar pattern of spatial variation due to a strong and positive correlation of 0.97 over the study area (Figure 7). In general, the AOD and AAOD values were higher in the southwest (Dir, Swat, Kohistan, etc.) regions, while these were lower in the northeast (Gilgit, Hunza Nagar, Skardu, and Ghizir) regions, except the northeast corner (China) of the study area. Moreover, higher values of AOD and AAOD were observed in summer and lower values were observed in winter.
The higher values of AOD and AAOD over the southwest regions (Dir, Swat, Kohistan, etc.) and smaller AOD and AAOD values in the northeast (Gilgit, Hunza Nagar, Skardu, and Ghizir) regions of the study area are mainly attributed to the corresponding differences in dust aerosol concentration (Figure 4c). The correlations of dust with AOD and AAOD were determined to be 0.94 and 0.92 (Figure 7), indicating that dust is the only major species contributing to AOD and AAOD. The contributions of BC and OC aerosols to AOD and AAOD in our study area are less, indicating that this area is less influenced by human anthropogenic activity. However, the higher AAOD in the northeast corner (China) of the study area is due to high dust aerosol concentration as a result of its proximity to the Taklimakan Desert [43]. Moreover, the monthly and seasonal spatial variations in AOD and AAOD were high in summer and low in winter and are consistent with the monthly and seasonal temporal variations in dust mass concentration over the study area. In addition, high values of SSA were found in the northeast regions (Gilgit, Hunza Nagar, Skardu, and Ghizir) of the study area due to lower concentrations of absorbing aerosols, while low values of SSA were found in the southwest regions (Dir, Swat, Kohistan, etc.) due to higher concentrations of absorbing aerosols. Furthermore, southwest (Dir, Swat, Kohistan, etc.) regions have a high population density, which leads to more anthropogenic emissions from activities such as transportation, cooking, heating, burning, etc., due to which there are more absorbing aerosols (BC, OC, dust and other pollutants).

4.5. Relationships between Mass Concentration, Optical, and Meteorological Parameters

The Pearson correlation coefficient was used to investigate the key links between light-absorbing aerosol concentration (BC, OC, and dust), optical properties (AOD, AAOD, and SSA), and meteorological parameters over northern Pakistan on a monthly-averaged basis during the study period, as shown in Figure 7. The relationships were found through statistical analysis of variance and the p-value was used to calculate the statistical level of significance in terms of the correlation coefficient (R). For probability value (p) < 0.05, the value of R will be considered significant [49]. The correlation between BC and OC is determined to be 0.93, indicating that both originate from a single source, that is, the source of combustion [46]. The correlations of BC and OC with dust were found to be −0.87 and −0.69, respectively, showing an inverse relationship and independent sources of production. BC correlations with AOD and AAOD were determined to be −0.75 and −0.74, respectively, indicating that BC is not a species contributing to AOD and AAOD seasonal (monthly) variation [50]. The correlations of BC and OC with WS were found to be 0.95 and 0.88, respectively, indicating that an increase in WS increases mixing and ventilation, transporting aerosols to the study area [15]. The correlation of BC with temperature was found to be −0.70; the explanation for the negative correlation is that high temperatures stimulate air convection, which causes the dilution and dispersion of concentration [51]. The correlation between OC and temperature was found to be −0.70, indicating that low temperatures favor low mixing heights, which restrict the vertical mixing of air pollutants and raise the ultimate pollution load [52]. The correlations of dust with AOD and AAOD were found to be 0.94 and 0.92, respectively, showing that dust is the only major species contributing to AOD and AAOD seasonal (monthly) variation. The correlation of dust with SSA was found to be 0.64, indicating that most of the scattering was due to dust aerosols. The correlation of dust with WS was found to be −0.79, which indicates the diffusion and dilution of dust aerosol concentration [53]. All other correlations were weak and statistically insignificant.

4.6. Long-Range Aerosol Transportation over the Study Area

The long-range transportation of aerosols is one of the main factors that increases the concentration in the regional atmosphere. Hence, the long-range air mass trajectory analysis is carried out over the study region. As the back trajectories can be calculated at multiple atmospheric levels, desert aerosols have been observed to travel at altitudes of up to 5000 m. Furthermore, trajectories at higher altitudes are often used for long-range transport studies [54]; therefore, the five days back-trajectory analysis of an air parcel at a height of 1500 m was examined for a particular date in each year, as shown in Figure 8. The dates were chosen on the basis of the highest AOD values in each year, as presented in Table 2. The coordinates chosen were 35.50N, 72.50E, which are defined for the Swat region. This region has a greater AOD as compared to other districts, which can be seen in Figure 6a. It is evident from the Figure 8 that the study region was mostly influenced by the western parts, especially Afghanistan and central Asia. The air parcel from distant regions such as Russia, Kazakhstan, Egypt, Turkmenistan, Uzbekistan, and Azerbaijan travelled over Afghanistan and Tajikistan to reach the study region. These regions consist of large deserts such as the Kyzylkum desert, Karakum Desert, Registan deserts, etc., [55,56], which are found to be the main source regions to affect the dust concentration of the study region (northern Pakistan). Moreover, it was also found that in 2014, 2020, and 2021, the air masses travelled from lower latitudes of local regions to reach the study site, which can contribute to regional concentration by carrying the road resuspension dust. This analysis supports the spatial variation in dust surface mass concentration (Figure 4c), which was found to be higher in the southwestern regions of the study site, and was much closer to Afghanistan and Tajikistan than the other regions of the study site.

5. Conclusions

In this research, the spatiotemporal variation in light-absorbing aerosols surface mass concentration, optical properties, and their relationships with meteorological parameters were investigated over northern Pakistan from 2001 to 2021. The results showed that BC and OC concentrations were highest in winter and autumn, respectively, while these concentrations were lowest in the spring season. This seasonal variability is attributed to various factors, including solid fuels, weather conditions, changes in vegetation, agricultural activities, biomass burning, and human activities. Similarly, dust concentration was found to be highest in the summer season due to drier conditions, dust activities, long range transport, and human activities. In contrast, the dust concentration was detected to be the lowest in the winter season. The research also revealed that the concentrations of BC, OC, and dust were higher in densely populated areas. Moreover, AOD and AAOD were higher during summer due to high concentrations of dust aerosols, which were transported from different regions and enhanced regional dust activities. The lowest AOD and AAOD values in the winter season were due to higher precipitation rates and speedy winds that dispersed the dust aerosols. In addition, the AOD and AAOD values in the southwest regions were higher as compared to the northeast regions of the study area. This difference is due to the higher concentration of dust aerosols in the southwest regions as compared to the northeast regions. Furthermore, AOD and AAOD spatial variation over the study area followed a similar pattern. In addition, SSA values were the highest in summer due to coarse particles that enhanced aerosol scattering efficiency. The concentration and optical properties of light-absorbing aerosols are significantly influenced by various meteorological parameters such as temperature, precipitation, and wind speed. In winter, the shallow boundary layers caused by low temperatures lead to increased concentrations of BC and OC, whereas heavy precipitation during spring reduces their concentrations. In the summer, dry conditions can cause high dust surface mass concentrations, hence increasing AOD and AAOD values. Conversely, higher rates of precipitation and faster winds in winter disperse the dust aerosols, decreasing AOD and AAOD values. The positive and strong correlations between BC and OC, and AOD with dust further validated the findings. Overall, the research provides useful insights into the sources, patterns, and transport of light-absorbing aerosols in northern Pakistan.

Supplementary Materials

The following supporting information can be downloaded at: https://www.mdpi.com/article/10.3390/rs15102527/s1, Figure S1: Monthly averaged spatial variation of BC surface mass concentration during 2001–2021 over the study area of northern Pakistan; Figure S2: Monthly averaged spatial variation of OC surface mass concentration during 2001–2021 over the study area of northern Pakistan; Figure S3: Monthly averaged spatial variation of dust surface mass concentration during 2001–2021 over the study area of northern Pakistan; Figure S4: Monthly averaged spatial variation of AOD surface mass concentration during 2005–2021 over the study area of northern Pakistan; Figure S5: Monthly averaged spatial variation of AODD surface mass concentration during 2005–2021 over the study area of northern Pakistan; Figure S6: Monthly averaged spatial variation of SSA surface mass concentration during 2005–2021 over the study area of northern Pakistan.

Author Contributions

Conceptualization, S.S.A.S. and K.A.; methodology, S.S.A.S.; software, E.u.H.; validation, K.A. and Z.H.; formal analysis, S.S.A.S.; writing—original draft preparation, S.S.A.S.; writing—review and editing, Z.H. and E.u.H.; supervision, K.A. All authors have read and agreed to the published version of the manuscript.

Funding

This research received no external funding.

Acknowledgments

The authors thank the OMI (http://goivanni.gsfc.nasa.gov/ accessed on 20 June 2018) scientific teams for providing the satellite data used in this investigation, as well as the ECMWF and MERRA reanalysis products and also HYSPLIT for trajectories (http://ready.arl.noaa.gov accessed on 20 March 2021). The authors would also like to thank the editor and all anonymous reviewers whose constructive comments, suggestions, and recommendations significantly improved the manuscript.

Conflicts of Interest

The authors declare no conflict of interest.

References

  1. Charlson, R.J.; Schwartz, S.E.; Hales, J.M.; Cess, R.D.; Coakley, J.A.; Hansen, J.E.; Hofmann, D.J. Climate Forcing by Anthropogenic Aerosols. Science 1992, 255, 423–430. [Google Scholar] [CrossRef] [PubMed]
  2. Li, J.; Lv, Q.; Zhang, M.; Wang, T.; Kawamoto, K.; Chen, S.; Zhang, B. Effects of Atmospheric Dynamics and Aerosols on the Fraction of Supercooled Water Clouds. Atmos. Chem. Phys. 2017, 17, 1847–1863. [Google Scholar] [CrossRef]
  3. Zeb, B.; Alam, K.; Sorooshian, A.; Chishtie, F.; Ahmad, I.; Bibi, H. Temporal Characteristics of Aerosol Optical Properties over the Glacier Region of Northern Pakistan. J. Atmos. Sol.-Terr. Phys. 2019, 186, 35–46. [Google Scholar] [CrossRef]
  4. Panicker, A.S.; Lee, D.I.; Kumkar, Y.V.; Kim, D.; Maki, M.; Uyeda, H. Decadal Climatological Trends of Aerosol Optical Parameters over Three Different Environments in South Korea. Int. J. Climatol. 2013, 33, 1909–1916. [Google Scholar] [CrossRef]
  5. Liu, J.; Du, Z.; Gordon, M.; Liang, L.; Ma, Y.; Zheng, M.; Cheng, Y.; He, K. The Characteristics of Carbonaceous Aerosol in Beijing during a Season of Transition. Chemosphere 2018, 212, 1010–1019. [Google Scholar] [CrossRef]
  6. Zhang, Y.; Kang, S.; Cong, Z.; Schmale, J.; Sprenger, M.; Li, C.; Yang, W.; Gao, T.; Sillanpää, M.; Li, X.; et al. Light-Absorbing Impurities Enhance Glacier Albedo Reduction in the Southeastern Tibetan Plateau. J. Geophys. Res. 2017, 122, 6915–6933. [Google Scholar] [CrossRef]
  7. Skiles, S.M.; Flanner, M.; Cook, J.M.; Dumont, M.; Painter, T.H. Radiative Forcing by Light-Absorbing Particles in Snow. Nat. Clim. Chang. 2018, 8, 964–971. [Google Scholar] [CrossRef]
  8. Moosmüller, H.; Chakrabarty, R.K.; Arnott, W.P. Aerosol Light Absorption and Its Measurement: A Review. J. Quant. Spectrosc. Radiat. Transf. 2009, 110, 844–878. [Google Scholar] [CrossRef]
  9. Warren, S. A Model for the Spectral Albedo of Snow. II: Snow Containing Atmospheric Aerosols. Artic. J. Atmos. Sci. 1980, 37, 2734–2745. [Google Scholar] [CrossRef]
  10. Doherty, S.J.; Grenfell, T.C.; Forsström, S.; Hegg, D.L.; Brandt, R.E.; Warren, S.G. Observed Vertical Redistribution of Black Carbon and Other Insoluble Light-Absorbing Particles in Melting Snow. J. Geophys. Res. Atmos. 2013, 118, 5553–5569. [Google Scholar] [CrossRef]
  11. Hansen, J.; Nazarenko, L. Soot Climate Forcing via Snow and Ice Albedos. Proc. Natl. Acad. Sci. USA 2004, 101, 423–428. [Google Scholar] [CrossRef]
  12. Hansen, J.; Sato, M.; Ruedy, R.; Nazarenko, L.; Lacis, A.; Schmidt, G.A.; Russell, G.; Aleinov, I.; Bauer, M.; Bauer, S.; et al. Efficacy of Climate Forcings. J. Geophys. Res. D Atmos. 2005, 110, 1–45. [Google Scholar] [CrossRef]
  13. Horvath, H. Atmospheric Light Absorption-A Review. Atmos. Environ. Part A Gen. Top. 1993, 27, 293–317. [Google Scholar] [CrossRef]
  14. Sanap, S.D.; Pandithurai, G. The Effect of Absorbing Aerosols on Indian Monsoon Circulation and Rainfall: A Review. Atmos. Res. 2015, 164–165, 318–327. [Google Scholar] [CrossRef]
  15. Nasir, J.; Zeb, B.; Sorooshian, A.; Mansha, M.; Alam, K.; Ahmad, I.; Rizvi, H.H.; Shafiq, M. Spatio-Temporal Variations of Absorbing Aerosols and Their Relationship with Meteorology over Four High Altitude Sites in Glaciated Region of Pakistan. J. Atmos. Sol.-Terr. Phys. 2019, 190, 84–95. [Google Scholar] [CrossRef]
  16. Goelles, T.; Bøggild, C.E.; Greve, R. Ice Sheet Mass Loss Caused by Dust and Black Carbon Accumulation. Cryosphere 2015, 9, 1845–1856. [Google Scholar] [CrossRef]
  17. Di Mauro, B.; Fava, F.; Ferrero, L.; Garzonio, R.; Baccolo, G.; Delmonte, B.; Colombo, R. Mineral Dust Impact on Snow Radiative Properties in the European Alps Combining Ground, UAV, and Satellite Observations. J. Geophys. Res. 2015, 120, 6080–6097. [Google Scholar] [CrossRef]
  18. Immerzeel, W.W.; Van Beek, L.P.H.; Bierkens, M.F.P. Climate Change Will Affect the Asian Water Towers. Science 2010, 328, 1382–1385. [Google Scholar] [CrossRef]
  19. Kang, L.; Chen, S.; Huang, J.; Zhao, S.; Ma, X.; Yuan, T.; Zhang, X.; Xie, T. The Spatial and Temporal Distributions of Absorbing Aerosols over East Asia. Remote Sens. 2017, 9, 1050. [Google Scholar] [CrossRef]
  20. Xu, B.; Cao, J.; Joswiak, D.R.; Liu, X.; Zhao, H.; He, J. Post-Depositional Enrichment of Black Soot in Snow-Pack and Accelerated Melting of Tibetan Glaciers. Environ. Res. Lett. 2012, 7, 014022. [Google Scholar] [CrossRef]
  21. Yao, T.; Thompson, L.; Yang, W.; Yu, W.; Gao, Y.; Guo, X.; Yang, X.; Duan, K.; Zhao, H.; Xu, B.; et al. Different Glacier Status with Atmospheric Circulations in Tibetan Plateau and Surroundings. Nat. Clim. Chang. 2012, 2, 663–667. [Google Scholar] [CrossRef]
  22. Ménégoz, M.; Krinner, G.; Balkanski, Y.; Cozic, A.; Boucher, O.; Ciais, P. Boreal and Temperate Snow Cover Variations Induced by Black Carbon Emissions in the Middle of the 21st Century. Cryosphere 2013, 7, 537–554. [Google Scholar] [CrossRef]
  23. Menon, S.; Koch, D.; Beig, G.; Sahu, S.; Fasullo, J.; Orlikowski, D. Atmospheric Chemistry and Physics Black Carbon Aerosols and the Third Polar Ice Cap. Atmos. Chem. Phys. 2010, 10, 4559–4571. [Google Scholar] [CrossRef]
  24. Gul, C.; Praveen Puppala, S.; Kang, S.; Adhikary, B.; Zhang, Y.; Ali, S.; Li, Y.; Li, X. Concentrations and Source Regions of Light-Absorbing Particles in Snow/Ice in Northern Pakistan and Their Impact on Snow Albedo. Atmos. Chem. Phys. 2018, 18, 4891–5000. [Google Scholar] [CrossRef]
  25. Zeb, B.; Alam, K.; Nasir, J.; Mansha, M.; Ahmad, I.; Bibi, S.; Malik, S.M.; Ali, M. Black Carbon Aerosol Characteristics and Radiative Forcing over the High Altitude Glacier Region of Himalaya-Karakorum-Hindukush. Atmos. Environ. 2020, 238, 117711. [Google Scholar] [CrossRef]
  26. Jilani, R.; Haq, M.; Naseer, A. A Study of Glaciers in Northern Pakistan. 2007. Available online: https://www.eorc.jaxa.jp/ALOS/conf/Proc_PIsymp2007/contents/proceedings/Land_Snow_and_Ice/LSI06.pdf (accessed on 10 February 2017).
  27. Ahmad, M.; Alam, K.; Tariq, S.; Blaschke, T. Contrasting Changes in Snow Cover and Its Sensitivity to Aerosol Optical Properties in Hindukush-Karakoram-Himalaya Region. Sci. Total Environ. 2020, 699, 134356. [Google Scholar] [CrossRef] [PubMed]
  28. Jegede, O.O. Variation of Rainfall and Humidity in Nigeria. IISTE J. Environ. Earth Sci. 2014, 4, 29–37. [Google Scholar]
  29. Millet, T.; Bencherif, H.; Bounhir, A.; Bègue, N.; Lamy, K.; Ranaivombola, M.; Benkhaldoun, Z.; Portafaix, T.; Duflot, V. Aerosol Distributions and Transport over Southern Morocco from Ground-Based and Satellite Observations (2004–2020). Atmosphere 2022, 13, 923. [Google Scholar] [CrossRef]
  30. Colarco, P.; Da Silva, A.; Chin, M.; Diehl, T. Online Simulations of Global Aerosol Distributions in the NASA GEOS-4 Model and Comparisons to Satellite and Ground-Based Aerosol Optical Depth. J. Geophys. Res. Atmos. 2010, 115, D14. [Google Scholar] [CrossRef]
  31. Buchard, V.; da Silva, A.M.; Randles, C.A.; Colarco, P.; Ferrare, R.; Hair, J.; Hostetler, C.; Tackett, J.; Winker, D. Evaluation of the Surface PM2.5 in Version 1 of the NASA MERRA Aerosol Reanalysis over the United States. Atmos. Environ. 2016, 125, 100–111. [Google Scholar] [CrossRef]
  32. Solanki, R.; Pathak, K.N. Study of Black Carbon (BC) Mass Concentration Variation at a Coastal Region (Surat). Environ. Sci. Proc. 2021, 4, 16. [Google Scholar] [CrossRef]
  33. Sati, A.P.; Mohan, M. Analysis of Air Pollution during a Severe Smog Episode of November 2012 and the Diwali Festival over Delhi, India. Int. J. Remote Sens. 2014, 35, 6940–6954. [Google Scholar] [CrossRef]
  34. Tanskanen, A.; Lindfors, A.; Määttä, A.; Krotkov, N.; Herman, J.; Kaurola, J.; Koskela, T.; Lakkala, K.; Fioletov, V.; Bernhard, G.; et al. Validation of Daily Erythemal Doses from Ozone Monitoring Instrument with Ground-Based UV Measurement Data. J. Geophys. Res. Atmos. 2007, 112, D24. [Google Scholar] [CrossRef]
  35. Chung, C.E.; Ramanathan, V.; Decremer, D. Observationally Constrained Estimates of Carbonaceous Aerosol Radiative Forcing. Proc. Natl. Acad. Sci. USA 2012, 109, 11624–11629. [Google Scholar] [CrossRef]
  36. ul Haq, E.; Alam, K.; Bibi, S.; Roy, A. High Concentration of Black Carbon in Northern Pakistan: Characteristics, Source Apportionment and Emission Source Regions. Atmos. Environ. 2023, 293, 119475. [Google Scholar] [CrossRef]
  37. Fang, C.; Xue, K.; Li, J.; Wang, J. Characteristics and Weekend Effect of Air Pollution in Eastern Jilin Province. Atmosphere 2022, 13, 681. [Google Scholar] [CrossRef]
  38. Wang, Q.; Zhao, T.; Wang, R.; Zhang, L. Backward Trajectory and Multifractal Analysis of Air Pollution in Zhengzhou Region of China. Math. Probl. Eng. 2022, 2022, 2226565. [Google Scholar] [CrossRef]
  39. Wang, Y.Q.; Zhang, X.Y.; Draxler, R.R. TrajStat: GIS-Based Software That Uses Various Trajectory Statistical Analysis Methods to Identify Potential Sources from Long-Term Air Pollution Measurement Data. Environ. Model. Softw. 2009, 24, 938–939. [Google Scholar] [CrossRef]
  40. Sandeep, K.; Negi, R.S.; Panicker, A.S.; Gautam, A.S.; Bhist, D.S.; Beig, G.; Murthy, B.S.; Latha, R.; Singh, S.; Das, S. Characteristics and Variability of Carbonaceous Aerosols over a Semi Urban Location in Garhwal Himalayas. Asia-Pacific J. Atmos. Sci. 2020, 56, 455–465. [Google Scholar] [CrossRef]
  41. Zhang, H.; Yin, S.; Bai, L.; Lu, X.; Wang, C.; Gu, X.; Li, Y. Establishment and Evaluation of Anthropogenic Black and Organic Carbon Emissions over Central Plain, China. Atmos. Environ. 2020, 226, 117406. [Google Scholar] [CrossRef]
  42. Li, Y.; Kang, S.; Zhang, X.; Li, C.; Chen, J.; Qin, X.; Shao, L.; Tian, L. Dust Dominates the Summer Melting of Glacier Ablation Zones on the Northeastern Tibetan Plateau. Sci. Total Environ. 2023, 856, 159214. [Google Scholar] [CrossRef] [PubMed]
  43. Zhao, M.; Dai, T.; Wang, H.; He, B.; Bao, Q.; Liu, Y.; Shi, G. Aerosol Characteristics over the Tibetan Plateau Simulated with a Coupled Aerosol–Climate Model (FGOALS-F3-L). Atmos. Ocean. Sci. Lett. 2021, 14, 100031. [Google Scholar] [CrossRef]
  44. Sahu, S.K.; Beig, G.; Sharma, C. Decadal Growth of Black Carbon Emissions in India. Geophys. Res. Lett. 2008, 35, 2807. [Google Scholar] [CrossRef]
  45. Sakerin, S.M.; Kabanov, D.M.; Kopeikin, V.M.; Kruglinsky, I.A.; Novigatsky, A.N.; Pol’kin, V.V.; Shevchenko, V.P.; Turchinovich, Y.S. Spatial Distribution of Black Carbon Concentrations in the Atmosphere of the North Atlantic and the European Sector of the Arctic Ocean. Atmosphere 2021, 12, 949. [Google Scholar] [CrossRef]
  46. Lin, P.; Hu, M.; Deng, Z.; Slanina, J.; Han, S.; Kondo, Y.; Takegawa, N.; Miyazaki, Y.; Zhao, Y.; Sugimoto, N. Seasonal and Diurnal Variations of Organic Carbon in PM2.5in Beijing and the Estimation of Secondary Organic Carbon. J. Geophys. Res. Atmos. 2009, 114, 1–14. [Google Scholar] [CrossRef]
  47. Fattahi Masrour, P.; Rezazadeh, M. Spatio-Temporal Distribution of Various Types of Dust Events in the Middle East during the Period 1996-2015. J. Earth Sp. Phys. 2022, 47, 231–248. [Google Scholar] [CrossRef]
  48. Denier van der Gon, H.; Jozwicka, M.; Hendriks, E.; Gondwe, M.; Schaap, M. Mineral Dust as a Component of Particulate Matter; PBL Netherlands Environment Assessment Agency: Bilthoven, The Netherlands, 2010; Volume 160. [Google Scholar]
  49. Sheoran, R.; Dumka, U.C.; Kaskaoutis, D.G.; Grivas, G.; Ram, K.; Prakash, J.; Hooda, R.K.; Tiwari, R.K.; Mihalopoulos, N. Chemical Composition and Source Apportionment of Total Suspended Particulate in the Central Himalayan Region. Atmosphere 2021, 12, 1228. [Google Scholar] [CrossRef]
  50. Liu, C.; Yang, L.; Che, H.; Xia, X.; Zhao, H.; Wang, H.; Gui, K.; Zheng, Y.; Sun, T.; Li, X.; et al. Aerosol Optical Properties over an Urban Site in Central China Determined Using Ground-Based Sun Photometer Measurements. Aerosol Air Qual. Res. 2019, 19, 620–638. [Google Scholar] [CrossRef]
  51. Zhao, H.; Che, H.; Gui, K.; Ma, Y.; Wang, Y.; Wang, H.; Zheng, Y.; Zhang, X. Interdecadal Variation in Aerosol Optical Properties and Their Relationships to Meteorological Parameters over Northeast China from 1980 to 2017. Chemosphere 2020, 247, 125737. [Google Scholar] [CrossRef]
  52. Sonwani, S.; Saxena, P.; Shukla, A. Carbonaceous Aerosol Characterization and Their Relationship With Meteorological Parameters During Summer Monsoon and Winter Monsoon at an Industrial Region in Delhi, India. Earth Sp. Sci. 2021, 8, e2020EA001303. [Google Scholar] [CrossRef]
  53. Yang, Q.; Yuan, Q.; Li, T.; Shen, H.; Zhang, L. The Relationships between PM2.5 and Meteorological Factors in China: Seasonal and Regional Variations. Int. J. Environ. Res. Public Health 2017, 14, 1510. [Google Scholar] [CrossRef]
  54. Toledano, C.; Cachorro, V.E.; De Frutos, A.M.; Torres, B.; Berjón, A.; Sorribas, M.; Stone, R.S. Airmass Classification and Analysis of Aerosol Types at El Arenosillo (Spain). J. Appl. Meteorol. Climatol. 2009, 48, 962–981. [Google Scholar] [CrossRef]
  55. Li, Y.; Song, Y.; Kaskaoutis, D.G.; Chen, X.; Mamadjanov, Y.; Tan, L. Atmospheric Dust Dynamics in Southern Central Asia: Implications for Buildup of Tajikistan Loess Sediments. Atmos. Res. 2019, 229, 74–85. [Google Scholar] [CrossRef]
  56. Thomas, D.C.; Kidd, F.J. On the Margins: Enduring Pre-Modern Water Management Strategies In and Around the Registan Desert, Afghanistan. J. F. Archaeol. 2017, 42, 29–42. [Google Scholar] [CrossRef]
Figure 1. Study area map of northern Pakistan.
Remotesensing 15 02527 g001
Figure 2. (a) Monthly and (b) seasonally averaged surface meteorological variations during 2001–2021 over the study region.
Remotesensing 15 02527 g002
Figure 3. Monthly and seasonal variation in surface mass concentration of BC (a,b), OC (c,d), and dust (e,f) over the study region from 2001 to 2021.
Remotesensing 15 02527 g003
Figure 4. Seasonal averaged spatial variation in (a) BC, (b) OC, and (c) dust surface mass concentration during 2001–2021 over the study area of northern Pakistan.
Remotesensing 15 02527 g004
Figure 5. Monthly and seasonal average variation in light-absorbing aerosol optical characteristics (AOD, AAOD, SSA) over the study region from 2005 to 2021. (a,c,e) and (b,d,f) correspond to monthly and seasonal variation in AOD, AAOD and SSA, respectively.
Remotesensing 15 02527 g005
Figure 6. Seasonal averaged spatial variation in (a) AOD, (b) AAOD, and (c) SSA during 2005–2021 over the study area of northern Pakistan.
Remotesensing 15 02527 g006
Figure 7. Pearson correlations of monthly averaged data between light-absorbing aerosols concentration, optical properties, and meteorological parameters over northern Pakistan.
Remotesensing 15 02527 g007
Figure 8. Five-days-back trajectory analysis of air masses during the study period at 1500 m height over the study site.
Remotesensing 15 02527 g008
Table 1. Name, covered area, population, and population density of study regions according to Census © 15/03/2017.
NameCovered Area (km2)PopulationPopulation Density
Astore5411100,00018.48
Diamir7234270,00037.32
Chanche8531160,00018.76
Ghizer12,381170,00013.73
Gilgit4208290,00068.92
Hunza Nagar14,246120,0008.42
Skardu18,700380,00020.32
Chitral14,850447,62530.14
Swat53372,308,624432.6
Dir3699947,401256.1
Kohistan7492784,711104.7
Table 2. Selected dates for the air mass trajectory analysis with AOD values.
DD-MM-YYAODDD-MM-YYAOD
20-06-050.92305-05-140.975
25-06-060.92707-07-150.952
13-08-070.95123-06-160.930
12-03-080.97224-05-170.916
11-08-090.98307-08-180.949
05-09-100.92920-07-190.992
20-08-110.98126-07-200.837
14-07-120.98011-07-210.884
25-06-130.898
Disclaimer/Publisher’s Note: The statements, opinions and data contained in all publications are solely those of the individual author(s) and contributor(s) and not of MDPI and/or the editor(s). MDPI and/or the editor(s) disclaim responsibility for any injury to people or property resulting from any ideas, methods, instructions or products referred to in the content.

