
Remote Sensing for Agricultural Water Management in Jordan

 ,
,  ,
,  ,
,
Abstract
1. Introduction
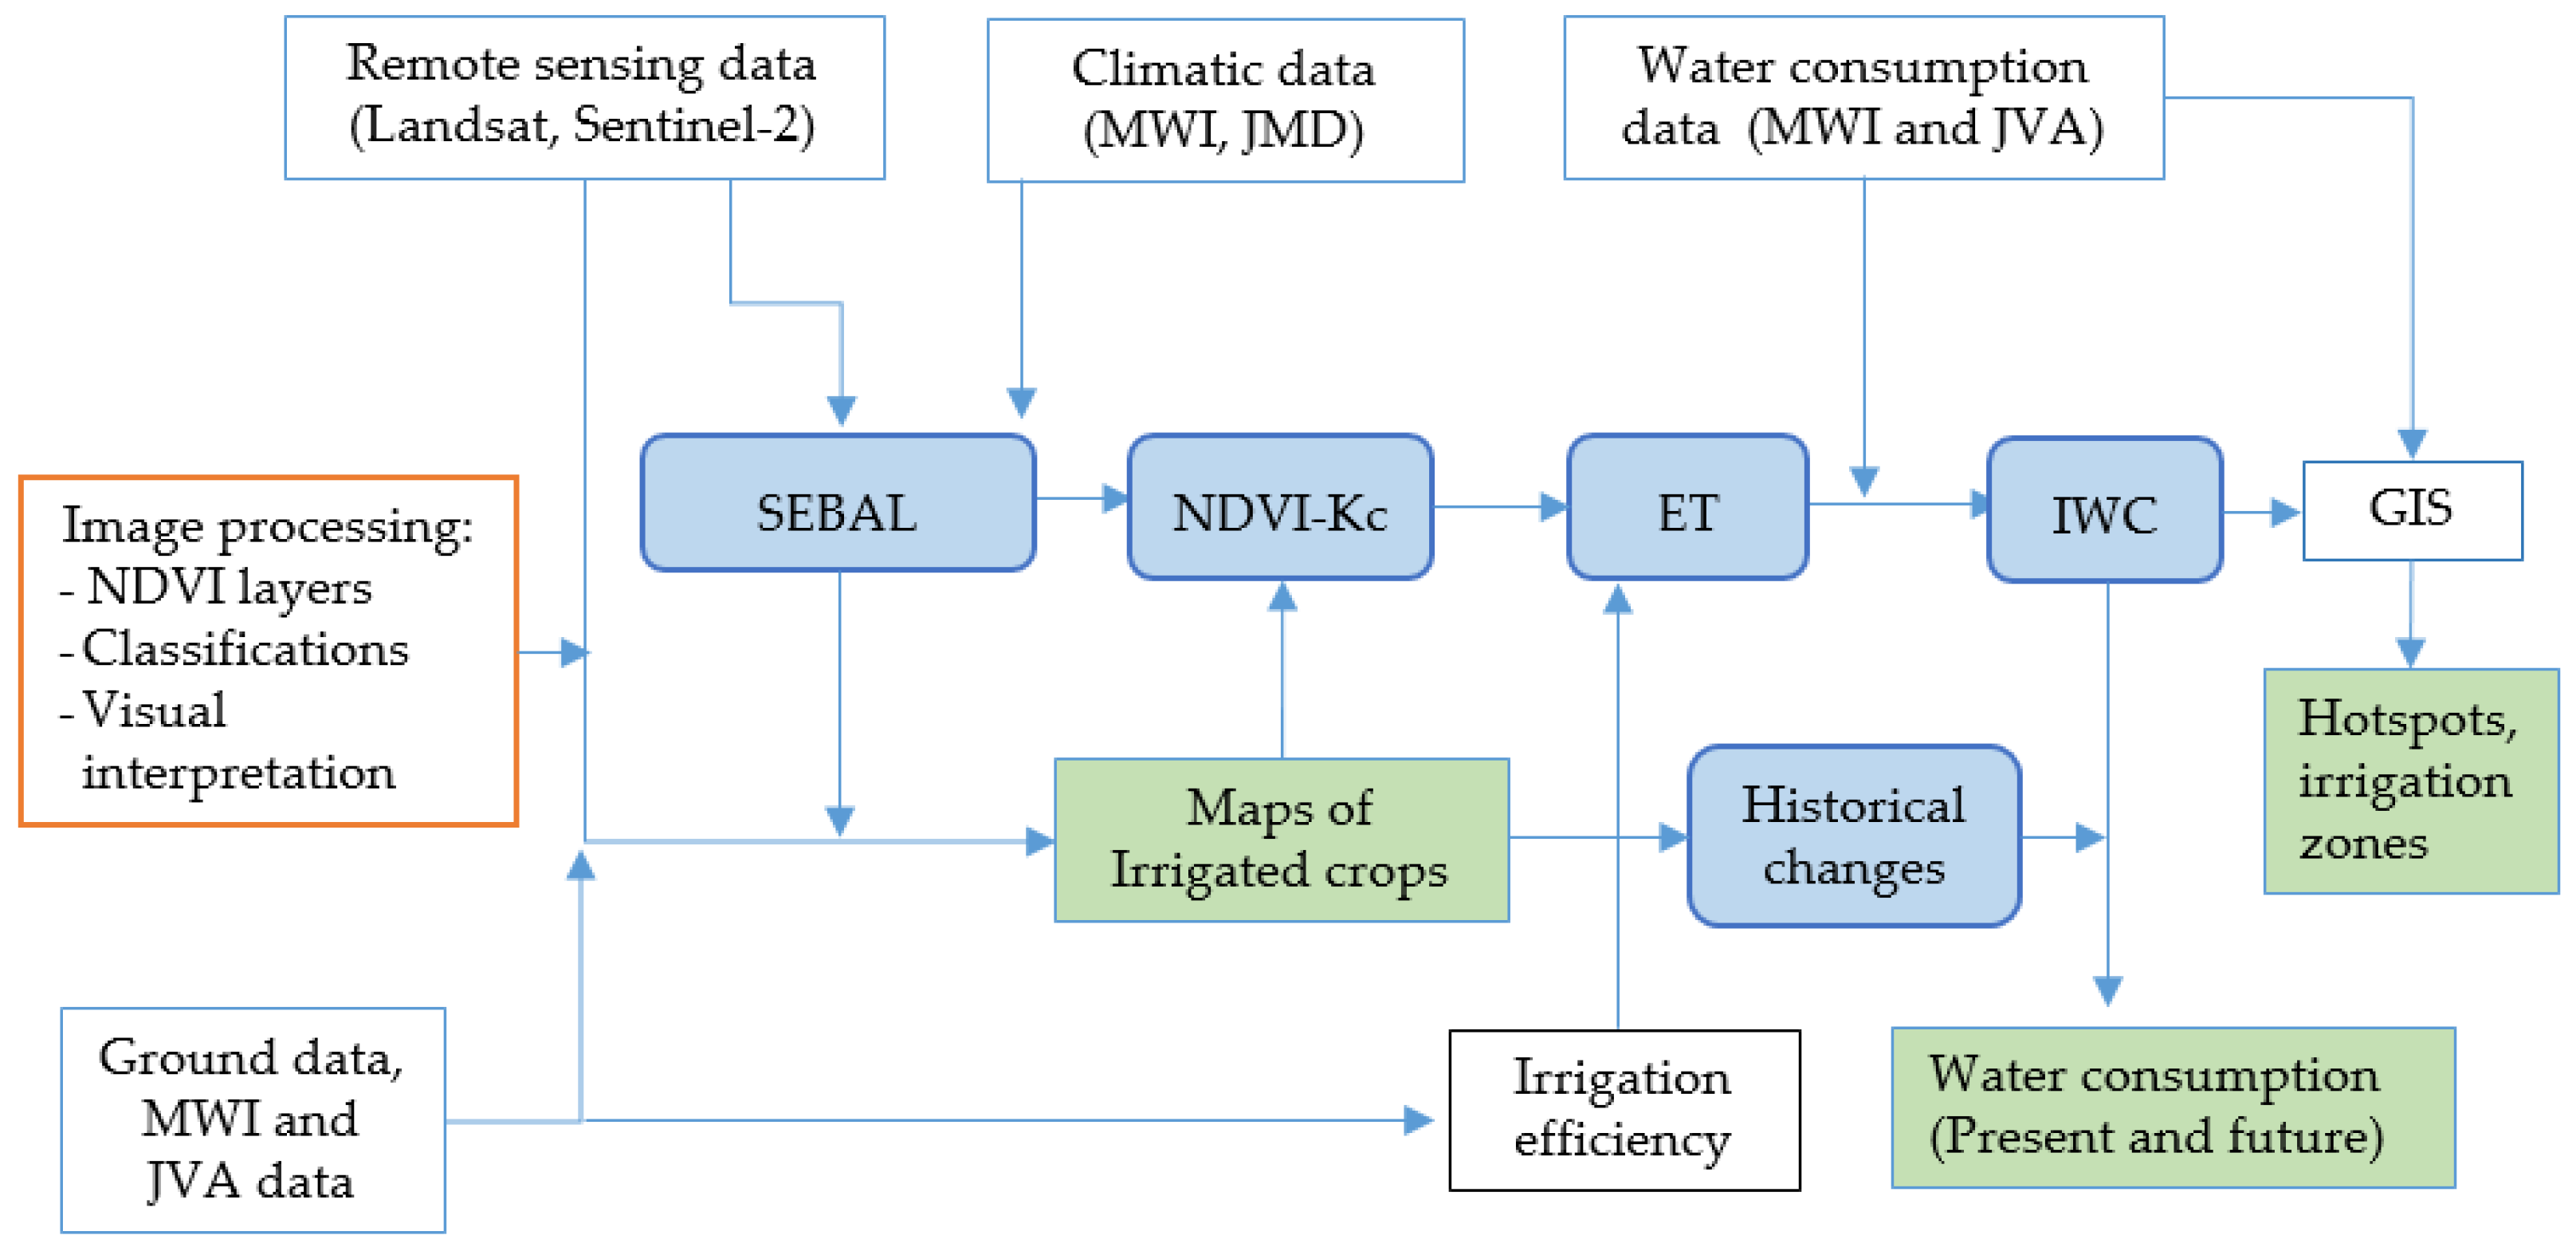
2. Materials and Methods
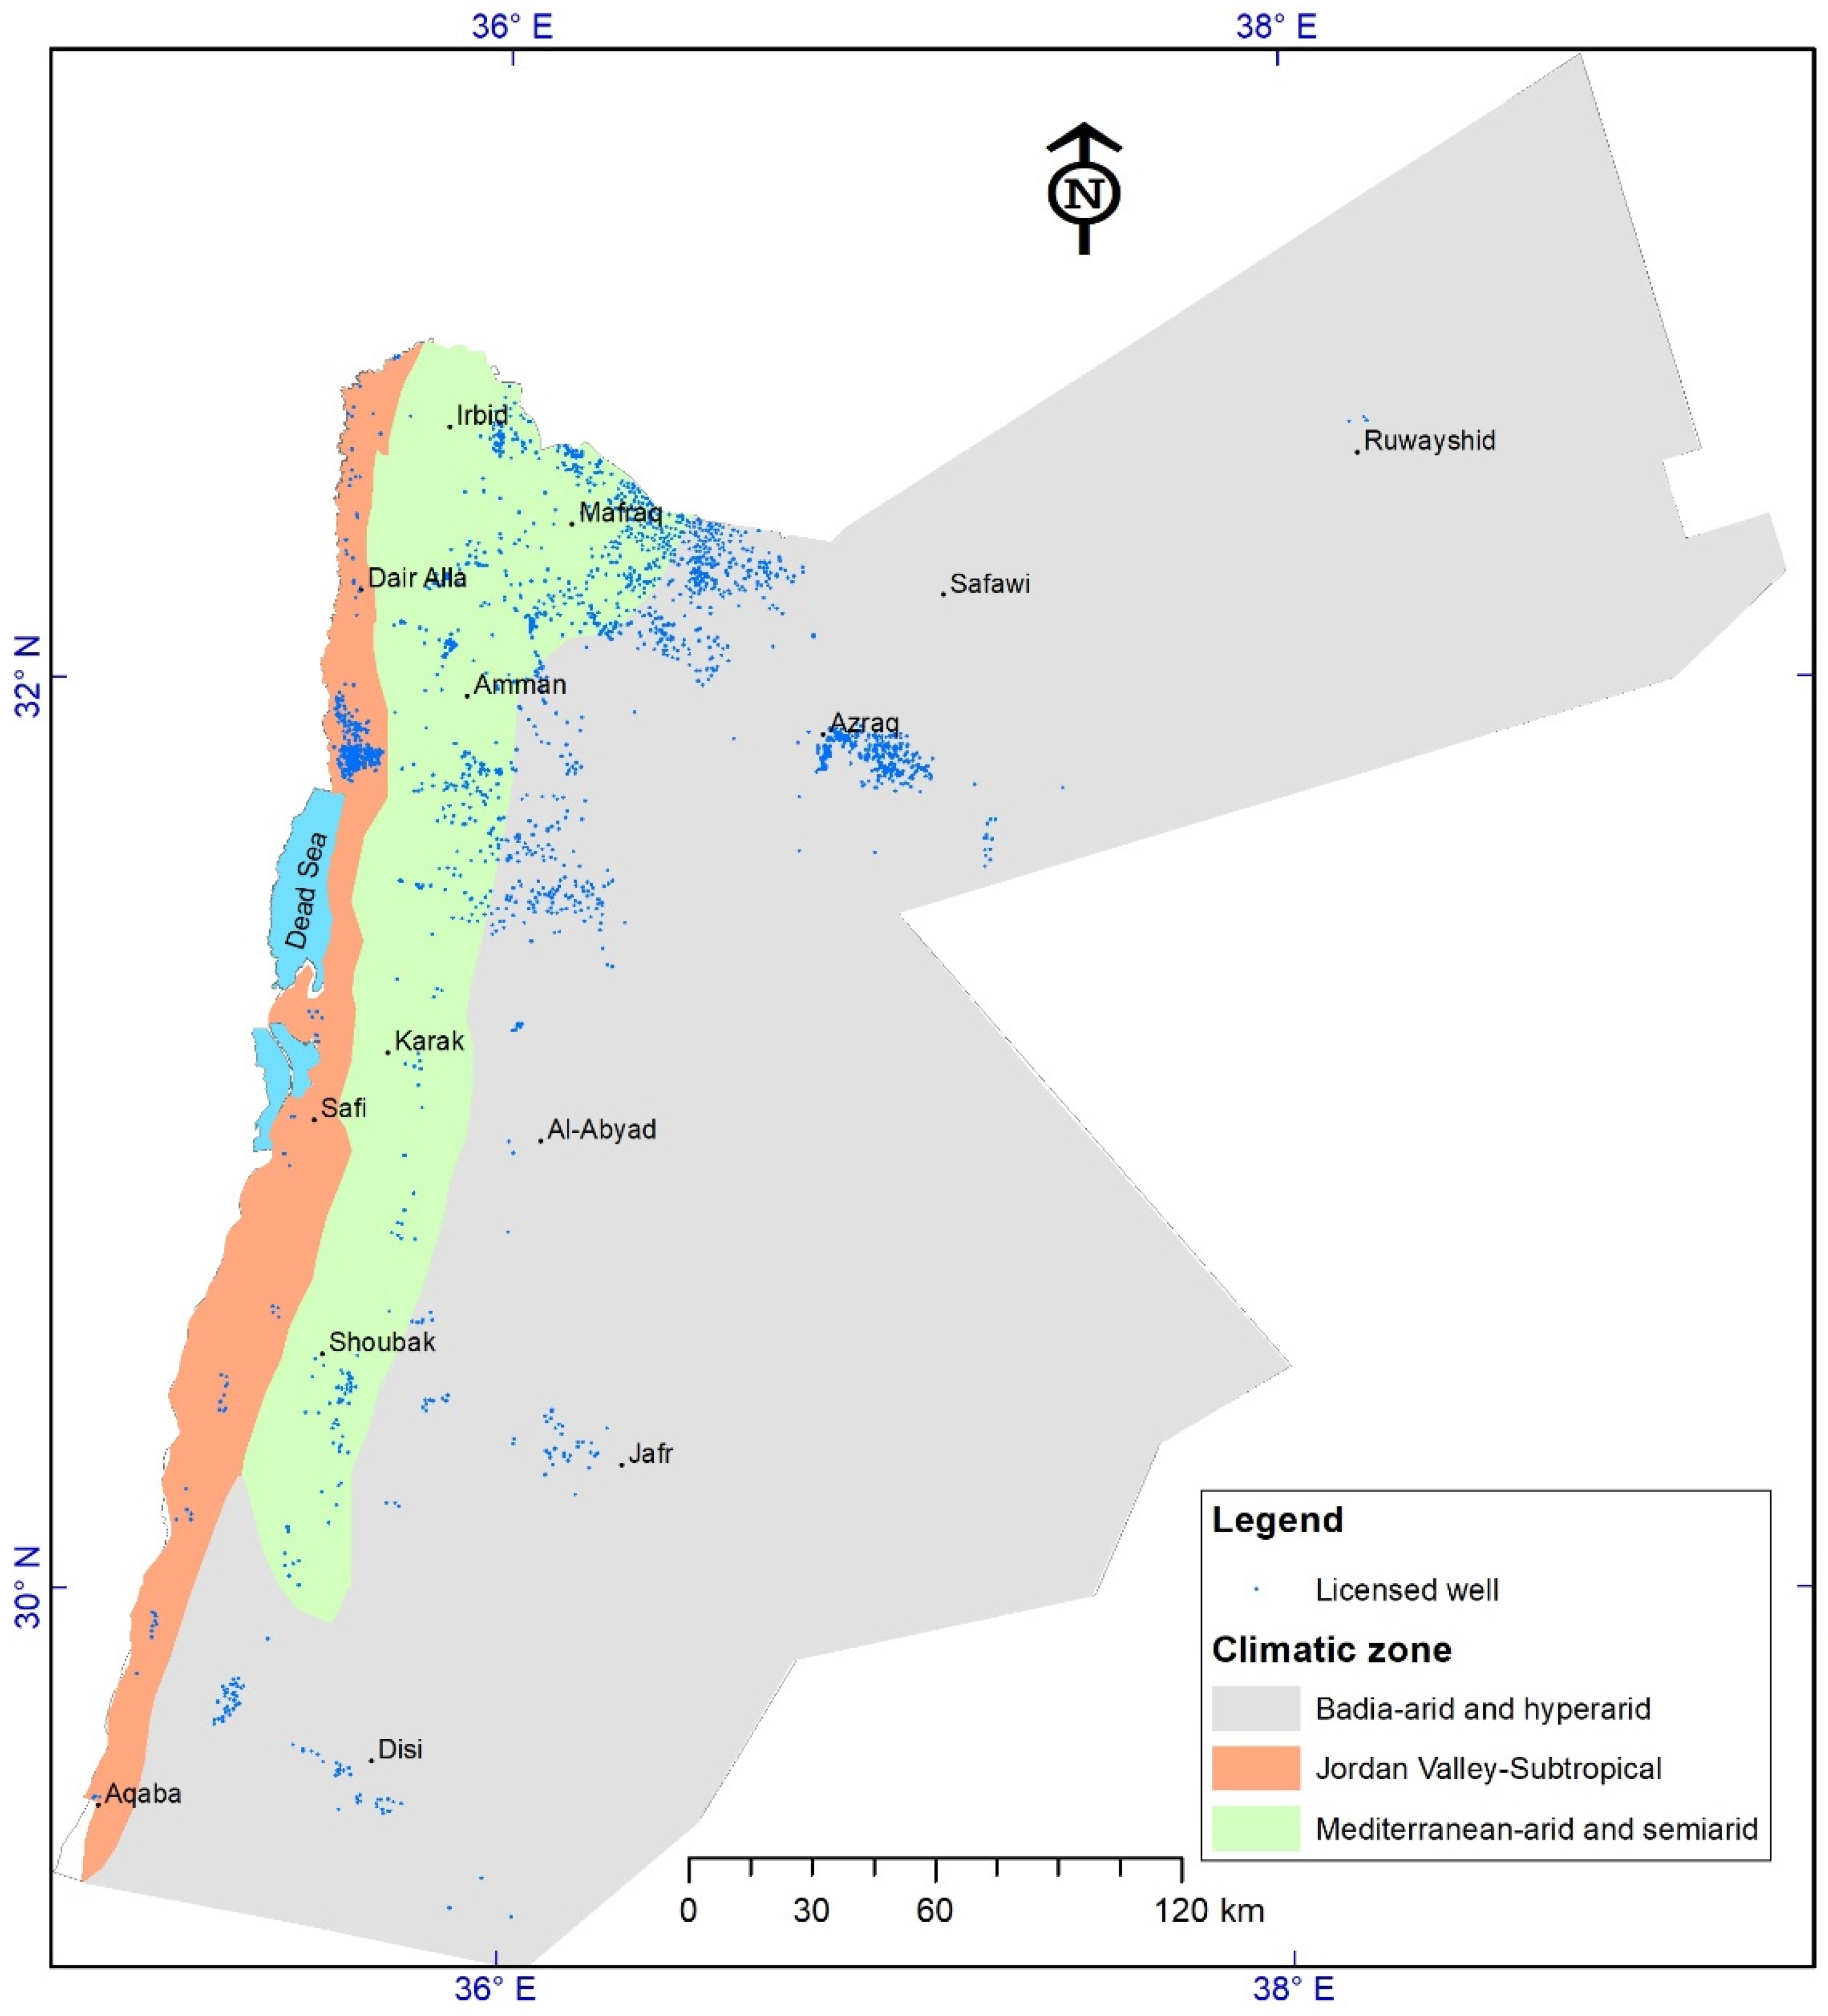
2.1. Study Areas
2.2. Collection and Pre-Processing of Data
2.3. Mapping of Irrigated Crops
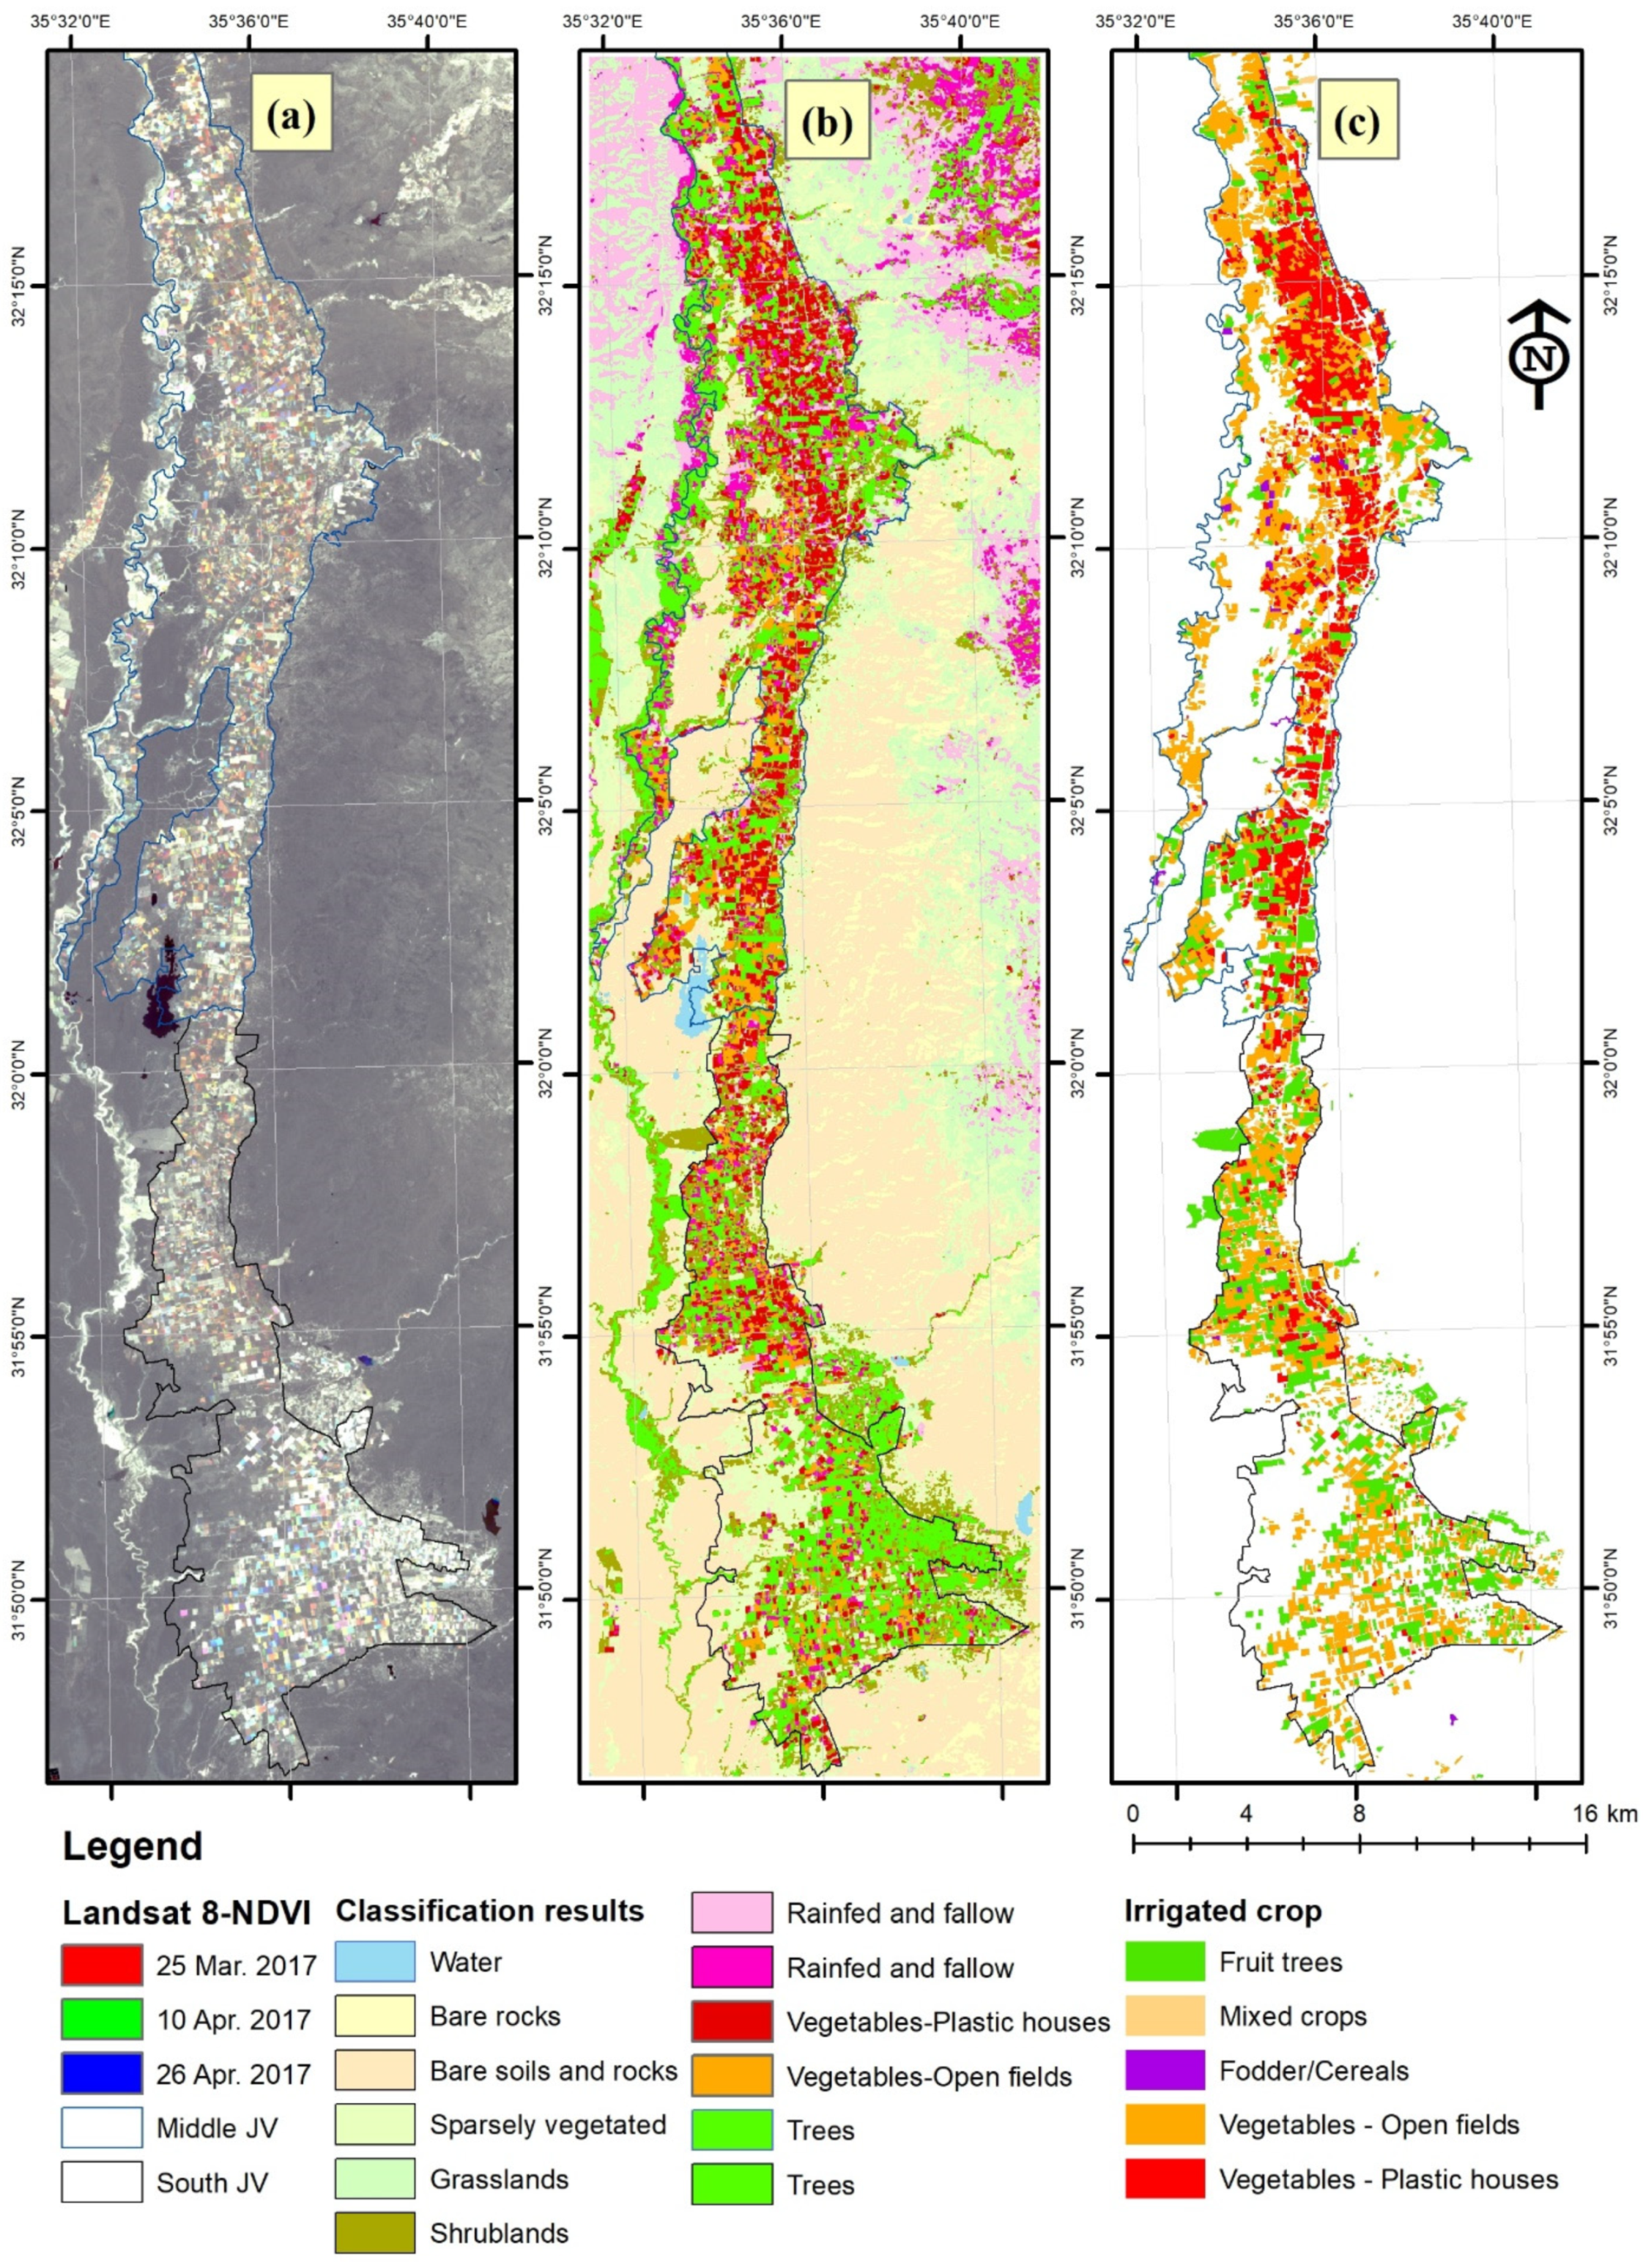
2.3.1. Mapping of Irrigated Crops in Jordan Valley
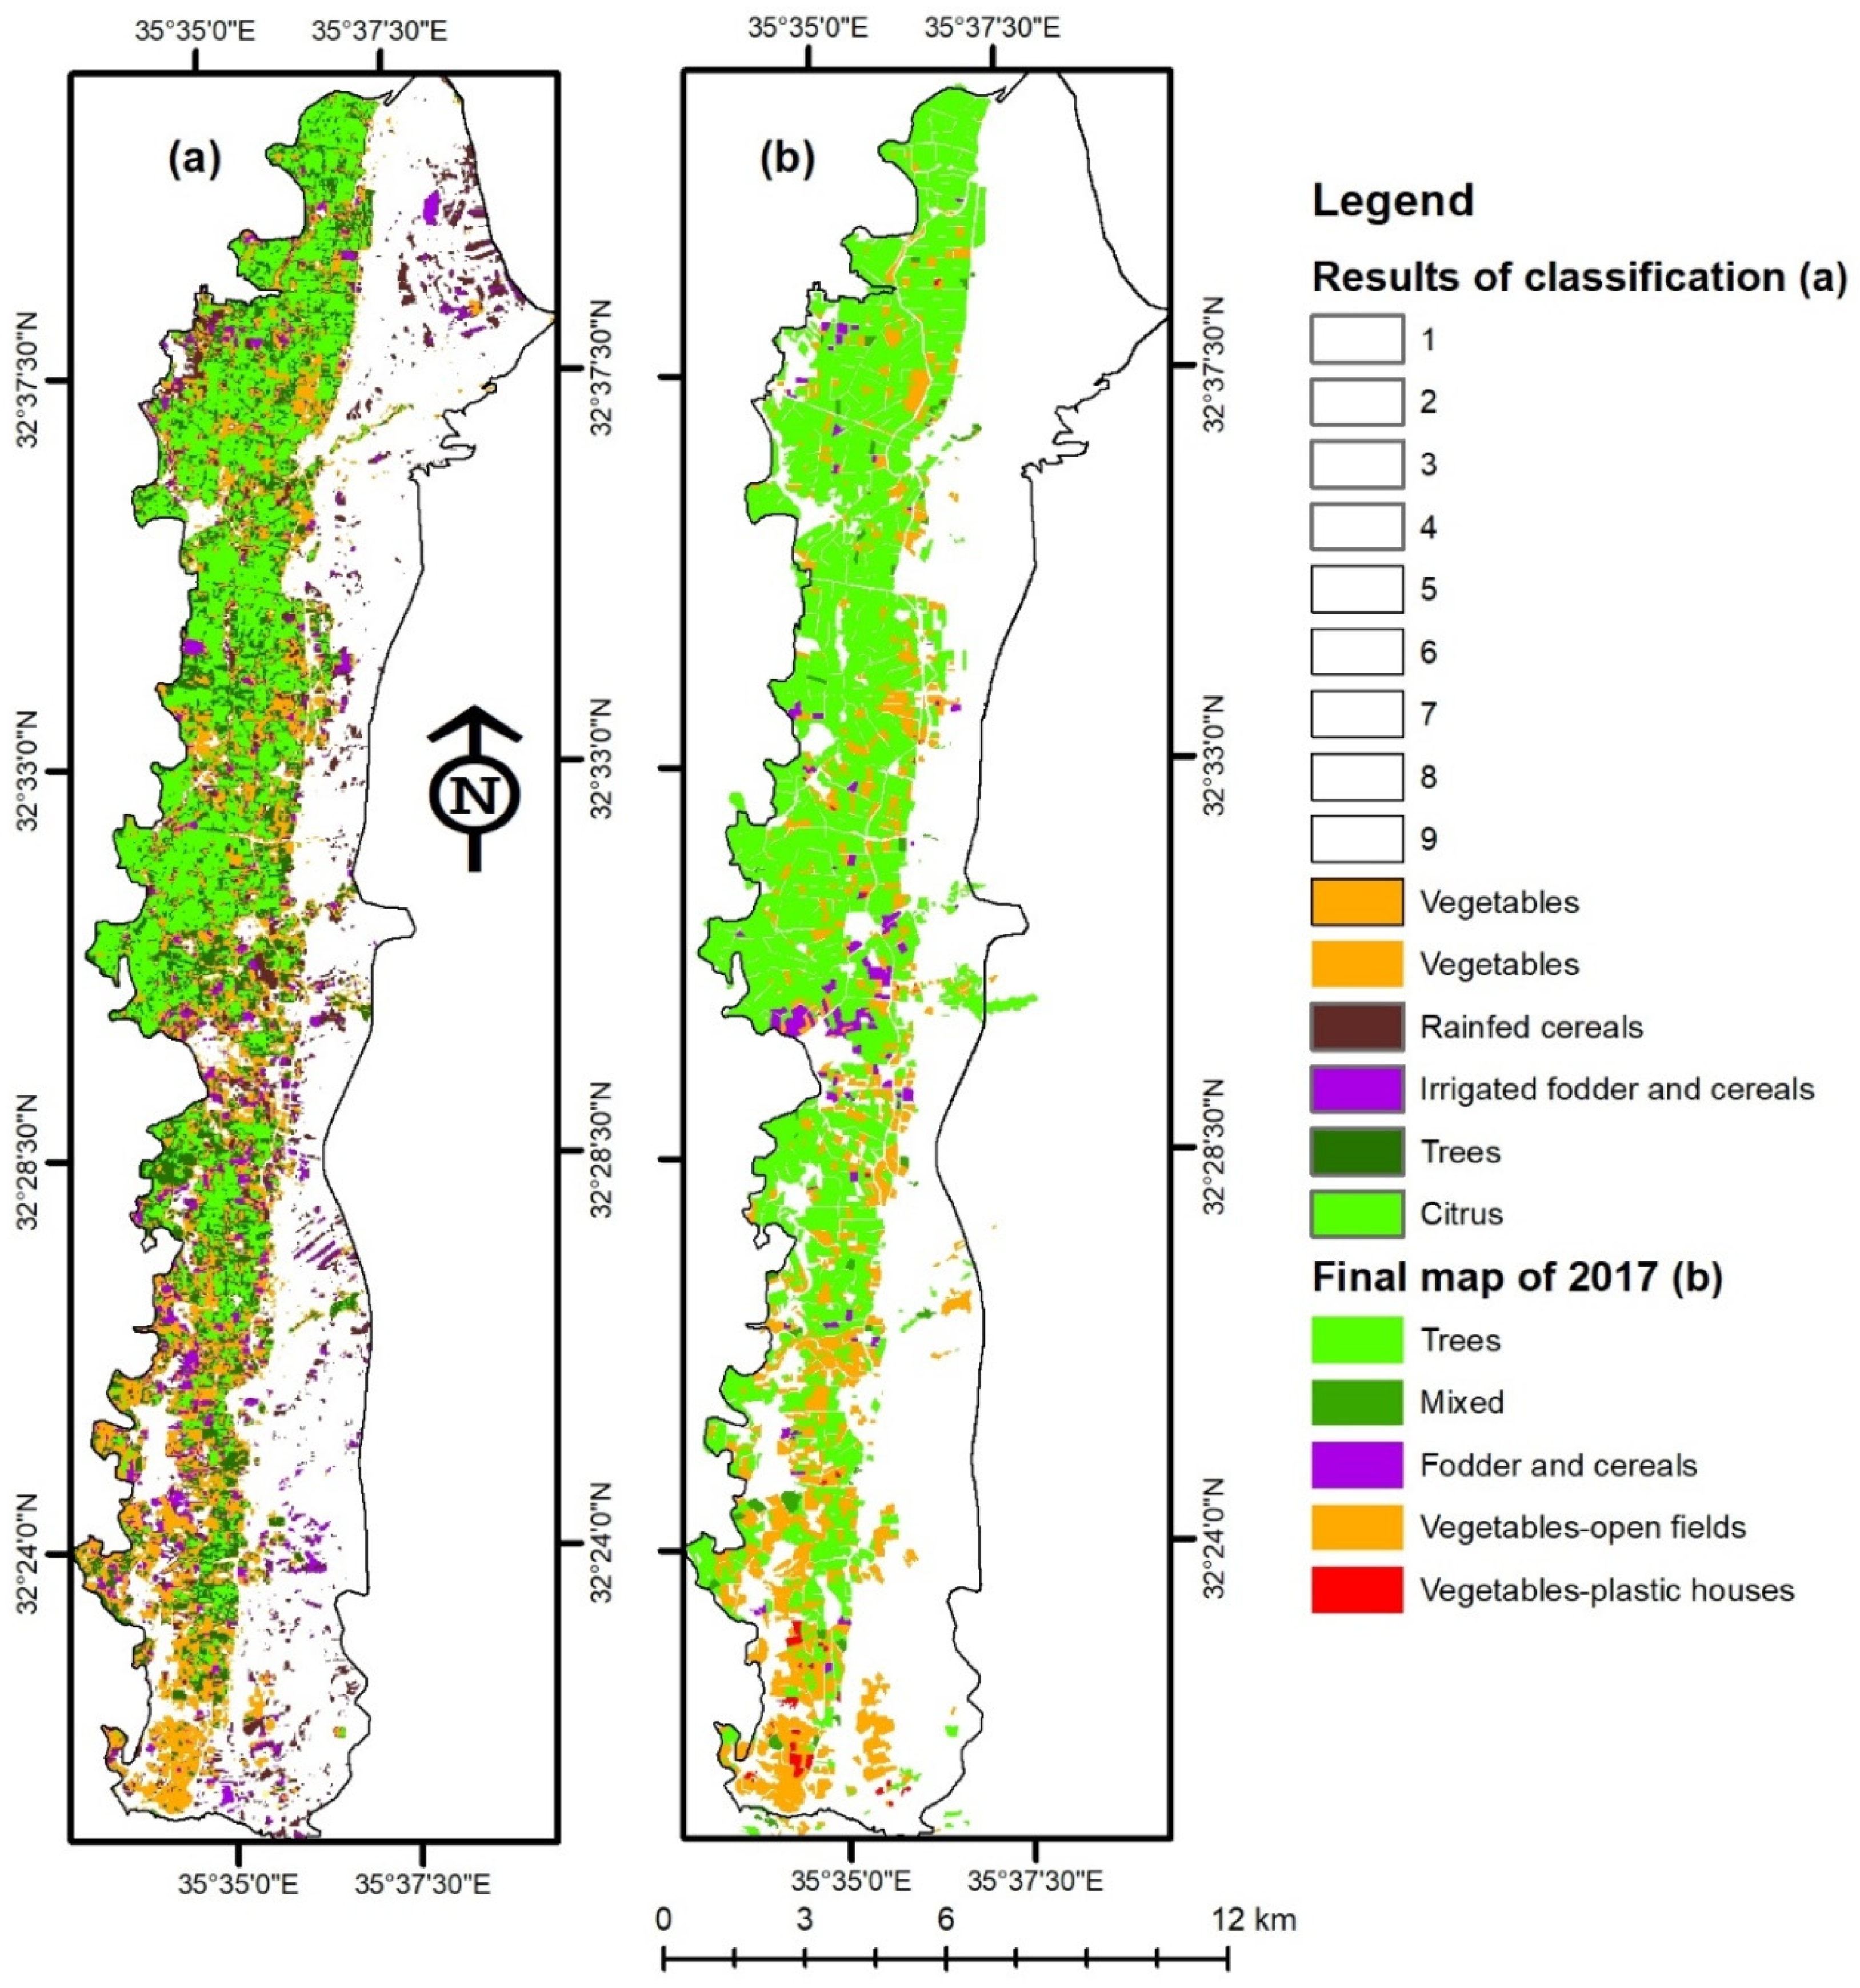
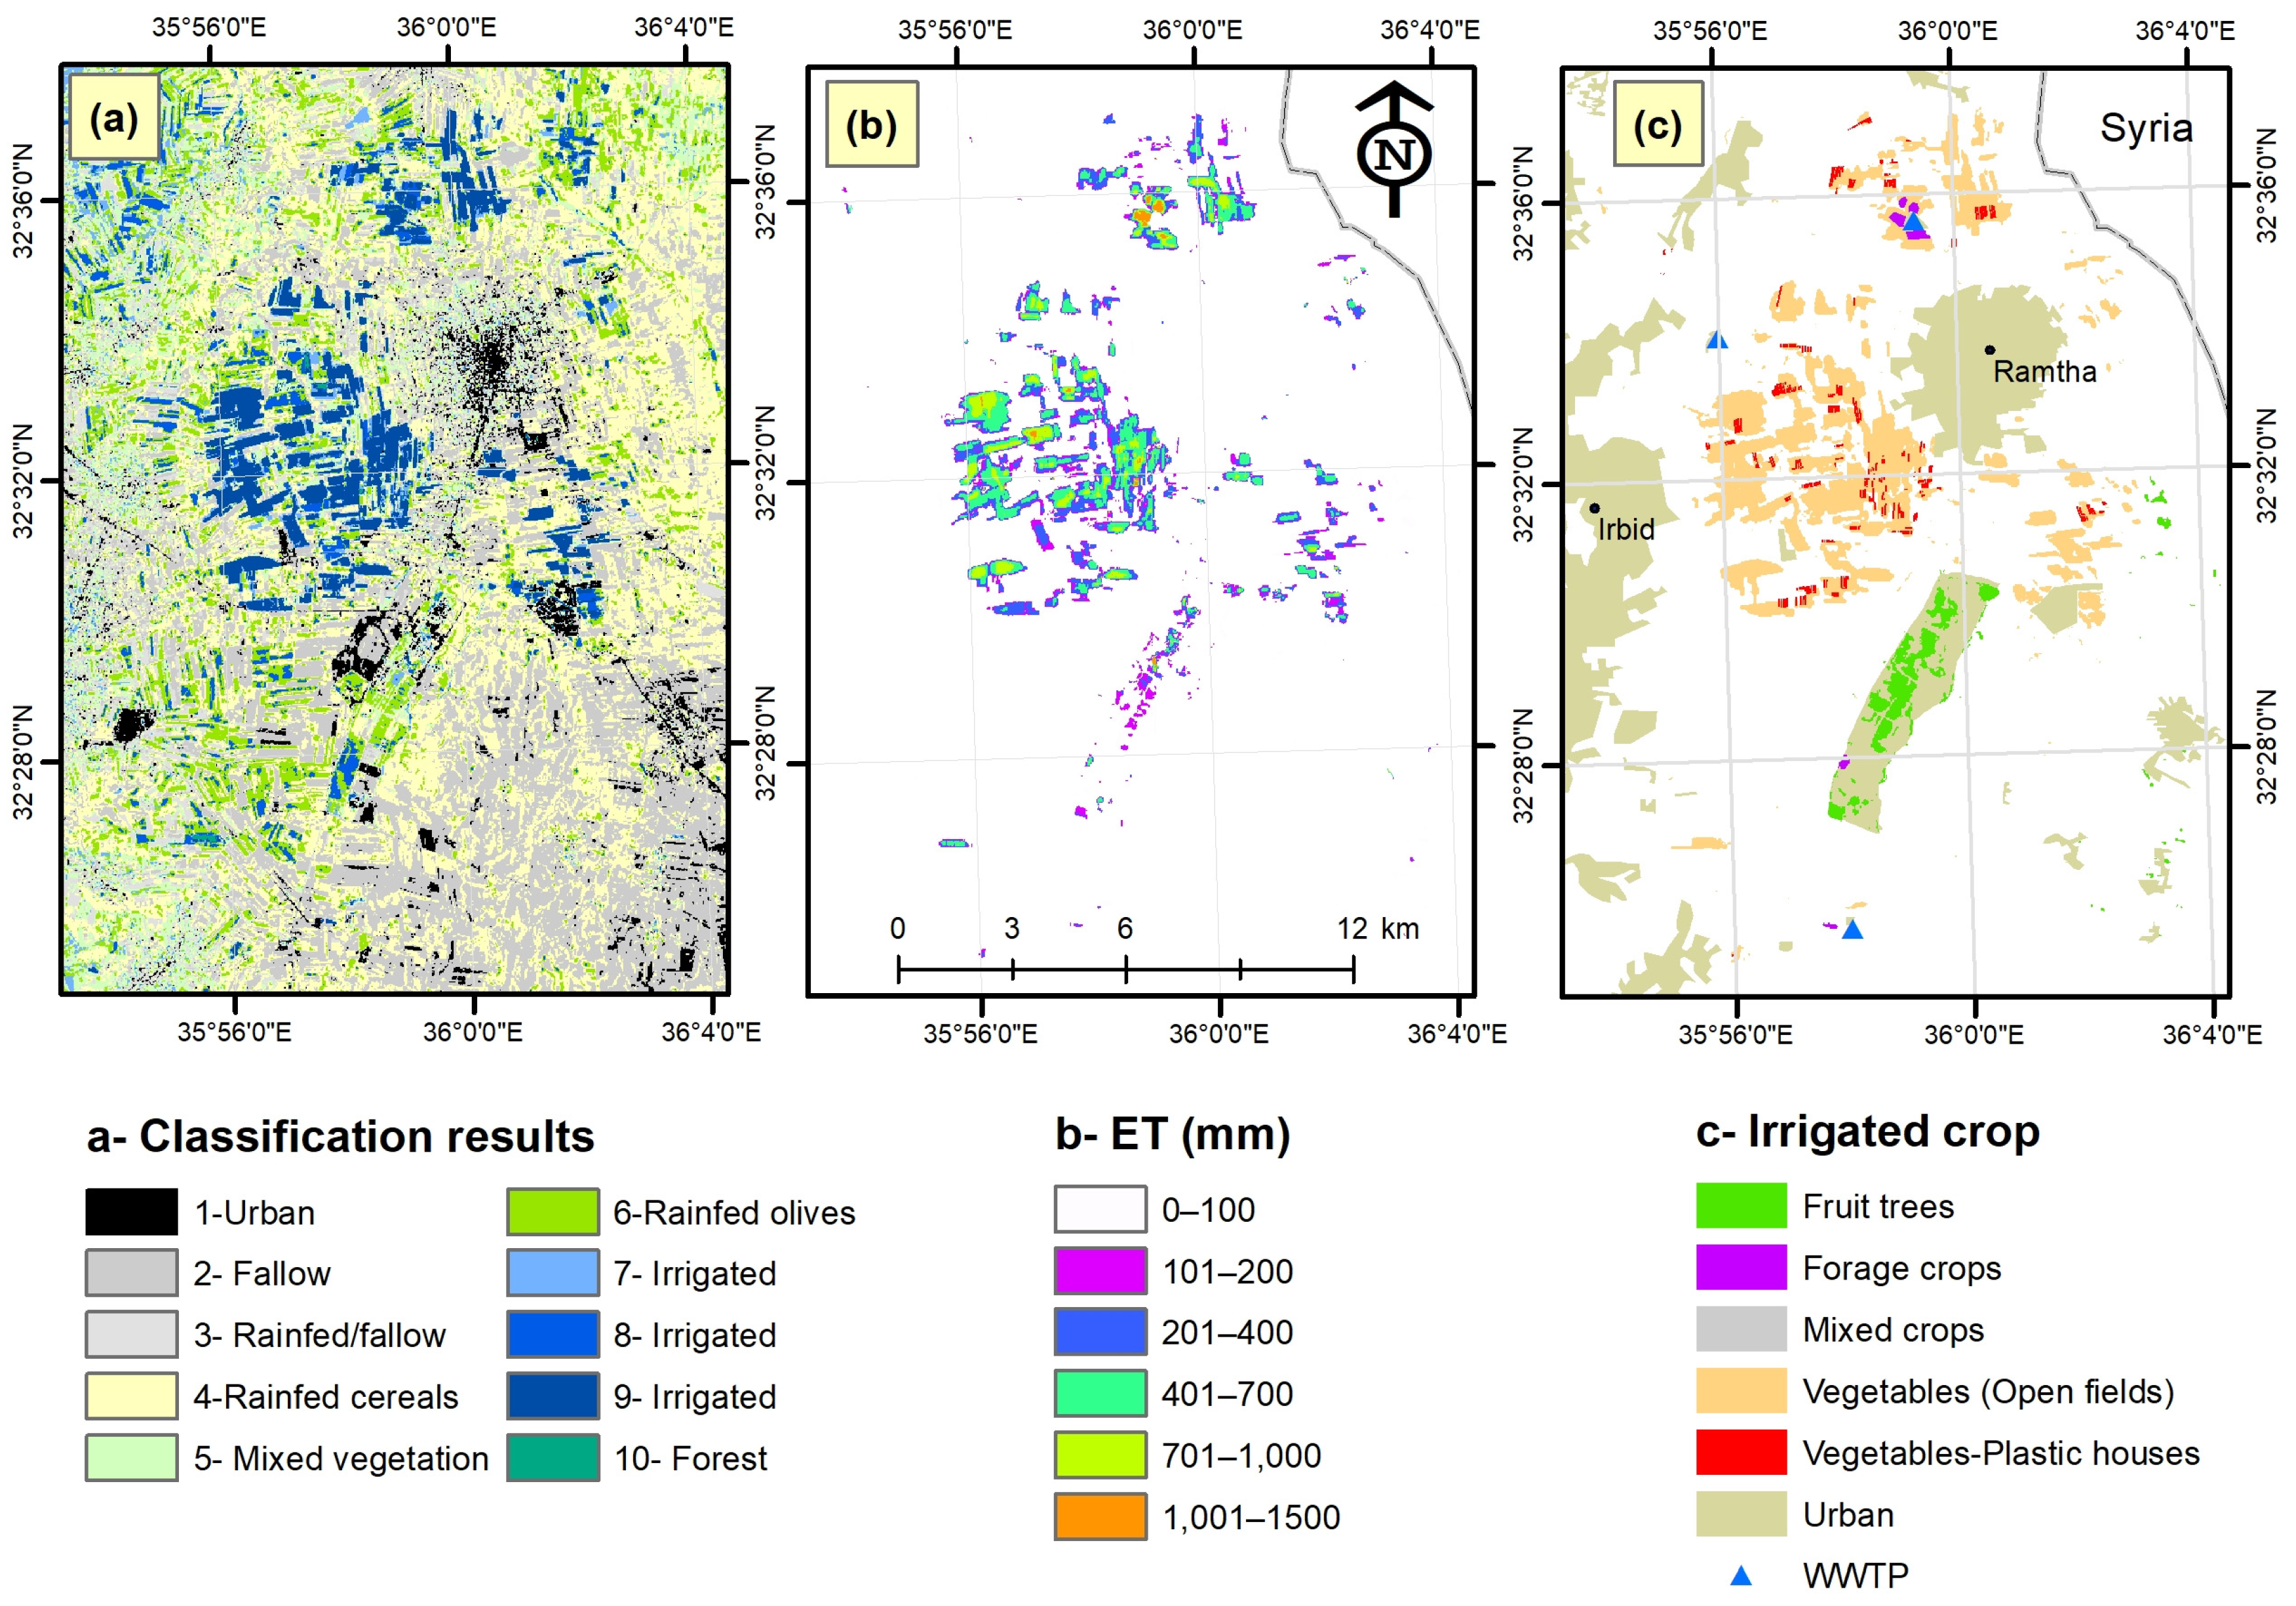
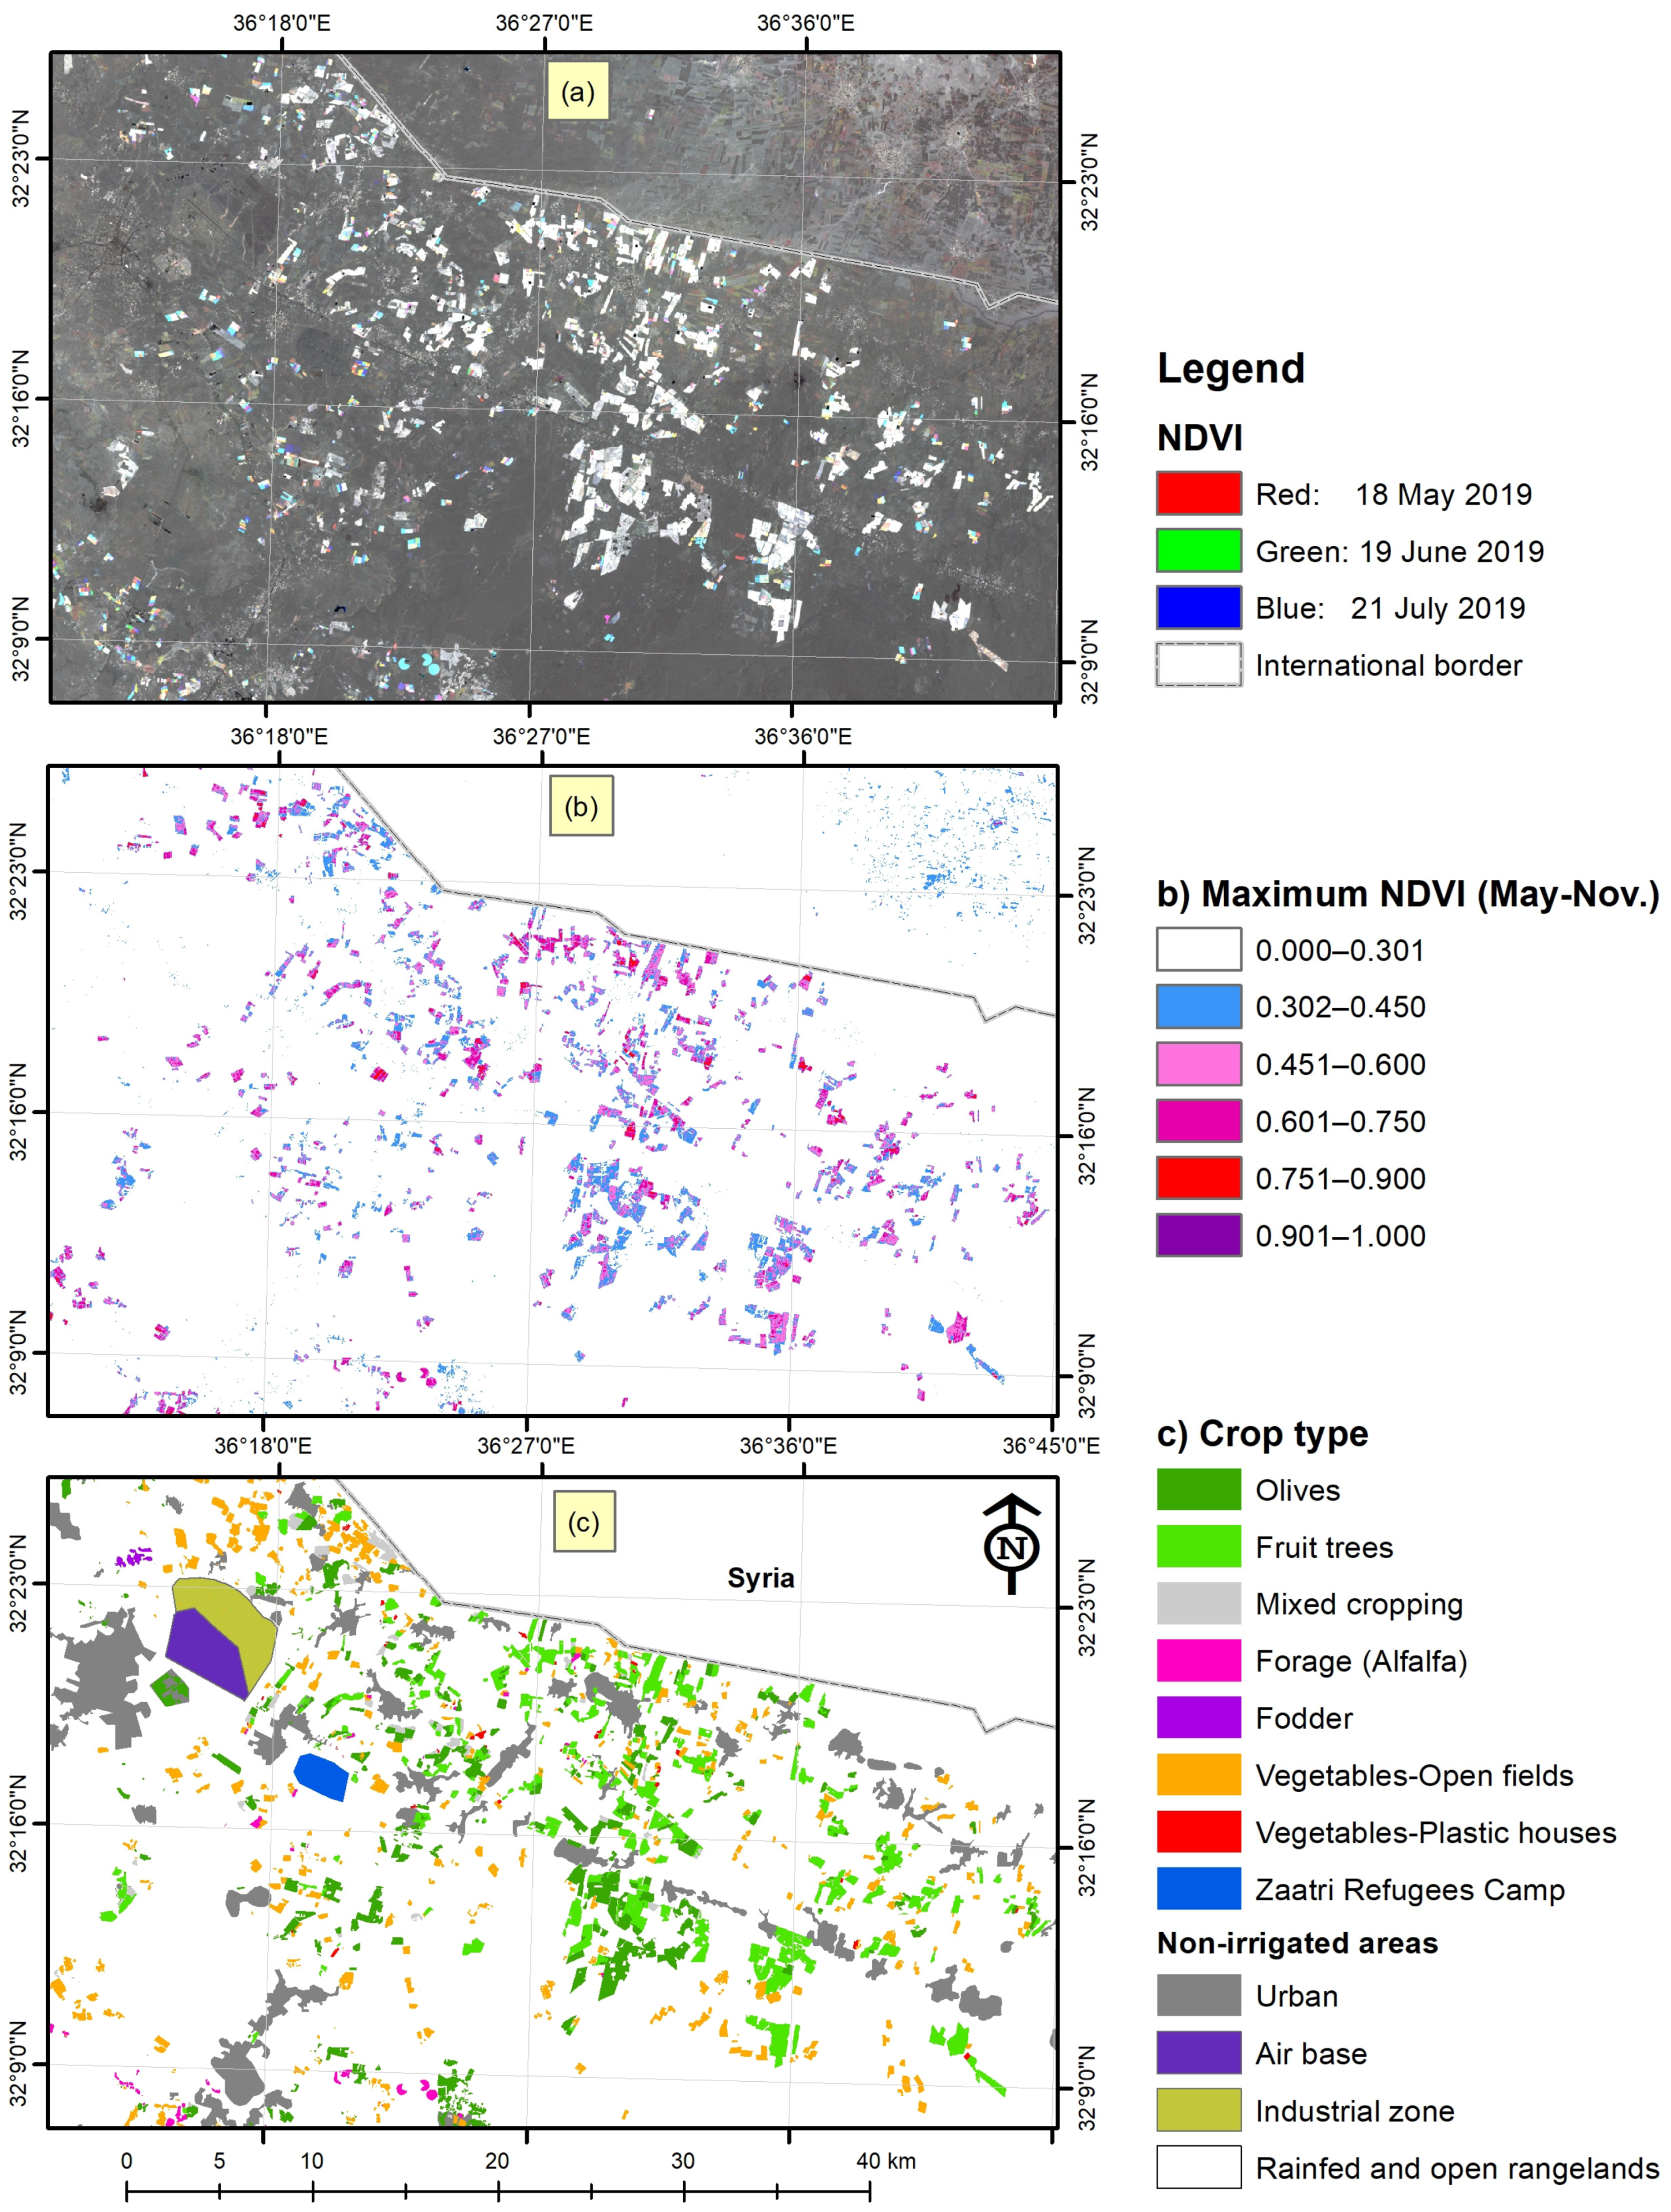
2.3.2. Mapping of Irrigated Crops in the Mediterranean Highlands
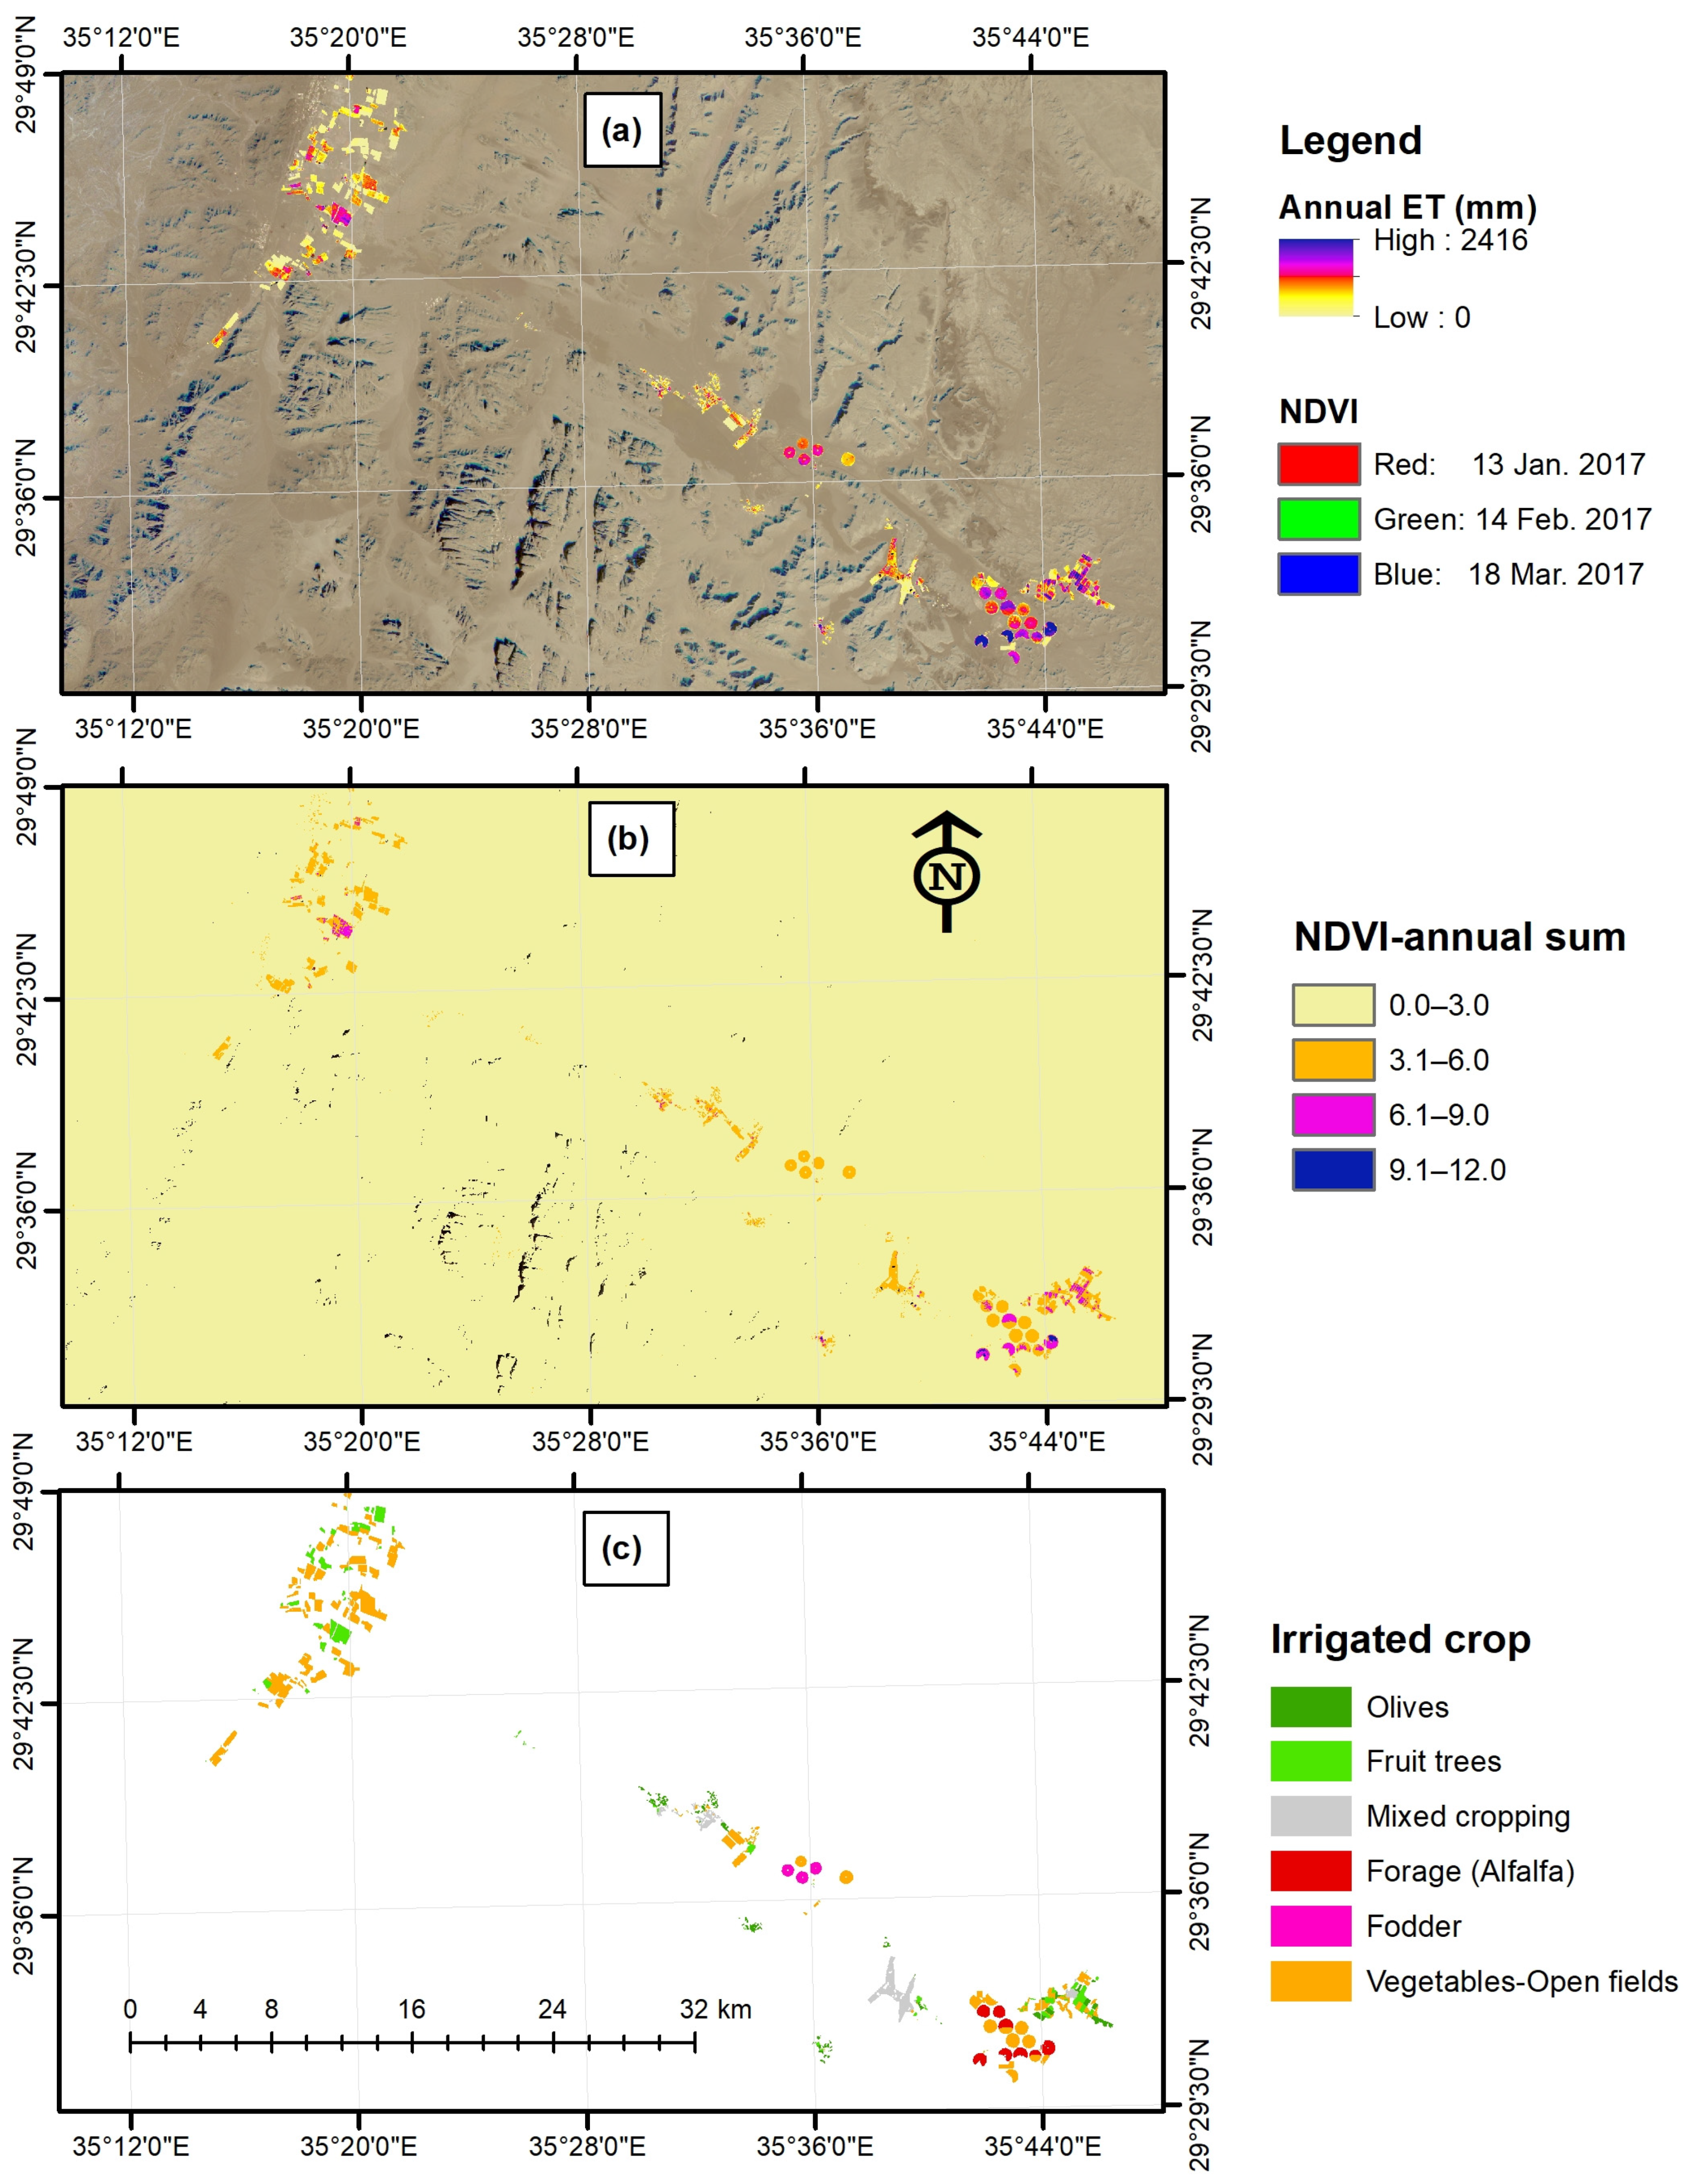
2.3.3. Mapping Irrigated Crops in the Badia
2.3.4. Mapping Historical Changes in Irrigated Areas
2.4. Mapping of ET and IWC
2.5. Application of Spatial Analysis
3. Results
3.1. Accuracy of Mapping Irrigated Crops from Remote Sensing Data
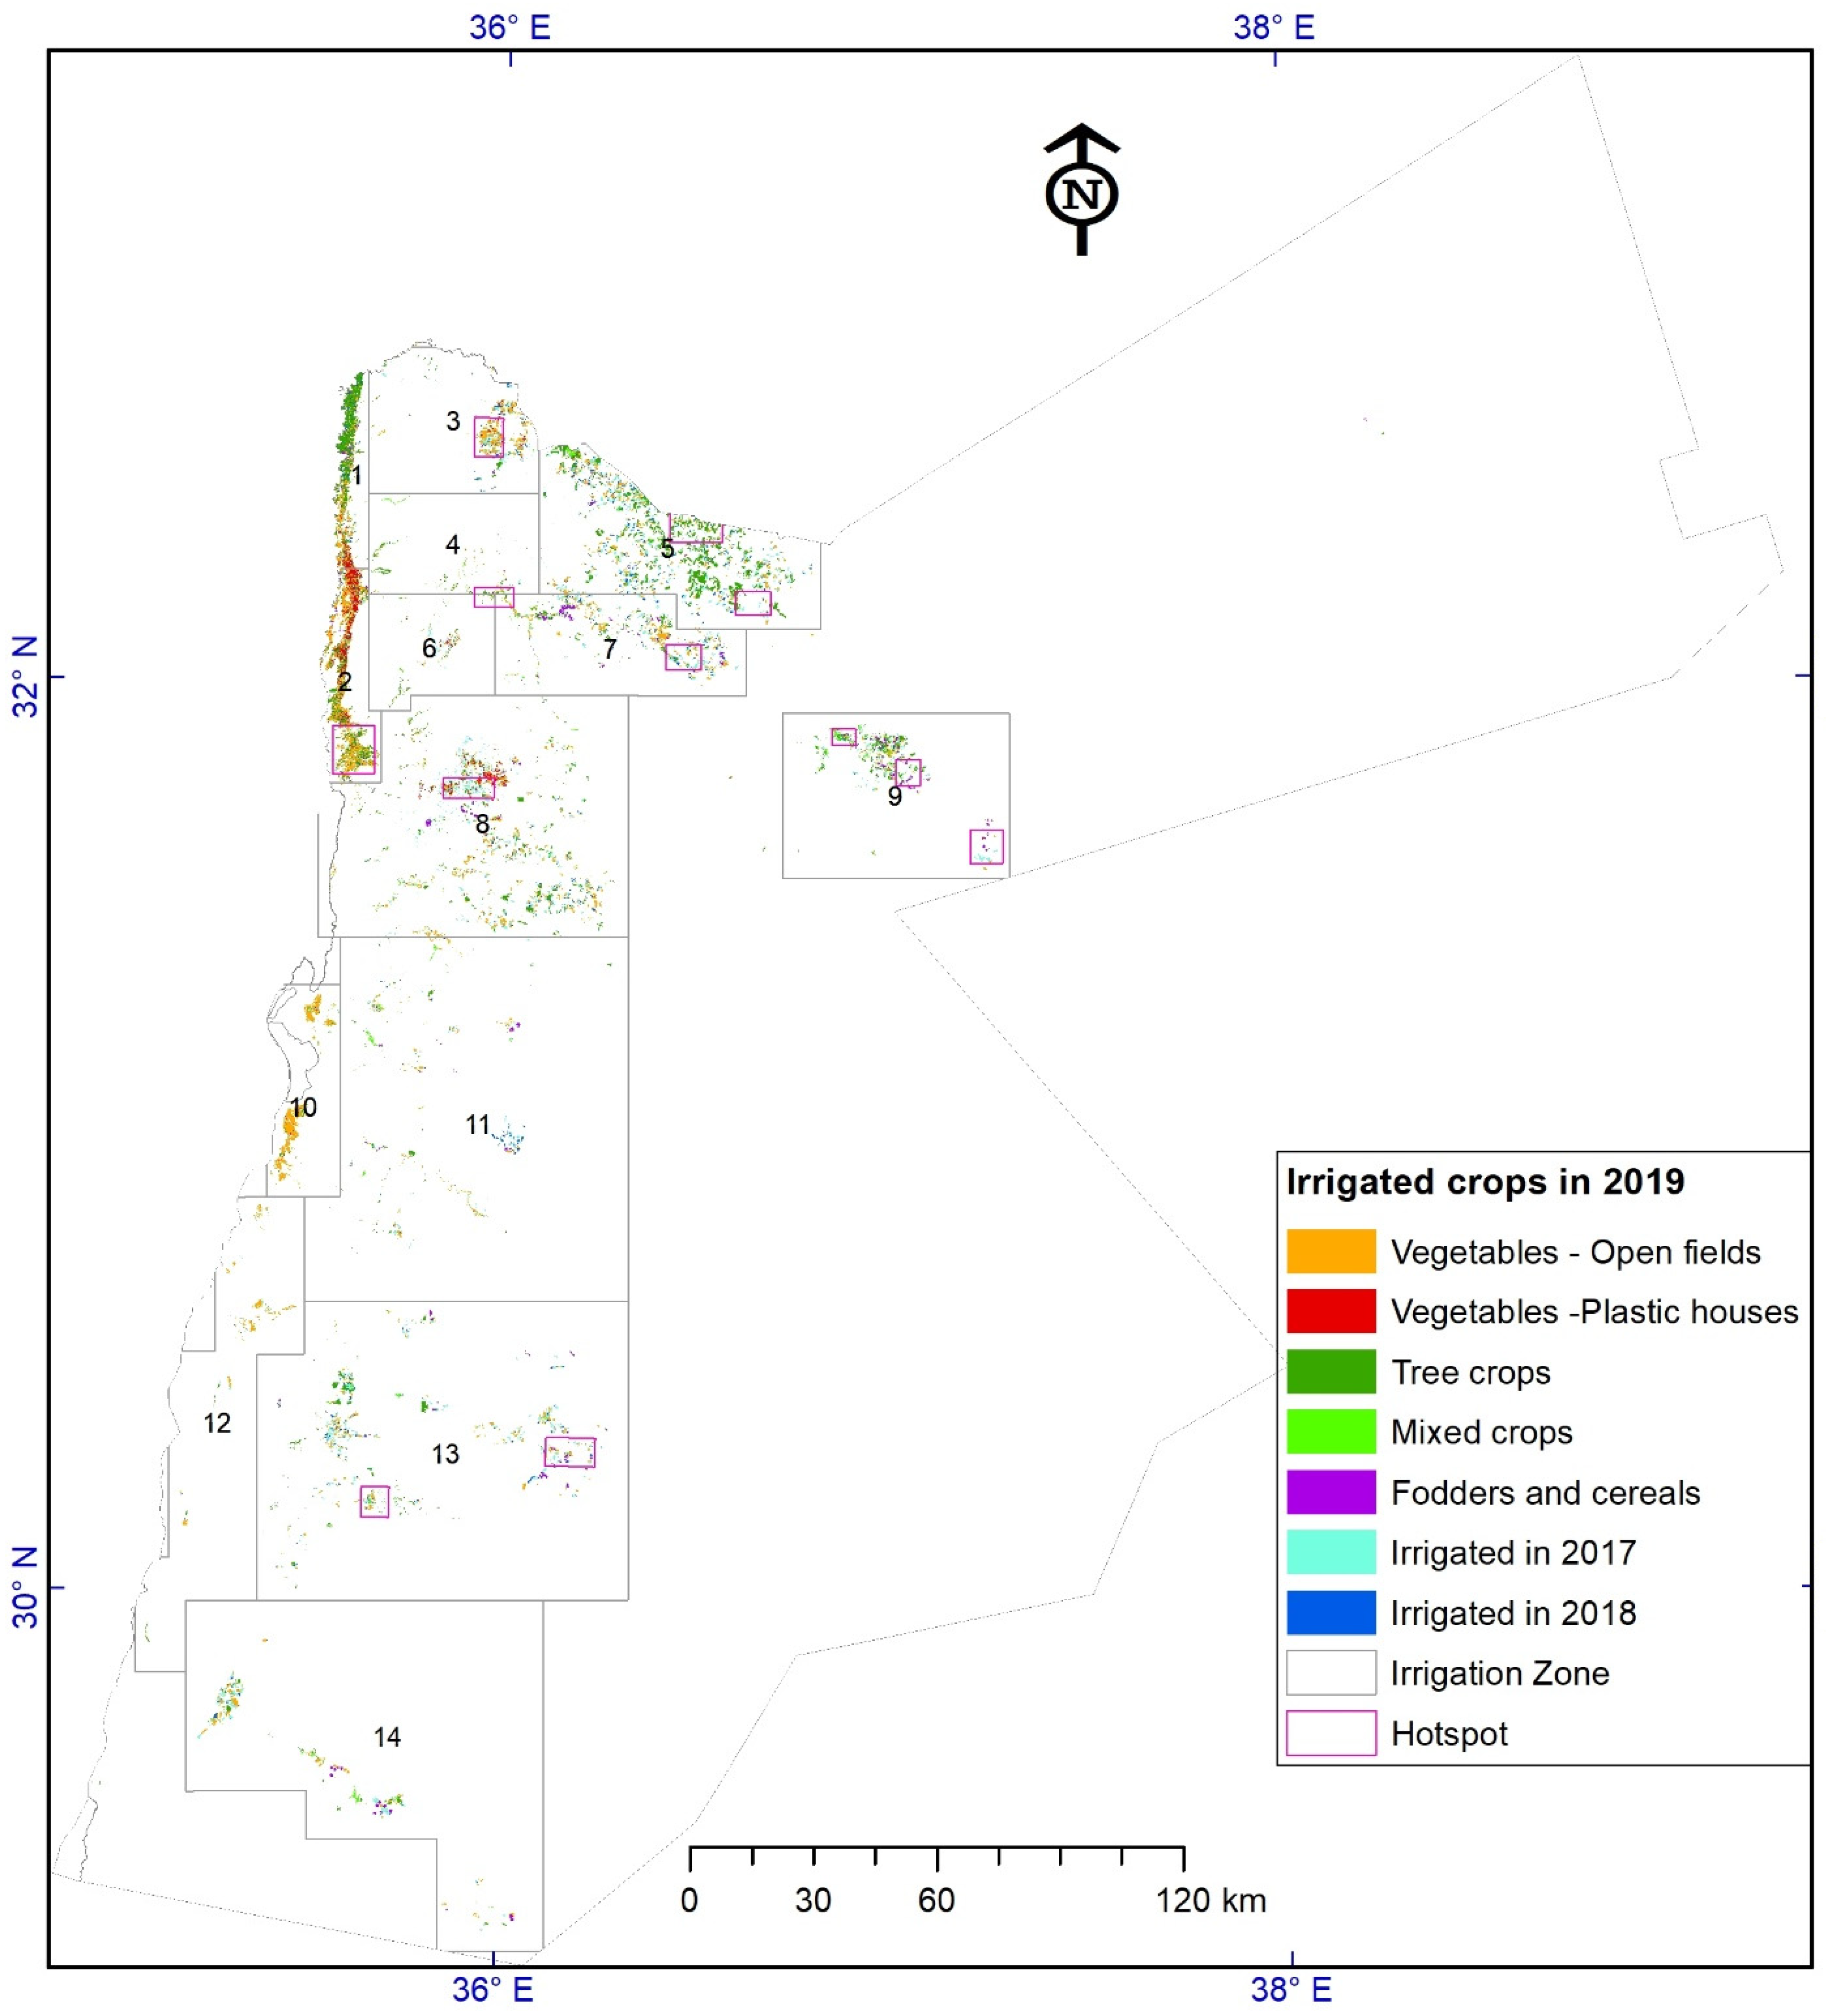
3.2. Irrigated Areas in Jordan
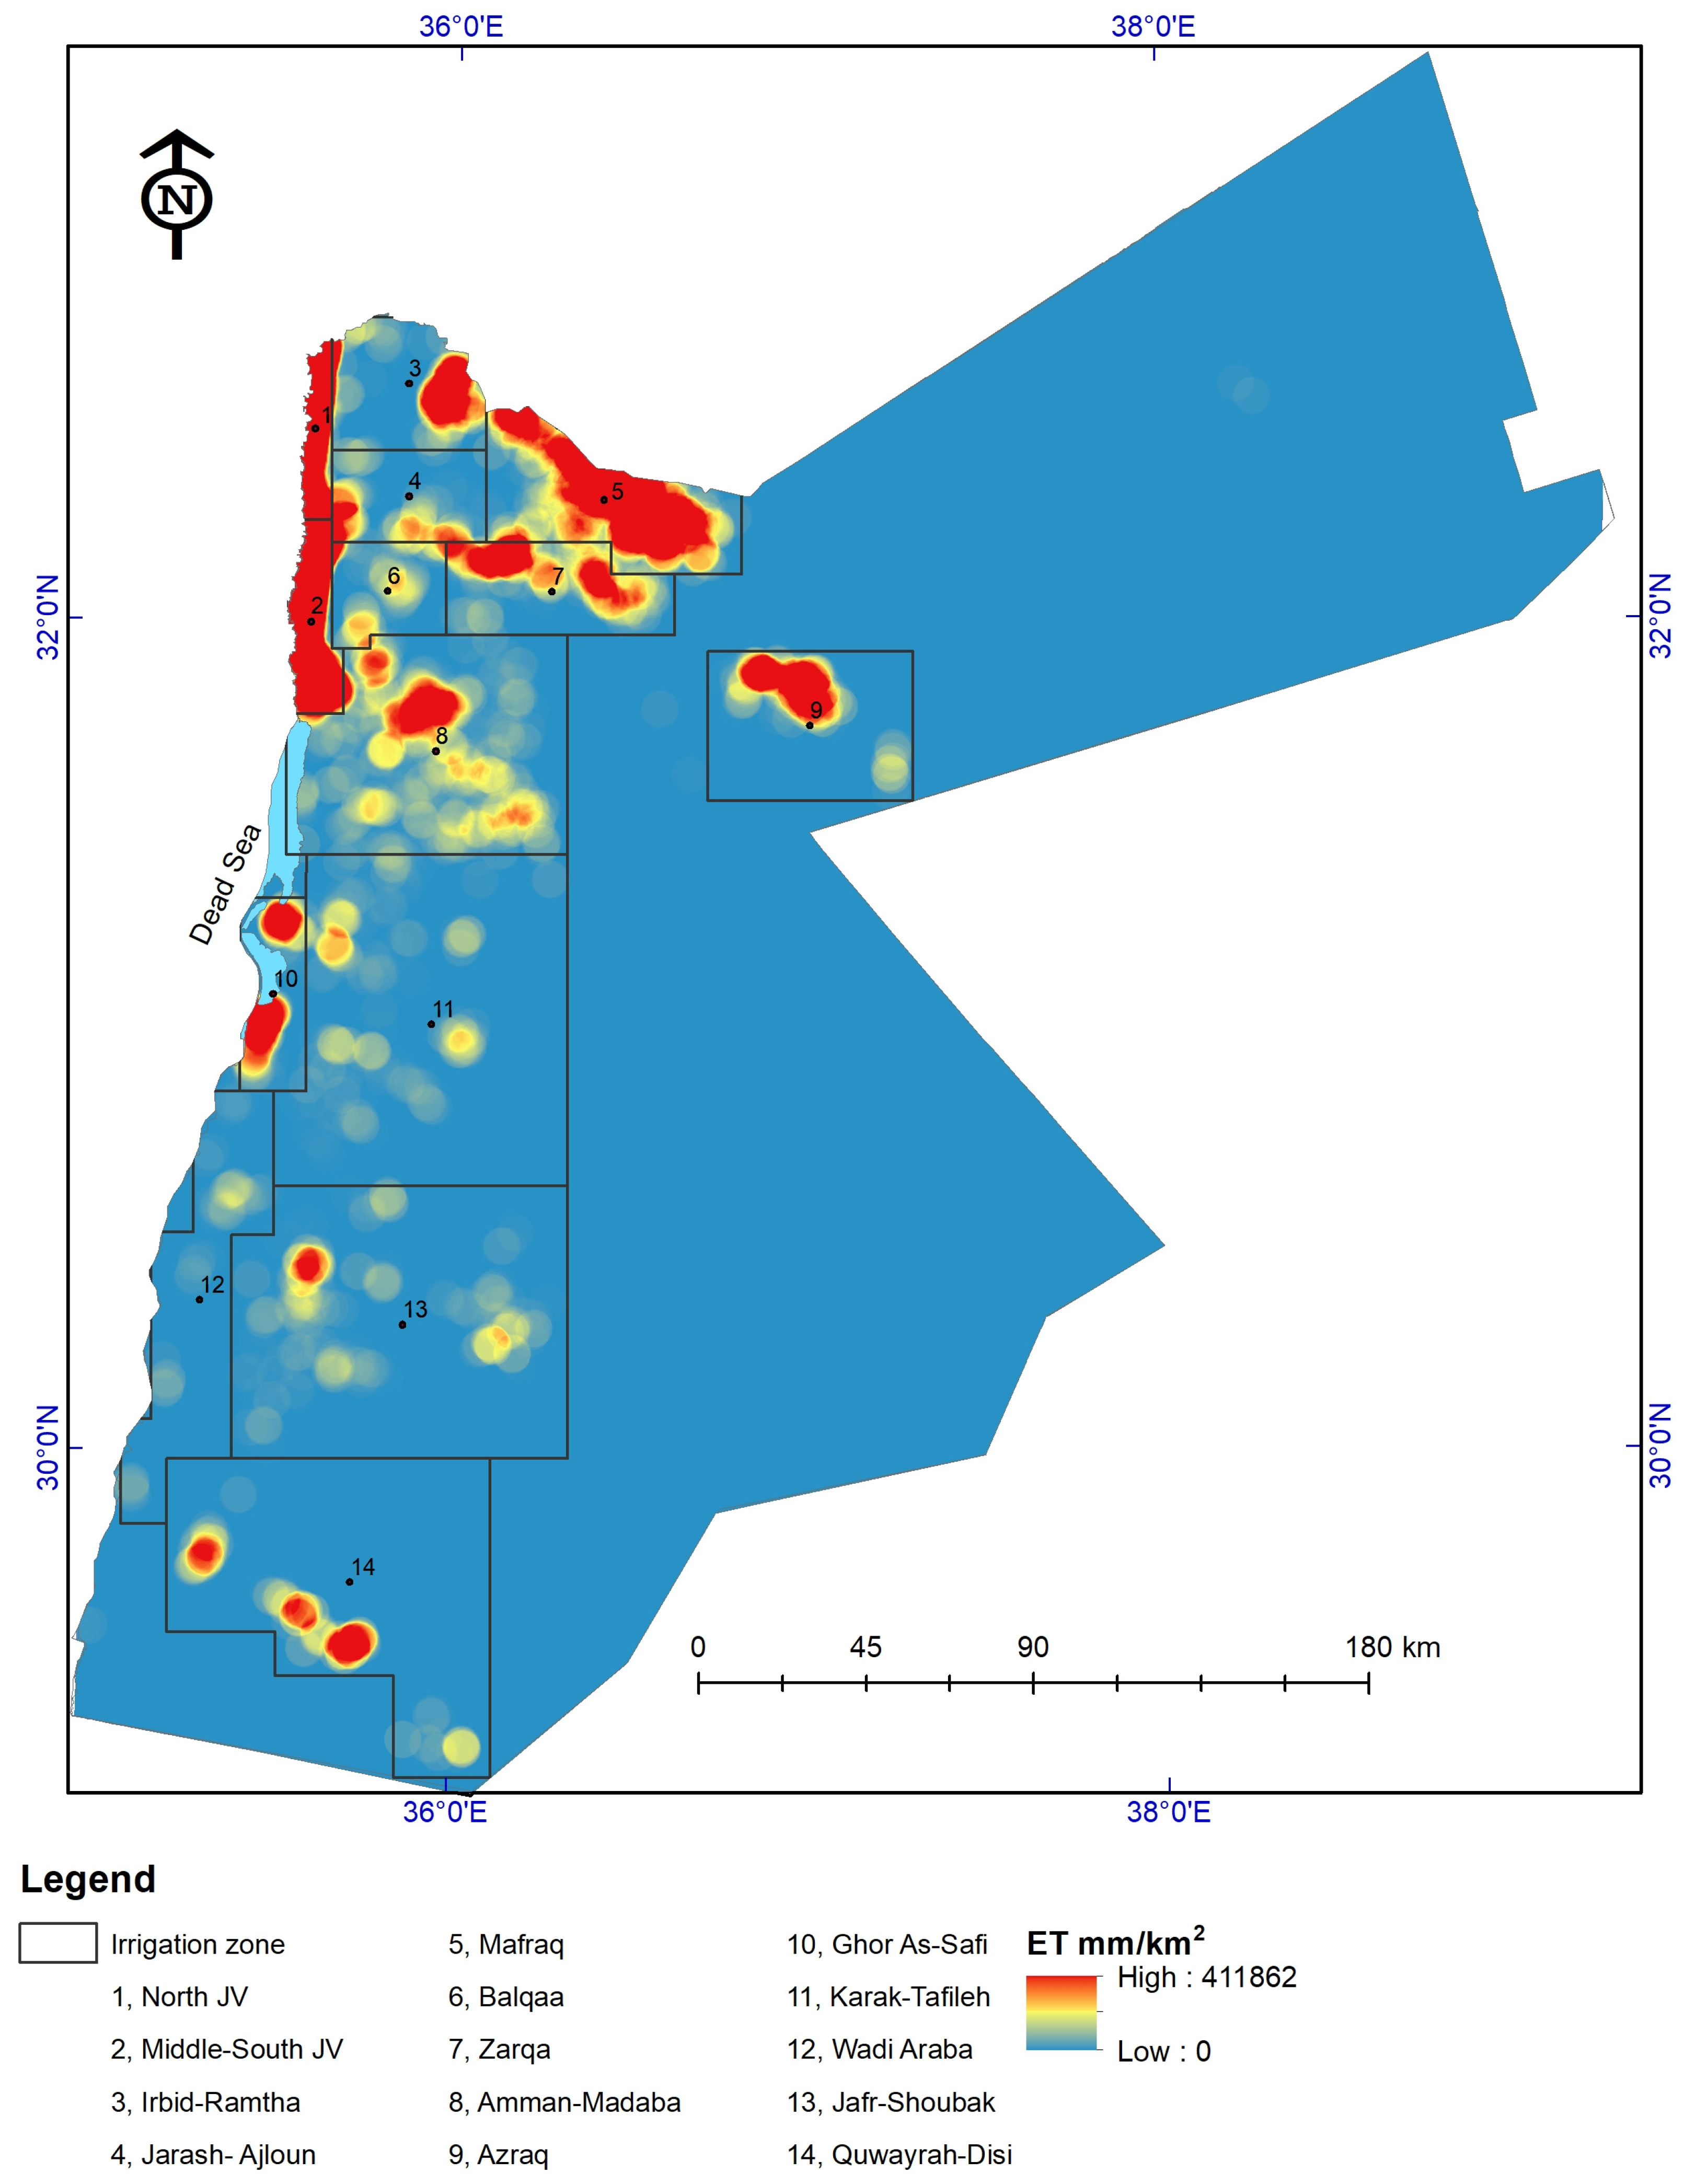
3.3. Remote Sensing of ET and IWC in Jordan
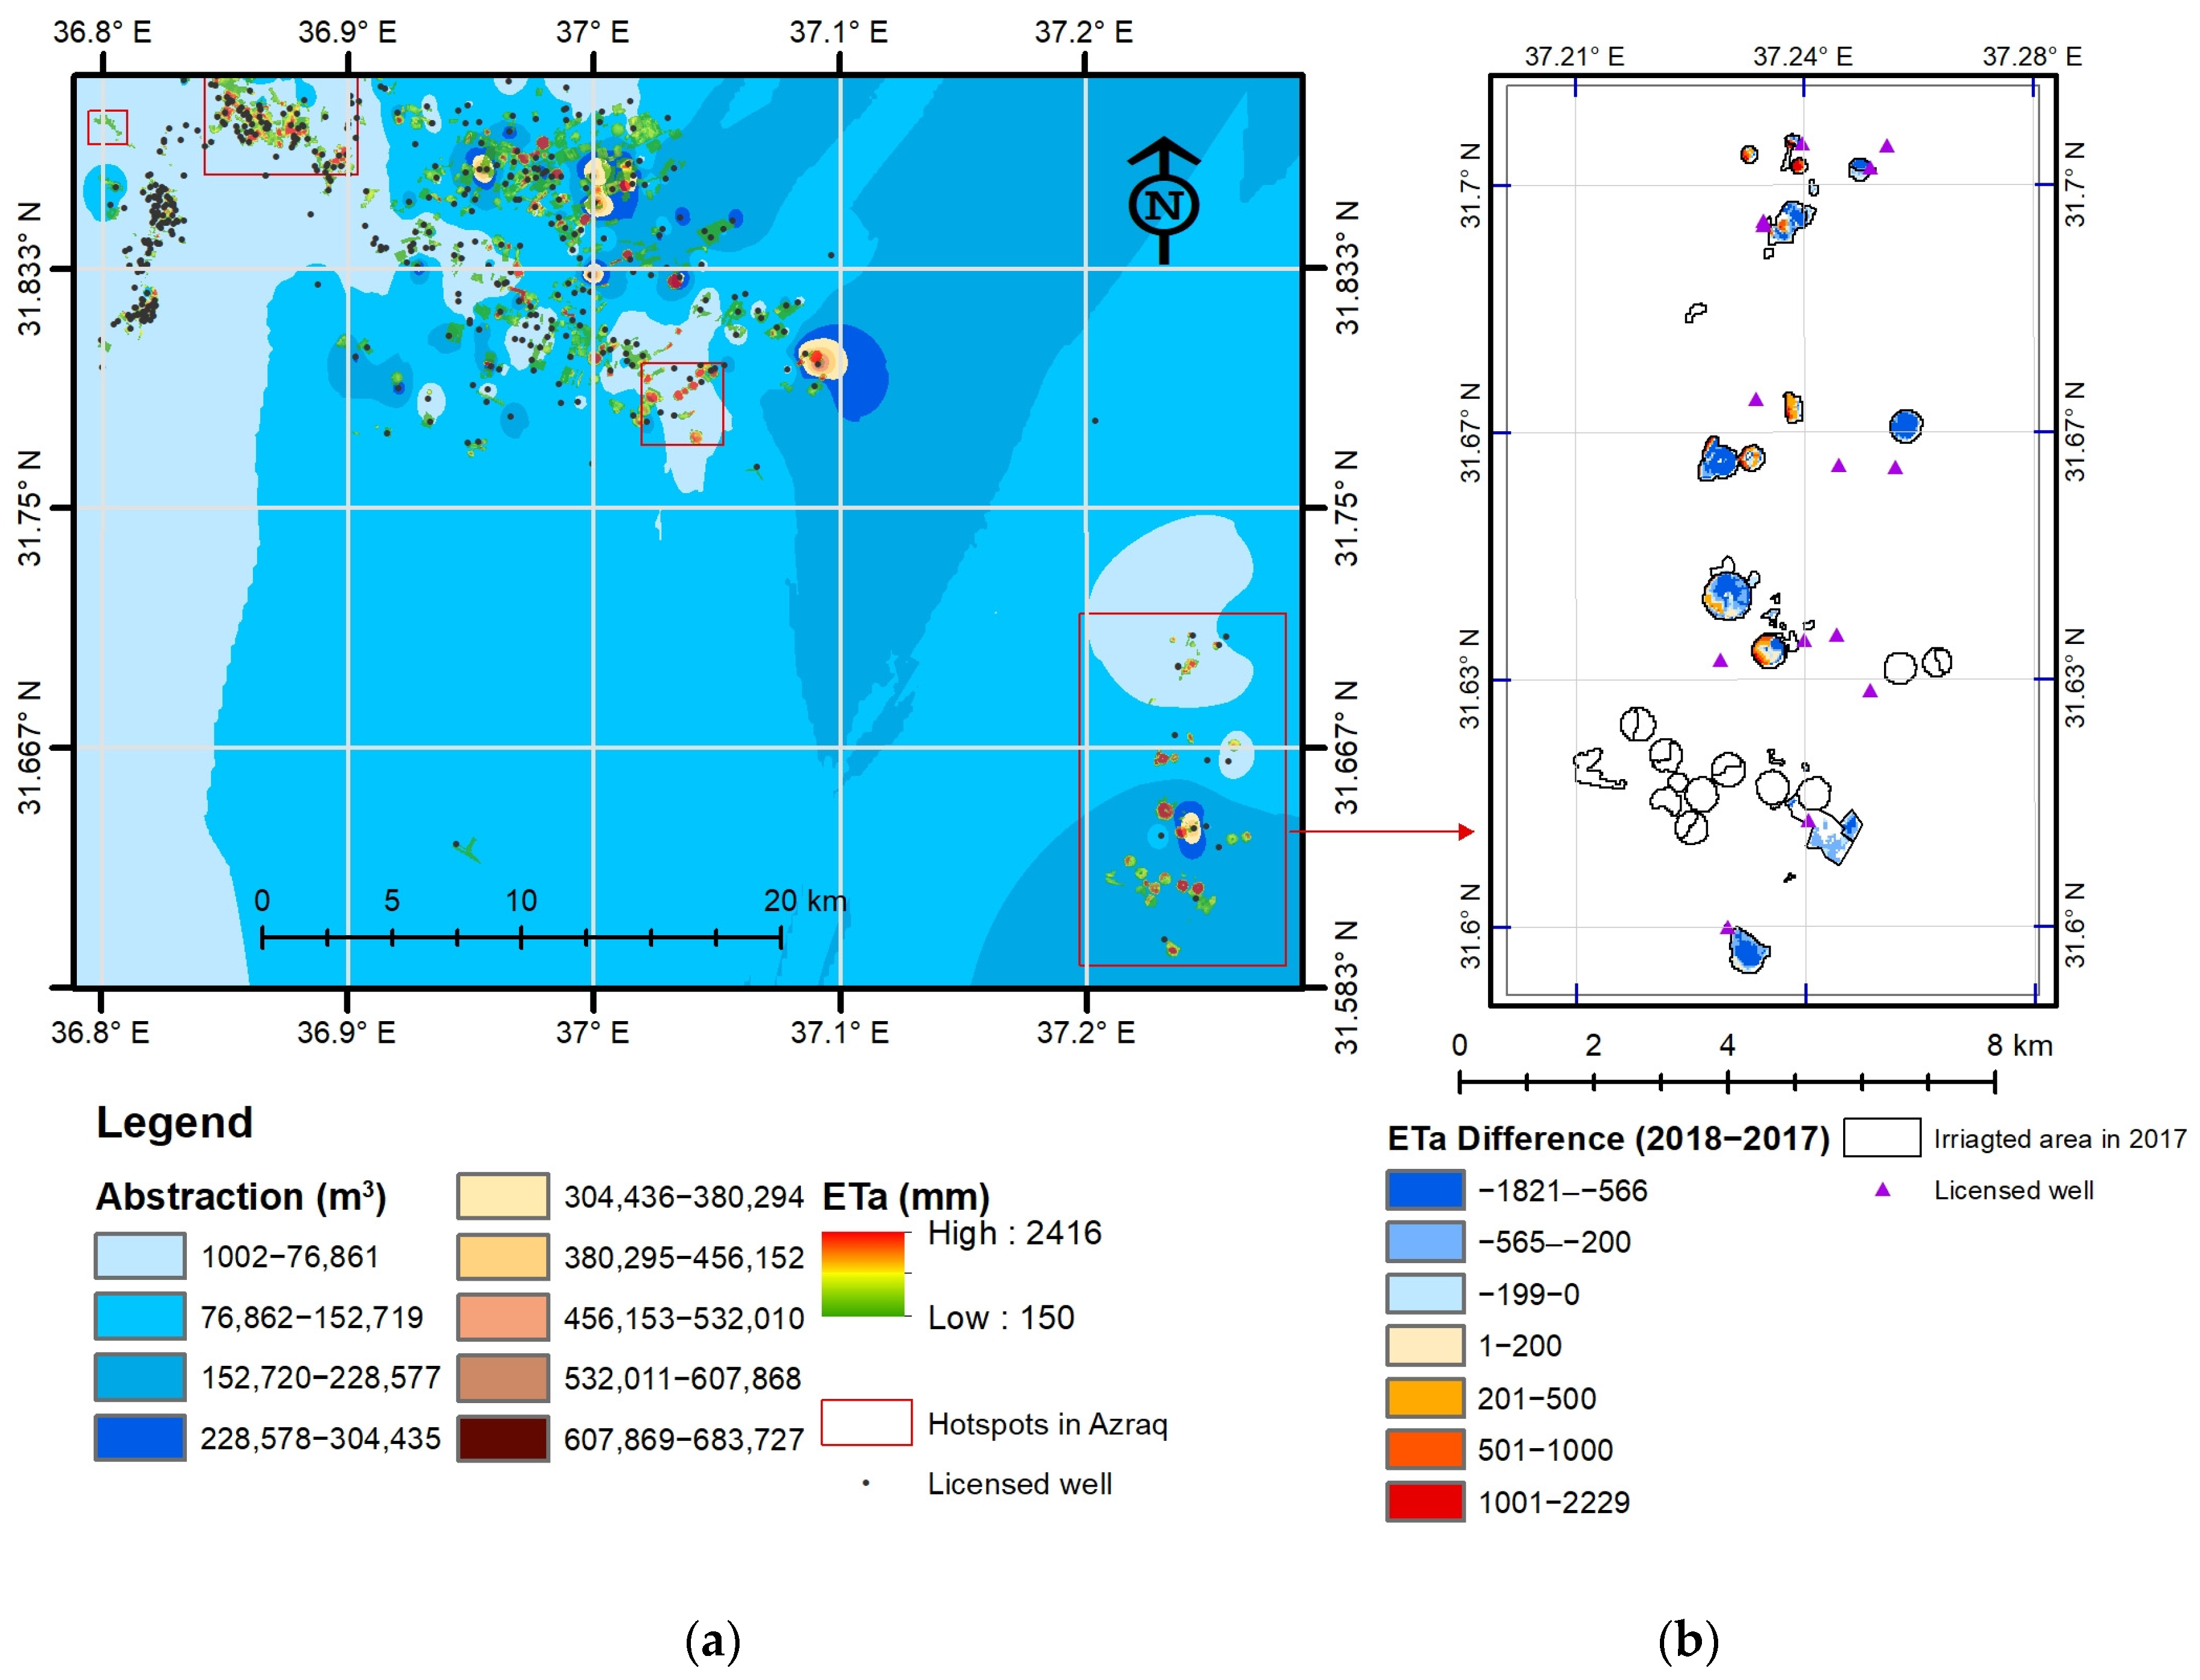
3.4. Remote Sensing and Groundwater Monitoring
3.5. Historical Changes and Future Trends of Irrigated Areas and IWC
4. Discussion
4.1. Remotely Sensed Irrigation Maps
4.2. Remote Sensing of ET and IWC
4.3. Future Planning of Irrigated Agriculture
5. Conclusions
Author Contributions
Funding
Data Availability Statement
Acknowledgments
Conflicts of Interest
Appendix A

| No. | Date—DD/MM/YYYY | 173/038 Azraq | 173/039 Jafr | 173/040 Disi | Date—DD/MM/YYYY | 174/037 NJV | 174/038 Amman | 174/039 Wadi Araba |
|---|---|---|---|---|---|---|---|---|
| 1. | 16 January 2018 | Cloudy * | 40.9 | 54.21 | 7 January 2018 | 7.5 | 9.1 | 16.6 |
| 2. | 1 February 2018 | 90.4 | 45.8 | 54.52 | 23 January 2018 | 31.5 | Cloudy ** | Cloudy * |
| 3. | 17 February 2018 | Cloudy * | Cloudy * | Cloudy * | 8 February 2018 | Cloudy ** | Cloudy ** | Cloudy * |
| 4. | 5 March 2018 | 143.5 | 101.0 | 166.72 | 24 February 2018 | 57.8 | 94.8 | 157.0 |
| 5. | 21 March 2018 | 138.3 | 99.9 | 121.42 | 12 March 2018 | 42.6 | 50.1 | 81.51 |
| 6. | 6 April 2018 | 136.4 | 97.8 | 138.9 | 28 March 2018 | Cloudy * | Cloudy * | Cloudy * |
| 7. | 22 April 2018 | 141.8 | Cloudy * | 137.78 | 13 April 2018 | 132.6 | 171.8 | 206.0 |
| 8. | 8 May 2018 | Cloudy * | 213.5 | 137.72 | 29 April 2018 | 72.7 | 93.3 | 116.1 |
| 9. | 24 May 2018 | 328.5 | Cloudy * | 186.91 | 15 May 2018 | 90.9 | 103.5 | 143.1 |
| 10. | 9 June 2018 | 200.5 | 269.0 | 169.45 | 31 May 2018 | Cloudy * | Cloudy * | Cloudy * |
| 11. | 25 June 2018 | 232.1 | 138.3 | 190.1 | 16 June 2018 | 195.2 | 276.1 | 345.1 |
| 12. | 11 July 2018 | 242.1 | 128.1 | 192.8 | 2 July 2018 | 109.6 | 125.5 | 177.6 |
| 13. | 27 July 2018 | 224.2 | 151.7 | 180.2 | 18 July 2018 | 104.0 | 141.8 | 170.2 |
| 14. | 12 August 2018 | 242.2 | 119.8 | 174.6 | 3 August 2018 | Cloudy * | 131.2 | Cloudy * |
| 15. | 28 August 2018 | 197.6 | 103.3 | 166.5 | 19 August 2018 | 220.7 | 116.5 | 326.6 |
| 16. | 13 September 2018 | 192.2 | Cloudy * | Cloudy * | 4 September 2018 | 93.9 | 108.8 | 156.2 |
| 17. | 29 September 2018 | 150.1 | 173.8 | 298.6 | 20 September 2018 | 88.7 | 94.9 | 131.8 |
| 18. | 15 October 2018 | 138.8 | 85.5 | 113.5 | 6 October 2018 | 62.0 | 81.9 | Cloudy * |
| 19. | 31 October 2018 | 129.8 | 60.2 | Cloudy * | 22 October 2018 | 44.6 | 60.7 | 214.3 |
| 20. | 16 November 2018 | Cloudy * | 39.9 | 187.2 | 7 November 2018 | 81.8 | 98.8 | 122.7 |
| 21. | 2 December 2018 | 125.4 | Cloudy * | Cloudy * | 23 November 2018 | Cloudy ** | Cloudy ** | Cloudy ** |
| 22. | 18 December 2018 | 73.8 | 68.8 | 144.0 | 9 December 2018 | 73.6 | 71.9 | Cloudy ** |
| 23. | N/A | 25 December 2018 | 36.3 | 37.3 | 161.5 | |||
| Annual Total | 3129 | 1937 | 2815 | 1546 | 1868 | 2526 | ||
| Other irrigated areas covered by the image | Mafraq | Disi | Jafr | Irbid- Ramtha | Zarqa, MSJV | Karak -Tafileh | ||
Appendix B
| Zone | ET-IWC Conversion Factor | Crop (s) | Exmples on Locations (s) | |
|---|---|---|---|---|
| Longitude (°E) | Latitude (°N) | |||
| 1- North JV | 0.76 | Citrus Tomato Banana | 35.5707 35.6091 35.5850 | 32.4269 32.4456 32.3956 |
| 2- Middle-South JV | 0.70 | Date palm Tomato | 35.5965 35.5982 | 32.0900 32.1235 |
| 3- Irbid-Ramtha | 0.65 | Potato, Mixed cropping Alfalfa | 35.9531 35.9616 35.9857 | 32.5447 32.5546 32.5947 |
| 4- Jarash-Ajloun | 0.70 | Fruit trees Vegetables | 35.6811 35.9962 | 32.3010 32.2403 |
| 5- Mafraq | 0.74 | Fruit trees (peaches) Olives Alfalfa | 36.4825 36.2896 36.4582 | 32.3268 32.3461 32.2798 |
| 6- Balqaa | 0.70 | Vegetables, fruit trees | 35.8230 | 32.0722 |
| 7- Zarqa | 0.68 | Alfalfa Vegetables Fruit trees | 36.3958 36.5664 36.4108 | 32.1399 32.0425 32.0704 |
| 8- Amman-Madaba | 0.75 | Olives Fruit trees Alfalfa | 36.0418 36.0271 35.8061 | 31.7448 31.6282 31.6915 |
| 9- Azraq | 0.64 | Fruit trees Vegetables Date palm Barley | 36.9209 36.9224 36.8004 36.9572 | 31.8374 31.8812 31.8065 31.8412 |
| 10- Ghor As-Safi | 0.72 | Tomato Fruit trees | 35.4441 35.5098 | 30.9120 31.2830 |
| 11- Karak-Tafileh | 0.75 | Olives Alfalfa | 35.6070 35.4415 | 30.8420 30.4111 |
| 12- Wadi Araba | 0.60 | Tomato Water melon | 35.3908 35.3736 | 30.6319 30.5775 |
| 13- Jafr-Shoubak | 0.60 | Apples Vegetables | 35.5855 35.7478 | 30.4537 30.4332 |
| 14- Quwayrah-Disi | 0.62 | Vegetables Alfalfa Date palm | 35.5533 35.5953 35.3274 | 29.6314 29.6110 29.7410 |
References
- Srivastava, P.K.; Suman, S.; Pandey, V.; Gupta, M.; Gupta, A.; Gupta, D.K.; Chaudhary, S.K.; Singh, U. Concepts and methodologies for agricultural water management. In Agricultural Water Management: Theories and Practices; Srivastava, P.K., Gupta, M., Tsakiris, G., Quinn, N.W., Eds.; Academic Press: London, UK, 2021; pp. 1–18. [Google Scholar]
- Dube, T.; Shekede, M.D.; Massari, C. Remote sensing for water resources and environmental management. Remote Sens. 2023, 15, 18. [Google Scholar] [CrossRef]
- Sonneveld, B.G.J.S.; Merbis, M.D.; Alfarra, A.; Ünver, O.; Arnal, M.A. Nature-Based Solutions for Agricultural Water Management and Food Security, FAO Land and Water Discussion Paper 12; Food and Agriculture Organization of the United Nations (FAO): Rome, Italy, 2018; p. 66. Available online: https://www.fao.org/3/ca2525en/ca2525en.pdf (accessed on 28 November 2022).
- FAO. The State of Food and Agriculture 2020: Overcoming Water Challenges in Agriculture; Food and Agriculture Organization of the United Nations (FAO): Rome, Italy, 2020; p. 210. Available online: https://doi.org/10.4060/cb1447en (accessed on 28 November 2022). [CrossRef]
- Basukala, A.K.; Oldenburg, C.; Schellberg, J.; Sultanov, M.; Dubovyk, O. Towards improved land use mapping of irrigated croplands: Performance assessment of different image classification algorithms and approaches. Eur. J. Remote Sens. 2017, 50, 187–201. [Google Scholar] [CrossRef]
- Thakur, R.; Manekar, V.L. Artificial intelligence-based image classification techniques for hydrologic applications. Appl. Artif. Intell. 2022, 36, 187–201. [Google Scholar] [CrossRef]
- Lowe, M.; Qin, R.; Mao, X. A Review on Machine Learning, Artificial Intelligence, and Smart Technology in Water Treatment and Monitoring. Water 2022, 14, 1384. [Google Scholar] [CrossRef]
- Krishnan, S.R.; Nallakaruppan, M.K.; Chengoden, R.; Koppu, S.; Iyapparaja, M.; Sadhasivam, J.; Sethuraman, S. Smart Water Resource Management Using Artificial Intelligence—A Review. Sustainability 2022, 14, 13384. [Google Scholar] [CrossRef]
- Cai, X.; Rosegrant, M.W. Global water demand and supply projections. Water Int. 2002, 27, 159–169. [Google Scholar] [CrossRef]
- Mancosu, N.; Snyder, R.L.; Kyriakakis, G.; Spano, D. Water scarcity and future challenges for food production. Water 2015, 7, 975–992. [Google Scholar] [CrossRef]
- Serbina, L.; Miller, H.M. Landsat and Water—Case Studies of the Uses and Benefits of Landsat Imagery in Water Resources; U.S. Geological Survey Open-File Report 2014–1108; U.S. Geological Survey: Reston, VA, USA, 2014; p. 61. [Google Scholar] [CrossRef]
- Allen, R.G.; Pereira, L.A.; Raes, D.; Smith, M. Crop Evapotranspiration—Guidelines for Computing Crop Water Requirements; FAO Irrigation and Drainage Paper 56; Food and Agriculture Organization of the United Nations (FAO): Rome, Italy, 1998; Available online: http://www.fao.org/3/X0490E/x0490e00.htm (accessed on 10 September 2022).
- Pereira, L.S.; Allen, R.G.; Smith, M.; Raes, D. Crop evapotranspiration estimation with FAO56: Past and future. Agric. Water Manag. 2015, 147, 4–20. [Google Scholar] [CrossRef]
- Nassar, A.; Torres-Rua, A.; Kustas, W.; Nieto, H.; McKee, M.; Hipps, L.; Stevens, D.; Alfieri, J.; Prueger, J.; Alsina, M.M.; et al. Influence of model grid size on the estimation of surface fluxes using the two source energy balance model and sUAS imagery in vineyards. Remote Sens. 2020, 12, 342. [Google Scholar] [CrossRef]
- Garrido-Rubio, J.; Calera, A.; Arellano, I.; Belmonte, M.; Fraile, L.; Ortega, T.; Bravo, R.; González-Piqueras, J. Evaluation of remote sensing-based irrigation water accounting at river basin district management scale. Remote Sens. 2020, 12, 3187. [Google Scholar] [CrossRef]
- Drexler, J.Z.; Snyder, R.L.; Spano, D.; Paw U, K.T. A review of models and micrometeorological methods used to estimate wetland evapotranspiration. Hydrol. Process. 2004, 18, 2071–2101. [Google Scholar] [CrossRef]
- Calera, A.; Campos, I.; Osann, A.; D’Urso, G.; Menenti, M. Remote sensing for crop water management: From ET modelling to services for the end users. Sensors 2017, 17, 1104. [Google Scholar] [CrossRef]
- Anderson, M.C.; Kustas, W.P.; Norman, J.M.; Hain, C.R.; Mecikalski, J.R.; Schultz, L.; González-Dugo, M.P.; Cammalleri, C.; D’urso, G.; Pimstein, A.; et al. Mapping daily evapotranspiration at field to continental scales using geostationary and polar orbiting satellite imagery. Hydrol. Earth Syst. Sci. 2011, 15, 223–239. [Google Scholar] [CrossRef]
- Allen, R.G.; Tasumi, M.; Trezza, R. Satellite-based energy balance for mapping evapotranspiration with internalized calibration (METRIC)—Model. J. Irrig. Drain. Eng. 2007, 133, 380–394. [Google Scholar] [CrossRef]
- Bastiaanssen, W.G.M.; Menenti, M.; Feddes, R.A.; Holtslag, A.A.M. A remote sensing surface energy balance algorithm for land (SEBAL). 1. Formulation. J. Hydrol. 1998, 212–213, 198–212. [Google Scholar] [CrossRef]
- Campos, I.; Neale, C.M.U.; Calera, A.; Balbontín, C.; González-Piqueras, J. Assessing satellite-based basal crop coefficients for irrigated grapes (Vitis vinifera L.). Agric. Water Manag. 2010, 98, 45–54. [Google Scholar] [CrossRef]
- FAO. WaPOR Database Methodology: Version 2 Release; FAO: Rome, Italy, 2020; p. 90. [Google Scholar] [CrossRef]
- Grosso, C.; Manoli, G.; Martello, M.; Chemin, Y.H.; Pons, D.H.; Teatini, P.; Piccoli, I.; Morari, F. Mapping Maize Evapotranspiration at Field Scale Using SEBAL: A Comparison with the FAO method and soil-plant model simulations. Remote Sens. 2018, 10, 1452. [Google Scholar] [CrossRef]
- Wagle, P.; Gowda, P.H. Editorial for the Special Issue “Remote Sensing of evapotranspiration (ET)”. Remote Sens. 2019, 11, 2146. [Google Scholar] [CrossRef]
- Jung, H.C.; Getirana, A.; Arsenault, K.R.; Holmes, T.R.H.; McNally, A. Uncertainties in evapotranspiration estimates over West Africa. Remote Sens. 2019, 11, 892. [Google Scholar] [CrossRef]
- Dhungel, S.; Barber, M.E. Estimating calibration variability in evapotranspiration derived from a satellite-based energy balance model. Remote Sens. 2018, 10, 1695. [Google Scholar] [CrossRef]
- Nassar, A.; Torres-Rua, A.; Kustas, W.; Alfieri, J.; Hipps, L.; Prueger, J.; Nieto, H.; Alsina, M.M.; White, W.; McKee, L.; et al. Assessing daily evapotranspiration methodologies from one-time-of-day sUAS and EC information in the GRAPEX project. Remote Sens. 2021, 13, 2887. [Google Scholar] [CrossRef] [PubMed]
- Asadi, M.; Kamran, K.V. Comparison of SEBAL, METRIC, and ALARM algorithms for estimating actual evapotranspiration of wheat crop. Theor. Appl. Climatol. 2022, 149, 327–337. [Google Scholar] [CrossRef]
- Chen, Y.; Xia, J.; Liang, S.; Feng, J.; Fisher, J.B.; Li, X.; Li, X.; Liu, S.; Ma, Z.; Miyata, A.; et al. Comparison of satellite-based evapotranspiration models over terrestrial ecosystems in China. Remote Sens. Environ. 2014, 140, 279–293. [Google Scholar] [CrossRef]
- Singh, R.K.; Senay, G.B. Comparison of Four different energy balance models for estimating evapotranspiration in the Midwestern United States. Water 2016, 8, 9. [Google Scholar] [CrossRef]
- Allen, R.; Irmak, A.; Trezza, R.; Hendrickx, J.M.H.; Bastiaanssen, W.; Kjaersgaard, J. Satellite-based ET estimation in agriculture using SEBAL and METRIC. Hydrol. Process. 2011, 25, 4011–4027. [Google Scholar] [CrossRef]
- Suleiman, A.; Bali, K.M.; Kleissl, J. Comparison of ALARM and SEBAL Evapotranspiration of Irrigated Alfalfa. In Proceedings of the ASABE Annual International Meeting, Reno, Nevada, 21–24 June 2009. [Google Scholar] [CrossRef]
- Owaneh, O.M.; Suleiman, A.A. Comparison of the performance of ALARM and SEBAL in estimating the actual daily ET from satellite data. J. Irrigat. Drain. Eng. 2018, 144, 04018024. [Google Scholar] [CrossRef]
- Zhou, X.; Bi, S.; Yang, Y.; Tian, F.; Ren, D. Comparison of ET estimations by the three-temperature model, SEBAL model and eddy covariance observations. J. Hydrol. 2014, 519, 769–776. [Google Scholar] [CrossRef]
- Rahimzadegan, M.; Janani, A. Estimating evapotranspiration of pistachio crop based on SEBAL algorithm using Landsat 8 satellite imagery. Agr. Water Manag. 2019, 217, 383–390. [Google Scholar] [CrossRef]
- Liou, Y.-A.; Kar, S.K. Evapotranspiration Estimation with Remote Sensing and Various Surface Energy Balance Algorithms—A Review. Energies 2014, 7, 2821–2849. [Google Scholar] [CrossRef]
- Acharya, B.; Sharma, V. Comparison of satellite driven surface energy balance models in estimating crop evapotranspiration in semi-arid to arid inter-mountain region. Remote Sens. 2021, 13, 1822. [Google Scholar] [CrossRef]
- Jaafar, H.H.; Ahmad, F.A. Time series trends of Landsat-based ET using automated calibration in METRIC and SEBAL: The Bekaa Valley, Lebanon. Remote Sens. 2020, 238, 111034. [Google Scholar] [CrossRef]
- Hlavaty, H. Water Management Initiative: Review of Water Scarcity Ranking Methodologies. A Report Prepared for Tetra Tech; USAID Water Management Initiative (WMI): Amman, Jordan, 2018. [Google Scholar]
- MWI (Ministry of Water and Irrigation, Jordan). Water Budget for Year 2017; Department of Policies and Strategic Planning, Ministry of Water and Irrigation: Amman, Jordan, 2018.
- MWI (Ministry of Water and Irrigation, Jordan). Water Budget for Year 2018; Department of Policies and Strategic Planning, Ministry of Water and Irrigation: Amman, Jordan, 2019.
- MWI (Ministry of Water and Irrigation, Jordan). Water Budget for Year 2019; Department of Policies and Strategic Planning, Ministry of Water and Irrigation: Amman, Jordan, 2020.
- Al-Bakri, J.T.; Shawash, S.; Ghanim, A.; Abdelkhaleq, R. Geospatial techniques for improved water management in Jordan. Water 2016, 8, 132. [Google Scholar] [CrossRef]
- WMI (Water Management Initiative). Remote Sensing for Crop Mapping and Assessment for Groundwater Abstraction in Azraq Basin; A report by Tetra Tech for USAID; USAID: Amman, Jordan, 2020. Available online: https://pdf.usaid.gov/pdf_docs/PA00X8QM.pdf (accessed on 20 October 2022).
- Yorke, V. Jordan’s shadow state and water management: Prospects for water security will depend on politics and regional cooperation. In Society–Water–Technology. A Critical Appraisal of Major Water Engineering Projects; Hüttl, R.F., Bismuth, O.B.C., Hoechstetter, S., Eds.; Springer: Cham, Switzerland, 2016; pp. 227–251. Available online: https://doi.org/10.1007/978-3-319-18971-0_15 (accessed on 28 November 2022). [CrossRef]
- Hussein, H. Lifting the veil: Unpacking the discourse of water scarcity in Jordan. Environ. Sci. Policy 2018, 89, 385–392. [Google Scholar] [CrossRef]
- Hussein, H. Tomatoes, tribes, bananas, and businessmen: An analysis of the shadow state and of the politics of water in Jordan. Environ. Sci. Policy 2018, 84, 170–176. [Google Scholar] [CrossRef]
- Klauer, B.; Küblböck, K.; Omann, I.; Karutz, R.; Klassert, C.; Zhu, Y.; Zozmann, H.; Smilovic, M.; Talozi, S.; Figueroa, A.J.; et al. Stakeholder Workshops Informing System Modeling—Analyzing the Urban Food–Water–Energy Nexus in Amman, Jordan. Sustainability 2022, 14, 11984. [Google Scholar] [CrossRef]
- Zozmann, H.; Klassert, C.; Sigel, K.; Gawel, E.; Klauer, B. Commercial Tanker Water Demand in Amman, Jordan—A Spatial Simulation Model of Water Consumption Decisions under Intermittent Network Supply. Water 2019, 11, 254. [Google Scholar] [CrossRef]
- Al Naber, M.; Molle, F. Controlling groundwater over abstraction: State policies vs. local practices in the Jordan highlands. Water Policy 2017, 19, 692–708. [Google Scholar] [CrossRef]
- Markham, B.; Storey, J.; Morfitt, R. Landsat-8 sensor characterization and calibration. Remote Sens. 2015, 7, 2279–2282. [Google Scholar] [CrossRef]
- Drusch, M.; Del Bello, U.; Carlier, S.; Colin, O.; Fernandez, V.; Gascon, F.; Hoersch, B.; Isola, C.; Laberinti, P.; Martimort, P.; et al. Sentinel-2: ESA’s optical high-resolution mission for GMES operational services. Remote Sens. Environ. 2012, 120, 25–36. [Google Scholar] [CrossRef]
- ESA (European Space Agency). Sentinel-2 Mission, ESA. Available online: https://sentinel.esa.int/web/sentinel/missions/sentinel-2. (accessed on 2 September 2022).
- Al-Bakri, J.T.; D’Urso, G.; Batchelor, C.; Abukhalaf, M.; Alobeiaat, A.; Al-Khreisat, A.; Vallee, D. Remote Sensing-Based Agricultural Water Accounting for the North Jordan Valley. Water 2022, 14, 1198. [Google Scholar] [CrossRef]
- Ozdogan, M.; Yang, Y.; Allez, G.; Cervantes, C. Remote Sensing of Irrigated Agriculture: Opportunities and Challenges. Remote Sens. 2010, 2, 2274–2304. [Google Scholar] [CrossRef]
- Jensen, J.R. Introductory Digital Image Processing: A Remote Sensing Perspective (Pearson Series in Geographic Information Science), 4th ed.; Prentice Hall: Upper Saddle River, NJ, USA, 2015. [Google Scholar]
- Simonneaux, V.; Duchemin, B.; Helson, D.; Raki, E.; Olioso, A.; Chehbouni, A. The use of high-resolution image time series for crop classification and evapotranspiration estimate over an irrigated area in central Morocco. Int. J. Remote Sens. 2008, 29, 95–116. [Google Scholar] [CrossRef]
- El-Magd, I.A.; Tanton, T.W. Improvements in land use mapping for irrigated agriculture from satellite sensor data using a multi-stage maximum likelihood classification. Int. J. Remote Sens. 2003, 24, 4197–4206. [Google Scholar] [CrossRef]
- Pontius Jr, R.G.; Millones, M. Death to Kappa: Birth of quantity disagreement and allocation disagreement for accuracy assessment. Int. J. Remote Sens. 2011, 32, 4407–4429. [Google Scholar] [CrossRef]
- Foody, G.M. Explaining the unsuitability of the kappa coefficient in the assessment and comparison of the accuracy of thematic maps obtained by image classification. Remote Sens. Environ. 2020, 111630. [Google Scholar] [CrossRef]
- DOS (Department of Statistics, Jordan). Agriculture: Crop Statistics; Tables and Interactive Statistical Data for Irrigated and Non-Irrigated Areas; DOS: Amman, Jordan. Available online: https://jorinfo.dos.gov.jo/Databank/pxweb/en/DOS_Database/START__08/AGR_AREA/ (accessed on 16 September 2022).
- Al-Bakri, J.T. Remote Sensing Techniques for Environmental Monitoring of the Semiarid Zone of Jordan. Ph.D. Thesis, Cranfield University, Bedford, UK, 2000. [Google Scholar]
- Al-Bakri, J.T.; Taylor, J.C.; Brewer, T.R. Monitoring land use change in the Badia transition zone in Jordan using aerial photography and satellite imagery. Geogr. J. 2001, 167, 248–262. [Google Scholar] [CrossRef]
- Al-Bakri, J.T. Crop Mapping and Validation of ALEXI-ET in Azraq and Mafraq Areas; A Report for Regional Coordination on Improved Water Resources Management and Capacity Building; Ministry of Water and Irrigation: Amman, Jordan, 2015; pp. 19–31.
- Moriasi, D.N.; Arnold, J.G.; Van Liew, M.W.; Bingner, R.L.; Harmel, R.D.; Veith, T.L. Model evaluation guidelines for systematic quantification of accuracy in watershed simulations. Trans. ASABE 2007, 50, 885–900. [Google Scholar] [CrossRef]
- Burgan, H.I.; Aksoy, H. Daily flow duration curve model for ungauged intermittent subbasins of gauged rivers. J. Hydrol. 2022, 604, 127249. [Google Scholar] [CrossRef]
- Bolstad, P. GIS Fundamentals: A First Text on Geographic Information Systems, 6th ed.; Eider Press: White Bear Lake, MN, USA, 2019; p. 764. [Google Scholar]
- Mitchell, A. The Esri Guide to GIS Analysis, Volume 1: Geographic Patterns and Relationships, 2nd ed.; ESRI Press: Redlands, California, 2020; pp. 105–133. [Google Scholar]
- GIZ (German Society for International Cooperation). Assessment of Surface Water Production, Conveyance and Use in All Sectors in Jordan; Final Report for Third National Water Master Plan (NWMP-3); GIZ: Amman, Jordan, 2021. [Google Scholar]
- Franceschini, G.; De Leo, E.; Muchoney, D. Jordan—Land Cover Atlas; FAO: Rome, Italy, 2019; p. 66. Available online: https://www.fao.org/3/ca3388en/CA3388EN.pdf (accessed on 22 October 2022).
- Kamble, B.; Kilic, A.; Hubbard, K. Estimating Crop Coefficients Using Remote Sensing-Based Vegetation Index. Remote Sens. 2013, 5, 1588–1602. [Google Scholar] [CrossRef]
- Hunsaker, D.J.; Pinter, P.J., Jr.; Kimball, B.A. Wheat basal crop coefficients determined by normalized difference vegetation index. Irrig. Sci 2005, 24, 1–14. [Google Scholar] [CrossRef]
- Reyes-González, A.; Trooien, T.; Kjaersgaard, J.; Hay, C.; Reta-Sánchez, D.G. Development of Crop Coefficients Using Remote Sensing-Based Vegetation Index and Growing Degree Days. In Proceedings of the ASABE Annual International Meeting, ASABE Paper No. 162462560, Orlando, FL, USA, 17–20 July 2016. [Google Scholar] [CrossRef]
- Margane, A.; Qadi, M.; Kurdi, O. Updating the Groundwater Contour Map of the A7/B2 Aquifer in North Jordan; Technical Report prepared by BGR Project Syrian Refugee Response 2009.2209.6, BGR archive no. 0132576; BGR and GIZ: Amman, Jordan, 2015; p. 130. [Google Scholar]
- Shatanawi, M.; Fardous, A.; Mazahrih, N.; Duqqah, M. Irrigation systems performance in Jordan. In Irrigation Systems Performance; Lamaddalena, N., Lebdi, F., Todorovic, M., Bogliotti, C., Eds.; (Options Méditerranéennes: Série B. Etudes et, Recherches; n., 52); CIHEAM: Bari, Italy, 2005; pp. 123–131. [Google Scholar]
- MWI and BGR (Ministry of Water and Irrigation; Bundesanstalt für Geowissenschaften und Rohstoffe). Groundwater Resource Assessment of Jordan; MWI and BGR: Amman, Jordan, 2019.
- MWI (Ministry of Water and Irrigation, Jordan). Jordan’s Water Strategy 2016–2025; Ministry of Water and Irrigation: Amman, Jordan, 2016.
- Saidan, M.N.; Al-Addous, M.; Al-Weshah, R.A.; Obada, I.; Alkasrawi, M.; Barbana, N. Wastewater Reclamation in Major Jordanian Industries: A Viable Component of a Circular Economy. Water 2020, 12, 1276. [Google Scholar] [CrossRef]
- GIZ & MWI. Third National Water Master Plan (NWMP-3), Volume B—Water Resources; Technical Report; Management of Water Resources Project: Jordan, Amman, 2022; p. 181.


| Method | Areas Applied in for Mapping | Class Accuracy Range (%) | Data Used to Improve Accuracy and Finalize Maps |
|---|---|---|---|
| Unsupervised classification of NDVI layers | NJV, MSJV, and Ghor As-Safi | 78–89 | GIS layers of JVA, Sentinel-2 NDVI layers |
| Highlands | 82–87 | SEBAL-ET, GIS layers of water resources | |
| Density slicing of NDVI images of Sentinel-2 | Wadi Araba | 89–92 | GIS layers of groundwater wells |
| Density slicing of annual sum of OLI-NDVI layers and decision tree based on NDVI profiles | Badia | 81–94 | SEBAL-ET, GIS layers of groundwater wells |
| Crop | Highlands (HL) | Jordan Valley (JV) 1 | Min.2 | Max. | Mean | S.E. | C.L. | % of the Crop | |
|---|---|---|---|---|---|---|---|---|---|
| Vegetables—open fields | Open fields cultivated with tomato, watermelon, melon, pepper, potato, and other vegetables. | Farm units cultivated with tomato, eggplant, pepper, potato, onion, okra (NJV), and other vegetables. | HL | 24,837 | 27,332 | 26,312 | 755 | 3250 | 27.3 |
| JV | 15,159 | 18,760 | 17,302 | 1095 | 4710 | 17.9 | |||
| Total | 42,491 | 45,528 | 43,615 | 962 | 4137 | 45.2 | |||
| Vegetables—plastic houses | Tomato, cucumber, and other crops grown under plastic houses in spring and summer. | Tomato, cucumber, strawberry, beans, and others. Includes nurseries and multi-spans. | HL | 1642 | 2548 | 2101 | 262 | 1126 | 2.2 |
| JV | 3958 | 4083 | 4027 | 37 | 158 | 4.2 | |||
| Total | 5725 | 6589 | 6128 | 251 | 1080 | 6.4 | |||
| Trees | Olives, deciduous trees of stone fruits, peaches, apricot, date palm, apples, and grapevines. | Citrus, date palm and grapevines, fruit trees, olives, and banana. | HL | 24,615 | 25,102 | 24,893 | 145 | 623 | 25.8 |
| JV | 11,336 | 12,103 | 11,597 | 253 | 1089 | 12.0 | |||
| Total | 36,314 | 36,718 | 36,490 | 119 | 514 | 37.8 | |||
| Mixed crops | Farms cultivated fruit trees and vegetables, olives and alfalfa, and nurseries. | Parts of farm units cultivated with fruit trees, vegetables, and cereals. It also includes nurseries. | HL | 4220 | 5397 | 4955 | 370 | 1592 | 5.1 |
| JV | 367 | 529 | 438 | 48 | 206 | 0.5 | |||
| Total | 4637 | 5777 | 5393 | 378 | 1626 | 5.6 | |||
| Fodders and cereals | Open fields cultivated with fodder, forage, and cereal crops. | Farm units cultivated with wheat and barley under supplementary irrigation or alfalfa with full irrigation. | HL | 3949 | 4596 | 4344 | 200 | 860 | 4.4 |
| JV | 290 | 580 | 438 | 84 | 360 | 0.5 | |||
| Total | 4239 | 5066 | 4782 | 272 | 1169 | 4.9 | |||
| Totals for Jordan | HL | 61,573 | 63,256 | 62,605 | 522 | 2245 | 64.7 | ||
| JV | 32,039 | 35,149 | 33,802 | 922 | 3965 | 35.3 | |||
| Total | 95,295 | 98,135 | 96,407 | 876 | 3768 | 100 | |||
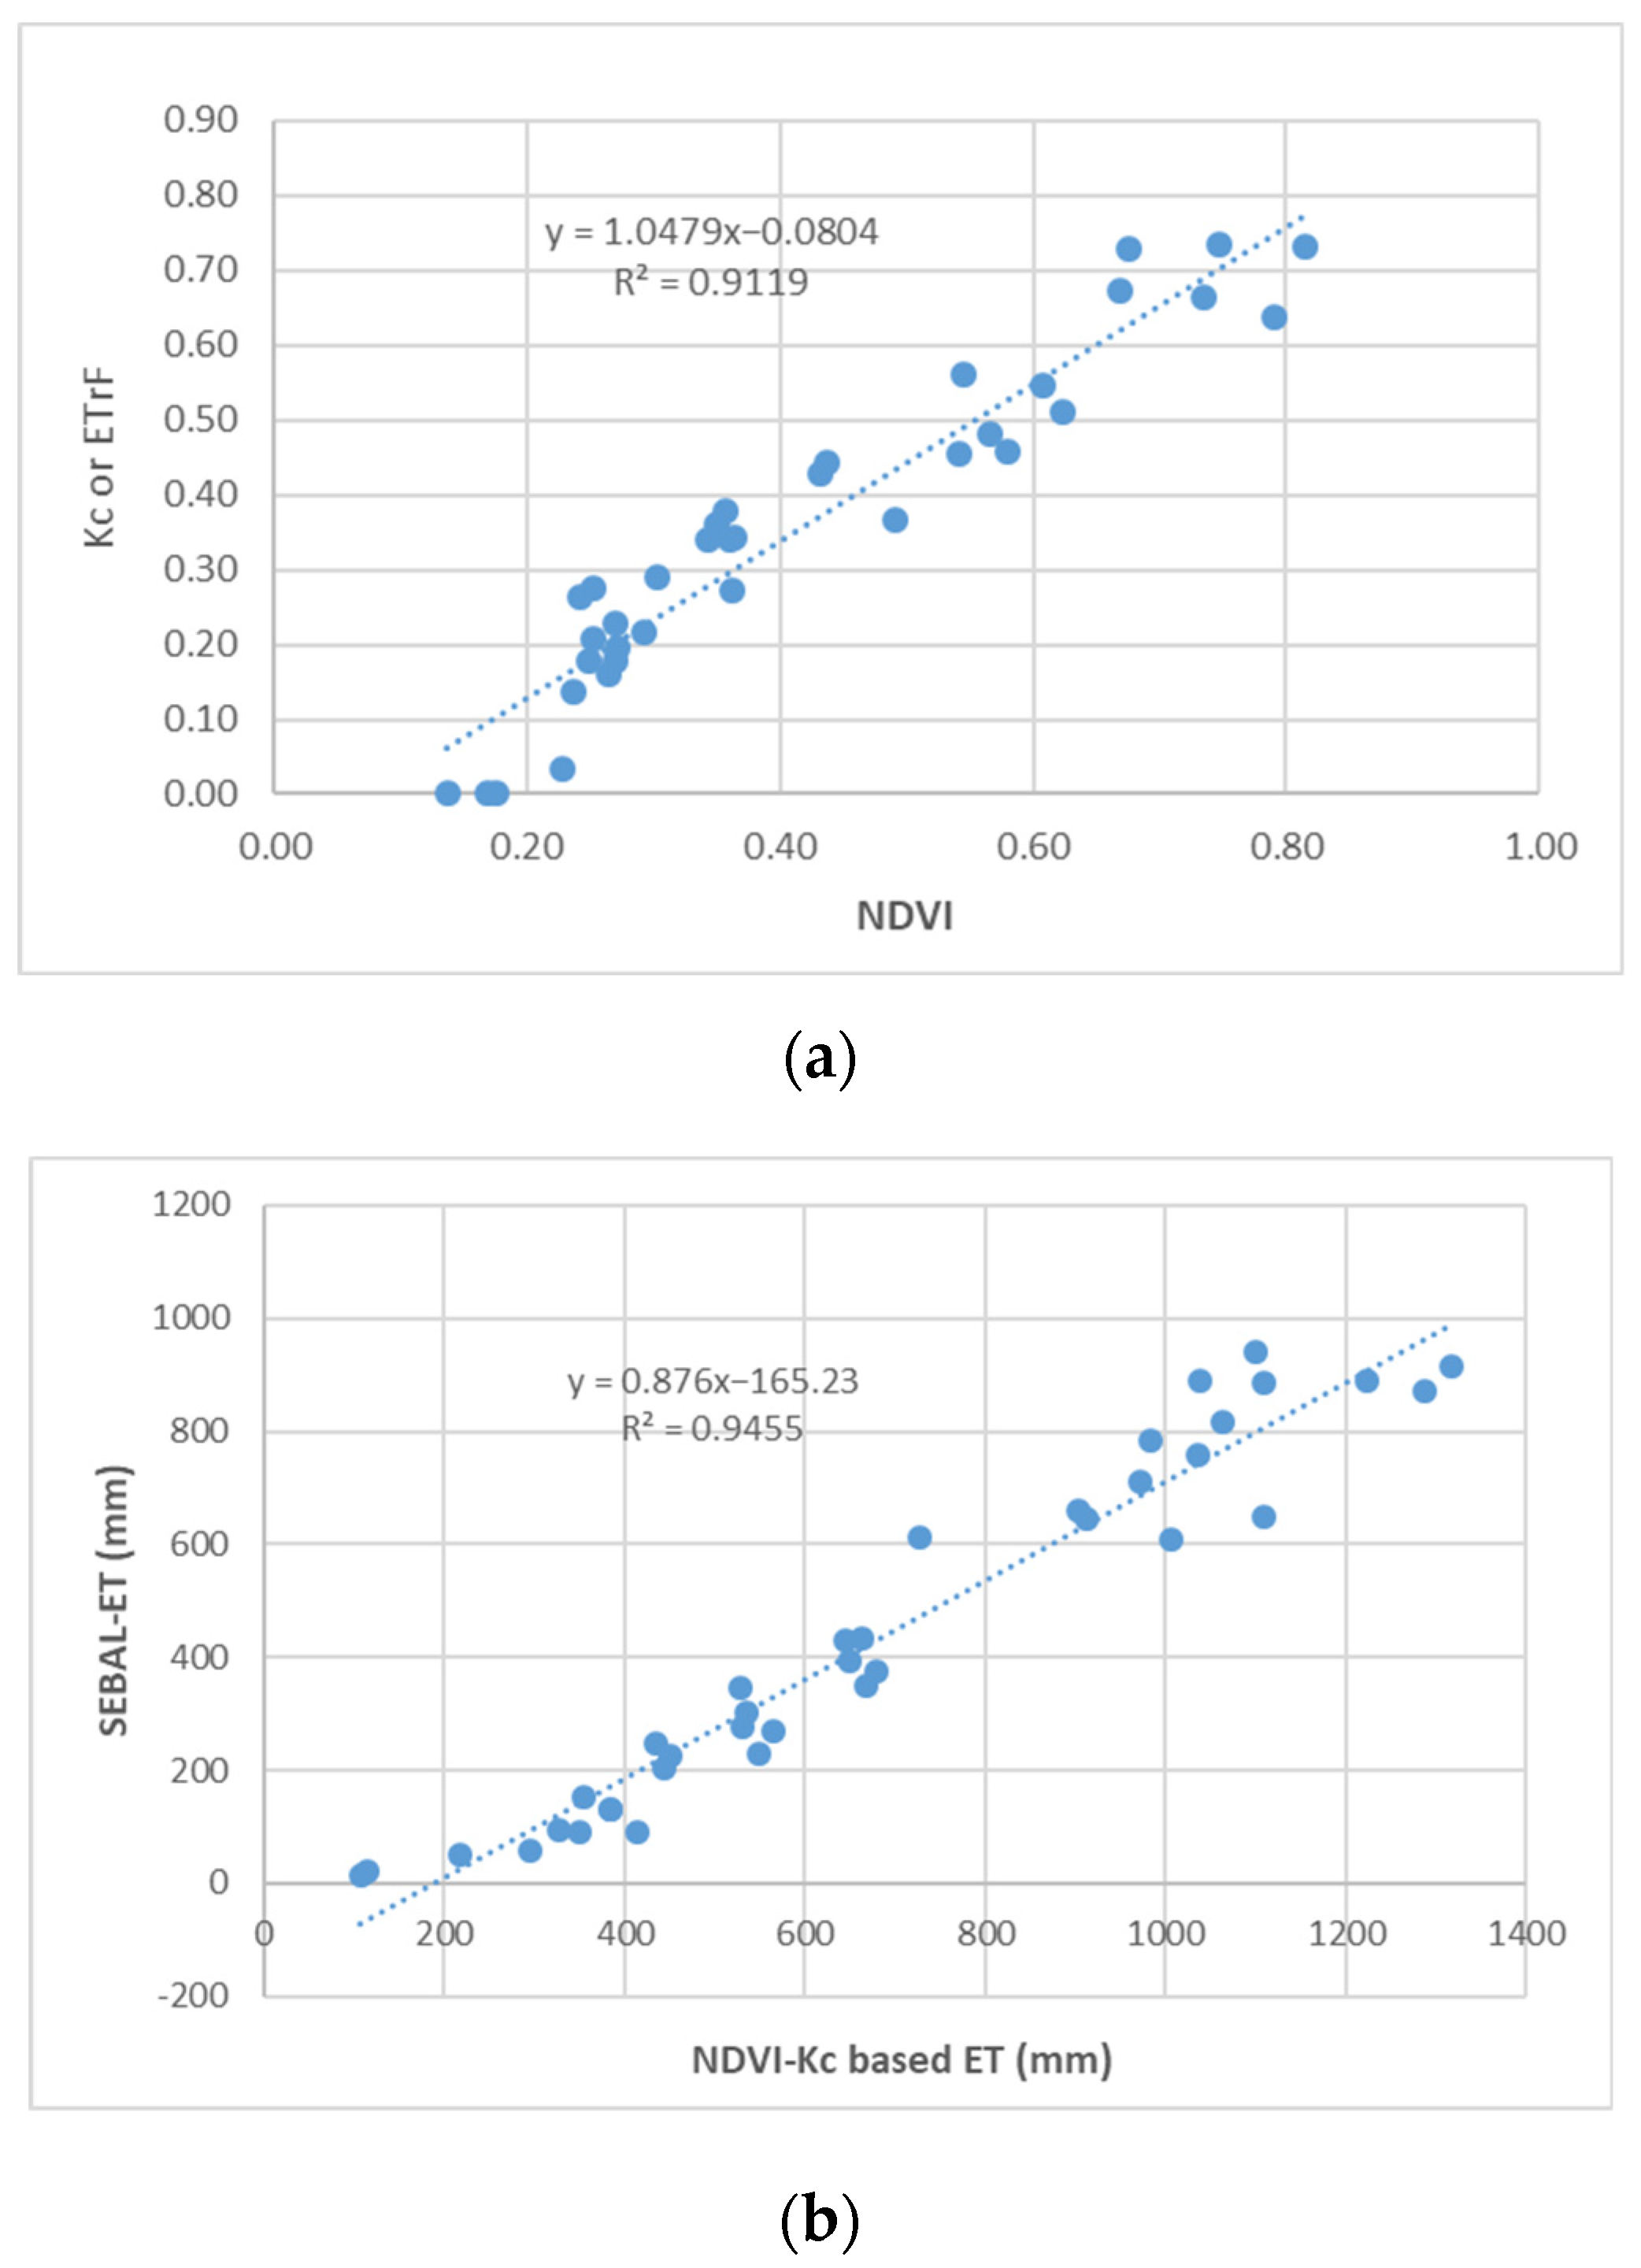
| Regression Parameter | Vegetables | Tree Crops | Mixed Crops | Alfalfa |
|---|---|---|---|---|
| Observations | 47 | 36 | 34 | 48 |
| Intercept (a) | −0.123 | −0.080 | −0.216 | −0.158 |
| Slope (b) | 1.034 | 1.048 | 1.636 | 1.216 |
| R2 (Coefficient of determination) | 0.887 | 0.912 | 0.928 | 0.918 |
| Standard Error | 0.047 | 0.059 | 0.039 | 0.0629 |
| Area (ha) | IWC (MCM) | Cropping Pattern (%) | ||||||||||||
|---|---|---|---|---|---|---|---|---|---|---|---|---|---|---|
| Zone | Min. * | Max. | Mean | S.E. | C.L. | Min. | Max. | Mean | S.E. | C.L. | Vegetables | Trees | Mixed | Fodders and Cereals |
| 1- North JV | 10,796 | 11,120 | 10,962 | 94 | 403 | 90.7 | 96.2 | 93.6 | 1.59 | 6.8 | 34.7 | 61.5 | 2.0 | 1.8 |
| 2- Middle-South JV | 14,784 | 17,265 | 16,207 | 739 | 3180 | 157.2 | 168.3 | 163.3 | 3.26 | 14.0 | 71.3 | 26.4 | 1.3 | 1.0 |
| 3- Irbid-Ramtha | 3769 | 4116 | 3974 | 105 | 452 | 29.3 | 33.4 | 31.8 | 1.27 | 5.4 | 83.9 | 14.3 | 0.4 | 1.3 |
| 4- Jarash-Ajloun | 1401 | 1468 | 1431 | 20 | 84 | 13.8 | 14.9 | 14.2 | 0.34 | 1.5 | 25.6 | 53.9 | 18.9 | 1.7 |
| 5- Mafraq | 17,939 | 18,596 | 18,243 | 191 | 823 | 101.5 | 118.2 | 112.1 | 5.31 | 22.8 | 32.1 | 62.0 | 4.9 | 1.0 |
| 6- Balqaa | 1079 | 1185 | 1149 | 35 | 150 | 6.8 | 9.4 | 8.2 | 0.76 | 3.3 | 48.0 | 38.7 | 12.7 | 0.7 |
| 7- Zarqa | 6131 | 6923 | 6586 | 236 | 1016 | 28.6 | 34.0 | 31.5 | 1.58 | 6.8 | 51.3 | 26.5 | 6.4 | 15.9 |
| 8- Amman-Madaba | 12,530 | 13,100 | 12,820 | 165 | 708 | 67.0 | 71.3 | 69.2 | 1.24 | 5.3 | 54.2 | 36.3 | 6.0 | 3.5 |
| 9- Azraq | 5004 | 5391 | 5225 | 115 | 495 | 38.6 | 45.3 | 42.1 | 1.94 | 8.3 | 20.3 | 38.4 | 18.7 | 22.5 |
| 10- Ghor As-Safi | 5077 | 5161 | 5125 | 25 | 108 | 32.8 | 42.0 | 37.1 | 2.67 | 11.5 | 90.1 | 8.4 | 0.2 | 1.3 |
| 11- Karak-Tafileh | 2786 | 3348 | 3072 | 162 | 698 | 15.2 | 16.5 | 15.9 | 0.38 | 1.7 | 48.7 | 17.5 | 22.2 | 11.6 |
| 12- Wadi Araba | 1382 | 1603 | 1507 | 65 | 282 | 5.8 | 6.9 | 6.4 | 0.32 | 1.4 | 87.3 | 12.0 | 0.3 | 0.4 |
| 13- Jafr-Shoubak | 6011 | 6429 | 6236 | 122 | 524 | 25.0 | 34.0 | 28.8 | 2.69 | 11.6 | 52.1 | 32.5 | 6.5 | 9.1 |
| 14- Quwayrah-Disi | 3682 | 4122 | 3868 | 131 | 566 | 36.8 | 43.7 | 39.4 | 2.18 | 9.4 | 55.0 | 22.1 | 10.2 | 12.7 |
| Jordan | 95,295 | 98,135 | 96,407 | 876 | 3768 | 688 | 702 | 694 | 4.26 | 18.3 | ||||
| Zone | Area (ha) | IWC (MCM) | Irrigation Water Sources (MCM) | |||
|---|---|---|---|---|---|---|
| Surface * | TWW | EGW | RGW | |||
| North JV | 11,120 | 96.2 | 76.5 | -- | 19.7 | 18.2 ** |
| Middle-South JV | 17,265 | 164.5 | 126.6 | -- | 37.9 | 15.4 |
| Irbid-Ramtha | 4116 | 33.4 | 5.7 | 5.7 | 22.0 | 4.0 |
| Jarash-Ajloun | 1468 | 13.8 | 7.3 | 2.9 | 3.6 | 3.6 |
| Mafraq | 17,939 | 116.5 | 7.5 | 4.5 | 104.5 | 65.0 |
| Balqaa | 1079 | 9.4 | 4.0 | 3.2 | 2.2 | 2.0 |
| Zarqa | 6705 | 32.0 | 6.5 | 6.1 | 19.4 | 13.8 |
| Amman-Madaba | 13,100 | 71.3 | 12.9 | 3.9 | 54.5 | 36.7 |
| Azraq | 5280 | 38.6 | 2.7 | -- | 35.9 | 16.4 |
| Ghor As-Safi | 5161 | 42.0 | 37.1 | -- | 4.9 | 1.3 |
| Karak-Tafileh | 3348 | 15.2 | 9.2 | 1.4 | 4.6 | 4.8 |
| Wadi Araba | 1603 | 6.4 | -- | 0.50 | 5.9 | 5.5 |
| Jafr-Shoubak | 6269 | 25.0 | 1.9 | 1.2 | 21.9 | 12.4 |
| Quwayrah-Disi | 3682 | 37.6 | -- | -- | 37.6 | 35.7 |
| Total | 98,135 | 702 | 298 | 29 | 375 | 235 |
| Zone | Year 1987 | Year 2002 | Year 2018 | Year 2034 | Year 2050 |
|---|---|---|---|---|---|
| Jordan Valley | 26,294 | 30,274 | 25,580 | 30,580 | 36,580 |
| Irbid-Ramtha | 1159 | 1200 | 4038 | 7191 | 11,247 |
| Jarash-Ajloun | 930 | 1121 | 1401 | 1681 | 1913 |
| Mafraq | 4085 | 10,621 | 18,596 | 22,315 | 23,803 |
| Balqaa | 816 | 983 | 1185 | 1386 | 2253 |
| Zarqa | 1875 | 3954 | 6923 | 8308 | 9452 |
| Amman-Madaba | 4076 | 6827 | 12,829 | 15,908 | 19,252 |
| Azraq | 1690 | 3460 | 5391 | 6847 | 8135 |
| Ghor As-Safi | 5081 | 5081 | 5077 | 5081 | 5081 |
| Karak-Tafileh | 2174 | 2589 | 3082 | 3575 | 3966 |
| Wadi Araba | 359 | 704 | 1382 | 2061 | 2790 |
| Jafr-Shoubak | 1039 | 2498 | 6011 | 9524 | 9500 |
| Quwayrah-Disi | 4847 | 4292 | 3800 | 3800 | 3800 |
| Total | 54,625 | 73,804 | 95,295 | 118,637 | 137,771 |
Disclaimer/Publisher’s Note: The statements, opinions and data contained in all publications are solely those of the individual author(s) and contributor(s) and not of MDPI and/or the editor(s). MDPI and/or the editor(s) disclaim responsibility for any injury to people or property resulting from any ideas, methods, instructions or products referred to in the content. |
© 2022 by the authors. Licensee MDPI, Basel, Switzerland. This article is an open access article distributed under the terms and conditions of the Creative Commons Attribution (CC BY) license (https://creativecommons.org/licenses/by/4.0/).
Share and Cite
Al-Bakri, J.T.; D’Urso, G.; Calera, A.; Abdalhaq, E.; Altarawneh, M.; Margane, A. Remote Sensing for Agricultural Water Management in Jordan. Remote Sens. 2023, 15, 235. https://doi.org/10.3390/rs15010235
Al-Bakri JT, D’Urso G, Calera A, Abdalhaq E, Altarawneh M, Margane A. Remote Sensing for Agricultural Water Management in Jordan. Remote Sensing. 2023; 15(1):235. https://doi.org/10.3390/rs15010235
Chicago/Turabian StyleAl-Bakri, Jawad T., Guido D’Urso, Alfonso Calera, Eman Abdalhaq, Maha Altarawneh, and Armin Margane. 2023. "Remote Sensing for Agricultural Water Management in Jordan" Remote Sensing 15, no. 1: 235. https://doi.org/10.3390/rs15010235
APA StyleAl-Bakri, J. T., D’Urso, G., Calera, A., Abdalhaq, E., Altarawneh, M., & Margane, A. (2023). Remote Sensing for Agricultural Water Management in Jordan. Remote Sensing, 15(1), 235. https://doi.org/10.3390/rs15010235