1. Introduction
Invasive species in forests negatively affect the provisioning of ecosystem services [
1]. They pose a significant threat to biodiversity by outcompeting native species and affecting other organisms, changing the quality of natural ecosystems, contributing to altered soil chemical properties, and increasing erosion or posing a direct threat to human health [
2,
3,
4,
5,
6,
7]. The invasion also causes changes in the area’s aesthetics, which may reduce recreational and tourism benefits, impacting ecosystem service delivery. The spread of invasive species in forests has not been sufficiently understood [
3], but climate change and human activities are expected to induce biological invasions [
2,
5].
Invasions of plant species generate high removal costs for land managers. This concerns the removal of invasive tree species, which have become a common element in, e.g., urban forests. Rapid mapping methods are necessary for successful and cost-effective tree removal from invaded sites. The effectiveness of removal methods depends on the adequate period of removal applied and adequate identification of the intensity and extent of invasion. Following the theoretical shape of the invasion curve and experimental research, the lowest cost, and the highest efficiency of removing invasive plants are obtained in the first stages of expansion [
8,
9]. Remote sensing methods have been proven to provide objective, repeatable, and cost-effective information about the occurrence of invasive plant species for land managers.
Different approaches for identification and mapping invasive plant species can be found in the literature. The majority of them is based on remotely sensed imagery. However, more and more commonly, LIDAR-based methods have been applied [
10,
11,
12], which allow one to examine both the lateral and vertical distribution of the species. It concerns a single wavelength with a multiple return scanning system, as not only do the laser beams penetrate the vegetation, but they can also record data from under the canopy. In the case of invasive species, the fast and accurate method is crucial for identifying the plants in their early stage of development, when the removal is most successful. Multiwavelength ALS (Airborne Laser Scanning) has already been proven successful in the accurate detection of tree species in forests [
13], reaching 87.6% identification’s accuracy for
Acer sp. However, it is not known whether the authors refer to the invasive
Acer sp. or the group of
Acer sp. in general. Another application of remote sensing techniques for mapping invasive plant sp.
Phragmites australis used multispectral images and the Canopy Height Model (CHM) [
11]. Authors of this application obtained 94.8% overall accuracy by using a neural network algorithm. Another example of fusion of multispectral and LiDAR data registered with use of a UAV platform succeeded in classifying shrubs and trees of habitats such as
Salicetum triandro-viminalis,
Salicetum albo-fragilis, and
Chelidonio-Aceretum in Vistula River Valley (Poland) with accuracies higher than 90% for selected species [
14]. Hyperspectral and LiDAR data fusion was also used to identify
Rubus armeniacus and
Hedera helix in open areas and areas with close treetops in Surrey (Canada). In open areas, mentioned work noticed an accuracy of 87.8% and 82.1% for both species, respectively, while in close treetops it decreased to 77.8% and 81.9%, respectively [
10].
Accurately identifying tree species depends on a suitable segmentation and classification method selection. Some methods (e.g., marker-controlled watershed) used the Canopy Height Model (CHM) for identifying treetops as a local maximum. In this study, selection of treetops was supported by a linear regression model for CHM generalization and selection of treetops based on the height–crown size relationship [
15]. Additionally, the Gaussian filter can be used in the watershed method for generalization purposes. The watershed algorithm delineates single trees using CHM. This algorithm separates single clusters and delineates trees on the basis of planar height continuity, read from pixel values [
16]. Another CHM-based method [
17] is region growing and clustering based on the similarity of “regions”. This method was implemented for longleaf pine detection [
17], with the assumption that the region around the local maximum point belongs to the target tree. Borders between different trees are designated by Voronoi polygonization, assuming that crown diameter is related to tree height with a 0.6 ratio. The mean shift segmentation method is increasingly used to delineate individual trees. This segmentation method was used effectively by authors for tree detection with an accuracy of 88% [
18]. However, this method does not include various types of trees, using the same hyperparameters for all layers of tree stands. Hu et al. [
18] obtained satisfying results in tree detection, by selecting the proper Kernel Density Estimator (KDE) type, and derived the best results for the mean shift algorithm using Pollock and Cylinder kernels. The disadvantage of using Pollock KDE was mentioned in the study, which is that it needs more effort in parametrization and consequently a long computation time is required for selecting particular parameters, while a Cylinder KDE was found to be much simpler in practical use. Another study presented an approach of adaptiveness recommending using fixed kernel size, arguing reducing the time consumption of the method [
19]. However, some authors use allometric features of the tree stand to calculate proper kernel density estimation. Adaptive allometry allows one to include Tree Height (TH), Diameter at Breast Height (DBH), Crown Width (CW), and Crown Depth (CD) [
20]. For a description of the multilayered tree structure, the vertical distribution study of each tree canopy can be used [
21].
The segmentation algorithms require parametrization, which hinders their direct and quick application. The more robust the method is to different conditions, the better the applicability of the model, which is one of the expected features of tree segmentation methods. The over-segmentation problem is a common issue that researchers encounter. One of the methods to cope with that is the refinement by the SVM (Support Vector Machines) model. Comparing the performance of segmentation algorithms proved that Mean Shift is a robust method, without much effort to parametrize [
19]. Different deep learning algorithms show similar accuracies of segmentation, e.g., the YOLO-4 (You Only Look Once) network applied in a tree nursery, forest landscape, and mixed forest habitats located in Nanjing (southeastern China) gives an overall accuracy of 81.4% [
22].
Ensemble methods are very popular in classifying natural ecosystems [
23,
24,
25,
26], including forests [
27,
28,
29]. One of the most popular models is the random forest classifier, which, for example, was used for classifying tree species based on ALS and spectral data with over 90% accuracy [
21]. Additional morphology features (e.g., Gaussian curvatures of single trees) can be used as supplementary features for this algorithm for lower density point clouds. In the case of Spruce species, for point clouds with a density of 3.6 points/m
2 and 5.3 points/m
2, including this type of features allows for obtaining accuracies of 91% and 96%, respectively [
30].
This study aims to evaluate the precision and sensitivity of applying dual-wavelength (Green and NIR bands) LiDAR in identifying invasive tree species such as A. negundo in the riparian forest. In particular, the different phases of invasions are considered in our study; therefore, we applied three scenarios of A. negundo identification: in the tallest canopy—the tree layer, underneath the canopy—the understory layer, and through consideration of the age classes of the trees. For this purpose, mean shift segmentation followed by four ensemble learning methods (random forest, SAMME.R, gradient boosting, and XGBoost) were used based on data obtained in the natural ecosystem in the Vistula River Valley in the area of Warsaw (Poland).
2. Materials and Methods
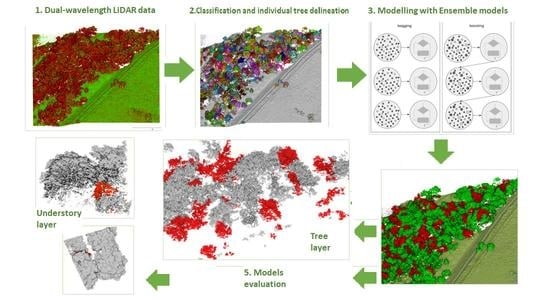
Workflow for
A. negundo detection consists of a few steps from airborne and field data acquisition through airborne data processing, classification, and validation of obtained results. The detailed flowchart is shown in
Figure 1, and each step is described in subsequent subsections.
2.1. Study Area
The study area is in the northern part of Warsaw, Poland’s capital city (
Figure 2), inhabited by over 1.7 million citizens (in 2018). Through the middle of the city runs the natural bank of the Vistula River with the form of the following forest vegetation: Natura 2000 habitat,
Salicion albae, 91E0 (European Commission DG Environment 2007) willow forests in the valleys of the river on the lowland and foothills. The most common tree species in the canopy are white willow (
Salix alba L.), fragile willow (
Salix × fragilis L.), gray poplar (
Populus × canescens (Aiton) Sm.), black poplar (
Populus nigra L.), European spindle (
Euonymus europaeus L.), sour cherry (
Prunus cerasus L.), black locust (
Robinia pseudoacacia L.), and Norway maple (
Acer platanoides L.). The research area was formerly proved to be heavily invaded by ash-leaved maple (
Acer negundo L.), which comprised up to 47.8% of the canopy in the case of the willow forest and 33.5% in the poplar forest [
31].
2.2. Field Reference Data
As field reference data, we used 500 vegetation samples of 4 m diameter collected from 500 locations in January and February 2019. The plots were randomly scattered in the research area, formerly verified to be, to various extents, invaded by
A. negundo. The reference plots were internally homogenous. In each plot, canopy and undergrowth parameters were measured, which can be further used for
A. negundo identification. The percentage cover of
A. negundo of diverse sizes were separately recorded for share of trees higher than 3 meters, 0.3 to 3 meters, and of a diameter smaller than 0.3 m. The height of the highest tree in the sample was also recorded. The age of the trees within three categories—up to 10 years, 10–20 years, and older than 20 years—was recorded for each sample. The age was measured by counting the years of the formation of annual rings in increment cores taken from living trees using increment cores [
32]. The percentage cover of undergrowth vegetation and the percentage cover of tree species other than maple were also measured. When possible, samples without
A. negundo were chosen near samples with maple.
2.3. LiDAR Data Acquisition and Processing
In this study, we used the ALS (Airborne Laser Scanner) of RIEGLVQ-1560i-DW, which uses two laser beams: green and infrared. The green laser beam is highly effective in penetrating a column of water, contrary to the infrared beam absorbed by the water surface [
33]. It effectively maps vegetation and waterbody shoreline, where echo sounder limitation is significant [
34]. The data were obtained on 7 August 2018, for the Vistula River Valley in the northern part of Warsaw (
Figure 2). As was already mentioned, the main characteristic of this scanner is its two spectral channel capability, recording data in the green (532 nm) and the near-infrared (1064 nm) wavelengths. The measurement density for both channels is 6 points/m
2. The data were classified using the convolutional neural network model developed at OPEGIEKA Sp.z.o.o. [
35]. The height of points above the ground was also calculated, allowing us to determine the tree’s height. Reflectance was calculated as a ratio of the actual amplitude of that target to the amplitude of a white flat target at the same range, oriented orthonormal to the beam axis, and with a size in excess of the laser footprint, according to the formula presented below:
where
Prel—relative reflectance;
Adb—calibrated amplitude;
Adb,Ref(R)—amplitude of reference object in range R.
The reflectance values vary depending on the type of material, texture, and reflection direction. Negative values hint at diffusely reflecting targets, whereas positive values are retro-reflecting targets, such as metals or water.
Reflectance was transformed into the strength of reflection as follows:
In addition, the green normalized difference vegetation index (GNDVI) was calculated according to the formula:
GNDVI is a valuable indicator for monitoring the condition of vegetation. This indicator was calculated for reflectance in voxels of shape 30 × 30 × 30 cm; in three-dimensional data, the nearest point is found for every point from another spectral channel. If the indicator’s exceeds 0, the infrared channel has a higher share of reflectance in a voxel, representing healthier vegetation. Application of GNDVI is recommended over the more commonly used NDVI (normalized difference vegetation index) due to its higher sensitivity for chlorophyll concentration detection in plants and higher correlation to nitrogen [
36].
2.4. Segmentation
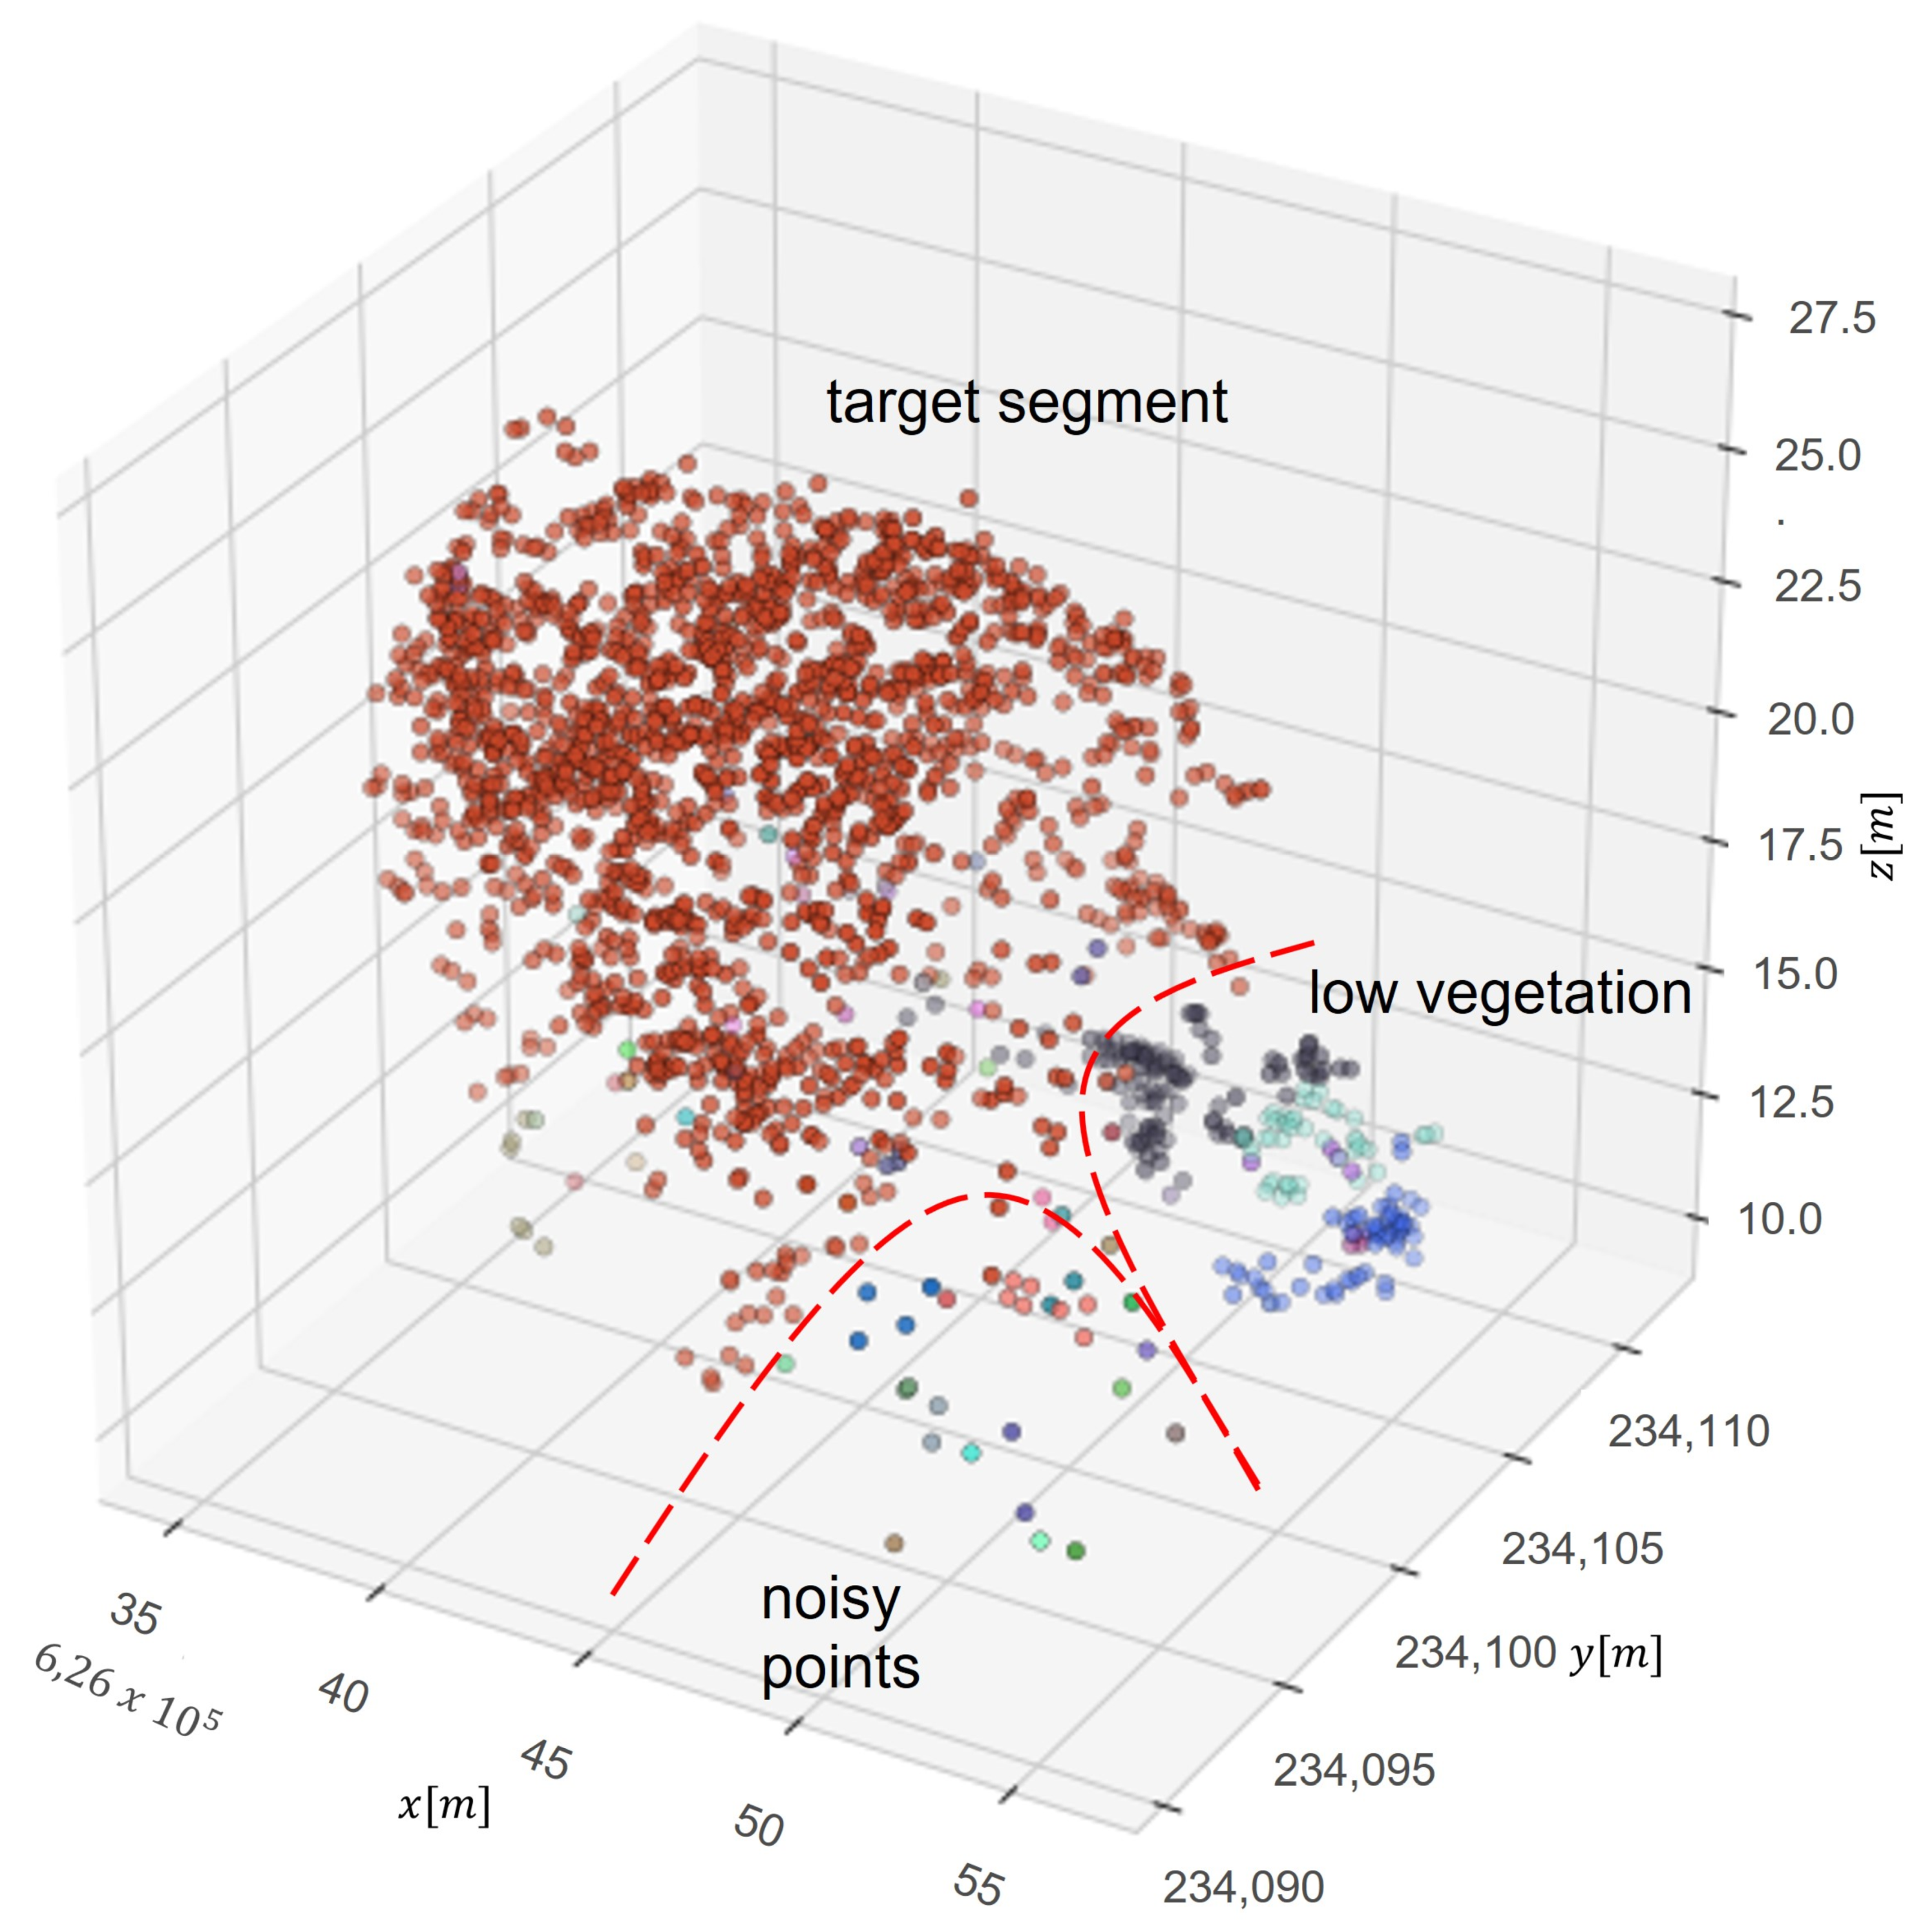
In order to distinguish individual trees, we used the Adaptive Mean Shift model. The adaptability of the algorithm consists of adjusting hyper-parameters to the nature of the data. The better segmentation results were obtained using adaptive seed points instead of bandwidth (
h). Mean Shift is a nonparametric segmentation technique that does not require information about the expected number of segments. This method uses differentiation in the density of the point cloud to separate different clusters (segments of trees). The segmentation process consists of two stages—the first is to detect trees in a single-layer structure, and the second is to detect trees in the lower layers of forest stands. The second step applies the vertical analysis of the distribution of previously separated segments. Assuming that a single tree has a vertical bimodal distribution, the algorithm re-clusters segments with a bimodal distribution, placing a seed point at a local density maximum point (
Figure 3). The algorithm assumes that the value of the maximum density mode must be greater than 10% of all segment points. The result is tree segmentation of trees located in the lower layers of the stand. The number of histogram bins was obtained with a linear function
, where h is the height of a tree and int(
x) is a round function of continuous variable
.
To reduce the vertical division in the first stage of the segmentation, the point cloud was transformed by scaling z value (
Figure 4). Before performing the first stage of segmentation, the height of trees is scaled with a 0.8 ratio, and after the first step of segmentation values are rescaled to the previous level. It was empirically established that this solution occurs by not dividing tall trees into smaller parts. After that, segments are refined by an additional algorithm called DBSCAN. This algorithm is used to identify outliers and noisy points. A basic concept is a neighborhood set
Nε(p) of a point
p, which contains all nearby points
q. The range limit
ε and a cardinality limit
k of
Nε(p) are used to divide points into outliers and core points as follows:
where
ε—area of searching for neighbors;
p—core point, the point where the neighbors are searched;
q—point in the epsilon distance relative to the core point;
d(p,q)—Euclidean distance between p and q.
The result of this operation is a segment without outlier points. Additionally, this process splits clusters that need to be separated in the previous step. Outlier points are separated into new segments and, in the next step, removed from the segmentation. An optimal parametrized segmentation algorithm maintains a balance between over and under-segmentation. After this stage, a segmentation of a multilayer structure of the forest stand is obtained, and statistics computation for described characteristics of the maples can be performed.
The segmentation results were validated based on 40 tree canopies (also delineated in the field), which were treated as speared classes. Segmentation accuracy was equal to 0.83.
2.5. Preprocessing
In the data pre-processing step, the reference points are linked to point cloud data by their location, making entire reference areas linked to the segmented point cloud. As a result, the point cloud containing segmented tree canopies with trees is obtained. For each tree canopy, geometric features such as diameter, tree height, stem diameter, basal area, crown diameter, and height of crown seating were calculated (
Table 1). For all tree canopies, reflectance-based features were also calculated. Initially, 14 variables were available (
Table 1) separately for reflectance (for NIR and GREEN) and GNDVI. The most important features were selected based on the initial random forest model run using all features, and importance was calculated for each of them. Finally, six features were selected for further analyses—crown base (0.17), skewness of reflectance (0.15), kurtosis of reflectance values (0.12), arithmetic mean (0.13), range of reflectance (0.14), and geometry roundness of tree canopy shape (0.128).
All features were standardized to fit the distribution where the average equals 0 and standard deviation is 1. Standardization features aimed to scale data relative to the average and thus center the data. Outliers were removed as samples higher or below three standard deviations from the distribution. The first process data are randomly sampled and divided into training and testing data sets; from the data set sampled, over 200 trees were selected for learning and testing the efficiency of the models. Features with high skewness of distribution were scaled logarithmically, which improved the model’s classification performance.
2.6. Classification
This study tested an ensemble statistical modelling approach for maple detection. The ensemble learning method aims to combine multiple predictors into an efficient one. The group of estimators is called an ensemble. There are three main methods of learning estimators: ensemble-bagging, boosting, and stacking. Ensemble models work most effectively with decision trees, so in this research, we use decision tree classifiers as a base estimator. To avoid overfitting, so-called pruning is used. It consists of limiting the number of decision nodes to a fixed number. The bagging technique fits a new model on bootstrapped samples (bootstrap aggregating). Each model is learning without returning sampled data. The family of the classifiers is generated based on learning strings, created based on N-random sampling with a bootstrap of the learning element. Learned classifiers make decisions about classification into one of the classes when the given class obtains the most indications (through majority voting).
Boosting technique is based on the sequential training of models by giving more weight to records with large residuals for each round [
37]. In the next version of the draw, samples with higher weights have a greater chance of being drawn, which makes the model focus on samples for which it is least efficient.
Decision trees—nonparametric supervised learning classification method based on learning decision rules according to learning data.
Random forest—using bagging (bootstrap aggregating), the most popular of ensemble models. The algorithm works by training decision trees; the final prediction is obtained by majority voting. The random forest model is a model learned using the aggregation method. The learning process begins with the randomization of initial samples (bootstrap—random sampling from the training set). Then, decision trees are generated based on the initial samples. At this stage, a random selection of features is performed for each node. Next, the node is separated using a feature that guarantees the best branching in the objective function (maximizing information gain). Finally, the prediction is selected by majority vote—a label is assigned to each sample.
SAMME.R or Stagewise Additive Modeling using a Multiclass Exponential loss function using the exponential loss function. The model focuses on the most challenging cases by correcting predictors in a sequence that has not been learned. A detailed algorithm description can be found later in the methodology description, as a base estimator used decision tree classifier. To train, we used 200 estimators with depths equal to 8.
Gradient boosting—Gradient enhancement adds further predictors to the ensemble sequentially, where each subsequent enhances its predecessor. However, we do not update the weights of examples with each pass but try to match the predictor to the residual error made by the previous predictor.
XGBoost—another implementation of gradient-boosted trees. XGBoost is much faster because of regularization tricks [
38]. Regularization is applied to the model by including a penalty term on the number of parameters. Parameters control regularization by reducing the change of weights. XGBoost grows the tree up to a max depth and then prunes backward until the improvement in loss function is below a threshold.
The final output is obtained through majority voting. For better efficiency of models, classes are weighted proportionally to the occurrence in the field. A. negundo was assigned a lower weight than other species. The model’s efficiency of A. negundo detection was compared for a few variants of the spectral channels. The models were trained and evaluated with features calculated for the green channel, infrared channel, combination of green and infrared channels, and GNDVI. Geometric features were calculated for both channels to avoid the effect of density changes on the feature values and classification results. Reflectance-based features were calculated on points that fulfil condition corresponding to a variant of spectral channels. The models have been trained and tested using the features derived from individual tree canopies (segments). However, statistics were generated for individual reference areas. This is due to the use of sample areas as reference data.
All algorithms were applied in 3 experiments:
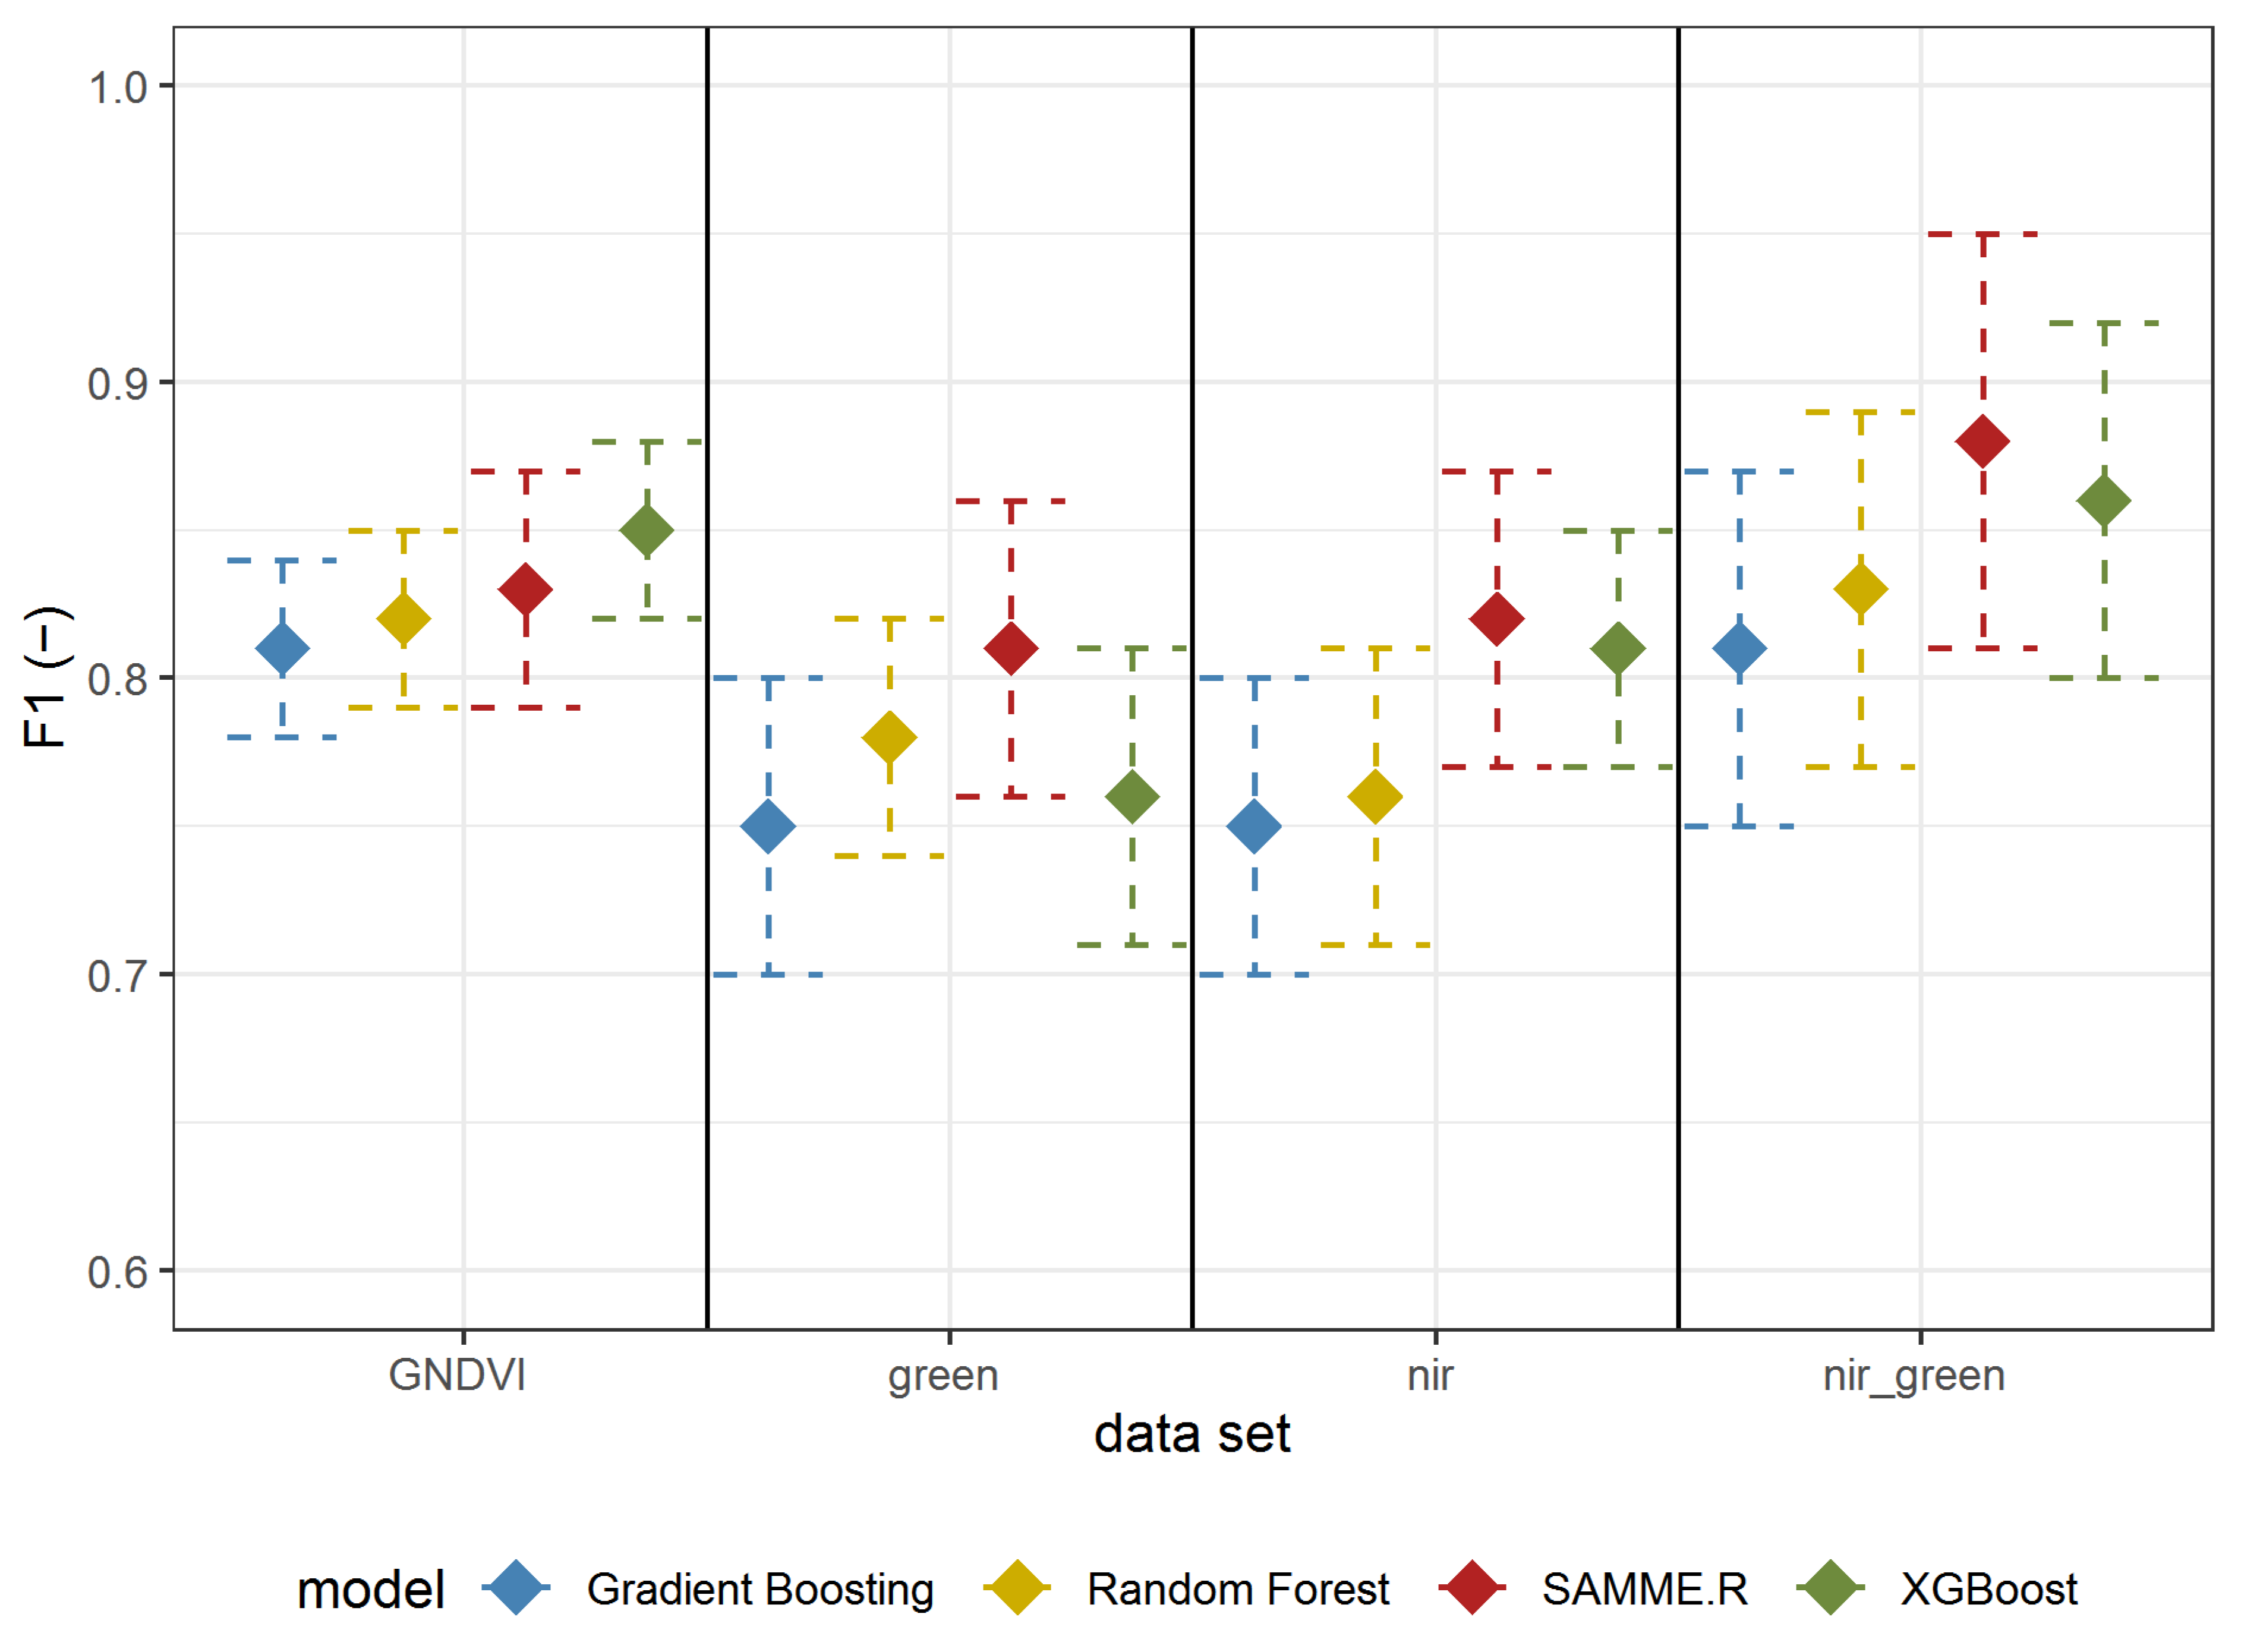
Experiment 1—for detecting A. negundo in the tree layer using four different feature data set selected geometric and reflectance parameters separately for i. GNDVI; ii. NIR; iii. GREEN; and iv. NIR and GREEN together.
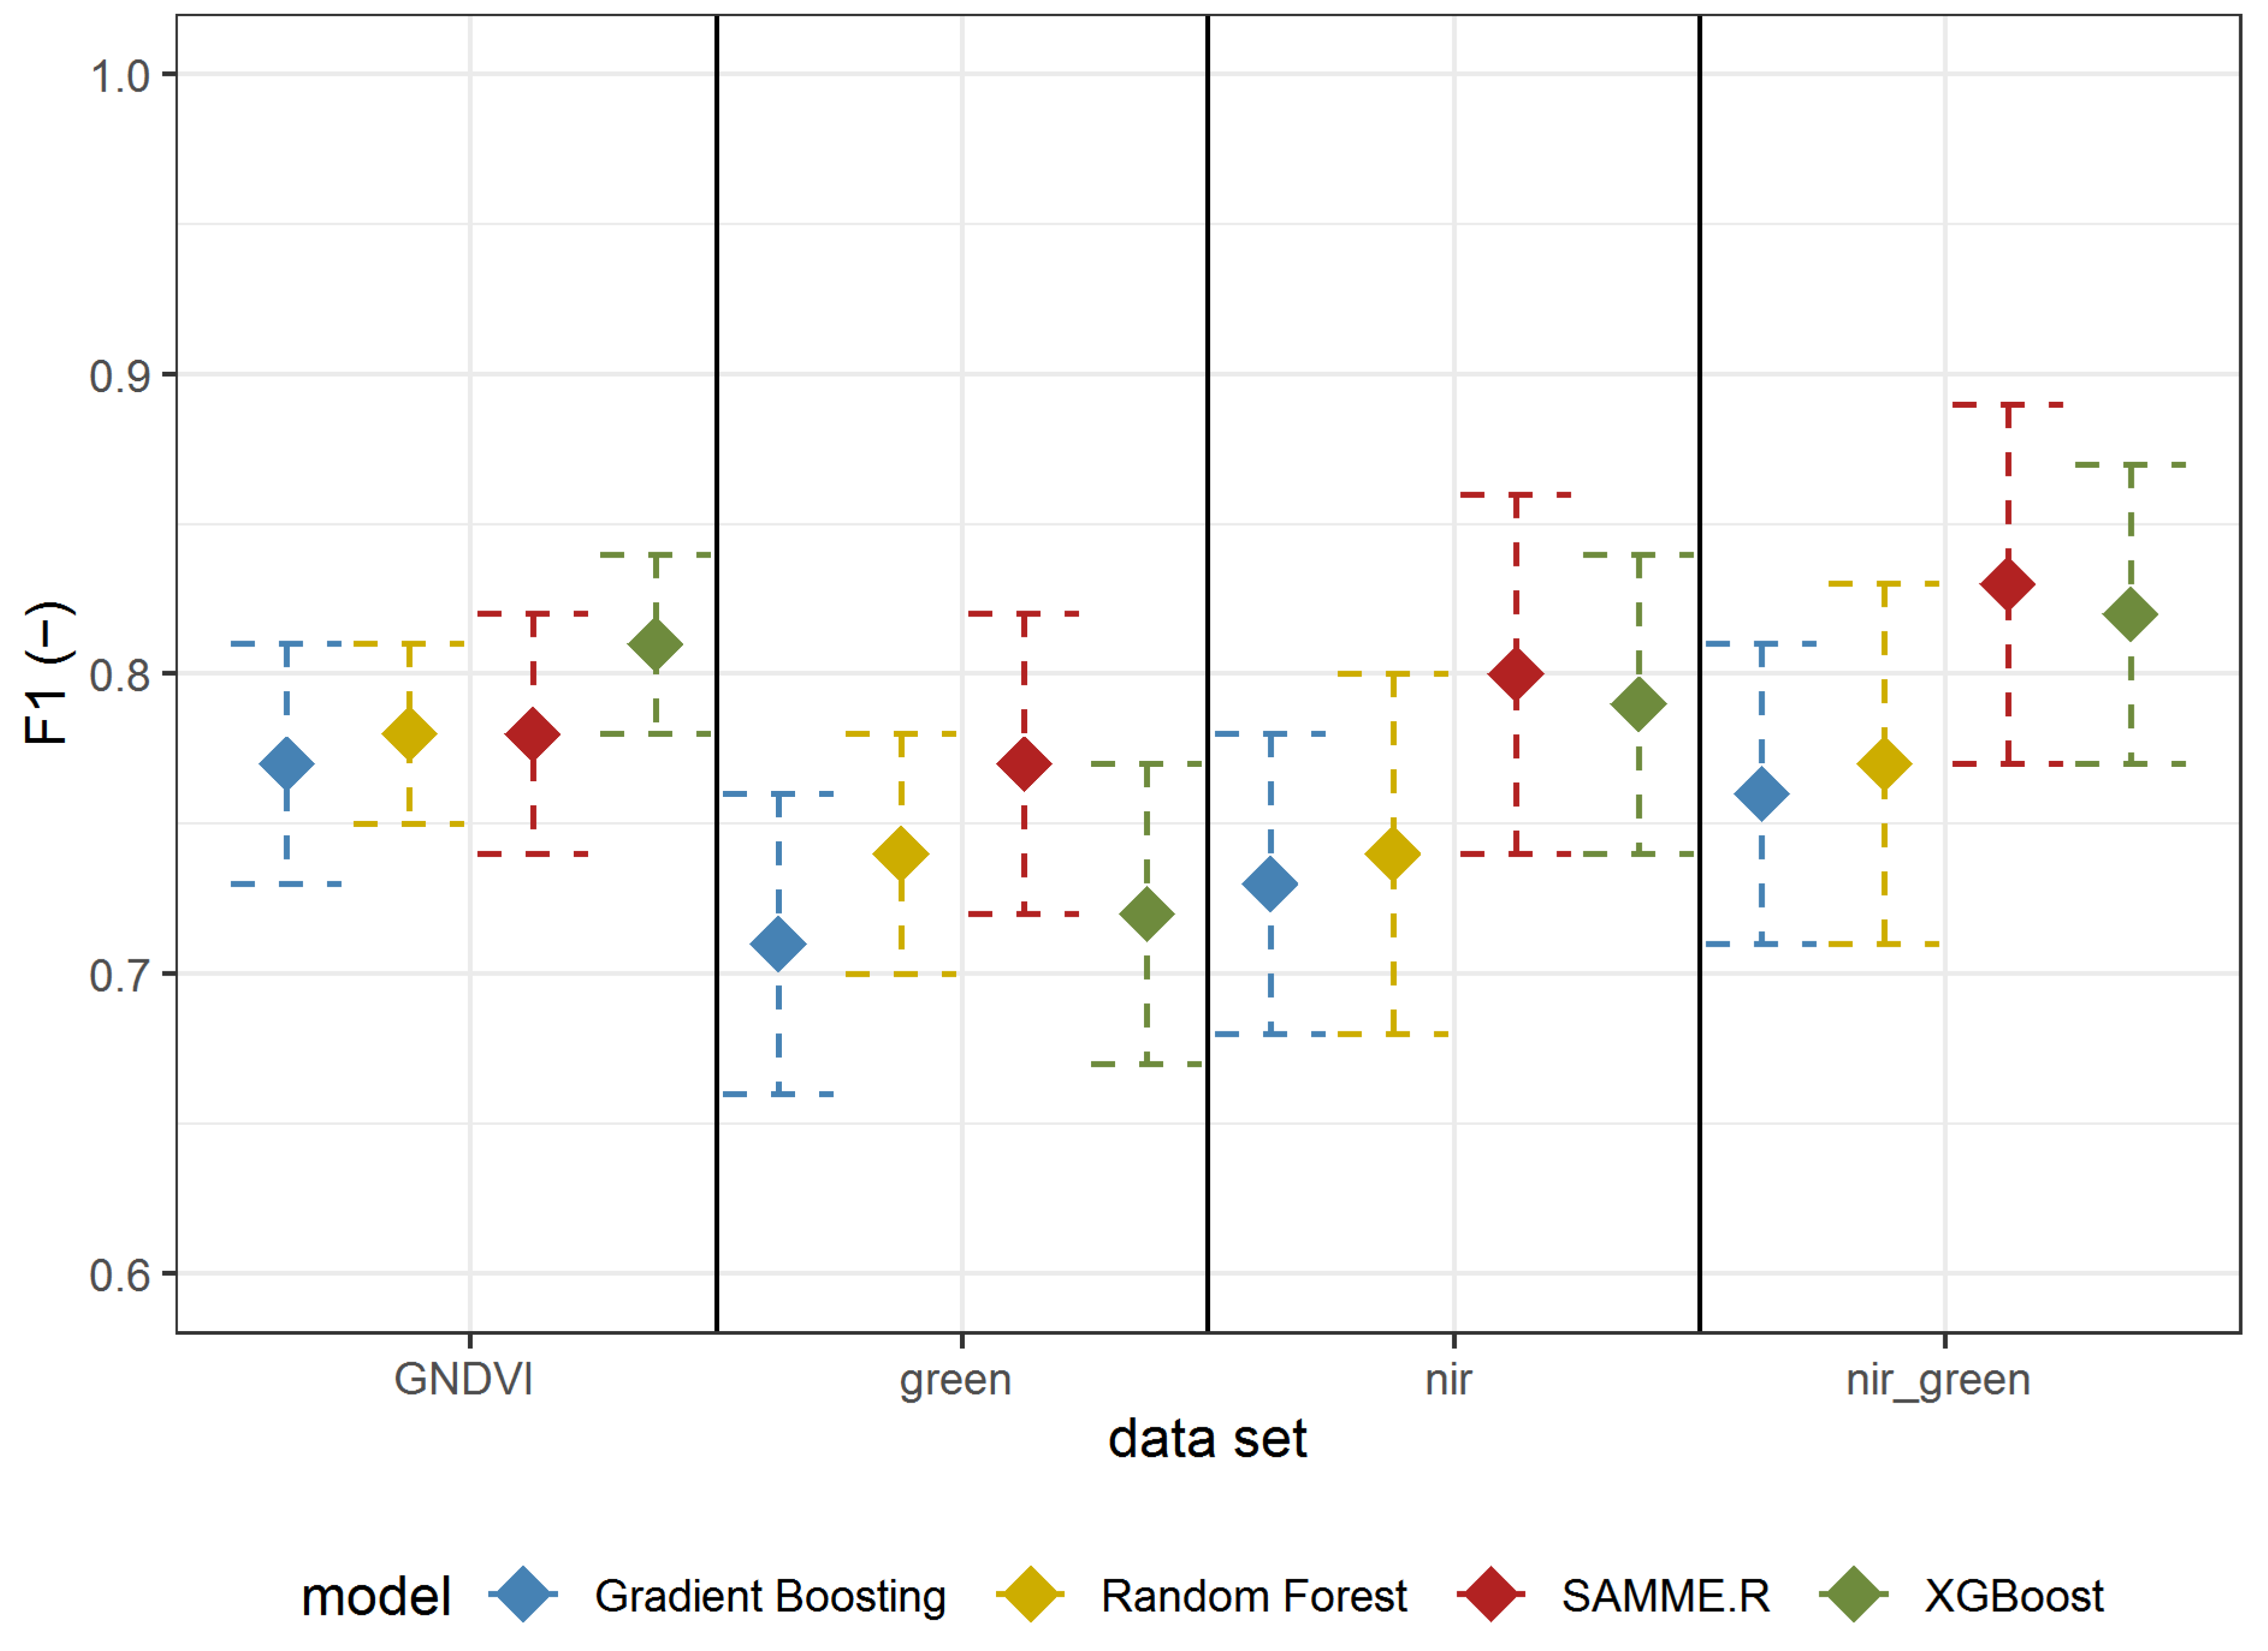
Experiment 2—for detecting A. negundo in the understory layer using the same four different feature data sets as in Experiment 1.
Experiment 3—for detecting A. negundo age groups using selected geometric features and selected reflectance features for GREEN and NIR spectrum (iv).
2.7. Validation
Tested models were evaluated with a metric commonly used with binary classification problems. For all models, reports with statistics describing errors were generated. For this purpose, Precision, Recall, and F1-score were calculated according to the following formulas:
where
tp—the number of true positives;
tn—the number of true negatives;
fp—the number of false positives;
fn—the number of false negatives.
Repeated random sub-sampling cross-validation was used for all metrics calculations. The Experiment 1 data set was randomly divided into the training (50%) and validation (50%) data sets 100 times; for Experiments 2 and 3, division was made 70 times. The mean value and its standard deviation for all metrics were analyzed.
4. Discussion
A. negundo penetrates riparian forests due to high seed production and easy dispersal with wind and water flow. These features allowed for the rapid, successful invasion of European river valleys [
40,
41]. The mechanisms of the invasion process have yet to be fully understood, but they have been mainly attributed to anthropogenic pressure [
3,
5]. The high accuracy of detection of invasive maple in riparian forests both in the canopy and understory proceeded with detailed visualization, allowing us to undertake accurate and precise removal actions and assess the scale of the phenomenon. Remote sensing methods are widely used for this purpose due to the data availability and objectivity of the obtained results. The present work fits the theme mentioned above, especially using only laser data, and its results should be compared with previous achievements in this field.
Invasive plant species detection using remote sensing techniques—multispectral, hyperspectral, LIDAR data—or its fusion is a topic widely researched in the world. In Surrey (Canada), LIDAR and hyperspectral data fusion were used for two invasive shrub species:
Rubus armeniacus and
Hedera helix [
10]. In this study, the random forest model was used to identify this species in two groups—in open areas and areas with close treetops (where more than 20% of the treetops were higher than 2.5 m). The identification accuracy in open areas was 87.8% for
Rubus armeniacus and 82.1% for
Hedera helix. The close treetops accuracy was slightly smaller: 77.8% for
Rubus armeniacus and 81.9% for
Hedera helix [
10]. It is difficult to compare the results of this work with ours, as the objects identified are completely different. In our case, these were trees at various stages of development, whereas in [
10], the authors analyzed the detection of invasive herbaceous plants and shrubs. Nevertheless, the detection accuracies obtained are comparable, but our results are slightly better. It is an interesting study but even more difficult to compare with ours, showing an attempt to identify invasive
Phragmites australis based on multispectral (using green, red, red edge, and NIR bands), CHM, and features derived from images such as GLCM (Gray-Level Co-Occurrence Matrix) texture. The carrier vector machines, k-nearest neighbor, and a neural network have been tested in two variants of classification: pixel and object-based. The neural network model for pixel-based classification achieved the best result (accuracy of 94.8%) [
11]. This particularly good result, obtained with extremely simple means and limited spatial data, is slightly better than the results we obtained. However, it was possible to obtain it due to a specific set of characteristics of
Phragmites australis, which is quite easy to isolate and does not usually occur under the tree canopy. Nevertheless, it must be said that with the significantly more challenging task in our work, we obtained only slightly lower accuracy rates, which further positively assesses the value of our work
Multi- and hyperspectral data were also used for invasive tree detection in the tree layer. In recent studies, we proved the usefulness of spatiotemporal compositing of Sentinel-2 products for mapping
Robinia pseudoacacia in small woody features across a wide range in Danubian lowlands (Slovakia) [
42]. In this research, temporally aggregated monthly composites stacked to seasonal time series data sets yielded consistently high overall accuracies ranging from 89.1% to 91.5%. The results obtained by [
42] are comparable to those we obtained for the tree level. For smaller scale application Vistula River Valley (Poland) fusion, UAV data were used for mapping shrubs, as well as trees such as
Salicetum triandro-viminalis,
Salicetum albo-fragilis, and
Chelidonio-Aceretum. The random forest model features selection was based on: hyperspectral data, RGB, and LiDAR-based calculated features. This method allows for the selection of specific combinations of features, which give classification accuracies for selected species of more than 90% [
14]. It is worth mentioning that this research area overlaps with ours and the data collection period is only two years apart. The results obtained by the authors are particularly deserving of comparison. It is interesting to note that the results obtained are similar irrespective of the use of different measurement platforms—UAV and aerial. However, they are concerned with different invasive species. The authors see a need for further research on the data sets mentioned above and the selection of appropriate algorithms, the condition of which should be simultaneous data collection. Most of the mentioned applications focused on the dominant species in the top vegetation layer and used a wide range of features. These approaches allow one to obtain high accuracies. In this study, based on only dual-wavelength LIDAR-based features, high accuracies were obtained for the identification of
A. negundo in both the tree layer (88%) and the understory layer (83%). Moreover, the detection of
A. negudno in the early stages of invasion (species younger than 10 years) was successful (accuracy of 83%).
The approach proposed in this study allows us to identify the invasive
A. negundo during its early stage of development, which has crucial implications for conserving valuable riparian forest habitats. It could allow the greenery managers to undertake preventive actions while they are still relatively cheap to carry out, as juvenile individuals are easier to remove mechanically. Laser scanning from an aircraft allows the method to be used in large areas and to monitor both urban and non-urban areas. Suppose the invasion phases of the maple are being considered. In that case, the development in the initial phase depends mainly on access to the bare ground, the humus content, and the stability of the substrate in general [
3,
43]. Removal of young
A. negundo shoots in the period up to about 10 years allows for effective removal actions, as there are still few invasive individuals, and soil conditions are usually unfavorable, so the possibility of seedling regrowth is small. Moreover, native species are abundant, which can outcompete the shoots of invasive
A. negundo. The later stage, associated with
A. negundo aged 10–20 years and over, is already the stage when the number of maples accounts for up to 50% of the total tree stand. Strong shading of the maple canopy to other trees contributes to the impoverishment of biodiversity [
31]. From our experience on the Vistula, it can be concluded that removing
A. negundo in such a phase and concentration of trees leads to a renewed invasion of the formerly removed species. Destruction of most of the leaves of trees, consisting of invasive species, and thus extensive access to light and destruction of the ground layer, leads to the rapid spread of seedlings. Applying mixed removal methods of
A. negundo is effective but expensive [
44] and, in some cases, can lead to reinvasion. The 30–40-year-old
A. negundo tree stands do not regenerate (there is no growth of seedlings), and after analysis of stem diameters, it can be observed that they are gradually disappearing (
Figure 10) [
31]. However, in the river valley, multiple disturbances are occurring, both of natural origin, such as flooding, and human-induced, such as shrub removal (a fast part of flood prevention). The riparian tree stands rarely reach an older age, and the invasion of
A. negundo is successful. In total, 11% of the most valuable riparian forests in Poland located in Natura 2000 habitats contain a species of foreign origin in their stand, of which
A. negundo has a dominant share [
45]. Riparian forests in cities are particularly susceptible to disturbances and thus contain 10–40% of invasive tree species [
2,
3,
31].
5. Conclusions
In this work, we have evaluated the Riegl VQ-1560i-DW scanner and four classification models based on their potential in the quick identification of invasive A. negundo in riparian forests. Models were trained and validated with features calculated for the green channel, infrared channel, combination of green and infrared channels, and GNDVI. The results show the advantage of using dual-frequency scanners compared to the standard one-frequency NIR beam and the GREEN spectrum. The most accurate tested model was the SAMME.R, with a calculation scenario based on reflectance analysis in both green and NIR spectra as model input features—an accuracy of 88% for the tree layer and an accuracy of 83% for the understory layer. The high accuracy values obtained for the tree layer are on the level of acceptance comparable with similar works, including hyperspectral data. In the case of our experiment, we also obtained similar values for scenarios when using GNDVI for the tree layer. A. negundo species were identified correctly on the tree layer with 5–8 % better accuracy than the analysis of single-frequency LiDAR data. For the tree layer and both mentioned scenarios, any algorithms work correctly.
Although high results were obtained in mapping the understory layer, equal to 83% was obtained using the SAMME.R model only for the scenario with features calculated for a combination of green and infrared channels. The XGboost model was slightly worse (1%) compared to SAMMER.R. It was significantly better than GNDVI for both models and significantly better than any other scenarios. The results prove the importance of using dual-wavelength LiDAR for the understory layer’s detection of A. negundo. With a proper classification of dual frequency LiDAR data, we can improve the identification of the understory layer with significantly higher than standard model accuracy.
In our work, we used an effective identification model (83% effectiveness) for the youngest individuals (under 10 years old). The youngest age group can be found as a part of the tree and understory layers. The efficiency of their identification of A. negundo was found on a similar, particularly good, level to the understory layer. We evaluated the same models (SAMMER.R and XGboost) and effectively identified this age group. Older individuals were detected with higher accuracy (87% for 10-to-20-year-olds and 88% for those older than 20), but identifying the youngest group appears to be the most crucial task. Proper identification of the youngest group is of great importance for the early removal of the invasion, helping to limit costs and destruction to the canopy. For this reason, the simple and precise visualization presented in this work allows us to quantify the scale of species invasion and thus estimate the costs of species removal.
According to the authors, the dual-frequency scanning method allowed such satisfactory results to be obtained due to combining the advantages of both laser scanning to detect canopy structure and multispectral features to detect species. This combination increased the accuracy of object identification for the understory layer compared to traditional ALS LiDAR. In the authors’ opinion, the penetration capability also gives greater possibilities for identifying the understory layer than optical hyperspectral data, which can undoubtedly give better results for detecting the species in the tree layer. The future development of remote sensing technology will enable the widespread use of multispectral LiDAR systems with more than two-three channels achieving an increase in species detection capabilities in the understory layer. With the ongoing scanner developments, the authors see a point in evaluating the results of the proposed method to results obtained based on aerial and UAV hyperspectral data.


 ,
, 


