


Tree Species Classification Using Plant Functional Traits and Leaf Spectral Properties along the Vertical Canopy Position


Abstract
1. Introduction
2. Materials and Methods
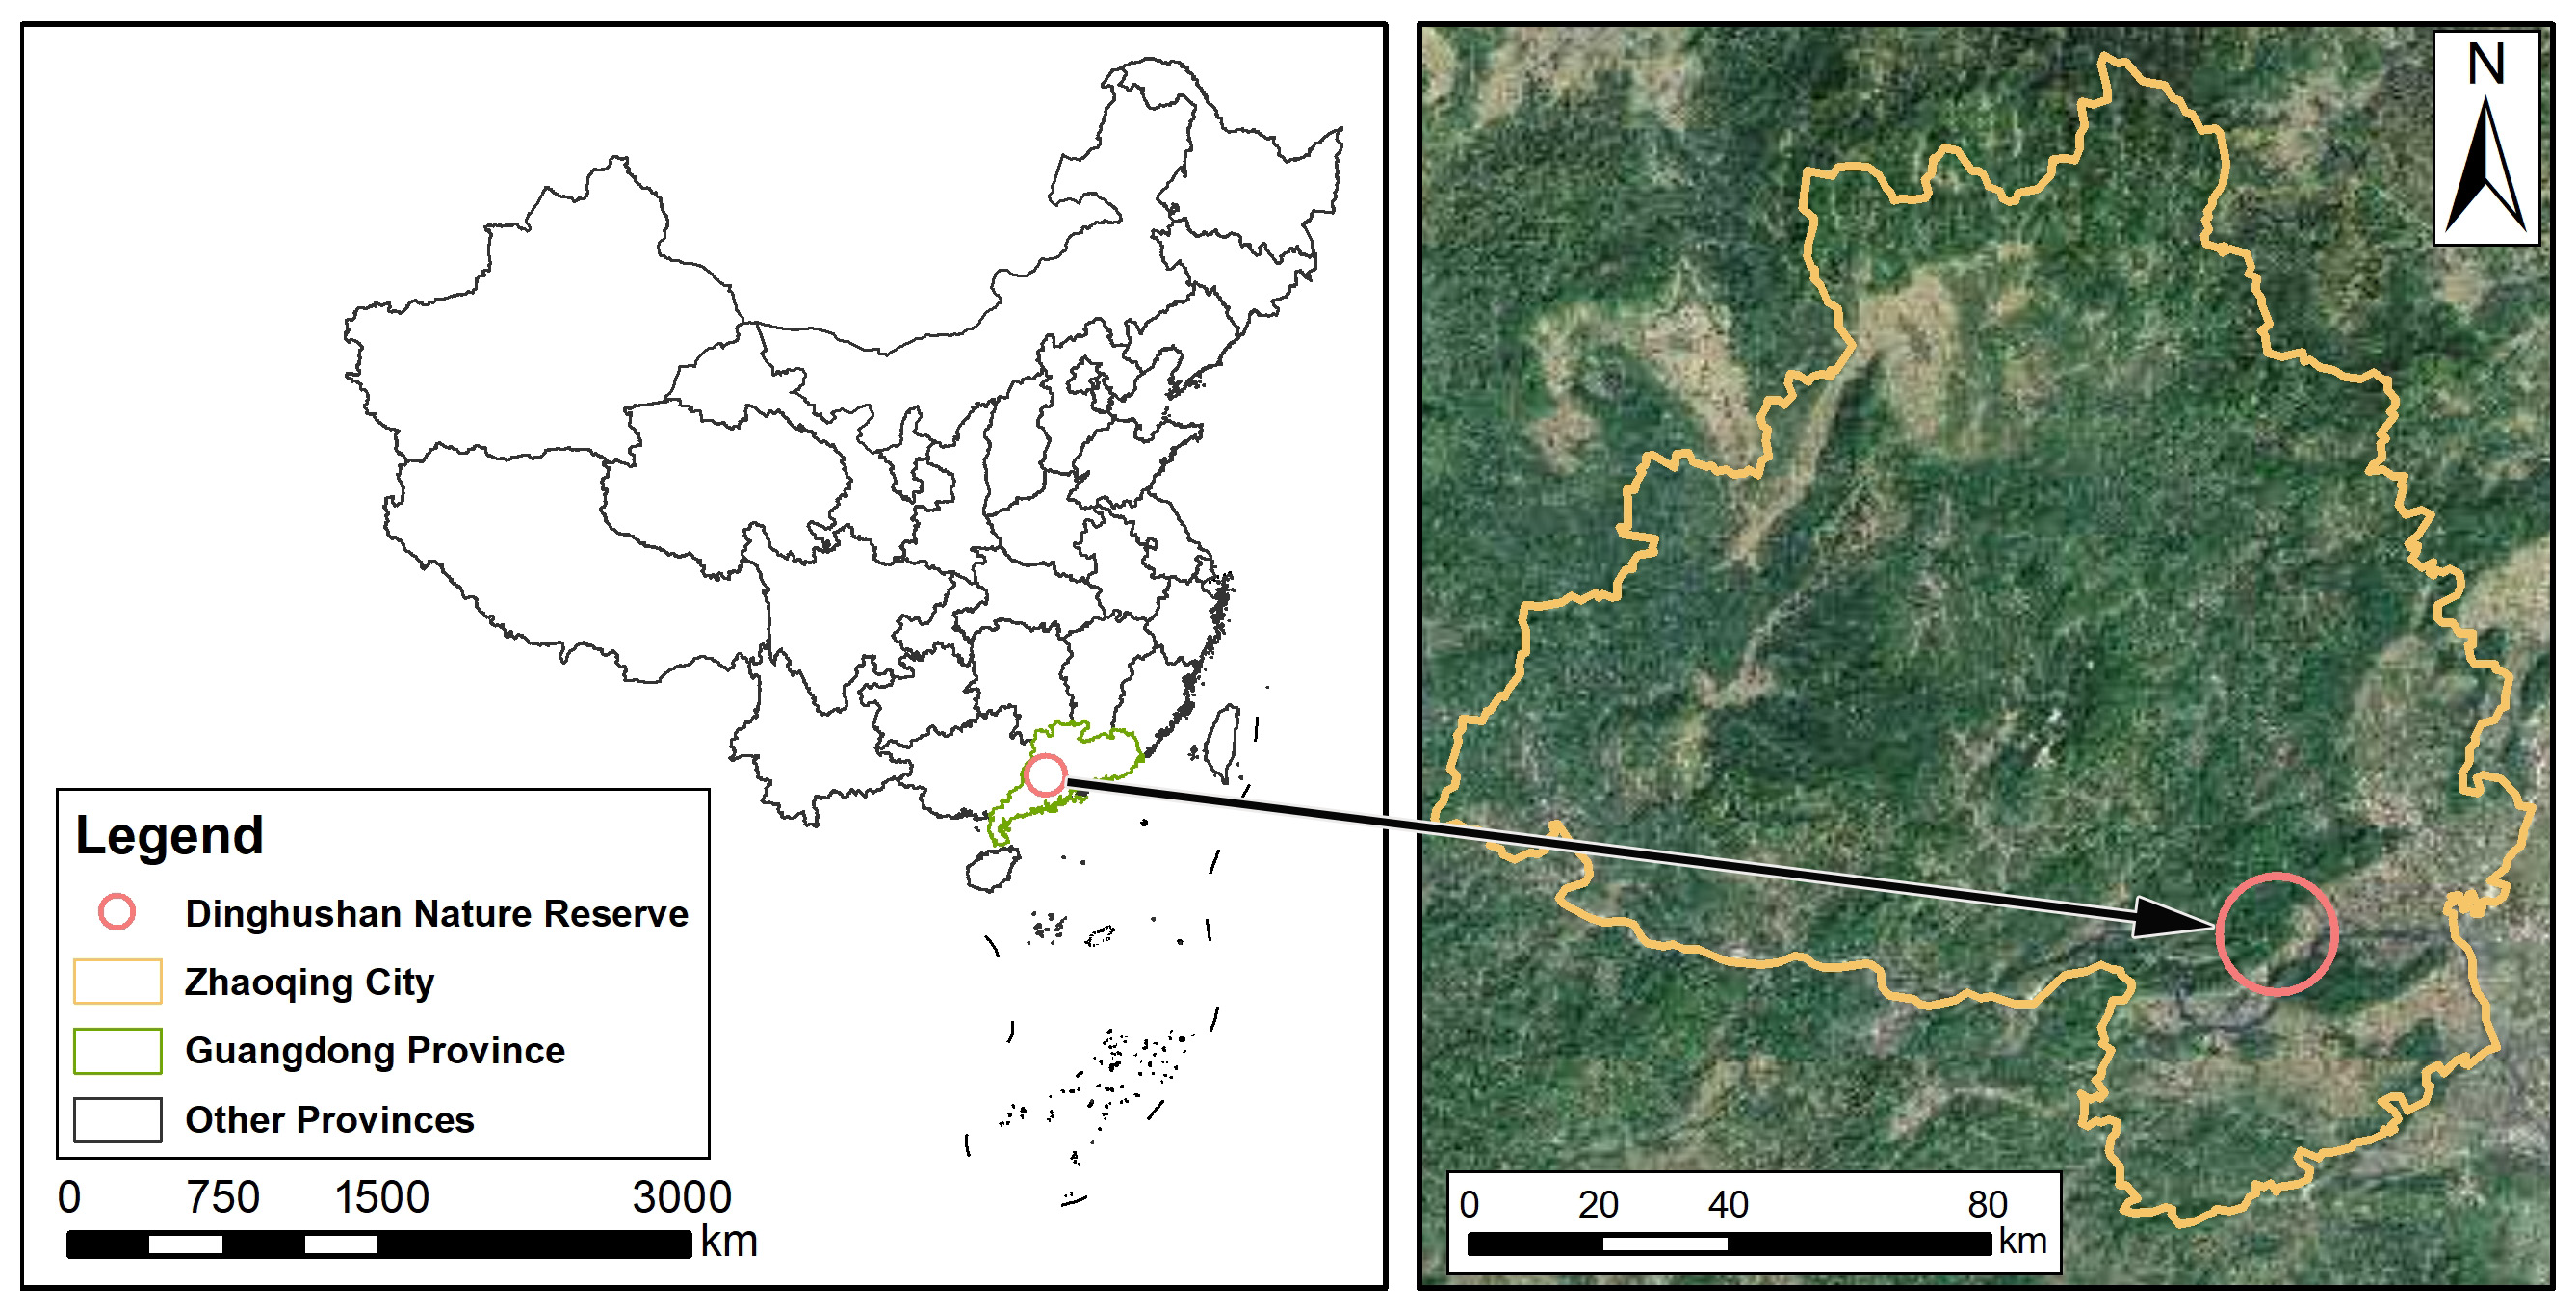
2.1. Study Area
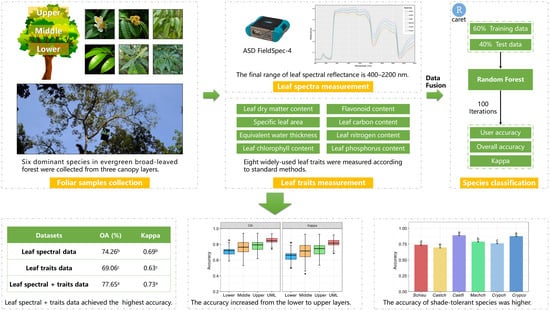
2.2. Field Sampling
2.3. Measurement of Leaf Spectra
2.4. Measurement of Leaf Traits
2.5. Random Forest Classifier
2.6. Statistical Analysis
3. Results
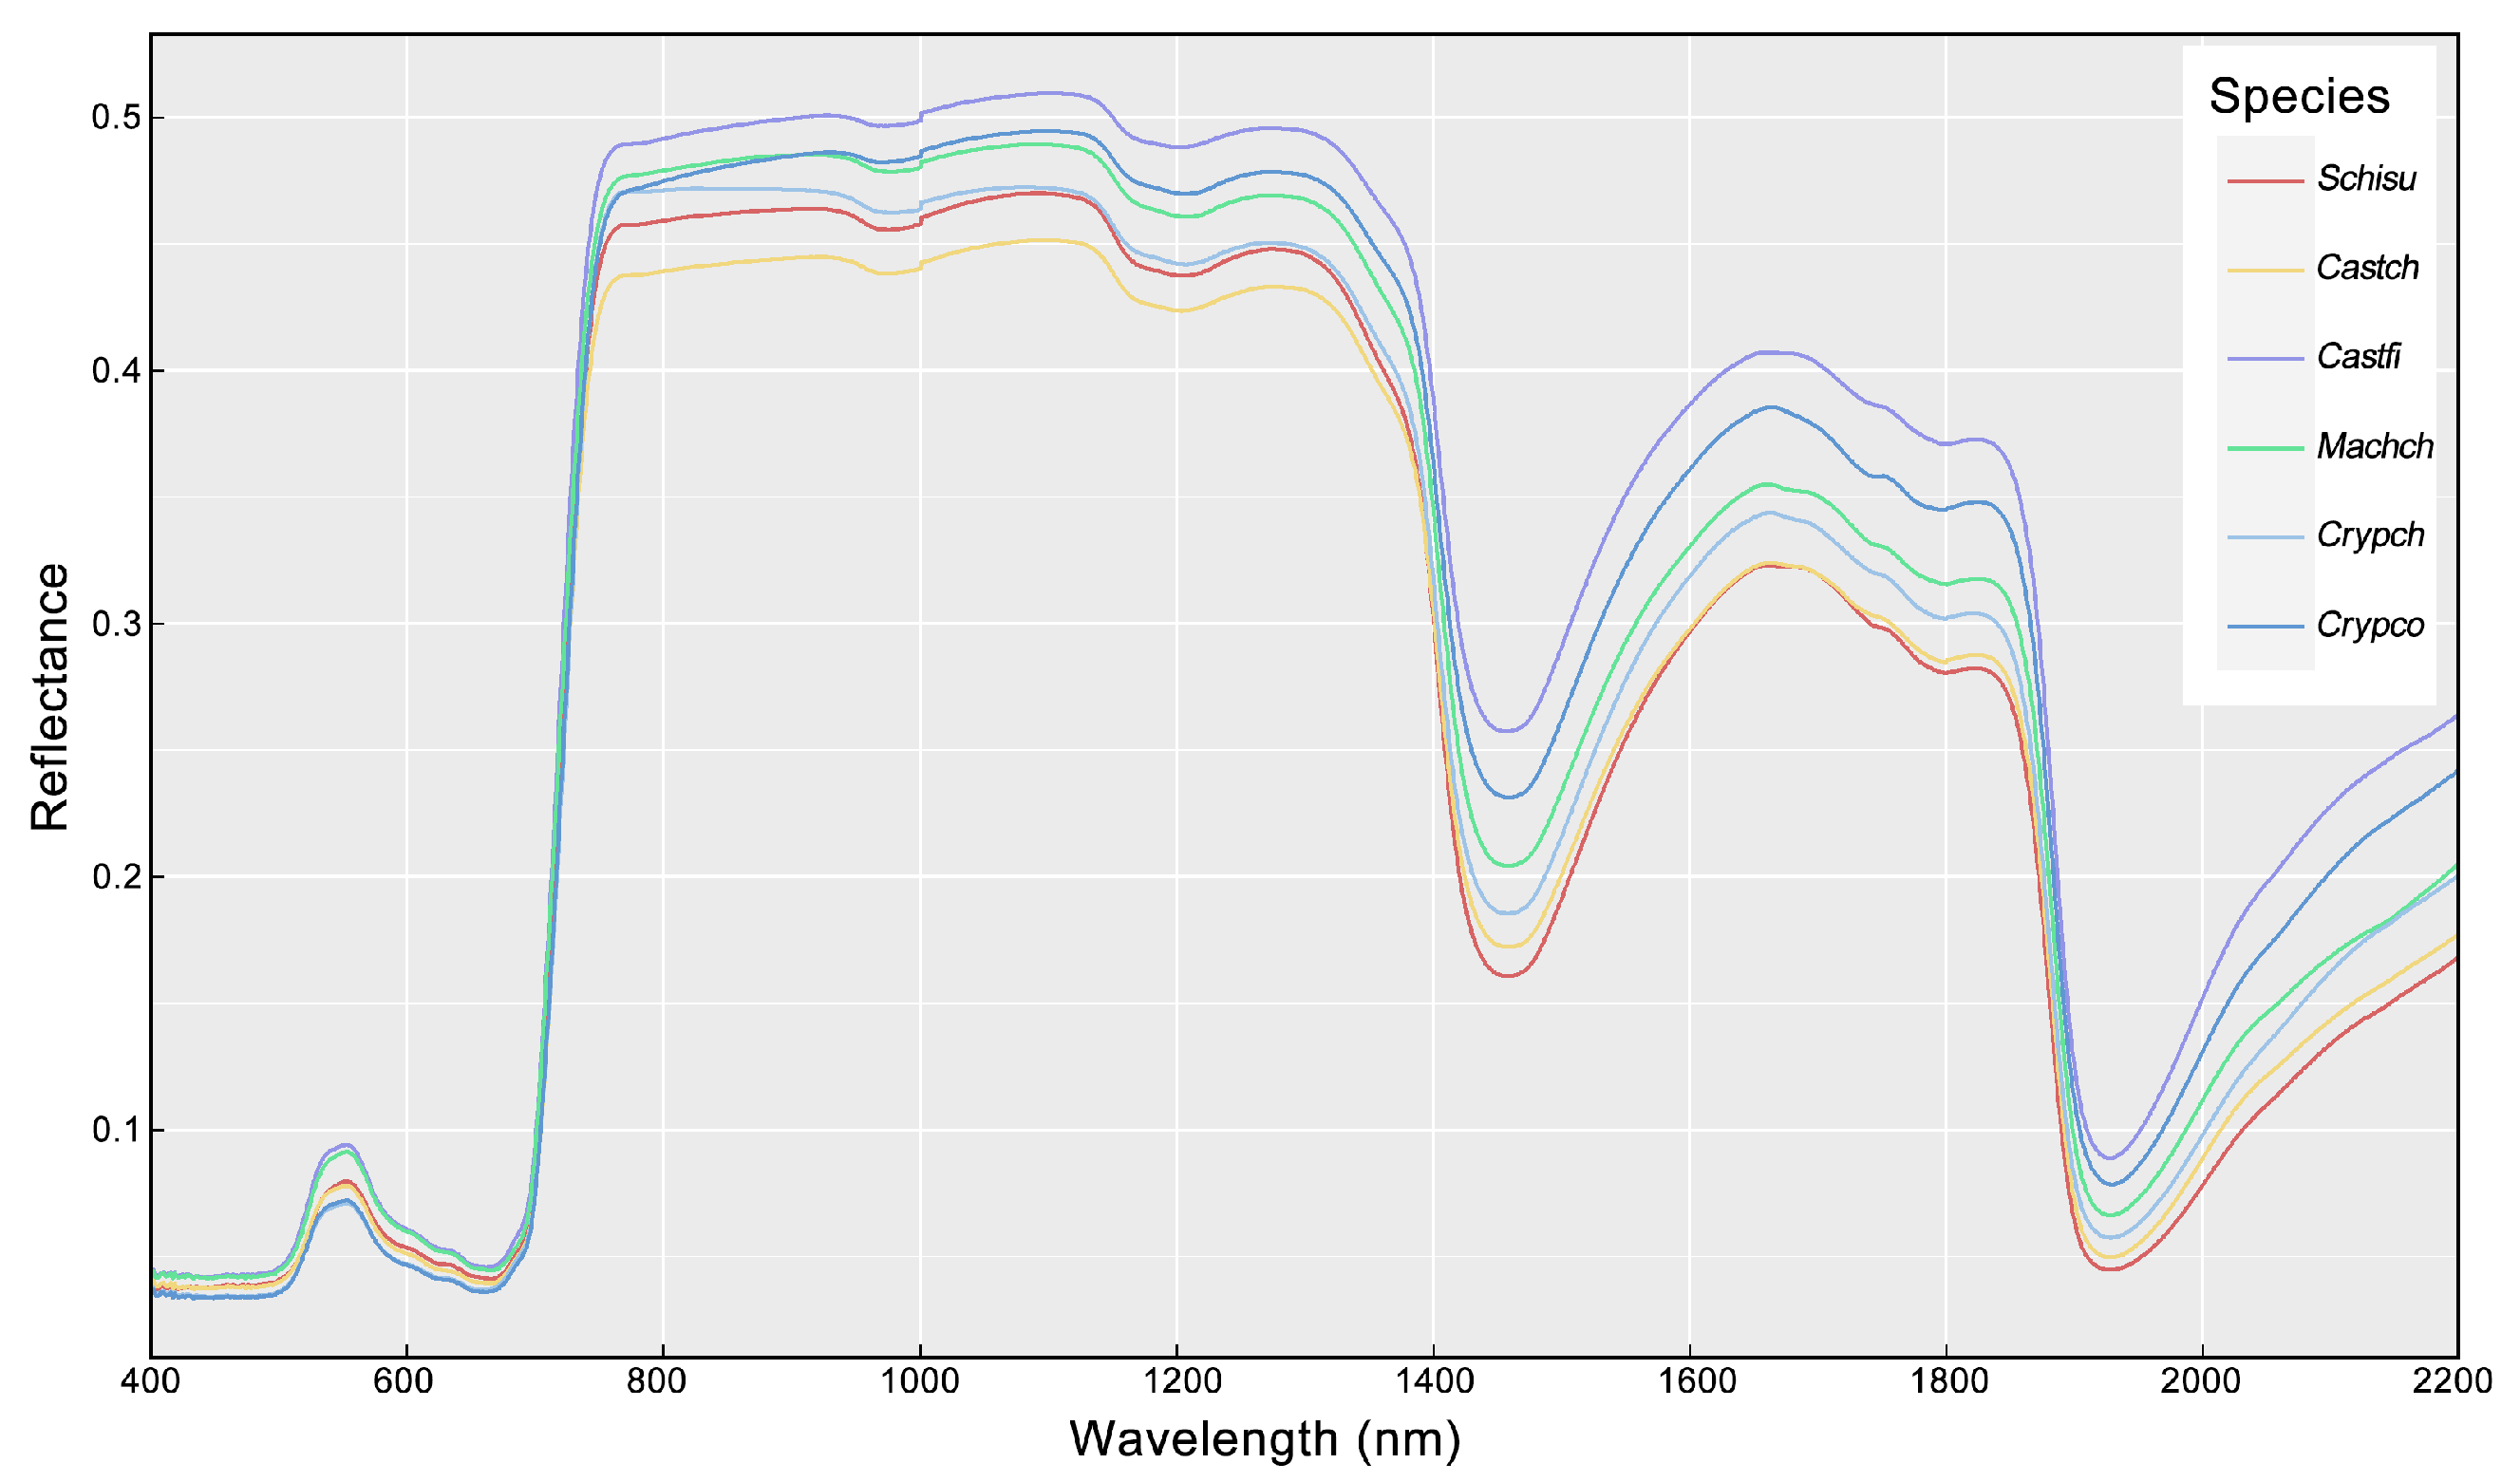
3.1. Variation of Leaf Traits and Spectra
3.2. Comparison of Classification Accuracies
3.3. Variation in Classification Accuracies along the Vertical Canopy
4. Discussion
4.1. Performance Differences of Leaf Spectra and Traits in Classification
4.2. Impact of Vertical Canopy Position on Accuracies
4.3. Influence of Tree Species Growth Habits on Classification Accuracies
5. Conclusions
- The combined LFT + LHR data achieved significantly higher accuracy compared to the LFT and LHR only datasets. Combining the leaf spectra and trait data provides a new site for the application of classification datasets at the leaf level. We proposed that leaf functional traits and other plant traits should be considered for tree species classification in the future.
- The UML layer achieved the highest accuracy among the four canopy layers, and the accuracy increased from the lower canopy to the upper canopy. This can be attributed to the ample survival resources and the fierce interspecific competition in the upper canopy layer, which was correlated with the light gradient. This result enriches our understanding of the vertical structure in evergreen broad-leaved forests, and light gradient is key to explaining the interaction of species in a dense canopy.
- Higher accuracies were produced by the shade-tolerant species (Machch, Crypch and Crypco) due to their stable growth strategy in the forest. By contrast, lower accuracies were yielded by the light-demanding species (Schisu and Castch) because of their low-light adaptations. We proposed that tree species discrimination from remotely sensed data should consider more ecological characteristics and information on species.
Author Contributions
Funding
Data Availability Statement
Conflicts of Interest
References
- Orka, H.O.; Dalponte, M.; Gobakken, T.; Naesset, E.; Ene, L.T. Characterizing forest species composition using multiple remote sensing data sources and inventory approaches. Scand. J. Forest Res. 2013, 28, 677–688. [Google Scholar] [CrossRef]
- Modzelewska, A.; Fassnacht, F.E.; Sterenczak, K. Tree species identification within an extensive forest area with diverse management regimes using airborne hyperspectral data. Int. J. Appl. Earth Obs. Geoinf. 2020, 84, 101960. [Google Scholar] [CrossRef]
- Orka, H.O.; Naesset, E.; Bollandsas, O.M. Classifying species of individual trees by intensity and structure features derived from airborne laser scanner data. Remote Sens. Environ. 2009, 113, 1163–1174. [Google Scholar] [CrossRef]
- Heinzel, J.; Koch, B. Investigating multiple data sources for tree species classification in temperate forest and use for single tree delineation. Int. J. Appl. Earth Obs. Geoinf. 2012, 18, 101–110. [Google Scholar] [CrossRef]
- Lucas, R.; Bunting, P.; Paterson, M.; Chisholm, L. Classification of Australian forest communities using aerial photography, CASI and HyMap data. Remote Sens. Environ. 2008, 112, 2088–2103. [Google Scholar] [CrossRef]
- Jones, T.G.; Coops, N.C.; Sharma, T. Assessing the utility of airborne hyperspectral and LiDAR data for species distribution mapping in the coastal Pacific Northwest, Canada. Remote Sens. Environ. 2010, 114, 2841–2852. [Google Scholar] [CrossRef]
- Zhao, F.; Guo, Q.H.; Kelly, M. Allometric equation choice impacts lidar-based forest biomass estimates: A case study from the Sierra National Forest, CA. Agric. For. Meteorol. 2012, 165, 64–72. [Google Scholar] [CrossRef]
- Henry, M.; Bombelli, A.; Trotta, C.; Alessandrini, A.; Birigazzi, L.; Sola, G.; Vieilledent, G.; Santenoise, P.; Longuetaud, F.; Valentini, R.; et al. GlobAllomeTree: International platform for tree allometric equations to support volume, biomass and carbon assessment. IForest 2013, 6, E1–E5. [Google Scholar] [CrossRef]
- Dube, T.; Gara, T.W.; Mutanga, O.; Sibanda, M.; Shoko, C.; Murwira, A.; Masocha, M.; Ndaimani, H.; Hatendi, C.M. Estimating forest standing biomass in savanna woodlands as an indicator of forest productivity using the new generation WorldView-2 sensor. Geocarto Int. 2018, 33, 178–188. [Google Scholar] [CrossRef]
- Yao, W.; Krzystek, P.; Heurich, M. Tree species classification and estimation of stem volume and DBH based on single tree extraction by exploiting airborne full-waveform LiDAR data. Remote Sens. Environ. 2012, 123, 368–380. [Google Scholar] [CrossRef]
- Asner, G.P.; Martin, R.E.; Tupayachi, R.; Anderson, C.B.; Sinca, F.; Carranza-Jimenez, L.; Martinez, P. Amazonian functional diversity from forest canopy chemical assembly. PNAS 2014, 111, 5604–5609. [Google Scholar] [CrossRef] [PubMed]
- Wang, Z.H.; Wang, T.J.; Darvishzadeh, R.; Skidmore, A.K.; Jones, S.; Suarez, L.; Woodgate, W.; Heiden, U.; Heurich, M.; Hearne, J. Vegetation Indices for Mapping Canopy Foliar Nitrogen in a Mixed Temperate Forest. Remote Sens. 2016, 8, 491. [Google Scholar] [CrossRef]
- Gokkaya, K.; Thomas, V.; Noland, T.; McCaughey, H.; Morrison, I.; Treitz, P. Mapping continuous forest type variation by means of correlating remotely sensed metrics to canopy N:P ratio in a boreal mixedwood forest. Appl. Veg. Sci. 2015, 18, 143–157. [Google Scholar] [CrossRef]
- Yin, D.M.; Wang, L. How to assess the accuracy of the individual tree-based forest inventory derived from remotely sensed data: A review. Int. J. Remote Sens. 2016, 37, 4521–4553. [Google Scholar] [CrossRef]
- Liu, L.X.; Coops, N.C.; Aven, N.W.; Pang, Y. Mapping urban tree species using integrated airborne hyperspectral and LiDAR remote sensing data. Remote Sens. Environ. 2017, 200, 170–182. [Google Scholar] [CrossRef]
- Shang, X.; Chisholm, L.A. Classification of Australian Native Forest Species Using Hyperspectral Remote Sensing and Machine-Learning Classification Algorithms. IEEE J. Sel. Top. Appl. Earth Obs. Remote Sens. 2014, 7, 2481–2489. [Google Scholar] [CrossRef]
- Fassnacht, F.E.; Latifi, H.; Sterenczak, K.; Modzelewska, A.; Lefsky, M.; Waser, L.T.; Straub, C.; Ghosh, A. Review of studies on tree species classification from remotely sensed data. Remote Sens. Environ. 2016, 186, 64–87. [Google Scholar] [CrossRef]
- Shi, Y.F.; Skidmore, A.K.; Wang, T.J.; Holzwarth, S.; Heiden, U.; Pinnel, N.; Zhu, X.; Heurich, M. Tree species classification using plant functional traits from LiDAR and hyperspectral data. Int. J. Appl. Earth Obs. Geoinf. 2018, 73, 207–219. [Google Scholar] [CrossRef]
- Clark, M.L.; Roberts, D.A.; Clark, D.B. Hyperspectral discrimination of tropical rain forest tree species at leaf to crown scales. Remote Sens. Environ. 2005, 96, 375–398. [Google Scholar] [CrossRef]
- Hesketh, M.; Sanchez-Azofeifa, G.A. The effect of seasonal spectral variation on species classification in the Panamanian tropical forest. Remote Sens. Environ. 2012, 118, 73–82. [Google Scholar] [CrossRef]
- Guzman, Q.J.A.; Rivard, B.; Sanchez-Azofeifa, G.A. Discrimination of liana and tree leaves from a Neotropical Dry Forest using visible-near infrared and longwave infrared reflectance spectra. Remote Sens. Environ. 2018, 219, 135–144. [Google Scholar] [CrossRef]
- Liao, W.Z.; Van Coillie, F.; Gao, L.R.; Li, L.W.; Zhang, B.; Chanussot, J. Deep Learning for Fusion of APEX Hyperspectral and Full-Waveform LiDAR Remote Sensing Data for Tree Species Mapping. IEEE Access 2018, 6, 68716–68729. [Google Scholar] [CrossRef]
- Puttonen, E.; Suomalainen, J.; Hakala, T.; Raikkonen, E.; Kaartinen, H.; Kaasalainen, S.; Litkey, P. Tree species classification from fused active hyperspectral reflectance and LIDAR measurements. For. Ecol. Manag. 2010, 260, 1843–1852. [Google Scholar] [CrossRef]
- Clark, M.L.; Roberts, D.A. Species-Level Differences in Hyperspectral Metrics among Tropical Rainforest Trees as Determined by a Tree-Based Classifier. Remote Sens. 2012, 4, 1820–1855. [Google Scholar] [CrossRef]
- van Deventer, H.; Cho, M.A.; Mutanga, O. Improving the classification of six evergreen subtropical tree species with multi-season data from leaf spectra simulated to WorldView-2 and RapidEye. Int. J. Remote Sens. 2017, 38, 4804–4830. [Google Scholar] [CrossRef]
- Cho, M.A.; Debba, P.; Mathieu, R.; Naidoo, L.; van Aardt, J.; Asner, G.P. Improving Discrimination of Savanna Tree Species Through a Multiple-Endmember Spectral Angle Mapper Approach: Canopy-Level Analysis. IEEE Trans. Geosci. Electron. 2010, 48, 4133–4142. [Google Scholar] [CrossRef]
- Asner, G.P.; Martin, R.E. Airborne spectranomics: Mapping canopy chemical and taxonomic diversity in tropical forests. Front. Ecol. Environ. 2009, 7, 269–276. [Google Scholar] [CrossRef]
- Lefcheck, J.S.; Bastazini, V.A.G.; Griffin, J.N. Choosing and using multiple traits in functional diversity research. Environ. Conserv. 2015, 42, 104–107. [Google Scholar] [CrossRef]
- Violle, C.; Navas, M.L.; Vile, D.; Kazakou, E.; Fortunel, C.; Hummel, I.; Garnier, E. Let the concept of trait be functional! Oikos 2007, 116, 882–892. [Google Scholar] [CrossRef]
- Reich, P.B. The world-wide ‘fast-slow’ plant economics spectrum: A traits manifesto. J. Ecol. 2014, 102, 275–301. [Google Scholar] [CrossRef]
- Albert, C.H.; Thuiller, W.; Yoccoz, N.G.; Douzet, R.; Aubert, S.; Lavorel, S. A multi-trait approach reveals the structure and the relative importance of intra- vs. interspecific variability in plant traits. Funct. Ecol. 2010, 24, 1192–1201. [Google Scholar] [CrossRef]
- Subedi, S.C.; Ross, M.S.; Sah, J.P.; Redwine, J.; Baraloto, C. Trait-based community assembly pattern along a forest succession gradient in a seasonally dry tropical forest. Ecosphere 2019, 10, e02719. [Google Scholar] [CrossRef]
- Asner, G.P.; Martin, R.E. Canopy phylogenetic, chemical and spectral assembly in a lowland Amazonian forest. New Phytol. 2011, 189, 999–1012. [Google Scholar] [CrossRef] [PubMed]
- Ewald, M.; Aerts, R.; Lenoir, J.; Fassnacht, F.E.; Nicolas, M.; Skowronek, S.; Piat, J.; Honnay, O.; Garzon-Lopez, C.X.; Feilhauer, H.; et al. LiDAR derived forest structure data improves predictions of canopy N and P concentrations from imaging spectroscopy. Remote Sens. Environ. 2018, 211, 13–25. [Google Scholar] [CrossRef]
- Asner, G.P.; Martin, R.E.; Tupayachi, R.; Emerson, R.; Martinez, P.; Sinca, F.; Powell, G.V.N.; Wright, S.J.; Lugo, A.E. Taxonomy and remote sensing of leaf mass per area (LMA) in humid tropical forests. Ecol. Appl. 2011, 21, 85–98. [Google Scholar] [CrossRef] [PubMed]
- Wang, Z.H.; Skidmore, A.K.; Darvishzadeh, R.; Heiden, U.; Heurich, M.; Wang, T.J. Leaf Nitrogen Content Indirectly Estimated by Leaf Traits Derived from the PROSPECT Model. IEEE J. Sel. Top. Appl. Earth Obs. Remote Sens. 2015, 8, 3172–3182. [Google Scholar] [CrossRef]
- de Jong, S.M.; Addink, E.A.; Doelman, J.C. Detecting leaf-water content in Mediterranean trees using high-resolution spectrometry. Int. J. Appl. Earth Obs. Geoinf. 2014, 27, 128–136. [Google Scholar] [CrossRef]
- Auger, S.; Shipley, B. Inter-specific and intra-specific trait variation along short environmental gradients in an old-growth temperate forest. J. Veg. Sci. 2013, 24, 419–428. [Google Scholar] [CrossRef]
- Ali, A.M.; Skidmore, A.K.; Darvishzadeh, R.; van Duren, I.; Holzwarth, S.; Mueller, J. Retrieval of forest leaf functional traits from HySpex imagery using radiative transfer models and continuous wavelet analysis. ISPRS J. Photogramm. Remote Sens. 2016, 122, 68–80. [Google Scholar] [CrossRef]
- Helfenstein, I.S.; Schneider, F.D.; Schaepman, M.E.; Morsdorf, F. Assessing biodiversity from space: Impact of spatial and spectral resolution on trait-based functional diversity. Remote Sens. Environ. 2022, 275, 113024. [Google Scholar] [CrossRef]
- Yu, F.Y.; Gara, T.W.; Lian, J.Y.; Ye, W.H.; Shen, J.; Wang, T.J.; Wu, Z.F.; Wang, J.J. Understanding the Impact of Vertical Canopy Position on Leaf Spectra and Traits in an Evergreen Broadleaved Forest. Remote Sens. 2021, 13, 5057. [Google Scholar] [CrossRef]
- Shi, Y.F.; Wang, T.J.; Skidmore, A.K.; Heurich, M. Important LiDAR metrics for discriminating forest tree species in Central Europe. ISPRS J. Photogramm. Remote Sens. 2018, 137, 163–174. [Google Scholar] [CrossRef]
- Sankey, T.; Donager, J.; McVay, J.; Sankey, J.B. UAV lidar and hyperspectral fusion for forest monitoring in the southwestern USA. Remote Sens. Environ. 2017, 195, 30–43. [Google Scholar] [CrossRef]
- Dalponte, M.; Bruzzone, L.; Gianelle, D. Tree species classification in the Southern Alps based on the fusion of very high geometrical resolution multispectral/hyperspectral images and LiDAR data. Remote Sens. Environ. 2012, 123, 258–270. [Google Scholar] [CrossRef]
- Alonzo, M.; Bookhagen, B.; Roberts, D.A. Urban tree species mapping using hyperspectral and lidar data fusion. Remote Sens. Environ. 2014, 148, 70–83. [Google Scholar] [CrossRef]
- Li, Y.P.; Ni, Y.L.; Xu, H.; Lian, J.Y.; Ye, W.H. Relationship between variation of plant functional traits and individual growth at different vertical layers in a subtropical evergreen broad-leaved forest of Dinghushan. Biodivers. Sci. 2021, 29, 1186–1197. [Google Scholar] [CrossRef]
- Gui, X.J.; Lian, J.Y.; Zhang, R.Y.; Li, Y.P.; Shen, H.; Ni, Y.L.; Ye, W.H. Vertical structure and its biodiversity in a subtropical evergreen broadleaved forest at Dinghushan in Guangdong Province, China. Biodivers. Sci. 2019, 27, 619–629. [Google Scholar]
- Cornelissen, J.H.C.; Lavorel, S.; Garnier, E.; Diaz, S.; Buchmann, N.; Gurvich, D.E.; Reich, P.B.; ter Steege, H.; Morgan, H.D.; van der Heijden, M.G.A.; et al. A handbook of protocols for standardised and easy measurement of plant functional traits worldwide. Aust. J. Bot. 2003, 51, 335–380. [Google Scholar] [CrossRef]
- Cutler, D.R.; Edwards, T.C.; Beard, K.H.; Cutler, A.; Hess, K.T. Random forests for classification in ecology. Ecology 2007, 88, 2783–2792. [Google Scholar] [CrossRef]
- Kuhn, M. Building Predictive Models in R Using the caret Package. J. Stat. Softw. 2008, 28, 1–26. [Google Scholar] [CrossRef]
- Harrison, D.; Rivard, B.; Sanchez-Azofeifa, A. Classification of tree species based on longwave hyperspectral data from leaves, a case study for a tropical dry forest. Int. J. Appl. Earth Obs. Geoinf. 2018, 66, 93–105. [Google Scholar] [CrossRef]
- Fassnacht, F.E.; Neumann, C.; Forster, M.; Buddenbaum, H.; Ghosh, A.; Clasen, A.; Joshi, P.K.; Koch, B. Comparison of Feature Reduction Algorithms for Classifying Tree Species with Hyperspectral Data on Three Central European Test Sites. IEEE J. Sel. Top. Appl. Earth Obs. Remote Sens. 2014, 7, 2547–2561. [Google Scholar] [CrossRef]
- Wietecha, M.; Jelowicki, L.; Mitelsztedt, K.; Miscicki, S.; Sterenczak, K. The capability of species-related forest stand characteristics determination with the use of hyperspectral data. Remote Sens. Environ. 2019, 231, 111232. [Google Scholar] [CrossRef]
- Fricker, G.A.; Ventura, J.D.; Wolf, J.A.; North, M.P.; Davis, F.W.; Franklin, J. A Convolutional Neural Network Classifier Identifies Tree Species in Mixed-Conifer Forest from Hyperspectral Imagery. Remote Sens. 2019, 11, 2326. [Google Scholar] [CrossRef]
- Feret, J.B.; Asner, G.P. Spectroscopic classification of tropical forest species using radiative transfer modeling. Remote Sens. Environ. 2011, 115, 2415–2422. [Google Scholar] [CrossRef]
- Castro-Esau, K.L.; Sanchez-Azofeifa, G.A.; Rivard, B.; Wright, S.J.; Quesada, M. Variability in leaf optical properties of Mesoamerican trees and the potential for species classification. Am. J. Bot. 2006, 93, 517–530. [Google Scholar] [CrossRef]
- Zhao, Y.J.; Zeng, Y.; Zhao, D.; Wu, B.F.; Zhao, Q.J. The Optimal Leaf Biochemical Selection for Mapping Species Diversity Based on Imaging Spectroscopy. Remote Sens. 2016, 8, 216. [Google Scholar] [CrossRef]
- Gara, T.W.; Skidmore, A.K.; Darvishzadeh, R.; Wang, T.J. Leaf to canopy upscaling approach affects the estimation of canopy traits. GIsci. Remote Sens. 2019, 56, 554–575. [Google Scholar] [CrossRef]
- Knyazikhin, Y.; Schull, M.A.; Stenberg, P.; Mottus, M.; Rautiainen, M.; Yang, Y.; Marshak, A.; Carmona, P.L.; Kaufmann, R.K.; Lewis, P.; et al. Hyperspectral remote sensing of foliar nitrogen content. PNAS 2013, 110, E185–E192. [Google Scholar] [CrossRef]
- Wang, Z.; Skidmore, A.K.; Darvishzadeh, R.; Wang, T. Mapping forest canopy nitrogen content by inversion of coupled leaf-canopy radiative transfer models from airborne hyperspectral imagery. Agric. For. Meteorol. 2018, 253, 247–260. [Google Scholar] [CrossRef]
- Malenovsky, Z.; Homolova, L.; Lukes, P.; Buddenbaum, H.; Verrelst, J.; Alonso, L.; Schaepman, M.E.; Lauret, N.; Gastellu-Etchegorry, J.P. Variability and Uncertainty Challenges in Scaling Imaging Spectroscopy Retrievals and Validations from Leaves Up to Vegetation Canopies. Surv. Geophys. 2019, 40, 631–656. [Google Scholar] [CrossRef] [PubMed]
- Morsdorf, F.; Nichol, C.; Malthus, T.; Woodhouse, I.H. Assessing forest structural and physiological information content of multi-spectral LiDAR waveforms by radiative transfer modelling. Remote Sens. Environ. 2009, 113, 2152–2163. [Google Scholar] [CrossRef]
- D’Andrea, R.; Guittar, J.; O’Dwyer, J.P.; Figueroa, H.; Wright, S.J.; Condit, R.; Ostling, A. Counting niches: Abundance-by-trait patterns reveal niche partitioning in a Neotropical forest. Ecology 2020, 101, e03019. [Google Scholar] [CrossRef] [PubMed]
- Weerasinghe, L.K.; Creek, D.; Crous, K.Y.; Xiang, S.; Liddell, M.J.; Turnbull, M.H.; Atkin, O.K. Canopy position affects the relationships between leaf respiration and associated traits in a tropical rainforest in Far North Queensland. Tree Physiol. 2014, 34, 564–584. [Google Scholar] [CrossRef]
- Lebrija-Trejos, E.; Perez-Garcia, E.A.; Meave, J.A.; Bongers, F.; Poorter, L. Functional traits and environmental filtering drive community assembly in a species-rich tropical system. Ecology 2010, 91, 386–398. [Google Scholar] [CrossRef]
- Holmgren, M.; Scheffer, M.; Huston, M.A. the interplay of facilitation and competition in plant communities. Ecology 1997, 78, 1966–1975. [Google Scholar] [CrossRef]
- Liu, W.D.; Su, J.R. Successional leaf traits of monsoon evergreen broad-leaved forest, Southwest China. IForest 2017, 10, 391–396. [Google Scholar] [CrossRef]
- Zou, S.; Zhou, G.Y.; Zhang, Q.M.; Xu, S.; Xiong, X.; Xia, Y.J.; Liu, S.Z.; Meng, Z.; Chu, G.W. Long-term (1992–2015) dynamics of community composition and structure in a monsoon evergreen broad-leaved forest in Dinghushan Biosphere Reserve. Chin. J. Plant Ecol. 2018, 42, 442–452. [Google Scholar]
- Zhang, J.Z.; Lin, G.Z.; Lin, Z.F.; Peng, C.L. Response of Photosynthesis to Growth Light Intensity in Some South Subtropical Woody Plants. J. Trop. Subtrop. Bot. 2005, 13, 413–418. [Google Scholar]
- Yu, Z.C.; Liu, X.T.; Zheng, X.T.; Huang, X.D.; Peng, C.L. Relationship between the Accumulation Ability of Photoprotective Substances and the Photosynthetic Capacity in Leaves of Four Woody Plants Grown under Two Light Intensities. J. South China Normal Univ. (Nat. Sci. Ed.). 2019, 51, 62–69. [Google Scholar]


| Species | Abbreviation | Sample Size |
|---|---|---|
| Schima superba | Schisu | 16 |
| Castanopsis chinensis | Castch | 12 |
| Castanopsis fissa | Castfi | 15 |
| Machilus chinensis | Machch | 20 |
| Cryptocarya chinensis | Crypch | 13 |
| Cryptocarya concinna | Crypco | 13 |
| Classification Datasets | OA (%) | Kappa |
|---|---|---|
| LFT dataset | 74.26 b | 0.69 b |
| LHR dataset | 69.06 c | 0.63 c |
| LFT + LHR dataset | 77.65 a | 0.73 a |
| Classification Datasets | Schisu | Castch | Castfi | Machch | Crypch | Crypco |
|---|---|---|---|---|---|---|
| LFT | 82.65 a | 64.09 c | 84.07 a | 72.80 b | 71.87 b | 81.81 a |
| LHR | 60.73 d | 53.94 e | 86.21 a | 69.74 b | 66.28 c | 84.59 a |
| LFT + LHR | 73.95 d | 69.72 e | 89.00 a | 78.85 b | 76.26 c | 87.50 a |
Publisher’s Note: MDPI stays neutral with regard to jurisdictional claims in published maps and institutional affiliations. |
© 2022 by the authors. Licensee MDPI, Basel, Switzerland. This article is an open access article distributed under the terms and conditions of the Creative Commons Attribution (CC BY) license (https://creativecommons.org/licenses/by/4.0/).
Share and Cite
Zhang, Y.; Wang, J.; Wu, Z.; Lian, J.; Ye, W.; Yu, F. Tree Species Classification Using Plant Functional Traits and Leaf Spectral Properties along the Vertical Canopy Position. Remote Sens. 2022, 14, 6227. https://doi.org/10.3390/rs14246227
Zhang Y, Wang J, Wu Z, Lian J, Ye W, Yu F. Tree Species Classification Using Plant Functional Traits and Leaf Spectral Properties along the Vertical Canopy Position. Remote Sensing. 2022; 14(24):6227. https://doi.org/10.3390/rs14246227
Chicago/Turabian StyleZhang, Yicen, Junjie Wang, Zhifeng Wu, Juyu Lian, Wanhui Ye, and Fangyuan Yu. 2022. "Tree Species Classification Using Plant Functional Traits and Leaf Spectral Properties along the Vertical Canopy Position" Remote Sensing 14, no. 24: 6227. https://doi.org/10.3390/rs14246227
APA StyleZhang, Y., Wang, J., Wu, Z., Lian, J., Ye, W., & Yu, F. (2022). Tree Species Classification Using Plant Functional Traits and Leaf Spectral Properties along the Vertical Canopy Position. Remote Sensing, 14(24), 6227. https://doi.org/10.3390/rs14246227