Abstract
This study aims to verify whether the open-source software may provide Precise Point Positioning (PPP) with high accuracy. In this way, we address a question on the potential usability of open-source software for PPP analysis. On 31 July 2020, the full constellation of BeiDou satellites (SV) was announced. Over the European area, however, the number of visible BeiDou SVs is significantly smaller than in Asian-Pacific regions. Additionally, the system is in a modernization process, which may result in difficulties in utilizing its full potential. Ten days of multi-GNSS data were processed using the open-source software GAMP to determine how the accuracy of a derived three-dimensional PPP coordinates depends on observation session length and satellite systems used. The time series of position components of selected EUREF Permanent Network (EPN) stations generated from sub-daily (30 min and longer) solutions were analyzed. The obtained results prove that adding BeiDou observations, even in the case of using an incomplete constellation, leads to visible improvements, which can be observed both in the reduction of differences between estimated and true coordinates, as well as in the reduction of the standard deviation (SD). Improved accuracy caused by adding BeiDou data is especially noticeable for short observation sessions (in the range of 0.5 to 2.0 h) and in the case of a joint solution with GLONASS or Galileo observations. Finally, the open-source software GAMP proved to be a useful tool for multi-GNSS data processing and analysis.
1. Introduction
In recent years the rapid development of new solutions in satellite navigation appeared. A key element of this evolution is the new global navigation systems (e.g., Galileo, BeiDou) and the associated increase in the number of signals reaching the receivers. The increased number of signals and frequencies that receivers can record, opens new opportunities for users. The most crucial role that multi-Global Navigation Satellite System (GNSS) can play is the increase of the probability of determining a reliable position in urban canyons, open-pit mines, or valleys [1]. A larger number of satellites and signals transmitted by different systems results in an improvement of the observation geometry, visible through the dilution of precision (DOP) parameter, which causes an improvement in positioning accuracy [2,3]. It also helps reduce the convergence time in the Precise Point Positioning (PPP) technique [4].
The European Space Agency (ESA) successfully develops a satellite navigation system called Galileo [5]. Currently (03.2022), there are 28 satellites on orbits (four have status NOT USABLE, one NOT AVAILABLE and two UNDER COMMISSIONING). Another newly developed system with global coverage is BeiDou [6]. The initial BeiDou satellites were launched in 2000. BeiDou-1 was out of use in late 2012. Its successor is the global BeiDou-2 system, also known as Compass, composed of five geostationary satellites and 30 orbiting. Compass has been operational in the Asia-Pacific region since December 2011, based on 10 SVs. The achievement of the full constellation of BeiDou satellites was announced on 31 July 2020. Currently, the BeiDou-3 system is being developed.
Besides introducing new systems, the GPS and GLONASS are being modernized. The essential elements of this modernization are new, additional signals. In 2000, the US Congress authorized work on GPS III. This project includes new ground stations and satellites, additional civilian and military navigation signals and improved accessibility [7]. The Government of the Russian Federation, considering the GLONASS satellite navigation system as a priority, established in 2001 Federal Task Program on the Global Navigation System (GNS). The GNS program is intended to improve the GLONASS system’s space, ground and user equipment segments. One of the major tasks of this modernization is to enable all new satellites to transmit both new CDMA and older FDMA signals [8].
Multiple frequencies, signals and time systems bring many advantages but also some challenges, especially in highly accurate measurements. For example, satellites, in addition to the parameters of the transmitted signals, differ in construction (shape, size and configuration of the solar panels, properties of the cover materials), as well as in specific technologies (e.g., the way the satellite is oriented on the orbit in the Sun-Earth-Satellite system). This causes various difficulties in creating universal models of precise orbits, including modeling elements that perturb satellite flight, such as the effect of solar radiation pressure.
Researchers have widely developed PPP methods and algorithms for many years. Currently, this technique has become a precious and common tool in many applications used in geodesy [9], geophysics [10] and meteorology [11]. The main advantage of PPP is determining high accuracy positions using only one dual-frequency GNSS receiver without using data from reference stations. However, high accuracies can only be achieved by using precise products provided by, i.e., the International GNSS Service (IGS), such as satellite orbits, satellite clocks, or Earth rotation parameters [12]. Initially, PPP was based on GPS-only observations. One of the earlier studies on integrating GPS and GLONASS observations in PPP methods was carried out in 2007 by Cai and Gao [13]. Although at that time, the GLONASS constellation consisted of 12 satellites only, nonetheless, the results have indicated an improvement on the position convergence time and the positioning accuracy by integrating GLONASS observations. In Pandey et al. [14], the authors also studied the efficiency of integrating GPS and GLONASS measurements to improve the reliability and accuracy of positioning using PPP. The authors showed that including GLONASS satellites significantly improved satellite availability (more than 60%), leading to improved satellite geometry (in terms of Positional Dilution of Precision-PDOP) of more than 30%. An integrated survey strategy allows for improved efficiency, especially in urban areas, mountainous areas, or where the satellite signal partially interferes. Similar conclusions can be found in Angrisano et al. [15].
Other studies have also reported improved accuracy and reduced convergence time for combined PPP [16,17,18,19,20]. Some papers analyzed the integration of GPS and BeiDou observations [21,22]. These analyses are mainly based on GNSS observations from the Asia-Pacific region, where the best BeiDou SVs coverage exists. Zhao et al. [22] found that adding BeiDou observations to a PPP based on GPS+GLONASS observations in the Asia-Pacific region reduces the convergence speed by 49.6% for short sessions and under difficult observing conditions. The Galileo constellation additionally increases the number of visible satellites and improves the geometric structure in space [23]. Afifi and El-Rabbany [24] showed that the combination of Galileo, BeiDou and GPS observations significantly increased positioning accuracy and reduced convergence time compared to PPP solutions based on GPS-only observations. PPP accuracy and convergence time analyses were done in kinematic and static mode. GNSS observations from five Asian-Pacific region stations obtained from sixteen successive measurement days were used. The results obtained for the static PPP showed that the positioning accuracy of BeiDou-only is lower than that of GPS-only for all three position components. The GPS+BeiDou PPP configuration improves positioning accuracy of 28%, 6% and 7% for the North, East and Up components, respectively, compared to the GPS-only results. Using the triple constellation GPS+BeiDou+GLONASS PPP, on the other hand, improved the positioning accuracy by 25%, 20%and 19% over GPS+BeiDou and by 9%, 8% and 10% over GPS+GLONASS for the East, North and Up components.
The analysis of multi-GNSS PPP efficiency was also presented in [25], where GPS, GLONASS, Galileo, BeiDou and QZSS observations were used. The investigations were based on 10 day observations of 2016 at six sites, also mainly located in the Asian-Pacific region stations. The analyses of the results showed an improvement in positioning accuracy at the centimeter level obtained with a multi-GNSS configuration compared to a configuration based on GPS-only observations. However, it was highlighted that when the positioning errors reach very low levels (around 5 mm), the impact of multi-GNSS on the increase in accuracy is limited due to the lower precision of orbits and clock corrections of systems such as BeiDou, GLONASS and Galileo. On the other hand, a significant increase in satellite availability has been observed with the multi-GNSS approach. Therefore, the authors suggest that the improvement in reliability and availability will be particularly noticeable in difficult measurement conditions, such as urban areas or partially obscured locations. A similar conclusion was also made by Abd Rabbou and El-Rabbany [26].
The results presented by Kiliszek and Kroszczyński [27] show that the development of the Galileo system had a particular impact on improving the results obtained in the case of multi-GNSS PPP. At the same time, the GPS still has the most significant impact on positioning accuracy. It was also proven that the Galileo system makes it possible to determine a position anywhere on Earth. Additionally, the results that were obtained for 2019 observations were 50 percent better than those based on 2017 observations.
To take full benefits of GNSS capabilities, it is preferred to use scientific software e.g., BERNESE, GIPSY-OASIS, or GAMIT/GLOBK. On the other hand, the GNU General Public License software’s were created, which can be a good alternative to scientific ones. They are free, usually easy to use, and often allow for sophisticated GNSS data analysis.
In the paper, we propose to examine open-source software performance in multi-GNSS PPP processing. So far, similar analyses have been conducted mainly based on scientific software [28] or online services [29]. In the paper, we focus on the impact of BeiDou measurements on the accuracy of multi-GNSS PPP derived position, as on 31 July 2020, when the full constellation of BeiDou satellites was announced. On the other hand, the coverage of visible BeiDou satellites is not homogenous over the Earth. Many studies have proved that the best Beidou system properties are available in the Asian-Pacific region. Over the European area, however, the number of visible BeiDou SVs is much smaller. The main goal of this paper was to evaluate the impact of adding BeiDou observations, to other GNSS system data, on the accuracy of PPP positioning over the Central Europe area. Ten days of multi-GNSS data were processed using the open-source software GAMP to determine how the accuracy of a derived three-dimensional PPP coordinates depends on observing session duration and satellite system configuration.
2. Materials and Methods
Observations from four (GPS, GLONASS, Galileo and BeiDou) GNSS systems collected at seven located in central Europe EPN stations were used for analysis (Figure 1). The geographical coordinates of used network points as well as hardware are presented in Table 1. Other detailed information can be found and EPN website (https://epncb.eu/, accessed on 27 December 2022).
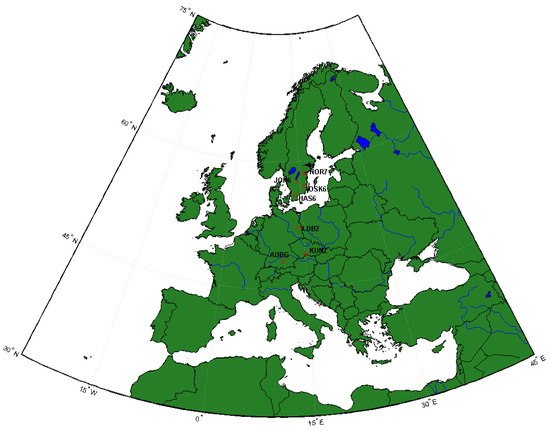
Figure 1.
Geographical location of the stations.

Table 1.
Stations’ geographical coordinates (GRS’80).
The analyses were based on observational data collected over 10 days (1–10 January 2021) and corresponding precise products. During the analyzed period Solar activity index Pk did not exceed 4 (active) and, in most cases, was below 1 (quiet). The daily observations were divided into the following observation windows (in hours): 0.5, 1.0, 2.0, 3.0, 4.0, 6.0, giving observational time series with different session lengths. The longer solutions were not included into the analysis. The reason was no significant difference between the results of 6- and 24-h data. The processing of the observations was carried out using the open-source software package GAMP [30].
The PPP requires, among others, the use of precise satellite orbits and clocks. This requirement can be achieved using the related products generated by the Analysis Centers (e.g., from the IGS) or autonomously modelling during the GNSS observation processing. The GNSS observations were processed in 14 scenarios (Table 2), with seven basic scenarios and corresponding scenarios in which the basic set of observations was supplemented with BeiDou signals. In all scenarios, the antenna phase center position variation was corrected using the type-mean corrections recommended by IGS and included in the ANTEX file (igs14_2035.atx).

Table 2.
Processing scenarios.
As the number of GNSS satellites and signals increases, it is become challenging to create a dedicated GNSS observation processing software that is easy to use and efficient. One of the attempts is a new GNSS analysis software called GAMP (GNSS analysis software for multi-constellation and multi-frequency precise positioning). The software can process GNSS observations using the PPP technique based on undifferenced and uncombined observations. GAMP is a fully operational software, is based on RTKLib but includes many improvements, such as cycle slips detection, receiver clock jump repair and GLONASS inter-frequency biases handling. Detailed description of GAMP structure, methodology and the rules of using it can be found in Zhou et al. [30]. The main processing parameters used in this study are shown in Table 3.

Table 3.
GAMP processing parameters.
Finally, it should be reminded that the transition from BeiDou-2 to BeiDou-3 and related changes in the transmitted signal structure can cause some challenges during observation post-processing. The software may not be ready for processing such observations, i.e., it may not be possible to use the modernized frequencies of the Beidou-3 system fully. This issue will be discussed in more detail later.
3. Results
The collected data were processed using the “free network” approach in the IGb14 system. Since the position time series analysis is mainly performed in topocentric coordinates, the obtained time series of cartesian positions were converted to North, East and Up (NEU) components. During NEU position component analyses, the results obtained from the PPP solutions were compared to the “true” coordinates, where the EUREF weekly combined solution per measurement epoch was used as the “true” one. The EUREF weekly combined solution is created from the GNSS solutions formed by the 16 EPN Analysis Centers (ACs). The EPN ACs regularly process GNSS data from EPN station subnetworks and generate daily coordinate results. The WUT-EUREF linking center, based on these data, produces daily and weekly combined positions of all EPN stations in SINEX format. Additionally, the value of Standard Deviation (SD) determined for each study variant was also analyzed.
3.1. SVs Constelation Analysis
For analysis purposes of the differences in the number of observed satellites and corresponding PDOP values during specific processing variants, the mean values of the number of SVs (Table 4) and the PDOP coefficient (Table 5) were presented.

Table 4.
Mean number of observed SVs (1 January 2021).

Table 5.
Mean PDOP coefficient (1.01.2021).
The results presented in Table 4 and Table 5 showed that the overall average number of observed satellites and corresponding PDOP values are 8.7 and 1.9 for GPS-only; 6.4 and 2.6 for GLONASS-only, 5.7 and 3.3 for Galileo-only, 15.1 and 1.4 for GPS and GLONASS combination; 14.3 and 1.4 for GPS and Galileo combination; 12.1 and 1.7 for GLONASS and Galileo combination; 20.8 and 1.1 for GPS, GLONASS, and Galileo combination, respectively. Including BeiDou observations to the processing increased the number of SVs and reduced the PDOP coefficient. On average, adding BeiDou observations increases the number of observed SVs, in the analyzed area, by 3.2. On the other hand, the reduction in PDOP value varies from 0.0 (GREC) to 1.1 (E-only). Analyzing the mean number of SVs and PDOP for the individual station, it can be seen that depending on the processing variant, the differences in the number of SVs range from 0.1 (III, E) to 0.7 (VII, GREC) and for PDOP coefficient from 0.0 to (G, R, GR, GE) to 1.4 (E). The percentage improvement rates of the average number of SVs and PDOP are shown in Table 6.

Table 6.
Number of SVs and PDOP percentage improvement rates [%].
The best rate of improvement in the mean number of SVs was obtained for all autonomous solutions (G-only, R-only, E-only), while the weakest rate was obtained for the GRE variant. In the case of the PDOP ratio, the best, above 20%, improvement was obtained for R and E solution.
3.2. GNSS Solutions Analysis
The results, differences between the mean NEU position and the “true” ones, and the corresponding SD coefficients, are shown in Figure 2 and Figure 3. As we expect the most significant impact on results for autonomous solutions (Table 6), these detailed analyses are presented only for scenarios I, II and III.
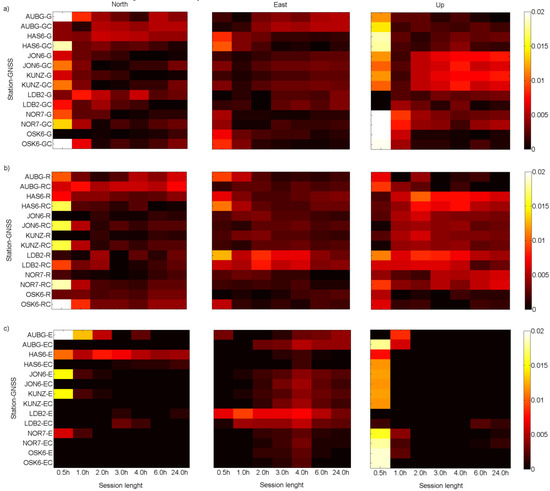
Figure 2.
Absolute value of mean NEU components differences (in meters) for scenarios: (a) I, (b) II, (c) III.
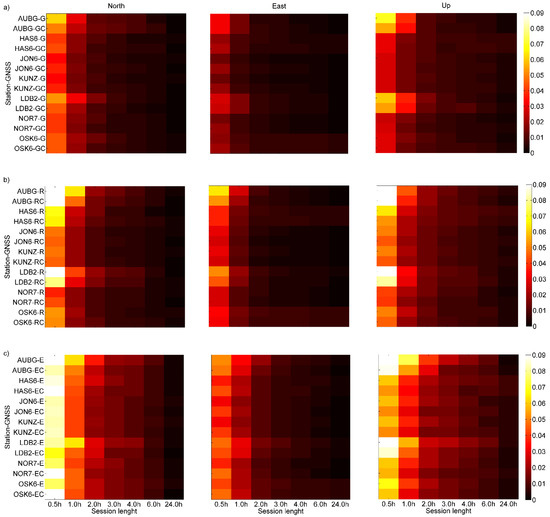
Figure 3.
SD for NEU components differences (in meters) for scenarios: (a) I, (b) II, (c) III.
Analyzing the differences between the estimated mean NEU components and the “real” values, it can be seen that the most significant differences were obtained in case of 0.5 and 1.0 h session. Extending the session length results in a noticeable reduction in these differences. This is seen in nearly all cases, regardless of solution type, position component, or EPN station. Adding of BeiDou observations, in general, results in a reduction of the analyzed differences. This is true in the case of all autonomous solutions (G-only, R-only, and E-only) and short observation sessions. Corresponding results were achieved for the SD coefficient. The extension of the session length results in an apparent reduction of the SD value. It is visible in all cases, regardless of the solution type, position component, or EPN station. Adding BeiDou observations, nearly in all cases, causes a reduction of SD value. The exceptions are longer sessions (over 4 h), where solution improvements are less visible.
3.3. Regresion Analysis
Change of position components differences resulting from the BeiDou signals adding and the linear regression coefficient estimated based on these data are presented in Figure 4.
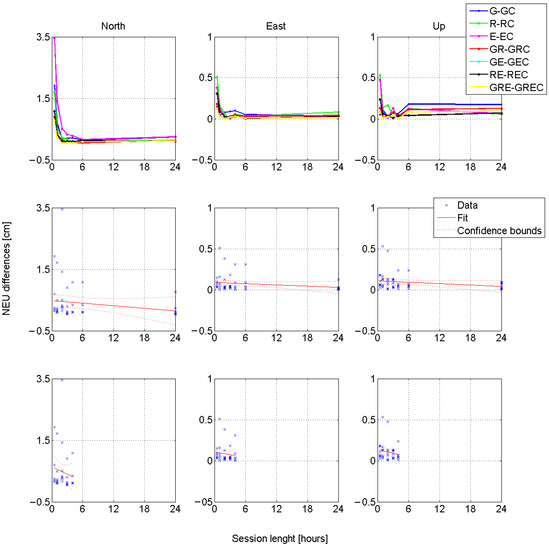
Figure 4.
Improvement in NEU differences. Upper subpolts present results of comparison “true” and estimated coordinates obtained from solution without and with BeiDou observations, central subplots present linear regression plot for up to 24 h data; bottom subplots present linear regression plot for up to 4 h data (please note the different scales on vertical axis).
As shown in Figure 4, adding BeiDou observations visibly affects coordinate differences. The improvement is particularly noticeable for short, from 0.5 to 2 h, observation sessions in the autonomous processing variants (E-only, R-only, and G-only). More significant differences and related improvements for the North component can be noted in all processing variants. The reason for this phenomenon could be the limited visibility of the satellites of all systems in the northern region, the so-called “North hole”. In the case of autonomous solutions (especially for the Galileo system with incomplete SV constellation), where we especially observe an improvement, the inclusion of observations from BeiDou-2satellites corrects the geometry of the satellites, which is most prominent in the Northern component of the position. Obviously, it will be visible especially in the case of short observation sessions (in the range of 0.5 to 1.0 h). The resulting regression model coefficients for the position component, calculated for 24 and 4 h data windows, are shown in Table 7. As the most significant impact on results is seen in the case of autonomous solutions (Figure 4), linear regression model coefficients were calculated for these three variants and presented in Table 7. We decided to use linear regression, as it is most often used in similar analyses [34,35].

Table 7.
The slope regression coefficient for mean NEU differences.
Presented in Table 7, the slope regression coefficients define the reduction of the difference between the true and the estimated coordinate in a function of the observation session duration. As was shown previously, adding BeiDou observations positively affects the results and causes a reduction of differences between estimated and true position components. This improvement is session length-dependent and is especially visible in the case of the North position component. Regression coefficients presented in Table 7 also clearly indicate that including BeiDou observables is especially beneficial for short sessions. Their absolute values calculated for 4 h data windows are 4–5 times higher than obtained for 24 h data windows. Generally, in multi-GNSS variant, including BeiDou signals resulted in a reduction of the difference between the true and the estimated coordinate according to the formulas (in case of 4 h data window): −0.8 mm·h, −0.1 mm·h, −0.2 mm·h for North, East and Up position components, respectively. The presented results also prove that particular improvements can be expected in the case of autonomous solution variants, especially in E-only and R-only. For Galileo signals, we obtained a reduction of position differences equal −7.7 mm·h, −0.8 mm·h, −0.9 mm·h for North, East, and Up position components, respectively (in case of 4 h data window). For GLONASS observations, the corresponding values are: −3.6 mm·h, −1.1 mm·h, −1.1 mm·h. It is worth noting that in the case of GPS-only variant, where regression coefficients were calculated based on 24 h data window, adding BeiDou observations can cause an increase in analyzed differences. This is the case of the Up component, where the worsening of results equals +0.1 mm·h.
The characteristics of the SD changes (difference estimated as subtraction of mean SDs obtained before and after including of BeiDou observations) and the regression coefficient calculated based on these data are presented in Figure 5.
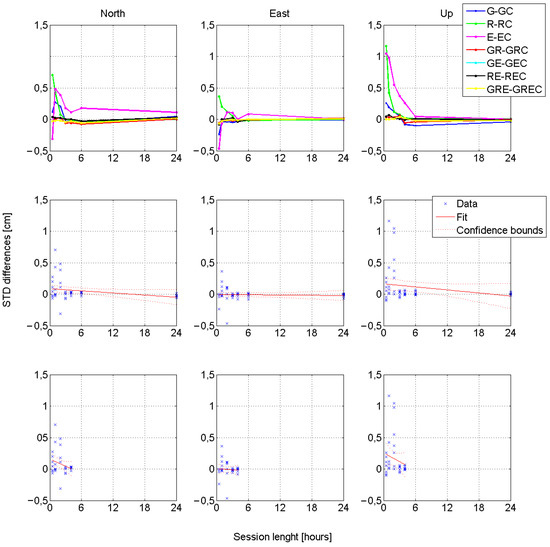
Figure 5.
SD coefficient differences. Upper subpolts present results of comparison SD obtained from solution without and with BeiDou observations, central subplots present linear regression plot for up to 24 h data; bottom subplots present linear regression plot for up to 4 h data.
As shown in Figure 5, in general, including BeiDou observations improves the results revealed in the SD coefficient reduction. This is especially visible for the Up component. For the horizontal components of the position, in some cases (especially in E-only processing), adding BeiDou observation may cause an increase in the SD (0.5 h of observation sessions). The obtained regression model coefficients for NEU coordinates are shown in Table 8.

Table 8.
The slope regression coefficient for SD differences.
These results also confirm that adding BeiDou observations positively affects the solutions and causes a reduction of SD in the case of all position components, with the increase of a session’s length. The most significant improvement was obtained for the North and Up components. In the SD case, adding BeiDou observables is especially beneficial for short sessions. Their absolute values calculated for 4 h data windows are, on average, six times higher than obtained for 24 h data windows. Nevertheless, it also should be noted that in the case of G-only and E-only processing variants adding BeiDou observations may increase the SD value. Such a situation occurred with horizontal position components for a 0.5-h session. The reason for the increase in SD for short sessions may be the small number of BeiDou satellites used in processing, their poor geometric distribution, and the lower accuracy of the precision products dedicated to this system. It should also be noted that the GAMP software used an ambiguity float solution approach. Such an approach generally causes greater dispersion of results and, consequently, a lower solution accuracy. Generally, in multi-GNSS variants, including BeiDou signals resulted in a reduction of the SD according to the formulas (in case of 4 h data window): −0.4 mm·h, −0.1 mm·h, −0.5 mm·h for North, East and Up position components, respectively. In the case of autonomous solution variants, for Galileo signals, we obtained a reduction of position differences equal to +0.4 mm·h, +1.1 mm·h, −2.4 mm·h for North, East, and Up position components, respectively (in the case of 4 h data window). For GLONASS observations, the corresponding values are: −2.0 mm·h, −1.0 mm·h, −2.7 mm·h. Finally, for GPS observations, the corresponding values are: −0.7 mm·h, +0.4 mm·h, −0.9 mm·h.
3.4. AUBG: Example Station Results Detailed Analysis
An additional analysis was conducted in the case of one randomly selected, example station. For this purpose, we chose the AUBG station, the first one on the station list. First of all, as was mentioned in the Introduction, the BeiDou-2 spacecrafts transmit the B1, B2, and B3 frequency bands while BeiDou-3 satellites transmit legacy B1 signals similar to the BeiDou-2 satellites, as well as modernized signals in the L1, E5, and B3 band. The transition from BeiDou-2 to BeiDou-3 can result in some challenges in fully utilizing its capabilities. In the GAMP software (official ver. 20 December 2017 made available for use under a GNU license), it manifests as the impossibility to use BeiDou-3 observations in dual-frequency PPP post-processing. The user can select a navigation system in a binary setup mode. On the other hand, official settings do not allow the selection of preferred signals to be processed [30]. Consequently, in our analysis, only BeiDou-2 observations contributed to solutions. Figure 6 presents BeiDou satellites’ visibility over central Europe for four elevation masks: 0 deg, 5 deg, 10 deg, and 15 deg in the case of all available BeiDou SVs and BeiDou-2 SVs only.
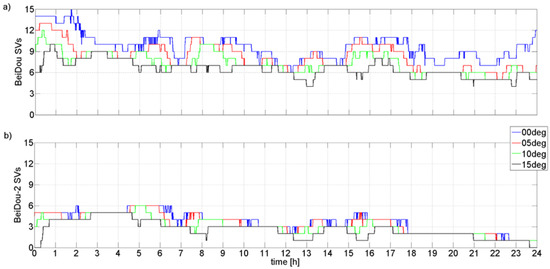
Figure 6.
BeiDou SVs visibility on AUBG station (day 1 in the 2021 year): (a) all available BeiDou SVs, (b) BeiDou-2 SVs.
The mean number of all visible BeiDou SVs (Figure 6) equals 9.7, 8.2, 7.3, and 6.5 for 0°, 5°, 10°, and 15° elevation masks, respectively. In the case of BeiDou-2 only SVs, the mean number of SVs dropped significantly and equals to 3.7, 3.4, 3.0, and 2.6 for 0°, 5°, 10°, and 15° elevation masks, respectively. Generally, the number of visible BeiDou-2 SVs recorded over Europa territory is relatively low and does not exceed 6. At 10 deg elevation mask, recommended for the GNSS observations processing, only between 2:30 to 4:45 a.m., the number of visible SVs exceeds 4. At all other time periods, there are only four or fewer satellites visible. Such a number is insufficient for precise and reliable PPP. Figure 7 shows the number of observed SVs and PDOP coefficients for all autonomous and full multi-GNSS variants adopted for the processing at a 10 deg elevation mask.
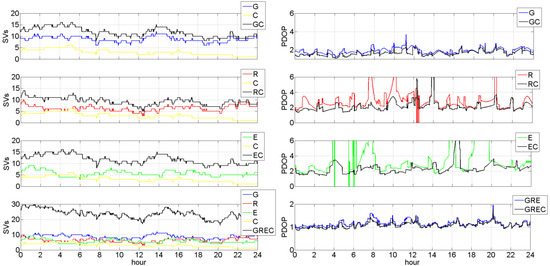
Figure 7.
Number of observed SVs and PDOP coefficients on AUBG station (day 1 in 2021 year).
According to data presented in Figure 7, the average numbers of observed satellites and calculated PDOP coefficients at station AUBG at doy 1 2021 are 8.7 and 1.9 for GPS-only; 6.2 and 35.4 for GLONASS-only; 5.6 and 6.1 for Galileo-only; 20.6 and 1.2 for GPS, GLONASS and Galileo combination, respectively. These PDOP results for the E-only and R-only solutions are not in agreement with the results presented in Table 4 and Table 5. This is because outliers have not been removed in the case of detailed analyses for AUBG stations.
Figure 8 shows the SD for all processing variants (AUBG station). As noted earlier, it is visible that adding of BeiDou observations is particularly beneficial for Galileo-only and GLONASS-only solutions (most significant SD reduction). This is true for almost all session lengths. However, for longer sessions, e.g., 24 h sessions for an E-only solution, adding BeiDou signals increased the SD coefficient (Up component). This can be explained be using the incomplete BeiDou constellation and the lower accuracy of the orbits and clocks products for the BeiDou satellites (compared to GPS ones).
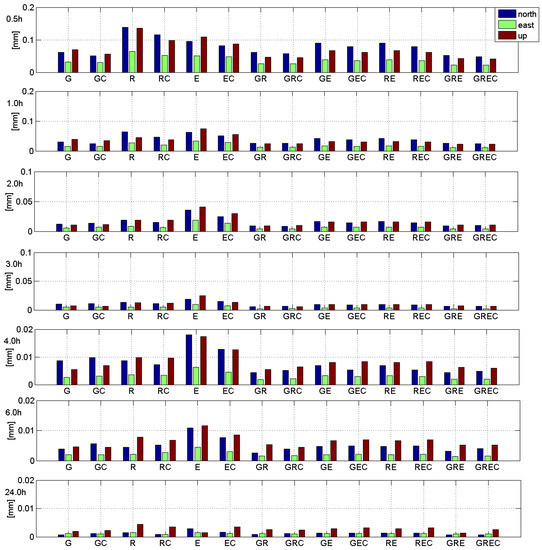
Figure 8.
Standard deviation for the position components differences time series: from 0.5 h session to 24 h session. Please note three different scales on vertical axis.
The mean differences of the position components, calculated as the differences between the mean NEU values estimated during PPP GNSS observations processing and the “true” values, are shown in Figure 9. In the AUBG station case, adding BeiDou observations are especially advantageous for all autonomous studies (most significant reduction in differences). However, it concerns mainly variants with short session lengths. It is not characteristic for all position components (e.g., for the E/EC solution, in the case of 0.5 h session, the difference for the U component increased significantly, and similar cases can be observed more. For longer sessions, on the other hand, the difference decreases only slightly, and this is not obvious in all cases. For some position components, differences grew visible after adding BeiDou signals (e.g., almost all 24 h variants).
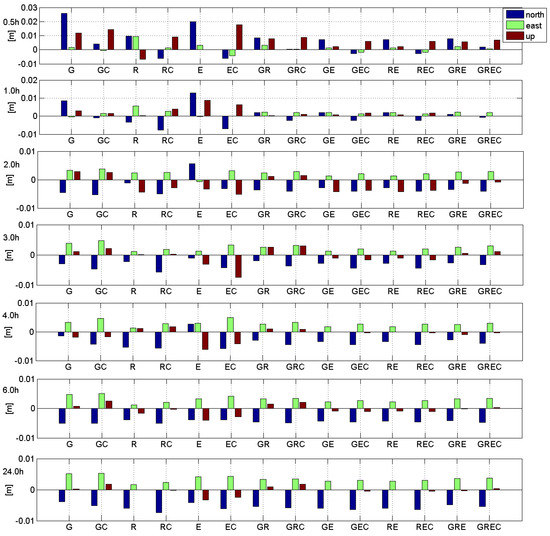
Figure 9.
Mean position components differences (AUBG station): from 0.5 h session to 24 h session. Please note three different scales on vertical axis.
A summarized analysis of the time series of position components differences for autonomous processing variants of AUBG station is presented in Figure 10 in Box Whisker Plots (BWPs).
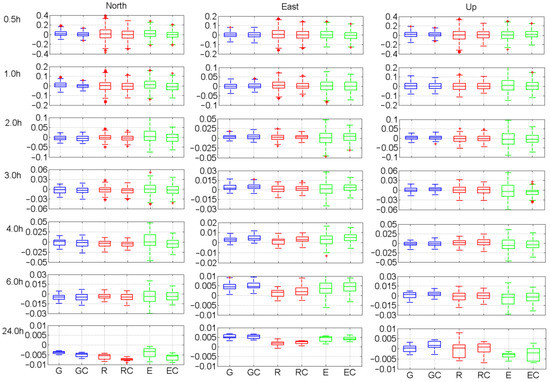
Figure 10.
Box whisker plots for time series of position components differences: from 0.5-h session to 24 h session. Please note the different scales on vertical axis.
Analyzing the respective variants of the solution, it can be seen that adding of BeiDou observations is particularly beneficial for Galileo-only and GLONASS-only cases (seen in an impressive reduction in the interquartile range). This is true for almost all cases. The only exception is 24-h data results obtained for Galileo (Up component). The reason can be using the incomplete BeiDou constellation and lower accuracy of orbits and clocks products for BeiDou satellites. Galileo-only and GLONASS-only studies are characterized by the most significant number of outlier observations, especially for short sessions. The BWP analysis also shows the effect of session length on reducing position differences. The interquartile range becomes noticeably smaller with the increase in the session length. Different results were obtained for GPS-only solutions. In the case of these variants, the improvement of the results caused by adding BeiDou observations is not so noticeable. In some cases, adding BeiDou signals causes a slight worsening of results (it concerns mainly longer observation sessions). As mentioned before, that can be caused by the lower accuracy of orbits and clocks for Beidou satellites. Analyzing the results for respective position components, it can be seen that the best results were obtained for East, slightly worse for North, and finally, the worst for the Up component (the range of the interquartile range). Weaker results for the Up component are expected as a result of the general characteristics of measurements using GNSS system (geometric dependence between satellites and position components). The GPS-only solution is also characterized by the highest consistency of the mean value of position components. In the case of the other two autonomous or autonomous variants plus observations from Beidou satellites, it can be seen shifts of average position value, which can be caused by lower accuracy of precise products for these systems [36,37].
In the next step, the results obtained for the shortest sessions (0.5 h and 1.0 h) were presented using cumulative histograms in Figure 11. This was conducted to get a more detailed insight into differences visible in results obtained in three autonomous processing variants. In this case, the variants of the autonomous processing and their corresponding studies with adding BeiDou observations were analyzed.
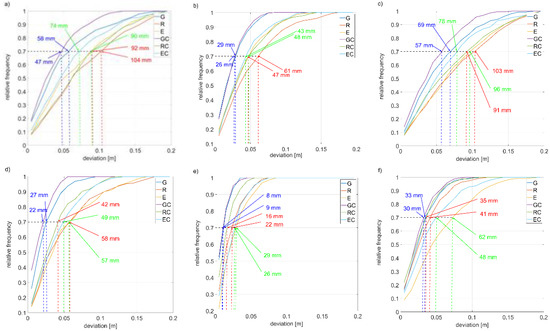
Figure 11.
Cumulative histograms for 0.5- (a) North, (b) East, (c) Up, and 1.0-h, (d) North, (e) East, (f) Up, session for autonomous solution.
Comparing the graphs showing the distribution of residuals for solutions without and with BeiDou observations (Figure 11) shows that adding BeiDou observations positively affects the solution. If we focus on the 70% of relative frequency, it can be seen that residual deviations reduce significantly when BeiDou observables are added. This is especially visible for the 0.5 h session and the R-only and E-only processing in the case of 1.0 h sessions. From the graphs, it can also be seen a significantly faster trend of residuals to 1 (100%) for the GPS-only observations, which is in line with the previous analysis. Additionally, it can be observed that the East component has a better distribution of residues than the North and Up examples.
Our results prove, like the previous studies [16,17,18,19,20], improvements in accuracy for combined PPP. Accuracy also increases significantly as a function of the length of the observation session. However, it should be noted that some limitations may affect achieving the highest accuracy when using the GAMP software. In the used version, GAMP runs processing based only on BeiDou-2 observations.
Our results also prove that PPP technique, for 6-h or longer sessions, is able to provide positions with an accuracy comparable to the differential GNSS technique [38].
4. Conclusions
This study addressed a scientific question on the potential usability of open-source software for PPP analysis. We focused on analyzing the performance of the open-source software GAMP, in particular, the effect of adding BeiDou observations on the obtained position. The second main goal was to evaluate the impact of BeiDou observations on the accuracy of multi-GNSS PPP-derived positions as a function of observing session duration within Europe.
The obtained results prove that including the BeiDou observations to the solution brings measurable improvements, which can be observed in the reduction of differences between estimated and true coordinates and in the reduction of the SD coefficient. Improved accuracy of the solution is obvious for short observation sessions (in the range of 0.5 to 2.0 h) as well as in the case of autonomous positioning (especially GLONASS-only and Galileo-only). On the other hand, in case of a 24-h session, adding BeiDou observations can negatively affect results. This can be explained be using the incomplete BeiDou constellation and by the lower accuracy of the orbits and clocks products for the BeiDou satellites (compared to GPS ones).
The paper also discussed the reduction of the difference between the true and the estimated coordinate in a function of the observation session duration. Generally, based on regression coefficients calculated using data from all the stations, it was found that in the case of a 24-h observation window, improvements in coordinate estimation equal: −0.014, −0.003, −0.003 cm/h for North, East, and Up components, respectively. In the case of a 4-h observation window, improvements in coordinate estimation are visibly more significant and equal to −0.077, −0.011 and −0.016 cm/h for North, East, and Up components, respectively. Corresponding results were obtained for SD. Finally, it should be noted that significantly bigger improvements can be expected in the case of autonomous positioning, especially R-only and E-only.
Additionally, we would like to remind that the BeiDou system is in the process of modernization, which results in some challenges in utilizing its capabilities fully. In the official GAMP software (ver. 20 December 2017), it manifests in the impossibility of using BeiDou-3 observations in dual-frequency PPP post-processing. Using the full potential of BeiDou, which in the GAMP case should be possible after a software upgrade, certainly improves the presented results. Some authors report significant improvements of solution when BeiDeo-2 only data are replaced by BeiDou_2+3 observations [39].
Author Contributions
Conceptualization, K.D.; methodology, K.D.; software, K.D.; validation, K.D. and M.B.; formal analysis, K.D.; investigation, K.D.; resources, K.D.; data curation, K.D.; writing—original draft preparation, K.D.; writing—review and editing, K.D. and M.B.; visualization, K.D.; supervision, K.D. and M.B.; project administration, K.D.; funding acquisition, K.D. All authors have read and agreed to the published version of the manuscript.
Funding
This research was funded by the University of Warmia and Mazury in Olsztyn.
Institutional Review Board Statement
Not applicable.
Informed Consent Statement
Not applicable.
Data Availability Statement
All GNSS data (RINEX and ephemeris files) used during the study are available online in accordance with funder data retention policies (RINEX: ftp://ftp.epncb.oma.be/pub/obs/, accessed on 30 June 2021; ephemeris: ftp://cddis.gsfc.nasa.gov/pub/gps/products/mgex/, accessed on 30 June 2021). All other data are available from the corresponding author upon reasonable request.
Acknowledgments
The authors grateful acknowledge the EPN providers for the RINEX observation files. We also thank the Centre of Orbit Determination in Europe (CODE) for providing high accurate GNSS products. Special thank for Zhou et al. for free sharing of the GAMP software.
Conflicts of Interest
The authors declare no conflict of interest.
References
- Ye, J.; Li, Y.; Luo, H.; Wang, J.; Chen, W.; Zhang, Q. Hybrid Urban Canyon Pedestrian Navigation Scheme Combined PDR, GNSS and Beacon Based on Smartphone. Remote Sens. 2019, 11, 2174. [Google Scholar] [CrossRef]
- Parente, C.; Meneghini, C. Advantages of Multi GNSS Constellation: GDOP Analysis for GPS, GLONASS and Galileo Combinations. Int. J. Eng. Technol. Innov. 2017, 7, 1–10. [Google Scholar]
- Yang, L.; Wang, Z.; Zhou, L.; Zhu, Y. The analysis on geometry dilution of precision for multi-GNSS. In Proceedings of the 2014 IEEE International Conference on Signal Processing, Communications and Computing (ICSPCC), Guilin, China, 5–8 August 2014; pp. 762–766. [Google Scholar]
- Yu, X.; Gao, J. Kinematic Precise Point Positioning Using Multi-Constellation Global Navigation Satellite System (GNSS) Observations. ISPRS Int. J. Geo-Inf. 2017, 6, 6. [Google Scholar] [CrossRef]
- Zhao, L.; Blunt, P.; Yang, L. Performance Analysis of Zero-Difference GPS L1/L2/L5 and Galileo E1/E5a/E5b/E6 Point Positioning Using CNES Uncombined Bias Products. Remote Sens. 2022, 14, 650. [Google Scholar] [CrossRef]
- Jiao, G.; Song, S.; Ge, Y.; Su, K.; Liu, Y. Assessment of BeiDou-3 and Multi-GNSS Precise Point Positioning Performance. Sensors 2019, 19, 2496. [Google Scholar] [CrossRef]
- Liu, G.; Guo, F.; Wang, J.; Du, M.; Qu, L. Triple-Frequency GPS Un-Differenced and Uncombined PPP Ambiguity Resolution Using Observable-Specific Satellite Signal Biases. Remote Sens. 2020, 12, 2310. [Google Scholar] [CrossRef]
- Zhu, J.; Liu, Y.; Wang, B.; Ye, S. Improved Method for GLONASS Long Baseline Ambiguity Resolution without Inter-Frequency Code Bias Calibration. Remote Sens. 2018, 10, 1223. [Google Scholar] [CrossRef]
- Wielgosz, P.; Hadaś, T.; Kłos, A.; Paziewski, J. Research on GNSS positioning and applications in Poland in 2015–2018. Geod. Cartogr. 2019, 1, 87–119. [Google Scholar] [CrossRef]
- Michel, A.; Santamaría-Gómez, A.; Boy, J.-P.; Perosanz, F.; Loyer, S. Analysis of GNSS Displacements in Europe and Their Comparison with Hydrological Loading Models. Remote Sens. 2021, 13, 4523. [Google Scholar] [CrossRef]
- Nykiel, G.; Figurski, M.; Bałdysz, Z. Analysis of GNSS sensed precipitable water vapour and tropospheric gradients during the derecho event in Poland of 11th August 2017. J. Atmos. Sol.-Terr. Phys. 2019, 193, 105082. [Google Scholar] [CrossRef]
- Zhou, W.; Cai, H.; Chen, G.; Jiao, W.; He, Q.; Yang, Y. Multi-GNSS Combined Orbit and Clock Solutions at iGMAS. Sensors 2022, 22, 457. [Google Scholar] [CrossRef] [PubMed]
- Cai, C.; Gao, Y. Precise point positioning using combined GPS and GLONASS observations. J. Glob. Position. Syst. 2007, 6, 13–22. [Google Scholar] [CrossRef]
- Pandey, D.; Dwivedi, R.; Dikshit, O.; Singh, A.K. GPS and GLONASS combined static precise point positioning (PPP). Int. Arch. Photogramm. Remote Sens. Spat. Inf. Sci. 2016, 41, 483–488. [Google Scholar] [CrossRef]
- Angrisano, A.; Gaglione, S.; Gioia, C. Performance assessment of GPS/GLONASS single point positioning in an urban environment. Acta Geod. Geophys. 2013, 48, 149–161. [Google Scholar] [CrossRef]
- Martín, A.; Anquela, A.B.; Capilla, R.; Berné, J.L. PPP technique analysis based on time convergence, repeatability, IGS products, different software processing, and GPS+GLONASS constellation. J. Surv. Eng. 2011, 137, 99–108. [Google Scholar] [CrossRef]
- Cai, C.; Gao, Y. Modeling and assessment of combined GPS/GLONASS precise point positioning. GPS Solut. 2013, 17, 223–236. [Google Scholar] [CrossRef]
- Choy, S.; Zhang, S.; Lahaye, F.; Héroux, P. A comparison between GPS-only and combined GPS+GLONASS Precise Point Positioning. J. Spat. Sci. 2013, 58, 169–190. [Google Scholar] [CrossRef]
- Yigit, C.O.; Gikas, V.; Alcay, S.; Ceylan, A. Performance evaluation of short to long term GPS, GLONASS and GPS/GLONASS postprocessed PPP. Surv. Rev. 2014, 46, 155–166. [Google Scholar] [CrossRef]
- Malik, J.S. Performance analysis of static precise point positioning using open-source GAMP. Artif. Satell. 2020, 55, 41–60. [Google Scholar] [CrossRef]
- Wang, M.; Chai, H.; Li, Y. Performance analysis of BDS/GPS precise point positioning with undifferenced ambiguity resolution. Adv. Space Res. 2017, 60, 2581–2595. [Google Scholar] [CrossRef]
- Zhao, X.; Wang, S.; Liu, C.; Ou, J.; Yu, X. Assessing the performance of multi-GNSS precise point positioning in Asia-Pacific region. Surv. Rev. 2017, 49, 186–196. [Google Scholar] [CrossRef]
- Xia, F.; Ye, S.; Xia, P.; Zhao, L.; Jiang, N.; Chen, D.; Hu, G. Assessing the latest performance of Galileo-only PPP and the contribution of Galileo to Multi-GNSS PPP. Adv. Space Res. 2019, 63, 2784–2795. [Google Scholar] [CrossRef]
- Afifi, A.; El-Rabbany, A. Precise point positioning using triple GNSS constellations in various modes. Sensors 2016, 16, 779. [Google Scholar] [CrossRef] [PubMed]
- Guo, J.; Li, X.; Chen, X.; Geng, J.; Wen, Q.; Pan, Y. Performance Analysis of Multi-GNSS Precise Point Positioning. In China Satellite Navigation Conference; Springer: Singapore, 2017. [Google Scholar]
- Abd Rabbou, M.; El-Rabbany, A. Performance analysis of precise point positioning using multi-constellation GNSS: GPS, GLONASS, Galileo and BeiDou. Surv. Rev. 2017, 49, 39–50. [Google Scholar] [CrossRef]
- Kiliszek, D.; Kroszczyński, K.A. Performance of the Precise Point Positioning Method along with the Development of GPS, GLONASS and Galileo Systems. Measurement 2020, 164, 108009. [Google Scholar] [CrossRef]
- Alkan, R.M.; İlçi, V.; Ozulu, İ.M.; Saka, M.H. A comparative study for accuracy assessment of PPP technique using GPS and GLONASS in urban areas. Measurement 2015, 69, 1–8. [Google Scholar] [CrossRef]
- Ogutcu, S. Assessing the contribution of Galileo to GPS+GLONASS PPP: Towards full operational capability. Measurement 2020, 151, 107143. [Google Scholar] [CrossRef]
- Zhou, F.; Dong, D.; Li, W.; Jiang, X.; Wickert, J.; Schuh, H. GAMP: An open-source software of multi-GNSS precise point positioning using undifferenced and uncombined observations. GPS Solut. 2018, 22, 33. [Google Scholar] [CrossRef]
- Pengfei, C.; Wei, L.; Jinzhong, B.; Hanjiang, W.; Yanhui, C.; Hua, W. Performance of precise point positioning (PPP) based on uncombined dual-frequency GPS observables. Surv. Rev. 2011, 43, 343–350. [Google Scholar] [CrossRef]
- Lyard, F.; Lefevre, F.; Letellier, T.; Francis, O. Modelling the global ocean tides: Modern insights from FES2004. Ocean. Dyn. 2006, 56, 394–415. [Google Scholar] [CrossRef]
- Wang, N.; Yuan, Y.; Li, Z.; Montenbruck, O.; Tan, B. Determination of differential code biases with multi-GNSS observations. J. Geodesy 2016, 90, 209–228. [Google Scholar] [CrossRef]
- Eckl, M.; Snay, R.; Soler, T.; Cline, M.W.; Mader, G.L. Accuracy of GPS-derived relative positions as a function of interstation distance and observing-session duration. J. Geodesy 2001, 75, 633–640. [Google Scholar] [CrossRef]
- Ollikainen, M. Determination of Orthometric Heights Using GPS Levelling; Finnish Geodetic Institute: Kirkkonummi, Finland, 1997; No. 123; ISSN 0085-6932. [Google Scholar]
- Lou, Y.; Dai, X.; Gong, X.; Li, C.; Qing, Y.; Liu, Y.; Peng, Y.; Gu, S. A review of real-time multi-GNSS precise orbit determination based on the filter method. Satell Navig. 2022, 3, 15. [Google Scholar] [CrossRef]
- Tan, B.; Yuan, Y.; Ai, Q.; Zha, J. Real-Time Multi-GNSS Precise Orbit Determination Based on the Hourly Updated Ultra-Rapid Orbit Prediction Method. Remote Sens. 2022, 14, 4412. [Google Scholar] [CrossRef]
- Bazanowski, M.; Szostak-Chrzanowski, A.; Chrzanowski, A. Determination of GPS Session Duration in Ground Deformation Surveys in Mining Areas. Sustainability 2019, 11, 6127. [Google Scholar] [CrossRef]
- Hu, J.; Li, P.; Zhang, X.; Bisnath, S.; Pan, L. Precise point positioning with BDS-2 and BDS-3 constellations: Ambiguity reso-lution and positioning comparison. Adv. Space Res. 2022, 70, 1830–1846. [Google Scholar] [CrossRef]
Disclaimer/Publisher’s Note: The statements, opinions and data contained in all publications are solely those of the individual author(s) and contributor(s) and not of MDPI and/or the editor(s). MDPI and/or the editor(s) disclaim responsibility for any injury to people or property resulting from any ideas, methods, instructions or products referred to in the content. |
© 2022 by the authors. Licensee MDPI, Basel, Switzerland. This article is an open access article distributed under the terms and conditions of the Creative Commons Attribution (CC BY) license (https://creativecommons.org/licenses/by/4.0/).