Research on Generalized RQD of Rock Mass Based on 3D Slope Model Established by Digital Close-Range Photogrammetry
Abstract
:1. Introduction
2. Materials and Methods
2.1. Study Area
2.2. Discontinuity Information Acquisition by Digital Close-Range Photogrammetry
2.3. Three-Dimensional Disk Model of Rock Mass Discontinuities
2.4. Generalized RQD Eliminating the Influence of Measurement Blank Areas
2.4.1. Filling of Measurement Blank Areas
2.4.2. Calculation Model of Generalized RQD
- Calculation of Generalized RQD on a Single Surveying Line
- Comprehensive Generalized RQD of Rock Mass
3. Results
4. Discussion
5. Conclusions
- The measurement data of discontinuities of a slope were obtained using digital close-range photogrammetry, and the generalized RQD of rock mass was calculated. Compared with the traditional method of using data from manual measurements to build a three-dimensional network model of discontinuities and then obtaining RQD, the proposed method does not need to simulate a three-dimensional network of discontinuities and avoids possible damage to data accuracy in this process. On the other hand, laying surveying lines parallel to three axes effectively avoids the shortcomings of the borehole method, which has difficulty reflecting the anisotropy of rock mass due to the limitations of direction and quantity.
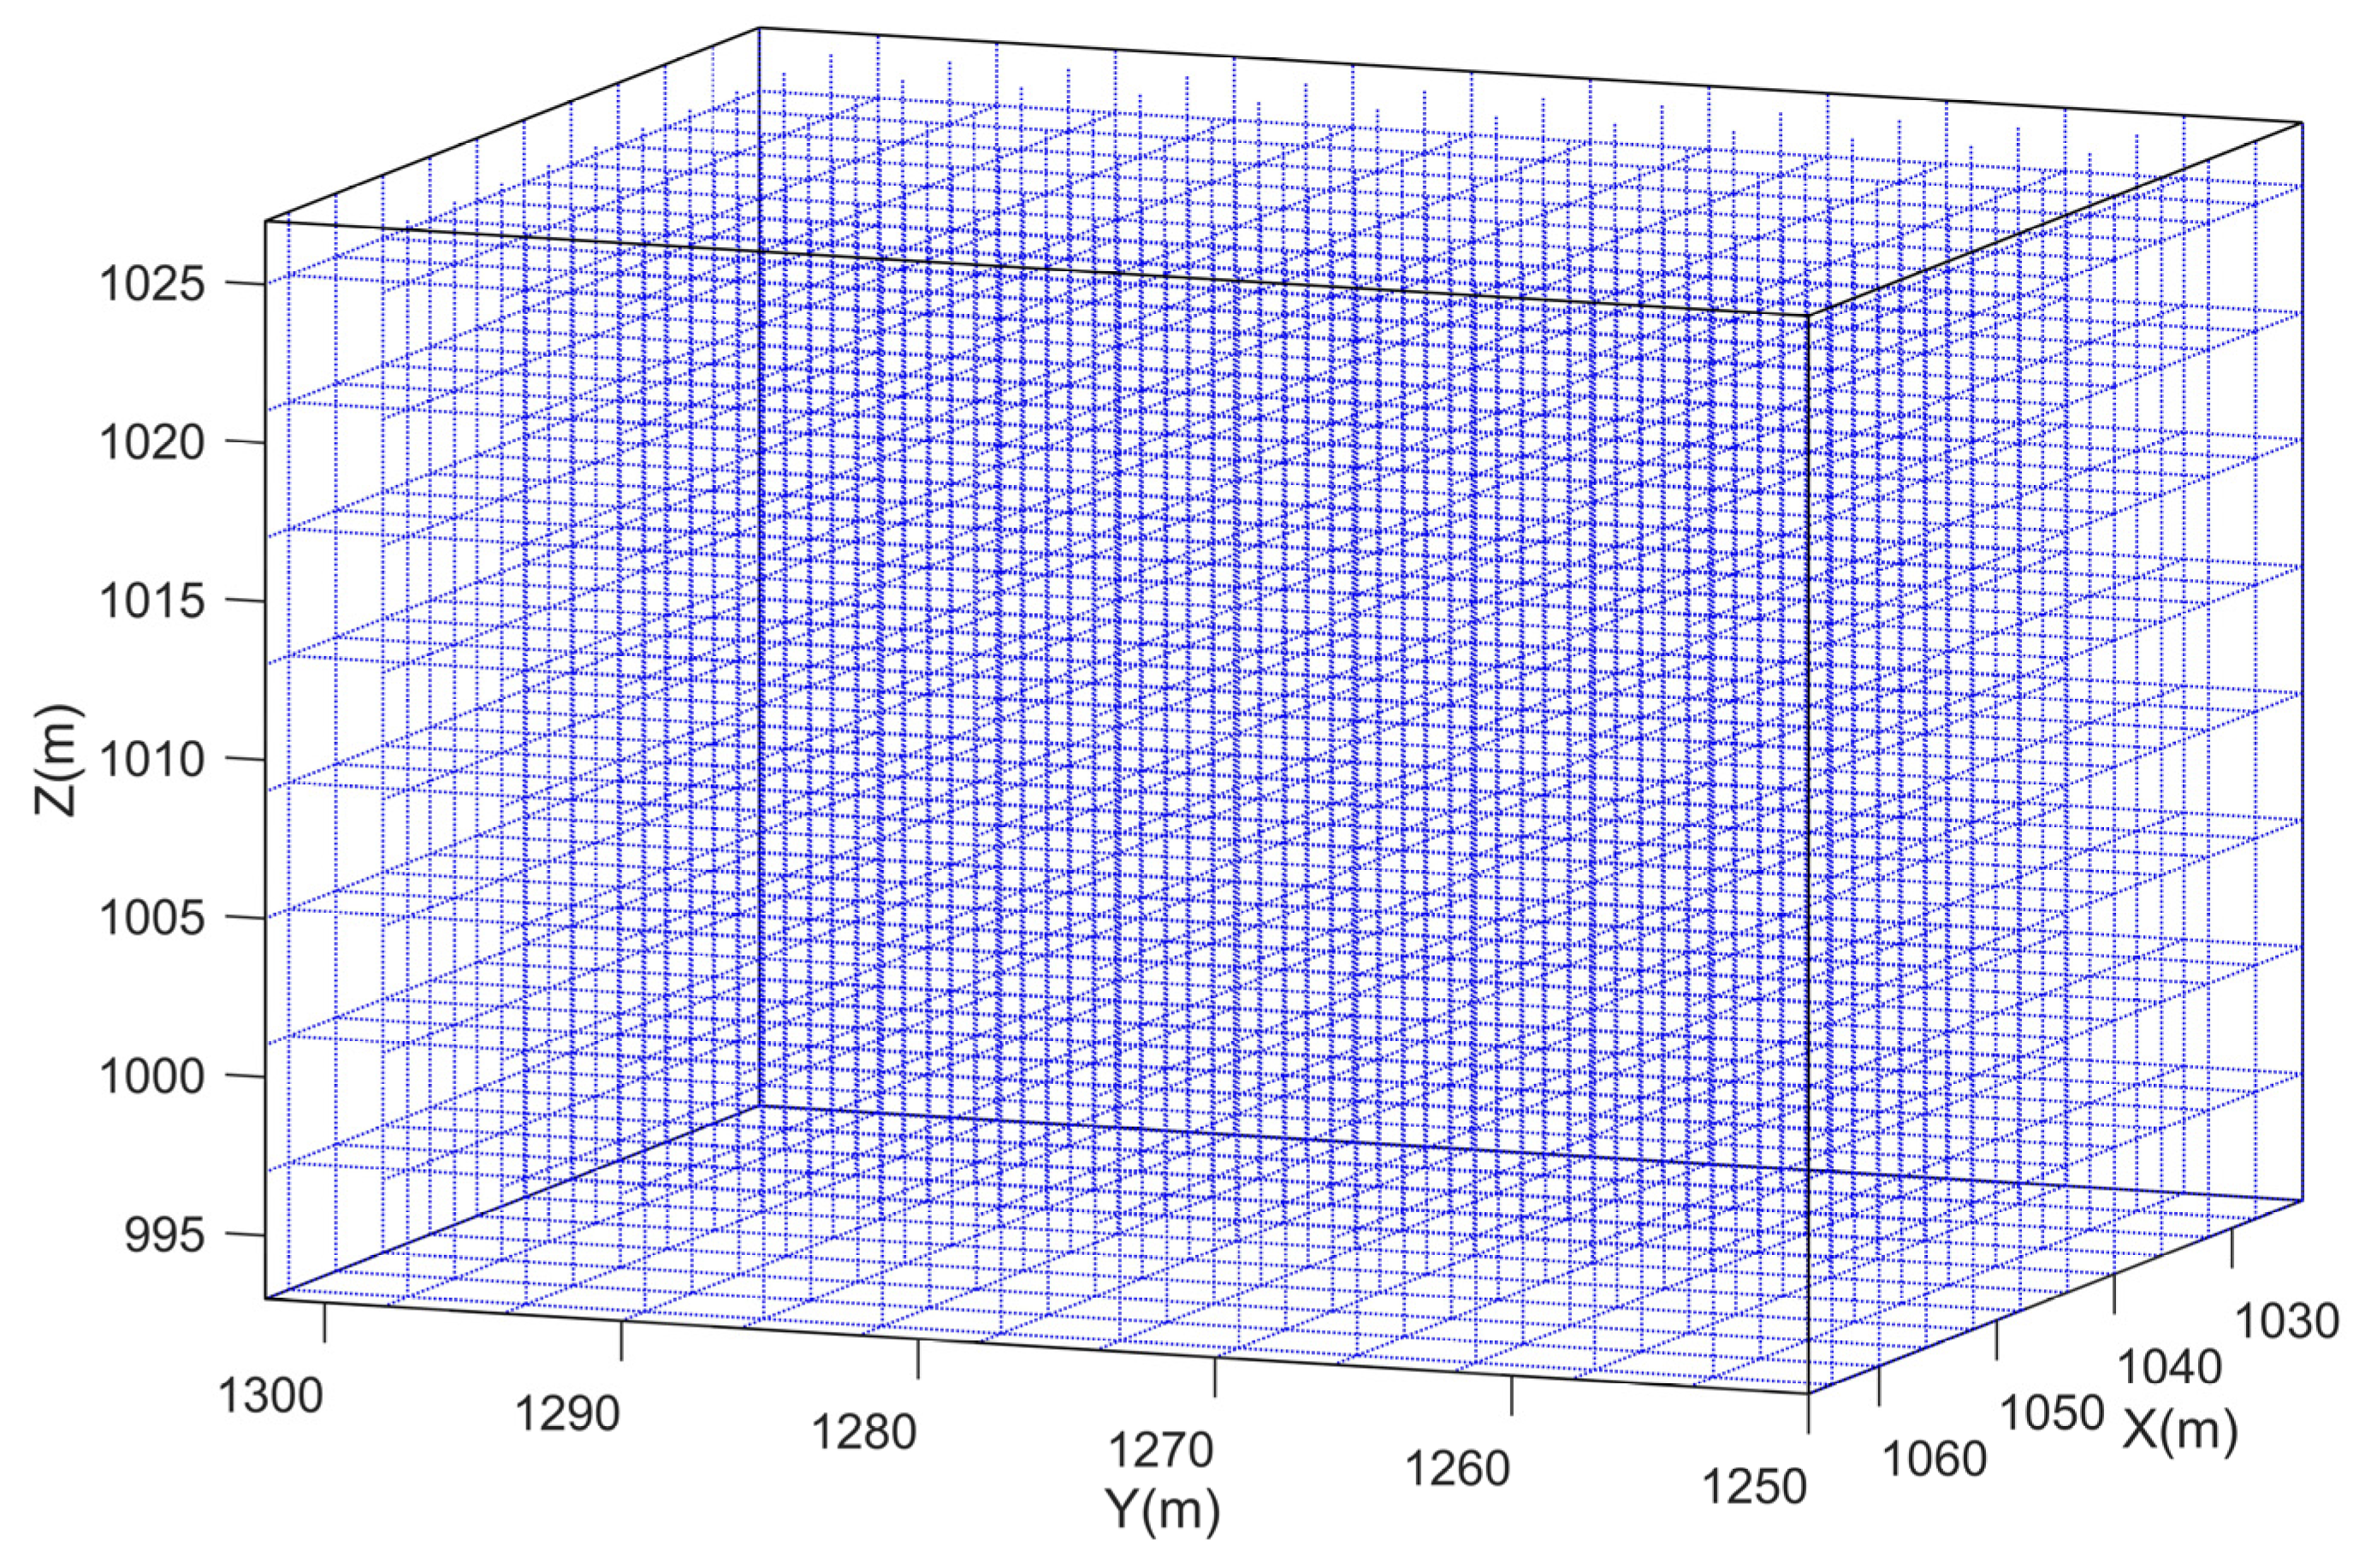
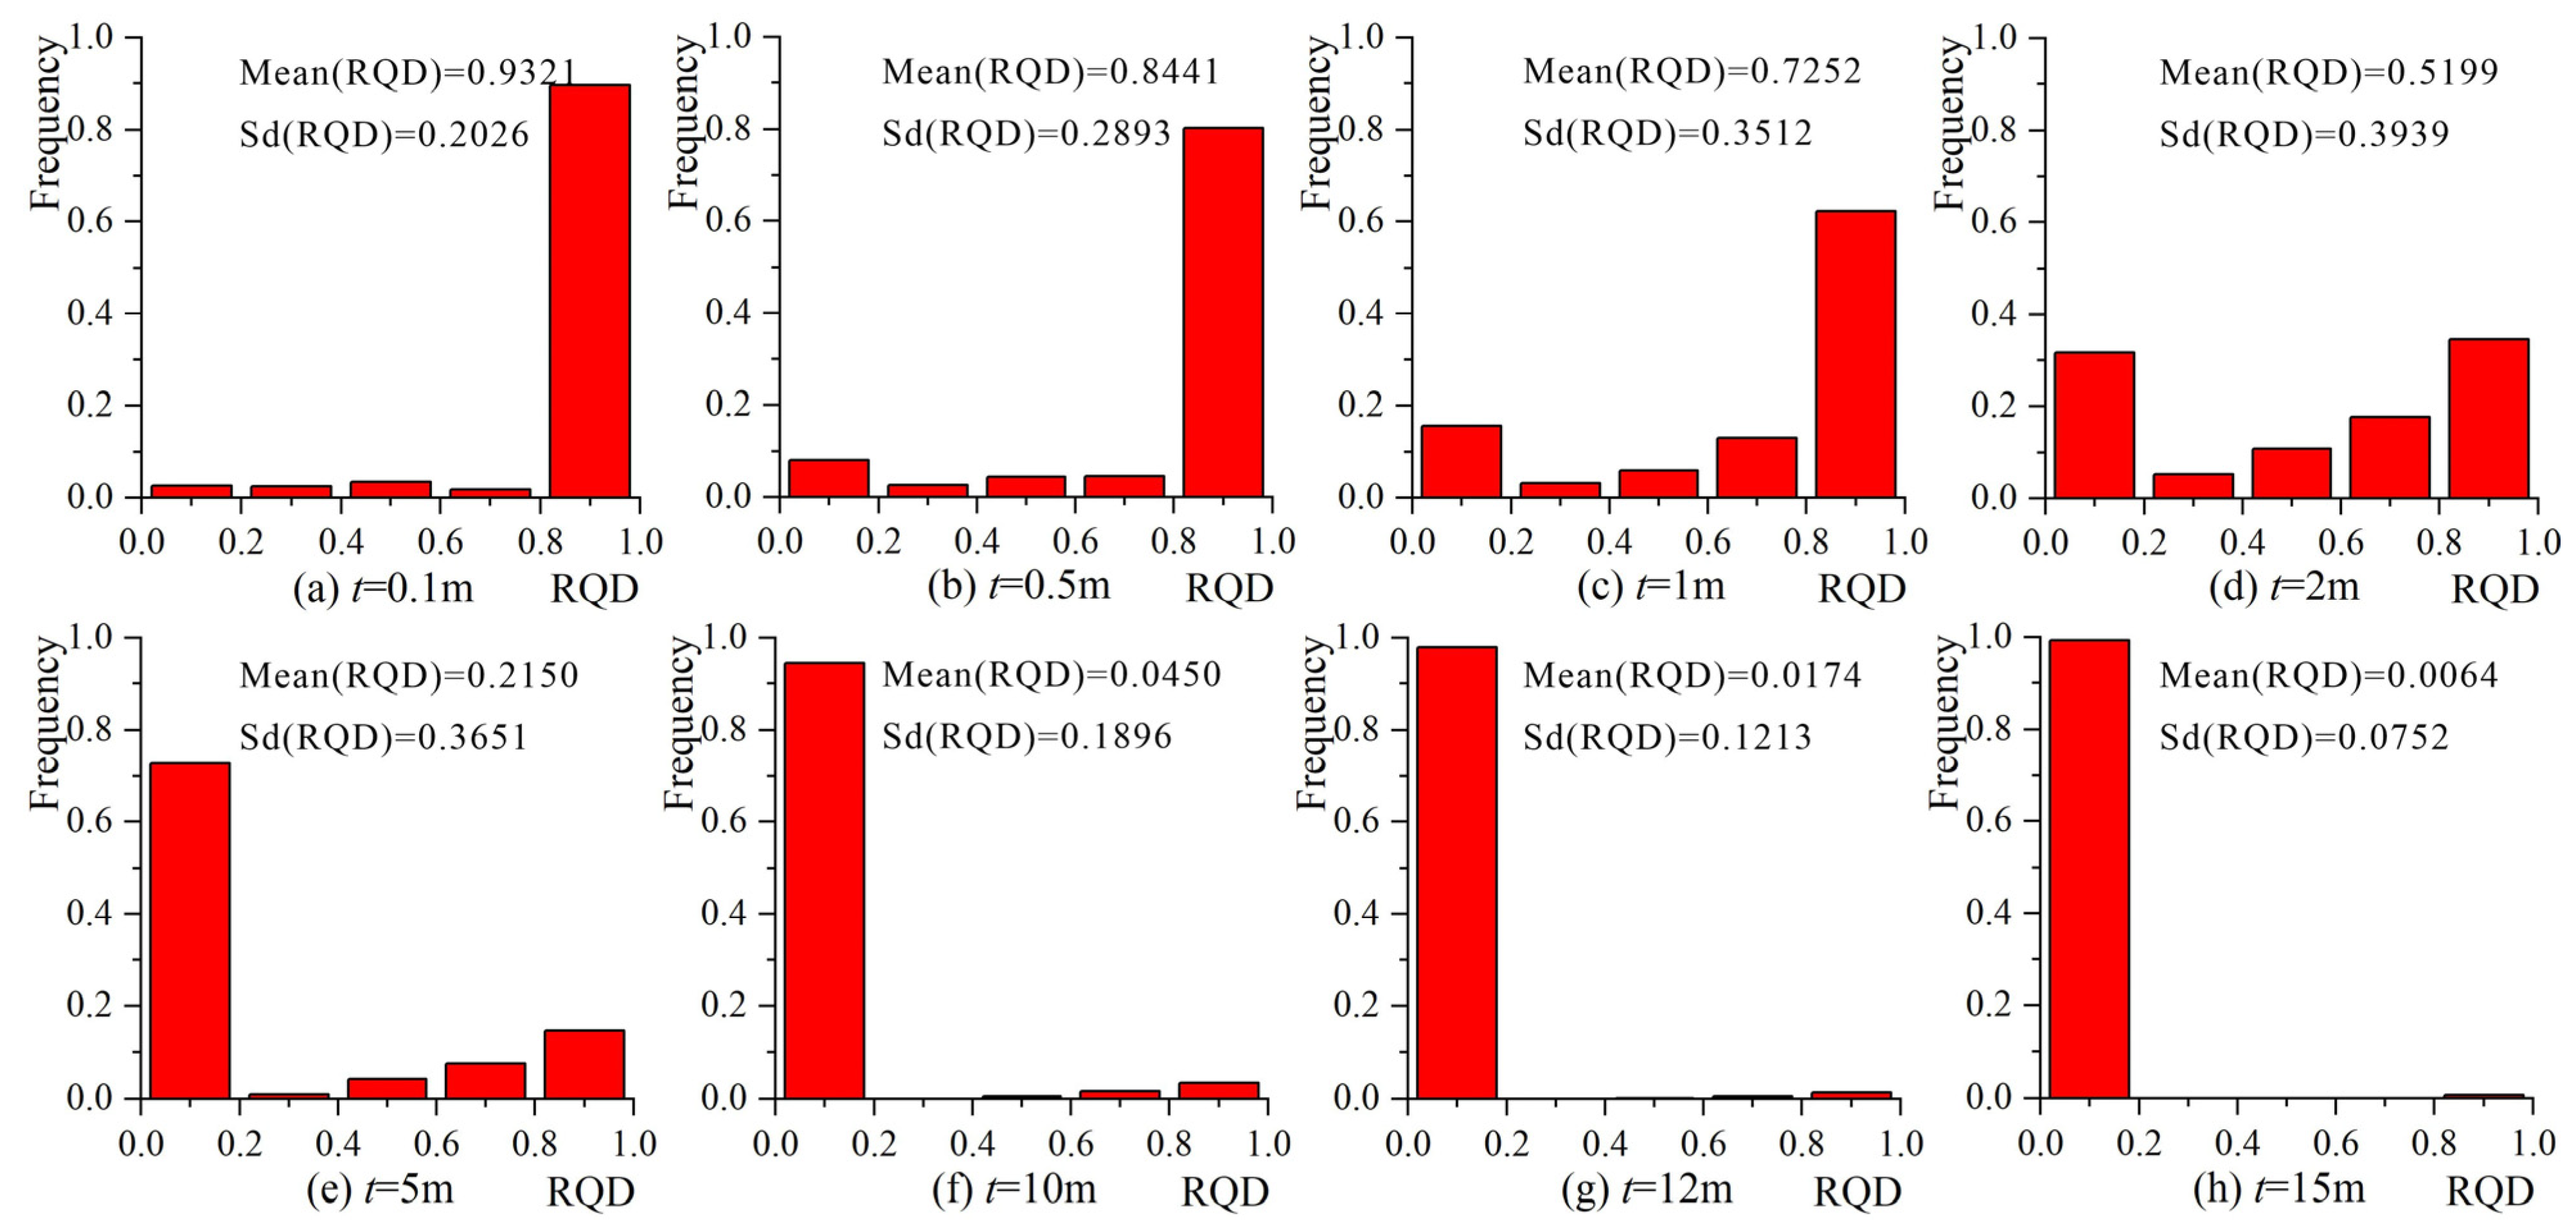
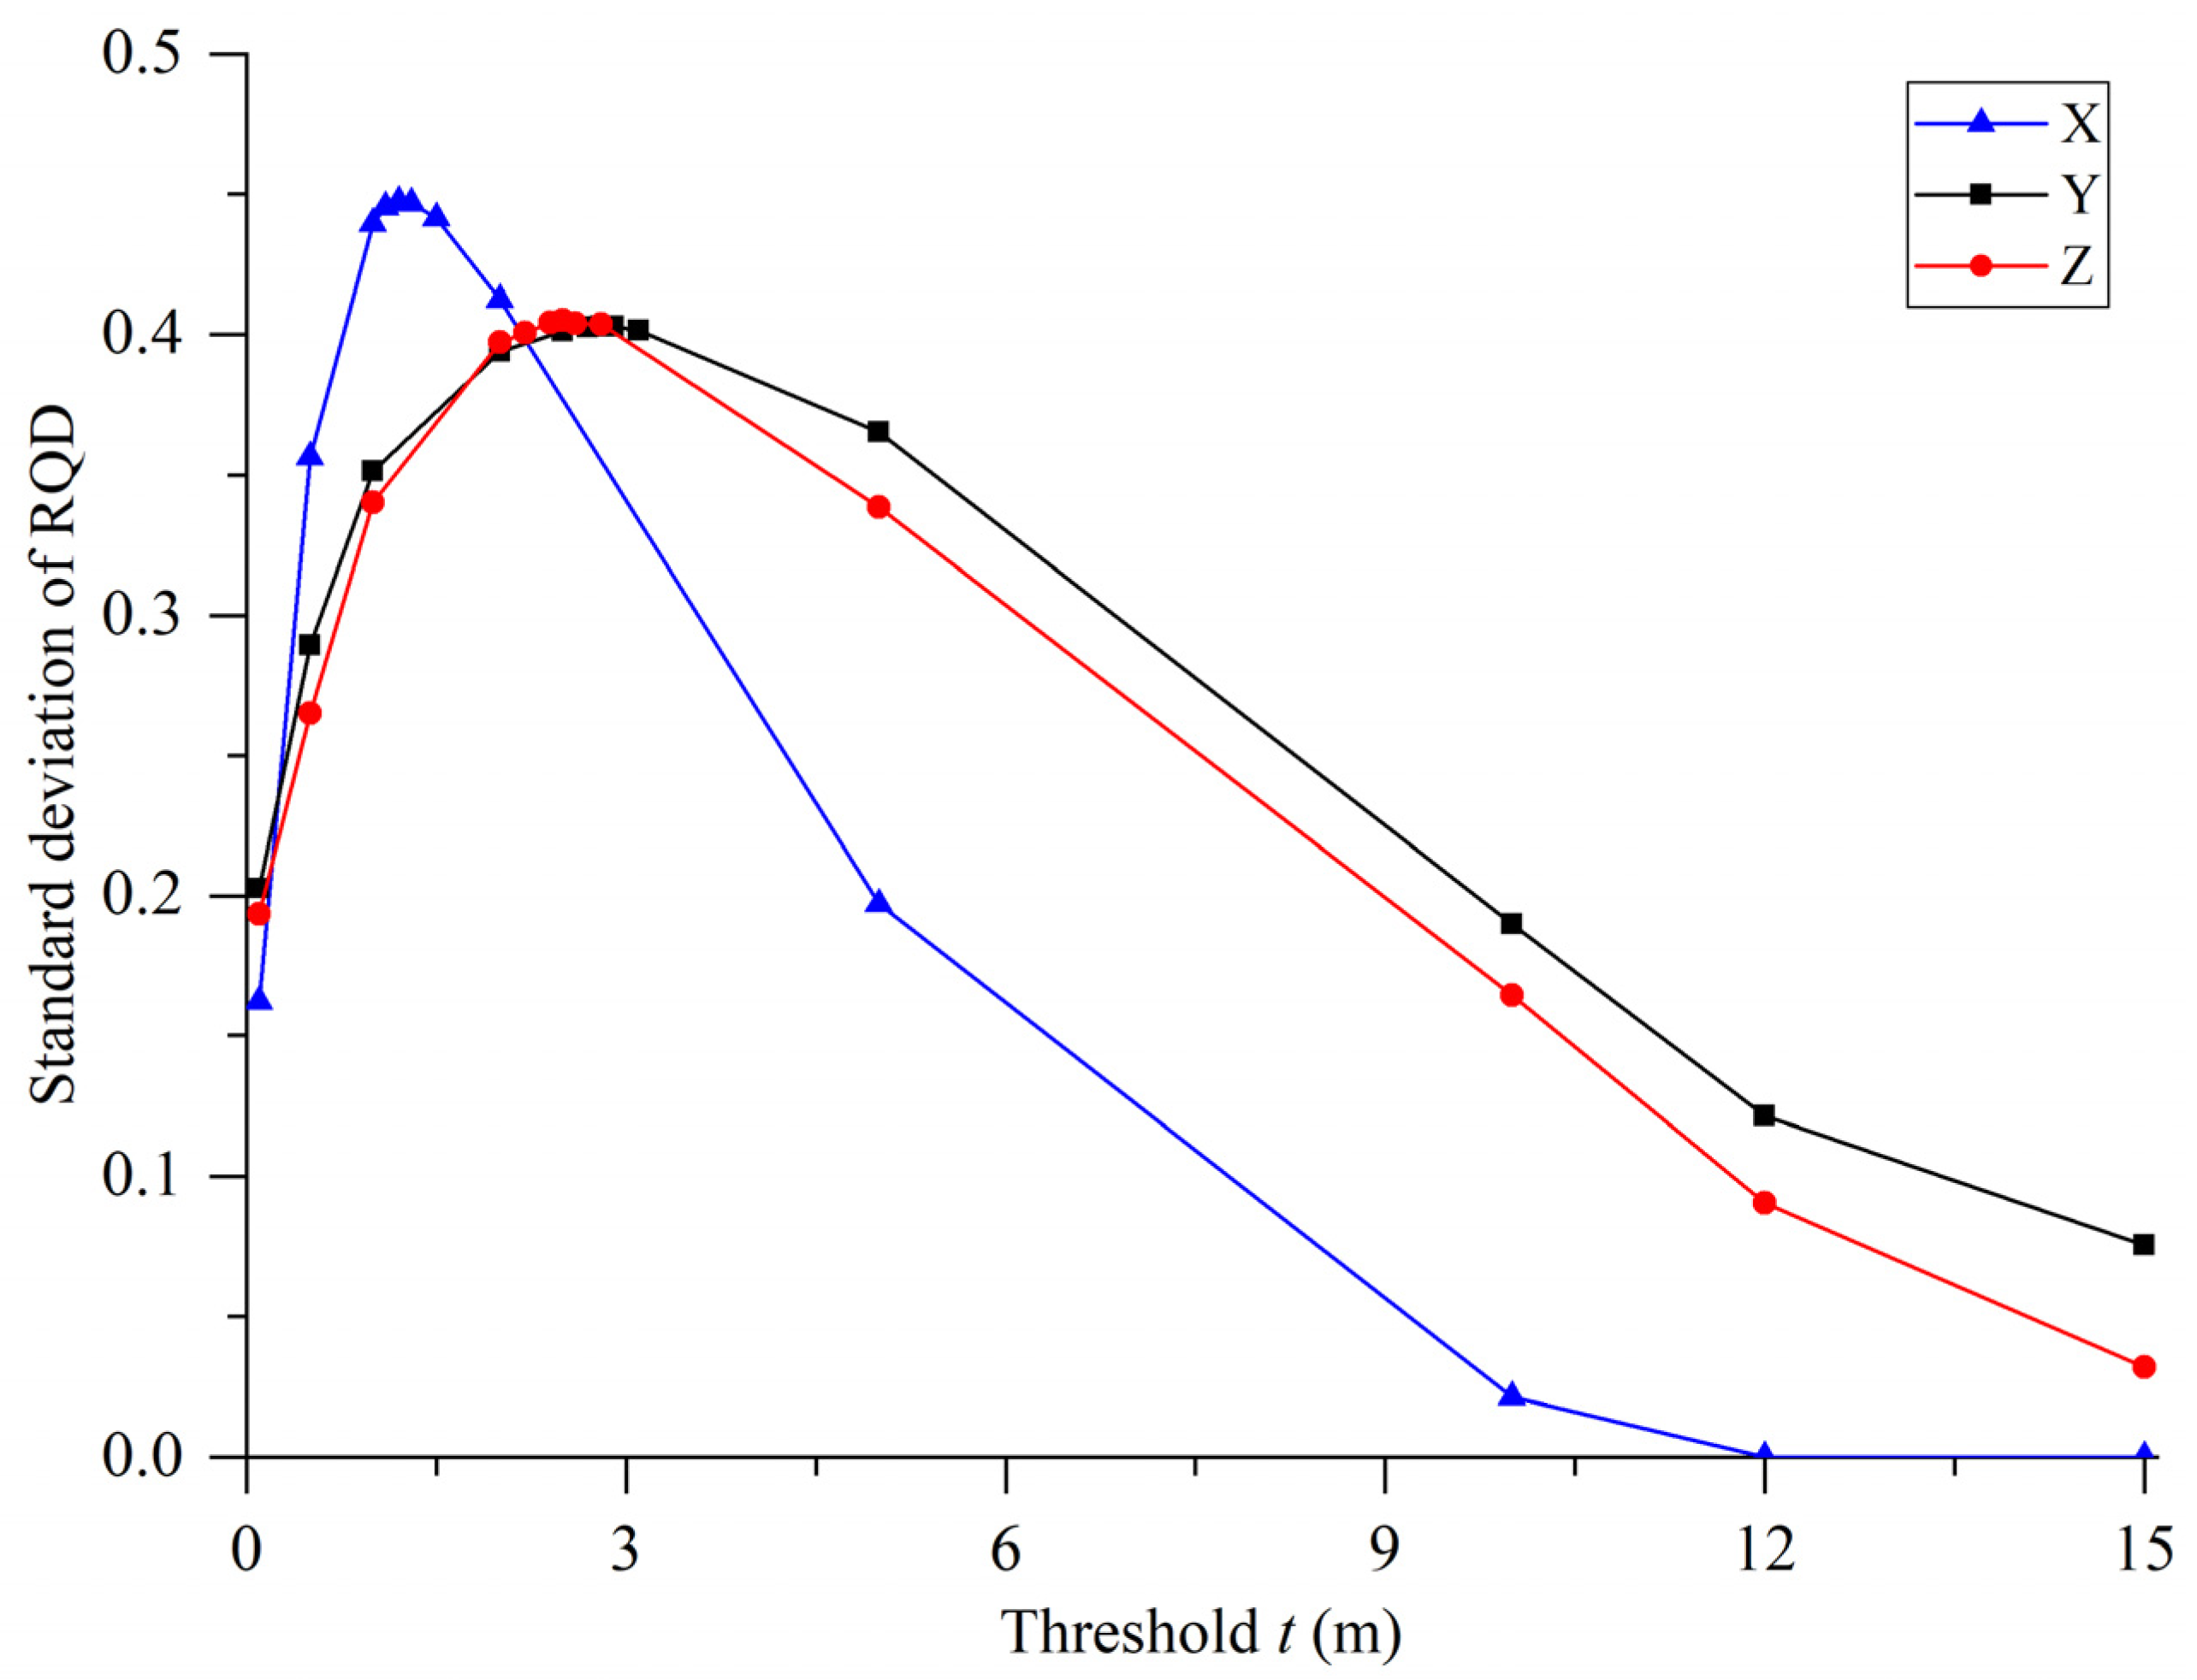
- According to the anisotropy and heterogeneity of rock mass, the principle of maximum standard deviation of RQD was determined. When several surveying lines are laid parallel to the same direction, the threshold of discontinuity spacing t corresponding to the maximum standard deviation of RQD values obtained by all lines is the optimal threshold. For the research slope in this paper, 0.5 m was set as the distance between surveying lines laid parallel to the X-, Y-, and Z-axes, and the optimal discontinuity spacing thresholds were 1.2, 2.8, and 2.5 m, respectively.
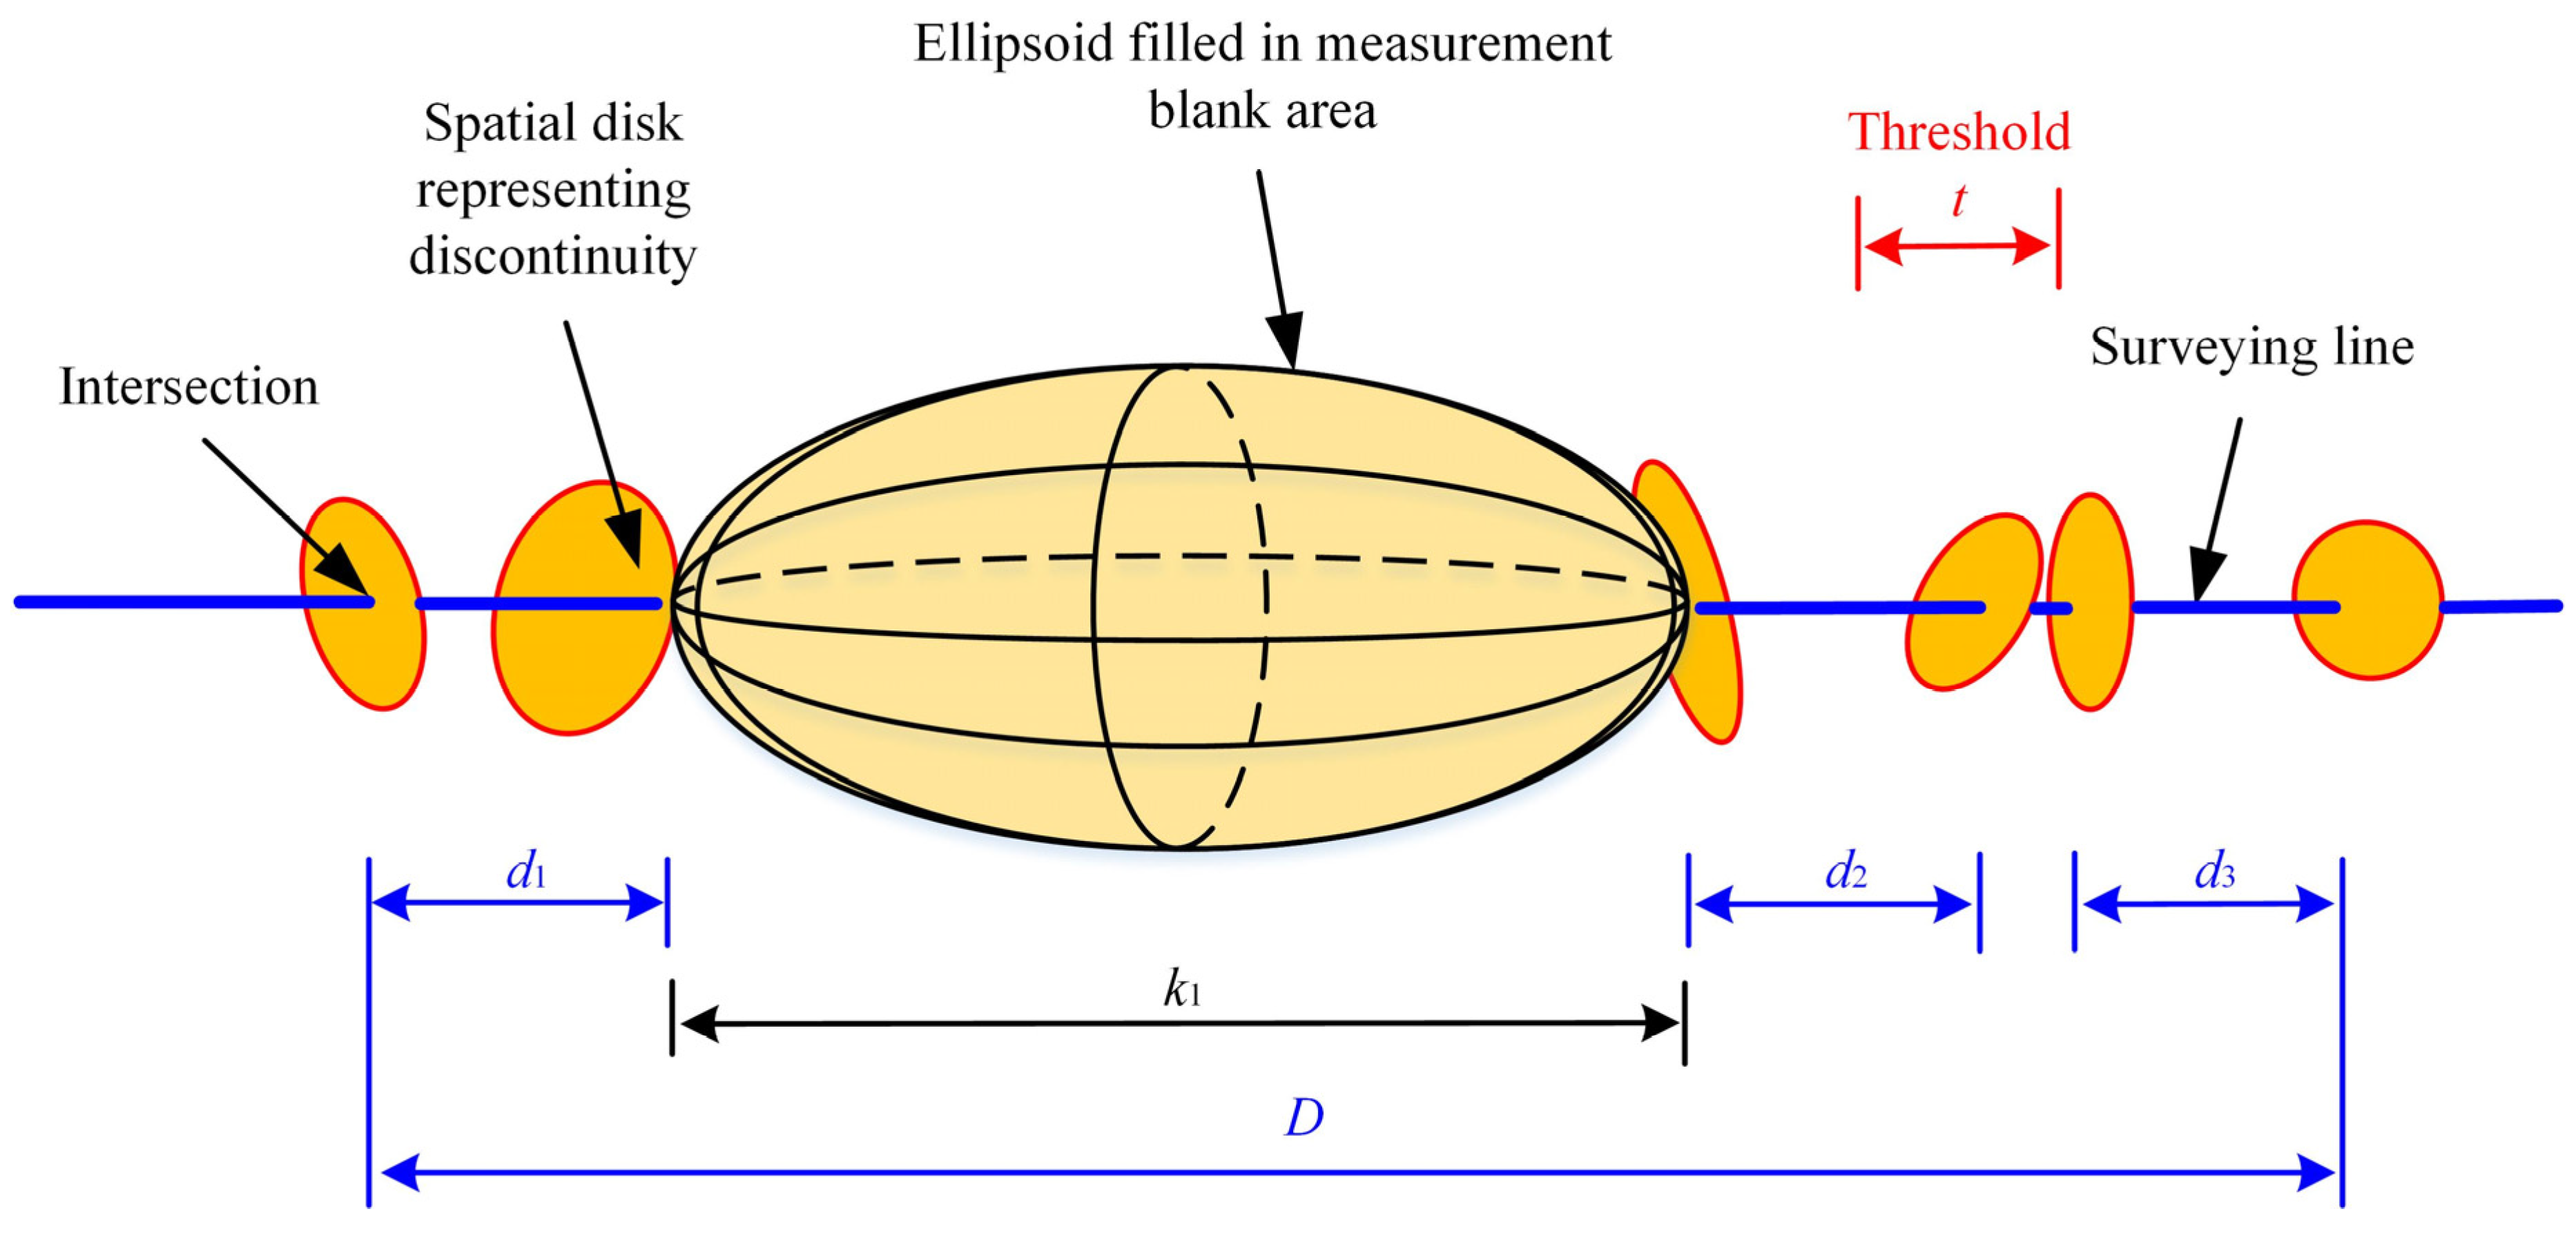
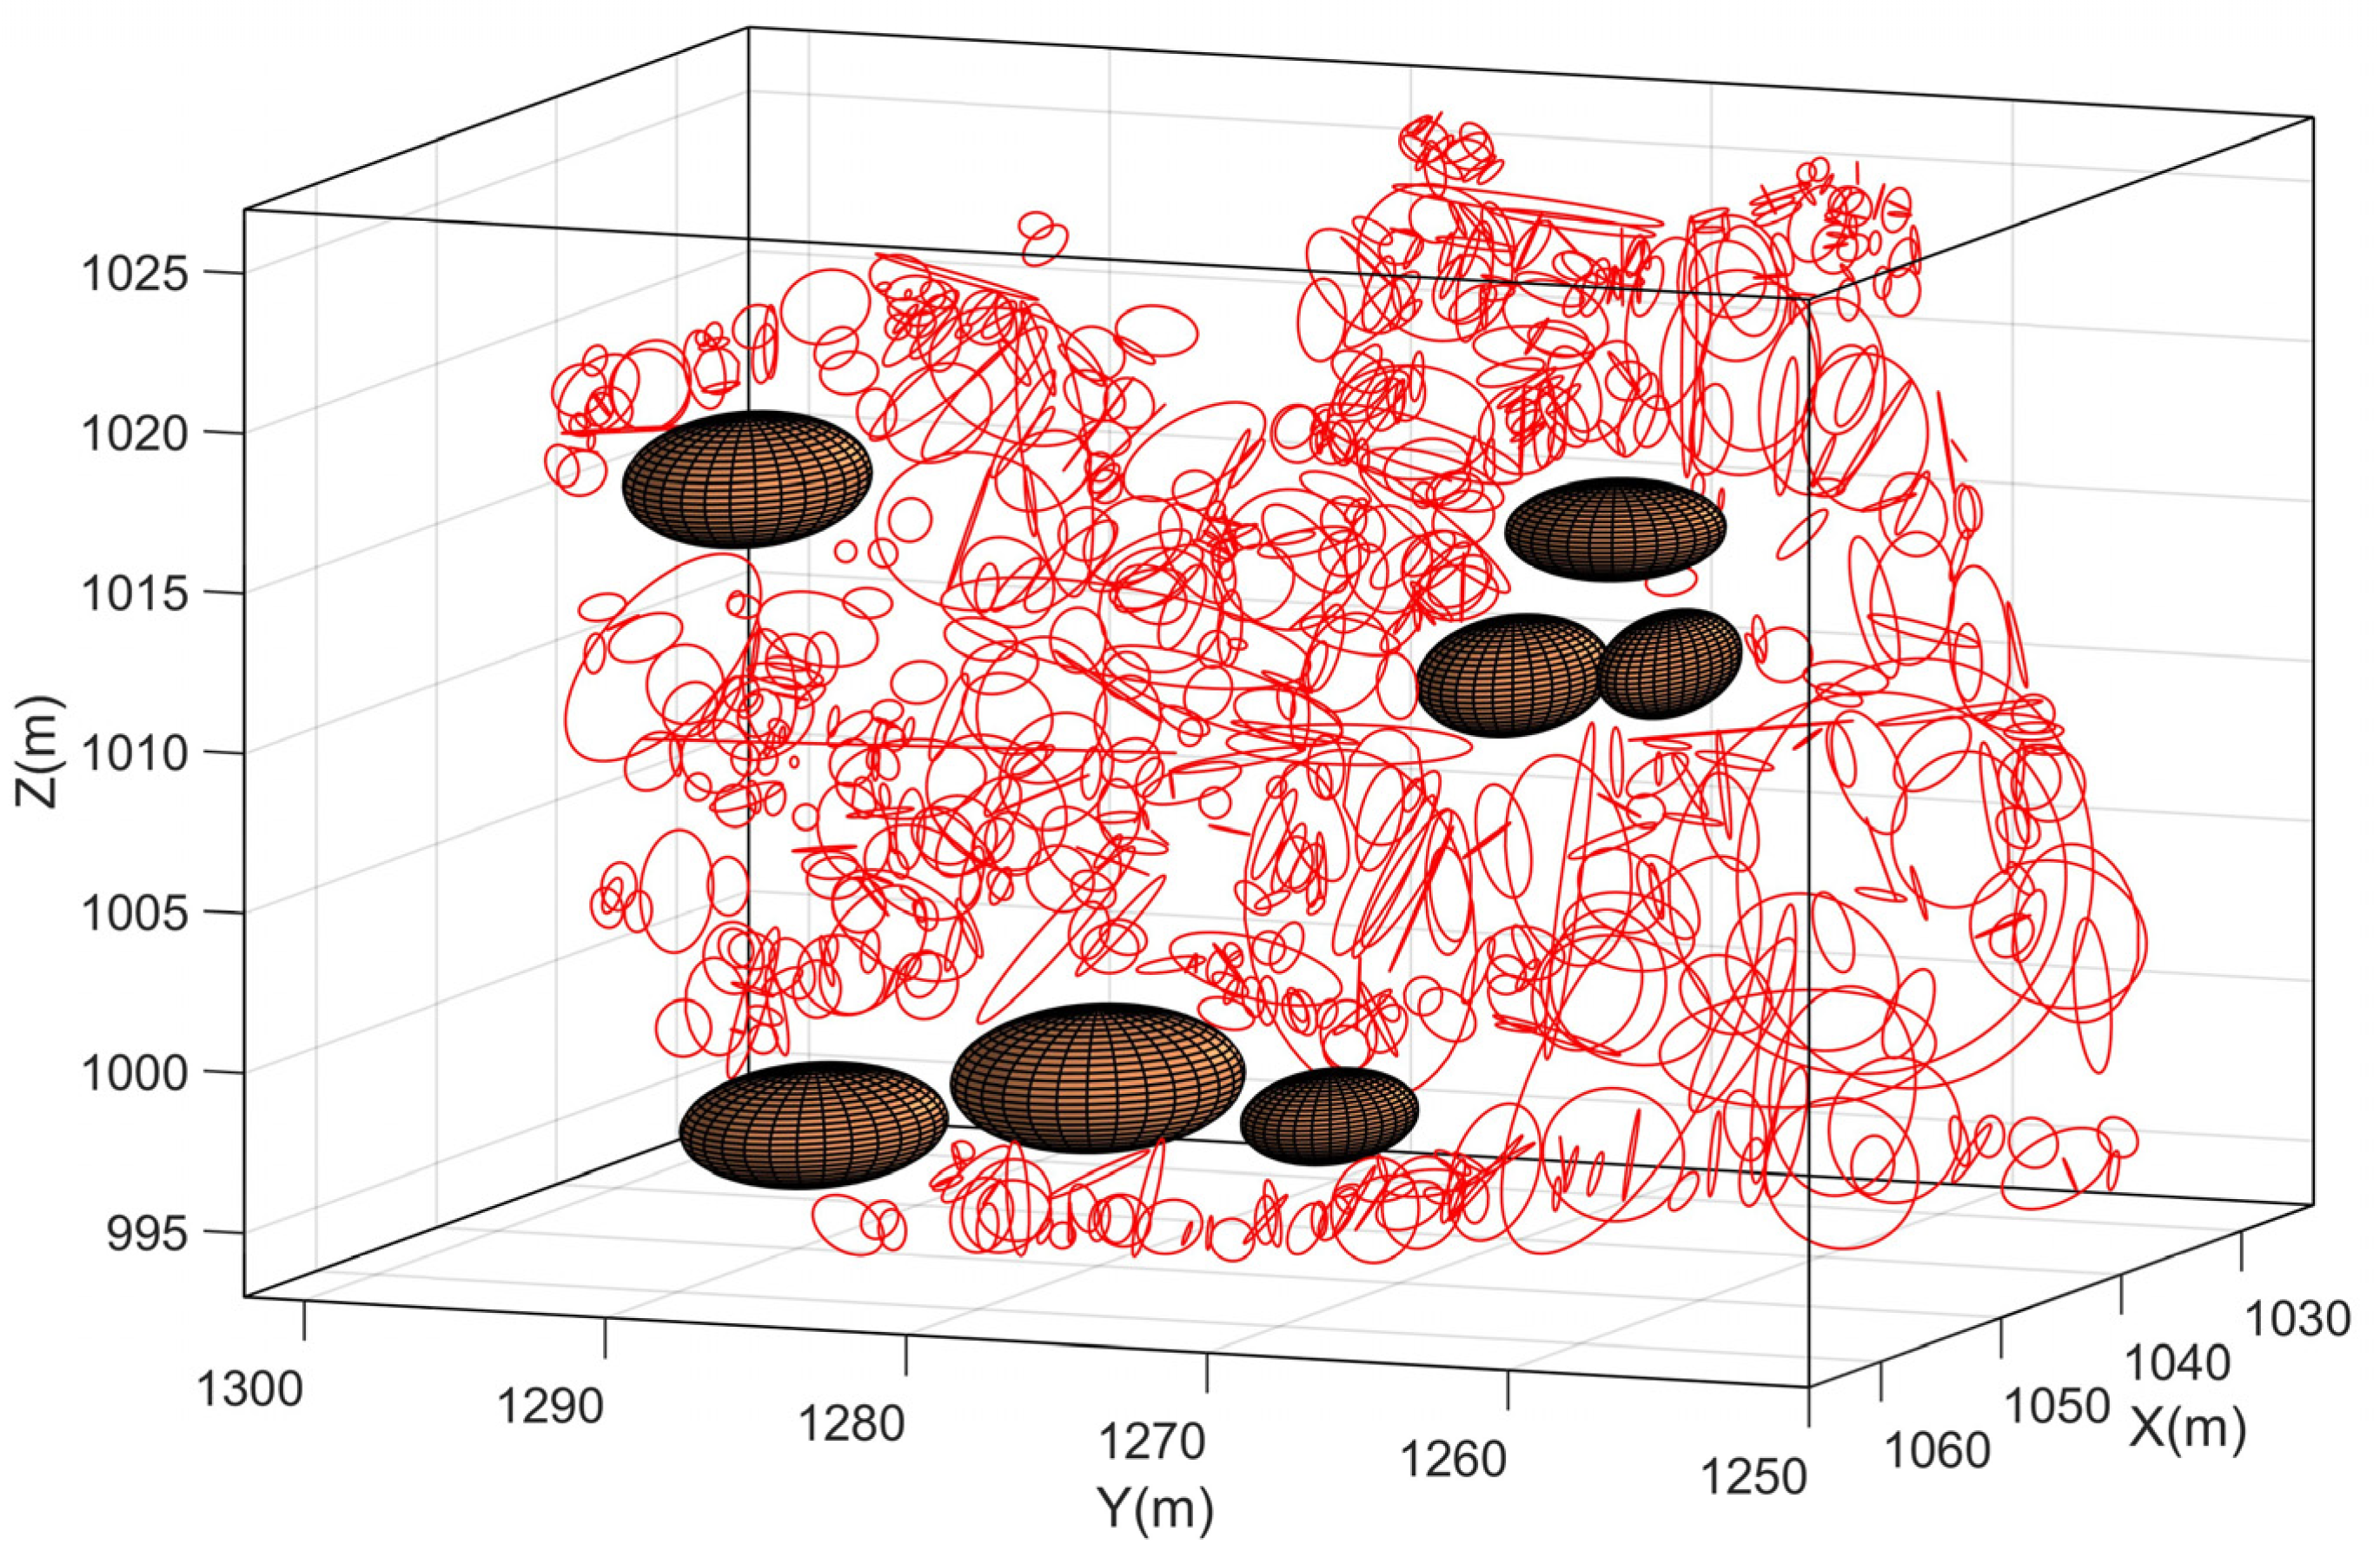
- Aiming at the problem of discontinuity measurement blank areas caused by gravel accumulation and vegetation on the slope, ellipsoids were set in the blank areas, and the influence of blank areas was eliminated in the RQD calculation. The generalized RQD of rock mass using the measurement data of discontinuities and eliminating the influence of measurement blank areas was obtained to describe the quality of rock mass more accurately. For the research slope in this paper, before and after eliminating the influence of blank areas, the generalized RQD decreased by 1.67%, from 46.58 to 44.91%. After eliminating the influence of measurement blank areas, the change in the generalized RQD of different slope rock mass was different, and the change in quality grade was also different. However, after eliminating the influence of blank areas, the generalized RQD can more accurately reflect the real quality of slope rock mass and provide more reliable data for engineering construction.
Author Contributions
Funding
Data Availability Statement
Acknowledgments
Conflicts of Interest
References
- Zhang, W.; Chen, J.; Cao, Z.; Wang, R. Size effect of RQD and generalized representative volume elements: A case study on an underground excavation in Baihetan dam, Southwest China. Tunn. Undergr. Space Technol. 2013, 35, 89–98. [Google Scholar] [CrossRef]
- Bertuzzi, R.; Douglas, K.; Mostyn, G. Comparison of quantified and chart GSI for four rock masses. Eng. Geol. 2016, 202, 24–35. [Google Scholar] [CrossRef]
- Barton, N. Some new Q-value correlations to assist in site characterisation and tunnel design. Int. J. Rock Mech. Min. Sci. 2002, 39, 185–216. [Google Scholar] [CrossRef]
- Romana, M. New Adjustment Ratings for Application of Bieniawski Classification to Slopes. In Proceedings of the International Symposium on the Role of Rock Mechanics, Zacatecas, Mexico, 2–4 September 1985; pp. 49–53. [Google Scholar]
- Zheng, J.; Zhao, Y.; Lü, Q.; Deng, J.; Pan, X.; Li, Y. A discussion on the adjustment parameters of the Slope Mass Rating (SMR) system for rock slopes. Eng. Geol. 2016, 206, 42–49. [Google Scholar] [CrossRef]
- Sadagah, B.H.; Qari, M.Y.H.T. Regional Rock Quality Designation (RRQD) of the West Central Arabian Shield. Environ. Eng. Geosci. 1993, 30, 455–467. [Google Scholar] [CrossRef]
- Du, S.; Xu, S.; Yang, S.; Chen, J.; Wang, S. Application of rock quality designation (RQD) to engineering classification of rocks. J. Eng. Geol. 2000, 8, 351–356. [Google Scholar]
- Niibori, Y.; Nakata, R.; Tochiyama, O.; Mimura, H. Evaluation of Solute Transport through a Fracture by Considering the Spatial Distributions of Retardation Effect in Grain Scale. J. Hydrol. Eng. 2009, 14, 1214–1220. [Google Scholar] [CrossRef]
- Huang, R.; Huang, J.; Ju, N.; Li, Y. Automated tunnel rock classification using rock engineering systems. Eng. Geol. 2013, 156, 20–27. [Google Scholar] [CrossRef]
- Aydan, Ö.; Ulusay, R.; Tokashiki, N. A New Rock Mass Quality Rating System: Rock Mass Quality Rating (RMQR) and Its Application to the Estimation of Geomechanical Characteristics of Rock Masses. Rock Mech. Rock Eng. 2013, 47, 1255–1276. [Google Scholar] [CrossRef]
- Deere, D.U. Technical description of rock cores for engineering purposes. Rock Mech. Eng. Geol. 1964, 9, 17–22. [Google Scholar]
- Chen, J.; Wang, Q.; Zhao, H. Obtaining RQD of rock mass by sampling window method. Chin. J. Rock Mech. Eng. 2004, 29, 1491–1495. [Google Scholar]
- Wang, G.; Xiao, S.; Chen, J. Discontinuities in three-dimensional network of applied research in the RQD. Chin. J. Rock Mech. Eng. 2002, 21, 1761–1764. [Google Scholar]
- Zhang, W.; Wang, Q.; Chen, J.-P.; Tan, C.; Yuan, X.-Q.; Zhou, F.-J. Determination of the optimal threshold and length measurements for RQD calculations. Int. J. Rock Mech. Min. Sci. 2012, 51, 1–12. [Google Scholar] [CrossRef]
- Zhang, W.; Chen, J.; Wang, Q.; Ma, D.; Niu, C.; Zhang, W. Investigation of RQD variation with scanline length and optimal threshold based on three-dimensional fracture network modeling. Sci. China Technol. Sci. 2013, 56, 739–748. [Google Scholar] [CrossRef]
- Azimian, A. A New Method for Improving the RQD Determination of Rock Core in Borehole. Rock Mech. Rock Eng. 2015, 49, 1559–1566. [Google Scholar] [CrossRef]
- Du, S.; Wang, S. Anisotropy analysis of rock quality index RQD. J. Eng. Geol. 1996, 4, 48–54. [Google Scholar]
- Du, S.; Wang, S. Review and trend of quantifying rock quality. J. Eng. Geol. 1998, 6, 230–237. [Google Scholar]
- Palmstrom, A. Application of the Volumetric Joint Count as a Measure of Rock Mass Jointing. In Proceedings of the International Symposium on Fundamentals of Rock Joints, Björkliden, Sweden, 15–20 September 1985; pp. 103–110. [Google Scholar]
- Sen, Z.; Eissa, E.A. Rock quality charts for log-normally distributed block sizes. Int. J. Rock Mech. Min. Sci. Geomech. Abstr. 1992, 29, 1–12. [Google Scholar] [CrossRef]
- Li, P.; Yang, J.; Yang, J.; Zhao, W.; Nie, D. New formulae for volumetric joint count Jv of jointed rock mass. J. Eng. Geol. 2009, 17, 240–243. [Google Scholar]
- Eissa, E.A.; Sen, Z. Fracture simulation and mulity-directional rock quality designation. Bull. Assoc. Eng. Geol. 1991, 2, 193–201. [Google Scholar]
- Chen, W.; Yang, J.; Tan, X.; Yu, H. Study on mechanical parameters of fractured rock masses. Sci. China Technol. Sci. 2011, 54, 140–146. [Google Scholar] [CrossRef]
- Harrison, J.P. Selection of the threshold value in RQD assessments. Int. J. Rock Mech. Min. Sci. 1999, 36, 673–685. [Google Scholar] [CrossRef]
- Zheng, J.; Yang, X.; Lü, Q.; Zhao, Y.; Deng, J.; Ding, Z. A new perspective for the directivity of Rock Quality Designation (RQD) and an anisotropy index of jointing degree for rock masses. Eng. Geol. 2018, 240, 81–94. [Google Scholar] [CrossRef]
- Huang, L.; Tang, H.; Zhang, L.; Ge, Y.; Liu, Y. New model of relation between rock discontinuities trace length and diameter for semi-trace scanline sampling and new algorithm. Chin. J. Rock Mech. Eng. 2011, 30, 733–745. [Google Scholar]
- Wang, F. Engineering Application of Rapid Acquiring Rock Mass Fractures Information with Digital Close Range Photogrammetry. Master’s Thesis, Jilin University, Changchun, China, 2006. [Google Scholar]
- Wang, F.; Huang, R.; Chen, J.; Yang, G.; Ma, L. Control surveying of rock mass slope and orientation validation measurement of discontinuities based on reflectorless total station instrument. J. Jilin Univ. 2013, 43, 1607–1614. [Google Scholar]
- Wang, F.; Chen, J.; Yang, G.; Sun, F.; Jiang, Q. Solution models of geometrical information of rock mass discontinuities based on digital close range photogrammetry. J. Jilin Univ. 2012, 42, 1839–1846. [Google Scholar]


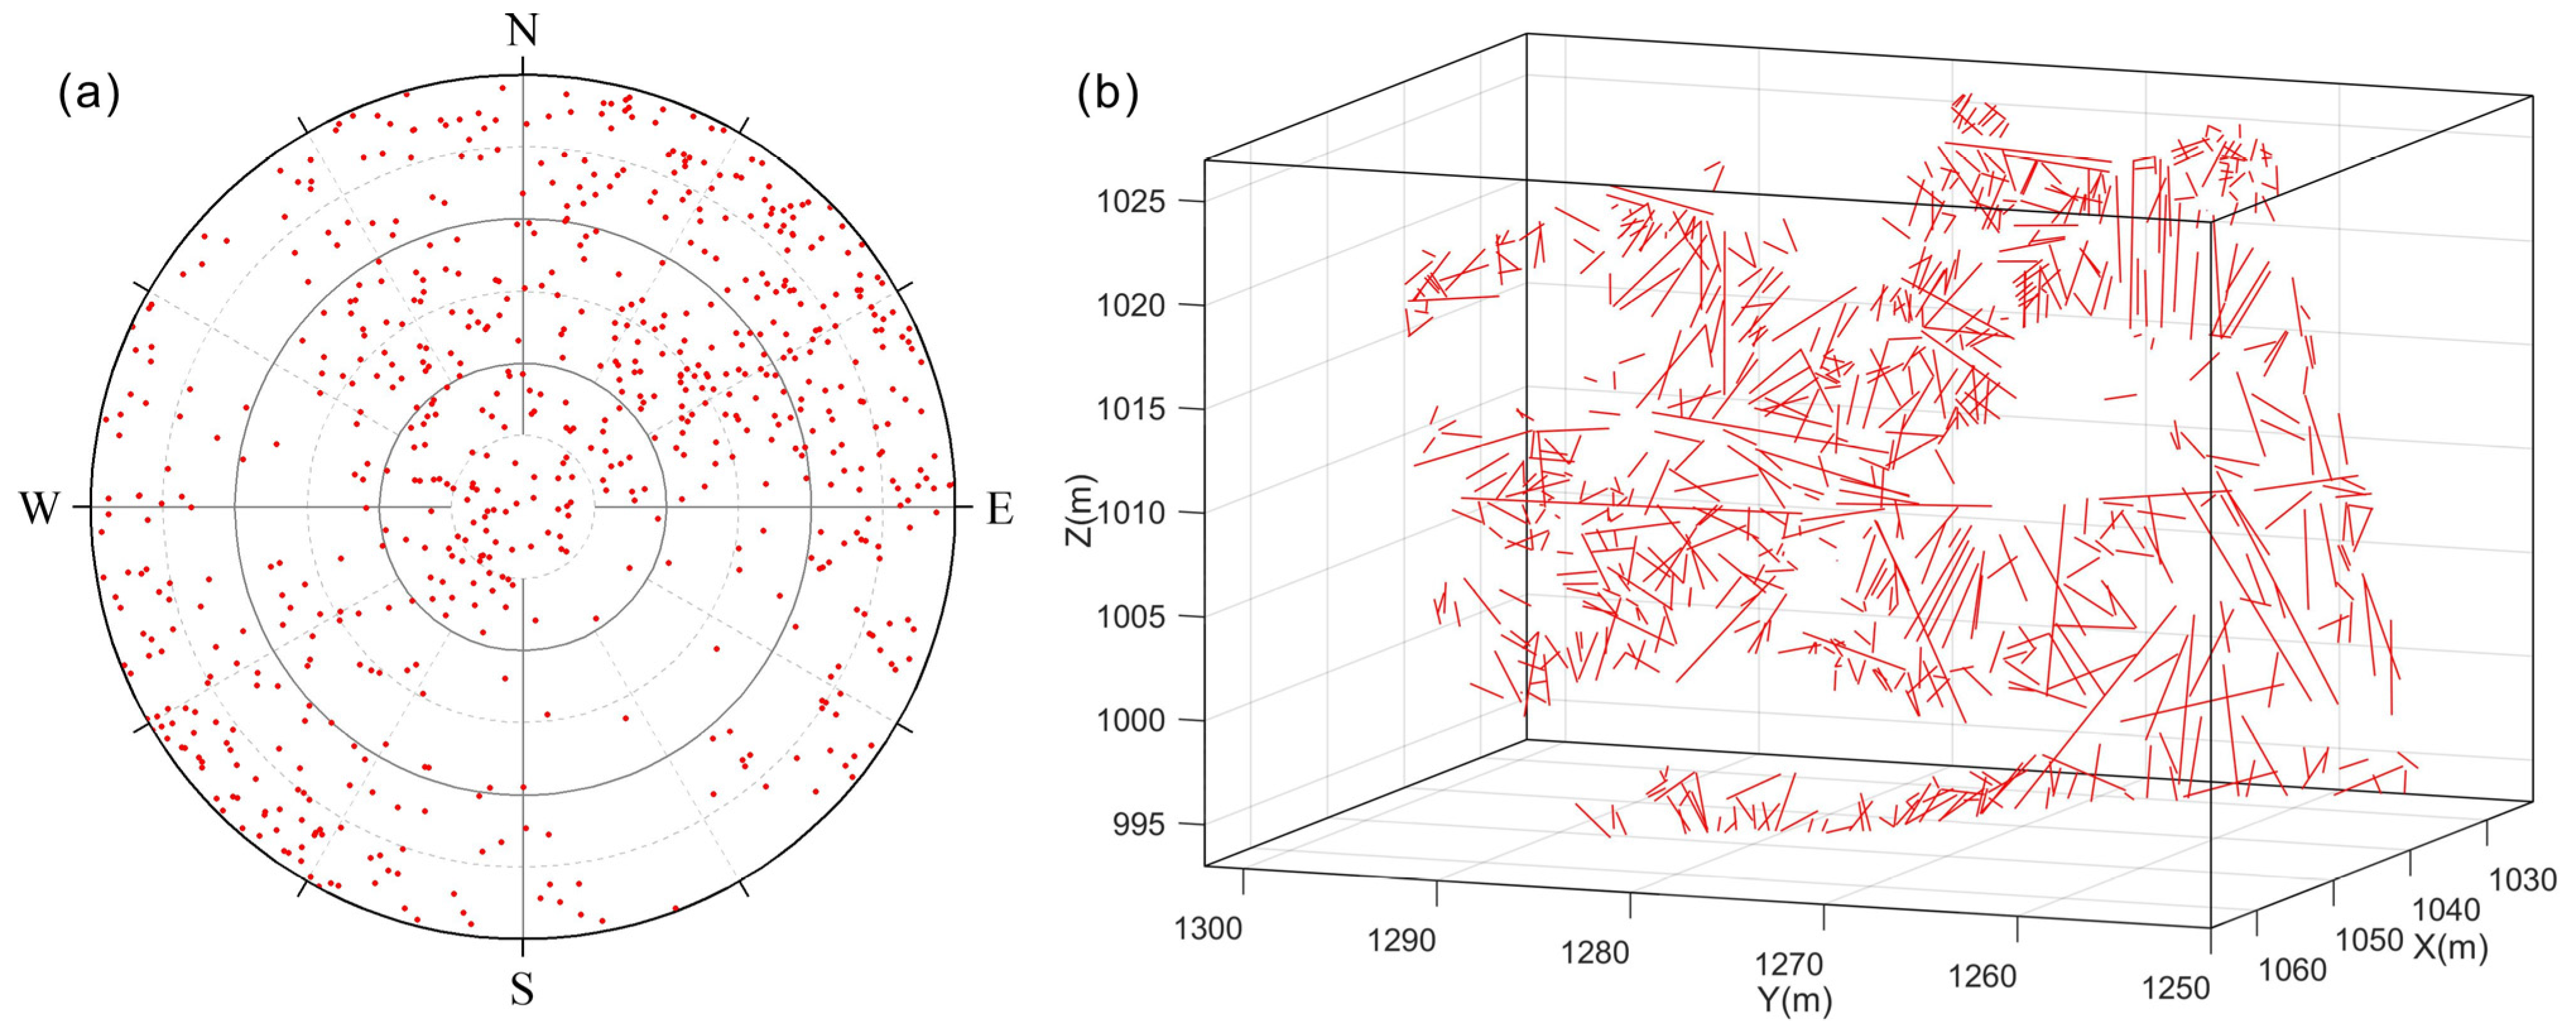




| Discontinuity Number | X1 | Y1 | Z1 | X2 | Y2 | Z2 | Dip (°) | Dip Angle (°) |
|---|---|---|---|---|---|---|---|---|
| 1 | 1042.06 | 1298.81 | 1019.30 | 1043.36 | 1300.22 | 1017.04 | 22.52 | 52.30 |
| 2 | 1041.71 | 1300.38 | 1019.22 | 1042.14 | 1299.53 | 1019.03 | 22.71 | 68.85 |
| 3 | 1042.19 | 1299.66 | 1018.81 | 1042.92 | 1300.80 | 1017.73 | 358.89 | 58.73 |
| 4 | 1043.07 | 1300.23 | 1017.02 | 1042.75 | 1300.01 | 1017.51 | 124.43 | 87.86 |
| 681 | 1063.20 | 1281.84 | 996.37 | 1063.59 | 1281.17 | 995.36 | 26.57 | 87.96 |
| 682 | 1063.01 | 1282.11 | 996.67 | 1063.66 | 1281.78 | 995.62 | 8.74 | 60.64 |
| 683 | 1065.46 | 1283.05 | 997.03 | 1064.61 | 1281.58 | 995.35 | 186.70 | 58.89 |
| Ellipsoid Number | Coordinates of Ellipsoid Center | Length of Half Axis | ||||
|---|---|---|---|---|---|---|
| Xe | Ye | Ze | A | B | C | |
| 1 | 1038.0 | 1271.0 | 1010.3 | 4.8 | 2.6 | 1.8 |
| 2 | 1034.5 | 1269.0 | 1014.5 | 4.0 | 3.3 | 1.5 |
| 3 | 1035.8 | 1266.7 | 1010.6 | 4.5 | 1.6 | 1.6 |
| 4 | 1045.9 | 1293.3 | 1016.3 | 5.5 | 3.5 | 2.0 |
| 5 | 1050.8 | 1272.0 | 998.2 | 4.3 | 2.4 | 1.4 |
| 6 | 1052.8 | 1278.9 | 999.3 | 5.8 | 4.3 | 2.2 |
| 7 | 1058.4 | 1286.1 | 998.2 | 5.8 | 3.8 | 1.8 |
| Distance between Surveying Lines (m) | Generalized RQD | ||
|---|---|---|---|
| Parallel X-axis Surveying Line | Parallel Y-axis Surveying Line | Parallel Z-axis Surveying Line | |
| 0.1 | 96.88% | 93.14% | 93.32% |
| 0.25 | 96.80% | 93.21% | 93.37% |
| 0.5 | 96.79% | 93.21% | 93.07% |
| 0.75 | 96.01% | 92.85% | 94.17% |
| 1 | 95.54% | 93.42% | 92.37% |
| 2 | 95.92% | 91.32% | 94.02% |
| 4 | 99.54% | 92.21% | 94.69% |
| 8 | 99.46% | 89.18% | 100.00% |
| Parallel Direction of Surveying Lines | Without Eliminating Blank Areas | Eliminate Blank Areas | ||||
|---|---|---|---|---|---|---|
| X-axis | Y-axis | Z-axis | X-axis | Y-axis | Z-axis | |
| Threshold t (m) | 1.2 | 2.8 | 2.5 | 1.2 | 2.8 | 2.5 |
| Number of effective surveying lines | 2239 | 1831 | 1974 | 2239 | 1831 | 1974 |
| Average generalized RQD | 50.57% | 41.93% | 46.37% | 50.54% | 40.19% | 42.90% |
| Comprehensive generalized RQD | 46.58% | 44.91% | ||||
Publisher’s Note: MDPI stays neutral with regard to jurisdictional claims in published maps and institutional affiliations. |
© 2022 by the authors. Licensee MDPI, Basel, Switzerland. This article is an open access article distributed under the terms and conditions of the Creative Commons Attribution (CC BY) license (https://creativecommons.org/licenses/by/4.0/).
Share and Cite
Ding, Q.; Wang, F.; Chen, J.; Wang, M.; Zhang, X. Research on Generalized RQD of Rock Mass Based on 3D Slope Model Established by Digital Close-Range Photogrammetry. Remote Sens. 2022, 14, 2275. https://doi.org/10.3390/rs14092275
Ding Q, Wang F, Chen J, Wang M, Zhang X. Research on Generalized RQD of Rock Mass Based on 3D Slope Model Established by Digital Close-Range Photogrammetry. Remote Sensing. 2022; 14(9):2275. https://doi.org/10.3390/rs14092275
Chicago/Turabian StyleDing, Qing, Fengyan Wang, Jianping Chen, Mingchang Wang, and Xuqing Zhang. 2022. "Research on Generalized RQD of Rock Mass Based on 3D Slope Model Established by Digital Close-Range Photogrammetry" Remote Sensing 14, no. 9: 2275. https://doi.org/10.3390/rs14092275
APA StyleDing, Q., Wang, F., Chen, J., Wang, M., & Zhang, X. (2022). Research on Generalized RQD of Rock Mass Based on 3D Slope Model Established by Digital Close-Range Photogrammetry. Remote Sensing, 14(9), 2275. https://doi.org/10.3390/rs14092275


