
Landslide Susceptibility Mapping along a Rapidly Uplifting River Valley of the Upper Jinsha River, Southeastern Tibetan Plateau, China

Abstract
:1. Introduction
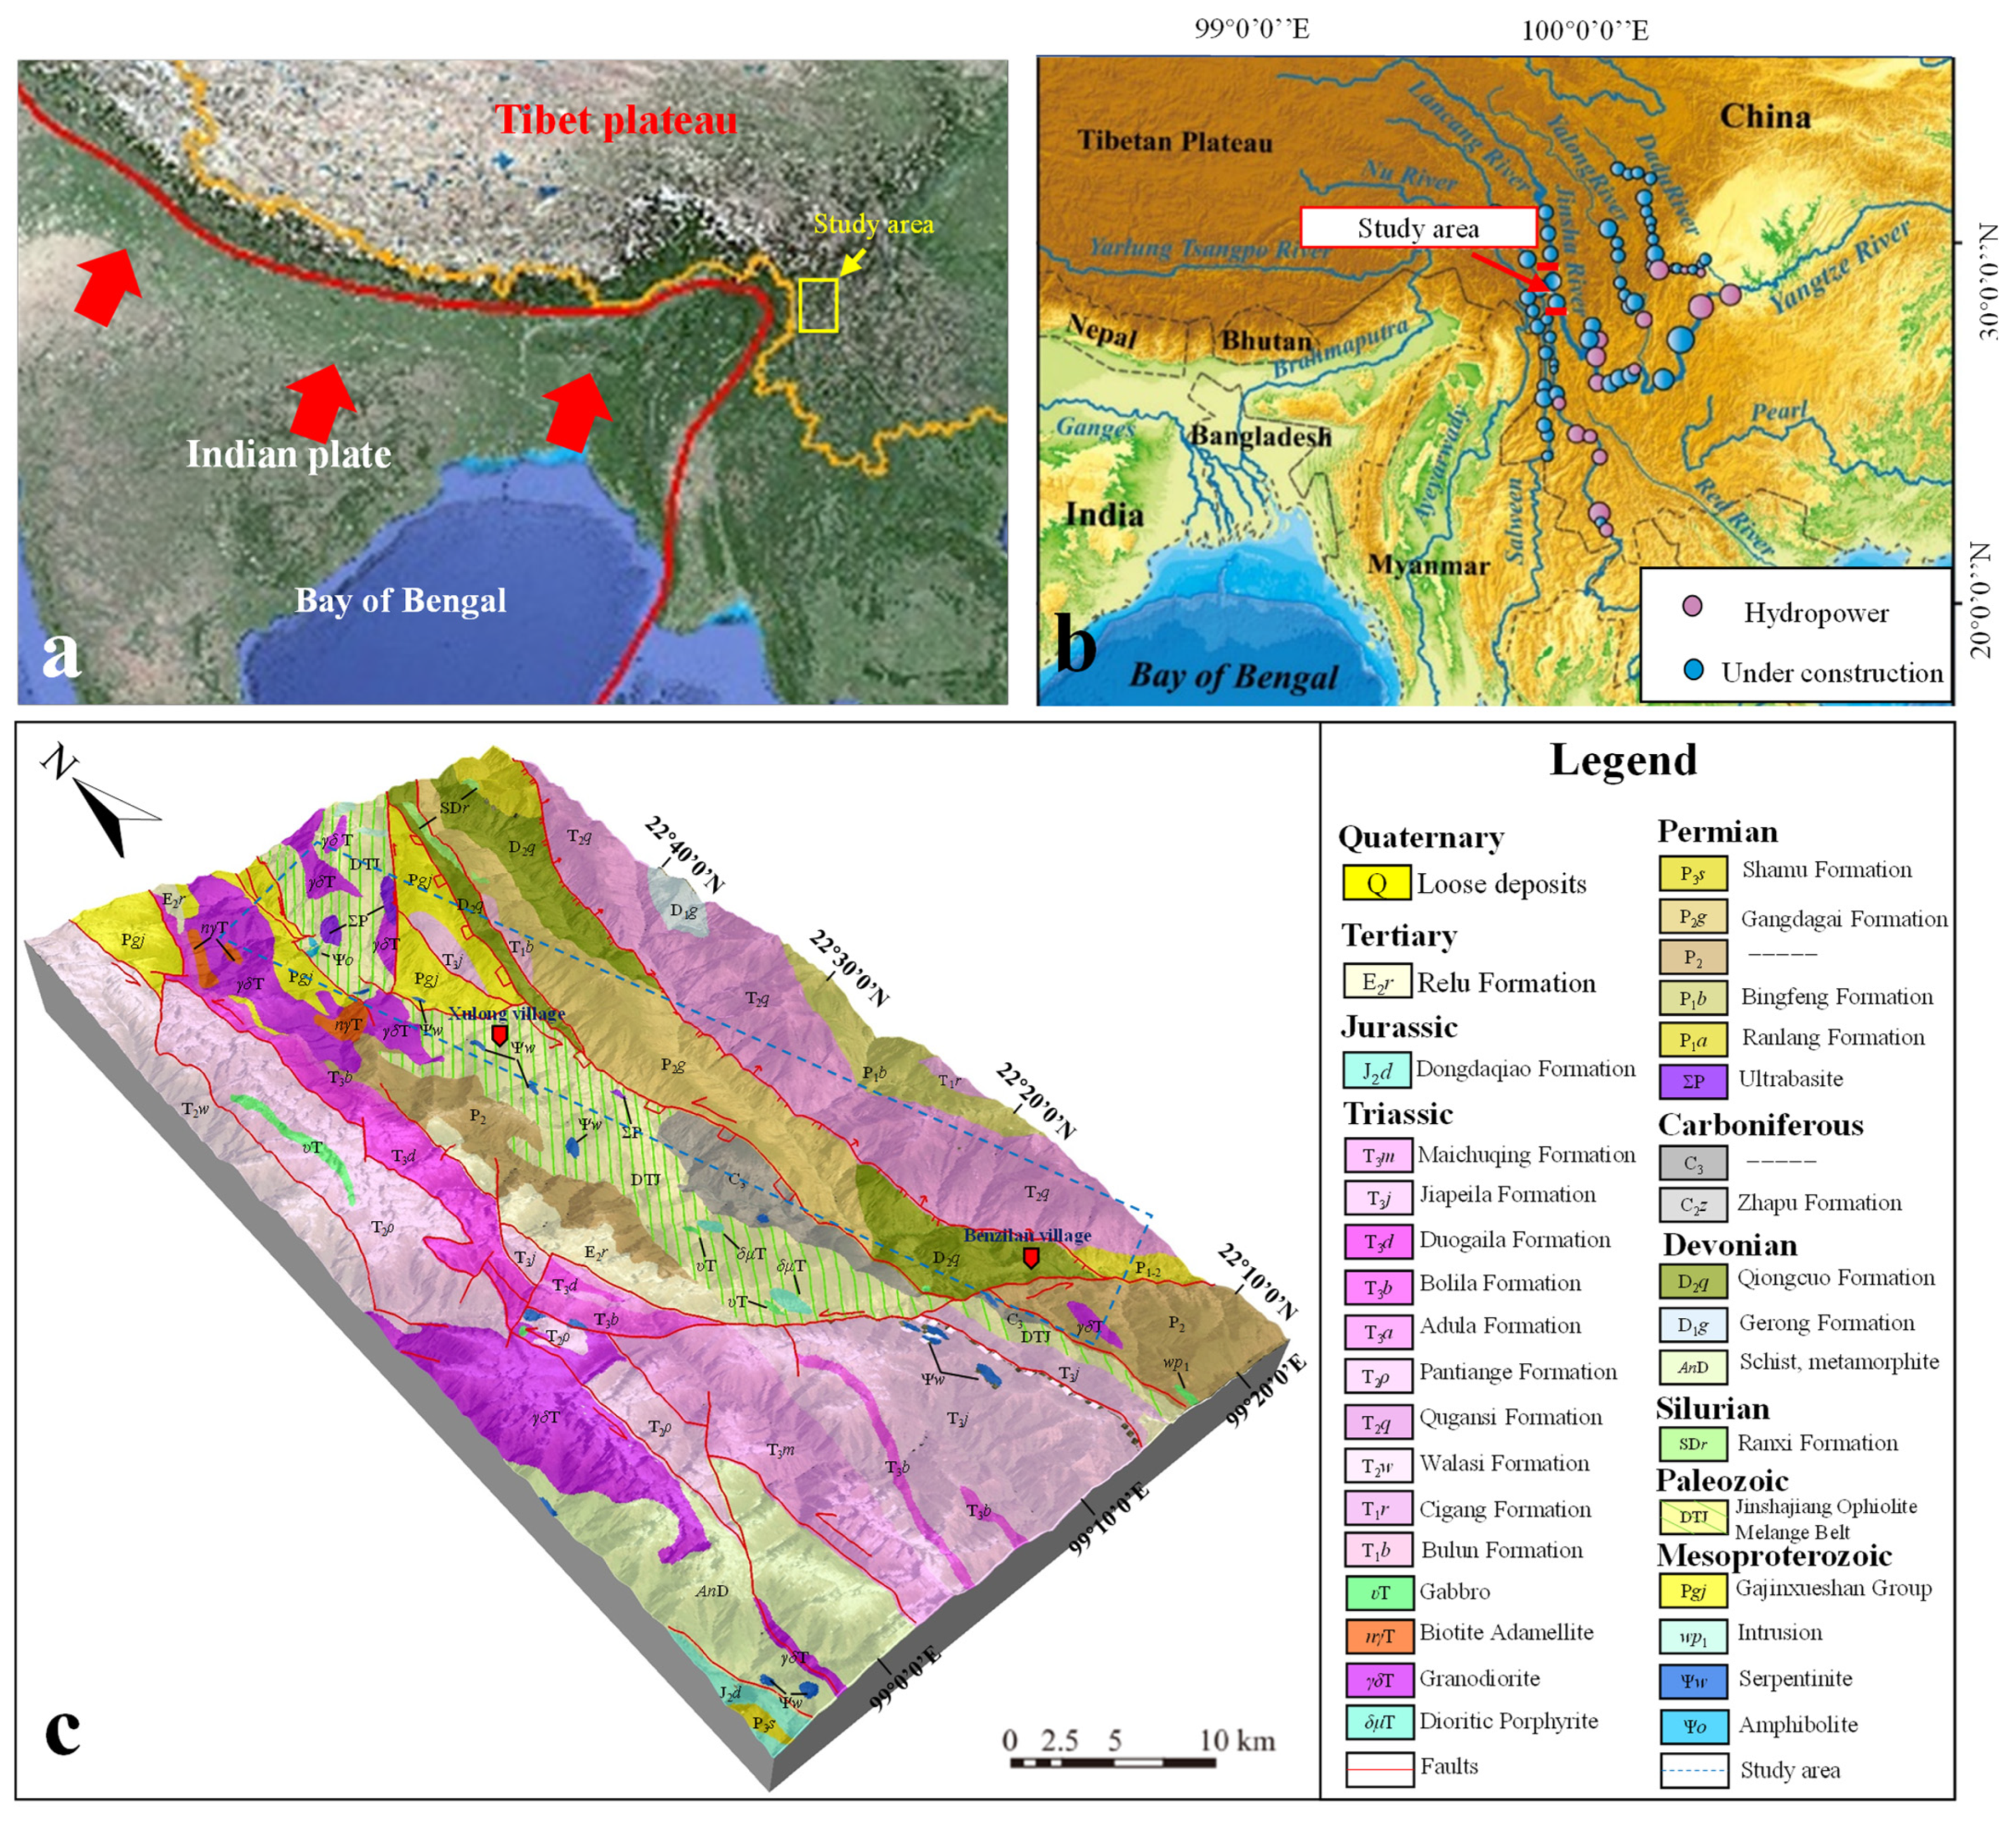
2. Study Area
2.1. Topographic Conditions
2.2. Geologic and Tectontic Settings
2.3. Climatic Conditions
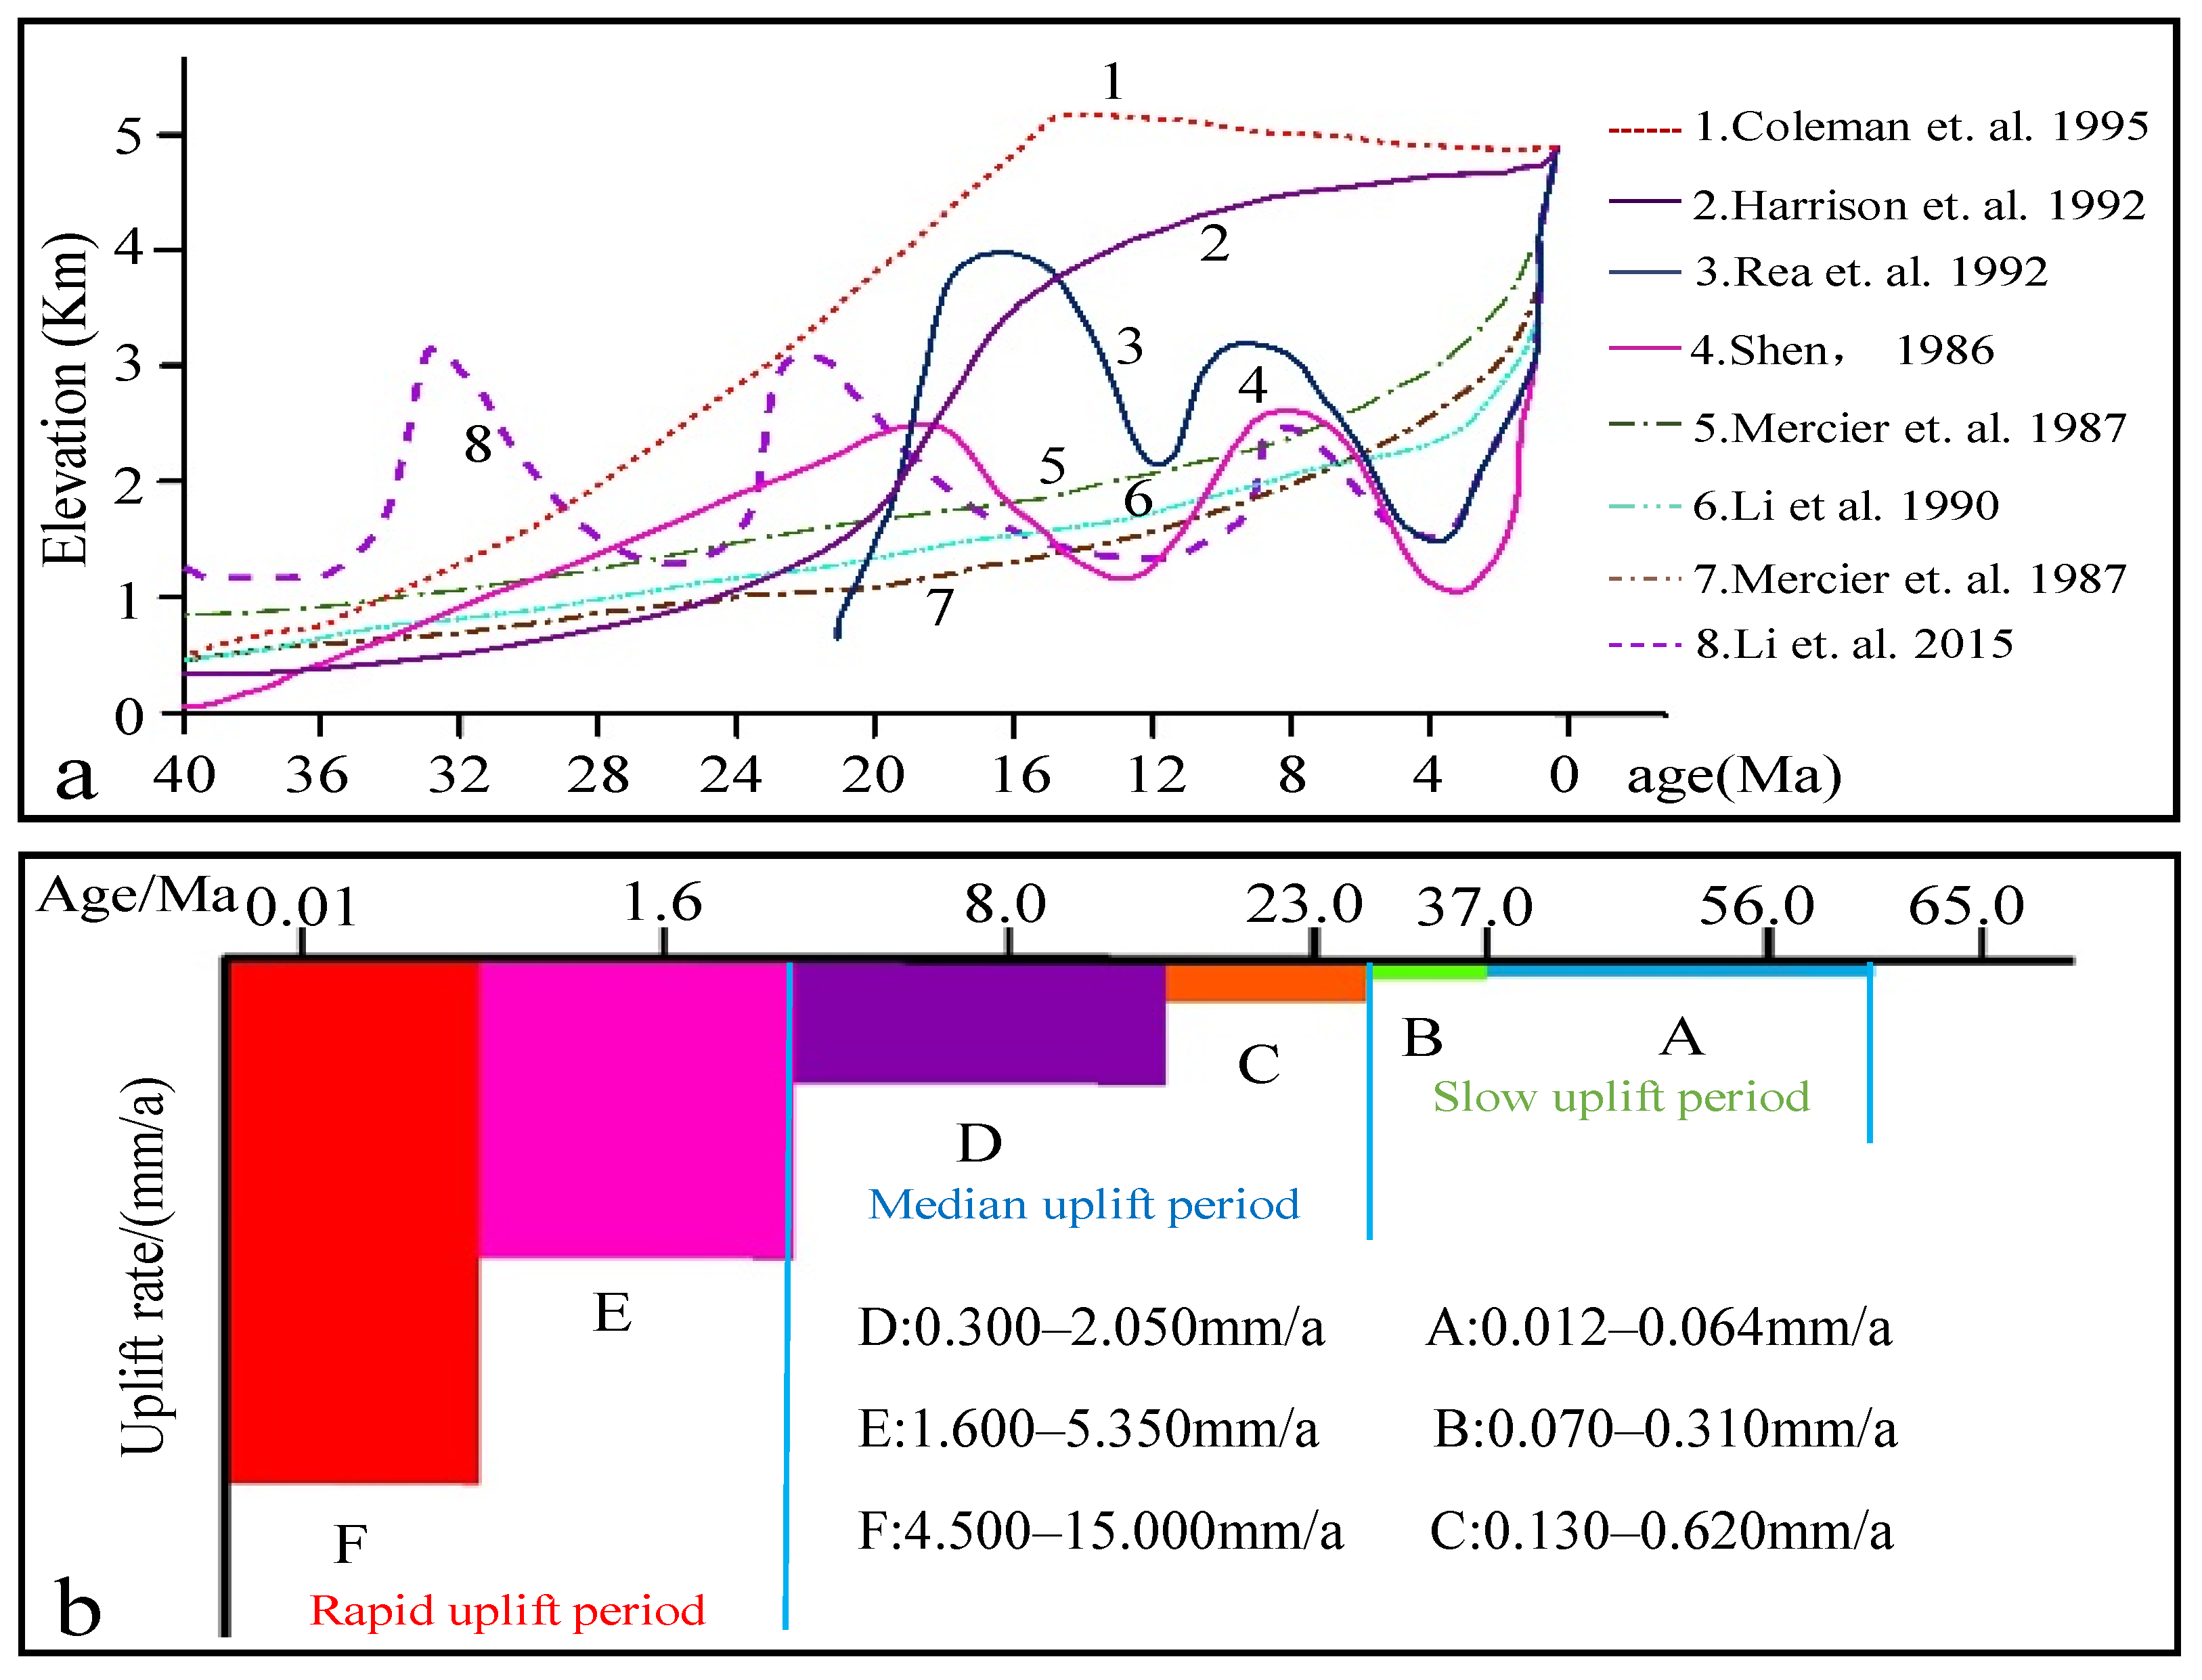
2.4. Tectonic Uplift
3. Data and Methods
3.1. Landslide Characteristics
3.1.1. Landslide Inventory
- (1)
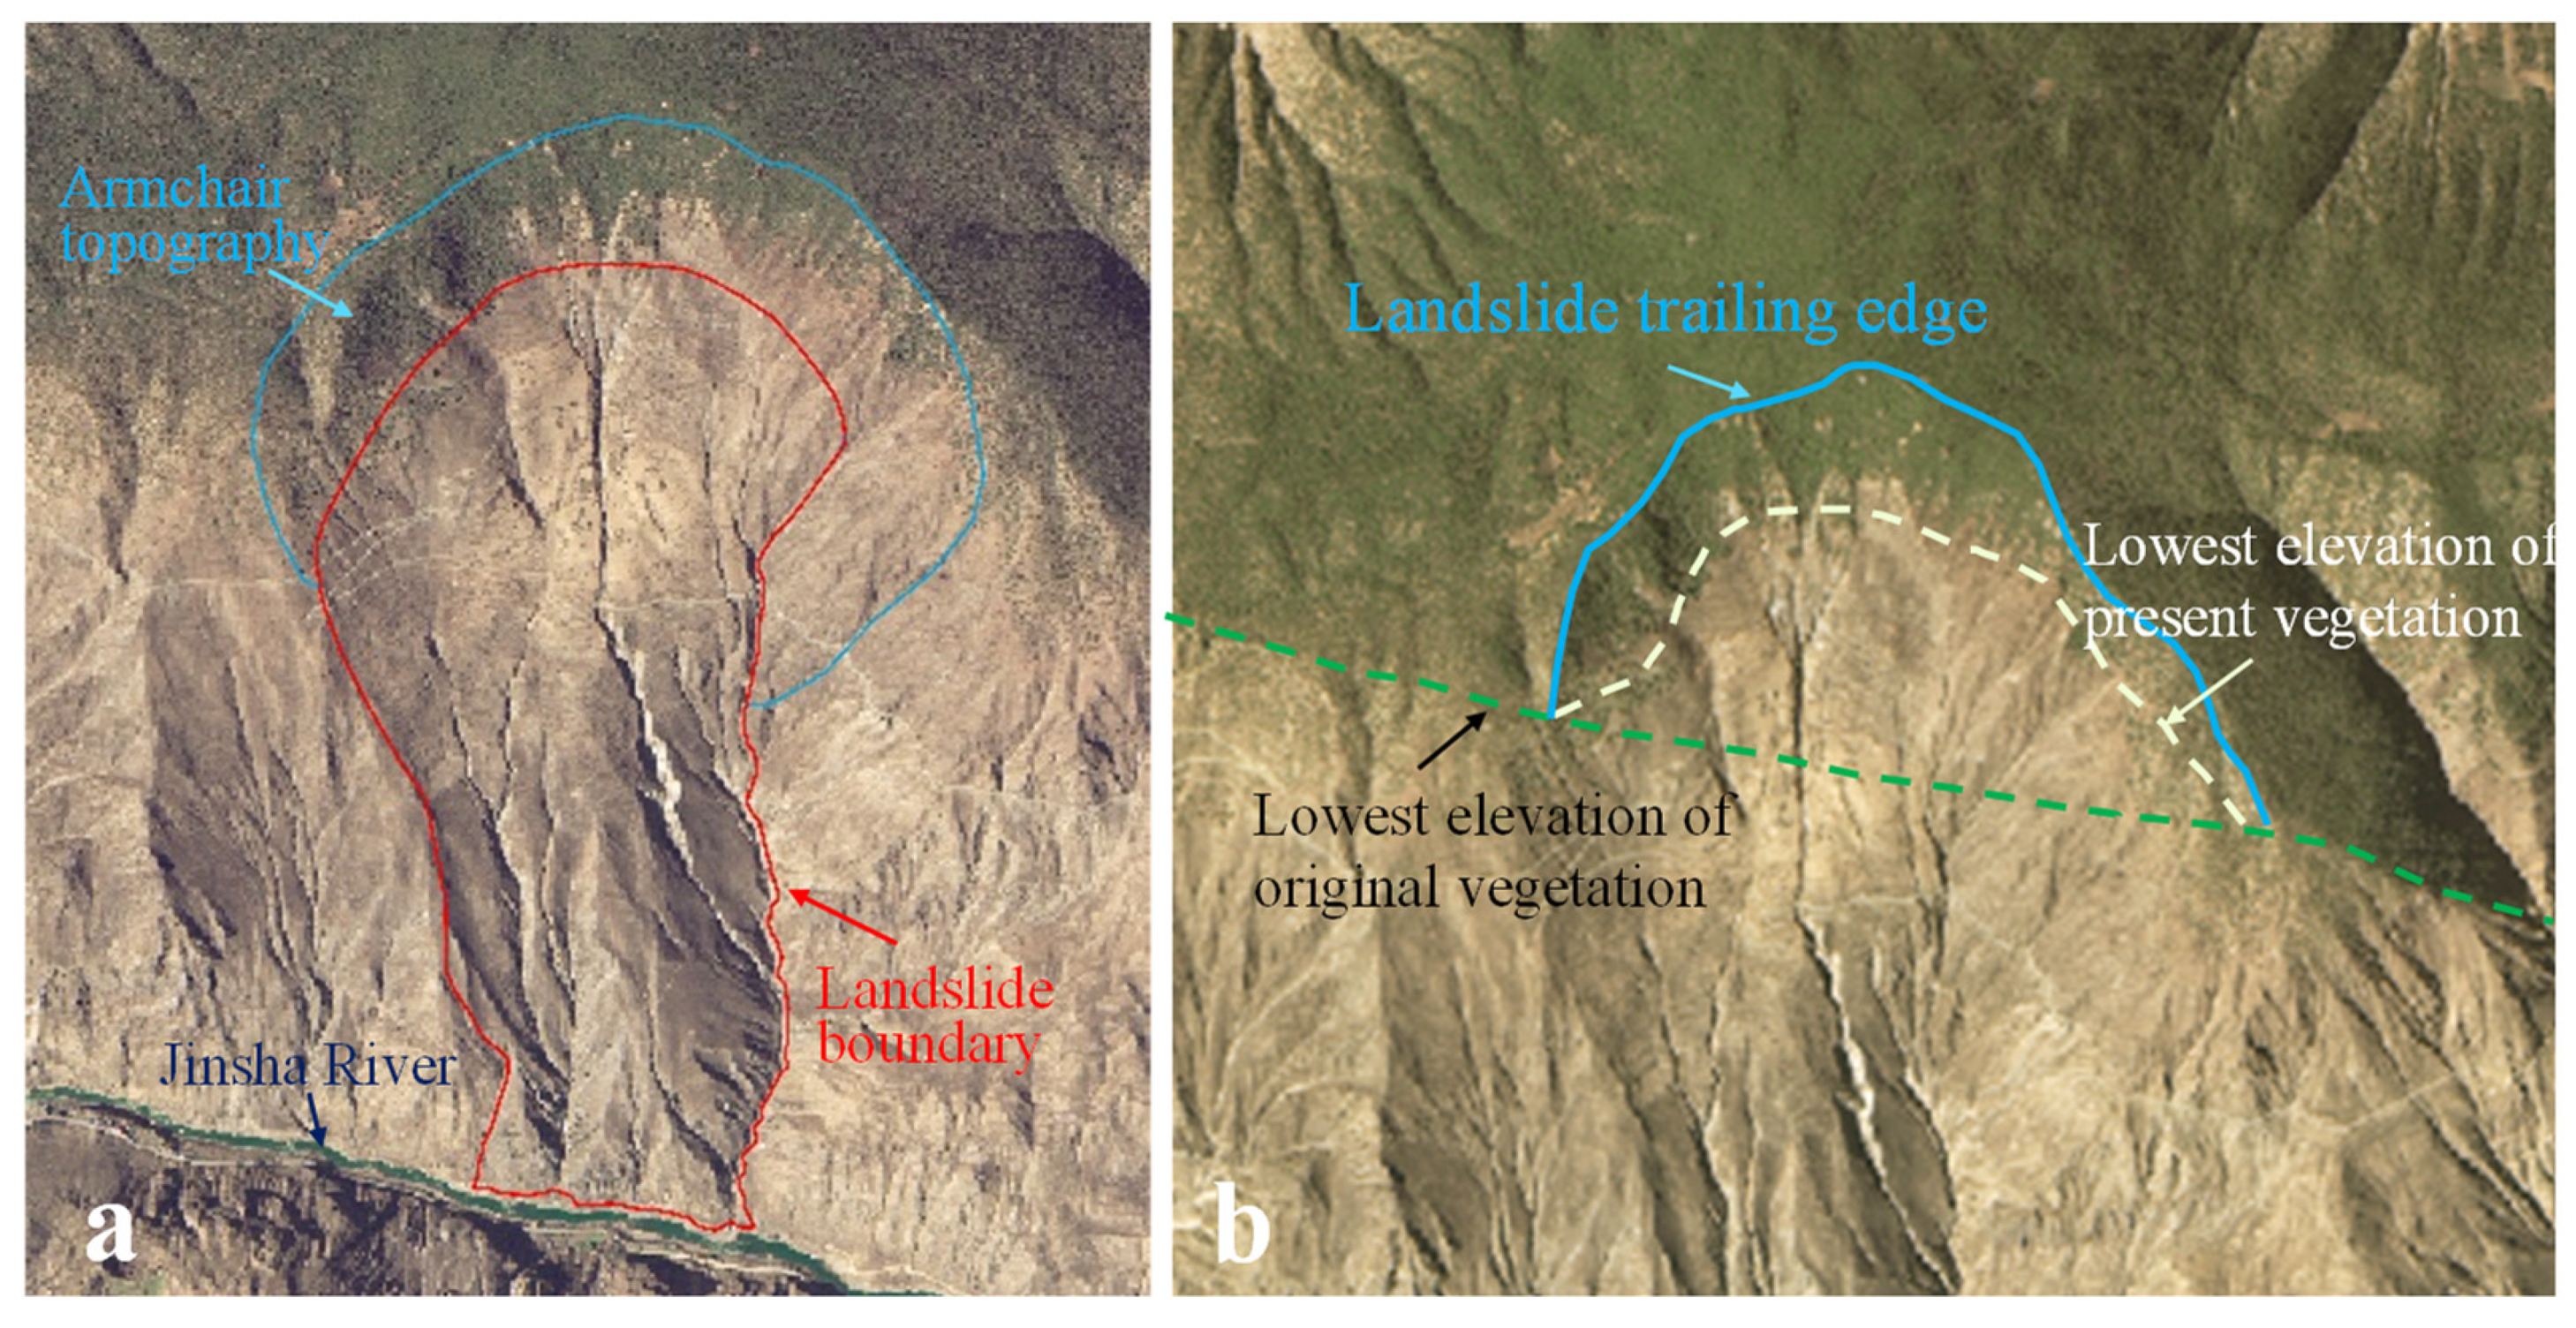
- According to the characteristics of the landslide and its characteristic marks in optical remote sensing images, the landslides that occurred were interpreted [49]. For example, based on the topographic (Figure 3a) and vegetation (Figure 3b) features of the Yingui landslide in the optical remote sensing image, the Yingui landslide was interpreted.
- (2)
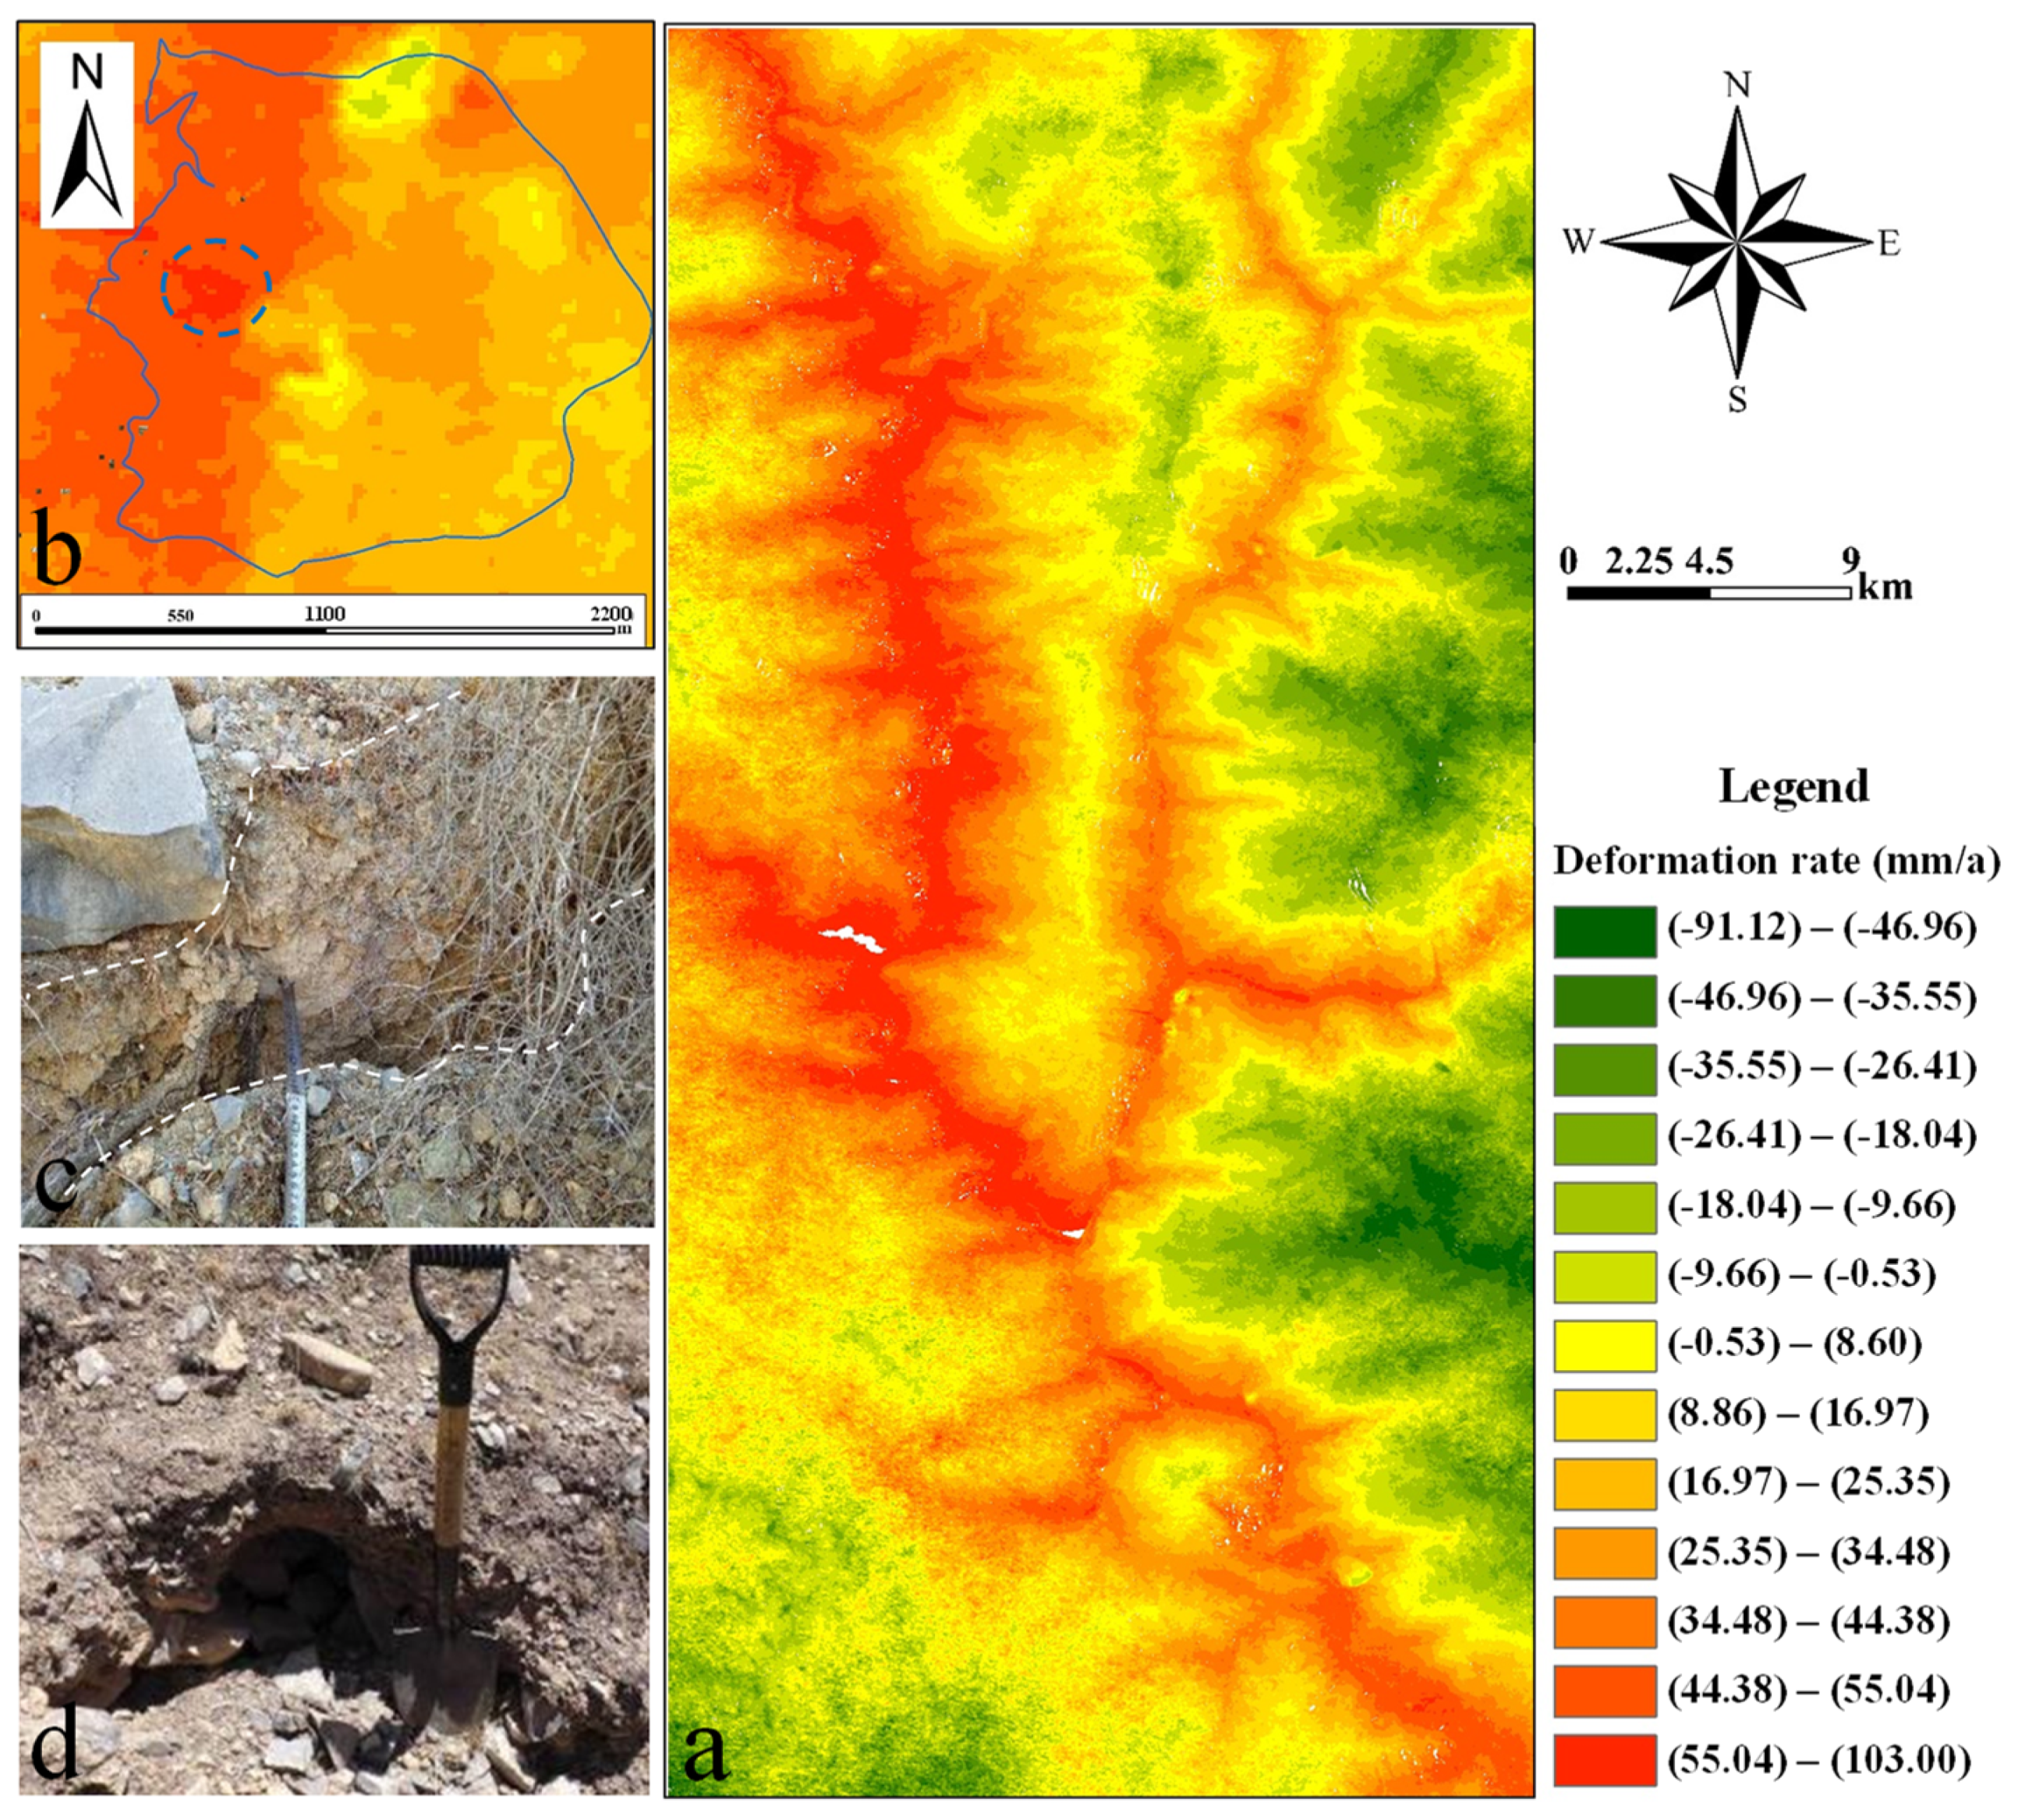
- Based on the monitoring of the surface deformation by InSAR technology, the potential landslides in the deformation stage of the study area that have not been damaged are identified. The study area belongs to the High Mountain and canyon area. Since the SBAS-InSAR technology can improve the coherence of the mountainous area by improving the time sampling rate, this study selected this technology to identify the potential landslide in the study area [58,59]. A total of 23 Sentinel-1A down orbit data with the time period of 12 June 2018–26 May 2019 were used as the InSAR interpretation data. According to the processing process of SBAS-InSAR technology, the connection diagram of the SLC image should be generated first. In this paper, the critical baseline percentage was set as 2, the time baseline was set as 180 days, and a total of 293 pairs were obtained. Then, the Goldstein method and Minimum Cost Flow method were used to generate the interferogram, and the relativities with a low coherence are removed. Finally, the orbit refining and re-flattening operation, two inversions, and geocoding were carried out to generate the average deformation rate map (Figure 4a). From the average deformation rate diagram of the study area, it can be observed that the deformation rate on both sides of Jinsha River is very high, which is consistent with the distribution law of landslides along the river in the study area. InSAR was based on the interpretation of the landslide study areas, mainly for clustering the deformation rate of the large area, using the Taentong landslide as an example. Although the landslide that is based on optical remote sensing is visible, there is a high concentration of the deformation zone when the interpretation based on InSAR technology is found in the Taentong landslide in zone II (Figure 4b). Therefore, it is speculated that the Tanentong landslide in this area may present signs suggesting that it might reoccur.
- (3)
- Based on the field investigation, the interpretation results are checked and the uninterpreted landslides are supplemented [60]. For example, through the field investigation, the interpretation results of the Taentong landslide were verified. The developing tensile crack was found in the inner part of the Taentong landslide, which showed that the Taentong landslide underwent deformation (Figure 4c,d).
3.1.2. Spatial Distribution of the Landslides
- (1)
- Linear distribution characteristics: landslides in the study area are mainly distributed along the two banks of Jinsha River and its tributary, Dingqu River, in the north–south direction.
- (2)
- Clustering distribution characteristics: landslides in the study area are mainly concentrated in Xulong-Maoding (13), Qulong-Rongxue (15), Guxue-Rancun (14), and Quzhi-Yahong (14), indicating that the distribution of the landslides is concentrated and the clustering is strong.
3.1.3. Landslide Mechanism
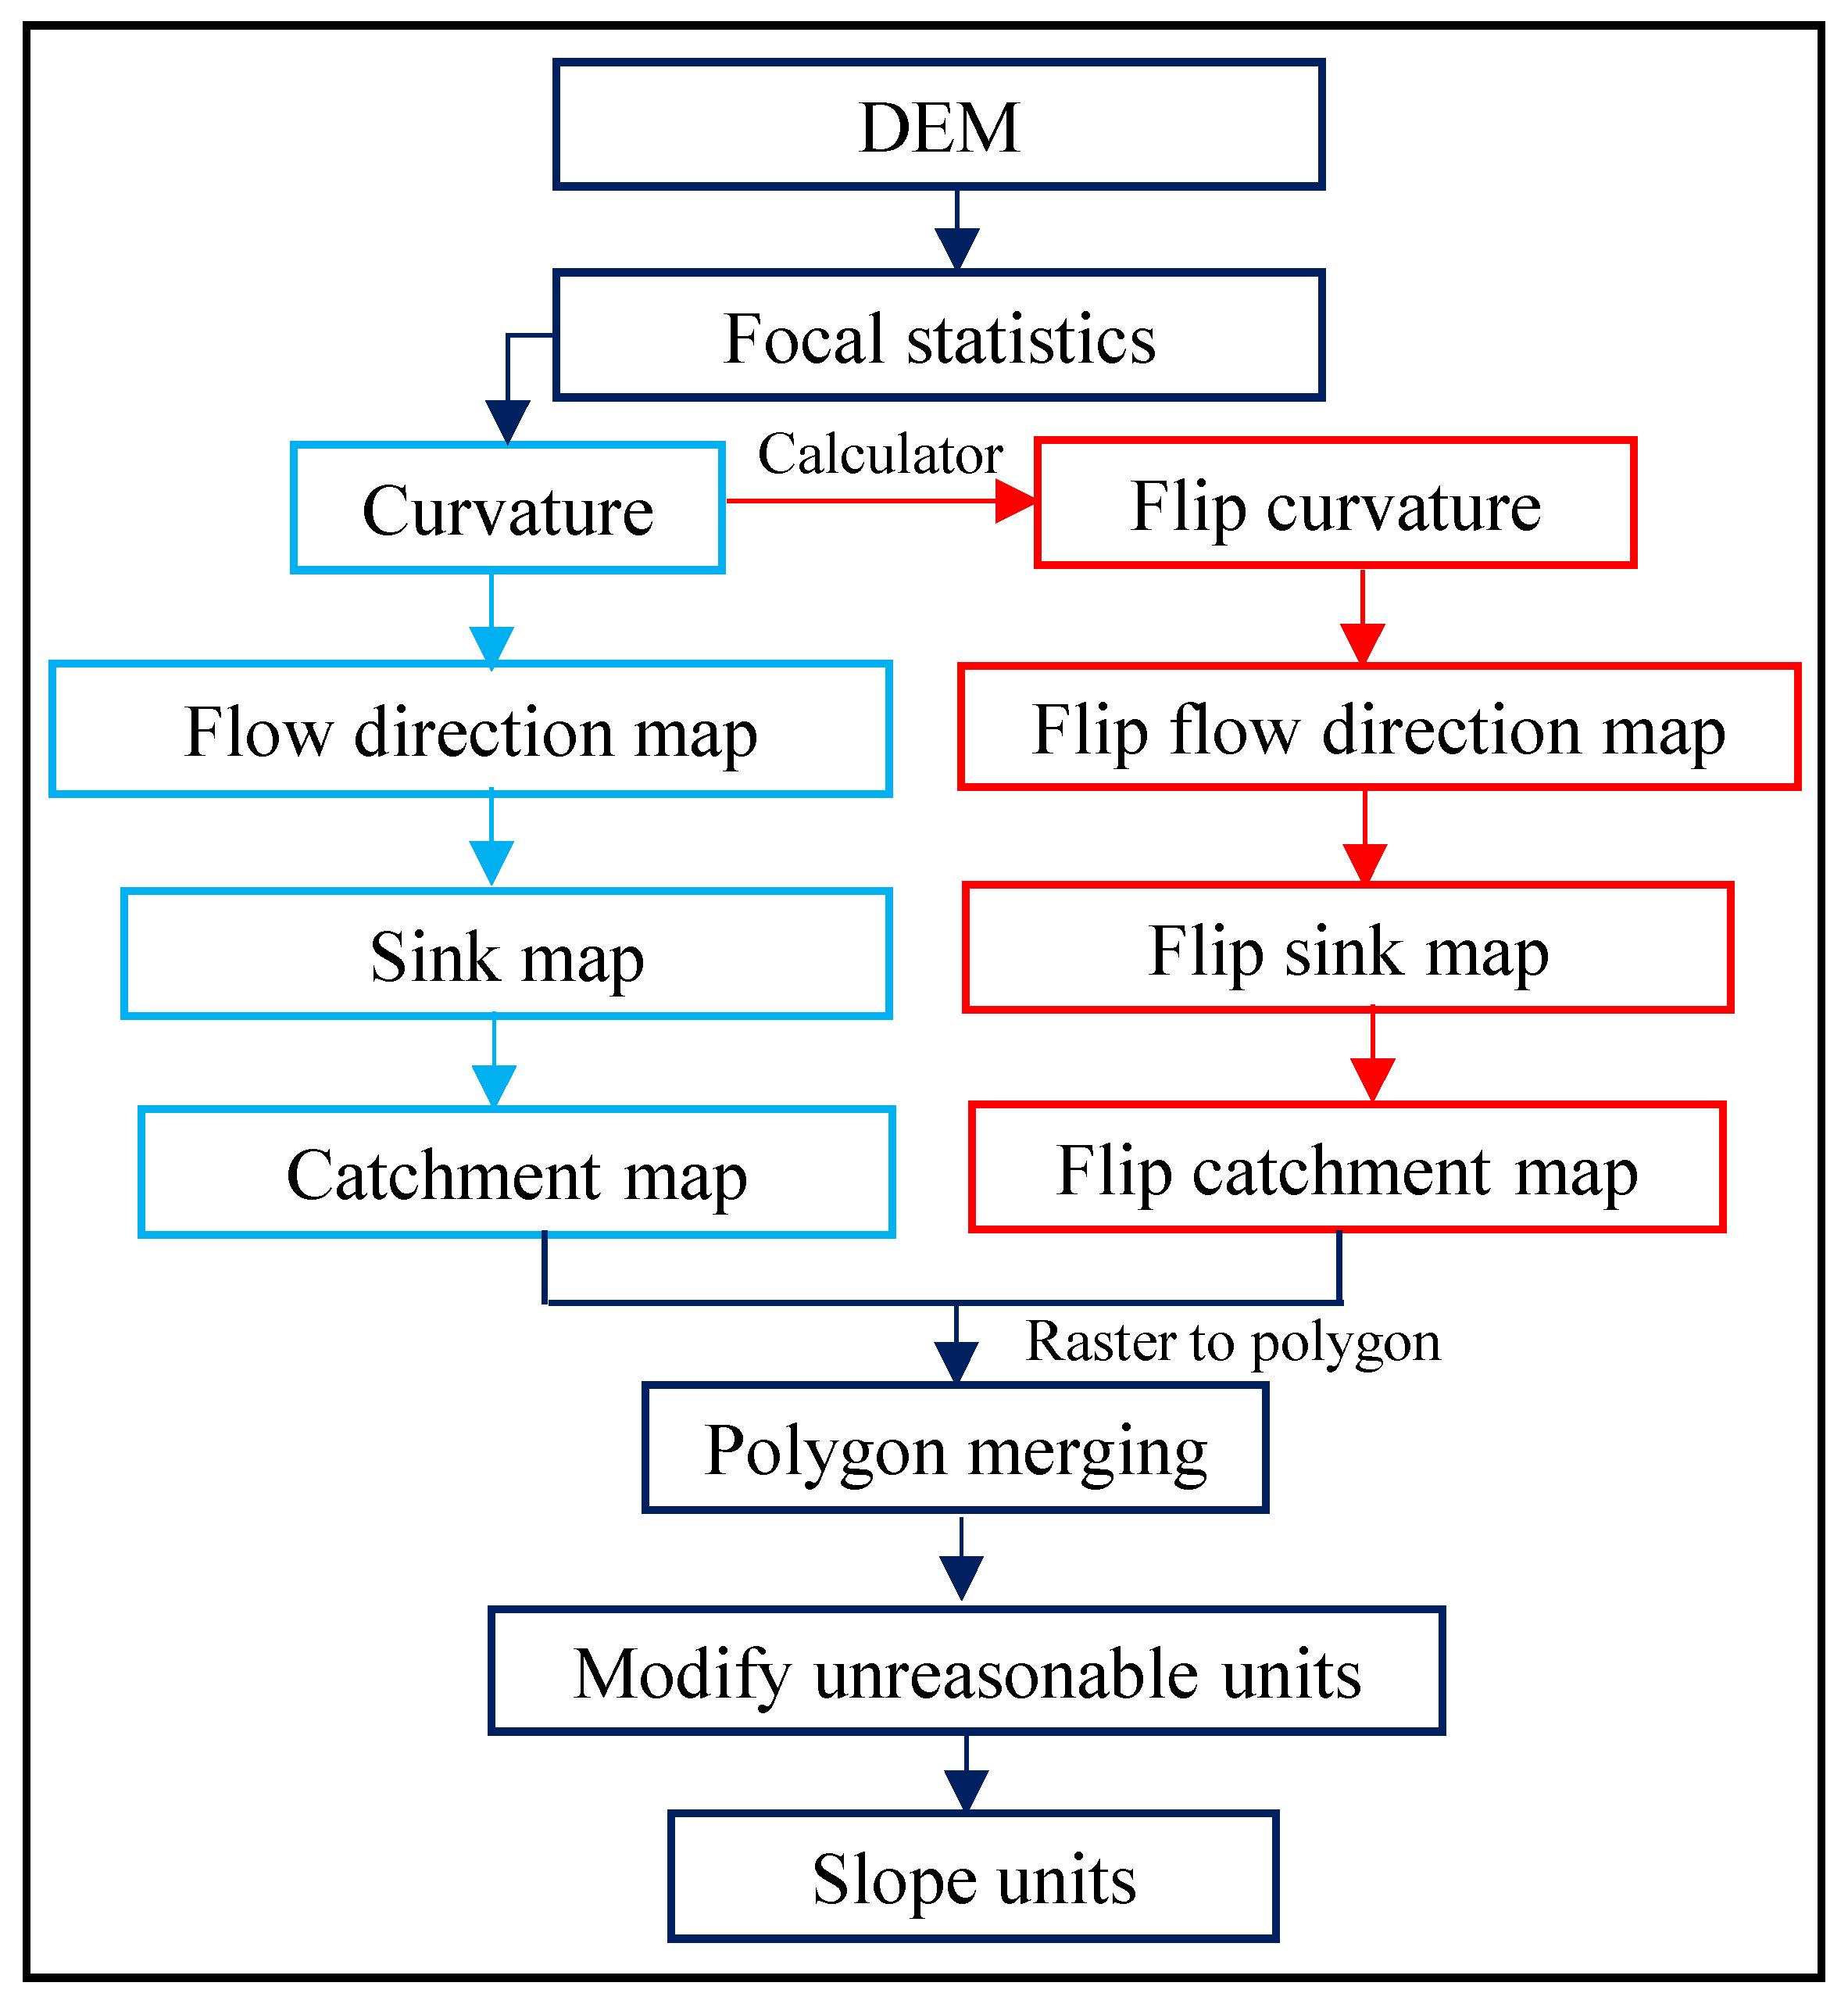
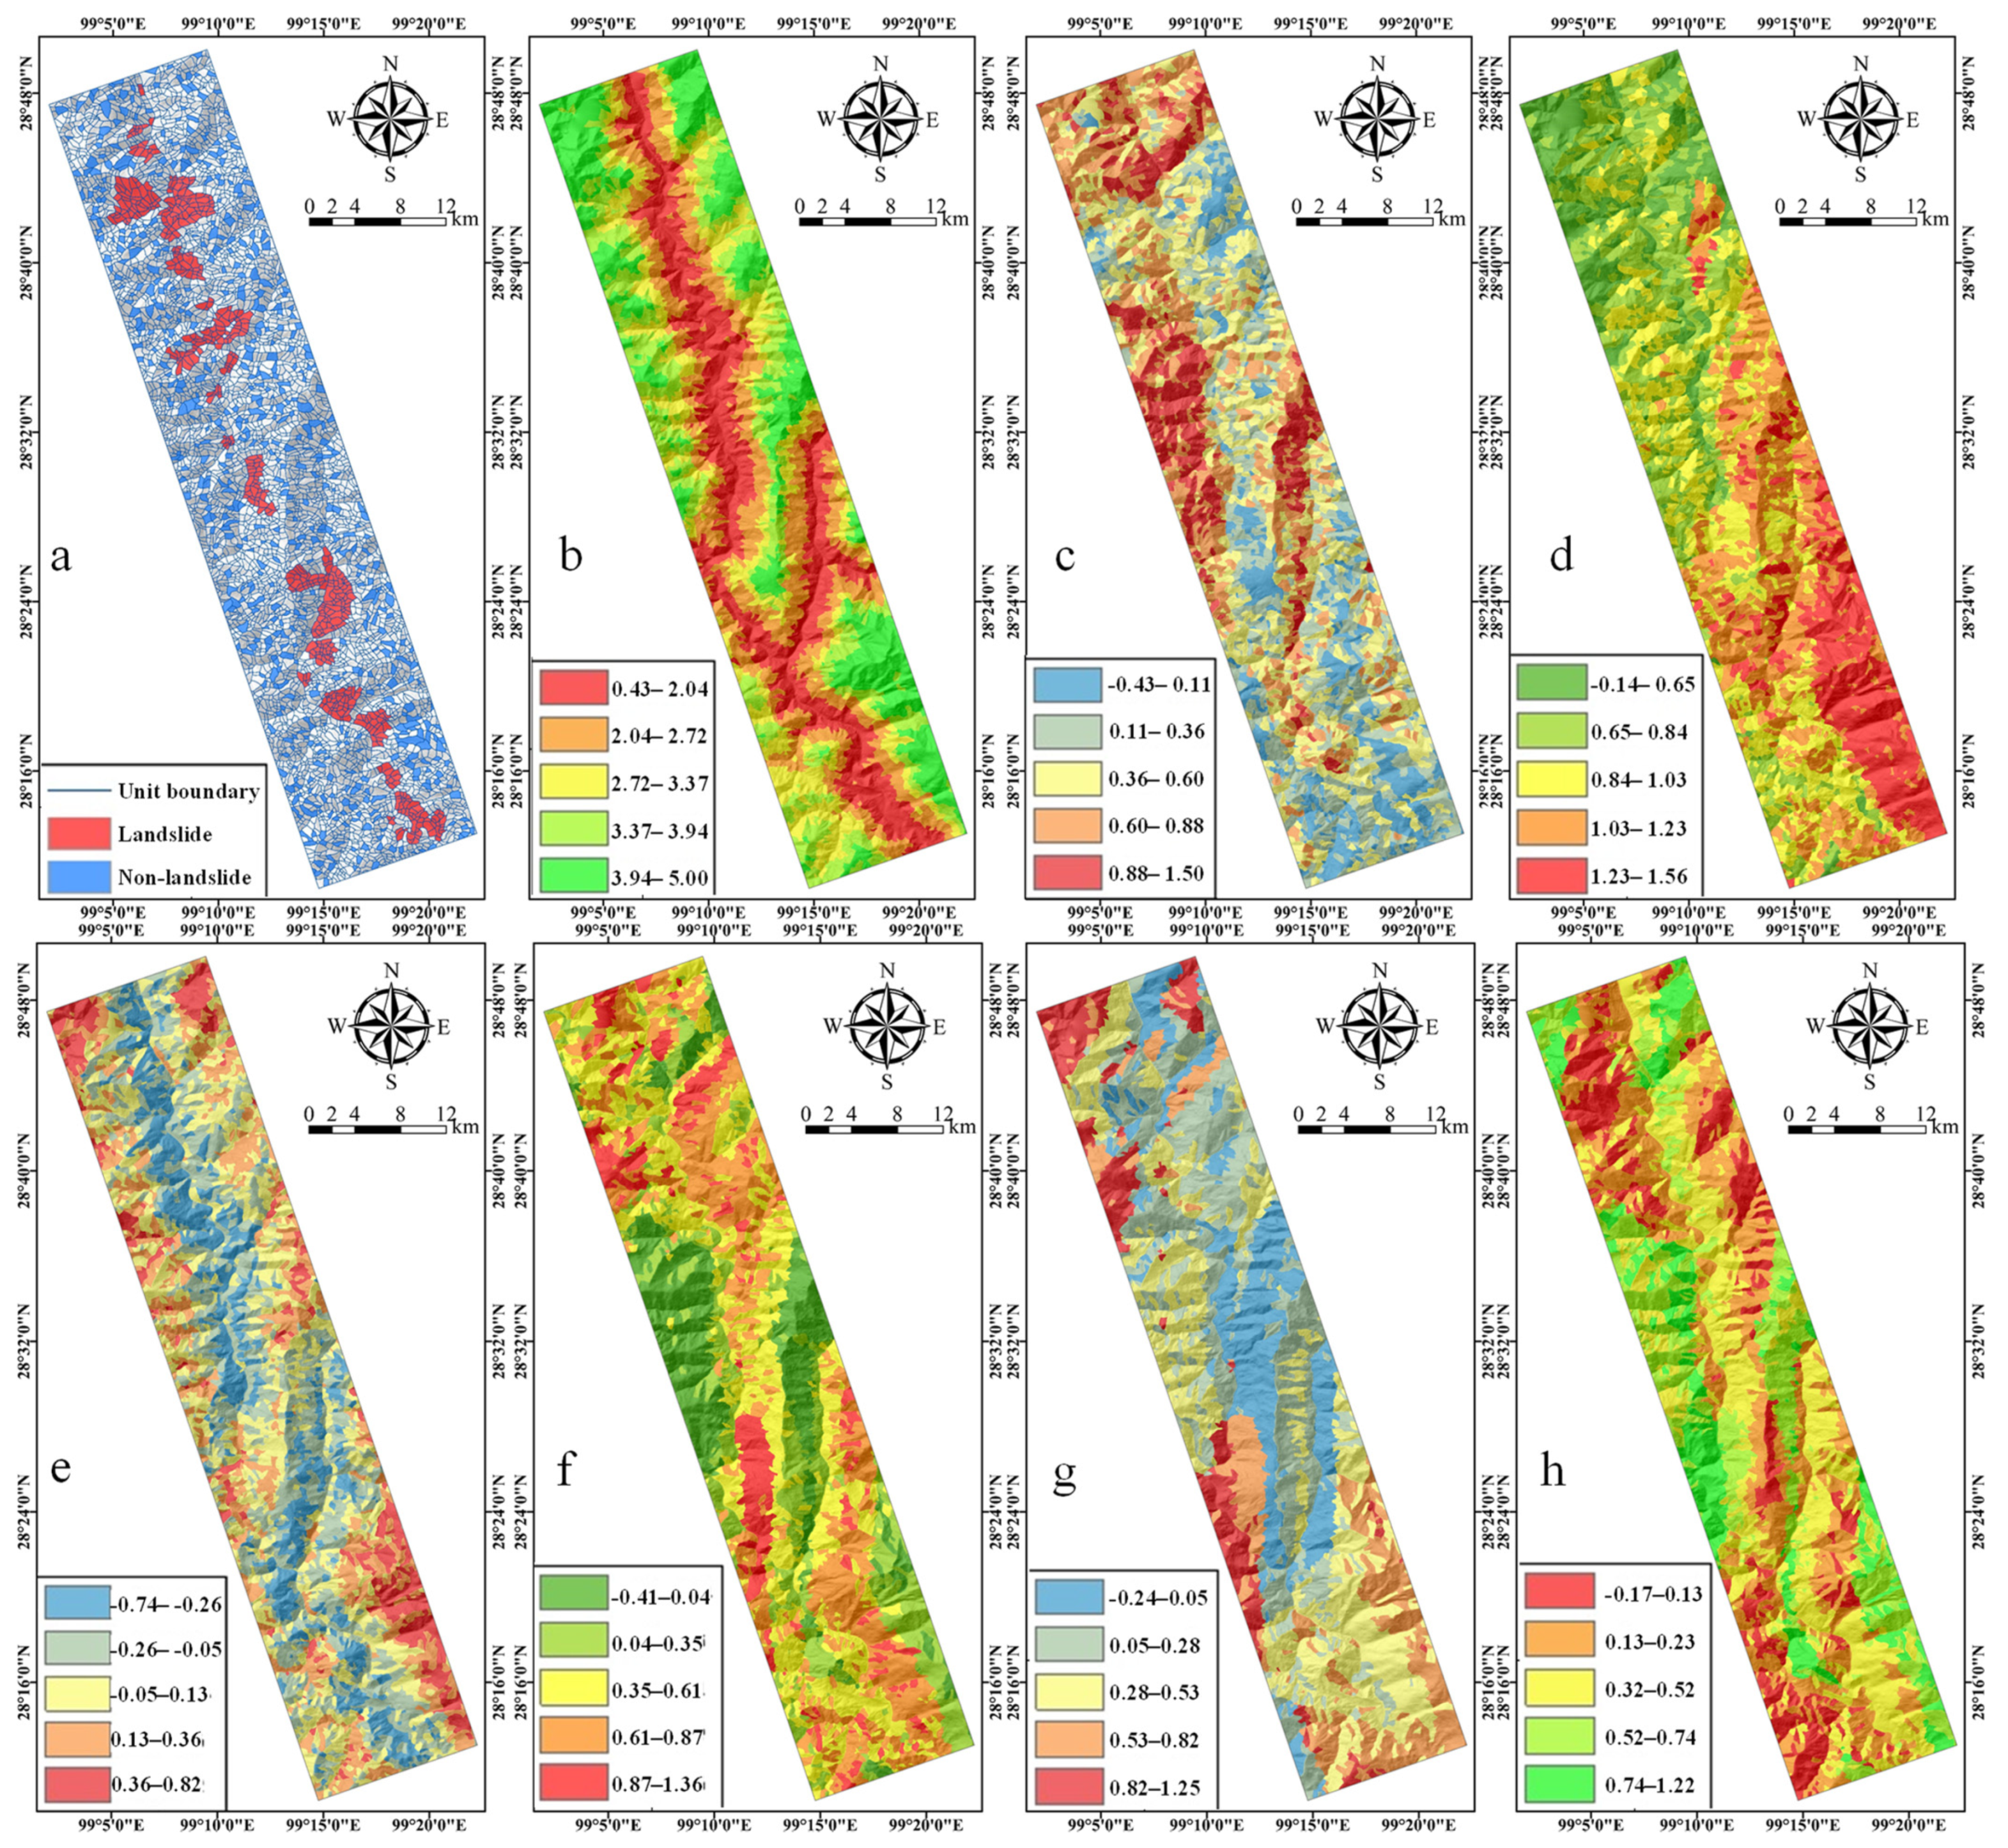
3.2. Mapping Units
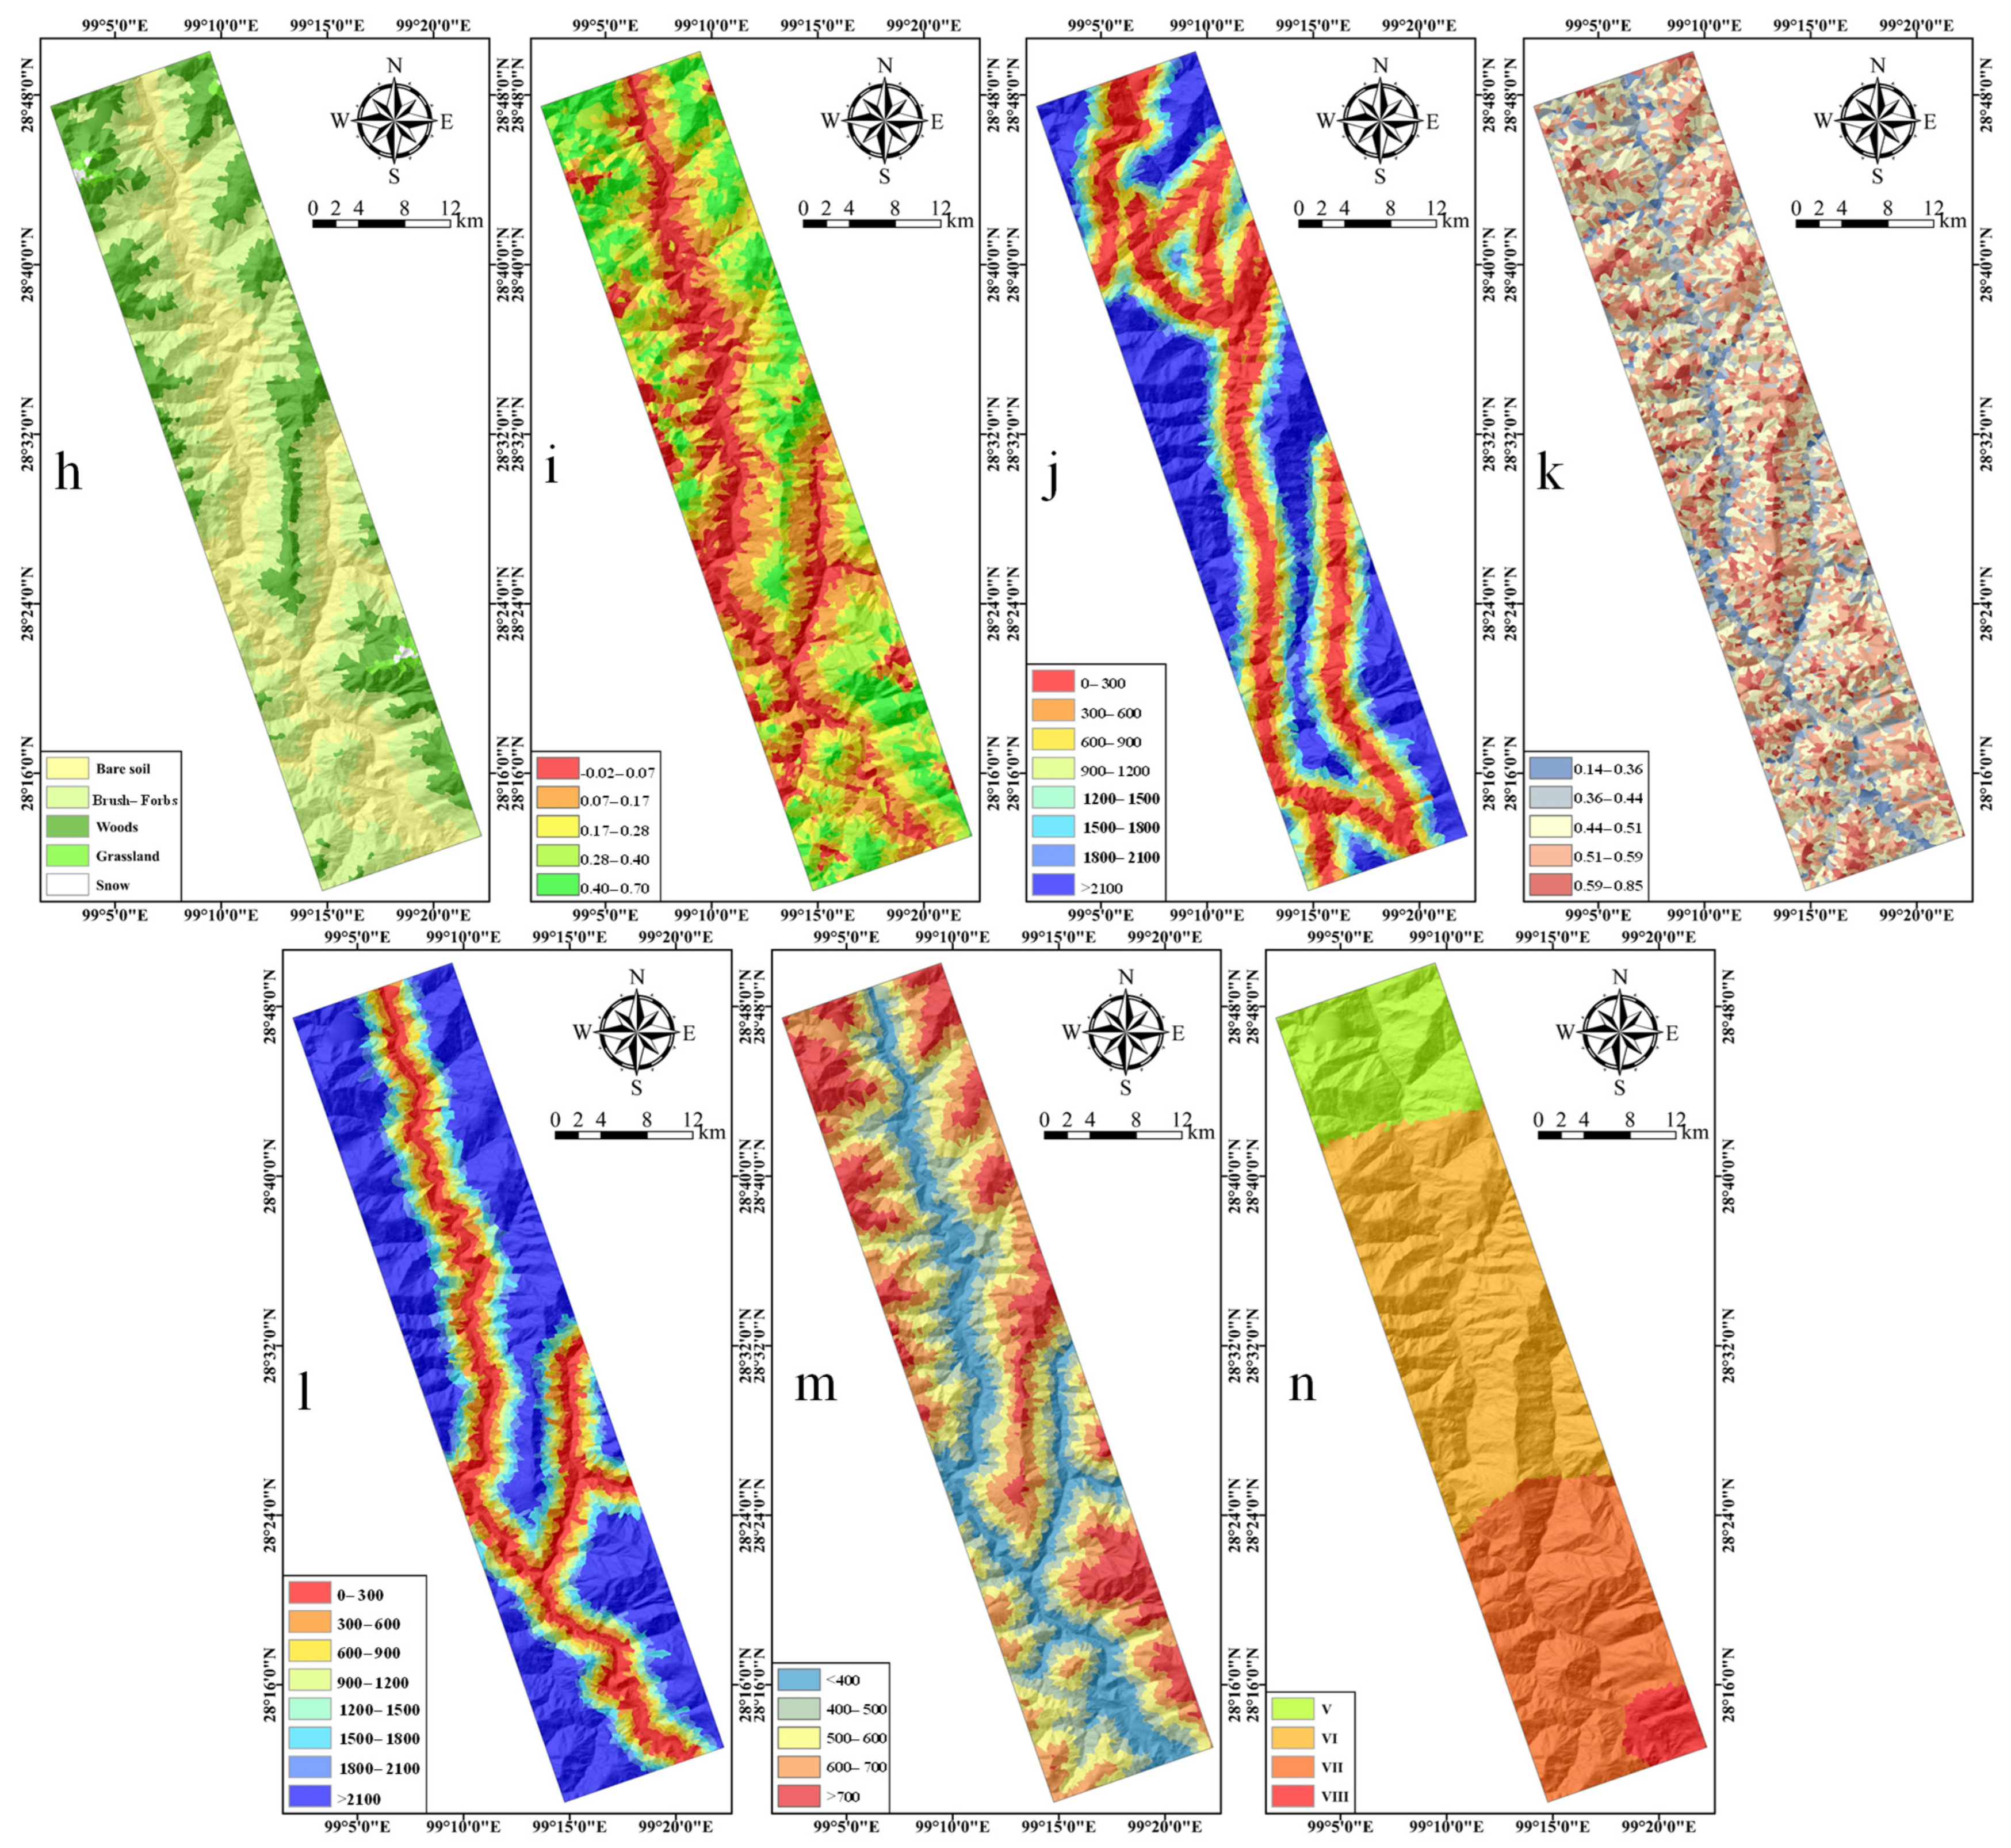
3.3. Conditioning Factors
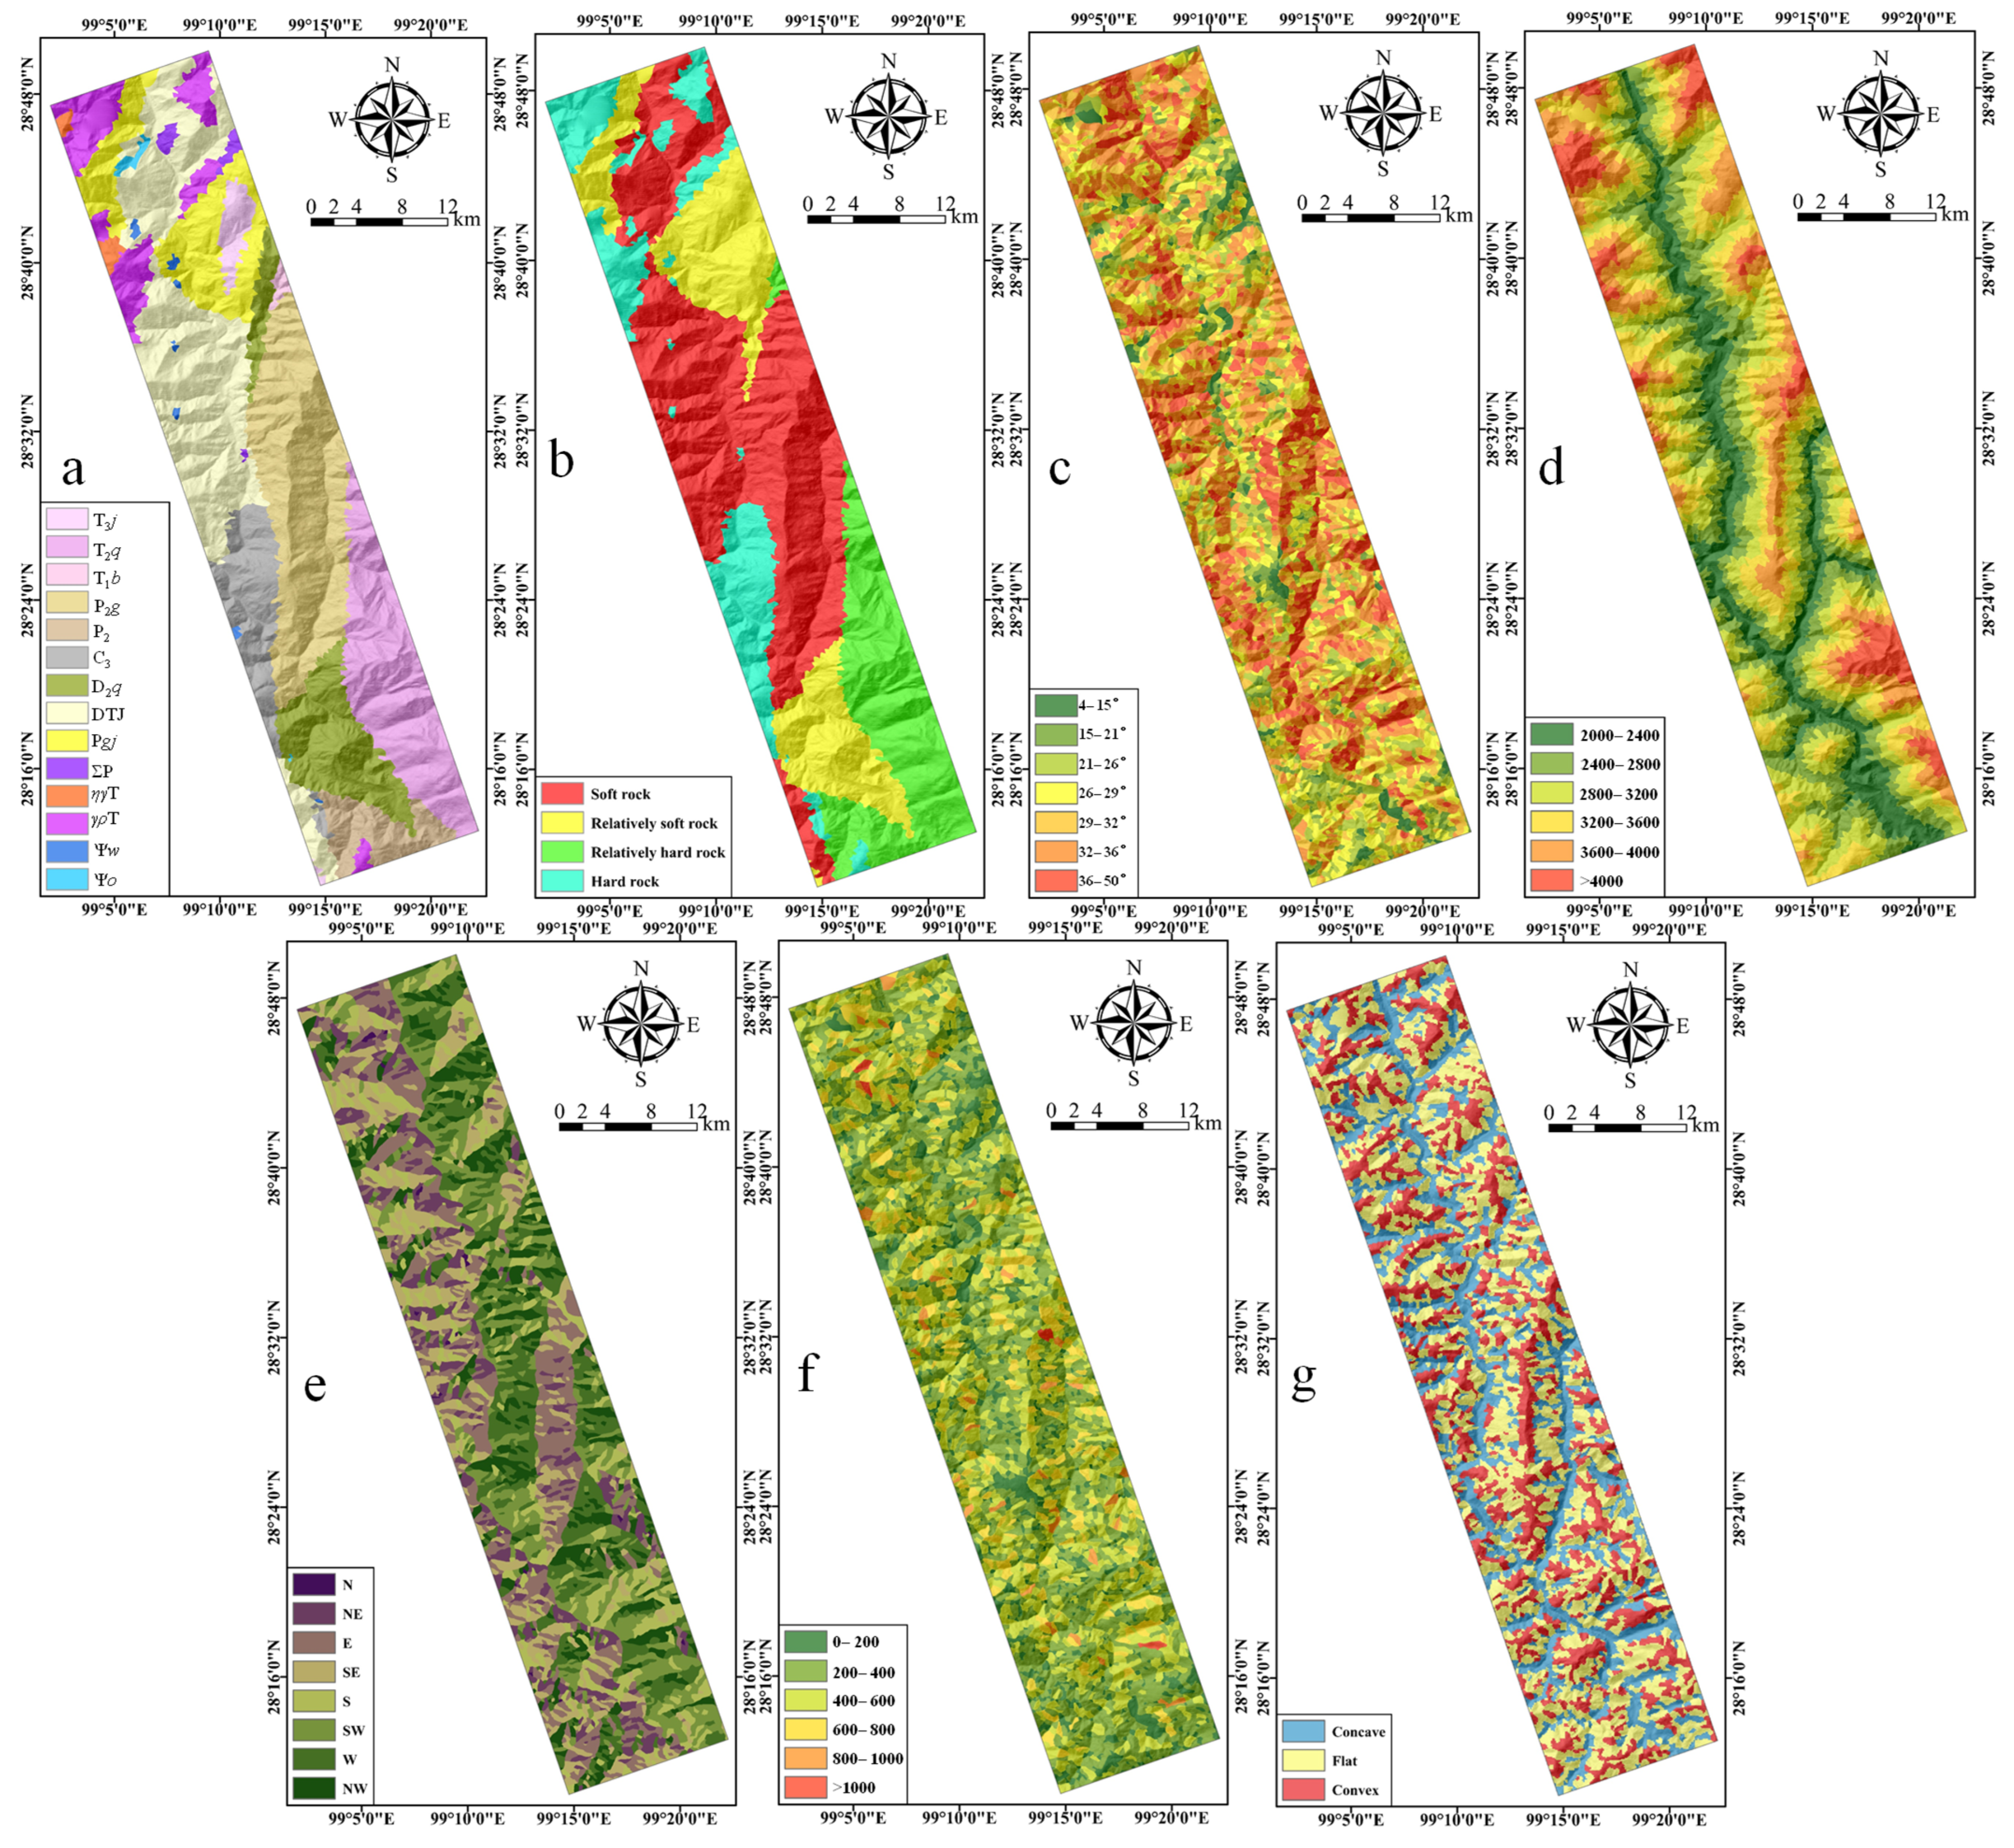
3.3.1. Establishment of the Conditioning Factor System
- (1)
- The rock mass structure is complex
- (2)
- The topographic characteristics are complex
- (3)
- The geological structure is complex
- (4)
- The climatic characteristics are complex
3.3.2. Multicollinearity Analysis of the Conditioning Factors
3.4. Landslide Susceptibility Models
3.4.1. Logistic Regression Model
3.4.2. Random Forest Model
3.4.3. Artificial Neural Network Model
3.5. Validation and Comparison Methods
3.5.1. K-Fold Cross-Validation
- (1)
- The data were randomly divided into five subsets.
- (2)
- Four subsets were used to build the landslide susceptibility model, and the other subset was used as the test datum.
- (3)
- Steps 1–2 were repeated until all five subsets were used as the training data and test data, respectively. In this way, a total of five models were established and five validations were carried out.
- (4)
- The prediction accuracy of the five-times modeling was incorporated, and the prediction accuracy of the different landslide susceptibility models was evaluated.
3.5.2. Statistical Analysis Method
3.5.3. Receiver Operating Characteristic Curve
3.6. Photoluminescence Dating Analysis of the Occurrence Date of the Landslides
4. Results
4.1. Slope Unit Division Results
4.2. Multicollinearity Analysis Results
4.3. Model Fitting Results
5. Discussion
5.1. Model Comparison
5.2. Model Comparison with Other Studies
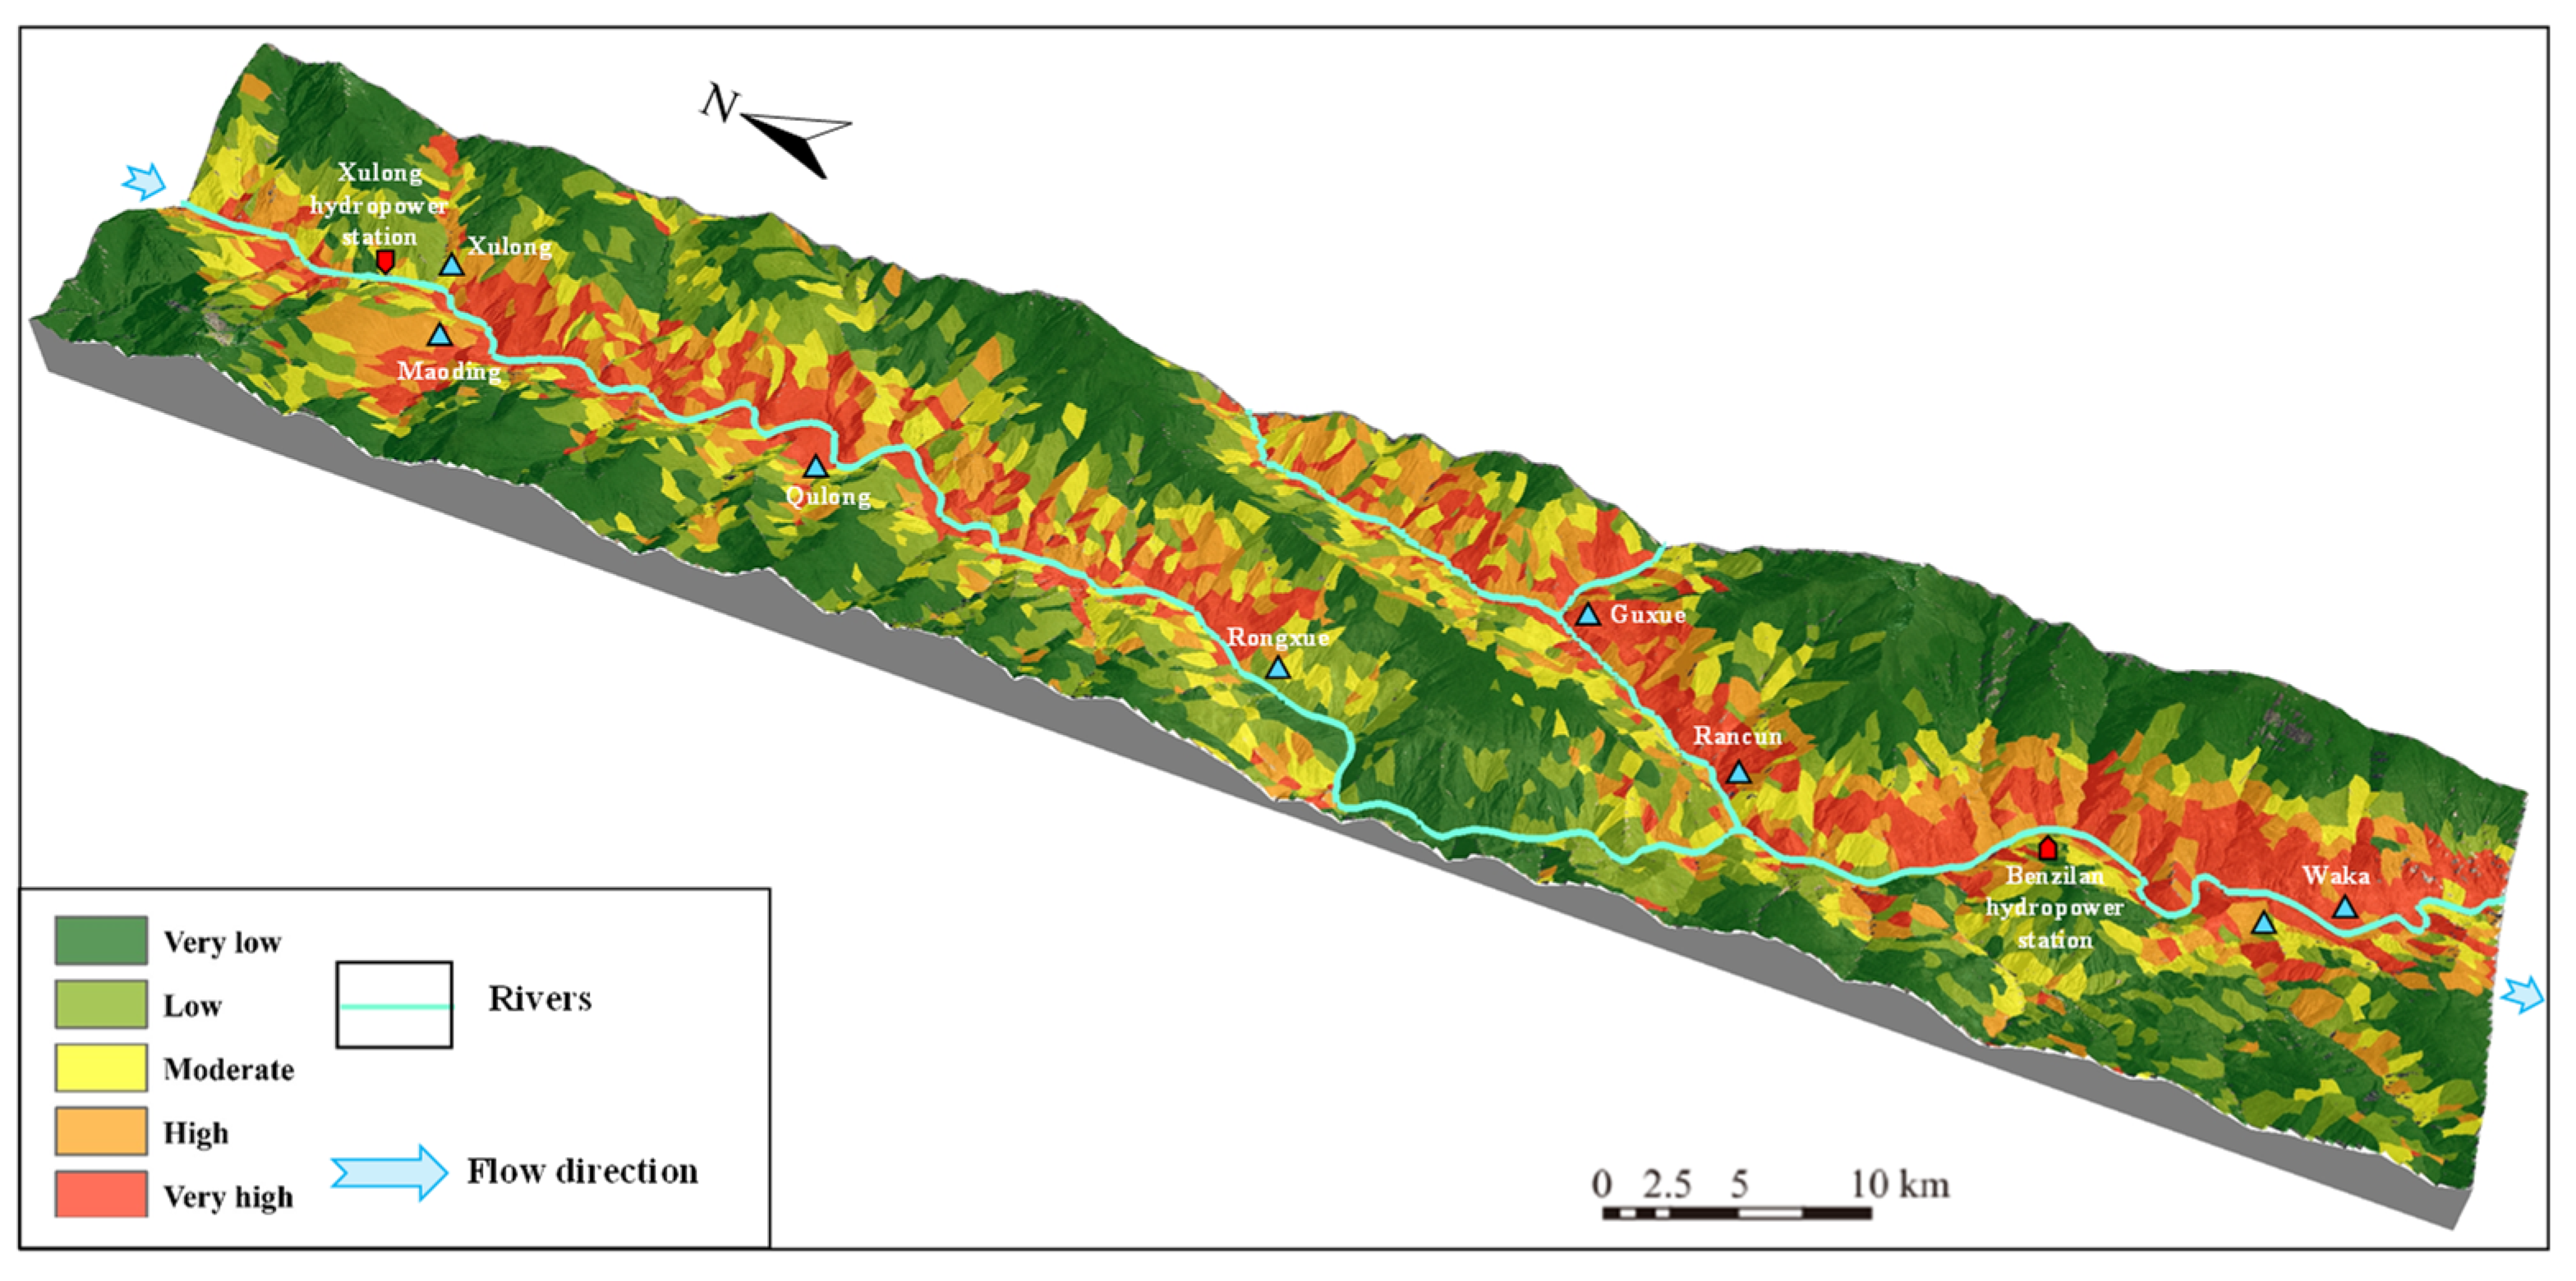
5.3. Landslide Susceptibility Map Analysis
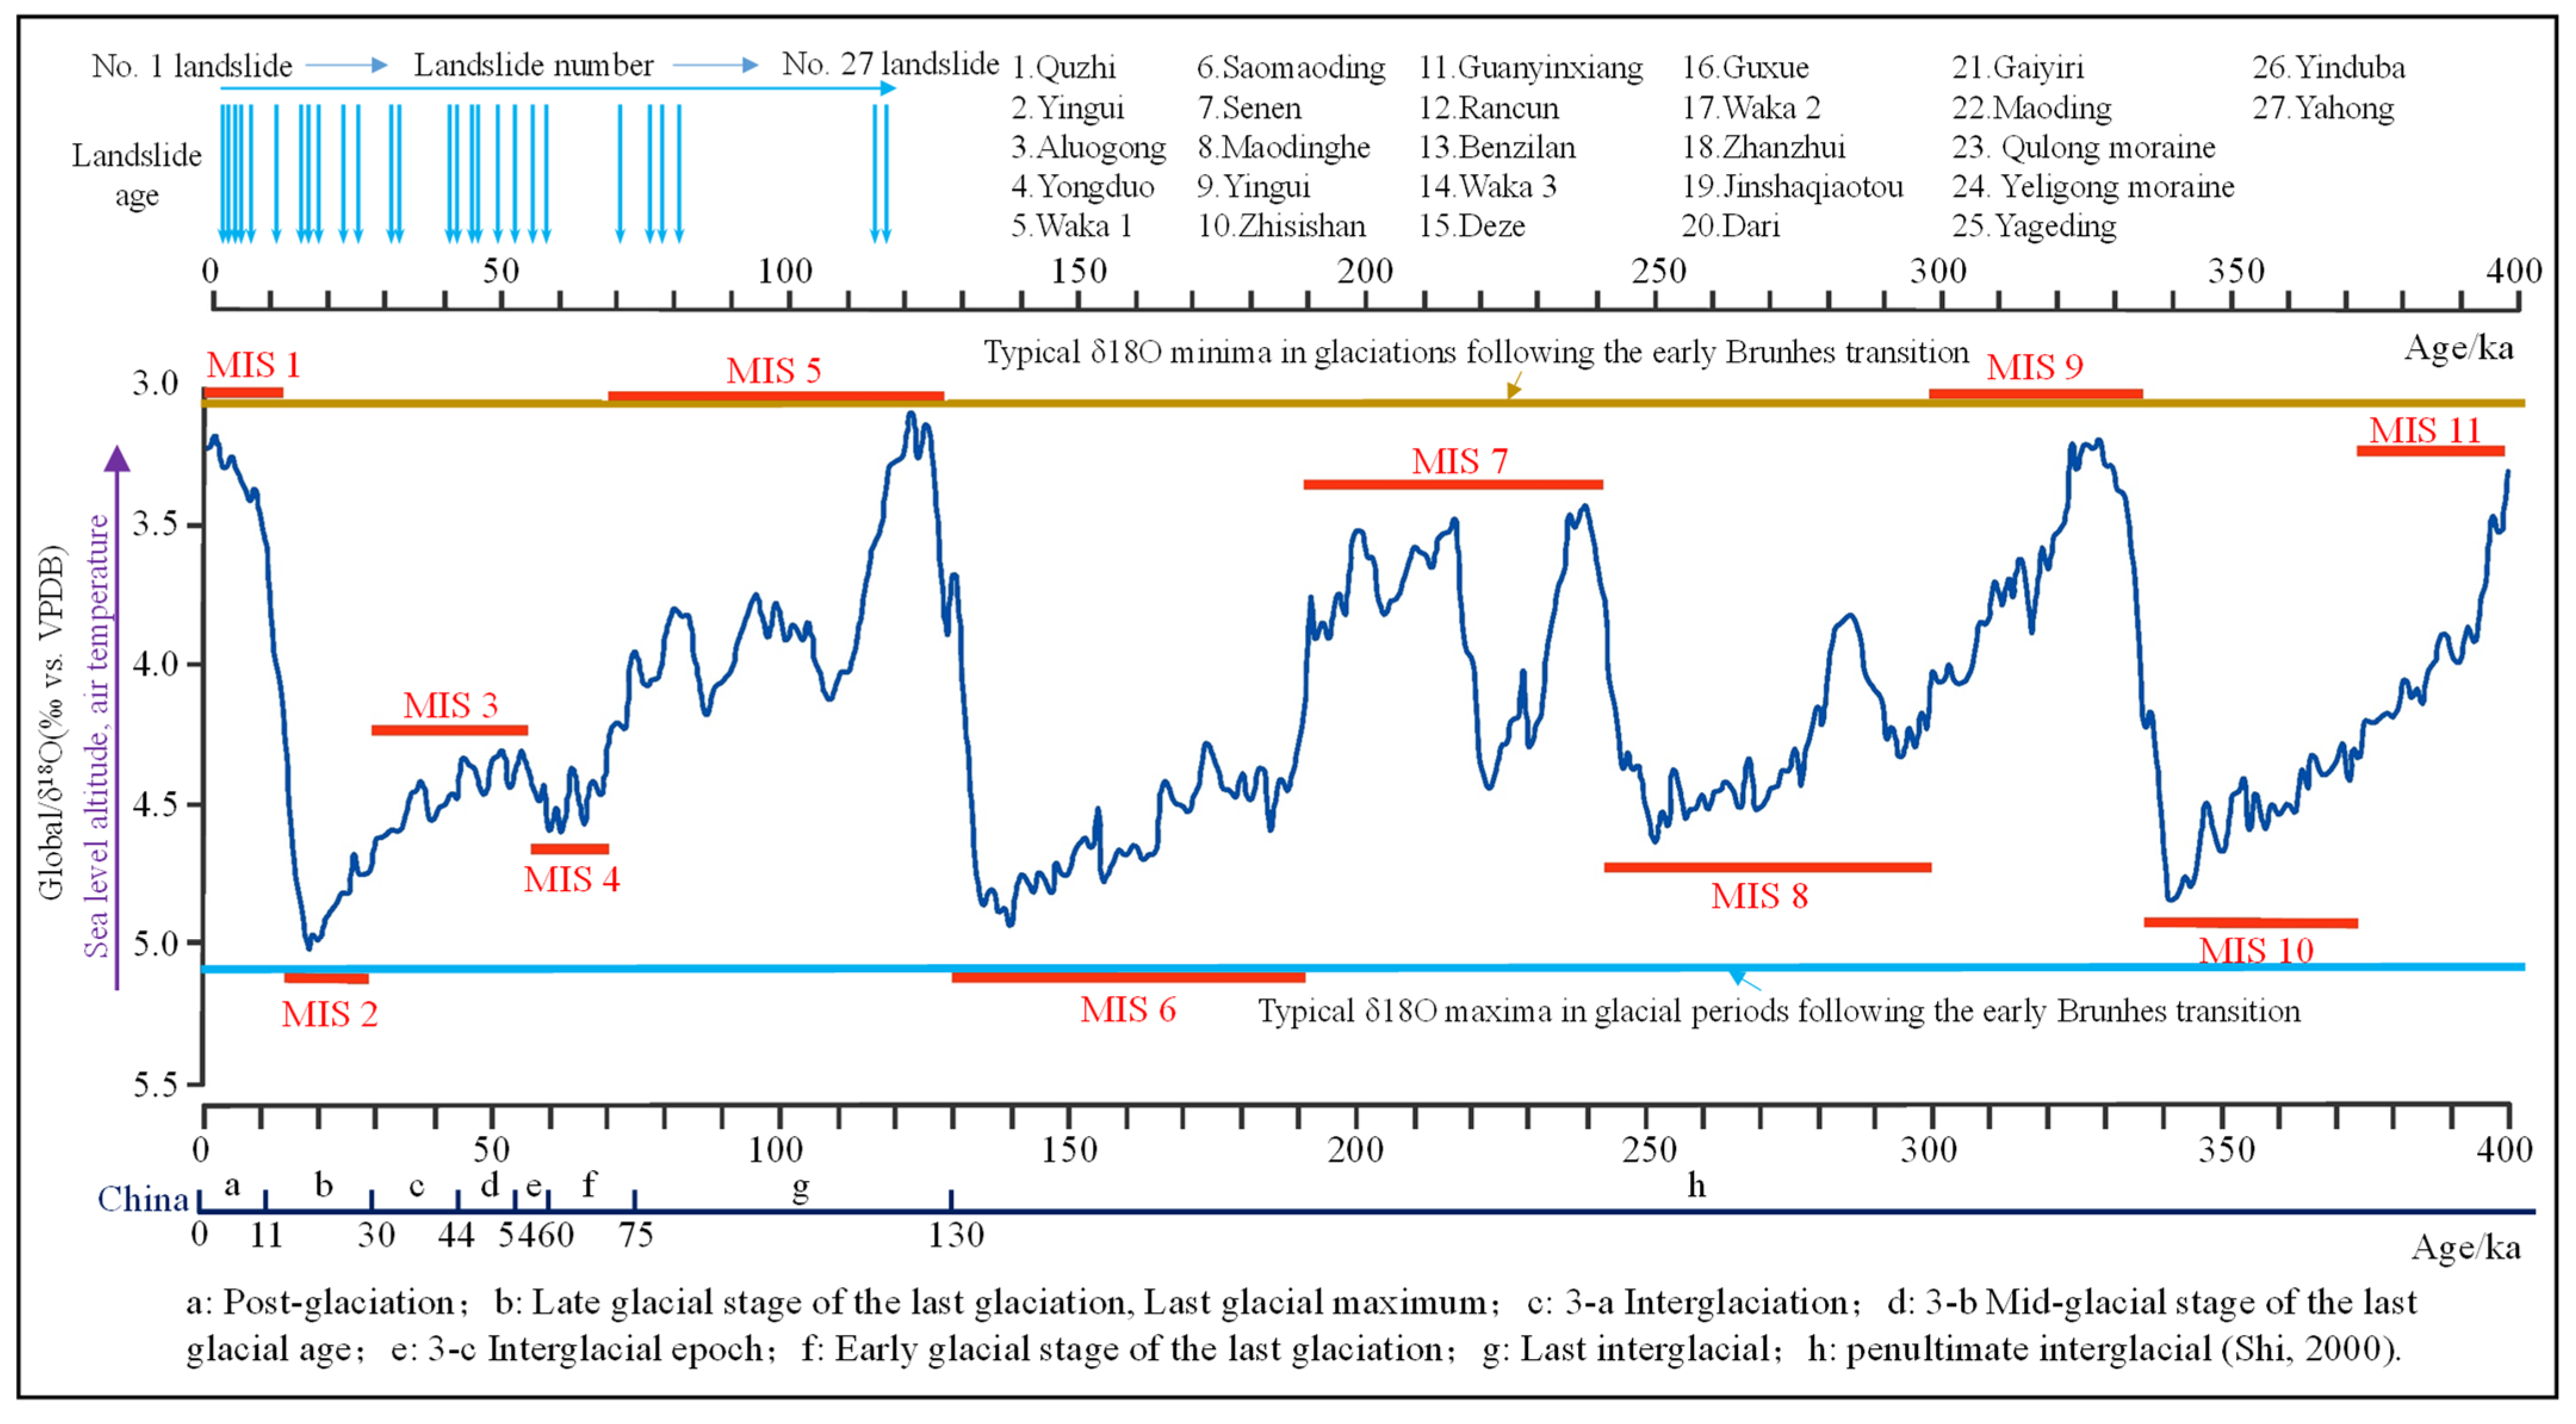
5.4. The Relationship between the Landslides and Crustal Uplift History and Glacial Age
6. Conclusions
- By comparing the results of the three models, it was found that the RF model is the optimal model. The area percentages of very low, low, moderate, high, and very high susceptibility classes were 40.13%, 20.06%, 13.39%, 12.55%, and 13.87%, respectively.
- By analyzing the landslide susceptibility map, it was found that the areas with a very high, high, and moderate landslide susceptibility were mainly distributed in Guxue, Benzilan, and other villages on both sides of the Jinsha and Dingqu Rivers. Since these areas are densely populated with people and buildings, priority should be given to disaster prevention and mitigation.
- By analyzing the relationship between landslides and crustal uplift history and glacial age, it is suggested that the landslide geological hazards in the upper reaches of Jinsha River be controlled by the double disaster effect of the geodynamic system, caused by the rapid uplift of the Tibetan Plateau and the significant decrease in sea level during the glacial period.
Author Contributions
Funding
Institutional Review Board Statement
Informed Consent Statement
Data Availability Statement
Acknowledgments
Conflicts of Interest
References
- Broeckx, J.; Vanmaercke, M.; Duchateau, R.; Poesen, J. A data-based landslide susceptibility map of Africa. Earth-Sci. Rev. 2018, 185, 102–121. [Google Scholar] [CrossRef]
- Deng, Q.; Fu, M.; Ren, X.; Liu, F.; Tang, H. Precedent long-term gravitational deformation of large scale landslides in the Three Gorges reservoir area, China. Eng. Geol. 2017, 221, 170–183. [Google Scholar] [CrossRef]
- Pereira, S.; Zêzere, J.L.; Quaresma, I.D.; Bateira, C. Landslide incidence in the North of Portugal: Analysis of a historical landslide database based on press releases and technical reports. Geomorphology 2014, 214, 514–525. [Google Scholar] [CrossRef]
- Samia, J.; Temme, A.; Bregt, A.; Wallinga, J.; Guzzetti, F.; Ardizzone, F.; Rossi, M. Do landslides follow landslides? Insights in path dependency from a multi-temporal landslide inventory. Landslides 2017, 14, 547–558. [Google Scholar] [CrossRef] [Green Version]
- Wang, H.; Zhang, Y.; Hu, H. A Study on Relationship of Landslide Occurrence and Rainfall. In Civil Engineering, Architecture and Sustainable Infrastructure Ii, Pts 1 and 2; Zhao, S., Xie, Y.M., Liu, H., Gao, D., Eds.; Applied Mechanics and Materials, Trans Tech Publications Ltd.: Baech, Switzerland, 2013; Volume 438–439, pp. 1200–1204. [Google Scholar]
- Wu, C. Landslide Susceptibility Based on Extreme Rainfall-Induced Landslide Inventories and the Following Landslide Evolution. Water 2019, 11, 2609. [Google Scholar] [CrossRef] [Green Version]
- Kao, L.-S.; Chiu, Y.-H.; Tsai, C.-Y. An Evaluation Study of Urban Development Strategy Based on of Extreme Climate Conditions. Sustainability 2017, 9, 284. [Google Scholar] [CrossRef] [Green Version]
- Chen, Z.; Zhou, H.; Ye, F.; Liu, B.; Fu, W. The characteristics, induced factors, and formation mechanism of the 2018 Baige landslide in Jinsha River, Southwest China. Catena 2021, 203, 105337. [Google Scholar] [CrossRef]
- Hu, Y.-X.; Yu, Z.-Y.; Zhou, J.-W. Numerical simulation of landslide-generated waves during the 11 October 2018 Baige landslide at the Jinsha River. Landslides 2020, 17, 2317–2328. [Google Scholar] [CrossRef]
- Tian, S.; Chen, N.; Wu, H.; Yang, C.; Zhong, Z.; Rahman, M. New insights into the occurrence of the Baige landslide along the Jinsha River in Tibet. Landslides 2020, 17, 1207–1216. [Google Scholar] [CrossRef]
- Zhan, J.; Chen, J.; Zhang, W.; Han, X.; Sun, X.; Bao, Y. Mass movements along a rapidly uplifting river valley: An example from the upper Jinsha River, southeast margin of the Tibetan Plateau. Environ. Earth Sci. 2018, 77, 634. [Google Scholar] [CrossRef]
- Li, Y.; Wang, C.; Dai, J.; Xu, G.; Hou, Y.; Li, X. Propagation of the deformation and growth of the Tibetan–Himalayan orogen: A review. Earth-Sci. Rev. 2015, 143, 36–61. [Google Scholar] [CrossRef]
- Shi, Y. A Suggestion to Improve the Chronology of Quaternary Glaciations in China. J. Glaciol. Geocryol. 2002, 24, 687–692. [Google Scholar]
- Fan, Q.; Ma, H.; Hou, G. Late Pleistocene lake and glaciation evolution on the northeastern Qinghai–Tibetan Plateau: A review. Environ. Earth Sci. 2011, 66, 625–634. [Google Scholar] [CrossRef]
- Yi, C.; Zhu, Z.; Wei, L.; Cui, Z.; Zheng, B.; Shi, Y.; Chaolu, Y.; Zhiyong, Z.; Ling, W.; Zhijiu, C.; et al. Advances in Numerical Dating of Quaternary Glaciations in China. Z. Geomorphol. 2007, 51, 153–175. [Google Scholar] [CrossRef]
- Wang, F.; Xu, P.; Wang, C.; Wang, N.; Jiang, N. Application of a GIS-Based Slope Unit Method for Landslide Susceptibility Mapping along the Longzi River, Southeastern Tibetan Plateau, China. ISPRS Int. J. Geo-Inf. 2017, 6, 172. [Google Scholar] [CrossRef] [Green Version]
- Bao, Y.; Sun, X.; Zhou, X.; Zhang, Y.; Liu, Y. Some numerical approaches for landslide river blocking: Introduction, simulation, and discussion. Landslides 2021, 18, 3907–3922. [Google Scholar] [CrossRef]
- Su, Y.-Q.; Gong, F.-Q.; Luo, S.; Liu, Z.-X. Experimental study on energy storage and dissipation characteristics of granite under two-dimensional compression with constant confining pressure. J. Central South Univ. 2021, 28, 848–865. [Google Scholar] [CrossRef]
- Wu, Z.-J.; Wang, Z.-Y.; Fan, L.-F.; Weng, L.; Liu, Q.-S. Micro-failure process and failure mechanism of brittle rock under uniaxial compression using continuous real-time wave velocity measurement. J. Central South Univ. 2021, 28, 556–571. [Google Scholar] [CrossRef]
- Dou, Z.; Tang, S.; Zhang, X.; Liu, R.; Zhuang, C.; Wang, J.; Zhou, Z.; Xiong, H. Influence of shear displacement on fluid flow and solute transport in a 3D rough fracture. Lithosphere 2021, 2021, 1569736. [Google Scholar] [CrossRef]
- Chen, D.; Chen, H.; Zhang, W.; Lou, J.; Shan, B. An analytical solution of equivalent elastic modulus considering confining stress and its variables sensitivity analysis for fractured rock masses. J. Rock Mech. Geotech. Eng. 2021; in press. [Google Scholar]
- Dou, Z.; Liu, Y.; Zhang, X.; Wang, Y.; Chen, Z.; Wang, J.; Zhou, Z. Influence of Layer Transition Zone on Rainfall-Induced Instability of Multilayered Slope. Lithosphere 2021, 2021, 2277284. [Google Scholar] [CrossRef]
- Cao, C.; Wang, Q.; Chen, J.; Ruan, Y.; Zheng, L.; Song, S.; Niu, C. Landslide Susceptibility Mapping in Vertical Distribution Law of Precipitation Area: Case of the Xulong Hydropower Station Reservoir, Southwestern China. Water 2016, 8, 270. [Google Scholar] [CrossRef] [Green Version]
- Wang, Z.; Cui, P.; Yu, G.-A.; Zhang, K. Stability of landslide dams and development of knickpoints. Environ. Earth Sci. 2012, 65, 1067–1080. [Google Scholar] [CrossRef]
- Wang, P.; Chen, J.; Dai, F.; Long, W.; Xu, C.; Sun, J.; Cui, Z. Chronology of relict lake deposits around the Suwalong paleolandslide in the upper Jinsha River, SE Tibetan Plateau: Implications to Holocene tectonic perturbations. Geomorphology 2014, 217, 193–203. [Google Scholar] [CrossRef]
- Ning, Y.; Zhang, G.; Tang, H.; Shen, W.; Shen, P. Process Analysis of Toppling Failure on Anti-dip Rock Slopes Under Seismic Load in Southwest China. Rock Mech. Rock Eng. 2019, 52, 4439–4455. [Google Scholar] [CrossRef]
- Tao, Z.; Zhu, C.; He, M.; Karakus, M. A physical modeling-based study on the control mechanisms of Negative Poisson’s ratio anchor cable on the stratified toppling deformation of anti-inclined slopes. Int. J. Rock Mech. Min. Sci. 2021, 138, 104632. [Google Scholar] [CrossRef]
- Wang, Y.; Yang, H.; Han, J.; Zhu, C. Effect of rock bridge length on fracture and damage modelling in granite containing hole and fissures under cyclic uniaxial increasing-amplitude decreasing-frequency (CUIADF) loads. Int. J. Fatigue 2022, 158, 106741. [Google Scholar] [CrossRef]
- Zhang, G.; Wang, F.; Zhang, H.; Tang, H.; Li, X.; Zhong, Y. New stability calculation method for rock slopes subject to flexural toppling failure. Int. J. Rock Mech. Min. Sci. 2018, 106, 319–328. [Google Scholar] [CrossRef]
- Zhu, C.; He, M.; Karakus, M.; Cui, X.; Tao, Z. Investigating Toppling Failure Mechanism of Anti-dip Layered Slope due to Excavation by Physical Modelling. Rock Mech. Rock Eng. 2020, 53, 5029–5050. [Google Scholar] [CrossRef]
- Zhu, C.; Karakus, M.; He, M.; Meng, Q.; Shang, J.; Wang, Y.; Yin, Q. Volumetric deformation and damage evolution of Tibet interbedded skarn under multistage constant-amplitude-cyclic loading. Int. J. Rock Mech. Min. Sci. 2022, 152, 105066. [Google Scholar] [CrossRef]
- Zhang, Y.; Tang, H.; Li, C.; Lu, G.; Cai, Y.; Zhang, J.; Tan, F. Design and Testing of a Flexible Inclinometer Probe for Model Tests of Landslide Deep Displacement Measurement. Sensors 2018, 18, 224. [Google Scholar] [CrossRef] [Green Version]
- Su, M.-B.; Chen, I.-H.; Liao, C.-H. Using TDR Cables and GPS for Landslide Monitoring in High Mountain Area. J. Geotech. Geoenviron. Eng. 2009, 135, 1113–1121. [Google Scholar] [CrossRef] [Green Version]
- Zhu, H.-H.; Shi, B.; Zhang, C.-C. FBG-Based Monitoring of Geohazards: Current Status and Trends. Sensors 2017, 17, 452. [Google Scholar] [CrossRef] [PubMed]
- Caviedes-Voullième, D.; Juez, C.; Murillo, J.; García-Navarro, P. 2D dry granular free-surface flow over complex topography with obstacles. Part I: Experimental study using a consumer-grade RGB-D sensor. Comput. Geosci. 2014, 73, 177–197. [Google Scholar] [CrossRef]
- Cao, C.; Zhang, W.; Chen, J.; Shan, B.; Song, S.; Zhan, J. Quantitative estimation of debris flow source materials by integrating multi-source data: A case study. Eng. Geol. 2021, 291, 106222. [Google Scholar] [CrossRef]
- Wasowski, J.; Bovenga, F. Investigating landslides and unstable slopes with satellite Multi Temporal Interferometry: Current issues and future perspectives. Eng. Geol. 2014, 174, 103–138. [Google Scholar] [CrossRef]
- Yang, W.; Liu, L.; Shi, P. Detecting precursors of an imminent landslide along the Jinsha River. Nat. Hazards Earth Syst. Sci. 2020, 20, 3215–3224. [Google Scholar] [CrossRef]
- Zhao, C.; Kang, Y.; Zhang, Q.; Lu, Z.; Li, B. Landslide Identification and Monitoring along the Jinsha River Catchment (Wudongde Reservoir Area), China, Using the InSAR Method. Remote Sens. 2018, 10, 993. [Google Scholar] [CrossRef] [Green Version]
- Pham, B.T.; Bui, D.T.; Pourghasemi, H.R.; Indra, P.; Dholakia, M.B. Landslide susceptibility assesssment in the Uttarakhand area (India) using GIS: A comparison study of prediction capability of naïve bayes, multilayer perceptron neural networks, and functional trees methods. Arch. Meteorol. Geophys. Bioclimatol. Ser. B 2017, 128, 255–273. [Google Scholar] [CrossRef]
- Pham, B.T.; Bui, D.T.; Dholakia, M.; Prakash, I.; Pham, H.V.; Mehmood, K.; Le, H.Q. A novel ensemble classifier of rotation forest and Naïve Bayer for landslide susceptibility assessment at the Luc Yen district, Yen Bai Province (Viet Nam) using GIS. Geomat. Nat. Hazards Risk 2017, 8, 649–671. [Google Scholar] [CrossRef] [Green Version]
- Pradhan, B.; Lee, S. Landslide susceptibility assessment and factor effect analysis: Backpropagation artificial neural networks and their comparison with frequency ratio and bivariate logistic regression modelling. Environ. Model. Softw. 2010, 25, 747–759. [Google Scholar] [CrossRef]
- Sun, X.; Chen, J.; Han, X.; Bao, Y.; Zhan, J.; Peng, W. Application of a GIS-based slope unit method for landslide susceptibility mapping along the rapidly uplifting section of the upper Jinsha River, South-Western China. Bull. Eng. Geol. Environ. 2020, 79, 533–549. [Google Scholar] [CrossRef]
- Sun, X.; Chen, J.; Bao, Y.; Han, X.; Zhan, J.; Peng, W. Landslide Susceptibility Mapping Using Logistic Regression Analysis along the Jinsha River and Its Tributaries Close to Derong and Deqin County, Southwestern China. ISPRS Int. J. Geo-Inf. 2018, 7, 438. [Google Scholar] [CrossRef] [Green Version]
- Harris, N. The elevation history of the Tibetan Plateau and its implications for the Asian monsoon. Palaeogeogr. Palaeoclim. Palaeoecol. 2006, 241, 4–15. [Google Scholar] [CrossRef]
- Li, J.; Fang, X. Uplift of the Tibetan Plateau and environmental changes. Chin. Sci. Bull. 1999, 44, 2117–2124. [Google Scholar] [CrossRef]
- Xiao, X.C.; Wang, J. A brief review of tectonic evolution and uplift of the Qinghai-Tibet Plateau. Geol. Rev. 1998, 44, 372–381. [Google Scholar]
- Chen, J.; Li, H. Genetic Mechanism and Disasters Features of Complicated Structural Rock Mass Along the Rapidly Uplift Section at the Upstream of Jinsha River. J. Jilin Univ. 2016, 46, 1153–1167. [Google Scholar]
- Sun, X.; Chen, J.; Han, X.; Bao, Y.; Zhou, X.; Peng, W. Landslide susceptibility mapping along the upper Jinsha River, south-western China: A comparison of hydrological and curvature watershed methods for slope unit classification. Bull. Eng. Geol. Environ. 2020, 79, 4657–4670. [Google Scholar] [CrossRef]
- Ba, Q.; Chen, Y.; Deng, S.; Yang, J.; Li, H. A comparison of slope units and grid cells as mapping units for landslide susceptibility assessment. Earth Sci. Inform. 2018, 11, 373–388. [Google Scholar] [CrossRef]
- Broeckx, J.; Maertens, M.; Isabirye, M.; Vanmaercke, M.; Namazzi, B.; Deckers, J.; Tamale, J.; Jacobs, L.; Thiery, W.; Kervyn, M.; et al. Landslide susceptibility and mobilization rates in the Mount Elgon region, Uganda. Landslides 2019, 16, 571–584. [Google Scholar] [CrossRef]
- Dhianaufal, D.; Kristyanto, T.H.W.; Indra, T.L.; Syahputra, R. Fuzzy Logic Method for Landslide Susceptibility Mapping in Volcanic Sediment Area in Western Bogor. In Proceedings of the 3rd International Symposium on Current Progress in Mathematics and Sciences, Bali, Indonesia, 26–27 July 2017. [Google Scholar]
- Lee, C.-T.; Chung, C.-C. Common Patterns among Different Landslide Susceptibility Models of the Same Region. In Advancing Culture of Living with Landslides. Volume 2: Advances in Landslide Science, Proceedings of the 4th World Landslide Forum, Ljubljana, Slovenia, 29 May–2 June 2017; Springer International Publishing: Cham, Switzerland, 2017; pp. 937–942. [Google Scholar]
- Xing, X.; Wu, C.; Li, J.; Li, X.; Zhang, L.; He, R. Susceptibility assessment for rainfall-induced landslides using a revised logistic regression method. Nat. Hazards 2021, 106, 97–117. [Google Scholar] [CrossRef]
- Guzzetti, F.; Mondini, A.C.; Cardinali, M.; Fiorucci, F.; Santangelo, M.; Chang, K.-T. Landslide inventory maps: New tools for an old problem. Earth-Sci. Rev. 2012, 112, 42–66. [Google Scholar] [CrossRef] [Green Version]
- Dai, K.; Li, Z.; Tomás, R.; Liu, G.; Yu, B.; Wang, X.; Cheng, H.; Chen, J.; Stockamp, J. Monitoring activity at the Daguangbao mega-landslide (China) using Sentinel-1 TOPS time series interferometry. Remote Sens. Environ. 2016, 186, 501–513. [Google Scholar] [CrossRef] [Green Version]
- Fárová, K.; Jelének, J.; Kopačková-Strnadová, V.; Kycl, P. Comparing DInSAR and PSI Techniques Employed to Sentinel-1 Data to Monitor Highway Stability: A Case Study of a Massive Dobkovičky Landslide, Czech Republic. Remote Sens. 2019, 11, 2670. [Google Scholar] [CrossRef] [Green Version]
- Du, Q.; Li, G.; Zhou, Y.; Chai, M.; Chen, D.; Qi, S.; Wu, G. Deformation Monitoring in an Alpine Mining Area in the Tianshan Mountains Based on SBAS-InSAR Technology. Adv. Mater. Sci. Eng. 2021, 2021, 9988017. [Google Scholar] [CrossRef]
- Jiang, C.; Fan, W.; Yu, N.; Nan, Y. A New Method to Predict Gully Head Erosion in the Loess Plateau of China Based on SBAS-InSAR. Remote Sens. 2021, 13, 421. [Google Scholar] [CrossRef]
- Steger, S.; Mair, V.; Kofler, C.; Pittore, M.; Zebisch, M.; Schneiderbauer, S. Correlation does not imply geomorphic causation in data-driven landslide susceptibility modelling—Benefits of exploring landslide data collection effects. Sci. Total Environ. 2021, 776, 145935. [Google Scholar] [CrossRef] [PubMed]
- Lombardo, L.; Tanyas, H.; Nicu, I.C. Spatial modeling of multi-hazard threat to cultural heritage sites. Eng. Geol. 2020, 277, 105776. [Google Scholar] [CrossRef]
- Wang, K.; Zhang, S.; Wei, F. Slope Unit Extraction Methods: Advances and Prospects. J. Yangtze River Sci. Res. Inst. 2020, 37, 85–93. [Google Scholar]
- Alvioli, M.; Marchesini, I.; Reichenbach, P.; Rossi, M.; Ardizzone, F.; Fiorucci, F.; Guzzetti, F. Automatic delineation of geomorphological slope units with r.slopeunits v1.0 and their optimization for landslide susceptibility modeling. Geosci. Model Dev. 2016, 9, 3975–3991. [Google Scholar] [CrossRef] [Green Version]
- Pourghasemi, H.R.; Rossi, M. Landslide susceptibility modeling in a landslide prone area in Mazandarn Province, north of Iran: A comparison between GLM, GAM, MARS, and M-AHP methods. Arch. Meteorol. Geophys. Bioclimatol. Ser. B 2017, 130, 609–633. [Google Scholar] [CrossRef]
- Sun, X.; Chen, J.; Bao, Y.; Han, X.; Zhan, J.; Peng, W. Flash flood schlep ability estimation in vertical distribution law of the precipitation area: A case of Xulong gully, Southwest China. Arab. J. Geosci. 2019, 12, 279. [Google Scholar] [CrossRef]
- Lai, M.; Zhu, J.G.; Jiang, P.; Sun, Z.T.; Da-Hu, L.I.; Hua, Y.U.; Long, C.H.; Zhu, Y.L. Ground motion data study of the 2013 Deqing-Derong M5. 9 Earthquake. Earthq. Res. Sichuan 2014. [Google Scholar] [CrossRef]
- Budimir, M.E.A.; Atkinson, P.M.; Lewis, H.G. A systematic review of landslide probability mapping using logistic regression. Landslides 2015, 12, 419–436. [Google Scholar] [CrossRef] [Green Version]
- Chen, Z.; Wang, J. Landslide hazard mapping using logistic regression model in Mackenzie Valley, Canada. Nat. Hazards 2007, 42, 75–89. [Google Scholar] [CrossRef]
- Lee, S.; Sambath, T. Landslide susceptibility mapping in the Damrei Romel area, Cambodia using frequency ratio and logistic regression models. Environ. Earth Sci. 2006, 50, 847–855. [Google Scholar] [CrossRef]
- Solaimani, K.; Mousavi, S.Z.; Kavian, A. Landslide susceptibility mapping based on frequency ratio and logistic regression models. Arab. J. Geosci. 2012, 6, 2557–2569. [Google Scholar] [CrossRef]
- Breiman, L. Random forests. Mach. Learn. 2001, 45, 5–32. [Google Scholar] [CrossRef] [Green Version]
- Hong, H.; Miao, Y.; Liu, J.; Zhu, A.-X. Exploring the effects of the design and quantity of absence data on the performance of random forest-based landslide susceptibility mapping. Catena 2019, 176, 45–64. [Google Scholar] [CrossRef]
- Kim, J.-C.; Lee, S.; Jung, H.-S.; Lee, S. Landslide susceptibility mapping using random forest and boosted tree models in Pyeong-Chang, Korea. Geocarto Int. 2018, 33, 1000–1015. [Google Scholar] [CrossRef]
- Miao, T.Y.; Wang, M. Susceptibility Analysis of Earthquake-Induced Landslide Using Random Forest Method. In Proceedings of the International Conference on Computer Information Systems and Industrial Applications, Bangkok, Thailand, 28–29 June 2015. [Google Scholar]
- Sun, D.; Wen, H.; Wang, D.; Xu, J. A random forest model of landslide susceptibility mapping based on hyperparameter optimization using Bayes algorithm. Geomorphology 2020, 362, 107201. [Google Scholar] [CrossRef]
- Polykretis, C.; Chalkias, C. Comparison and evaluation of landslide susceptibility maps obtained from weight of evidence, logistic regression, and artificial neural network models. Nat. Hazards 2018, 93, 249–274. [Google Scholar] [CrossRef]
- Poudyal, C.P.; Chang, C.; Oh, H.-J.; Lee, S. Landslide susceptibility maps comparing frequency ratio and artificial neural networks: A case study from the Nepal Himalaya. Environ. Earth Sci. 2010, 61, 1049–1064. [Google Scholar] [CrossRef]
- Saro, L.; Woo, J.S.; Kwan-Young, O.; Moung-Jin, L. The spatial prediction of landslide susceptibility applying artificial neural network and logistic regression models: A case study of Inje, Korea. Open Geosci. 2016, 8, 117–132. [Google Scholar] [CrossRef]
- Bao, Y.; Zhai, S.; Chen, J.; Xu, P.; Sun, X.; Zhan, J.; Zhang, W.; Zhou, X. The evolution of the Samaoding paleolandslide river blocking event at the upstream reaches of the Jinsha River, Tibetan Plateau. Geomorphology 2020, 351, 106970. [Google Scholar] [CrossRef]
- Yu, C.; Chen, J. Application of a GIS-Based Slope Unit Method for Landslide Susceptibility Mapping in Helong City: Comparative Assessment of ICM, AHP, and RF Model. Symmetry 2020, 12, 1848. [Google Scholar] [CrossRef]
- Su, Q.; Zhang, J.; Zhao, S.; Wang, L.; Liu, J.; Guo, J. Comparative Assessment of Three Nonlinear Approaches for Landslide Susceptibility Mapping in a Coal Mine Area. ISPRS Int. J. Geo-Inf. 2017, 6, 228. [Google Scholar] [CrossRef] [Green Version]


| Conditioning Factors | Data Source | Variable Type | Mutator Methods of the Slope Units |
|---|---|---|---|
| Lithology | Department of Geological Survey (1:200,000 scale) | Categorical | Major value |
| Rock hardness | Categorical | Major value | |
| Elevation | Digital elevation model (91 Weitu software, 8.96 m) | Continues | Average value |
| Slope angle | Continues | Average value | |
| Slope aspect | Continues | Average value | |
| Topographic relief | Continues | Average value | |
| Curvature | Continues | Average value | |
| Land use | Landsat 5 TM images (3 April 2015) | Categorical | Major value |
| NDVI | Continues | Average value | |
| Distance from faults | Department of Geological Survey (1:200,000 scale) | Continues | Average value |
| Strahler’s integral value | Sun et al., 2020c | Continues | Average value |
| Distance from rivers | Department of Geological Survey (1:200,000 scale) | Continues | Average value |
| Rainfall | Sun et al., 2019 [65] | Continues | Average value |
| Earthquake intensity | Lai et al., 2014 [66] | Categorical | Major value |
| KMO test | 0.764 |
| Bartlett’s test | 48,271.116 |
| p-value | 0.000 |
| Components | Initial Eigenvalues | Extraction Sums of Squared Loadings | ||||
|---|---|---|---|---|---|---|
| Total | % of Variance | Cumulative % | Total | % of Variance | Cumulative % | |
| 1 | 4.517 | 32.263 | 32.263 | 4.517 | 32.263 | 32.263 |
| 2 | 1.769 | 12.634 | 44.897 | 1.769 | 12.634 | 44.897 |
| 3 | 1.532 | 10.940 | 55.837 | 1.532 | 10.940 | 55.837 |
| 4 | 1.231 | 8.795 | 64.632 | 1.231 | 8.795 | 64.632 |
| 5 | 1.074 | 7.670 | 72.302 | 1.074 | 7.670 | 72.302 |
| 6 | 0.977 | 6.977 | 79.279 | 0.977 | 6.977 | 79.279 |
| 7 | 0.759 | 5.422 | 84.702 | 0.759 | 5.422 | 84.702 |
| 8 | 0.560 | 3.999 | 88.700 | - | - | - |
| 9 | 0.468 | 3.346 | 92.046 | - | - | - |
| 10 | 0.413 | 2.953 | 94.999 | - | - | - |
| 11 | 0.348 | 2.484 | 97.483 | - | - | - |
| 12 | 0.256 | 1.831 | 99.314 | - | - | - |
| 13 | 0.082 | 0.585 | 99.899 | - | - | - |
| 14 | 0.014 | 0.101 | 100.000 | - | - | - |
| Method | Index | Training | Validating | ||||||||||||
|---|---|---|---|---|---|---|---|---|---|---|---|---|---|---|---|
| K = 1 | K = 2 | K = 3 | K = 4 | K = 5 | Mean | Standard Deviation | K = 1 | K = 2 | K = 3 | K = 4 | K = 5 | Mean | Standard Deviation | ||
| LR | AC | 0.782 | 0.775 | 0.786 | 0.777 | 0.778 | 0.780 | 0.004 | 0.765 | 0.800 | 0.743 | 0.778 | 0.778 | 0.773 | 0.021 |
| SE | 0.769 | 0.761 | 0.773 | 0.766 | 0.768 | 0.767 | 0.005 | 0.780 | 0.785 | 0.737 | 0.746 | 0.781 | 0.766 | 0.022 | |
| SP | 0.795 | 0.791 | 0.800 | 0.789 | 0.790 | 0.793 | 0.004 | 0.752 | 0.817 | 0.750 | 0.820 | 0.776 | 0.783 | 0.034 | |
| PPV | 0.804 | 0.802 | 0.809 | 0.798 | 0.798 | 0.802 | 0.005 | 0.739 | 0.826 | 0.757 | 0.843 | 0.774 | 0.788 | 0.045 | |
| NPV | 0.759 | 0.748 | 0.763 | 0.757 | 0.759 | 0.757 | 0.006 | 0.791 | 0.774 | 0.730 | 0.713 | 0.783 | 0.758 | 0.034 | |
| AUC | 0.856 | 0.856 | 0.863 | 0.859 | 0.853 | 0.857 | 0.003 | 0.861 | 0.856 | 0.829 | 0.843 | 0.873 | 0.852 | 0.015 | |
| RF | AC | 0.898 | 0.911 | 0.903 | 0.889 | 0.887 | 0.898 | 0.010 | 0.804 | 0.804 | 0.817 | 0.830 | 0.817 | 0.815 | 0.011 |
| SE | 0.880 | 0.900 | 0.894 | 0.907 | 0.874 | 0.891 | 0.014 | 0.843 | 0.802 | 0.823 | 0.806 | 0.817 | 0.818 | 0.016 | |
| SP | 0.918 | 0.922 | 0.913 | 0.873 | 0.901 | 0.905 | 0.020 | 0.773 | 0.807 | 0.812 | 0.858 | 0.817 | 0.814 | 0.030 | |
| PPV | 0.922 | 0.924 | 0.915 | 0.867 | 0.904 | 0.907 | 0.023 | 0.748 | 0.809 | 0.809 | 0.870 | 0.817 | 0.810 | 0.043 | |
| NPV | 0.874 | 0.898 | 0.891 | 0.911 | 0.870 | 0.889 | 0.017 | 0.861 | 0.800 | 0.826 | 0.791 | 0.817 | 0.819 | 0.027 | |
| AUC | 0.964 | 0.968 | 0.965 | 0.963 | 0.962 | 0.964 | 0.002 | 0.849 | 0.881 | 0.871 | 0.878 | 0.869 | 0.870 | 0.011 | |
| ANN | AC | 0.822 | 0.853 | 0.863 | 0.841 | 0.832 | 0.842 | 0.017 | 0.804 | 0.787 | 0.783 | 0.796 | 0.791 | 0.792 | 0.008 |
| SE | 0.826 | 0.842 | 0.846 | 0.828 | 0.827 | 0.834 | 0.010 | 0.843 | 0.770 | 0.773 | 0.779 | 0.786 | 0.790 | 0.030 | |
| SP | 0.818 | 0.865 | 0.881 | 0.855 | 0.837 | 0.851 | 0.025 | 0.773 | 0.806 | 0.793 | 0.815 | 0.796 | 0.797 | 0.016 | |
| PPV | 0.815 | 0.870 | 0.887 | 0.861 | 0.839 | 0.854 | 0.028 | 0.748 | 0.817 | 0.800 | 0.826 | 0.800 | 0.798 | 0.030 | |
| NPV | 0.828 | 0.837 | 0.839 | 0.822 | 0.824 | 0.830 | 0.008 | 0.861 | 0.757 | 0.765 | 0.765 | 0.783 | 0.786 | 0.043 | |
| AUC | 0.891 | 0.921 | 0.926 | 0.908 | 0.906 | 0.910 | 0.012 | 0.891 | 0.884 | 0.883 | 0.897 | 0.896 | 0.890 | 0.006 | |
| Source | Method | Conditioning Factor | Prediction Accuracy | Mapping Units | |
|---|---|---|---|---|---|
| Cao et al. (2016) [23] | ICM-AHP | Slope angle, slope aspect, curvature, geology, distance to fault, distance to river, vegetation, and annual precipitation | 85.74% | Grid units | |
| Sun et al. (2018) [44] | FR | Lithology, slope angle, slope aspect, TWI, curvature, SPI, STI, topographic relief, rainfall, vegetation, NDVI, distance to river, and distance to fault | 79.90% | Grid units | |
| AHP | 76.90% | ||||
| PCA-LR | 83.40% | ||||
| Sun et al. (2020) [43] | LR | Slope angle, slope aspect, curvature, land use, NDVI, rainfall, lithology, distance to river, distance to fault, and Strahler’s integral value | Training | 88.16% | Slope unit (hydrological method) |
| Validating | 87.68% | ||||
| ANN | Training | 93.96% | |||
| Validating | 92.60% | ||||
| SVM | Training | 89.68% | |||
| Validating | 89.88% | ||||
| Sun et al. (2021) [49] | SVM | Lithology, slope angle, slope aspect, NDVI, land cover, rainfall, curvature, distance to river, and distance to fault | Training | 89.72% | Slope unit (hydrological method) |
| Validating | 88.08% | ||||
| Training | 90.72% | Slope unit (curvature watershed method) | |||
| Validating | 88.96% | ||||
| This study | LR | Lithology, rock hardness, elevation, slope angle, slope aspect, topographic relief, curvature, land use, NDVI, distance from faults, Strahler’s integral value, distance from rivers, rainfall, and earthquake intensity | Training | 85.7% | Slope unit (curvature watershed method) |
| Validating | 85.2% | ||||
| RF | Training | 96.4% | |||
| Validating | 87.0% | ||||
| ANN | Training | 91.0% | |||
| Validating | 89.0% | ||||
| Susceptibility | Landslide Occurred | Total Study Area | ||
|---|---|---|---|---|
| Area (km2) | Ratio | Area (km2) | Ratio | |
| Very Low | 0.22 | 0.40% | 376.08 | 40.13% |
| Low | 2.20 | 4.00% | 188.00 | 20.06% |
| Moderate | 4.39 | 7.99% | 125.53 | 13.39% |
| High | 15.23 | 27.70% | 117.60 | 12.55% |
| Very High | 32.94 | 59.91% | 130.01 | 13.87% |
| Number | Name | Method of Dating | Age (Ka) | Number | Name | Method of Dating | Age (Ka) |
|---|---|---|---|---|---|---|---|
| 1 | Quzhi landslide | TH | 2.8 ± 0.2 | 15 | Deze landslide | TH | 42.5 ± 2.0 |
| 2 | Yingui landslide | PH | 3.4 ± 0.2 | 16 | Guxue landslide | TH | 45.1 ± 2.7 |
| 3 | Aluogong landslide | TH | 4.4 ± 0.3 | 17 | Waka 2 landslide | TH | 46.5 ± 2.1 |
| 4 | Yongduo landslide | TH | 5.2 ± 0.2 | 18 | Zhanzhui landslide | TH | 50.0 ± 3.1 |
| 5 | Waka 1 landslide | TH | 7.7 ± 0.5 | 19 | Jinshaqiaotou landslide | TH | 52.4 ± 3.0 |
| 6 | Saimaoding landslide | TH | 10.6 ± 0.5 | 20 | Dari landslide | TH | 56.9 ± 3.7 |
| 7 | Senen landslide | TH | 17.6 ± 1.1 | 21 | Gaiyiri moraine | PH | 58.8 ± 3.1 |
| 8 | Maodinghe landslide | TH | 18.3 ± 1.2 | 22 | Maoding landslide | TH | 70.8 ± 5.1 |
| 9 | Yingui landslide | TH | 19.7 ± 1.3 | 23 | Qulong moraine | TH | 77.3 ± 4.5 |
| 10 | Zhisishan landslide | TH | 22.7 ± 1.0 | 24 | Yeligong moraine | TH | 79.0 ± 4.1 |
| 11 | Guanyinxiang landslide | TH | 25.9 ± 1.6 | 25 | Yegeding landslide | TH | 81.0 ± 4.3 |
| 12 | Rancun landslide | TH | 31.1 ± 1.8 | 26 | Yinduba landslide | TH | 115.7 ± 7.6 |
| 13 | Benzilan landslide | TH | 33.2 ± 1.6 | 27 | Yahong landslide | TH | 118.1 ± 6.0 |
| 14 | Waka 3 landslide | TH | 41.1 ± 3.1 | - | - | - | - |
Publisher’s Note: MDPI stays neutral with regard to jurisdictional claims in published maps and institutional affiliations. |
© 2022 by the authors. Licensee MDPI, Basel, Switzerland. This article is an open access article distributed under the terms and conditions of the Creative Commons Attribution (CC BY) license (https://creativecommons.org/licenses/by/4.0/).
Share and Cite
Sun, X.; Chen, J.; Li, Y.; Rene, N.N. Landslide Susceptibility Mapping along a Rapidly Uplifting River Valley of the Upper Jinsha River, Southeastern Tibetan Plateau, China. Remote Sens. 2022, 14, 1730. https://doi.org/10.3390/rs14071730
Sun X, Chen J, Li Y, Rene NN. Landslide Susceptibility Mapping along a Rapidly Uplifting River Valley of the Upper Jinsha River, Southeastern Tibetan Plateau, China. Remote Sensing. 2022; 14(7):1730. https://doi.org/10.3390/rs14071730
Chicago/Turabian StyleSun, Xiaohui, Jianping Chen, Yanrong Li, and Ngambua N. Rene. 2022. "Landslide Susceptibility Mapping along a Rapidly Uplifting River Valley of the Upper Jinsha River, Southeastern Tibetan Plateau, China" Remote Sensing 14, no. 7: 1730. https://doi.org/10.3390/rs14071730
APA StyleSun, X., Chen, J., Li, Y., & Rene, N. N. (2022). Landslide Susceptibility Mapping along a Rapidly Uplifting River Valley of the Upper Jinsha River, Southeastern Tibetan Plateau, China. Remote Sensing, 14(7), 1730. https://doi.org/10.3390/rs14071730