
Mapping Grassland Classes Using Unmanned Aerial Vehicle and MODIS NDVI Data for Temperate Grassland in Inner Mongolia, China

 , , , ,
  ,
, 
Abstract
:1. Introduction
2. Data and Methods
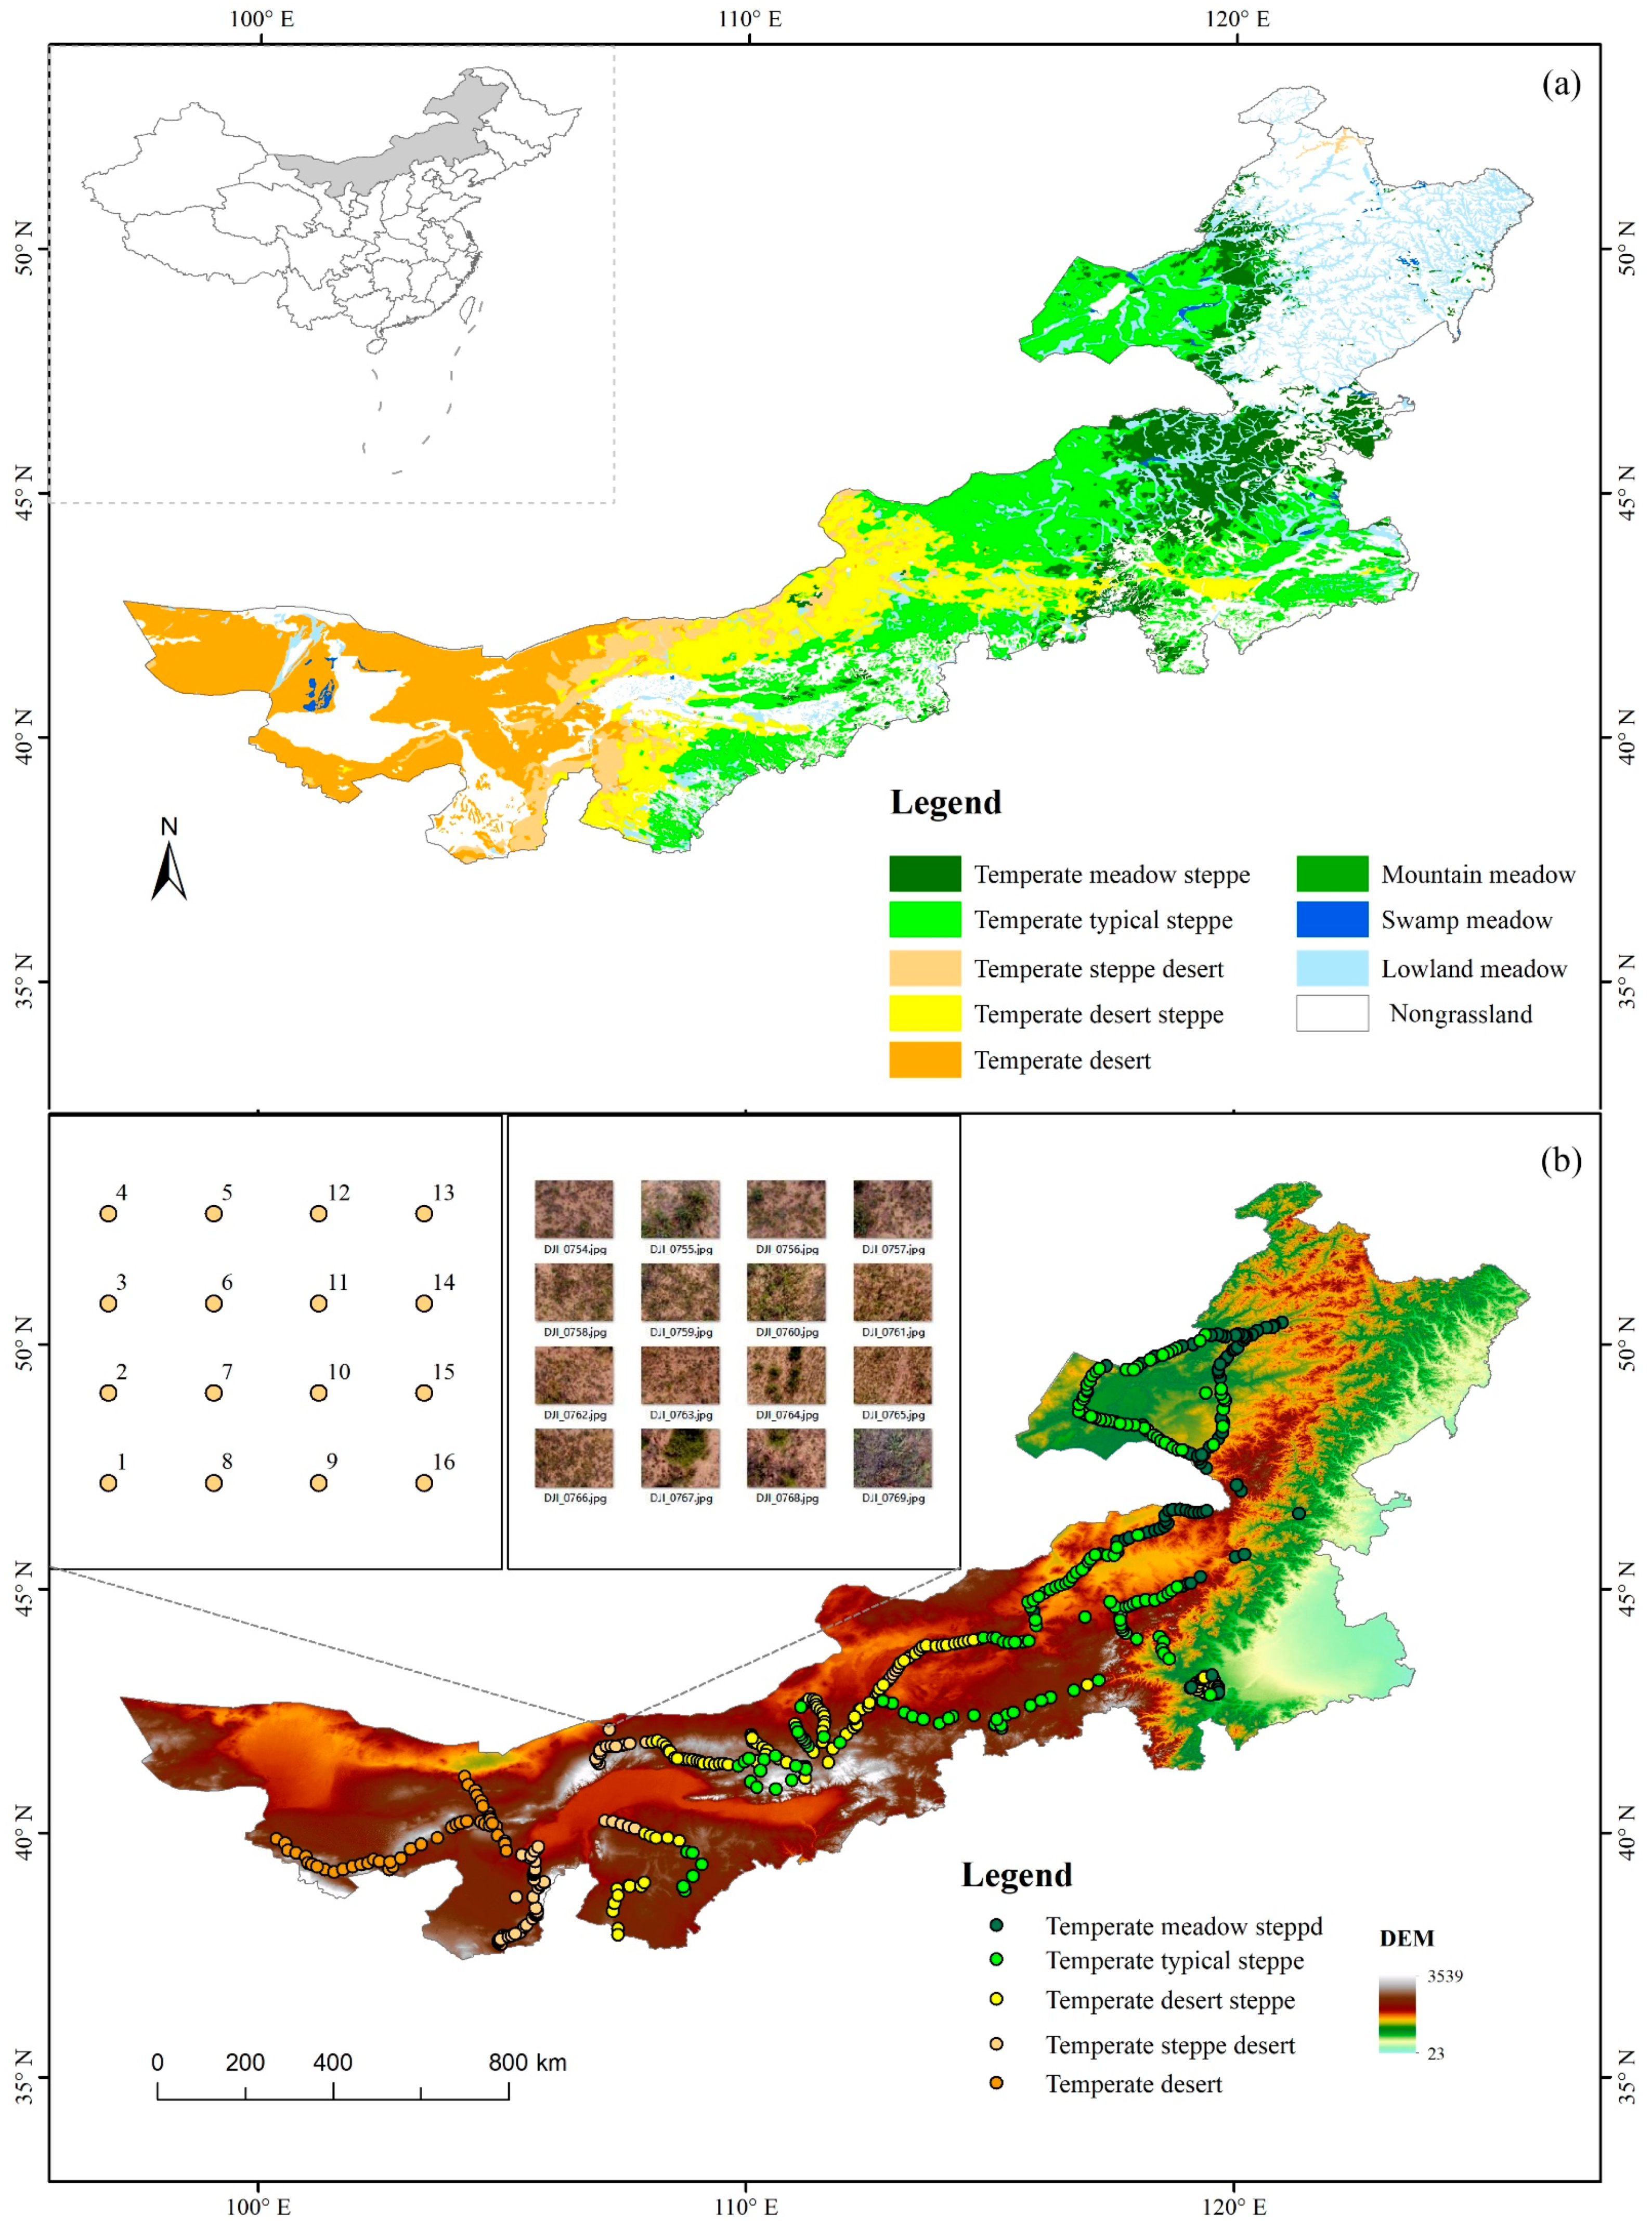
2.1. Study Area
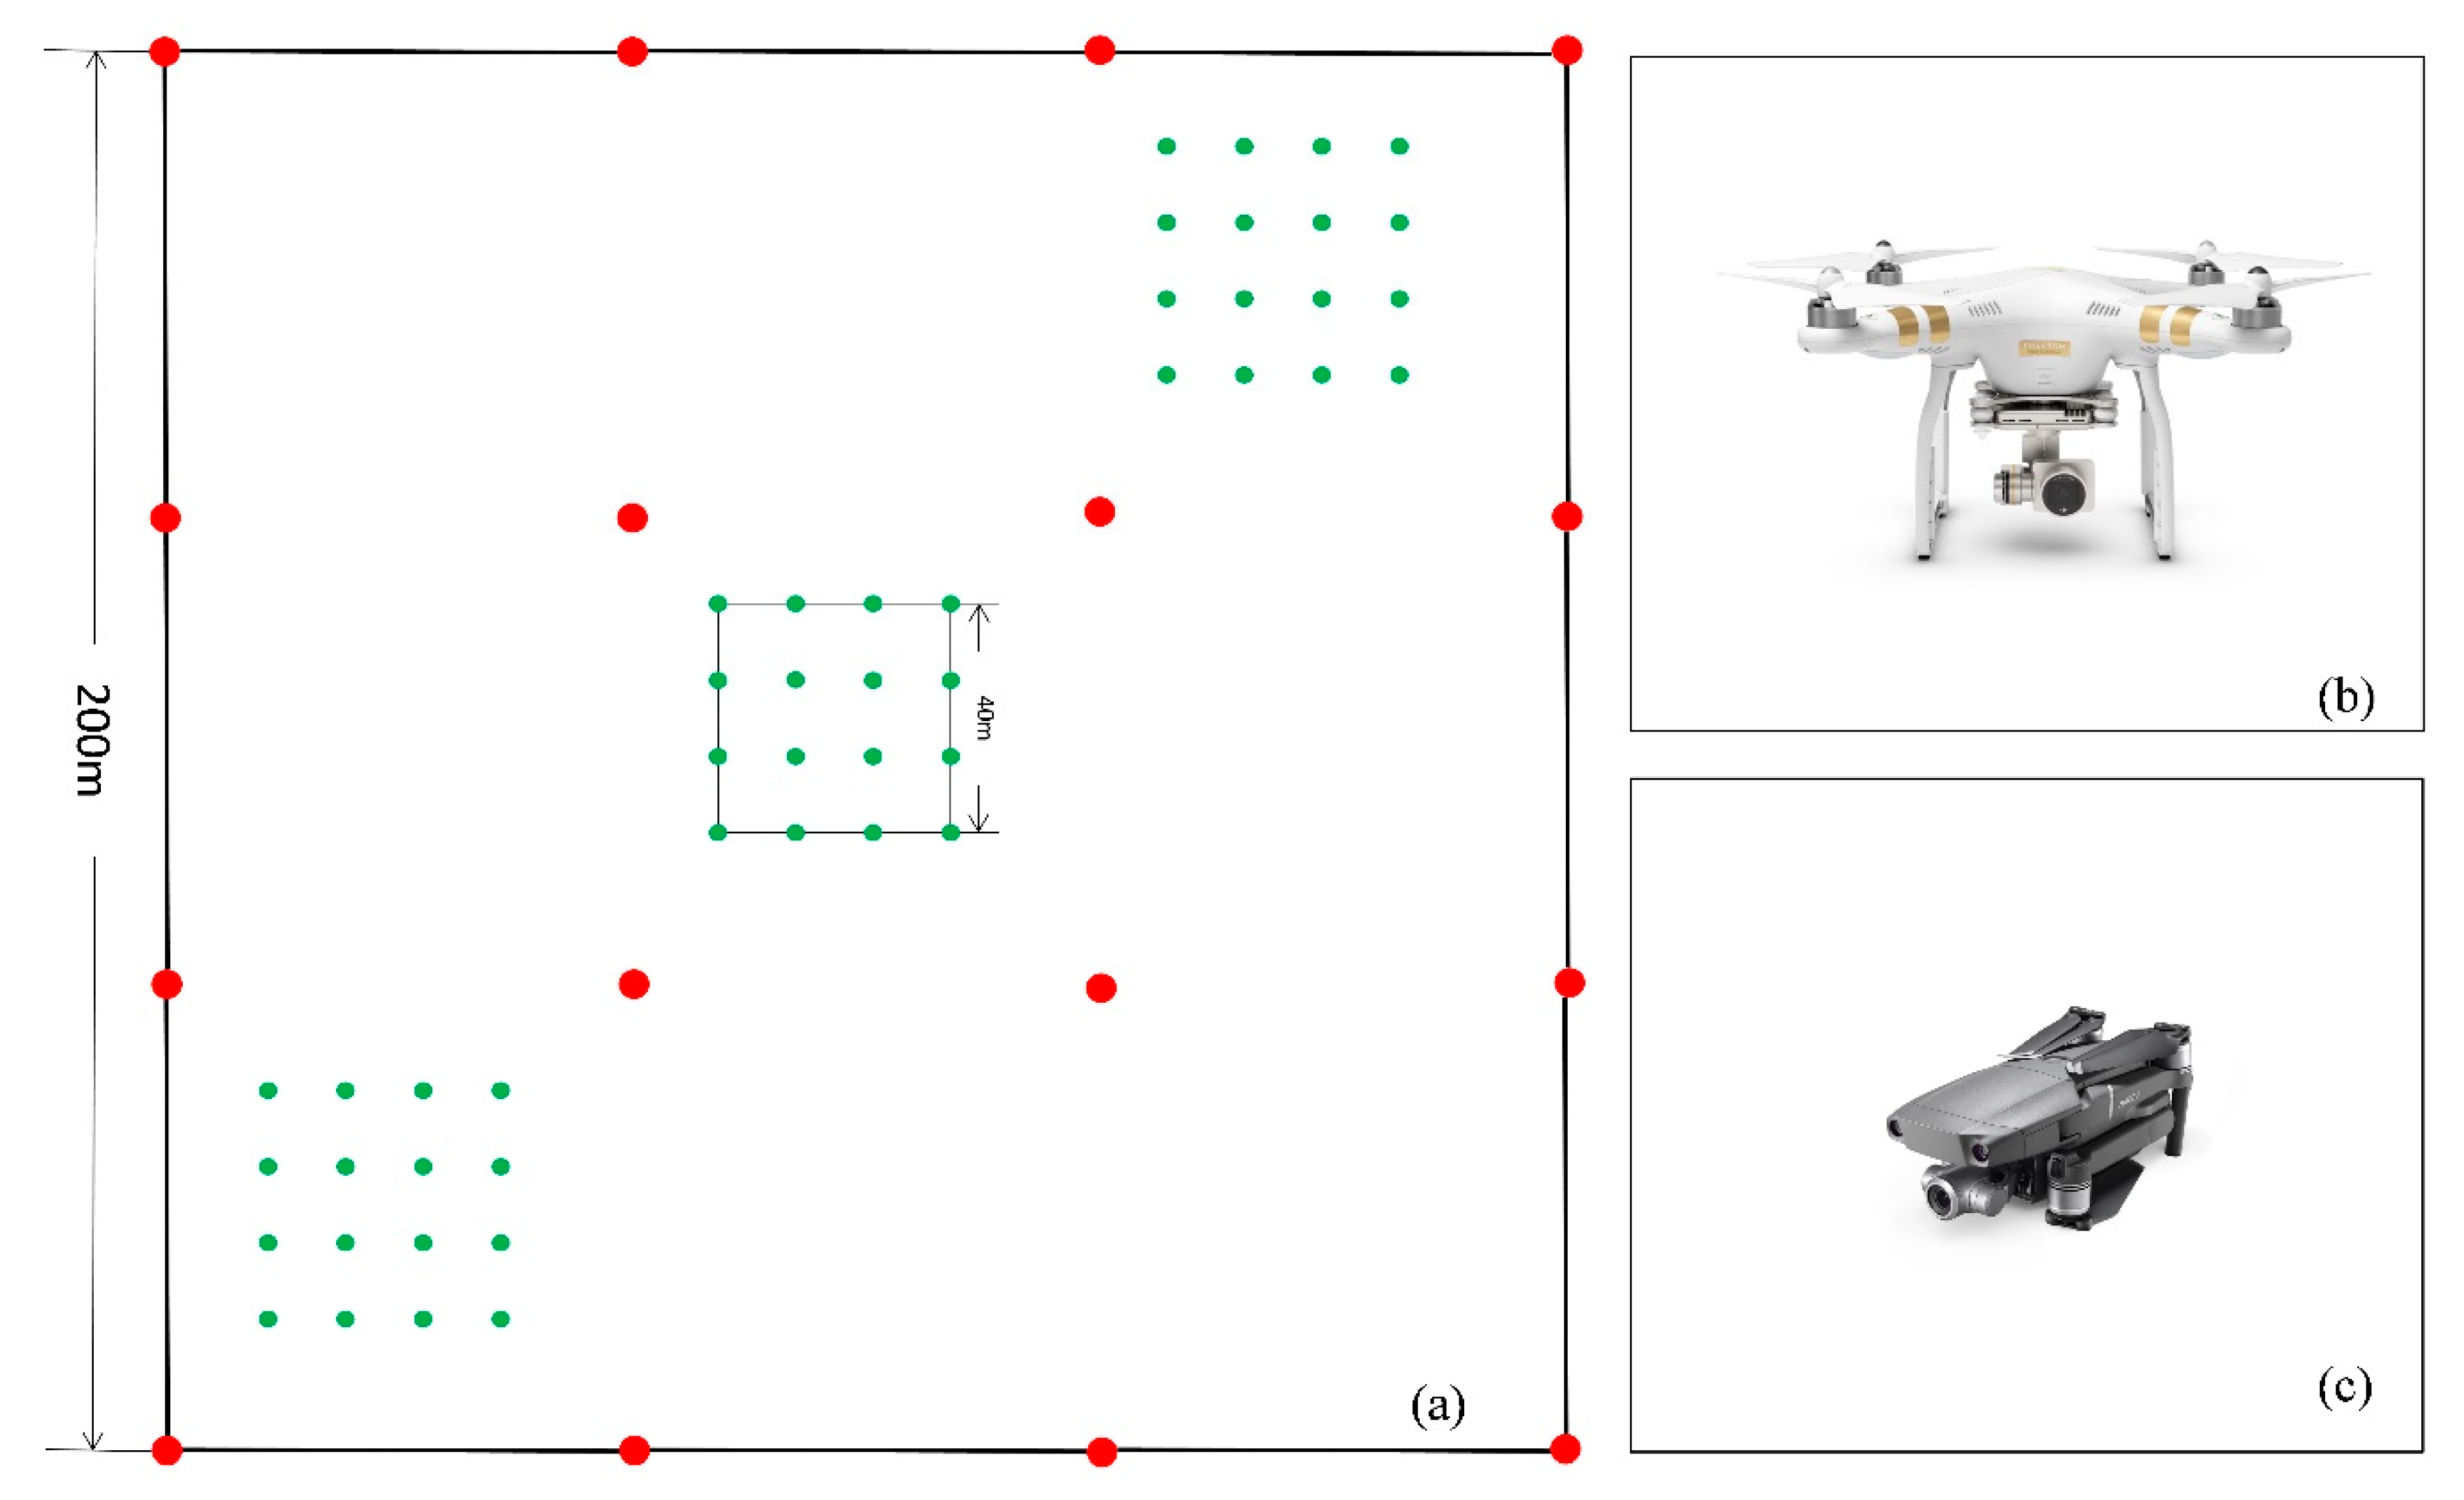
2.2. Field Observation
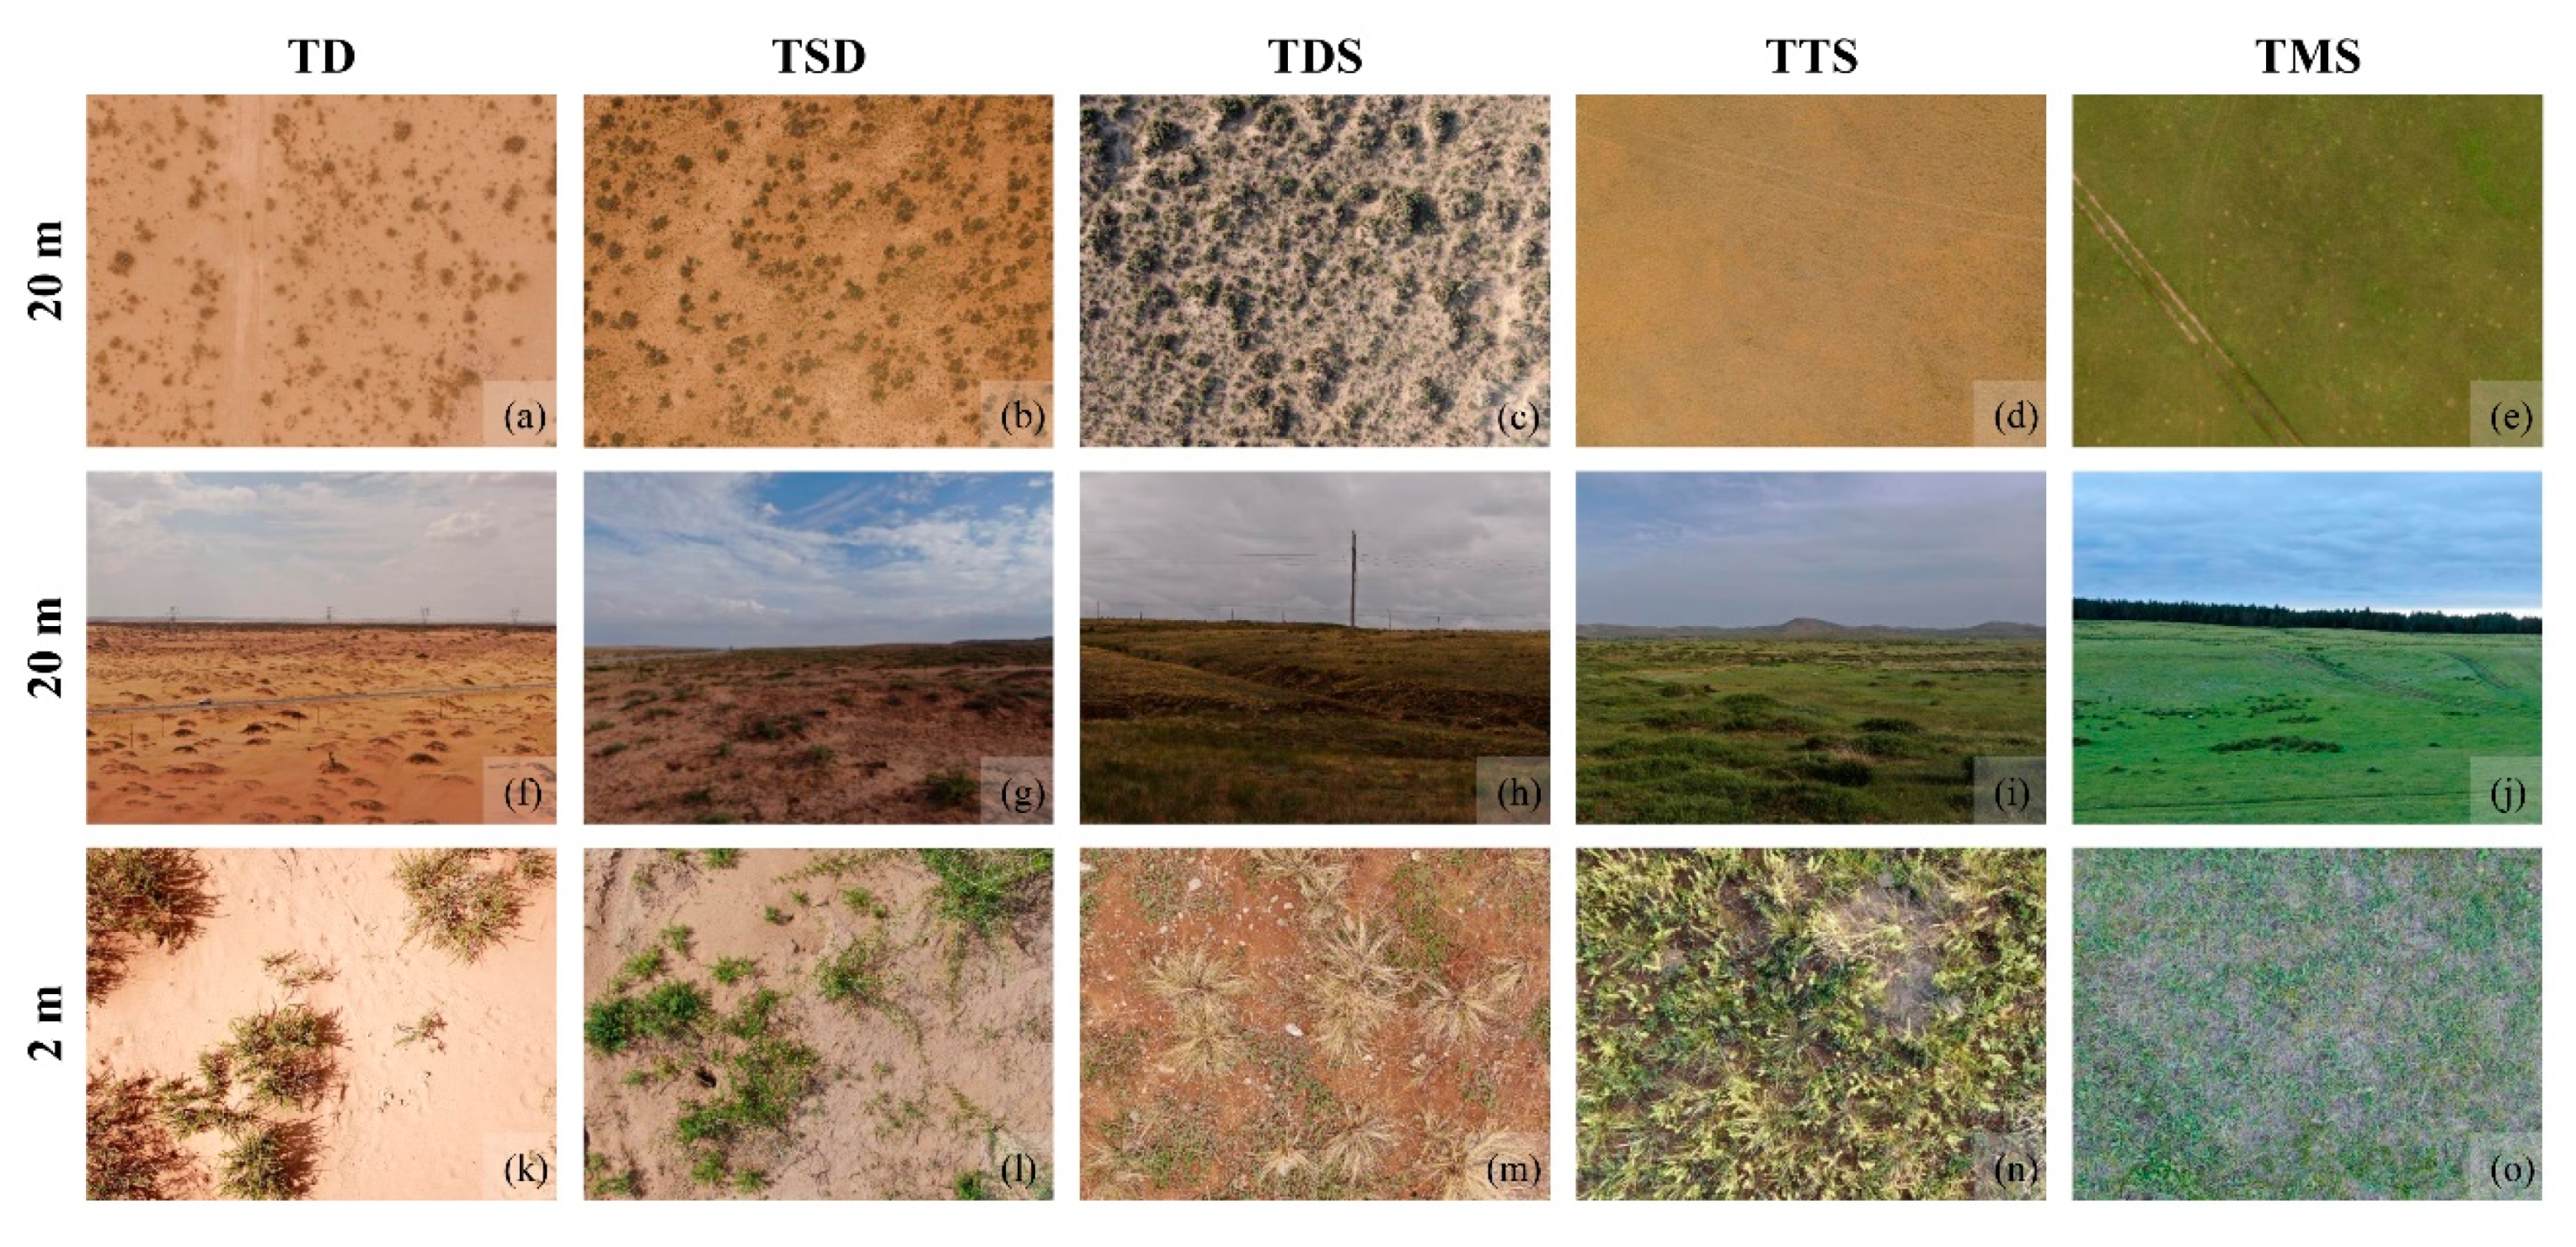
2.3. Grassland Classification in Observation Sites
2.4. Acquisition and Reprocessing of Remote Sensing Data
2.5. Classification Methods
2.6. Variables Selection and Accuracy Validation
3. Results
3.1. Characteristics of Field Observation and Corresponding NDVI
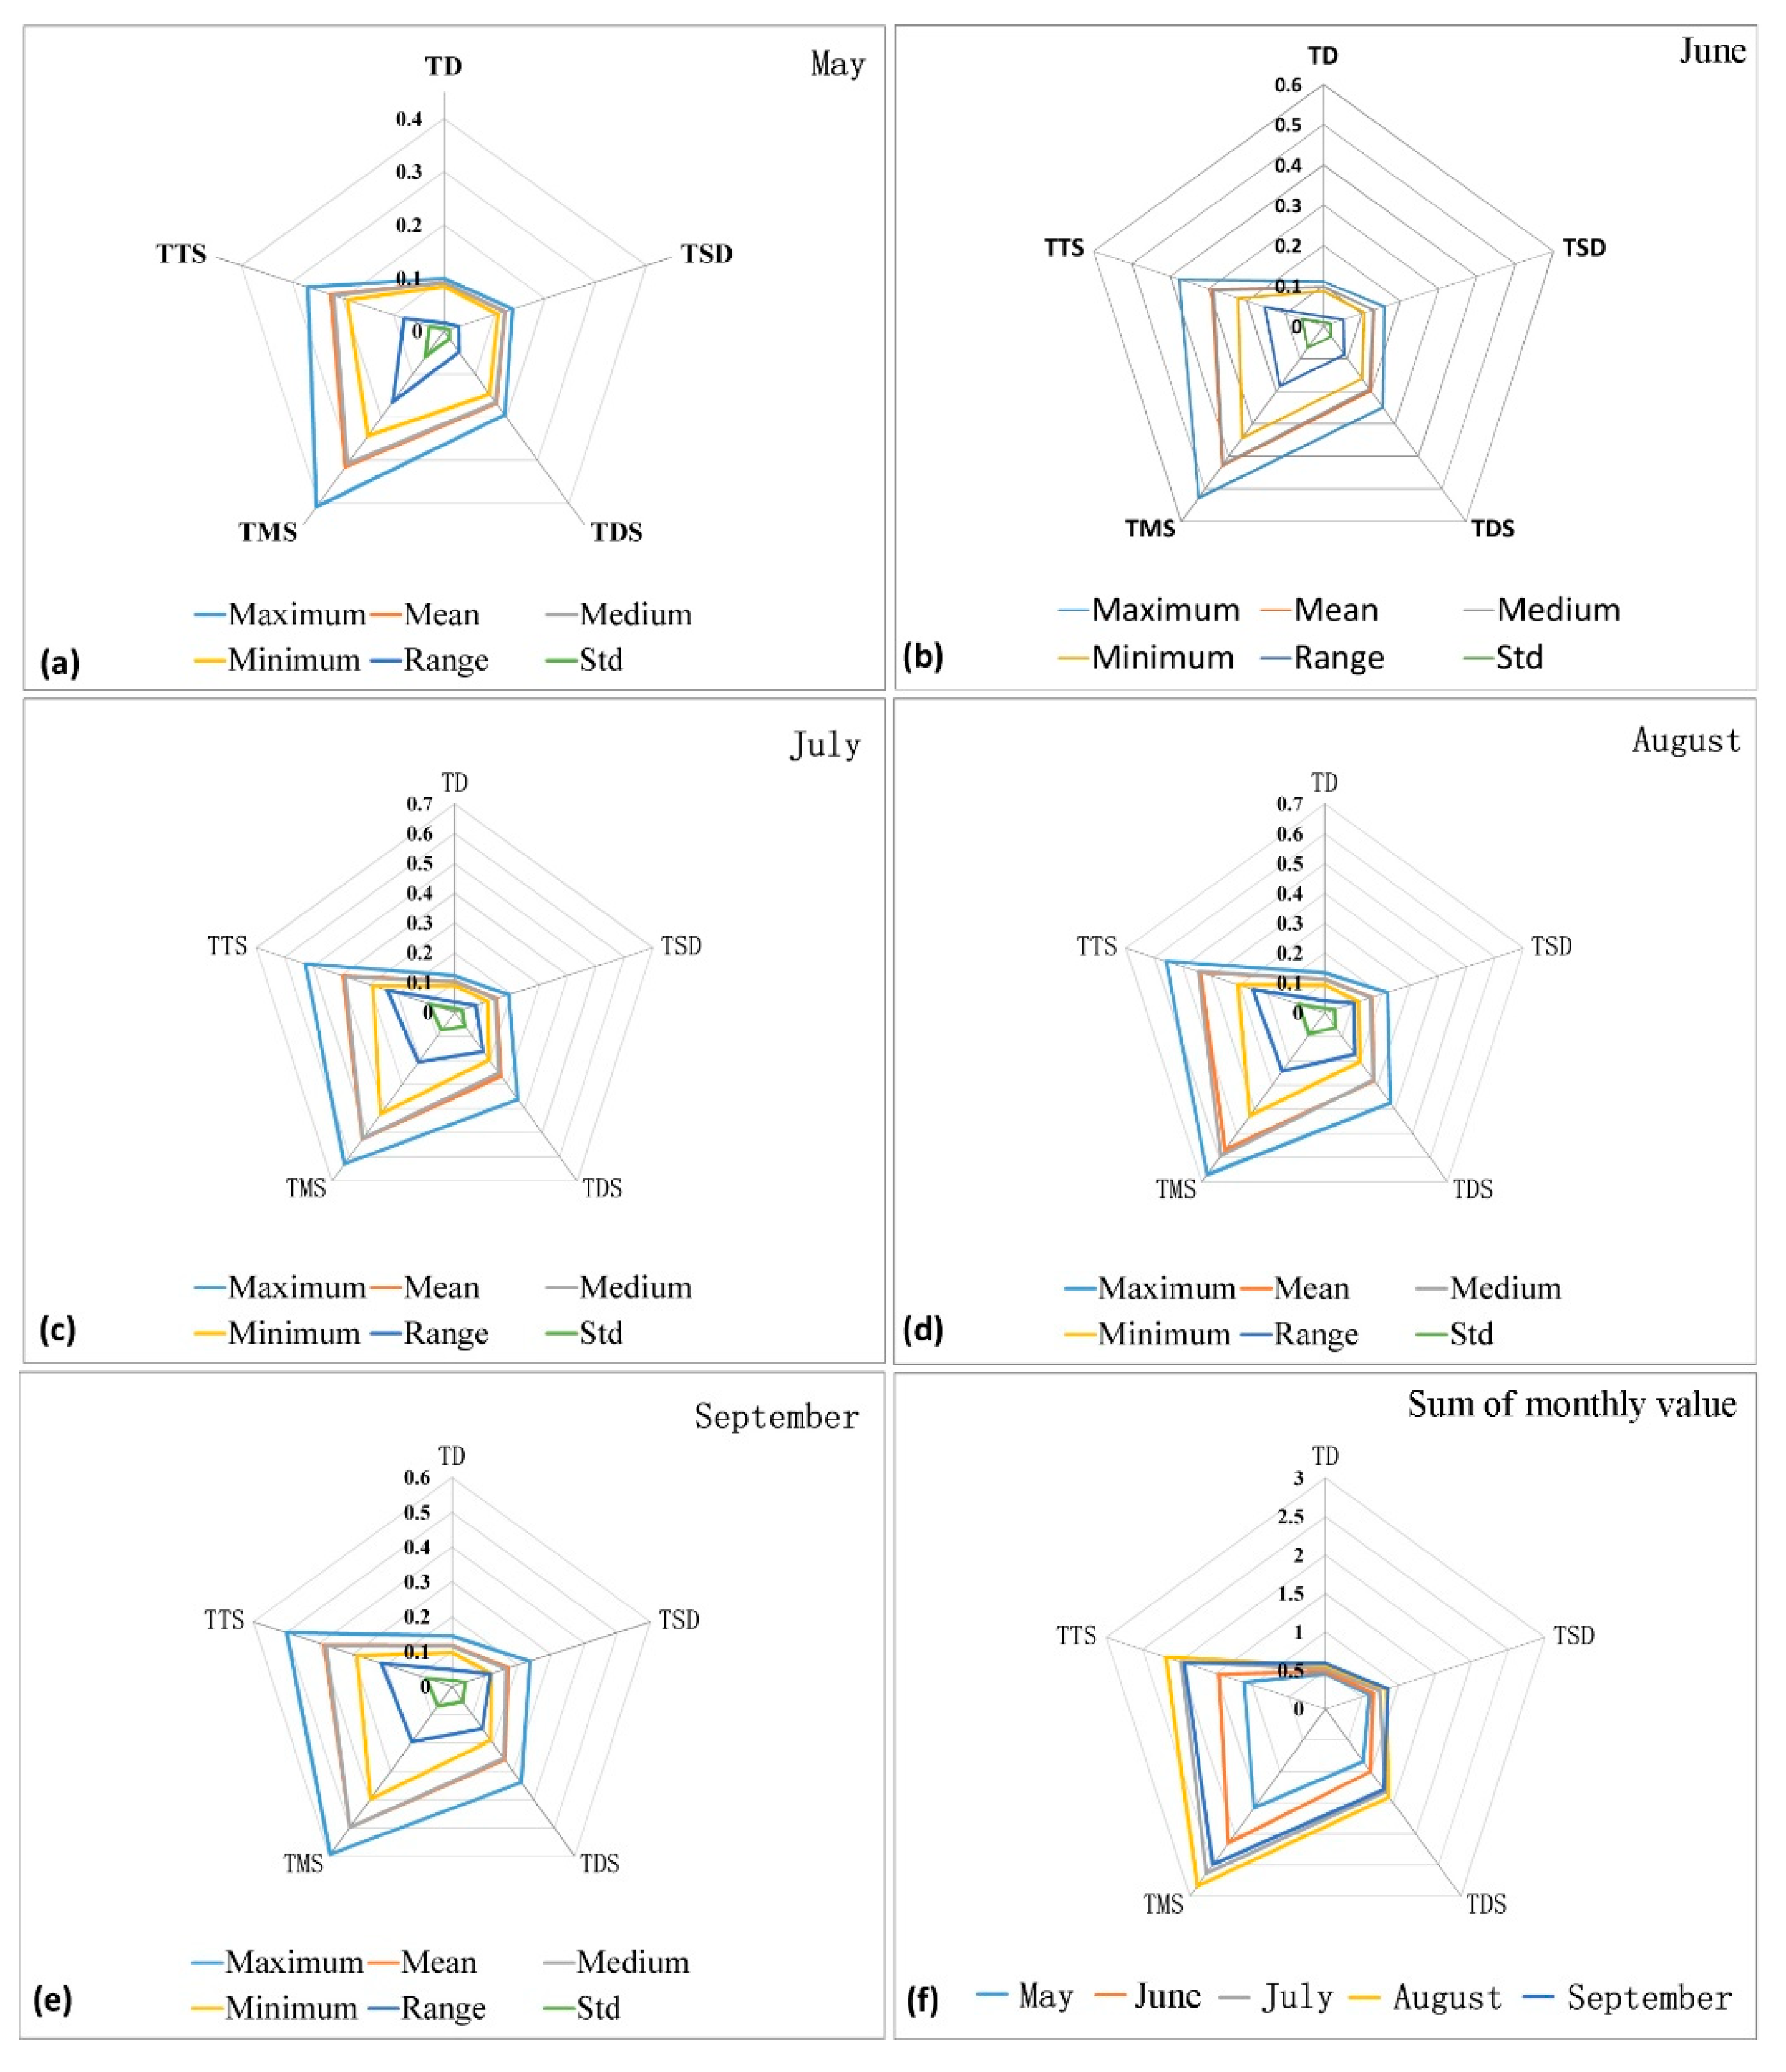
3.2. Selection of NDVI Characteristic Indices
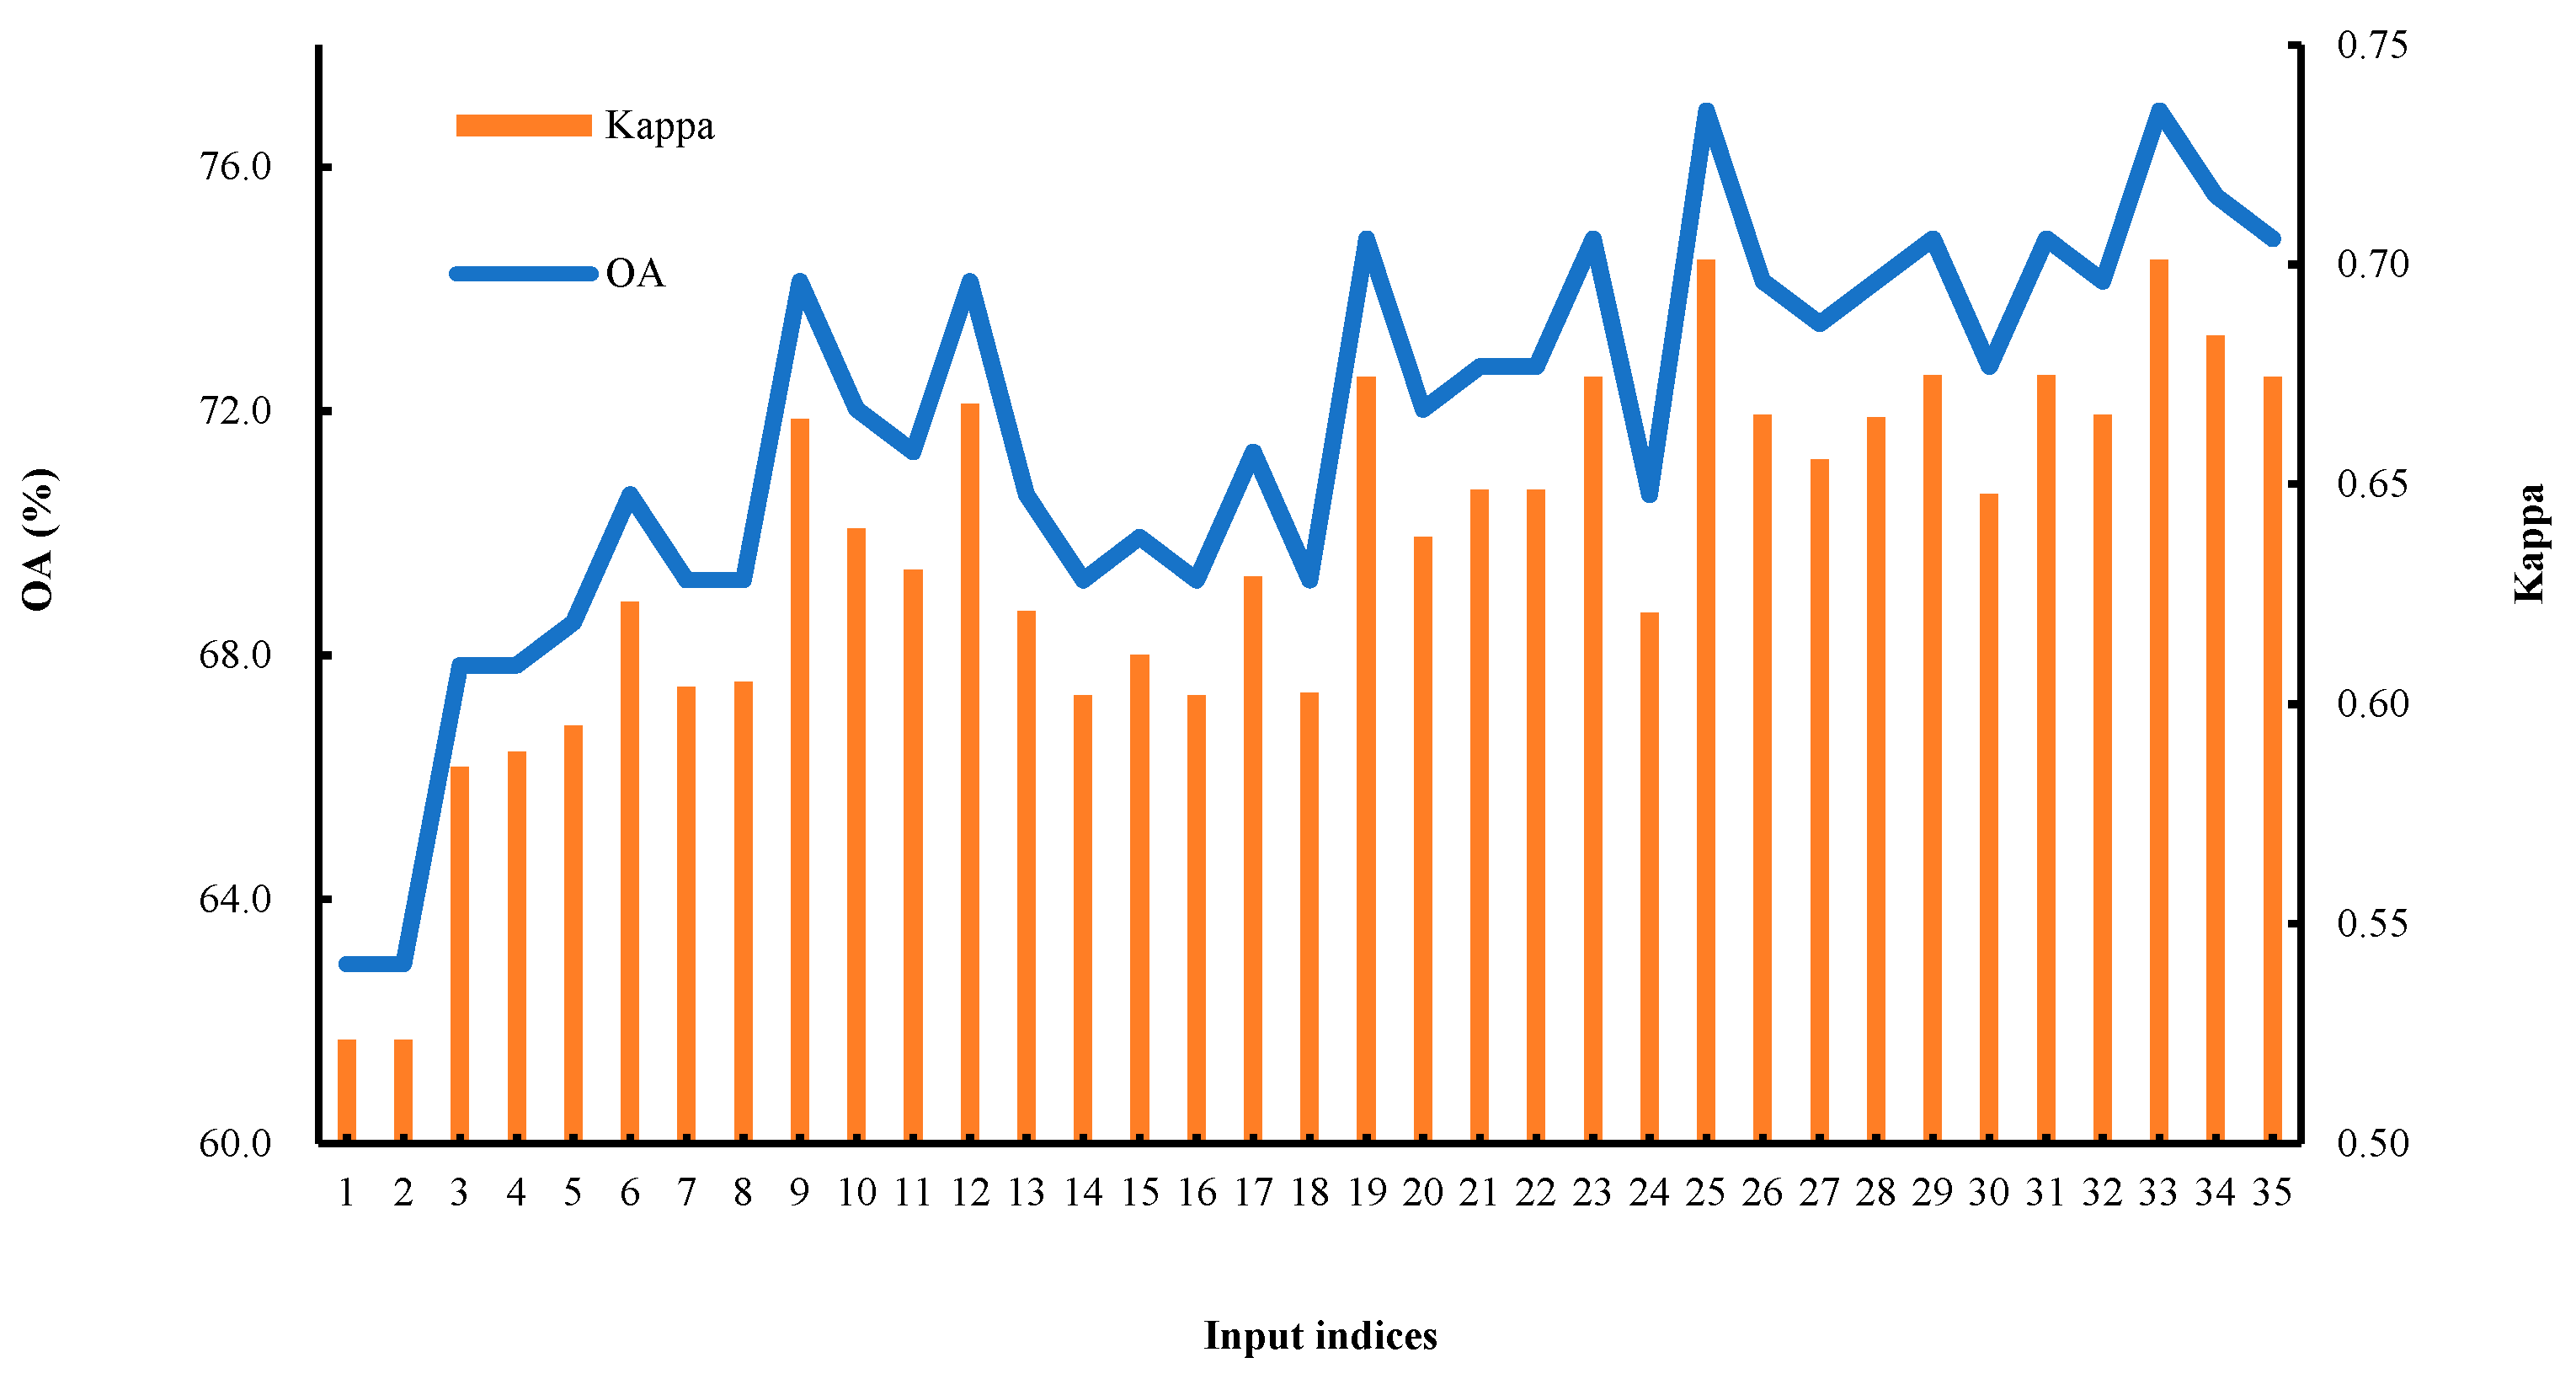
3.3. Accuracy Evaluation of Classification Methods
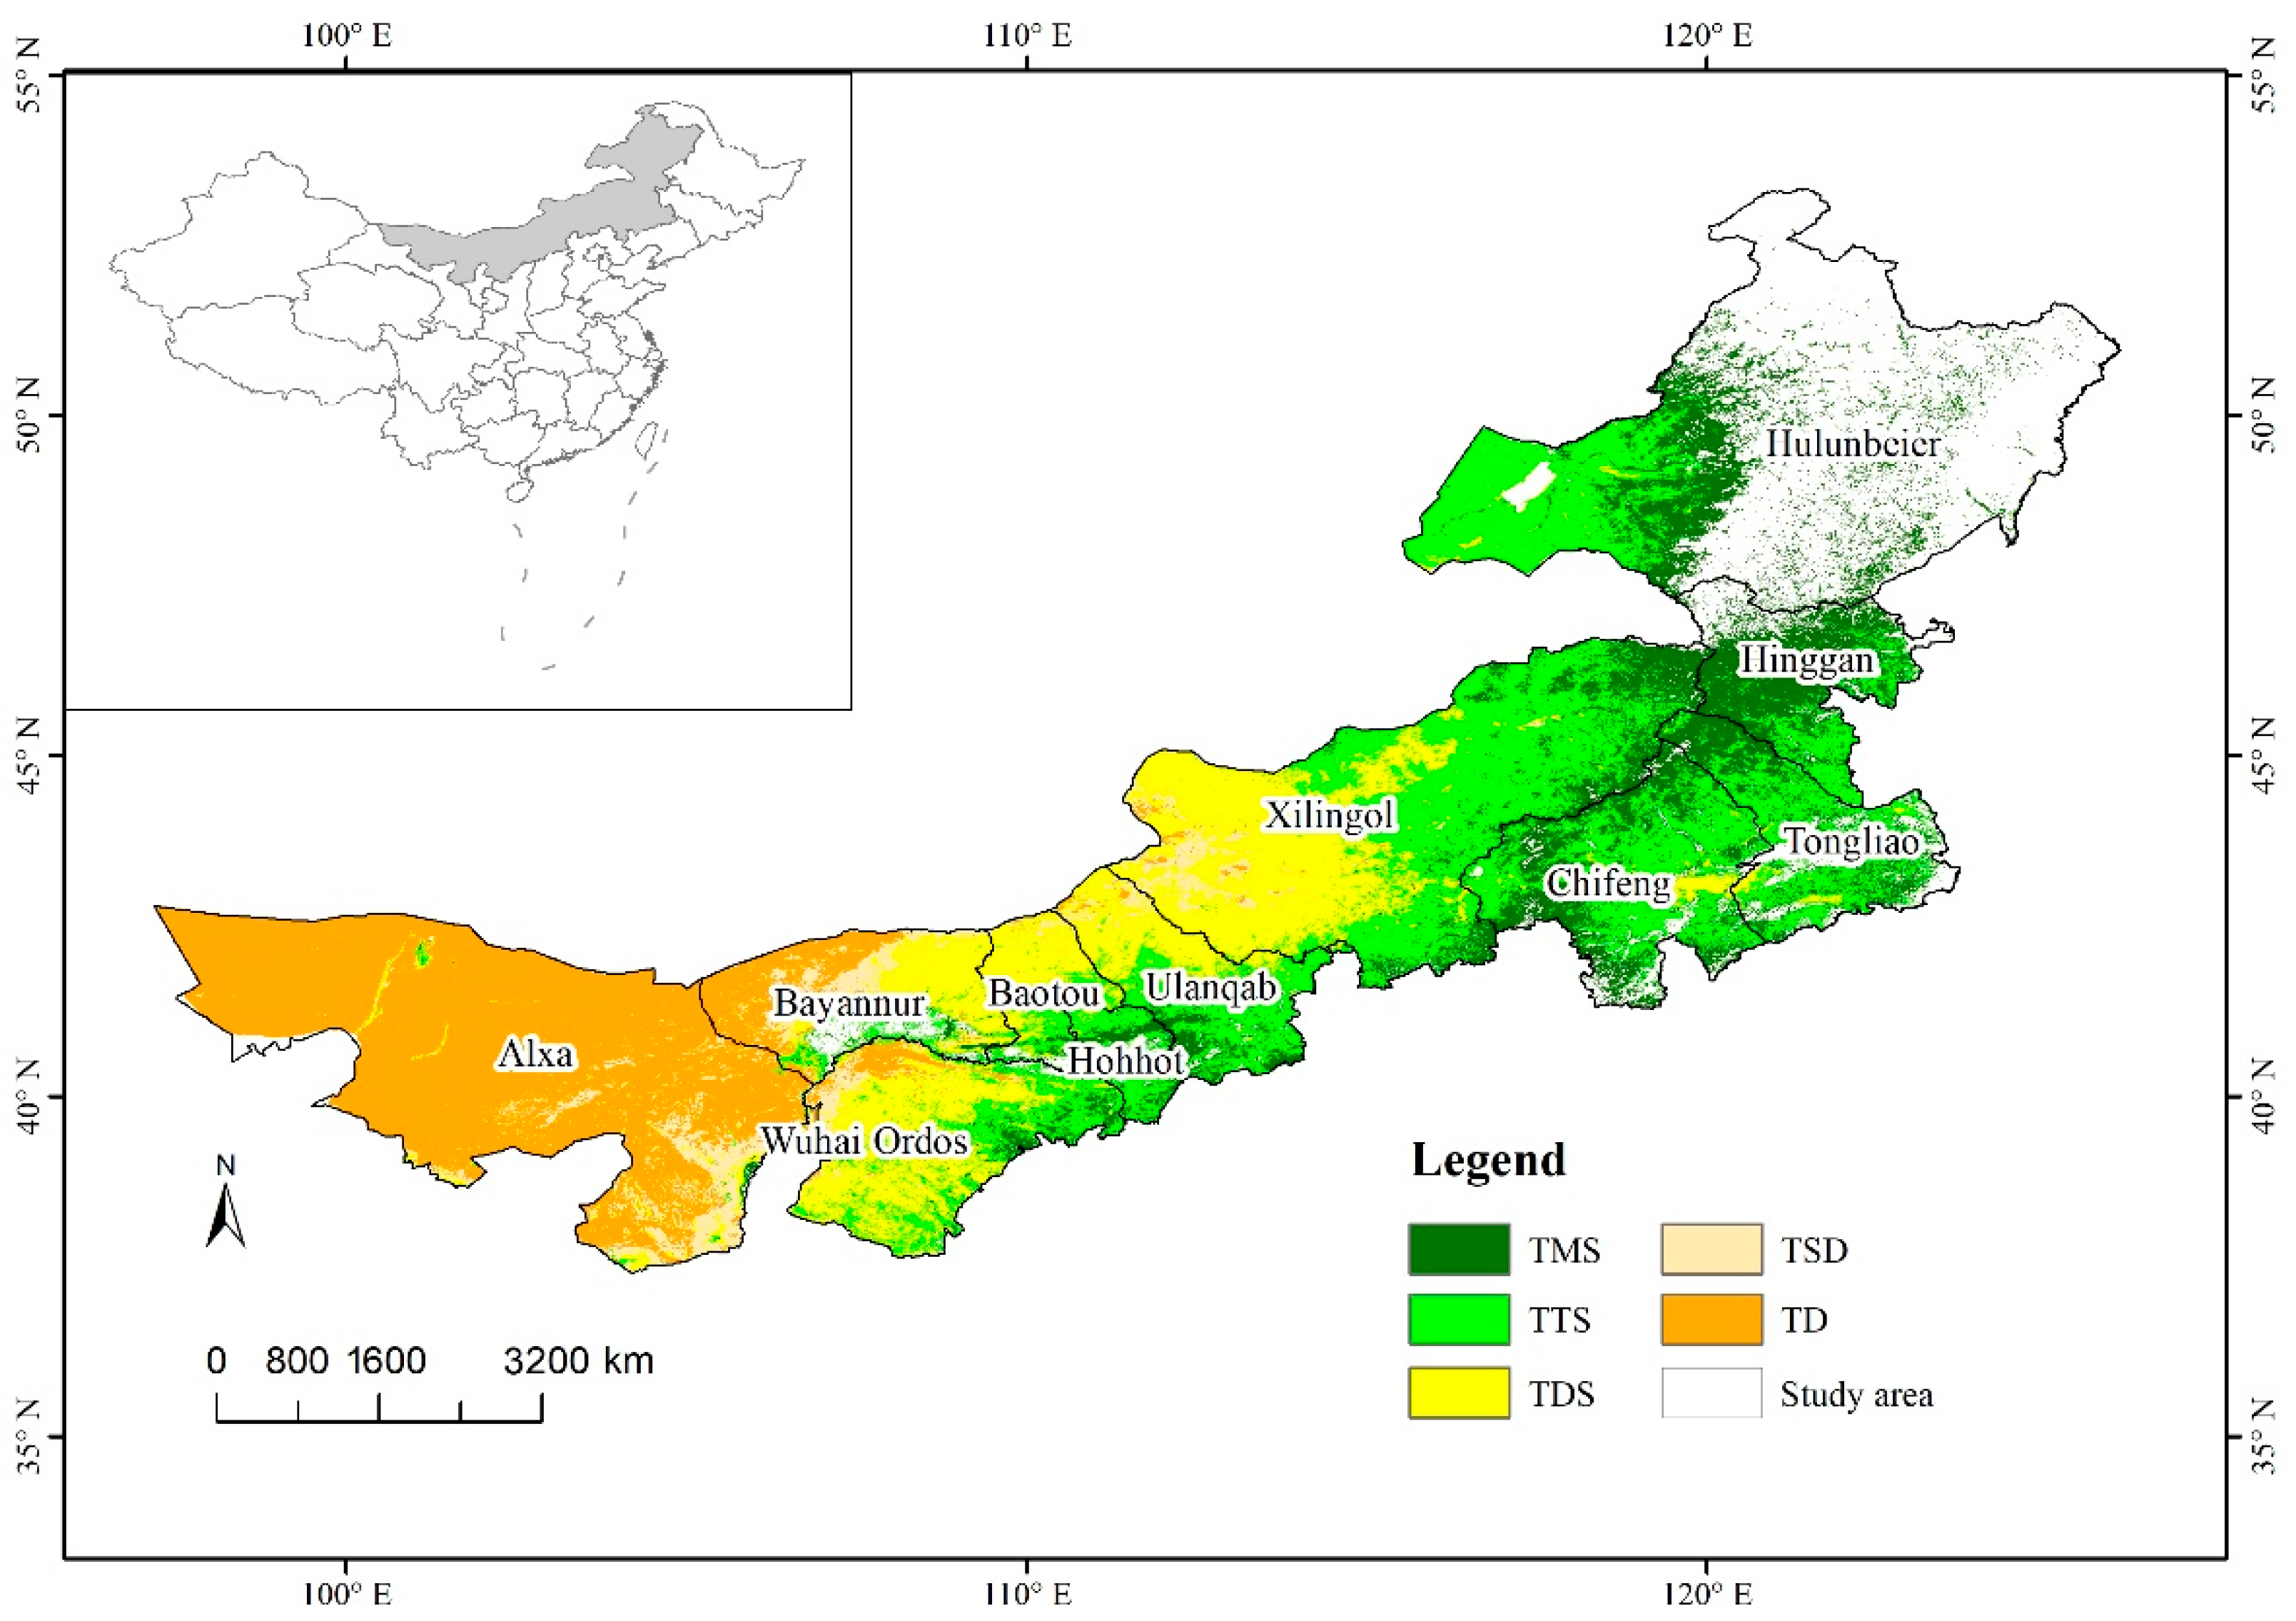
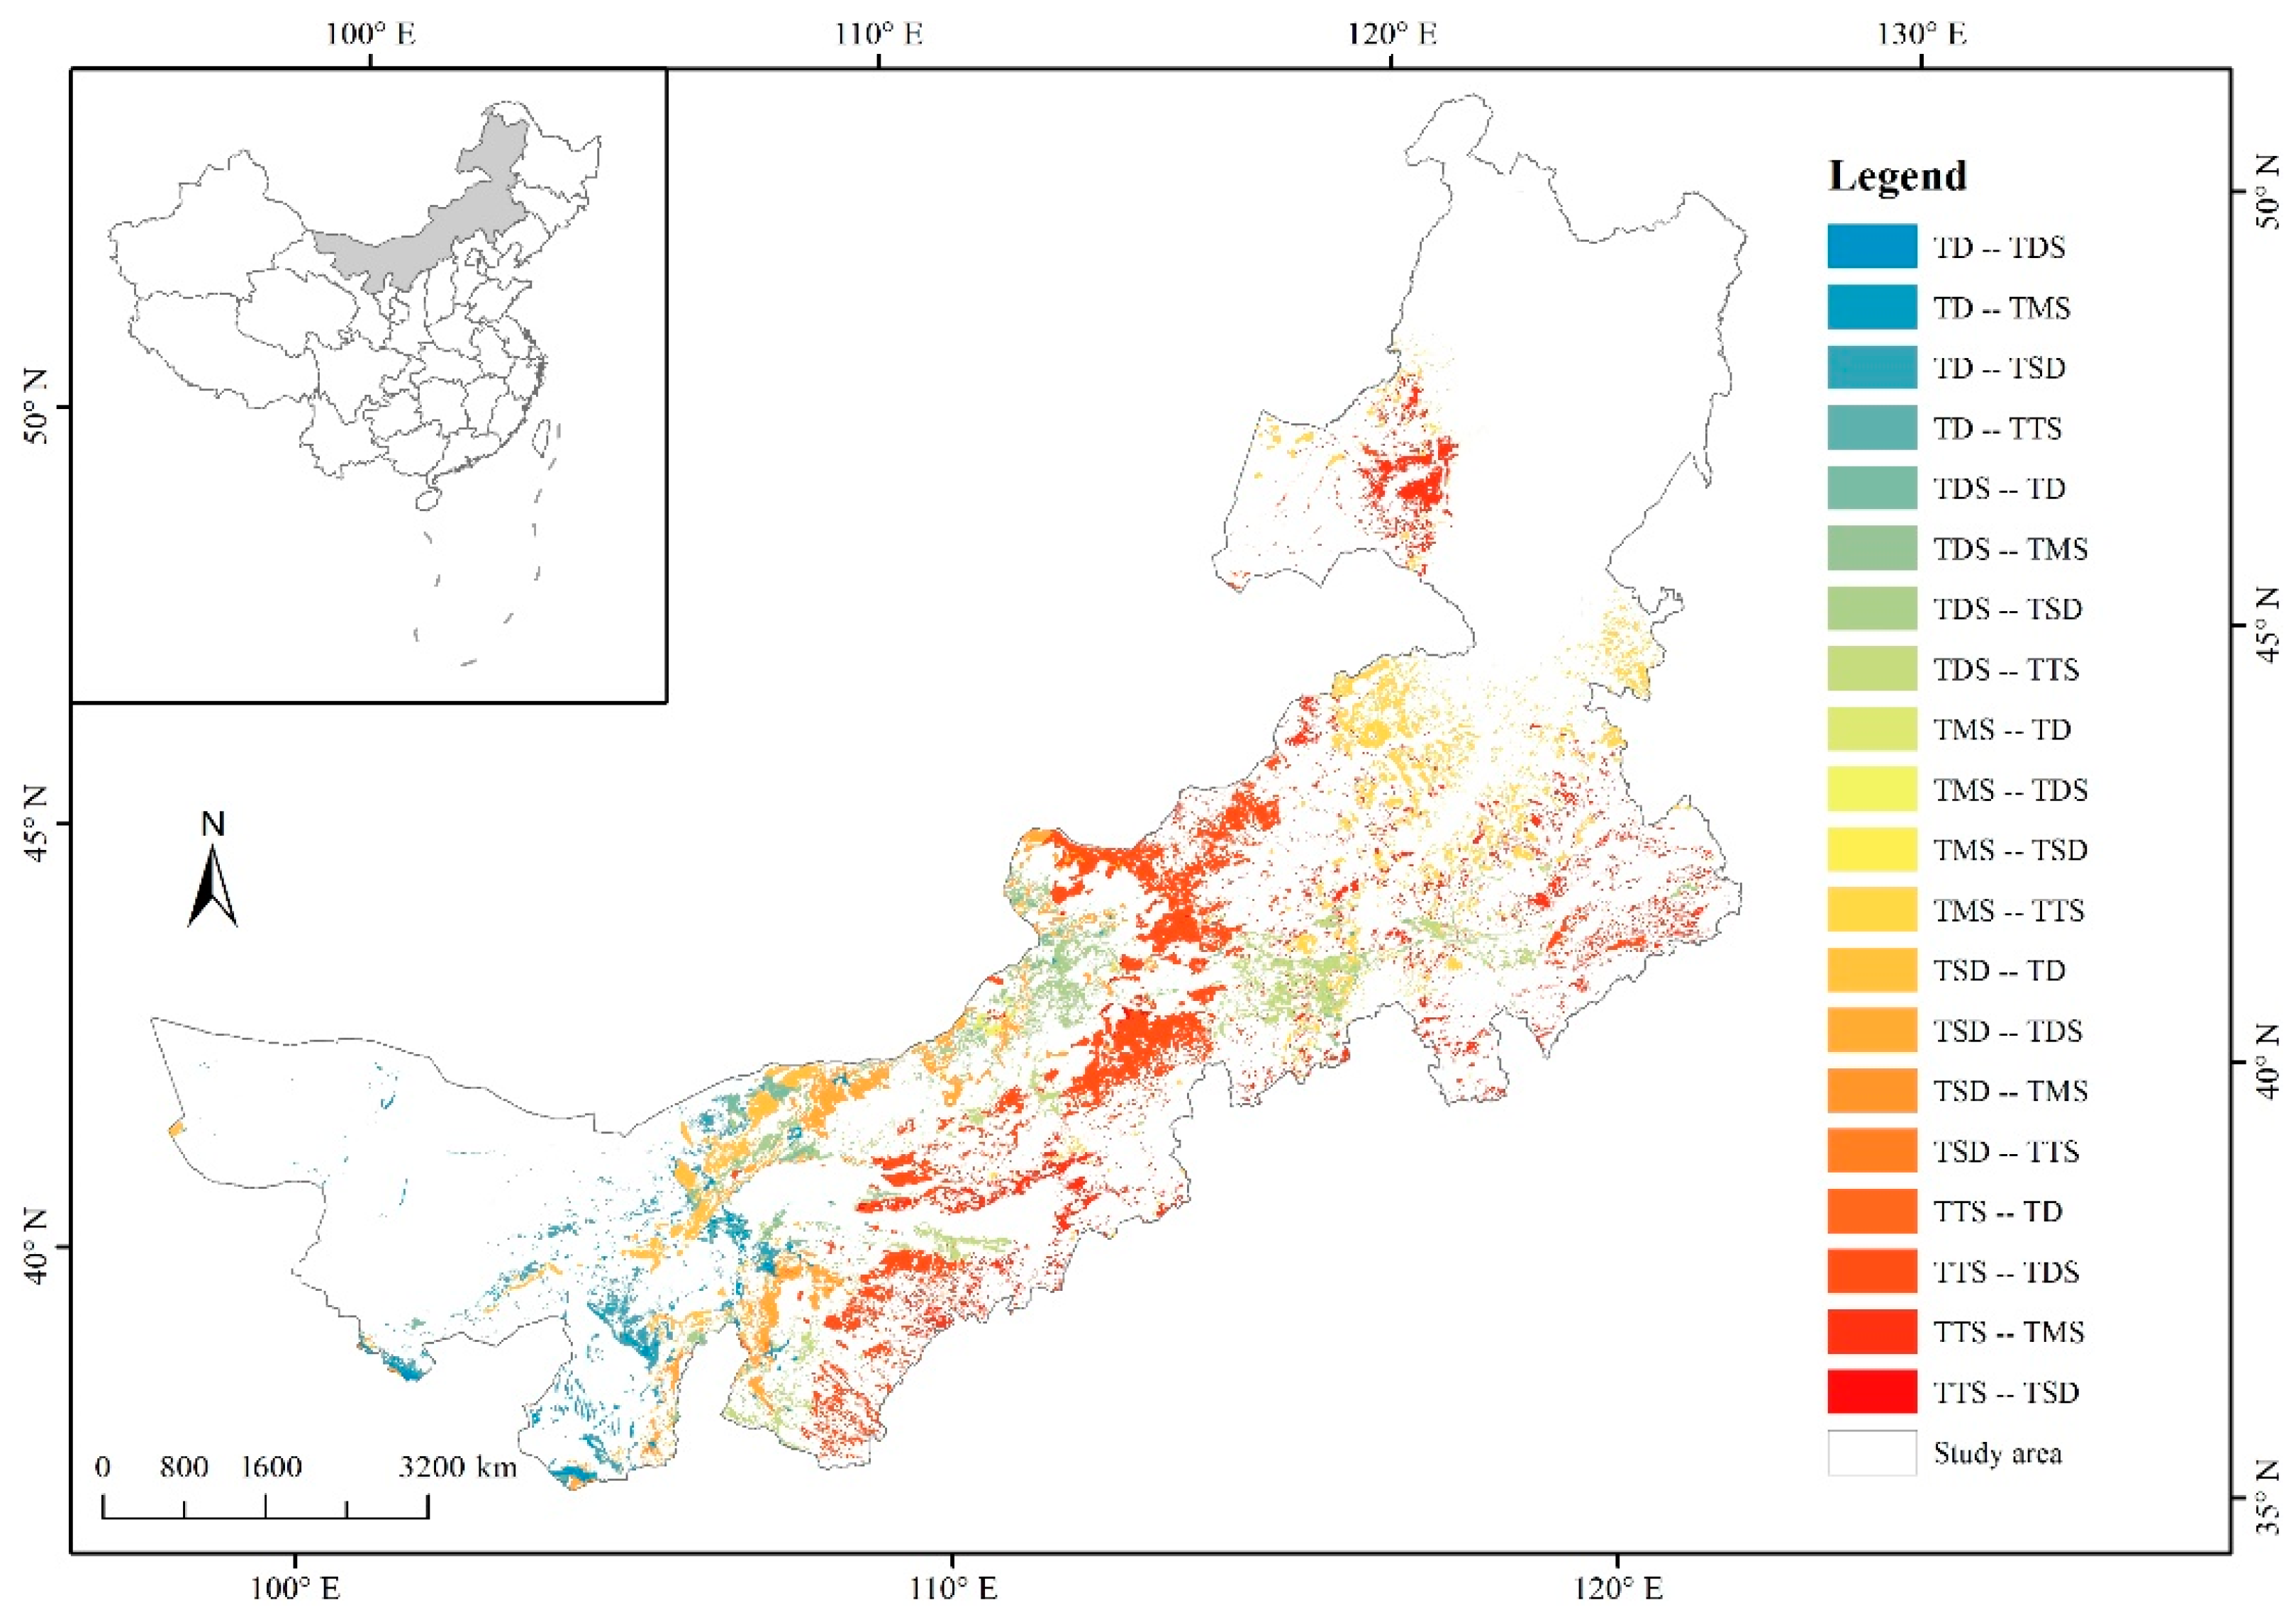
3.4. Distribution of Grassland Classes in Inner Mongolia
3.5. Spatial and Temporal Variation of Grassland Classes in Inner Mongolia
4. Discussion
4.1. Remote Sensing Classification of Grassland Classes
4.2. Limitations and Prospects of Grassland Classification
5. Conclusions
Supplementary Materials
Author Contributions
Funding
Acknowledgments
Conflicts of Interest
References
- Ren, J.Z.; Hu, Z.Z.; Zhao, J.; Zhang, D.G.; Hou, F.J.; Lin, H.L.; Mu, X.D. A grassland classification system and its application in China. Rangeland J. 2008, 30, 199–209. [Google Scholar] [CrossRef]
- Jacobsen, A.; Nielsen, A.A.; Ejrnæs, R.; Groom, G.B. Spectral identification of danish grassland classes related to management and plant species composition. In Proceedings of the 4th International Airborne Remote Sensing Conference and Exhibition/21st Canadian Symposium on Remote Sensing, Ottawa, ON, Canada, 21–24 June 1999; pp. 74–81. [Google Scholar]
- Lin, H.L.; Feng, Q.S.; Liang, T.G.; Ren, J.Z. Modelling global-scale potential grassland changes in spatio-temporal patterns to global climate change. Int. J. Sustain. Dev. World. Ecol. 2013, 20, 83–96. [Google Scholar] [CrossRef]
- Pratt, D.J.; Greenway, P.J.; Gwynne, M.D. A Classification of East African Rangeland, with an Appendix on Terminology. J. Appl. Ecol. 1966, 3, 369–382. [Google Scholar] [CrossRef]
- Lauenroth, W.K. Grassland Primary Production: North American Grasslands in Perspective. In Perspectives in Grassland Ecology; Springer: New York, NY, USA, 1979; pp. 3–24. [Google Scholar]
- Wei, Y.X.; Chen, Q.G. Grassland classification and evaluation of grazing capacity in Naqu Prefecture, Tibet Autonomous Region, China. N. Z. J. Agric. Res. 2001, 44, 253–258. [Google Scholar]
- Cui, X.; Guo, Z.G.; Liang, T.G.; Shen, Y.Y.; Liu, X.Y.; Liu, Y. Classification management for grassland using MODIS data: A case study in the Gannan region, China. Int. J. Remote Sens. 2012, 33, 3156–3175. [Google Scholar] [CrossRef]
- Hu, Z.W.; Zhang, S.; Yu, X.Y.; Wang, X.S. Preliminary Research on Grassland Fine-classification Based on MODIS. IOP Conf. Ser. Earth Environ. Sci. 2014, 17, 012079. [Google Scholar] [CrossRef] [Green Version]
- Ren, H.G.; Zhou, G.S. Measuring the impacts of anthropogenic activities on Inner Mongolian temperate grassland. Land Degrad Dev. 2018, 29, 2942–2950. [Google Scholar] [CrossRef]
- Guo, D.; Song, X.N.; Hu, R.H.; Cai, S.H.; Zhu, X.M.; Hao, Y.B. Grassland type-dependent spatiotemporal characteristics of productivity in Inner Mongolia and its response to climate factors. Sci. Total Environ. 2021, 775, 145644. [Google Scholar] [CrossRef]
- Su, Y.J.; Guo, Q.H.; Hu, T.Y.; Guan, H.C.; Jin, S.C.; An, S.Z.; Chen, X.L.; Guo, K.; Hao, Z.Q.; Hu, Y.M.; et al. An updated Vegetation Map of China (1:1,000,000). Sci. Bull. 2020, 65, 1125–1136. [Google Scholar] [CrossRef]
- Miao, L.J.; Sun, Z.L.; Ren, Y.J.; Schierhorn, F.; Müller, D. Grassland greening on the Mongolian Plateau despite higher grazing intensity. Land Degrad Dev. 2020, 32, 792–802. [Google Scholar] [CrossRef]
- Su, L.D.; Yang, J.; Wang, Z.Q.; Gu, R.; Yan, Y.L.; Gao, Q.Z. Climate change and its impacts on distribution pattern of grassland types in Inner Mongolia. Chin. J. Agrometeorol. 2015, 36, 139–148. [Google Scholar]
- Wei, P.; Xu, L.; Pan, X.B.; Hu, Q.; Li, Q.Y.; Zhang, X.T.; Shao, C.X.; Wang, C.C.; Wang, X.X. Spatio-temporal variations in vegetation types based on a climatic grassland classification system during the past 30 years in Inner Mongolia, China. CATENA 2020, 185, 104298. [Google Scholar] [CrossRef]
- Su, R.N.; Yu, T.; Dayananda, B.; Bu, R.; Su, J.H.; Fan, Q.Y. Impact of climate change on primary production of Inner Mongolian grasslands. Glob. Ecol. Conserv. 2020, 22, e00928. [Google Scholar] [CrossRef]
- Naidoo, R.; Hill, K. Emergence of indigenous vegetation classifications through integration of traditional ecological knowledge and remote sensing analyses. Environ. Manag. 2006, 38, 377–387. [Google Scholar] [CrossRef] [PubMed]
- Ichter, J.; Evans, D.; Richard, D. Terrestrial Habitat Mapping in Europe: An Overview; European Environmental Agency: Luxembourg, 2014; p. 152.
- De Cáceres, M.; Wiser, S.K. Towards consistency in vegetation classification. J. Veg. Sci. 2012, 23, 387–393. [Google Scholar] [CrossRef]
- Tierney, D.A.; Fletcher, A.T.; Erskine, P.D. Standard survey designs drive bias in the mapping of upland swamp communities. Austral. Ecol. 2015, 40, 782–793. [Google Scholar] [CrossRef]
- 1:1,000,000 China Grassland Resource Mapping Committee. 1:1 Million Atlas of Grassland Resources in China; China Cartographic Publishing House: Beijing, China, 1993. [Google Scholar]
- Meiss, M.; Jacob, F.; Duveiller, G. Remote sensing for agricultural applications: A meta-review. Remote Sens. Environ. 2020, 236, 111402. [Google Scholar]
- Jamshidi, S.; Zand-Parsa, S.; Niyogi, D. Assessing Crop Water Stress Index of Citrus Using In-Situ Measurements, Landsat, and Sentinel-2 Data. Int. J. Remote Sens. 2021, 42, 1893–1916. [Google Scholar] [CrossRef]
- Jahromi, M.N.; Jahromi, M.N.; Pourghasemi, H.R.; Zand-Parsa, S.; Jamshidi, S. Accuracy assessment of forest mapping in MODIS land cover dataset using fuzzy set theory. In Forest Resources Resilience and Conflicts; Elsevier: Amsterdam, The Netherlands, 2021; pp. 165–183. [Google Scholar]
- Reinermann, S.; Asam, S.; Kuenzer, C. Remote Sensing of Grassland Production and Management—A Review. Remote Sens. 2020, 12, 1949. [Google Scholar] [CrossRef]
- Masoud, M.; Bahram, S.; Mohammad, R.; Fariba, M.; Zhang, Y. Very Deep Convolutional Neural Networks for Complex Land Cover Mapping Using Multispectral Remote Sensing Imagery. Remote Sens. 2018, 10, 1119. [Google Scholar]
- Wulder, M.A.; Coops, N.C.; Roy, D.P.; White, J.C.; Hermosilla, T. Land cover 2.0. Int. J. Remote Sens. 2018, 39, 4254–4284. [Google Scholar] [CrossRef] [Green Version]
- Dixon, A.P.; Faber-Langendoen, D.; Josse, C.; Morrison, J.; Loucks, C.J. Distribution mapping of world grassland types. J. Biogeogr. 2014, 41, 2003–2019. [Google Scholar] [CrossRef]
- Meng, B.P.; Ge, J.; Liang, T.G.; Yang, S.X.; Gao, J.; Feng, Q.S.; Cui, X.; Huang, X.D.; Xie, H.J. Evaluation of Remote Sensing Inversion Error for the Above-Ground Biomass of Alpine Meadow Grassland Based on Multi-Source Satellite Data. Remote Sens. 2017, 9, 372. [Google Scholar] [CrossRef] [Green Version]
- Meng, B.P.; Liang, T.G.; Yi, S.H.; Yin, J.P.; Cui, X.; Ge, J.; Hou, M.J.; Lv, Y.Y.; Sun, Y. Modeling alpine grassland above ground biomass based on remote sensing data and machine learning algorithm: A case study in the east of Tibetan Plateau, China. IEEE J. Sel. Top. Appl. Earth Obs. Remote Sens. 2020, 13, 2986–2995. [Google Scholar] [CrossRef]
- Wen, Q.K.; Zhang, Z.X.; Liu, S.; Wang, X.; Wang, C. Classification of Grassland Types by MODIS Time-Series Images in Tibet, China. IEEE J. Sel. Top. Appl. Earth Obs. Remote Sens. 2010, 3, 404–409. [Google Scholar] [CrossRef]
- Zhang, X.M.; Sheng, Y.; Nan, Z.T.; Zhao, L.; Zhou, G.Y.; Yue, G.Y. Vegetation classification of alpine grassland based on decision tree approach in the Wenquan area of the Qinghai-Tibet Plateau. Pratacult. Sci. 2011, 28, 2074–2083. [Google Scholar]
- Zhang, X.S. Vegetation Classification Research of Grassland Based on Decision Tree Approach in Xinjiang Yili Area. Master’s Thesis, Lanzhou Jiaotong University, Lanzhou, China, 2015. [Google Scholar]
- Liang, T.G.; Yang, S.X.; Feng, Q.S.; Liu, B.K.; Zhang, R.P.; Huang, X.D.; Xie, H.J. Multi-factor modeling of above-ground biomass in alpine grassland: A case study in the Three-River Headwaters Region, China. Remote Sens. Environ. 2016, 186, 164–172. [Google Scholar] [CrossRef]
- Yi, S.H. FragMAP: A tool for long-term and cooperative monitoring and analysis of small-scale habitat fragmentation using an unmanned aerial vehicle. Int. J. Remote Sens. 2017, 38, 8–10. [Google Scholar] [CrossRef]
- Yi, S.H.; Chen, J.J.; Qin, Y.; Xu, G.W. The burying and grazing effects of plateau pika on alpine grassland are small: A pilot study in a semiarid basin on the Qinghai-Tibet Plateau. Biogeosciences 2016, 13, 6273. [Google Scholar] [CrossRef] [Green Version]
- Wang, Z.X.; Liu, C.; Zhao, B.R. Potentials and limitation of AVHRR for grassland classification in Xilingol, Inner Mongolia. J. Nat. Resour. 2003, 18, 704–711. [Google Scholar]
- Zhao, B.R.; Liu, C.; Liu, A.J.; Wang, Z.X. Estimate the yield of grassland using MODIS-NDV—A case study of the grassland in Xilinguole in Inner Mongolia. Pratacult. Sci. 2004, 21, 12–15. [Google Scholar]
- Navin, M.S.; Agilandeeswari, L. Comprehensive review on land use/land cover change classification in remote sensing. J. Spectr. Imaging 2020, 9, a8. [Google Scholar] [CrossRef]
- Meng, B.P.; Yang, Z.G.; Yu, H.Y.; Qin, Y.; Sun, Y.; Zhang, J.G.; Chen, J.J.; Wang, Z.W.; Zhang, W.; Li, M.; et al. Mapping of Kobresia pygmaea Community Based on Umanned Aerial Vehicle Technology and Gaofen Remote Sensing Data in Alpine Meadow Grassland: A Case Study in Eastern of Qinghai–Tibetan Plateau. Remote Sens. 2021, 13, 2483. [Google Scholar] [CrossRef]
- Meng, B.P.; Gao, J.L.; Liang, T.G.; Cui, X.; Ge, J.; Yin, J.P.; Feng, Q.S.; Xie, H.J. Modeling of Alpine Grassland Cover Based on Unmanned Aerial Vehicle Technology and Multi-Factor Methods: A Case Study in the East of Tibetan Plateau, China. Remote Sens. 2018, 10, 320. [Google Scholar] [CrossRef] [Green Version]
- Sun, Y.; Yi, S.H.; Hou, F.J. Unmanned aerial vehicle methods makes species composition monitoring easier in grasslands. Ecol. Indic. 2018, 95, 825–830. [Google Scholar] [CrossRef]
- Friedl, M.A.; Brodley, C.E. Decision tree classification of land cover from remotely sensed data. Remote Sens. Environ. 1997, 61, 399–409. [Google Scholar] [CrossRef]
- Chen, T.; Zhu, L.; Niu, R.Q.; Trinder, C.J.; Peng, L.; Lei, T. Mapping landslide susceptibility at the Three Gorges Reservoir, China, using gradient boosting decision tree, random forest and information value models. J. Mt. Sci. 2020, 17, 670–685. [Google Scholar] [CrossRef]
- Breiman, L. Bagging predictors. Mach. Learn. 1996, 24, 123–140. [Google Scholar] [CrossRef] [Green Version]
- Breiman, L. Random Forests. Mach. Learn. 2001, 45, 5–32. [Google Scholar] [CrossRef] [Green Version]
- Dreiseitl, S.; Ohno-Machado, L. Logistic regression and artificial neural network classification models: A methodology review. J. Biomed. Inform. 2002, 35, 352–359. [Google Scholar] [CrossRef] [Green Version]
- Tiryaki, S.; Aydın, A. An artificial neural network model for predicting compression strength of heat treated woods and comparison with a multiple linear regression model. Constr. Build. Mater. 2014, 62, 102–108. [Google Scholar] [CrossRef]
- Yang, S.; Feng, Q.; Liang, T.; Liu, B.; Zhang, W.; Xie, H. Modeling grassland above-ground biomass based on artificial neural network and remote sensing in the Three-River Headwaters Region. Remote Sens. Environ. 2017, 204, 448–455. [Google Scholar] [CrossRef]
- Yu, K.F.; Lehmkuhl, F.; Falk, D. Quantifying land degradation in the Zoige Basin, NE Tibetan Plateau using satellite remote sensing data. J. Mt. Sci. 2017, 14, 77–93. [Google Scholar] [CrossRef]
- Zhang, J.G.; Liu, D.W.; Meng, B.P.; Chen, J.J.; Wang, X.Y.; Jiang, H.; Yu, Y.; Yi, S.H. Using UAVs to assess the relationship between alpine meadow bare patches and disturbance by pikas in the source region of Yellow River on the Qinghai-Tibetan Plateau. Glob. Ecol. Conserv. 2021, 26, e01517. [Google Scholar] [CrossRef]
- Lv, Y.; Shen, M.; Meng, B.; Zhang, H.; Sun, Y.; Zhang, J.; Chang, L.; Li, J.; Yi, S. The Similarity between Species Composition of Vegetation and Soil Seed Bank of Grasslands in Inner Mongolia, China: Implications for the Asymmetric Response to Precipitation. Plants 2021, 10, 1890. [Google Scholar] [CrossRef] [PubMed]
- Zhang, X.K.; Lu, X.Y.; Wang, X.D. Spatial-Temporal NDVI Variation of Different Alpine Grassland Classes and Groups in Northern Tibet from 2000 to 2013. Mt. Res. Dev. 2015, 35, 254–263. [Google Scholar] [CrossRef]
- Gao, T.; Yang, X.C.; Jin, Y.X.; Ma, H.L.; Li, J.Y.; Yu, H.D.; Yu, Q.Y.; Zheng, X.; Xu, B. Spatio-Temporal Variation in Vegetation Biomass and Its Relationships with Climate Factors in the Xilingol Grasslands, Northern China. PLoS ONE 2013, 8, e83824. [Google Scholar] [CrossRef]
- Liu, M.; Liu, G.H.; Gong, L.; Wang, D.B.; Sun, J. Relationships of Biomass with Environmental Factors in the Grassland Area of Hulunbuir, China. PLoS ONE 2014, 9, e102344. [Google Scholar] [CrossRef] [Green Version]
- Li, Z.Q.; Guo, X.L. Topographic effects on vegetation biomass in semiarid mixed grassland under climate change using AVHRR NDVI data. Br. J. Environ. Clim. Chang. 2014, 4, 229–242. [Google Scholar] [CrossRef]
- Pan, Y.; Li, X.; Gong, P.; He, C.; Shi, P.; Pu, R. An integrative classification of vegetation in China based on NOAA AVHRR and vegetation-climate indices of the Holdridge life zone. Int. J. Remote Sens. 2003, 24, 1009–1027. [Google Scholar] [CrossRef]
- Ma, W.W. Study on Methods for Grassland Classification and Quality Estimation by Remote Sensing: A Case Study in the Region around Qinghai Lake; University of Chinese Academy of Sciences: Beijing, China, 2015. [Google Scholar]
- Guo, Q.H.; Guan, H.C.; Hu, T.Y.; Jin, S.C.; Su, Y.J.; Wang, X.J.; Wei, D.J.; Ma, Q.; Sun, Q.H. Remote sensing-based mapping for the new generation of Vegetation Map of China (1:500,000). Sci Sin Vitae 2021, 51, 229–241. (In Chinese) [Google Scholar] [CrossRef]
- Feng, Q.S.; Liang, T.G.; Huang, X.D.; Lin, H.L.; Xie, H.J.; Ren, J.Z. Characteristics of global potential natural vegetation distribution from 1911 to 2000 based on comprehensive sequential classification system approach. Grassl. Sci. 2013, 59, 87–99. [Google Scholar] [CrossRef]


| Grassland Classes | Vegetation Life Form | Dominant Grass Species | Coverage |
|---|---|---|---|
| TD | Extremely xerophytic short shrubs, semishrubs | Lyonia ovalifolia, Salsola laricifolia, Reaumuria songarica, Kalidium foliatum, Artemisia desertorum, Psammochloa villosa | 0–20% |
| TSD | Super xerophytic semi-shrubs, shrubs, and xerophytic grasses | Seriphidium gracilescens, Seriphidium terrae-albae, Seriphidium borotalense, Sympegma regelii, Reaumuria soongorica, Anabasis brevifolia, Stipa glareosa | 20–30% |
| TDS | Super xerophytic grasses, xerophytic short/semishrubs | Stipa tianschanica, Stipa breviflora, Cleistogenes songorica, Artemisia frigida, Allium mongolicum, Allium aflatunense | 30–40% |
| TTS | Xerophytic perennial tufted grasses, xerophytic short shrubs | Stipa grandis, Stipa krylovii, Stipa bungeana, Cleistogenes squarrosa, Agropyron cristatum, Artemisia frigida, Caragana sinica | 60–70% |
| TMS | Mesoxerophytic perennial tufted grasses and root grasses | Stipa baicalensis, Leymus chinensis, Filifolium sibiricum | 70–90% |
| Index | Importance (%) | Contribution (%) | Index | Importance (%) | Contribution (%) |
|---|---|---|---|---|---|
| Sum_8 | 7.58 | 7.58 | Minimum_6 | 2.5 | 72.43 |
| Mean_8 | 6.25 | 13.83 | Median_5 | 2.27 | 74.71 |
| Maximum_9 | 5.57 | 19.4 | Minimum_9 | 2.21 | 76.92 |
| Sum_7 | 5.28 | 24.68 | Sum_5 | 2.1 | 79.02 |
| Median_8 | 4.63 | 29.31 | Minimum_7 | 2.04 | 81.06 |
| Mean_7 | 4.34 | 33.65 | Minimum_8 | 1.76 | 82.82 |
| Mean_9 | 4.07 | 37.73 | Std_6 | 1.75 | 84.57 |
| Maximum_6 | 3.72 | 41.45 | Std_9 | 1.73 | 86.3 |
| Sum_9 | 3.22 | 44.67 | Range_9 | 1.72 | 88.02 |
| Maximum_7 | 3.22 | 47.88 | Std_8 | 1.6 | 89.62 |
| Mean_6 | 3.14 | 51.02 | Range_5 | 1.6 | 91.22 |
| Mean_5 | 2.93 | 53.95 | Std_5 | 1.56 | 92.78 |
| Mediam_9 | 2.8 | 56.76 | Minimum_5 | 1.52 | 94.3 |
| Sum_6 | 2.74 | 59.5 | Range_6 | 1.51 | 95.81 |
| Maximum_5 | 2.67 | 62.17 | Std_7 | 1.48 | 97.29 |
| Medium_7 | 2.66 | 64.82 | Range_7 | 1.44 | 98.73 |
| Maximum_8 | 2.59 | 67.41 | Range_8 | 1.27 | 100 |
| Median_6 | 2.52 | 69.93 |
| Grassland Classes | DT (%) | GDBT (%) | RF (%) | LR (%) | ||||
|---|---|---|---|---|---|---|---|---|
| PA | UA | PA | UA | PA | UA | PA | UA | |
| TMS | 73.91 | 68.69 | 56.82 | 71.43 | 62.16 | 65.71 | 67.65 | 65.71 |
| TTS | 71.63 | 81.87 | 77.50 | 69.66 | 75.56 | 76.40 | 71.13 | 77.53 |
| TDS | 72.90 | 69.64 | 62.50 | 77.78 | 66.67 | 75.56 | 64.00 | 71.11 |
| TSD | 61.54 | 53.33 | 80.00 | 42.86 | 87.50 | 50.00 | 90.91 | 35.71 |
| TD | 90.91 | 76.92 | 76.47 | 86.67 | 77.78 | 93.33 | 70.00 | 93.33 |
| OA (%) | 62.74 | 69.34 | 72.17 | 69.81 | ||||
| Kappa | 0.63 | 0.58 | 0.62 | 0.58 | ||||
| Grassland Classes | Validation Dataset | Total | UA (%) | ||||
|---|---|---|---|---|---|---|---|
| TMS | TTS | TDS | TSD | TD | |||
| TMS | 23 | 12 (13.33%) | 0 | 0 | 0 | 35 | 65.71 |
| TTS | 12 (32.43%) | 68 | 9 (17.65%) | 0 | 0 | 89 | 76.40 |
| TDS | 1 (2.70%) | 9 (10.00%) | 34 | 1 (6.25%) | 0 | 45 | 75.56 |
| TSD | 1 (2.70%) | 1 (1.11%) | 8 (15.68%) | 14 | 4 (22.22%) | 28 | 50.00 |
| TD | 0 | 0 | 0 | 1 (6.25%) | 14 | 15 | 93.33 |
| Total | 37 | 90 | 51 | 16 | 18 | 212 | |
| PA (%) | 62.16 | 75.56 | 66.67 | 87.50 | 77.78 | ||
| Transition Matrix | Grassland Classes in 2019 | |||||||
|---|---|---|---|---|---|---|---|---|
| Grassland Classes | TMS | TTS | TDS | TSD | TD | Total | Decrease | |
| Grassland classes in the 1980s | TMS | 4.81 | 2.60 | 0.05 | 0.02 | 0.02 | 7.51 | 2.70 |
| TTS | 3.08 | 14.02 | 5.27 | 0.07 | 0.01 | 22.46 | 8.43 | |
| TDS | 0.16 | 1.70 | 8.31 | 1.36 | 0.34 | 11.87 | 3.56 | |
| TSD | 0.01 | 0.08 | 1.76 | 1.94 | 1.17 | 4.96 | 3.02 | |
| TD | 0.01 | 0.13 | 0.34 | 1.28 | 14.30 | 16.06 | 1.76 | |
| Total | 8.07 | 18.53 | 15.74 | 4.67 | 15.83 | 62.86 | ||
| Increase | 3.27 | 4.51 | 7.43 | 2.73 | 1.54 | |||
| Transition Matrix | Grassland Classes in 2019 | |||||||
|---|---|---|---|---|---|---|---|---|
| Grassland Classes | TMS | TTS | TDS | TSD | TD | Total | Decrease | |
| Grassland classes in the 1980s | TMS | 7.65 | 4.14 | 0.08 | 0.03 | 0.03 | 11.94 | 4.29 |
| TTS | 4.90 | 22.31 | 8.38 | 0.11 | 0.02 | 35.73 | 13.42 | |
| TDS | 0.26 | 2.70 | 13.22 | 2.16 | 0.54 | 18.89 | 5.66 | |
| TSD | 0.01 | 0.12 | 2.81 | 3.09 | 1.86 | 7.89 | 4.80 | |
| TD | 0.02 | 0.20 | 0.55 | 2.03 | 22.75 | 25.55 | 2.80 | |
| Total | 12.85 | 29.48 | 25.04 | 7.44 | 25.20 | 100 | ||
| Increase | 5.20 | 7.17 | 11.82 | 4.34 | 2.45 | |||
Publisher’s Note: MDPI stays neutral with regard to jurisdictional claims in published maps and institutional affiliations. |
© 2022 by the authors. Licensee MDPI, Basel, Switzerland. This article is an open access article distributed under the terms and conditions of the Creative Commons Attribution (CC BY) license (https://creativecommons.org/licenses/by/4.0/).
Share and Cite
Meng, B.; Zhang, Y.; Yang, Z.; Lv, Y.; Chen, J.; Li, M.; Sun, Y.; Zhang, H.; Yu, H.; Zhang, J.; et al. Mapping Grassland Classes Using Unmanned Aerial Vehicle and MODIS NDVI Data for Temperate Grassland in Inner Mongolia, China. Remote Sens. 2022, 14, 2094. https://doi.org/10.3390/rs14092094
Meng B, Zhang Y, Yang Z, Lv Y, Chen J, Li M, Sun Y, Zhang H, Yu H, Zhang J, et al. Mapping Grassland Classes Using Unmanned Aerial Vehicle and MODIS NDVI Data for Temperate Grassland in Inner Mongolia, China. Remote Sensing. 2022; 14(9):2094. https://doi.org/10.3390/rs14092094
Chicago/Turabian StyleMeng, Baoping, Yuzhuo Zhang, Zhigui Yang, Yanyan Lv, Jianjun Chen, Meng Li, Yi Sun, Huifang Zhang, Huilin Yu, Jianguo Zhang, and et al. 2022. "Mapping Grassland Classes Using Unmanned Aerial Vehicle and MODIS NDVI Data for Temperate Grassland in Inner Mongolia, China" Remote Sensing 14, no. 9: 2094. https://doi.org/10.3390/rs14092094
APA StyleMeng, B., Zhang, Y., Yang, Z., Lv, Y., Chen, J., Li, M., Sun, Y., Zhang, H., Yu, H., Zhang, J., Lian, J., He, M., Li, J., Yu, H., Chang, L., & Yi, S. (2022). Mapping Grassland Classes Using Unmanned Aerial Vehicle and MODIS NDVI Data for Temperate Grassland in Inner Mongolia, China. Remote Sensing, 14(9), 2094. https://doi.org/10.3390/rs14092094