Article

Evaluating Vertical Accuracies of Open-Source Digital Elevation Models over Multiple Sites in China Using GPS Control Points

School of Automation and Electronic Information, Xiangtan University, Xiangtan 411105, China
*
Author to whom correspondence should be addressed.
Remote Sens. 2022, 14(9), 2000; https://doi.org/10.3390/rs14092000
Submission received: 12 March 2022 / Revised: 10 April 2022 / Accepted: 18 April 2022 / Published: 21 April 2022

Abstract

:
Digital elevation models (DEMs) are widely used across a range of fields. Several open-source global DEMs have been released, including the advanced land observing satellite world 3D 30 m DEM (AW3D30DEM), advanced spaceborne thermal emission and reflection radiometer global DEM (ASTER GDEM), shuttle radar topography mission DEM (SRTMDEM), and TerraSAR-X for digital elevation measurement (TanDEM-X). ASTER and SRTM are the most widely used DEMs, while the newer models AW3D30DEM and TanDEM-X are becoming increasingly popular. Many studies have evaluated the qualities of these DEMs; however, few multi-regional studies have been conducted in China. To comprehensively and systematically evaluate the qualities of these DEMs in China, the vertical accuracies of AW3D, ASTER, STRM (all 30 m), and TanDEM-X (90 m) were tested across 16 regions in China. Using high-precision global positioning system control points for reference, error values were determined by subtracting these reference values from corresponding global DEM elevation values. As the study only covered flat areas (slope < 5°), slope was treated as a controlled variable. After assessing the impacts of the slope aspect and land cover type, variations in vertical accuracy were examined with respect to longitude and latitude. Overall, TanDEM-X exhibited the highest stability and accuracy, AW3D30 and SRTM also performed well, while ASTER exhibited the worst accuracy. The DEMs showed relationships with the slope aspect and land cover type, assuming that slope had no influence on vertical accuracy. In general, vertical accuracy in high latitudes was slightly better than that in low latitudes, and no evident variations were observed with respect to longitude. This study is the first to conduct DEM analysis across many regions in China from open sources. Since most of the users rely on public domain DEM datasets, this work contributes to their analysis in academic and engineering fields.

Graphical Abstract

1. Introduction

Digital elevation models (DEMs) and their derived topographic variables (such as slope and aspect) provide important data for research in the fields of geomorphology, climatology, hydrology, and biodiversity [1,2,3,4,5,6,7]. Over the past decade, several DEM products have been developed using remote sensing data [8,9,10]. Different remote sensing technologies have been used when producing DEMs, such as interferometric synthetic aperture radar (InSAR) and optical stereoscopic photogrammetry [11,12]. Thus, DEM errors will adversely affect the accuracies of results in subsequent investigations and data processing [13,14,15]. Therefore, it is very important to evaluate the qualities of DEM products and formulate appropriate correction methods [16,17]. Among currently available global or quasi-global digital elevation models, the space radar terrain mission DEM (SRTM DEM) and advanced spaceborne thermal emission and reflection radiometer global DEM (ASTER GDEM) are currently the most widely used. The SRTM DEM was obtained using InSAR. After the release of v1 in 2003, SRTMDEM has released v2 and v3 in 2006 and 2013, respectively. ASTER GDEM was acquired by optical stereo photogrammetry, with v1, v2, and v3 being released in 2009, 2011, and 2019, respectively. Advanced land observing satellite world 3D 30 m DEM (AW3D30DEM) and TerraSAR-X for digital elevation measurement (TanDEM-X) are newer global digital elevation products that are based on more advanced remote sensing data and better processing methods, and they are becoming increasingly favored by researchers (Figure 1). DEMs are constantly being updated, and new products are typically improved by the application and analysis of previous products to reduce errors and uncertainties. For example, SRTM v3 aimed to completely eliminate gaps, which were mostly filled using ASTER GDEM data [18].
There are currently many open-source global or quasi-global DEM products. However, the global accuracies of these DEM products do not necessarily represent the quality of a given local area, which is related to the respective area’s terrain, longitude and latitude, and land cover conditions, among other factors. Therefore, it is crucial to quantitatively evaluate the quality of a DEM and provide reference opinions for its use in designated areas.
Many researchers have recently evaluated the vertical accuracies of open-source global DEM products [8,9,10]. Moreover, many studies have been conducted focusing on certain regions in China. Han et al., for example, selected four sites in China (Sichuan, Xinjiang A, Xinjiang B, and Inner Mongolia), and they evaluated the quality of 12 and 30 m resolution TanDEM-X, 30 m resolution ASTER GDEM, and 30 m resolution SRTM, using reference data from the ice, cloud, and land elevation satellite geoscience laser altimeter system (ICESat/GLAS; absolute vertical accuracy = 14 cm, diameter = 70 m). They also analyzed the quality of the SRTM DEM in the c band using the local incident angle, in an attempt to provide a new perspective for evaluating the quality of SRTM and other DEMs with incident angle files [19]. Uuemaa et al., meanwhile, evaluated the vertical accuracies of six open-source global DEMs over the Ningxia Hui Autonomous Region of China, and they concluded that the accuracy of a global DEM largely depends on the unique characteristics of a region [20]. Li et al. analyzed the vertical error of SRTM in the northern Shaanxi Plateau area of China [21], while Hui et al. selected five typical landform validation samples in China to evaluate the accuracy of AW3D30DEM; compared with STRM and GDEM2, they found that AWD30 had a higher accuracy [22]. Although many studies have focused on one region or one type of DEM, or have analyzed each factor independently, to date the vertical accuracies of the above-mentioned freely available global DEMs have not yet been evaluated across multiple sites in China, under different terrain types, latitudes, longitudes, and land cover conditions.
Considering this research gap, the present study aimed to provide new insights into the large-scale evaluation of AW3D30, ASTER, STRM, and TanDEM-X in China. Hence, the vertical accuracies of AW3D30, ASTER, STRM, and TanDEM-X were evaluated across a large number of provinces in China. Field measurement data from global positioning system (GPS) receivers in various parts of China were used as reference data. These field measurements were mostly obtained in areas with gentle terrain, where the slope was generally <5°. Therefore, the slope variable was controlled, with the vertical accuracies of 30 m AW3D, 30 m ASTER DEM, 30 m STRM DEM, and 90 m TanDEM-X being analyzed in relation to slope aspect and land cover type. Considering a new perspective, the regularity of the vertical accuracy of AW3D30, SRTM, and TanDEM-X was also analyzed in relation to variations along longitude and latitude. To ensure rigorous processing of the experimental results, we used the Kruskal–Wallis test to analyze the variation of vertical accuracy of the same data source with latitude and longitude. We also selected more reference points in the 16 study areas we selected at an interval of 0.1° and controlled the variables more strictly. Taking the elevation value of the most accurate TanDEM-X 90 m as the reference value, we analyzed the impact of different latitudes along the same longitude on AW3D30 and SRTM, as well as the impact of different longitudes along the same latitude on these two DEMs, further expanding the analysis of latitude and longitude. Thus, this study evaluated whether the vertical accuracies of these DEMs showed limitations and particularities in different regions of China, providing a useful guide for other researchers when using these DEMs in China.

2. Materials and Methods
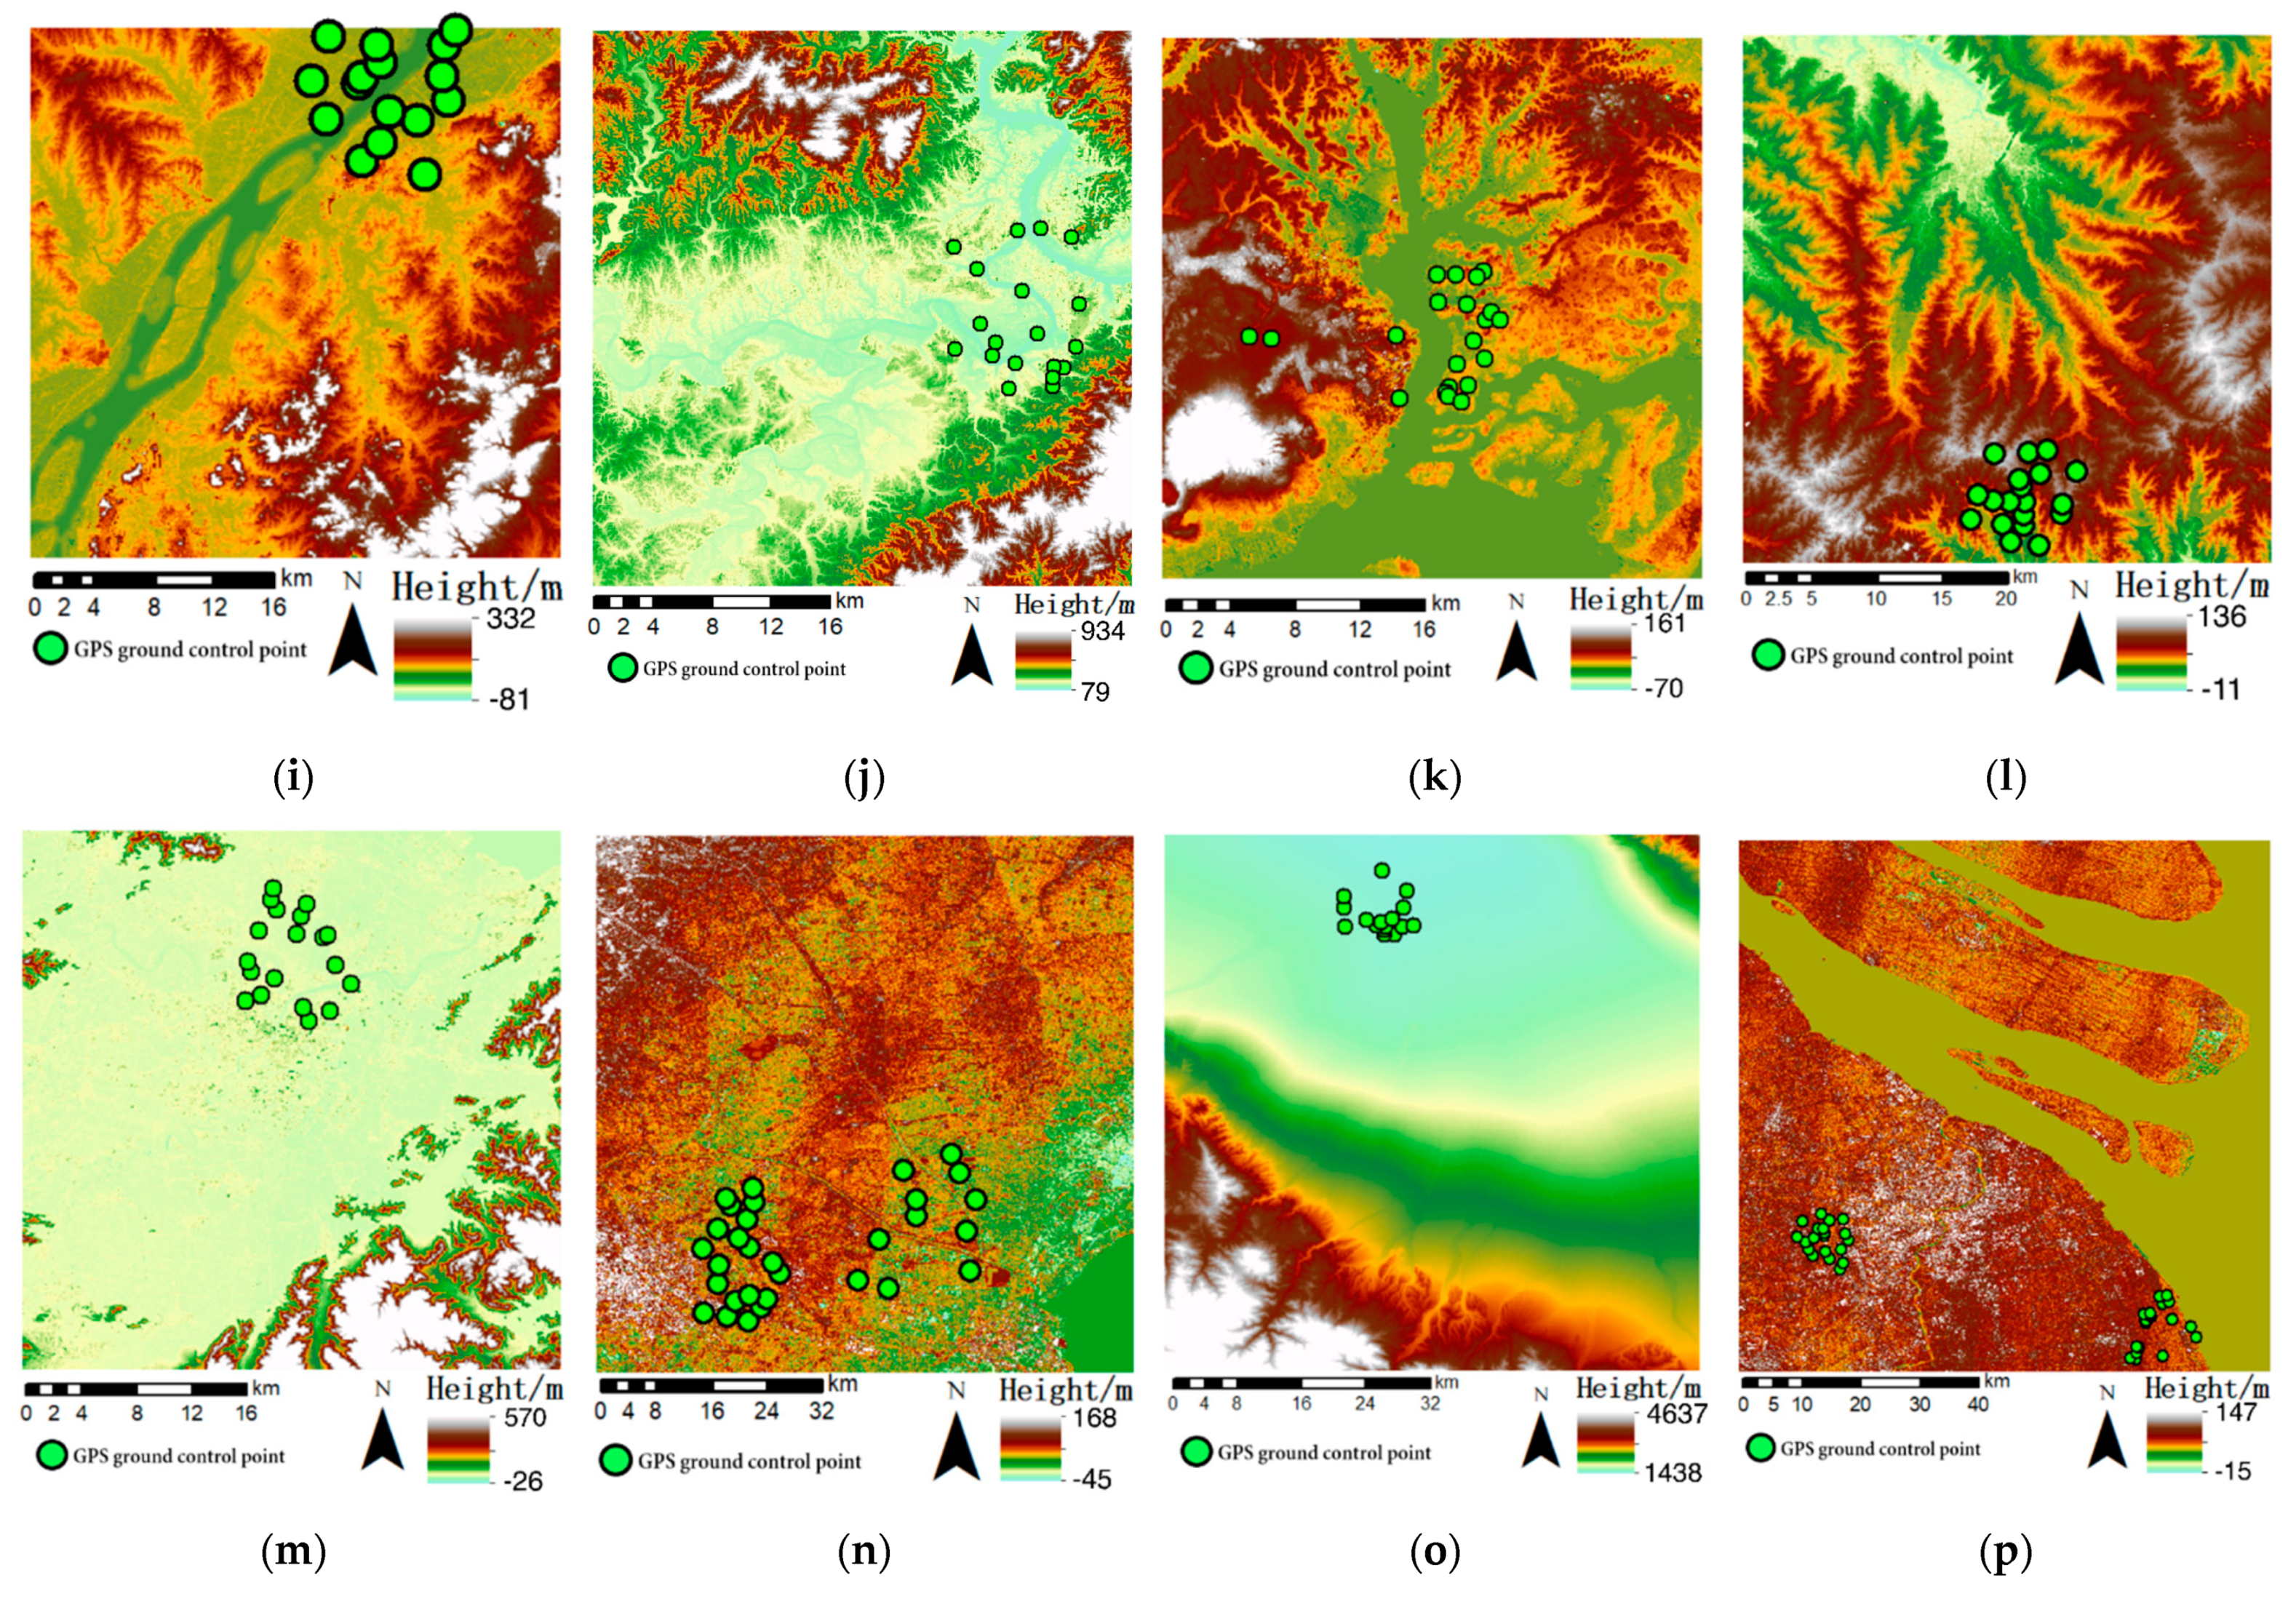
2.1. Study Area

China is a vast country that features diverse landforms. The overall terrain is low in the east and high in the west, with a step-like distribution, and it is inclined toward the ocean. The highest altitude in China exceeds 4500 m, while the lowest altitude is below 0 m. Sixteen study areas (Figure 2) at different latitudes and longitudes were selected for this study. These study areas have different topographic conditions (Figure 3), span large ranges of latitude and longitude, and feature very different land cover types, and these are the main factors that can affect the vertical accuracy of a DEM. Within these study areas, the geomorphic types were classified into hills, plains, mountains, basins, or plateaus.

2.2. DEMs in the Study

2.2.1. AW3D30

AW3D30 was produced by the Japan Aerospace Exploration Agency (JAXA) in May 2015. It provides open-source, high-precision global digital surface model data with a horizontal resolution of 30 m (1 arc second) and an elevation accuracy of 5 m. AW3D30 is based on optical stereoscopic photogrammetry. In May 2016, JAXA officially released the first 30 m resolution global product, AW3D30V1.0, which was primarily obtained by resampling the 5 m resolution commercial global digital surface model (DSM) data AW3D product that was jointly released by Nippon Telegraph and Telephone DATA and The Remote Sensing Technology Center of Japan. AW3D was the first global DSM product with 5 m resolution; in some regions, it can even provide DSM data products with higher resolutions, such as 0.5, 1, 2, or 2.5 m. In March 2017, JAXA released a supplementary version, AW3D30V1.1. In April 2018, JAXA released an improved version, AW3D30V2.1, based on the second version of the commercial AW3D product. This product features the corrections of the absolute offset error from the ICESat reference, while the relative stripe error in the satellite orbit is corrected using an updated calibration method. Existing DEM data were used to fill in the cloud and snow pixels, water pixels, and low-correlation pixels in the range of 60°S to 60°N in this product, while the coastline data of Japan were also updated. AW3D30V1.1 only provides products obtained from mean resampling because its mean resampling products do not differ significantly from those of AW3D30V1.1. In April 2019, JAXA released another supplementary version, AW3D30V2.2, in which existing DEM data were used to supplement the data for areas north of 60°N. The process of updating cloud and snow pixels, water and low-quality pixels, and coastlines was also continued in this product (Table 1).

2.2.2. ASTER GDEM

ASTER GDEM is a data product in which global elevation was obtained based on optical stereoscopic photogrammetry. It strictly includes elevation data for forest vegetation, buildings, and other surface objects, and these data are DSM data products. ASTER is an advanced multispectral imager that was launched on the National Aeronautics and Space Administration’s (NASA) Terra spacecraft in 1999. Its sensors cover 14 bands (from visible light to thermal infrared (IR)), with high spatial, spectral, and radiative resolutions. Furthermore, its backward near-IR (NIR) band provides stereoscopic coverage with a spatial resolution of 15 m to collect topographic data. On 28 June 2009, NASA and the Ministry of Economy, Trade, and Industry (METI) released the ASTERDEMv1 data product, using approximately 1.26 million optical stereo pairs. Subsequently, the America–Japan joint verification team evaluated the accuracy of the GDEMv1, finding its overall absolute elevation accuracy (LE95) and horizontal positioning accuracy (CE95) to be approximately 20 and 30 m, respectively [23,24]. However, some problems were identified, such as insufficient coverage in high-latitude areas, cloud pollution, water masks, and some artifacts. Thus, this product can only support some scientific research applications. In October 2011, NASA and METI produced and released ASTERGDEMv2, which added 260,000 optical stereo image pairs to GDEMv1. Compared with GDEMv1, its coverage area, spatial resolution, and water mask processing accuracy are all significantly improved. The America–Japan joint verification team found that GDEMv2 had a LE95 of approximately 17 m and a corresponding root mean squared error (RMSE) of approximately 8.7 m [23]. On 5 August 2019, NASA and METI jointly released ASTERGDEMv3, which added 360,000 optical stereo image pairs to GDEMv2 to reduce elevation blank areas and water numerical anomalies. The GDEMv3 data have a significantly improved effective coverage and elevation accuracy.

2.2.3. SRTM

SRTM is an international collaboration between NASA, the National Imagery and Mapping Agency (NIMA), and the German Aerospace Center (DLR), and it was officially launched on 11 February 2000. The space shuttle, Endeavour, launched by the United States, carried the SRTM system for data acquisition, which took 11 h to complete. SRTM includes the C and X bands. Owing to the narrow width and limited global coverage of the X band, the final product is dominated by C-band data. In 2003, NASA’s Jet Propulsion Laboratory (JPL) released its first version of SRTM, SRTMv1, which comprises raw InSAR data. These data are unedited and have some data quality problems, such as vertical error, water noise, single pixel error, and data voids, and these problems are particularly prevalent over water and in high-altitude areas. In 2006, SRTMv2, the final version, was released by NIMA after significant amounts of editing. It solved some of the problems encountered in SRTMv1 and generally showed good water boundaries and coastlines. However, this version featured cavities in some areas. In November 2013, the Land Processes Distributed Active Archive Center released SRTMv3, or the SRTMPlus product, through NASA’s Making Earth System Data Records for Use in Research Environments program. This product addressed all the limitations of previous versions by fusing together ASTERGDEMv2, United States Geological Survey Global Multi-resolution Terrain Elevation Data 2010, and USGS National Elevation Dataset data. NASA has now opened the SRTMv3 1” resolution global digital elevation product download channel for free.

2.2.4. TanDEM-X

Compared with optical stereo photogrammetry, the InSAR-based elevation inversion method has unique advantages in cloudy, foggy, and rainy environments. Developed in collaboration with the DLR and European Aeronautic Defense and Space (EADS) Astrium, TanDEM-X began a new era regarding the generation of global digital elevation data from SAR interferometry. The TanDEM-X satellite was launched in June 2010: it orbits in formation with TerraSAR-X satellites to construct a dual-station SAR interference mode that eliminates temporal incoherence effects and provides a high-precision global digital elevation product, TanDEM-X. Similar to SRTM products, it provides elevation information for surface features, including forest vegetation and surface buildings, and also creates DSM data products. Compared with previous global elevation data products, TanDEM-X is the first global digital elevation product with uniform accuracy and no gaps, and it was acquired by the WGS84-G1150 ellipsoid as its horizontal reference frame. Subsequently, global TanDEM-X DEM products with 1” and 3” resolution have been acquired by resampling based on the above standard products, with the 3” resolution product being freely available to users worldwide. The TanDEM-X DEM has an absolute positioning accuracy (CE90) and an absolute elevation accuracy (LE90) of 10 m, and its relative elevation accuracy (LE90) for slopes of <20% (relative elevation accuracy is limited to 0.4” resolution products; 1” and 3” resolution products are not calibrated) is 2 m, and 4 m for slopes > 20%. The DLR used approximately 15 million ICESat points worldwide to perform an actual quality assessment of TanDEM-X DEM, achieving a LE90 of approximately 3.5 m. Except for ice, forest-covered areas, and desert, its LE90 reaches 0.88 m [25,26].
Table 1. Overview of global digital elevation models (DEMs) evaluated in this study.
Global DEMRelease TimeHorizontal ResolutionMethodSource
AW3D30v1.0: 20161”Optical stereo
photogrammetry
[27]
v1.1: 2017
v2.1: 2018
v2.2: 2019
ASTER GDEMv1: 20091”Optical stereo
photogrammetry
[28]
v2: 2011
v3: 2019
SRTMv1: 20031”InSAR[29]
v2: 20063”
v3: 201330”
TanDEM-X20163”InSAR[30]
AW3D30: advanced land observing satellite world 3D 30 m; ASTER GDEM: advanced spaceborne thermal emission and reflection radiometer global DEM; SRTM: space radar terrain mission; TanDEM-X: TerraSAR-X for digital elevation measurement; InSAR: interferometric synthetic aperture radar.

2.3. Reference Data

Most current accuracy assessments have used GPS control points [31,32], aerial photographic images, or Earth laser altimetry systems (such as LiDAR) as reference models for comparison with published DEMs [19,33]. Here, GPS control points (Figure 4) were used as reference data. According to the GPS Continuously Operating Reference Stations established by network real-time kinematic technology in China, the plane and elevation accuracies of these control points were both better than 0.1 m [34]. The number of GPS control points used in this study is listed in Table 2.

2.4. Data Processing

2.4.1. Unification of DEM Coordinate Systems

As these four types of DEMs have different reference data, it was necessary to preprocess the data to make the study more accurate, that is, to unify the reference data. AW3D30, ASTER, and STRM all use the EGM96 geoid, whereas TanDEM-X uses WGS84-G1150 as its vertical reference plane. To make these models comparable, here, TanDEM-X’s WGS84 ellipsoid was used as the vertical reference plane. The EGM96 geoid correction model was added to the AW3D30, ASTER, and STRM DEMs to complete this data conversion.

2.4.2. DEM Accuracy Assessment

The elevation values of GPS control points were obtained from each DEM and then compared with those measured by GPS, as shown in Formula (1):
h = HmodelHref,
where Hmodel is the elevation value obtained through the DEM in question, Href is the reference value from GPS, and ∆h is the difference between the elevation value of said DEM and that of the reference model. Here, positive results indicate that the DEM elevation value exceeds the GPS-measured value, while negative values indicate the opposite.

2.4.3. Precision Statistical Indicators

Mean error (ME), RMSE, and standard deviation (STD), which are widely used in data statistics [23], were selected to describe the error characteristics. Based on the literature and the experimental analysis presented here, the median error (MED), median absolute deviation (MAD), LE90, and LE95 were also calculated for each DEM [18,19].
The ME, RMSE, STD, MED, MAD, LE90, and LE95 were calculated as follows:
ME = i = 1 N Δ h N ,
RMSE = i = 1 N Δ h 2 N ,
STD = i = 1 N ( Δ h M E ) 2 N ,
MED = median({∆hi}),
MAD = median({∆hi − MED}),
Since the elevation error of our sample did not obey the elevation distribution, LE90 and LE95 cannot use the formula when the sample obeys the normal distribution: LE90 = 1.6449 × STD, LE95 = 1.9000 × STD; here, the LE90 is equated to the 90th percentile of the sorted absolute differences calculated by the minimum rank method, i.e., the smallest value in the list, and LE95 is the same [19,35].
We conducted Kruskal–Wallis ANOVA for 16 study areas and on the change of vertical accuracy of the same data source with latitude and longitude, and the variable response here is ∆h. This is a nonparametric test that does not require the samples to obey normal distribution and homogeneity of variance. It determines whether the data difference among several groups is significant: when the p-value is less than 0.05, the data difference of such groups is statistically significant; otherwise, the difference is not significant [36,37].

2.5. Experimental Design

The experimental design included: (1) descriptive statistics of the vertical accuracy of each kind of DEM, (2) descriptive statistics of slope aspect impact analysis, (3) descriptive statistics on the impacts of different land cover types, and (4) descriptive statistics for the analysis of the impacts of changes in latitude and longitude.
To analyze the impact of slope and aspect on DEM accuracy, slope and aspect data were derived from TanDEM-X (90 m) for each measuring point. The slopes of the GPS field measurement points in all regions used in this study were <5°, and therefore, the control variable method was used. That is, it was assumed that the slope variable was controlled; therefore, the slope direction, with degrees of 0°–360°, was divided into eight major slope directions (Table 3). When analyzing the impact of the slope aspect on vertical accuracy, values were not divided into the 16 research areas. Instead, regions with the same slope aspect in each research area were integrated into a single category for further analysis. Here, we chose ME as the test index to analyze the impact of different slope aspects on DEM accuracy and whether the elevation value would be overestimated or underestimated.
To analyze the impact of land cover type on DEM accuracy, the 2017 global 10 m resolution land cover (use) type data published by Professor Peng Gong’s group at Tsinghua University were used. This global land cover map represents a combination of the European Space Agency’s (ESA) 10 m resolution sentinel-2 satellite open-source imagery data [38]. As the slope and land cover type may have mutual influences on error analysis, in previous studies, areas with high slopes are excluded when analyzing land cover types to control these variables [19,20,39]. However, the slopes of the measured GPS points here were all <5°; therefore, the analysis of land cover types did not suffer from such interference, that is, the slope variable was controlled. Land cover types were divided into nine main categories according to their classification rules, however since our site selection is mainly focused on cropland and artificial surface, we only listed these two land cover types and their respective numbers of GPS ground control points (Table 4). When analyzing the impact of land cover type on vertical accuracy, we directly integrated identical land cover types from each research area into one group for further analysis, as detailed in Section 2.5. We only investigated the influence of land cover type on the accuracy of AW3D30, SRTM, and TanDEM-X, and this was carried out after elucidating that the slope aspect has a significant impact on ASTER, but not on the other three DEMs, and can be considered as a novel analysis method.
Due to the extensive spatial range of the sampling points used across China in this study, the latitude and longitude spans of these study areas were large. Therefore, to control the variables, we also only investigated the variation in vertical accuracies of AW3D30, SRTM, and TanDEM-X considering the differences in latitude and longitude. To this end, all study areas were classified according to the same latitude and longitude (Table 1); thereafter, changes in RMSE were analyzed.
In order to further expand the analysis of the interesting point of longitude and latitude changes, we also selected more reference points in the 16 study areas at an interval of 0.1° and controlled the variables more strictly. Taking the elevation value of the most accurate TanDEM-X 90 m as the reference value, we analyzed the impact of different latitudes along the same longitude on AW3D30 and SRTM, as well as the impact of different longitudes along the same latitude on these two DEMs.

3. Results

3.1. Descriptive Statistics of Overall Vertical Accuracy

Across all study areas, it can be seen from Table 5 that the four global DEMs generally exhibited positive ME values, among which AW3D30 and SRTM were the most obvious, with high proportions of positive ME values. TanDEM-X had a positive ME ratio that was slightly above negative, whereas ASTER had a negative ME ratio that was slightly above positive. Compared with the reference model, all the global DEMs generally overestimated elevation; however, ASTER tended to underestimate it. TanDEM-X exhibited the highest and most stable vertical accuracy for all study areas, based on ME and RMSE, and its maximum RMSE (3.540 m) was obtained over the Ganzhou study area, while its minimum RMSE (0.889 m) was obtained over the Chengdu study area. AW3D30 and SRTM also performed well, and their maximum RMSE values were 5.051 and 4.894 m, respectively, with both being obtained in the Wuhan study area. Their minimum RMSE values, meanwhile, were 1.0941 m over the Chengdu study area and 1.059 m over the Zhangye study area, respectively. ASTER had the worst performance, though it obtained a similar vertical accuracy to the other DEMS over the Zhanjiang and Chengdu study areas. ASTER’s maximum RMSE was 19.367 m, over the Weinan study area, while its minimum RMSE was 2.710 m, over the Zhanjiang study area. Regarding STD, LE90, LE95, MAD, and MED, TanDEM-X 90 m exhibited good stability, followed by SRTM and AW3D30, whereas ASTER performed worst.

3.2. Aspect and Land Cover

As can be seen from the average error radar plot of the four global DEMs in all study areas according to the slope aspect grade (Figure 5), the radar plots of AW3D30, SRTM, and TanDEM-X are very close to the regular octagon, and all of them fluctuated slightly near the error of 0. The slope aspect had little influence on their vertical accuracy, but it did influence that of ASTER, and this is consistent with the conclusion of the above overall accuracy analysis. The ME value of AW3D30 was the largest at W slope aspect, which was 1.068 m, and the smallest at ES slope aspect, which was −0.014 m. The ME values of other slope aspects fluctuated between 0 and 1 m. In general, these ME values were very small, and there was no significant difference between different slope aspects. Similarly, the ME values of SRTM and TanDEM-X in different slope aspects basically fluctuated between 0 and 1 m. The difference is that SRTM and TanDEM-X both showed opposite ME values on E, SE, and S slopes compared to N, NW, and W slopes. The ME values of SRTM were 0.816, 0.791, and 0.780 m in the N, NW, and W slope aspects, and 0.054, −0.054, and 0.257 m in the E, SE, and S slope aspects. The ME values of TanDEM-X were 0.773, 1.296, and 0.976 m in the N, NW, and W slope aspects, and −0.034, −0.060, and −0.459 m in the E, SE, and E slope aspects. Moreover, both exhibited the highest vertical accuracy on E slopes. Different from the first three DEMs, the ME value of ASTER fluctuated greatly in different slope aspects, with the maximum value of −3.172 m in the SE slope aspect and the minimum value of 0.2350 m in the N aspect, and underestimated the elevation value in other slope aspects, except N and NW.
The chosen study areas were located over cultivated land, buildings, and artificial surfaces, so only grades 1 and 6 of the land cover types were analyzed here. Levels 1 and 6 each had little influence on the vertical accuracy of each DEM. It can be seen from Figure 6 that the RMSE values of AW3D30, SRTM, and TanDEM-X were very similar at levels 1 and 6. The RMSE value of AW3D30 was 2.344 and 2.339 m at levels 1 and 6, respectively, that of SRTM was 2.761 and 2.755 m, respectively, and that of TanDEM-X was 2.039 and 2.031 m, respectively. The difference of RMSE values of the three DEMs was also small.

3.3. Effects of Variations in Latitude and Longitude on Vertical Accuracy When Using the Same Data Source

In Section 3.2, we found that different slope aspects have a certain impact on the elevation accuracy of ASTER through the radar plots. For conducting a rigorous analysis, we controlled the variable and did not analyze the impact of longitude and latitude change on vertical accuracy when using the ASTER model. Regarding the influence of latitude variations on vertical accuracy (when using the same data source), the RMSE values of AW3D30, SRTM, and TanDEM-X all changed with latitude. The maximum RMSE value of AW3D30 was 3.561 m at 30°N latitude, and the minimum value was 1.420 m at 39°N latitude. The maximum RMSE value of SRTM was 3.973 m at 25°N, and the minimum value was 1.059 m at 38°N. The maximum RMSE value of TanDEM-X was 2.843 m at 19°N, and the minimum value was 1.520 m at 34°N. Overall, the vertical accuracy at high latitudes was slightly higher than that at low latitudes (Figure 7).
The RMSE values of AW3D30, SRTM, and TanDEM-X also changed with longitude, but no evident trend was observed. The maximum RMSE values of AW3D30, SRTM, and TanDEM-X were 4.194, 4.432, and 3.376 m, respectively, and were all observed at 114°E. Their vertical accuracies fluctuated within a small range across other locations (Figure 8).
We conducted Kruskal–Wallis tests for the 16 study areas and on the group of 11 latitudes and longitudes. It can be seen from the p-value (Table 6) that there are significant differences in the 16 study areas’ vertical accuracy and also in the effects of different latitudes and longitudes on the vertical accuracy of the three DEMs.
In the expansion experiment, we used the scatter points composed of ΔH (the elevation values of AW3D30 and SRTM minus the elevation value of TanDEM-X, i.e., elevation error) to draw Figure 9. It can be seen that when analyzing the latitude change along the same longitude, the error values in higher latitudes are more concentrated at 0, while the elevation errors in lower latitudes are larger and more dispersed.

4. Discussion

4.1. Summary of Overall Accuracy

The spaceborne mission TanDEM-X successfully acquired and processed an X-band global DEM from interferometric bistatic SAR data. Released in 2016, TanDEM-X 90 m features unprecedented vertical accuracy, which is under 2 m over flat areas at a 90% confidence level [40], as reflected in this study. TanDEM-X 90 m had the coarsest spatial resolution of the four DEMs in this study and provided the finest and most stable vertical accuracy across all study areas in China. AW3D30 and SRTM also exhibited good vertical accuracy. AW3D30 has demonstrated high accuracy and stable performance in many research tests, making it the best choice for analyzing multiple geographic areas [20,41]. Here, ASTER exhibited the worst performance across most areas, though its vertical accuracy was similar to those of the other three DEMs in some study areas. Moreover, its RMSE value ranged between 5.473 and 19.367 m and exhibited a large difference between its maximum positive (9.571 m) and minimum negative (−16.840 m) ME values, while the other indicators of ASTER were all significantly higher in some study areas than those of the other DEMs. ASTER tended to underestimate elevation values, for in terms of the spatial distribution of ME, bare land, artificial surfaces, arable land, and sparse vegetation areas were prone to negative errors, while forest areas were prone to positive errors. TanDEM-X and SRTM are InSAR products, whereas ASTER GDEM is an optical stereo photogrammetry product. The poor overall performance of ASTER can be due to its optical image capture and processing technology. This quality was related to the type and resolution of the original satellite data, that is, NIR images with a resolution of 15 m. These NIR images record the thermal radiation of objects on the Earth’s surface. They are represented by false colors, which can lead to manual distortion during the automatic processing of stereo pairs [42]. The ASTER GDEM also includes artifacts that may be caused by cloud cover, mismatches between different scenes, and processing techniques, which are its main disadvantages [20].

4.2. Aspect and Land Cover

Slope has been found to have the greatest influence on DEM quality. In this study, slope variables were controlled to allow the effect of the slope aspect on the vertical accuracy of each DEM to be determined. The slope aspect was found to have small impacts on AW3D30, SRTM, and TanDEM-X, whereas it had a relatively large impact on ASTER. SRTM and TanDEM-X exhibited negative errors on E, SE, and S slopes, as opposed to on N, NW, and W slopes. This is related to the technology used by each model (InSAR) and possibly to the orbit of Endeavor. When scanned by SAR, this track is perpendicular to the NE–SW line and is connected to two specific elevation difference elements (front and back slopes). This indicates that the elevation difference is related to the orientation of the ramp, and there are varying degrees of elevation difference, depending on the trajectory of this shuttle over an area.
As different land cover types change and are updated at different speeds, error analysis results cannot fully reflect the data characteristics of rapidly changing land cover types. The acquisition times of the reference and DEM data are also important regarding the analysis results. Artificial surfaces and cultivated land are fast-changing land use types. TanDEM-X data were released in 2016, and the land cover type data used in this study were released in 2017 [38]. These two datasets have the shortest time difference, so the TanDEM-X data will have smaller land cover type errors than those of the other two DEMs. Additionally, no significant differences were observed in the error generation of DEMs regarding their vertical accuracies over artificial surfaces and cultivated land.

4.3. Effects of Variations in Latitude and Longitude on the Vertical Accuracy of the Same Data Source

We observed that the change of latitude or longitude has a statistically significant impact on the vertical accuracy of DEMs (Figure 8 and Kruskal–Wallis test). In general, the vertical accuracy in high latitudes was slightly higher than that in low latitudes. As SRTM and TanDEM-X are InSAR products, a satellite’s orbit has a certain influence on the accuracy of InSAR-based DEMs, primarily regarding orbit accuracy and baseline estimation [43]. This can also explain why such variations were observed.
No obvious relationships between vertical accuracy and longitude were observed for any of the three DEMs. AW3D30, SRTM, and TanDEM-X all exhibited the worst vertical accuracy at 114°E (Wuhan, Ganzhou). Analysis of the overall longitude in this study reveals that this was not closely related to longitude variations, however.

4.4. Limitations of the Study

One of the limitations of this study is that the selected land cover types were relatively consistent, and there were few variables. Although a large range of GPS field measurements were conducted in China, most of the study areas were cultivated land, bare land, buildings, or artificial surfaces. Furthermore, the global DEMs analyzed were actually DSMs. A DEM describes a terrain’s surface, whereas a DSM either represents a terrain’s surface or the top part of the surface’s topography, including vegetation canopies, buildings, and other objects on the terrain’s surface. This study failed to analyze the elevation accuracy of more land cover types, including forests and vegetation, due to the selection of control points. Another issue is that the locations used here to study variations in latitude and longitude were irregularly spaced across China, so it was not possible to control these variables (e.g., by studying points with varying latitude but the same longitude). This aspect could be further improved upon in future research. Finally, attention should be paid to the analysis of the combined effects of slope and aspect in future studies.

5. Conclusions

This study clearly revealed that the vertical accuracies of global DEMs largely depend on the particularity of each region. Over China, differences in slope aspect and land cover type can lead to varying differences in vertical accuracy for DEMs. However, overall, the slope aspect did not systematically or regularly affect the vertical accuracies of DEMs, and therefore, it needs to be analyzed in specific areas. In terms of land cover types, DEMs were less affected or underestimated elevation values over bare land, cultivated land, and sparsely vegetated areas. Among the four open-source global digital elevation products analyzed here, TanDEM-X exhibited the highest vertical accuracy, despite having the lowest resolution. AW3D30 and SRTM also performed well, while ASTER had the lowest vertical accuracy. In China, TanDEM-X is thus preferable to ASTER GDEM for studies and experiments that require a high vertical accuracy. This study analyzed for the first time the vertical accuracy of four open-source global DEMs in several regions of China, which may help future research based on open-source DEMs in China, and it also provides a reference for evaluating other types of DEMs.

Author Contributions

X.L. wrote the paper and conducted the experiments; M.R. and H.X. guided the experiments and defined the structure of the paper; M.D. checked the paper and provided suggestions. All authors have read and agreed to the published version of the manuscript.

Funding

This work was supported by the National Key Research and Development Program of China (2020YFA0713503), the Nature Science Foundation of Hunan Province Grant (2020JJ5537), and the Research Foundation of Education Department of Hunan Province Grant (19C1769).

Institutional Review Board Statement

Not applicable.

Informed Consent Statement

Not applicable.

Data Availability Statement

The datasets presented in this study are available public darasets.

Conflicts of Interest

The authors declare no conflict of interest.

References

  1. Courty, L.G.; Soriano-Monzalvo, J.C.; Pedrozo-Acuña, A. Evaluation of open-access global digital elevation models (AW3D30, SRTM, and ASTER) for flood modelling purposes. J. Flood Risk Manag. 2019, 12, e12550. [Google Scholar] [CrossRef] [Green Version]
  2. Hawker, L.; Bates, P.; Neal, J.; Rougier, J. Perspectives on digital elevation model (DEM) simulation for flood modeling in the absence of a high-accuracy open access global DEM. Front. Earth Sci. 2018, 6, 233. [Google Scholar] [CrossRef] [Green Version]
  3. Gdulová, K.; Marešová, J.; Barták, V.; Szostak, M.; Červenka, J.; Moudrý, V. Use of TanDEM-X and SRTM-C data for detection of deforestation caused by bark beetle in Central European Mountains. Remote Sens. 2021, 13, 3042. [Google Scholar] [CrossRef]
  4. Hui, W.; Yuqi, C.; Bo, Z.; Shifeng, X. Investigation of the effect of cementing ratio on the mechanical properties and strain location of hydrate-bearing sediments by using DEM. J. Nat. Gas Sci. Eng. 2021, 94, 104123. [Google Scholar] [CrossRef]
  5. Scown, M.W.; Thoms, M.C.; De Jager, N.R. Floodplain complexity and surface metrics: Influences of scale and geomorphology. Geomorphology 2015, 245, 102–116. [Google Scholar] [CrossRef]
  6. Kübra, B.; Ümmühan, B.F. A comprehensive study on modeling of photovoltaic arrays and calculation of photovoltaic potential using digital elevation model. Energy Sources A 2021, 43, 2609–2633. [Google Scholar]
  7. Natsagdorj, B.; Dalantai, S.; Sumiya, E.; Bao, Y.; Bayarsaikhan, S.; Batsaikhan, B.; Ganbat, D. Assessment of some meteorology data of average monthly air temperature over Mongolia using digital elevation model (DEM) and GIS techniques. Int. Arch. Photogramm. Remote Sens. Spatial Inf. Sci. 2021, 43, 117–121. [Google Scholar] [CrossRef]
  8. Lakshmi, S.E.; Yarrakula, K. Review and critical analysis on digital elevation models. Geofizika 2019, 35, 129–157. [Google Scholar] [CrossRef]
  9. Satgé, F.; Bonnet, M.P.; Timouk, F.; Calmant, S.; Pillco, R.; Molina, J.; Lavado-Casimiro, W.; Arsen, A.; Crétaux, J.F.; Garnier, J. Accuracy Assessment of SRTM v4 and ASTER GDEM v2 over the Altiplano watershed using ICESat/GLAS data. Int. J. Remote Sens. 2015, 36, 465–488. [Google Scholar] [CrossRef]
  10. Mesa-Mingorance, J.L.; Mesa-Mingorance, F.J.; Ariza-López, F.J. Accuracy assessment of digital elevation models (DEMs): A critical review of practices of the past three decades. Remote Sens. 2020, 12, 2630. [Google Scholar] [CrossRef]
  11. Smith, B.; Sandwell, D. Accuracy and resolution of shuttle radar topography mission data. Geophys. Res. Lett. 2003, 30, 3–6. [Google Scholar] [CrossRef] [Green Version]
  12. Eineder, M. Problems and solutions for InSAR digital elevation model generation of mountainous terrain. Aerospace 2000, 2003, 1–5. [Google Scholar]
  13. Mukherjee, A.; Rai, R.; Singla, P.; Singh, T.; Patra, A.K. Effect of dem uncertainty on geophysical mass flow via identification of strongly coupled subsystem. Int. J. Uncertain. Quantif. 2019, 6, 589–605. [Google Scholar] [CrossRef]
  14. Wechsler, S.P. Uncertainties associated with digital elevation models for hydrologic applications: A review. Hydrol. Earth Syst. Sci. 2007, 11, 1481–1500. [Google Scholar] [CrossRef] [Green Version]
  15. Li, C.; Wang, Q.; Shi, W.; Zhao, S. Uncertainty modelling and analysis of volume calculations based on a regular grid digital elevation model (DEM). Comput. Geosci. 2018, 114, 117–129. [Google Scholar] [CrossRef]
  16. Jarihani, A.A.; Callow, J.N.; McVicar, T.R.; Van Niel, T.G.; Larsen, J.R. Satellite-derived digital elevation model (DEM) selection, preparation and correction for hydrodynamic modelling in large, low-gradient and data-sparse catchments. J. Hydrol. 2015, 524, 489–506. [Google Scholar] [CrossRef]
  17. Guan, L.; Pan, H.; Zou, S.; Hu, J.; Zhu, X.; Zhou, P. The impact of horizontal errors on the accuracy of freely available Digital Elevation Models (DEMs). Int. J. Remote Sens. 2020, 41, 7383–7399. [Google Scholar] [CrossRef]
  18. Grohmann, C.H. Evaluation of TanDEM-X DEMs on selected Brazilian sites: Comparison with SRTM, ASTER GDEM and ALOS AW3D30. Remote Sens. Environ. 2018, 212, 121–133. [Google Scholar] [CrossRef] [Green Version]
  19. Han, H.; Zeng, Q.; Jiao, J. Quality assessment of TanDEM-X DEMs, SRTM and ASTER GDEM on selected Chinese sites. Remote Sens. 2021, 13, 1304. [Google Scholar] [CrossRef]
  20. Uuemaa, E.; Ahi, S.; Montibeller, B.; Muru, M.; Kmoch, A. Vertical accuracy of freely available global digital elevation models (Aster, AW3D30, MERIT, TanDEM-X, SRTM, and NASADEM). Remote Sens. 2020, 12, 3482. [Google Scholar] [CrossRef]
  21. Zhao, S.; Zhao, H.; Li, R.; Cheng, W.; Zhou, C. A quantitative model to simulate the vertical errors of SRTM3 DEM V4 data at the pixel level in the Shanbei Plateau of China. Int. J. Remote Sens. 2020, 41, 5257–5276. [Google Scholar] [CrossRef]
  22. Hui, L.; Jiayang, Z. Evaluation of the newly released worldwide AW3D30 DEM over typical landforms of China using two global DEMs and ICESat/GLAS data. IEEE J. Sel. Top. Appl. Earth Obs. Remote Sens. 2018, 11, 4430–4440. [Google Scholar]
  23. Chirico, P.G.; Malpeli, K.C.; Trimble, S.M. Accuracy Evaluation of an ASTER-Derived Global Digital Elevation Model (GDEM) Version 1 and Version 2 for Two Sites in Western Africa. GIScience Remote Sens. 2013, 49, 775–801. [Google Scholar] [CrossRef]
  24. Hirt, C.; Filmer, M.S.; Featherstone, W.E. Comparison and validation of the recent freely available ASTER-GDEM ver1, SRTM Ver4.1 and GEODATA DEM-9s Ver3 digital elevation models over Australia. Aust. J. Earth Sci. 2010, 57, 337–347. [Google Scholar] [CrossRef] [Green Version]
  25. Rizzoli, P.; Martone, M.; Gonzalez, C.; Wecklich, C.; Tridon, D.B.; Bräuti-gam, B.; Bachmann, M.; Schulze, D.; Fritz, T.; Huber, M.; et al. Generation and performance assessment of the global TanDEM-X digital elevation model. ISPRS J. Photogramm. Remote Sens. 2017, 132, 119–139. [Google Scholar] [CrossRef] [Green Version]
  26. Wecklich, C.; Gonzalez, C.; Rizzoli, P. TanDEM-X height performance and data coverage. In Proceedings of the IEEE International Geoscience and Remote Sensing Symposium, Fort Worth, TX, USA, 1 July 2017; pp. 4088–4091. [Google Scholar] [CrossRef] [Green Version]
  27. Available online: http://www.eorc.jaxa.jp/ALOS/en/aw3d30/data/index.htm (accessed on 23 September 2021).
  28. Available online: http://gdex.cr.usgs.gov/gdex/ (accessed on 23 September 2021).
  29. Available online: https://download.geoservice.dlr.de/TDM90 (accessed on 23 September 2021).
  30. Available online: https://wist.echo.nasa.gov/~wist/api/imswelcome/ (accessed on 23 September 2021).
  31. Athmania, D.; Achour, H. External validation of the ASTER GDEM2, GMTED2010 and CGIAR-CSI- SRTM v4.1 free access digital elevation models (DEMs) in Tunisia and Algeria. Remote Sens. 2014, 6, 4600–4620. [Google Scholar] [CrossRef] [Green Version]
  32. del Rosario González-Moradas, M.; Viveen, W. Evaluation of ASTER GDEM2, SRTMv3.0, ALOS AW3D30 and TanDEM-X DEMs for the Peruvian Andes against highly accurate GNSS ground control points and geomorphological-hydrological metrics. Remote Sens. Environ. 2020, 237, 111509. [Google Scholar] [CrossRef]
  33. Zhang, K.; Gann, D.; Ross, M.; Biswas, H.; Li, Y.; Rhome, J. Comparison of TanDEM-X DEM with LiDAR data for accuracy assessment in a coastal urban area. Remote Sens. 2019, 11, 876. [Google Scholar] [CrossRef] [Green Version]
  34. Hu, G.; Riddell, A.; Dawson, J. Results of the National GNSS CORS Campaign, September 2014. Record 2015/08. Geoscience Australia, Canberra. 2015. Available online: https://d28rz98at9flks.cloudfront.net/83164/Rec2015_008.pdf (accessed on 15 August 2018).
  35. Wessel, B.; Huber, M.; Wohlfart, C.; Marschalk, U.; Kosmann, D.; Roth, A. Accuracy assessment of the global TanDEM-X Digital Elevation Model with GPS data—ScienceDirect. ISPRS J. Photogramm. Remote Sens. 2018, 139, 171–182. [Google Scholar] [CrossRef]
  36. Ostertagova, E.; Ostertag, O.; Kováč, J. Methodology and Application of the Kruskal-Wallis Test. Appl. Mech. Mater. 2014, 611, 115–120. [Google Scholar] [CrossRef]
  37. Liu, Y.; Chen, W. A SAS macro for testing differences among three or more independent groups using Kruskal-Wallis and Nemenyi tests. J. Huazhong Univ. Sci. Technol. 2012, 32, 130–134. [Google Scholar] [CrossRef] [PubMed]
  38. Finer Resolution Observation and Monitoring-Global Land Cover. Available online: http://data.ess.tsinghua.edu.cn/fromglc2017v1.html (accessed on 5 October 2021).
  39. Alba Fernández, M.V.; Ariza López, F.J.; Jiménez Gamero, M.D. A new approach to the quality control of slope and aspect classes derived from digital elevation models. Remote Sens. 2021, 13, 2069. [Google Scholar] [CrossRef]
  40. Carolina, G.; Markus, B.; José Luis, B.B.; Rizzoli, P.; Manfred, Z. A Fully automatic algorithm for editing the TanDEM-X global DEM. Remote Sens. 2020, 12, 3961. [Google Scholar] [CrossRef]
  41. Carrera-Hernández, J.J. Not all DEMs are equal: An evaluation of six globally available 30 m resolution DEMs with geodetic benchmarks and LiDAR in Mexico. Remote Sens. Environ. 2021, 261, 112474. [Google Scholar] [CrossRef]
  42. Florinsky, I.V.; Skrypitsyna, T.N.; Luschikova, O.S. Comparative accuracy of the AW3D30 DSM, ASTER GDEM, and SRTM1 DEM: A case study on the Zaoksky testing ground, Central European Russia. Remote Sens. Lett. 2018, 9, 706–714. [Google Scholar] [CrossRef]
  43. Wang, X.; Liu, L.; Shi, X.; Huang, X.; Geng, W. A High precision DEM extraction method based on InSAR data. ISPRS Ann. Photogramm. Remote Sens. Spat. Inf. Sci. 2018, 4, 211–216. [Google Scholar] [CrossRef] [Green Version]
Figure 1. Schematic of the four digital elevation models (DEMs) and an optical satellite image of the Pudong study area (31°N, 121°E) obtained by Google Earth: (a) optical satellite image, (b) SRTM, (c) TanDEM-X, (d) AW3D30, and (e) ASTER.
Remotesensing 14 02000 g001
Figure 2. Distribution of the sixteen test fields.
Remotesensing 14 02000 g002
Figure 3. Images showing topographies of the sixteen study areas in China (generated by AW3D30DEM): (a) Fangshan, (b) Yantai 1, (c) Yantai 2, (d) Zhengzhou, (e) Hefei, (f) Chengdu, (g) Wenchang, (h) Wuhan, (i) Nanjing, (j) Ganzhou, (k) Zhanjiang, (l) Weinan, (m) Ningbo, (n) Beichen, (o) Zhangye, and (p) Pudong.
Remotesensing 14 02000 g003aRemotesensing 14 02000 g003b
Figure 4. Field photos of surveying GPS control points.
Remotesensing 14 02000 g004
Figure 5. Radar plots of ME for four DEMs classified by slope aspect across all study areas: AW3D30, SRTM, TanDEM-X, and ASTER.
Remotesensing 14 02000 g005
Figure 6. Histograms of RMSE for three DEMs classified by land cover type across all study areas: AW3D30, SRTM, and TanDEM-X.
Remotesensing 14 02000 g006
Figure 7. RMSE values of the three DEMs with respect to latitude: (a) AW3D30, (b) SRTM, and (c) TanDEM-X.
Remotesensing 14 02000 g007
Figure 8. RMSE values of the three DEMs with respect to longitude: (a) AW3D30, (b) SRTM, and (c) TanDEM-X.
Remotesensing 14 02000 g008
Figure 9.H (elevation error) of AW3D30 and SRTM with respect to latitude and longitude: (a) was drawn with reference points along 121.5°E in Ningbo (29°N), Pudong (31°N), and Yantai (37°N), (b) was drawn with reference points along 113°E in Ganzhou (25°N), Wuhan (30°N), Zhengzhou (34°N), and Fangshan (39°N), (c) was drawn with reference points along 31°N in Chengdu (103°E), Wuhan (114°E), Hefei (117°E), Nanjing (118°E), and Pudong (121°E), (d) was drawn with reference points along 39°N in Zhangye (100°E), Fangshan (116°E), and Beichen (117°E).
Remotesensing 14 02000 g009
Table 2. Classification of longitude and latitude.
GroupLatitudeAreaNumber of PointsGroupLongitudeAreaNumber of Points
119°NWenchang181100°EZhangye16
221°NZhanjiang212103°EChengdu19
325°NGanzhou193109°EWeinan17
429°NNingbo194110°EZhanjiang21
Wenchang18
530°NWuhan175 113°EZhengzhou20
Chengdu19
631°NPudong406114°EWuhan17
Nanjing16Ganzhou19
732°NHefei197116°EFangshan18
834°NZhengzhou208117°EBeichen31
Weinan17Hefei19
937°NYantai1179118°ENanjing16
Yantai218
1038°NZhangye1610120°EYantai117
1139°NFangshan1811121°EYantai218
Beichen30Pudong40
Table 3. Classification of slope aspect in this study.
Azimuth (°)337.5–22.522.5–67.567.5–112.5112.5–157.5157.5–202.5202.5–247.5247.5–292.5292.5–337.5
AspectNNEESESSWWNW
Table 4. Classification of land cover types in this study.
Land Cover TypeCroplandArtificial Surface
Land cover class16
Number of points155171
Table 5. Error measurements of the four global DEMs across the 16 study areas. Error terms include: mean error, ME; root mean square error, RMSE; standard deviation, STD; confidence levels at 90% and 95%, LE90 and LE95; median error, MED; median absolute deviation, MAD. The above units are in meters.
Study AreaGlobal DEMMERMSESTDLE90LE95MEDMAD
FangshanAW3D302.0282.3061.1301.3881.4002.1130.619
ASTER−4.3056.2494.6613.89110.2136.0591.680
SRTM1.0643.1363.0361.9993.0272.3330.954
TanDEM-X0.5241.6631.6241.2001.2721.1310.420
BeichenAW3D300.0851.6211.6451.4783.1440.8300.575
ASTER4.7895.4732.6932.5656.8564.9291.740
SRTM0.9521.7741.5211.9672.4911.2010.527
TanDEM-X0.0421.2571.2771.1861.7210.8170.397
WeinanAW3D30−2.0932.7491.8381.0882.5092.6161.022
ASTER−16.84019.3669.8599.88210.28816.6825.705
SRTM−3.4593.8471.7331.6451.6884.0910.625
TanDEM-X−0.4501.5161.4930.6922.9430.7580.302
ZhangyeAW3D30−0.5631.6761.6310.5880.8301.1870.834
ASTER−6.7189.1556.4231.6368.4958.9392.613
SRTM−0.0401.0591.0931.4081.4950.6210.509
TanDEM-X−1.8291.9940.8200.5151.4942.0400.306
Yantai1AW3D30−1.5542.1341.5081.5211.6491.2631.010
ASTER−6.2457.4184.5093.5958.7186.5862.886
SRTM−1.1071.7861.4452.0102.2691.5140.592
TanDEM-X0.3331.9792.0110.9364.5980.6560.499
Yantai2AW3D300.2441.7881.8231.7251.9801.0550.552
ASTER−6.2649.5647.43610.11610.1688.0404.162
SRTM0.2982.7112.7732.3873.0812.1421.185
TanDEM-X0.9242.4602.3461.6874.4301.0720.442
PudongAW3D301.1271.9931.6651.7663.0231.6110.607
ASTER5.6846.2962.6892.8683.3935.8321.260
SRTM1.5322.9082.5042.4124.4522.0810.844
TanDEM-X1.1231.7141.3111.2641.7681.0650.662
NanjingAW3D301.1682.0151.6961.2231.6131.5510.642
ASTER4.6295.4933.0553.9524.5023.8172.490
SRTM−0.9692.7102.6142.7522.9741.7730.935
TanDEM-X−0.1630.9352.1371.6202.6080.8250.622
ZhengzhouAW3D300.9391.3340.9731.2251.2281.1020.310
ASTER−8.5079.4844.3004.4386.1408.5982.506
SRTM0.4231.6541.6401.4522.4370.9110.864
TanDEM-X−0.7281.5231.3720.8621.0590.7520.427
HefeiAW3D300.7601.4411.2581.0101.8930.8910.635
ASTER−6.1567.3284.0865.0025.4926.2742.393
SRTM−0.0311.1251.1561.0111.1190.8500.181
TanDEM-X−0.8211.7121.5441.4132.7981.2800.798
WuhanAW3D303.5405.0513.7235.3475.3831.5451.390
ASTER3.0207.0586.5766.93510.0602.7191.559
SRTM3.5114.8943.5142.4414.2483.9931.866
TanDEM-X2.0603.1822.4993.0703.7292.2720.942
GanzhouAW3D301.1173.2403.1252.6763.8472.2401.185
ASTER−9.31910.7125.4265.0387.0029.0352.206
SRTM0.3993.9734.0614.4314.7832.5381.650
TanDEM-X0.5753.5403.5894.2474.5551.1721.047
ChengduAW3D300.6581.0940.8981.0781.1710.6590.520
ASTER−0.0133.1993.2873.2743.5091.8581.244
SRTM−1.4062.2961.8651.6751.9570.7590.489
TanDEM-X−0.1180.8890.9051.0001.2710.4580.337
ZhanjiangAW3D30−2.3012.6561.3600.7862.2982.2490.526
ASTER1.4932.7102.3182.4253.1571.7371.172
SRTM−0.0602.4552.5151.5425.6961.3330.830
TanDEM-X−0.7401.4341.2581.3401.5011.0140.758
WenchangAW3D30−0.5822.2092.1932.5703.8011.4610.816
ASTER9.57112.6278.4755.51812.4576.7253.240
SRTM0.1533.6963.7994.6546.4612.9051.742
TanDEM-X1.3622.8432.5683.9364.5090.6900.475
NingboAW3D301.2922.8412.6001.6682.7051.6531.068
ASTER7.8078.7994.1695.2265.2927.9282.157
SRTM1.0692.4852.3052.5562.9851.8961.079
TanDEM-X0.5632.2072.1922.5793.0550.7900.454
Table 6. Kruskal–Wallis test on latitudes and longitudes.
Significance Level (p-Value)AW3D30SRTMTanDEM-X
Latitude<0.000990.004<0.00099
Longitude<0.00099<0.00099<0.00099
16 study areas<0.00099<0.00099<0.00099
Publisher’s Note: MDPI stays neutral with regard to jurisdictional claims in published maps and institutional affiliations.

