1. Introduction
Indoor localization of people, objects, and autonomous devices is a key enabling technology for many smart environment scenarios. Large spaces such as residential complexes, malls, offices, airports, and administrative buildings can be difficult to navigate. Unfortunately, satellite-based radio navigation systems often cannot be used inside buildings because of signal attenuation and multipath propagation [
1]. In recent decades, there has been increasing interest in indoor localization techniques [
2,
3,
4,
5,
6]. The problem of accurate indoor positioning has been the subject of many articles, focusing on different aspects of indoor localization systems and technologies [
7]. Some authors have focused on the data sources used for localization in buildings [
7]. Others have attempted to find new ways of processing and using building floor plans to locate people and objects indoors [
8,
9]. There have also been attempts to minimize location errors [
8].
Indoor positioning typically requires many sources of data [
6,
7,
9,
10,
11,
12]. To gather the data, various sensors and methods have been explored [
5,
13]. There are two main data types used by researchers and commercial companies for indoor localization [
1,
5,
10,
14,
15]. The first approach is to gather data from devices worn by the user or from the autonomous mobile devices being localized [
7]. It is common in the case of human users to use smartphones equipped with a set of sensors including a magnetometer, accelerometer, gyroscope, and barometer, which can provide valuable data about the environment and the user’s movements around buildings [
16]. Smartphone devices can also be used in vision-based methods [
17,
18,
19]. The camera is used to record images that allow the user to be located in the indoor environments. The problem with solutions based on smartphone data is that personally owned devices vary in terms of the number and quality of their sensors and antennas [
8].
The second approach is to collect information from external sources located in buildings, such as Wi-Fi access points [
6,
13,
14], Bluetooth transmitters [
5], RFID tags [
20,
21], UWB technology [
22], or laser sensors [
23]. The use of external signal sources enables the provision of location services to most users with smartphones. Wi-Fi and Bluetooth transmitters can be easily adapted for localization purposes and placed in an indoor environment. Various factors can influence the positioning accuracy of such systems. For example, Pelant et al. discussed the influence of the number of BLE beacons on the performance of indoor fingerprint localization based on received signal strength indication (RSSI) [
24]. Other researchers have proposed using machine learning methods to improve the accuracy of RSSI fingerprint-based localization systems in indoor environments [
25].
Preparation of the reference RSSI distribution for each of the external sources available in a building requires creating a database of information at points covering the entire area. This database serves as a source of information for localization algorithms using the fingerprinting method. To develop such a dataset, many authors divide the localized area into a grid of points, called reference points, where time-consuming and labor-intensive RSSI readings are taken [
6]. Such measurements usually take several days, depending on the size and complexity of the rooms.
Different approaches to reducing the complexity of the map construction process and improving the performance of RSSI fingerprint-based methods have been explored in the literature. In [
26], path loss model interpolation was used with sparse crowdsourced fingerprints. In [
27], an automated method of reference map calibration was proposed using a mobile robot. In [
28,
29], crowdsourcing approaches were used for full radio map construction and calibration.
In our previous works, we discussed the influence of factors affecting the quality of computer-generated reference maps on the performance of RSSI-fingerprint-based positioning systems. In [
30], we discussed the suitability of the multiwall radio wave propagation model for the preparation of RSSI reference data from BLE beacons. These initial results showed that it is possible in some cases to use less complex propagation models to prepare reference data, reducing the time required while maintaining sufficient localization accuracy. In [
31], we discussed the impact of user mobility on positioning accuracy at different resolutions of received power distribution reference maps. In [
32] we studied how the resolution of the received power distribution reference maps affects positioning accuracy. We showed that careful selection of map resolution can reduce computation time significantly while maintaining the accuracy of the positioning system.
Extending our previous research, this article presents a method of preparing reference RSSI distributions using computer simulations. The simulations were conducted using the ray tracing propagation model and the computationally less demanding multiwall model. The simulated RSSI distributions were tested using a location algorithm. Their performance was compared with that of measured RSSI maps. The results show that it is possible to replace the complex creation of reference maps with simulations using the ray tracing model or the multiwall model, both of which provide sufficiently accurate measurements (from the point of view of the user) of 1–2.5 m.
The main contributions of this study can be summarized as follows:
Two popular propagation models, multiwall and ray tracing, were used to create simulated RSSI datasets from floor plans representing three very different indoor environments: a sports hall, an office building, and a long corridor. RSSI measurements were also made using a smartphone. Differences between the simulated and measured RSSI maps are presented and discussed.
Simulated and measured positioning datasets were prepared for all three environments. The datasets were used to experimentally verify the suitability of the simulated maps for a fingerprint-based localization algorithm combined with a particle filter.
We show that it is possible to use simulated RSSI maps instead of measured RSSI maps for positioning systems in large buildings. The preparation of simulated maps is significantly less costly and time-consuming than taking labor-intensive RSSI measurements.
The concept for a localization system that uses reference RSSI maps as a source of information is explained in
Section 2.1.
Section 2.2 presents a localization system developed by the authors, which was used in the study. The system uses the fingerprinting method followed by a particle filter to determine the location of terminals in a building. The localization algorithm is described in detail.
Section 2.3 describes the preparation of reference RSSI in an experimental measurement campaign.
Section 2.4 discusses the propagation models used to replace labor-intensive RSSI measurements with computer simulations. Two propagation models were used: ray tracing and multiwall.
Section 2.5 explains how the values of the simulated reference RSSI distributions were matched to the actual measurements recorded by the mobile terminal.
Section 2.6 presents the three indoor environments that were used as test scenarios. The RSSI distribution maps obtained from measurements and multiwall and ray tracing simulations are compared in
Section 2.7.
Section 3 discusses the verification scenario that was used to evaluate the accuracy of indoor localization based on the measured RSSI maps and the distributions obtained in computer simulations. We also compare the localization error and the time needed to prepare maps using measurements and simulations. Conclusions are presented in
Section 4.
2. Materials and Methods
2.1. Concept of the Proposed Localization System
An experimental positioning system developed by the authors was used in the study. The system architecture consists of a Bluetooth Low Energy (BLE) transmitter network and user terminals equipped with a dedicated mobile application implementing algorithms for determining the position of the user.
Because of the great popularity of mobile devices based on the Android system, Android phones were as a platform to run the application and provide visualization of the searched objects. The program requires a terminal equipped with a BLE receiver and Internet access.
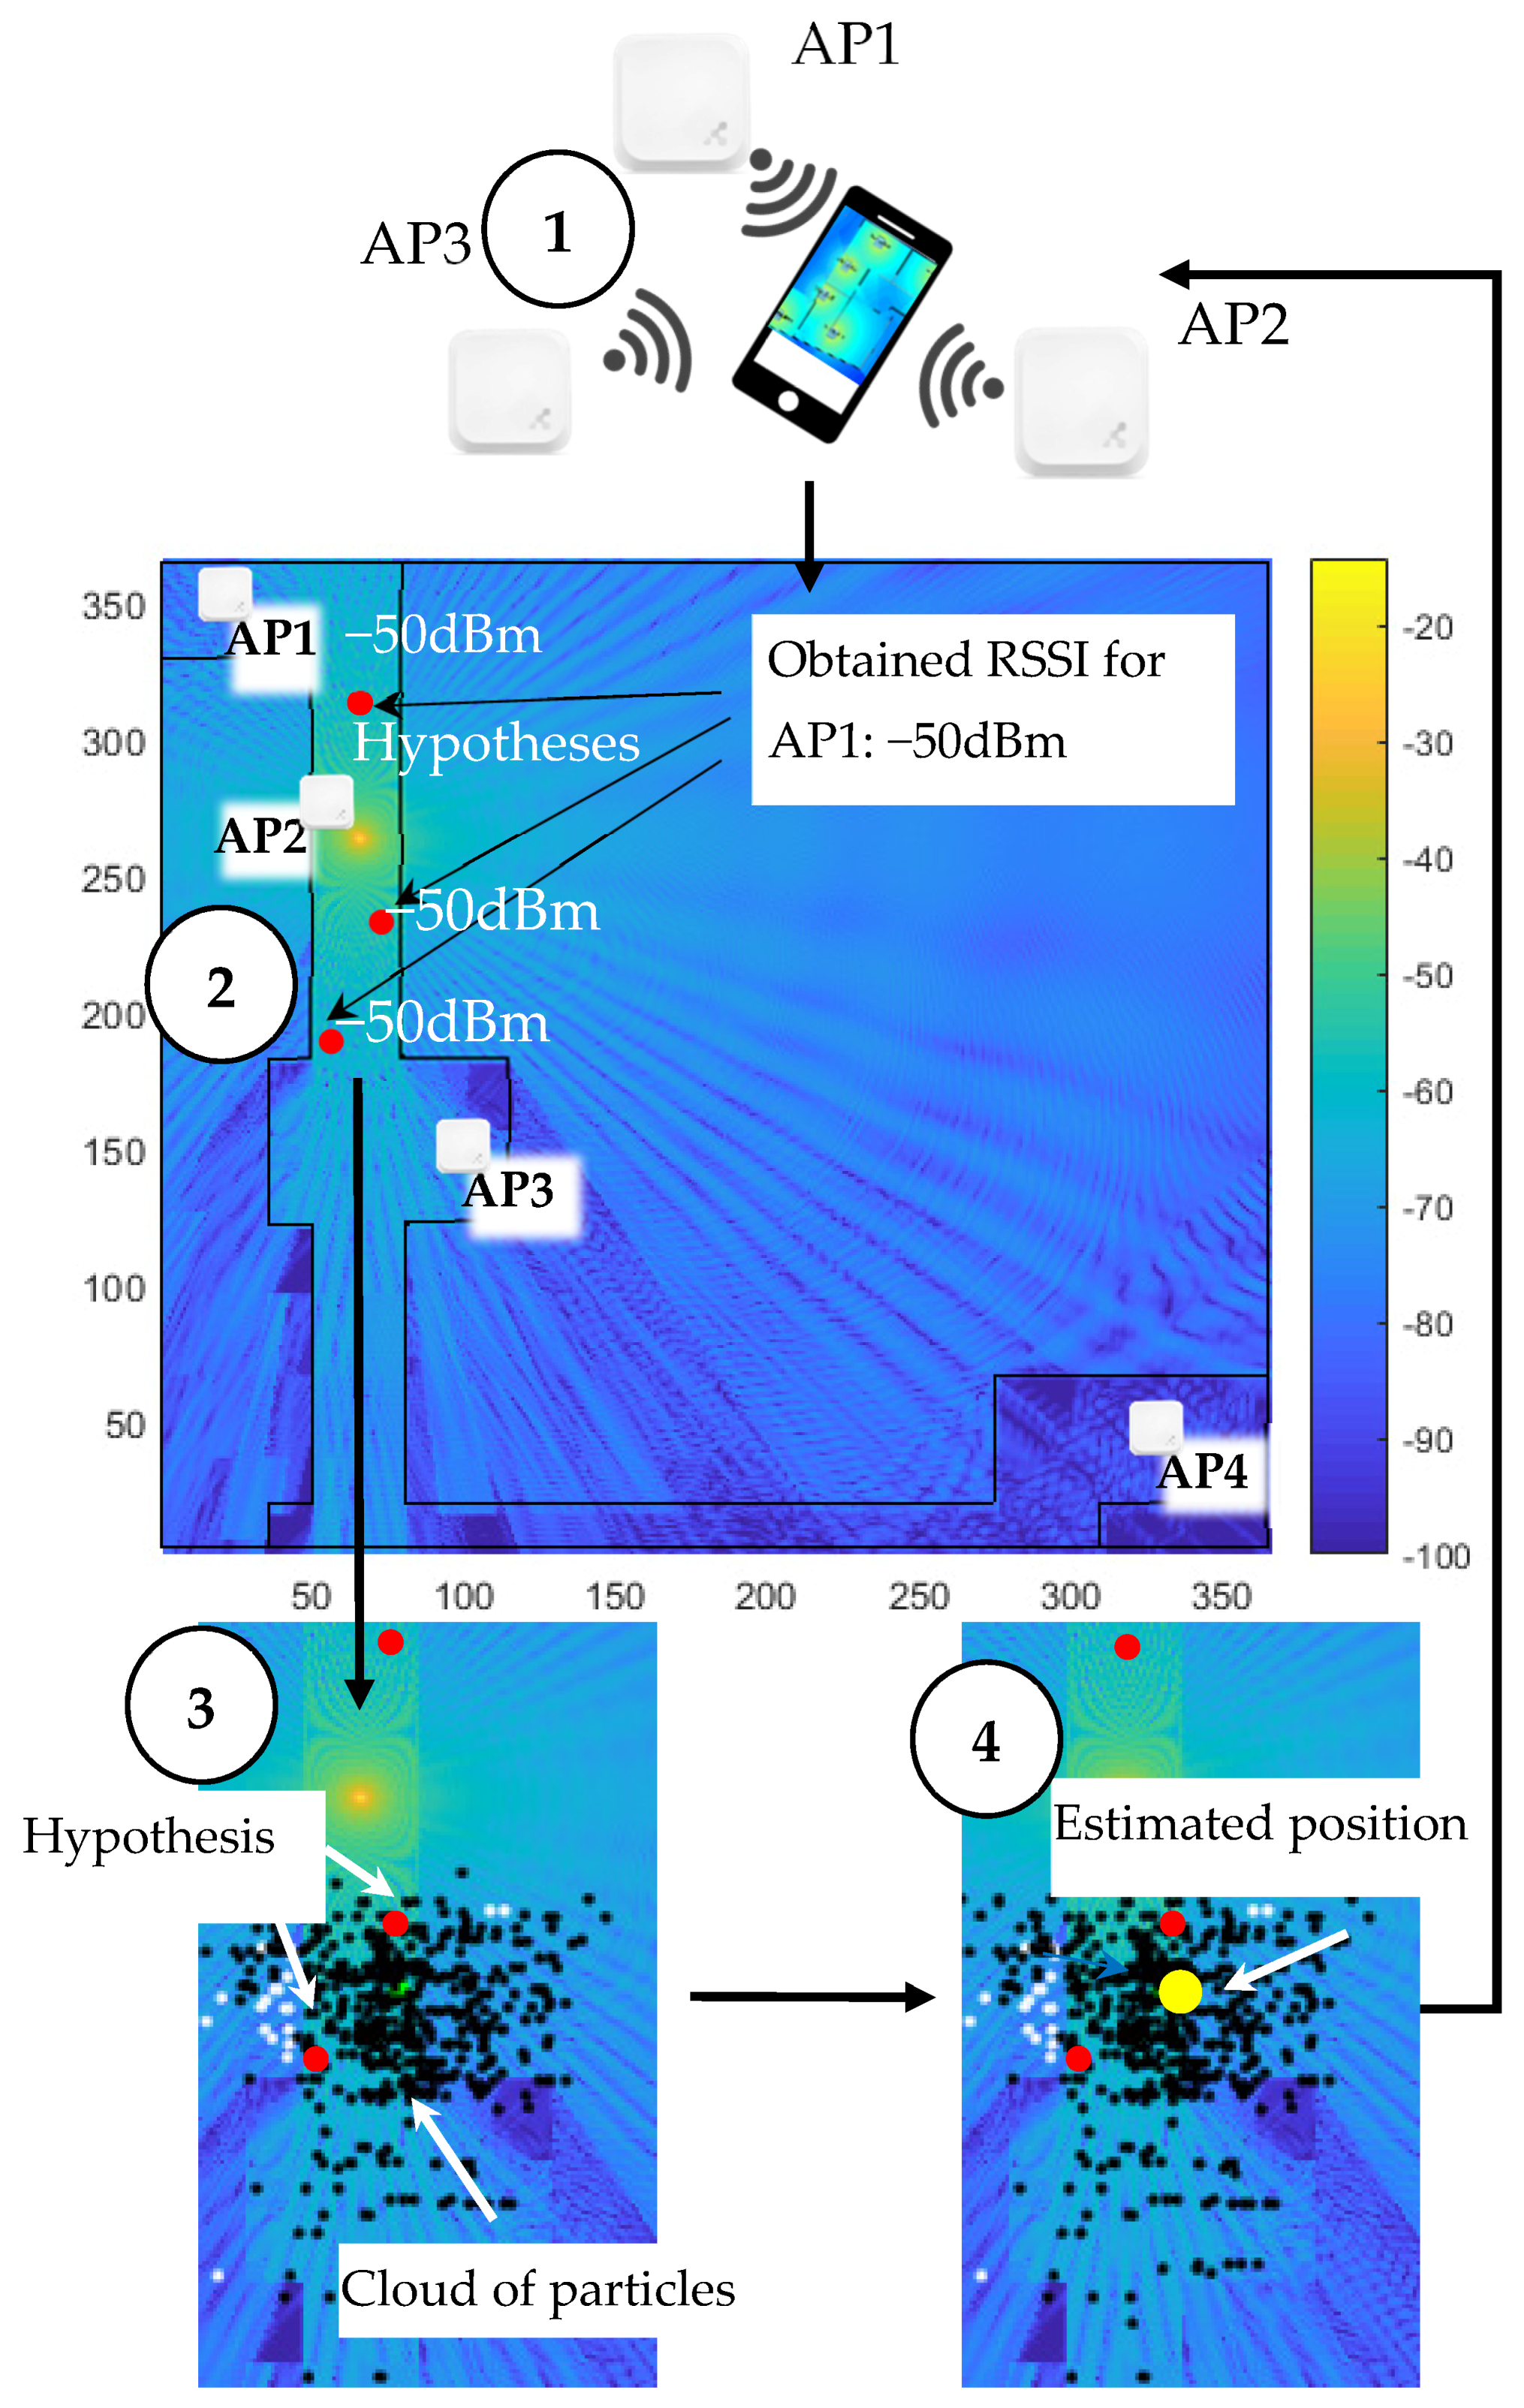
The system works according to the following scenario (also presented in graphic form in
Figure 1):
Bluetooth transmitters broadcast messages containing unique identifiers (AP1-APn), allowing the source of the signal to be determined unambiguously. The application installed on the mobile device looks for Bluetooth tags in the environment, by registering their identification numbers and the corresponding signal strength of the RSSI.
The strength of the RSSI from each available BT transmitter is compared with the reference RSSI distribution dataset. If the received RSSI level value for a given Bluetooth transmitter (within some range) matches with predetermined accuracy the values for a given set of points on the reference map, then these points are treated as possible mobile terminal locations (i.e., hypotheses) in the indoor environment.
The fingerprinting localization algorithm uses the particle filtration method to generate a random cloud of particles around the recently estimated location. Each particle is a potential position hypothesis for the next iteration of the algorithm. Based on the hypotheses registered by the mobile terminal and the last estimated position, the algorithm assigns weights to each particle. It determines the probability with which a given particle is a true estimate of the location. Particles that are far from the potential hypotheses and the last estimate are given low weights (or zero), and those close to the hypotheses receive higher weights. The algorithm then eliminates particles with low or zero weights.
Based on the observed identifiers and RSSI values, the fingerprinting algorithm followed by particle filter determines the estimated position of the terminal. The procedure of updating the terminal estimate is performed each time the currently obtained RSSI values are different from those in the previous algorithm iterations.
2.2. Indoor Positioning Algorithm Based on Fingerprinting Method Followed by Particle Filter
To determine the location of the terminal, a modified version of a particle filter algorithm [
30,
33,
34] was used.
The algorithm includes the following stages:
Load the reference data.
Read (measure) the RSSI sequence for a fragment of a terminal movement path.
Initialize the positioning procedure, determine the initial location estimate, initialize (for the Nth-segment) vectors of coordinates:
XP—set of x coordinates for particle positions
YP—set of y coordinates for particle positions
N—number of particles used in the localization algorithm
- 4.
Compare the measured RSSI values against the reference values. Select all the points from the reference map that meet the condition
Prefmap—reference RSSI values
Pxy—RSSI value measured at the coordinates (x, y)
P∆—maximum admissible deviation of the reference values from the measured RSSI value.
The following steps of the localization algorithm were implemented to increase its stability and accuracy:
- 5.
Determine common points (areas) on reference RSSI maps that meet the assumption from step 4:
XS, YS—state vectors, sets of x, y coordinates of the points that correspond (are equal or close) to measured values from each source.
- 6.
On the basis of the points meeting Equation (1) for all sources, we obtain three sets of points for which the value of the power distribution is similar to values measured for each of the RSSI sources at a given moment. Determining the common measurements limits the area that needs to be searched.
- 7.
The set obtained in step 5 is a state vector. It is used to generate a shift for the set of particles
x∆,
y∆ are the sets of shifts for each of the particles, for the x and y axes respectively.
where:
Xsigma, Ysigma—variance in the particle dispersion x, y
xest, yest—estimated location of the object from the previous iteration
median (XS)—median value
randn (1, N)—random value with a normal distribution
- 8.
If none of the common vectors are found, select the state vector by following these steps:
X′S1, X′S2, X′S3—state vectors, sets of x coordinates of the points that correspond (are equal or close) to measured values from sources S1, S2, S3
Y′S1, Y′S2, Y′S3, —state vectors, sets of x, y coordinates of the points that correspond (are equal or close) to measured values from sources S1, S2, S3
- 9.
For each algorithm iteration (i) compute x∆ and y∆ using Equations (2) and (3) with the newly generated state vectors. Move sets of particles XP, YP by x∆ and y∆:
- 10.
Assign new weights to each of the particles whose position does not coincide with the points that meet the condition
PxyP—each particle that represents a hypothetical position with defined coordinates XP, YP for which a new weight is assigned.
- 11.
Normalize the particle weights. The weight is the probability that the given particle is an accurate estimate of the object’s position. Therefore, in order to determine the probability for each of the particles, the sum of their weights should be 1.
- 12.
Calculate the degeneration coefficient and check if it exceeds the experimentally selected threshold value GTHR = 0.8. This threshold value was selected in a deterministic manner because it allows for re-scattering of the particles when their weights start to differ significantly (making it difficult to accurately estimate the position of the object in the building). The degeneration coefficient enables the dispersion of particle weights to be measured. If all particles have the same weight, then GTHR reaches the maximum value of 1. If the weights of the particles start to differ, the degeneracy coefficient d decreases.
- 13.
If GTHR = 0.8, d < GTHR, the algorithm starts the resampling procedure. A new set of particles is created. The probability of copying a particle in a given x, y depends on its weight. Particles that have low weights are replaced with the more probable ones (with greater weights).
- 14.
Update the position estimate: determine the mean value from the set of particle coordinates (XP, YP).
2.3. Preparing Reference Data Distribution for Indoor Localization
The reference RSSI distributions of the measured parameters must be prepared so that the location algorithm can assign the current measured readings to the values from the reference database. We gathered such measurements manually on a grid of points and created RSSI distribution maps for designated areas in the buildings. The RSSI parameter was measured using a dedicated mobile application. For each of the available BT transmitters, points were arranged on a square 0.75 m grid. Measurements were performed for several minutes and then the maximum value was selected for each point. The manual preparation of reference RSSI distributions required about 3–5 working days. The time and effort required make this procedure impractical in real-life applications. Replacing measured RSSI maps with simulated RSSI maps is the main motivation and objective of our study.
This study was divided into stages, including measurement of the received signal power distribution within the test area, recording of the RSSI data along predefined user walking paths, and assessment of the accuracy and performance of the positioning algorithm with measured and simulated reference data.
One of the indoor environments was the Sports and Education Centre “Sports Bay” at Lodz University of Technology in Poland. Simple BLE beacons by Kontakt.io were used as signal transmitters. The BLE beacon was configured to broadcast information using one radio channel. The frequency the identification message can be modified (in our case it was 100 ms) and the output power varied (in our scenario it was 0 dB). The measurements were made in a 2 × 2 m grid. Almost 90,000 RSSI samples were collected during the measurement campaign. The measurements required about 4 days.
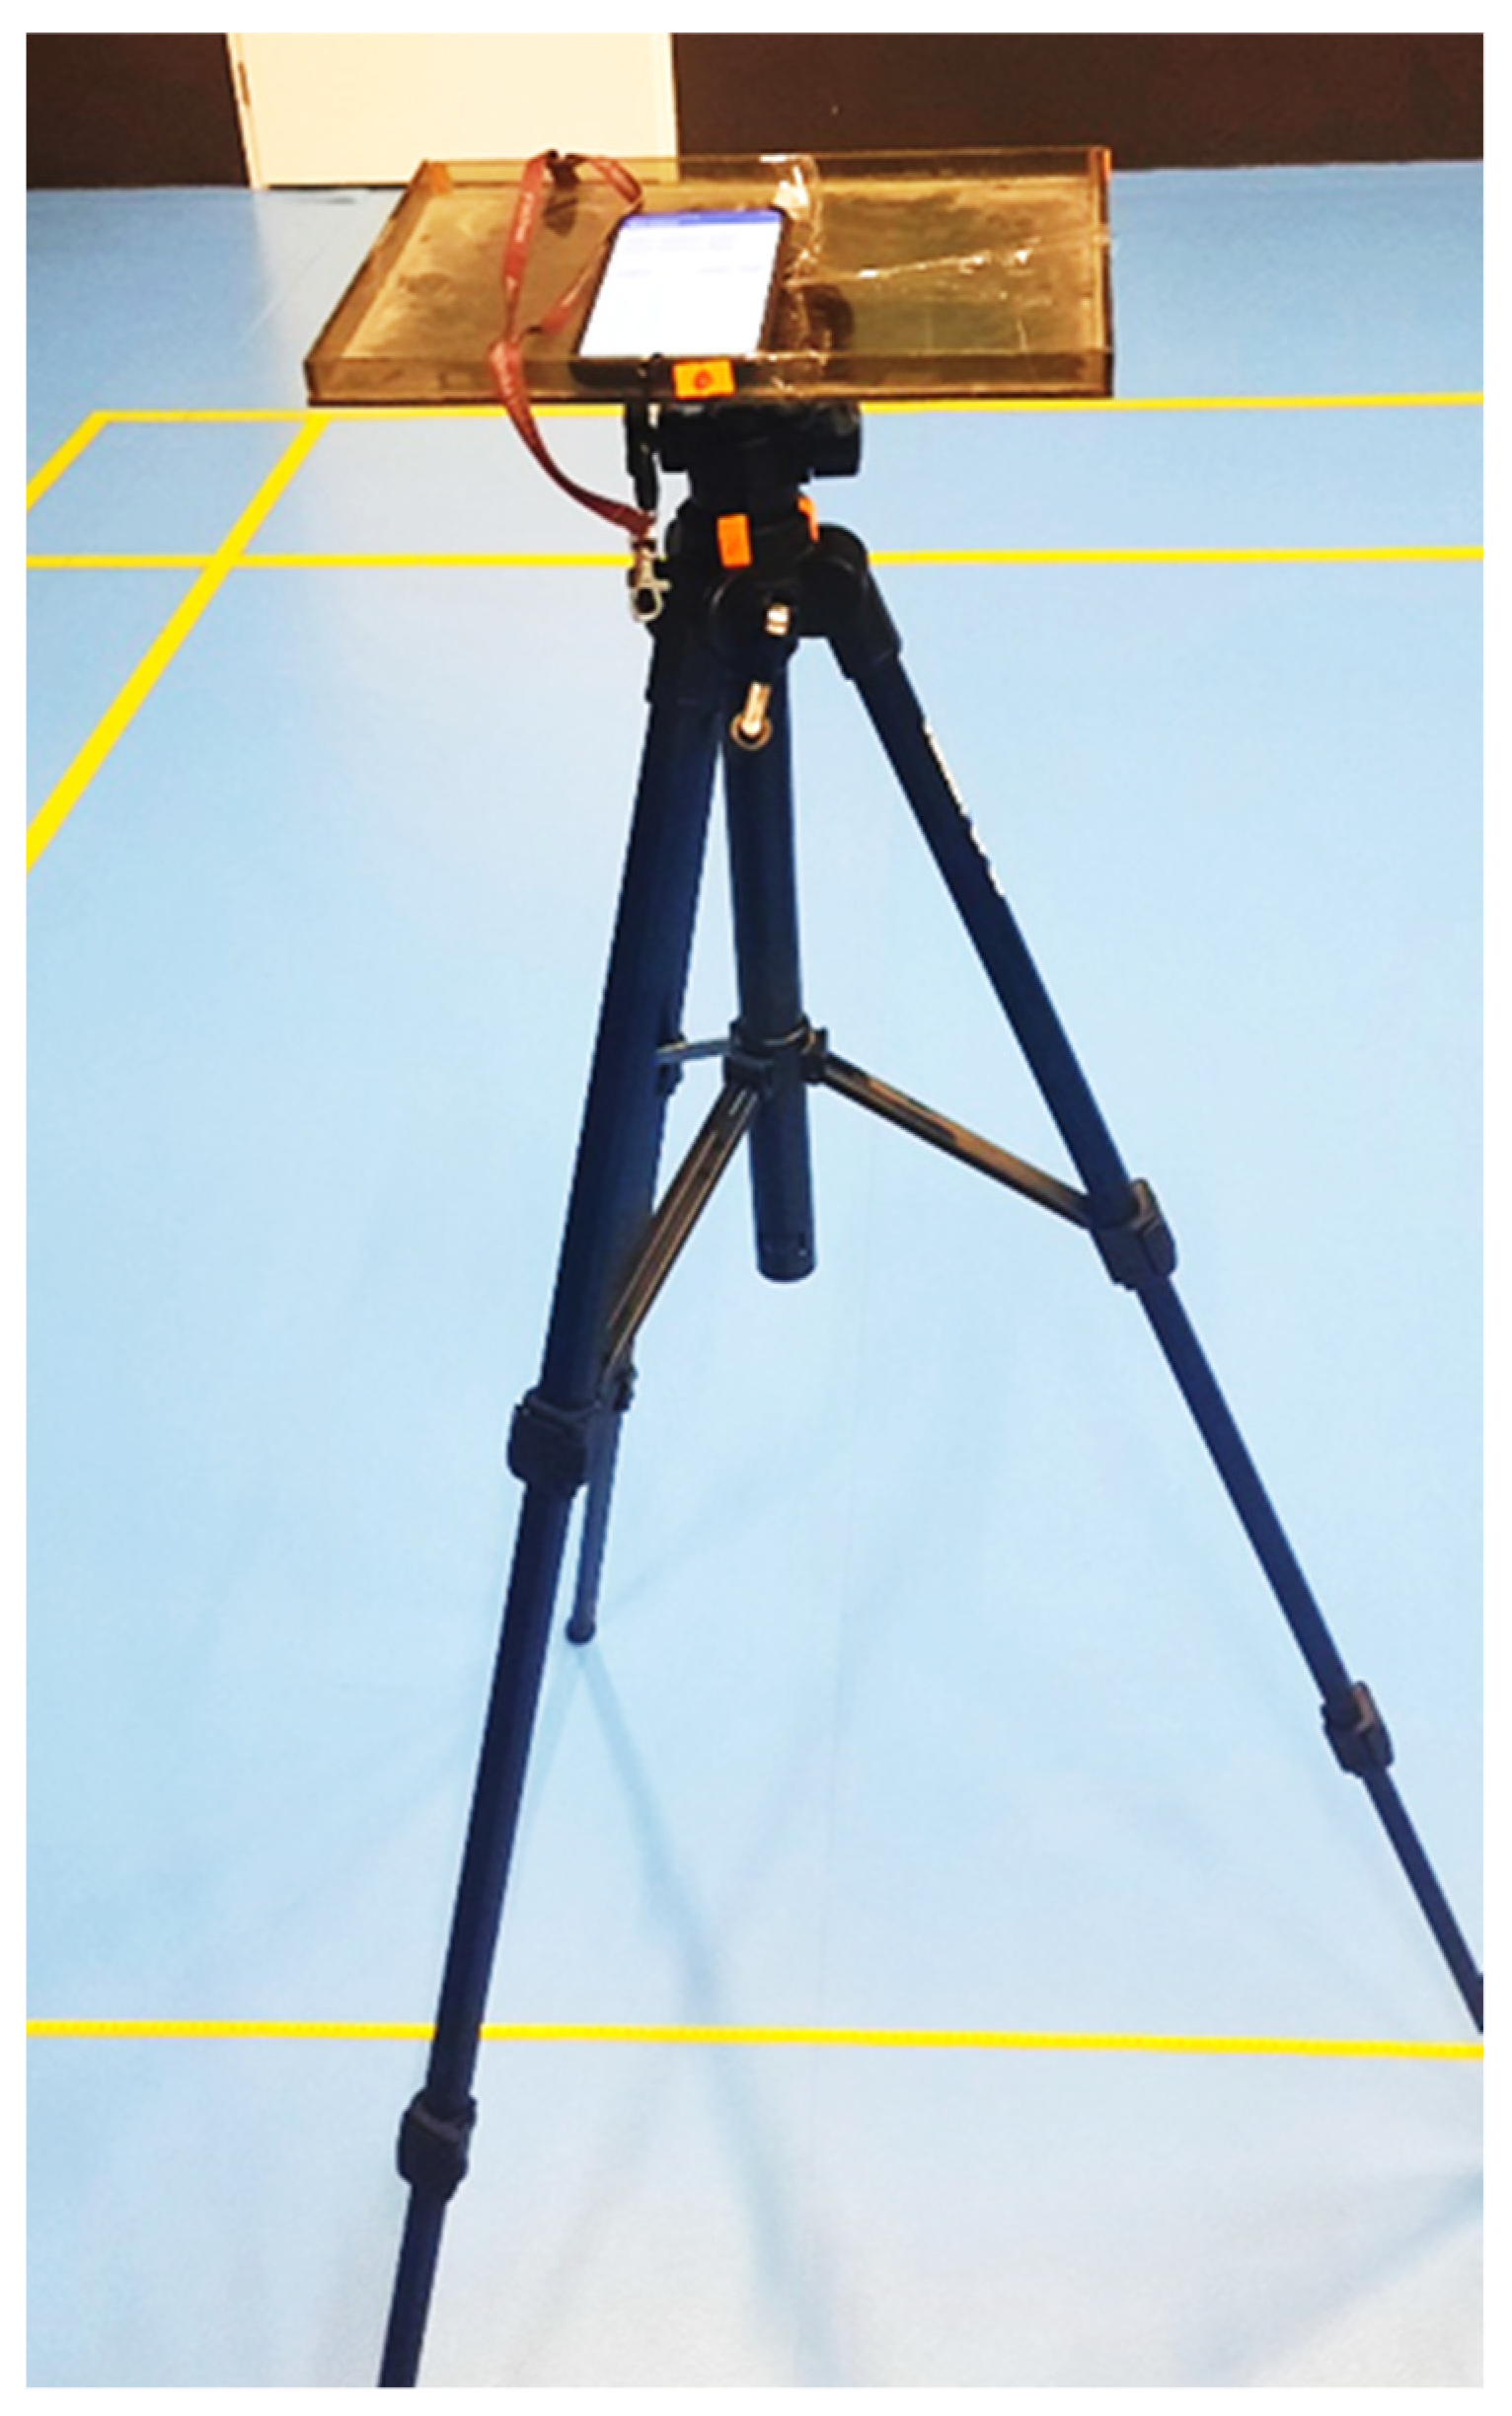
Figure 2 shows the setup used to record the measurement data. It consists of a tripod with a mobile terminal on which an application is installed for collecting measurement data. Measurements were made of the terminal’s horizontal position and four orientations (in 90° increments) on its longitudinal axis. All RSSI readings with values greater than −110 dBm were recorded. The measurement data were collected using a dedicated mobile application on an OPPO Reno 5G smartphone running the Android operating system version 11. The smartphone is equipped with the version 5.1 Bluetooth communication module, which enables better RSSI measurement accuracy than previous releases and has also been used by other authors for indoor localization purposes [
35]. The collected data were saved in a database for further offline processing using the MATLAB environment without any specialized toolboxes. A verification platform was implemented in MATLAB to load the measured RSSI distributions, simulate the user’s movements in the building, determine the user’s location, and calculate the location error.
The next section outlines some prerequisites needed to prepare such data and selected methods that can be used to prepare simulated reference RSSI maps.
2.4. Indoor Propagation Models
To generate a simulated RSSI distribution for use as reference data for a location algorithm, it is necessary to provide information on the locations of the transmitters in the building and the arrangement of walls, windows, doors, and other objects. Since the electromagnetic properties of structural elements are typically challenging to acquire, in our simulations we used typical values taken from ITU recommendations [
36,
37].
Two propagation models were used to prepare reference RSSI distributions: the ray tracing model for its accuracy and a simple multiwall model. This class of models estimates the path loss in a building environment delimited by obstacles such as walls, doors, windows, furniture, and people who may be in the area and affect radio propagation. Later in this section, two propagation models are used to prepare reference RSSI distributions using computer simulations. Of course, more propagation models can be used, but two of them were chosen—the ray tracing model for its accuracy in modeling the indoor environment, and a simple multiwall model, to verify whether this class of models can also be successfully used in locating terminals in buildings.
2.4.1. Ray Tracing Model
The 3D ray tracing method was implemented in Remcom Wireless InSite 3.3.0 software [
38]. We used the X3D variant of the ray tracing method, which supports efficient parallel computations using multi-core Compute Unified Device Architecture (CUDA)-capable Graphics Processing Units (GPUs), and a processor, such as the Nvidia Tesla K series. The model of the test environment (
Figure 3) consisted of the floor, ceiling, and outer and inner walls, in addition to other essential construction elements.
To simplify analysis of the test environment, since the exact orientation and radiation patterns of the beacon antennas were not known, the beacons were modeled as nodes equipped with omnidirectional half-wave dipole antennas. We also assumed the use of omnidirectional antennas at the receivers. The transmitters were placed at locations corresponding to the actual locations of the beacons, while the receiver positions (test points) were arranged in rectangular grids covering the entire test area.
To construct a model of the building, it was necessary to take into account the electromagnetic parameters of the walls and other structural elements, such as concrete walls, brick walls, and partition walls made of drywall. The electromagnetic parameters of these elements were taken as recommended in ITU documents [
37] and are presented in
Table 1.
2.4.2. Multiwall Model
Reference RSSI maps were created using a multiwall propagation model. This is a well-known and commonly used model for indoor environments. It combines One-Slope and Motley–Keenan models [
39]. The multiwall model was chosen as it is less complex than ray tracing. The purpose was to determine if using a less complicated propagation model can still result in sufficient positioning accuracy. The multiwall propagation model takes into account the attenuation of walls and ceilings. Obstacles are divided by category (partition walls, external walls, etc.). The following formula expresses the decibel notation of the multiwall model:
where:
L—propagation loss between antennas (dB)
L0—reference loss at a distance of 1 m (dB)
γ—distance power loss index
d—distance between antennas (m)
kwi—number of walls of i-th category
Lwi—attenuation of walls of i-th category
kfj—number of ceilings of category j
Lfj—attenuation of ceilings of category j.
The multiwall model was generated using the WiCa Heuristic Indoor Propagation Prediction Tool (WHIPP) [
40]. The model included walls, doors, windows, and electromagnetic (EM) parameters that can also be used to create signal propagation distribution data. The tool used to calculate the EM field distribution utilizes a multiwall propagation model, and includes information on such obstacles as walls and ceilings.
Computer simulations were performed on the following hardware: Intel Core i7-8750H (8th gen) 2.2 GHz processor with Turbo boost technology, supported by an NVIDIA GeForce GTX 1050Ti graphics card with 4 GB RAM. The times needed to generate the distributions for selected test scenarios were compared with the time required to perform measurements in an indoor environment. The results are presented in
Section 3 (Results).
2.5. Adjustment of Simulated Reference Distribution Map to Real Signal Measurements
The RSSI values measured in a given building area using a mobile terminal often vary over time. Additionally, mobile terminals are often equipped with various types of receiving antennas. As part of our research, several models of smartphone-type mobile devices were tested. The RSSI was measured at a given point with the same arrangement of the smartphone. It was noticed that the read values differed by up to 2–3 dBm. However, although the RSSI values were different, the trends were similar. Therefore, to use the reference RSSI distributions generated by computer simulations, it was necessary to adjust all values from the reference database by the mean square error (MSE) value, which is the difference between samples in the reference distribution and the values measured in the actual indoor environment. The following formula was used to calculate the difference due to the mean square error between the reference and measured values:
where:
n—number of points in the indoor subarea where calibration was calculated
RSSIref—RSSI value for a given point obtained from the reference database
RSSIreal—RSSI value for a given point obtained from real measurements
Based on the results, each reference point from RSSI distribution map was shifted using the following formula:
where:
Adjusted RSSIref map—SSI distribution dataset adjusted for a given mobile terminal.
2.6. Measurements and Simulation Data
To verify the proposed method of computing reference RSSI maps for localization purposes, three extensive test scenarios were carried out. Measurements were made for two test scenarios. For the third scenario, a database used in an indoor localization competition during the International Conference on Indoor Positioning and Indoor Navigation (IPIN) 2014 [
41] was used. The three test scenarios are described in detail in the sections that follow, along with the key results. RSSI reference distributions were prepared for all three scenarios using the propagation models described in
Section 2.4.
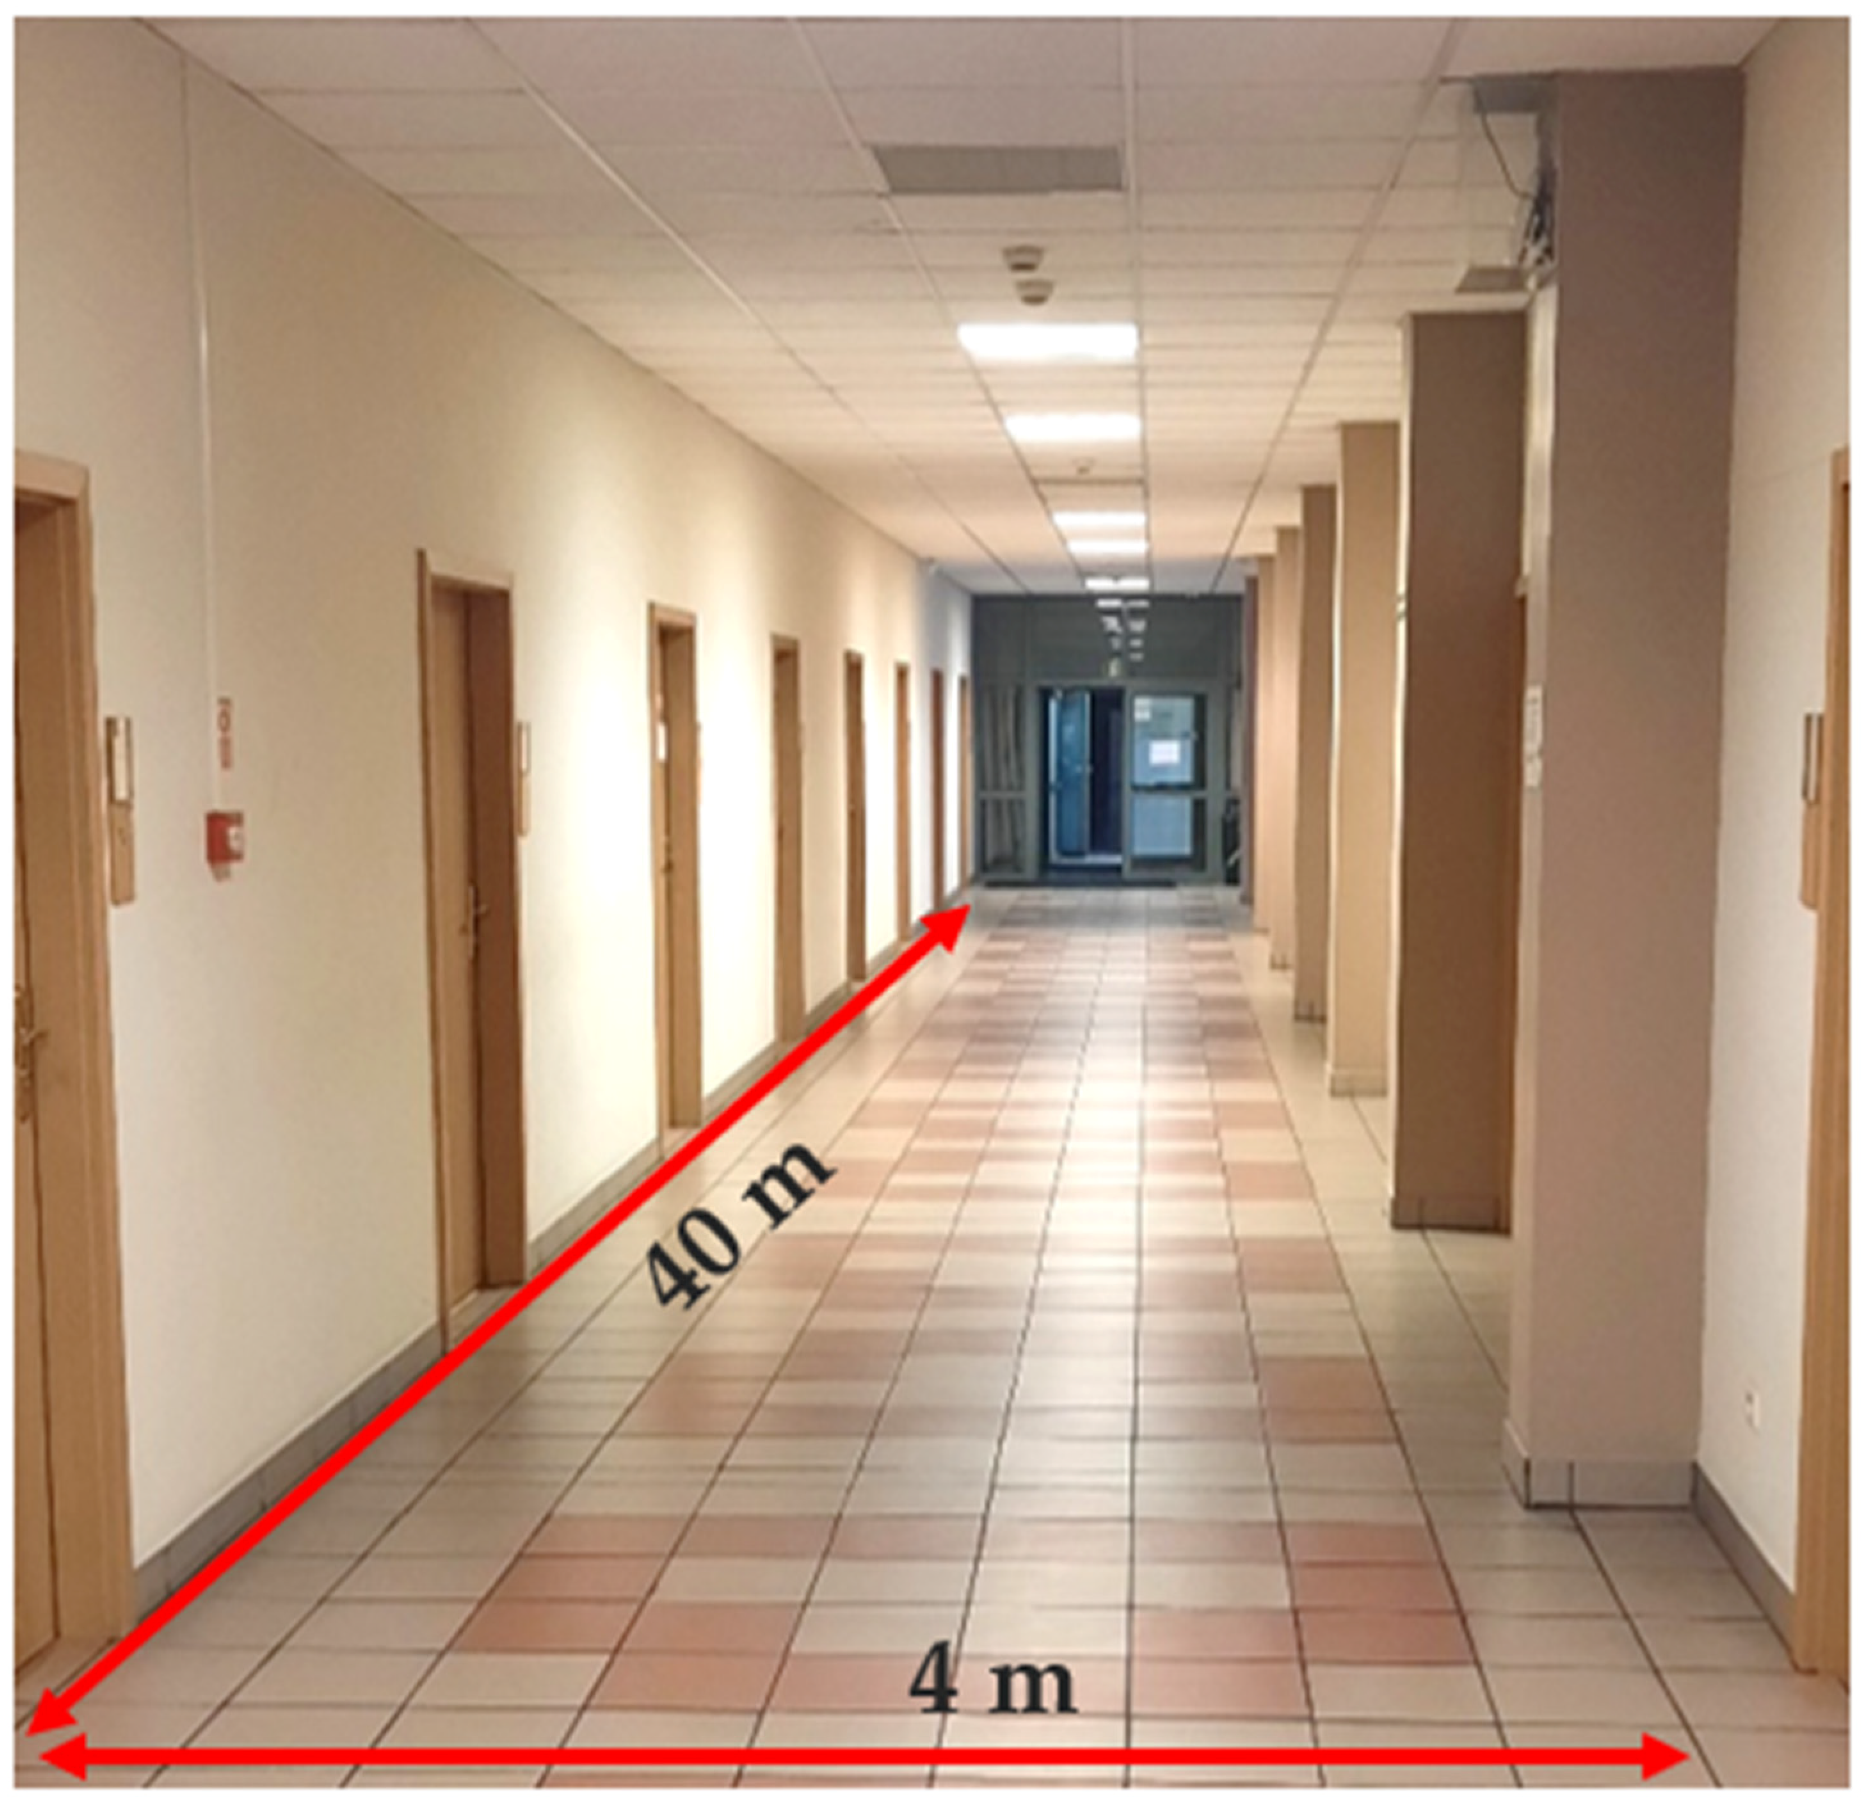
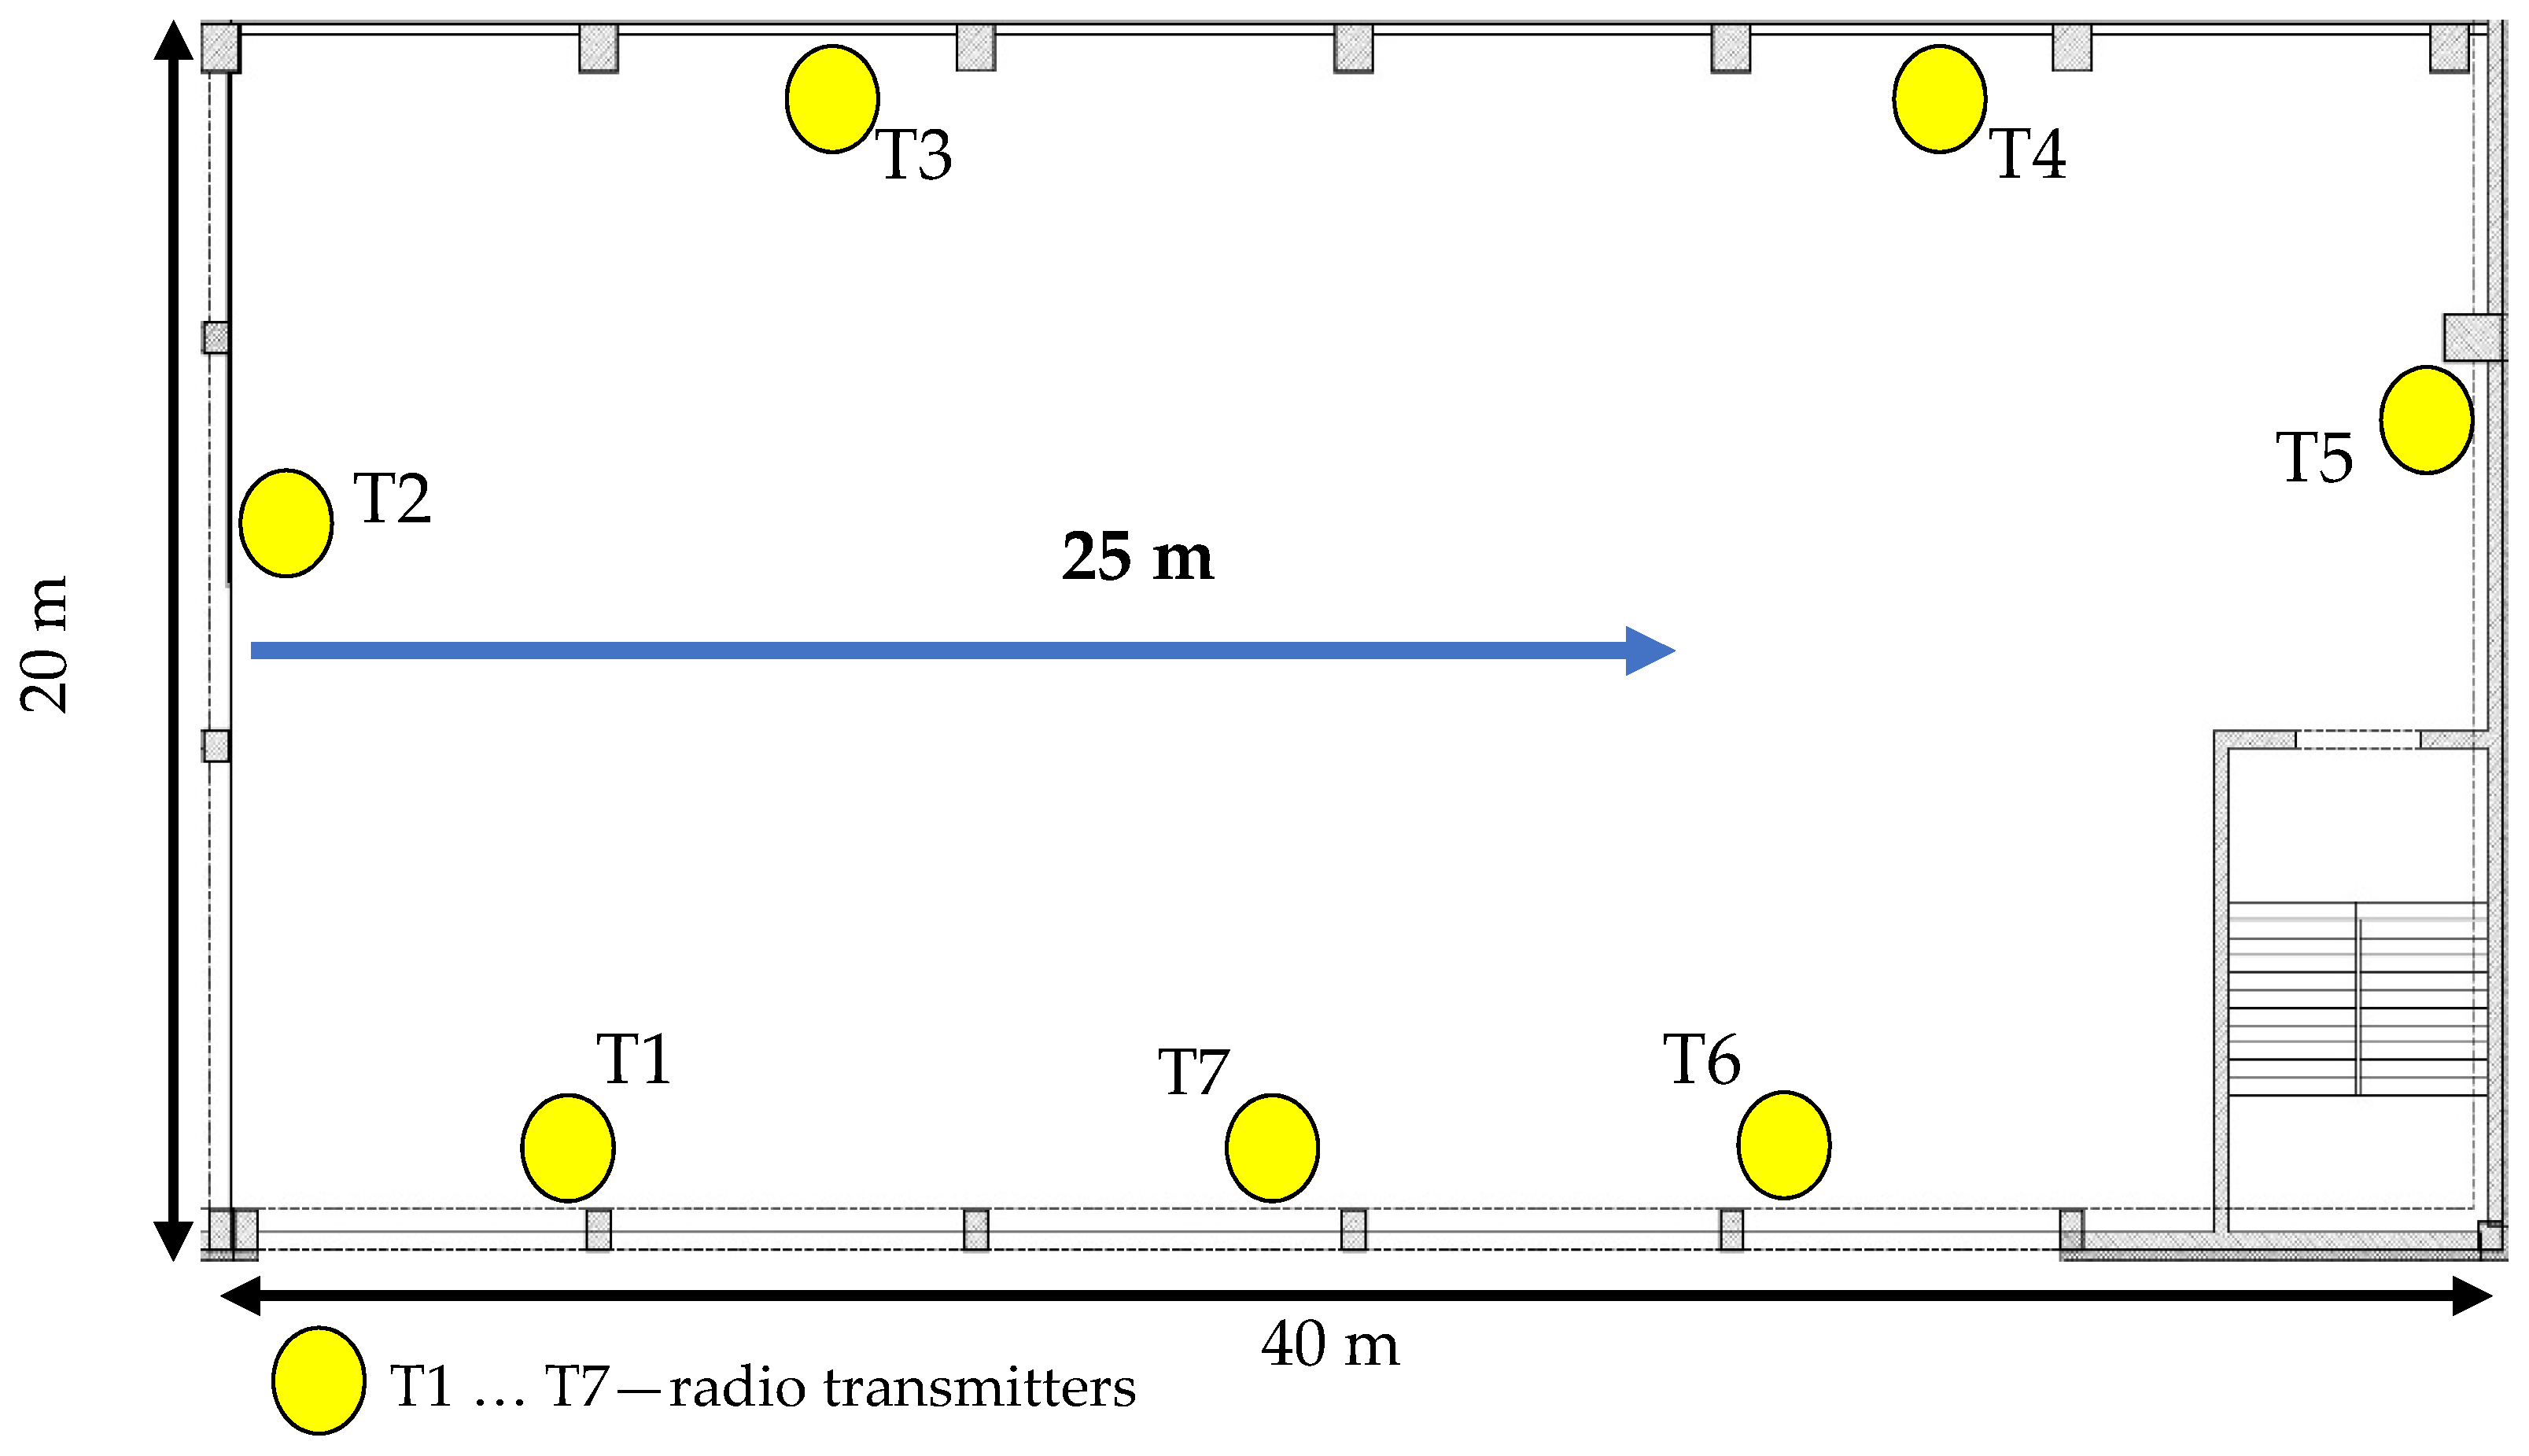
2.6.1. Scenario 1 (S1): Corridor in the Institute of Electronics at Lodz University of Technology
The first verification scenario was a fragment of the building environment in the Institute of Electronics at Lodz University of Technology.
Figure 4 shows the floor plan for this verification scenario. BLE transmitters were placed in the locations marked with yellow circles.
Measurements of the RSSI parameter were performed for each of the BT transmitters at measurement points arranged in a square grid with a 75 cm step. Measurements were carried out using a dedicated mobile application. Measurements were performed for several minutes for each point. Datasets gathered during the measurement campaign and simulations are available at the following link:
https://github.com/robertkawecki7/IndoorPositioningDatasets (accessed on 1 April 2022). The median and maximum values for a given point were calculated. This time-consuming approach allowed the preparation of RSSI parameter distribution maps for each Bluetooth transmitter placed in the building and used for localization. In the test environment, manual preparation of the reference RSSI distributions required about 3–5 days of work.
Figure 5 shows a photograph of the indoor environment.
To prepare the reference RSSI distributions for S1, a model of the fragment of the building on the third floor of the Institute of Electronics was developed. The model presented in
Figure 5 was prepared using the Remcom Wireless InSite application. A similar simulation was prepared using the WHIPP software tool (to prepare RSSI distributions generated by the multiwall model). It was assumed that the structure of the building included structural elements such as concrete walls, brick walls, and partition walls made of drywall. The electromagnetic parameters of these elements were as recommended in ITU documents [
36,
37] and are presented in
Table 1.
Preparation of reference data using the simulation methods (multiwall and ray tracing) made it possible to generate RSSI distributions for each of the transmitters in this part of the building.
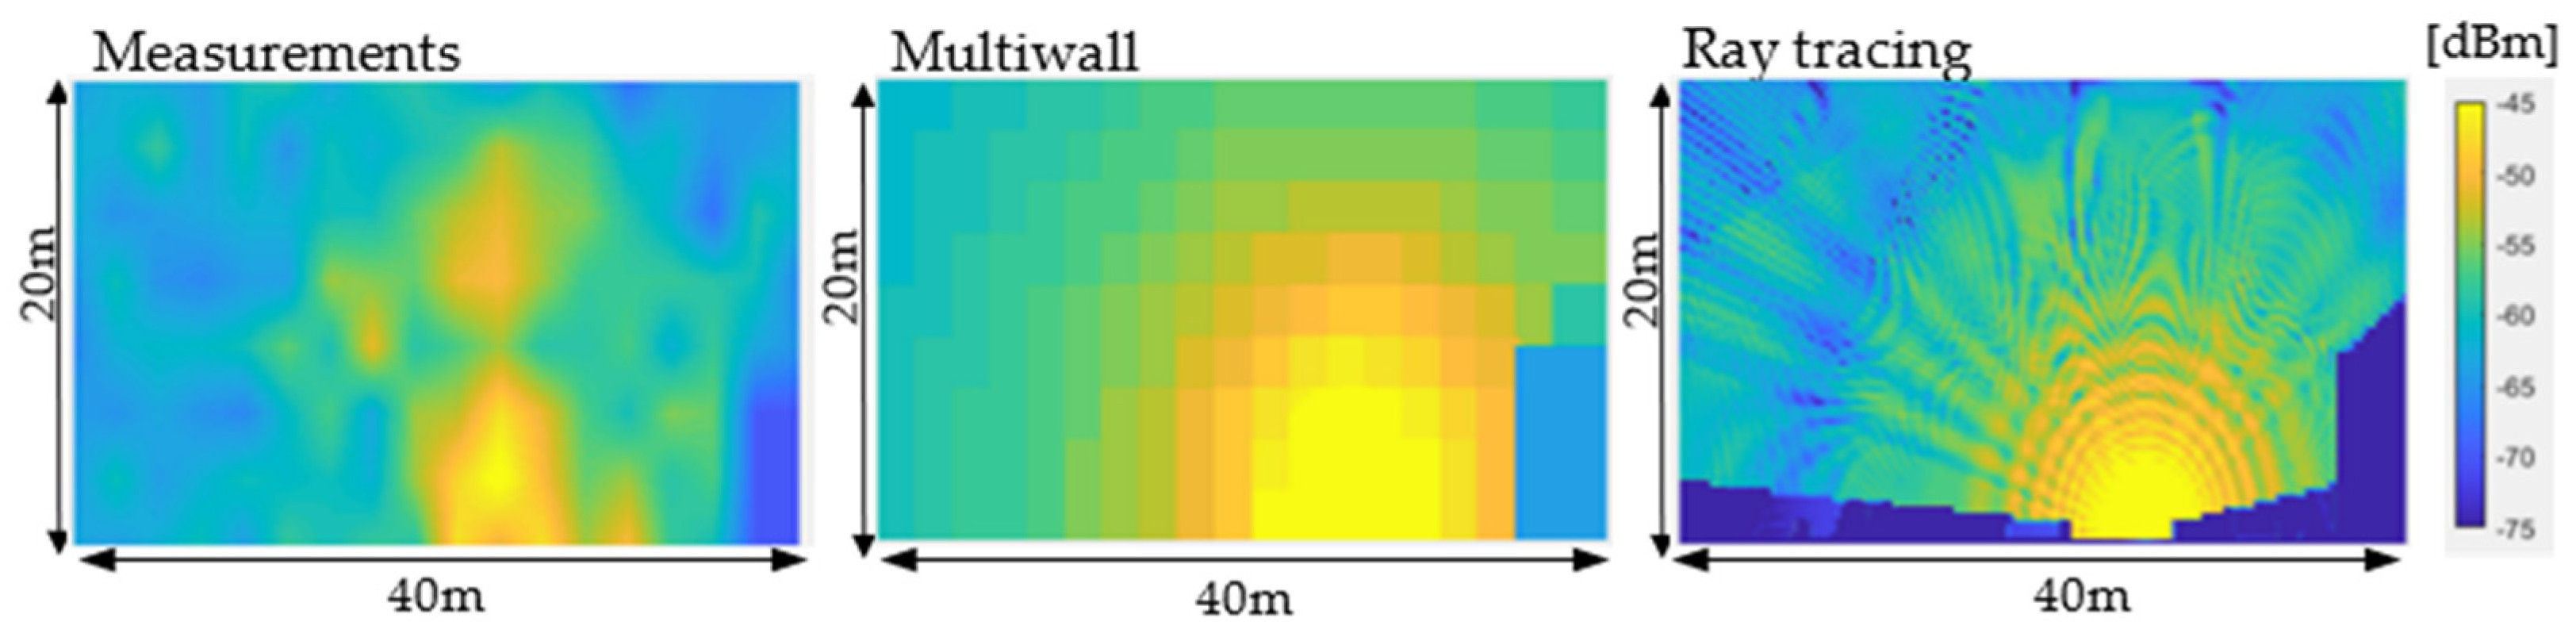
Figure 6 shows the distributions for one of the sources made using measurements (first RSSI distribution) and simulation methods.
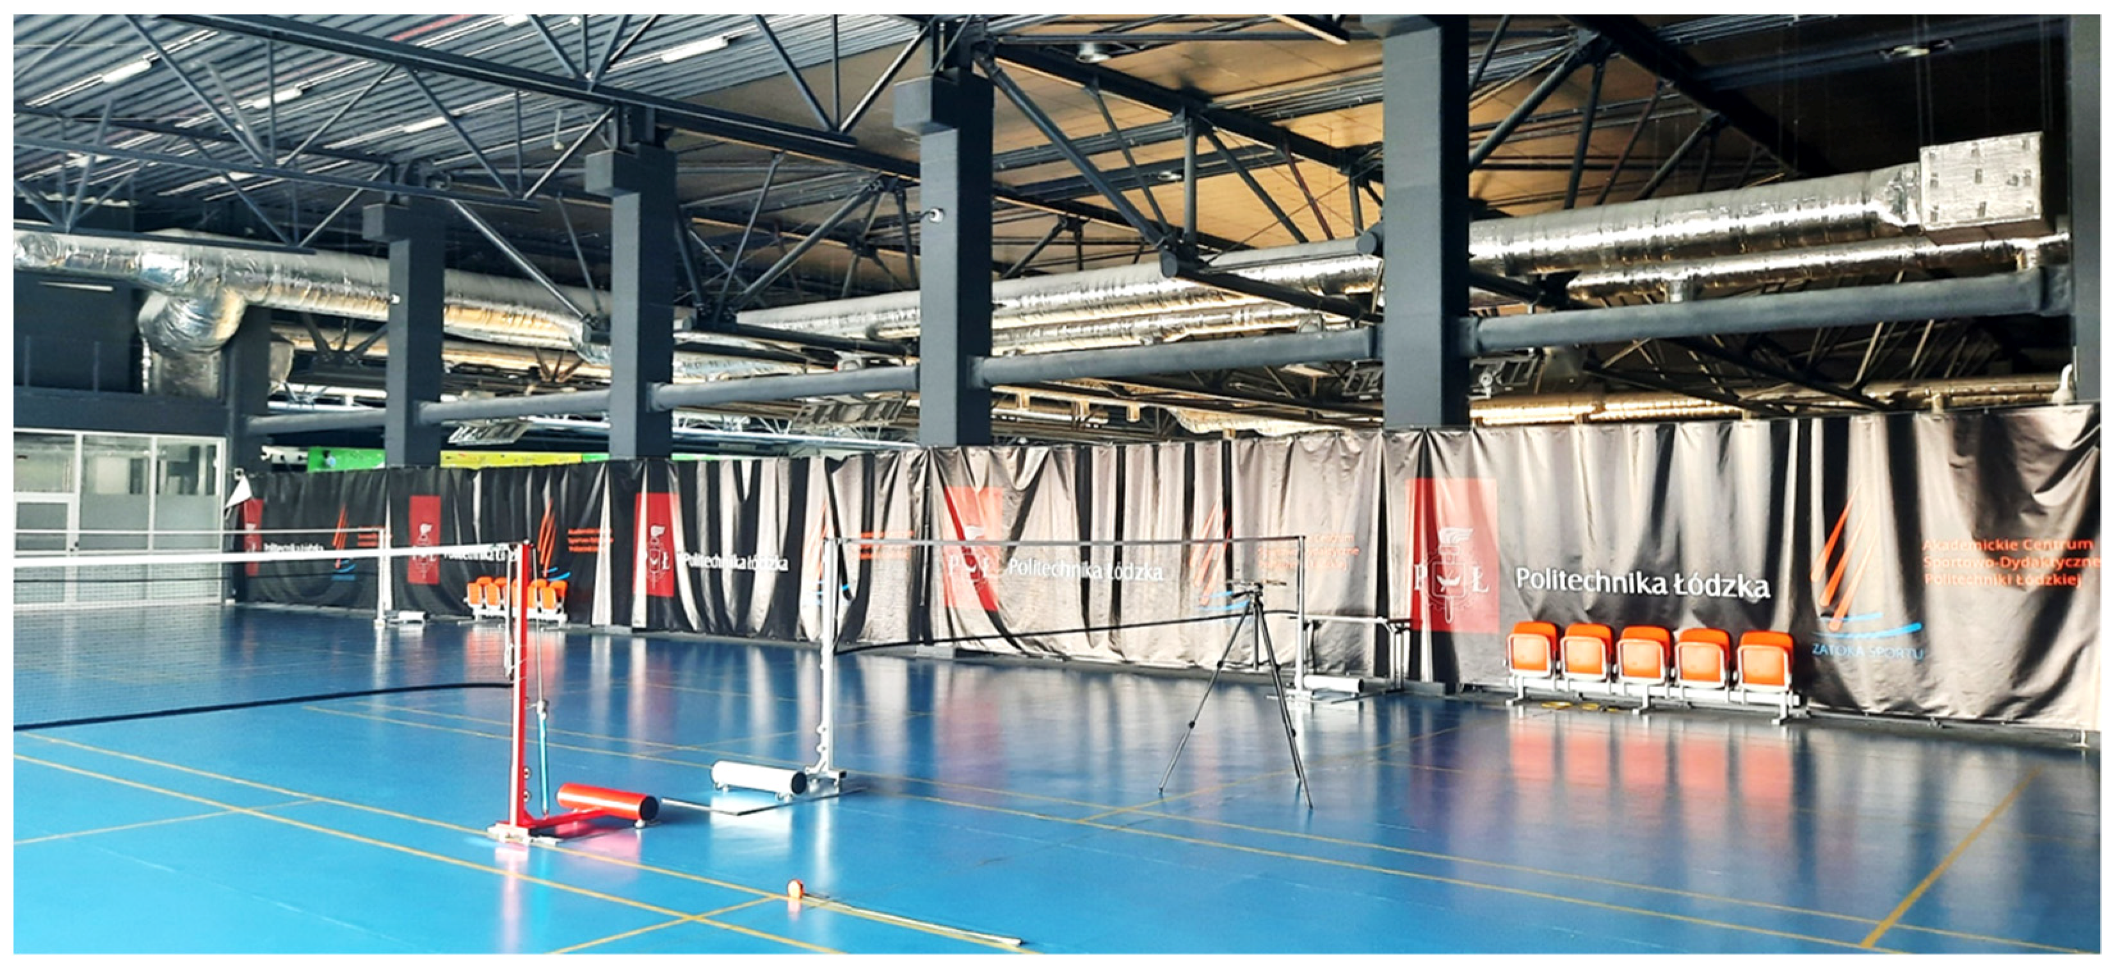
2.6.2. Scenario 2 (S2): Sports Hall in the “Sports Bay” Sports and Education Centre at Lodz University of Technology
The second test environment was the team sports hall in Sports and Education Centre “Sports Bay”. This environment is a large space with a high ceiling and no partition walls. The ceiling is about 12 m high and is composed partially of steel brackets.
Figure 7 shows a photograph of the team sports hall.
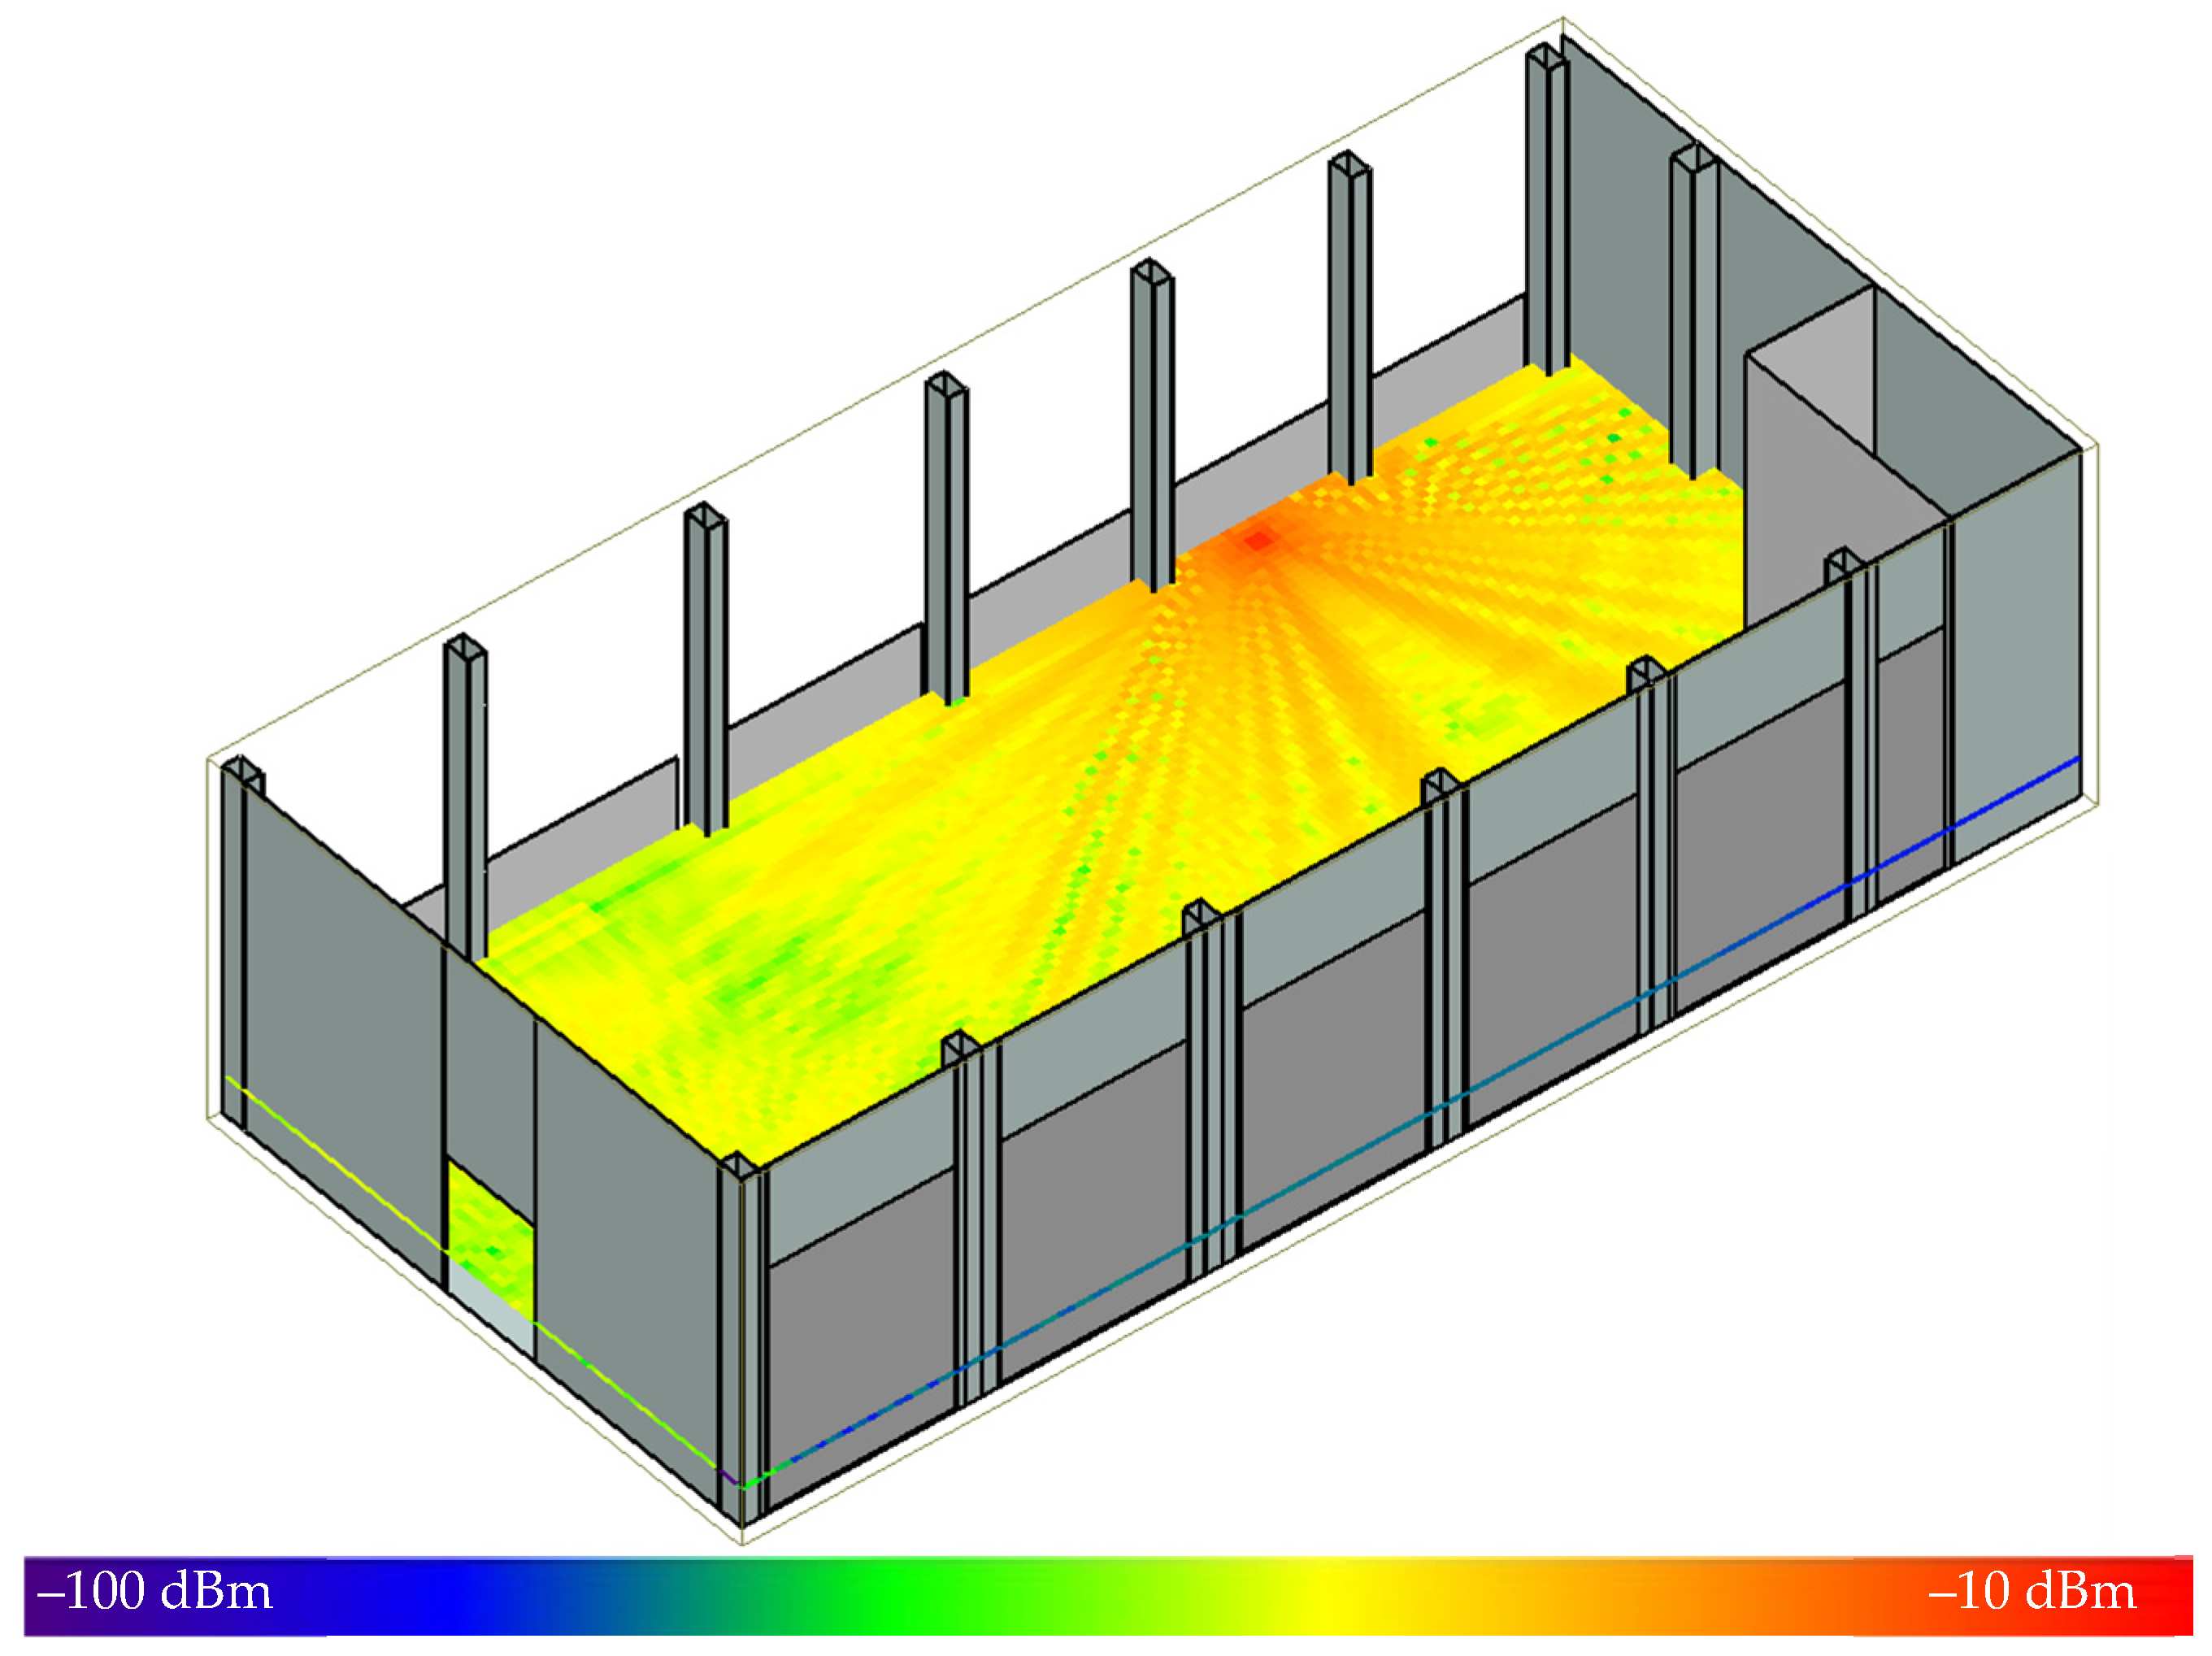
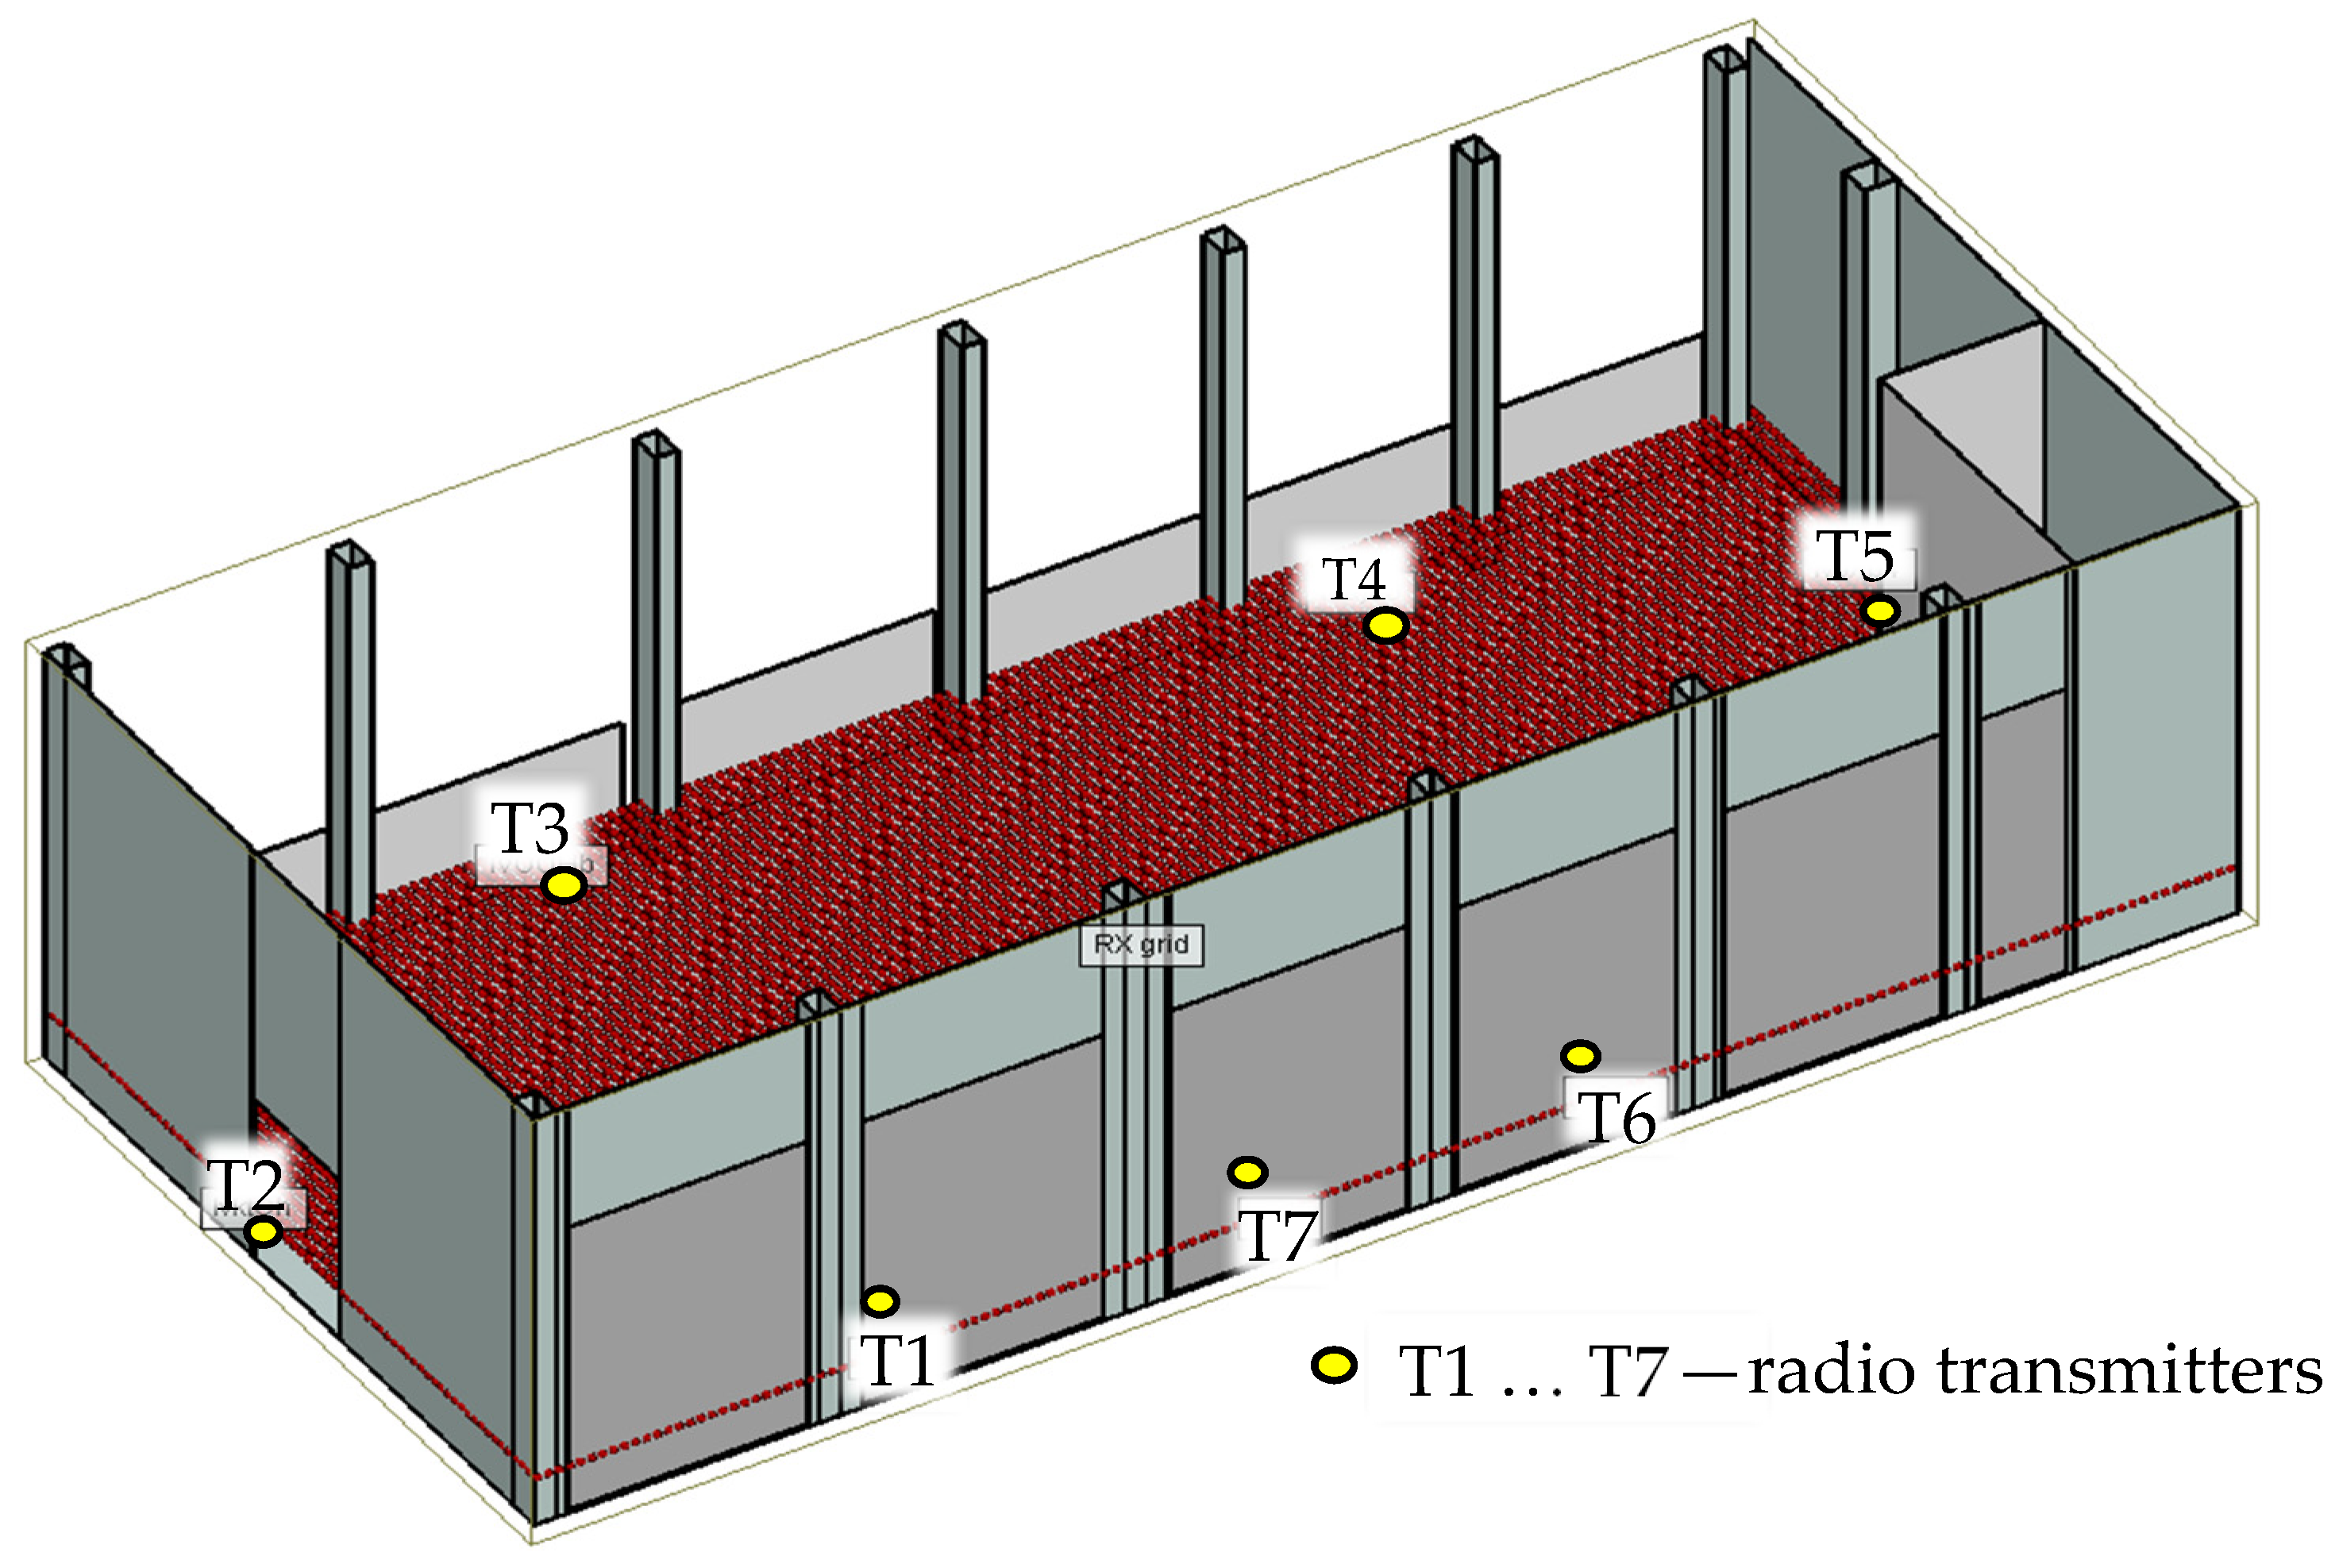
To prepare the reference RSSI distributions for S2, a model of a fragment of the sports hall was prepared. Dimensions of basic elements, such as area dimensions and height, were taken from the construction documentation. The model is illustrated in
Figure 8.
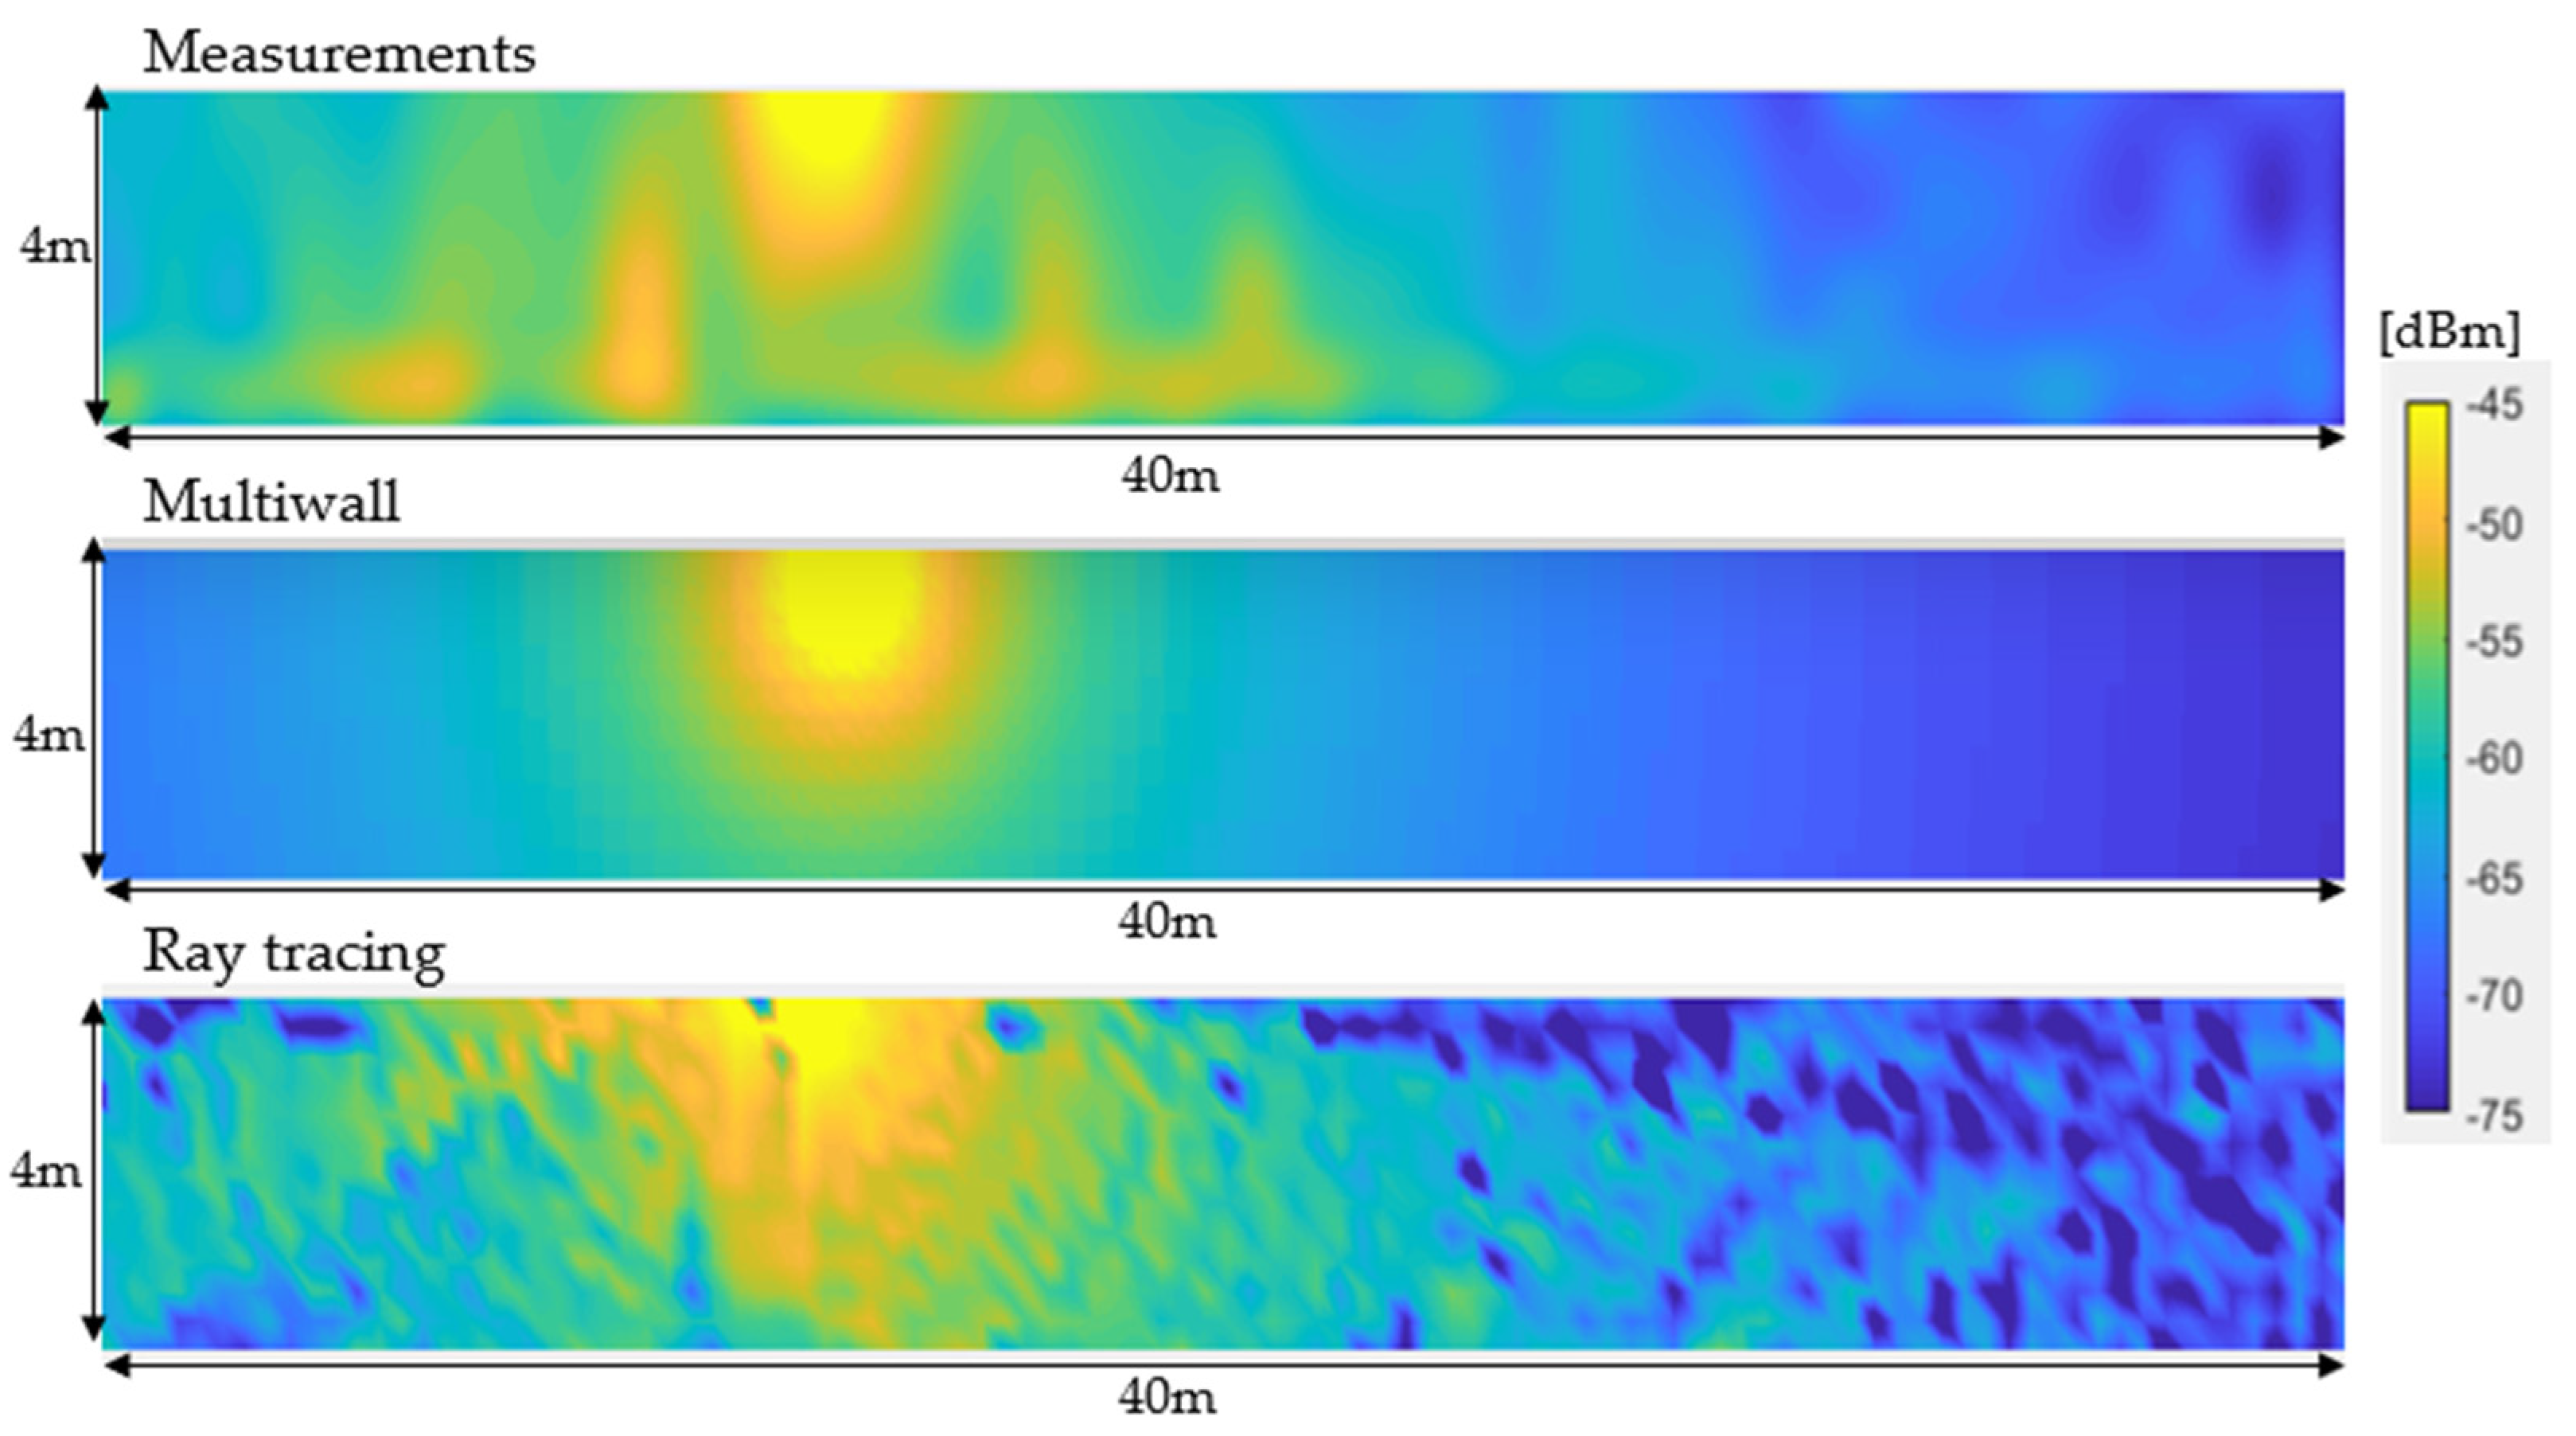
Using the multiwall and ray tracing simulation methods, RSSI distributions were generated for each of the transmitters in the sports hall.
Figure 9 shows the distributions for one of the sources made using measurements (first RSSI distribution) and simulation methods.
2.6.3. Scenario 3 (S3): Indoor Environment from IPIN Resources
The third scenario was based on real data collected by researchers from the Italian National Council of Research in Pisa [
41], whose studies provide links to a rich database of measurements carried out in an indoor environment. We decided to use the Pisa data to validate our approach using an external data source.
The geometry of the indoor environment was also provided in [
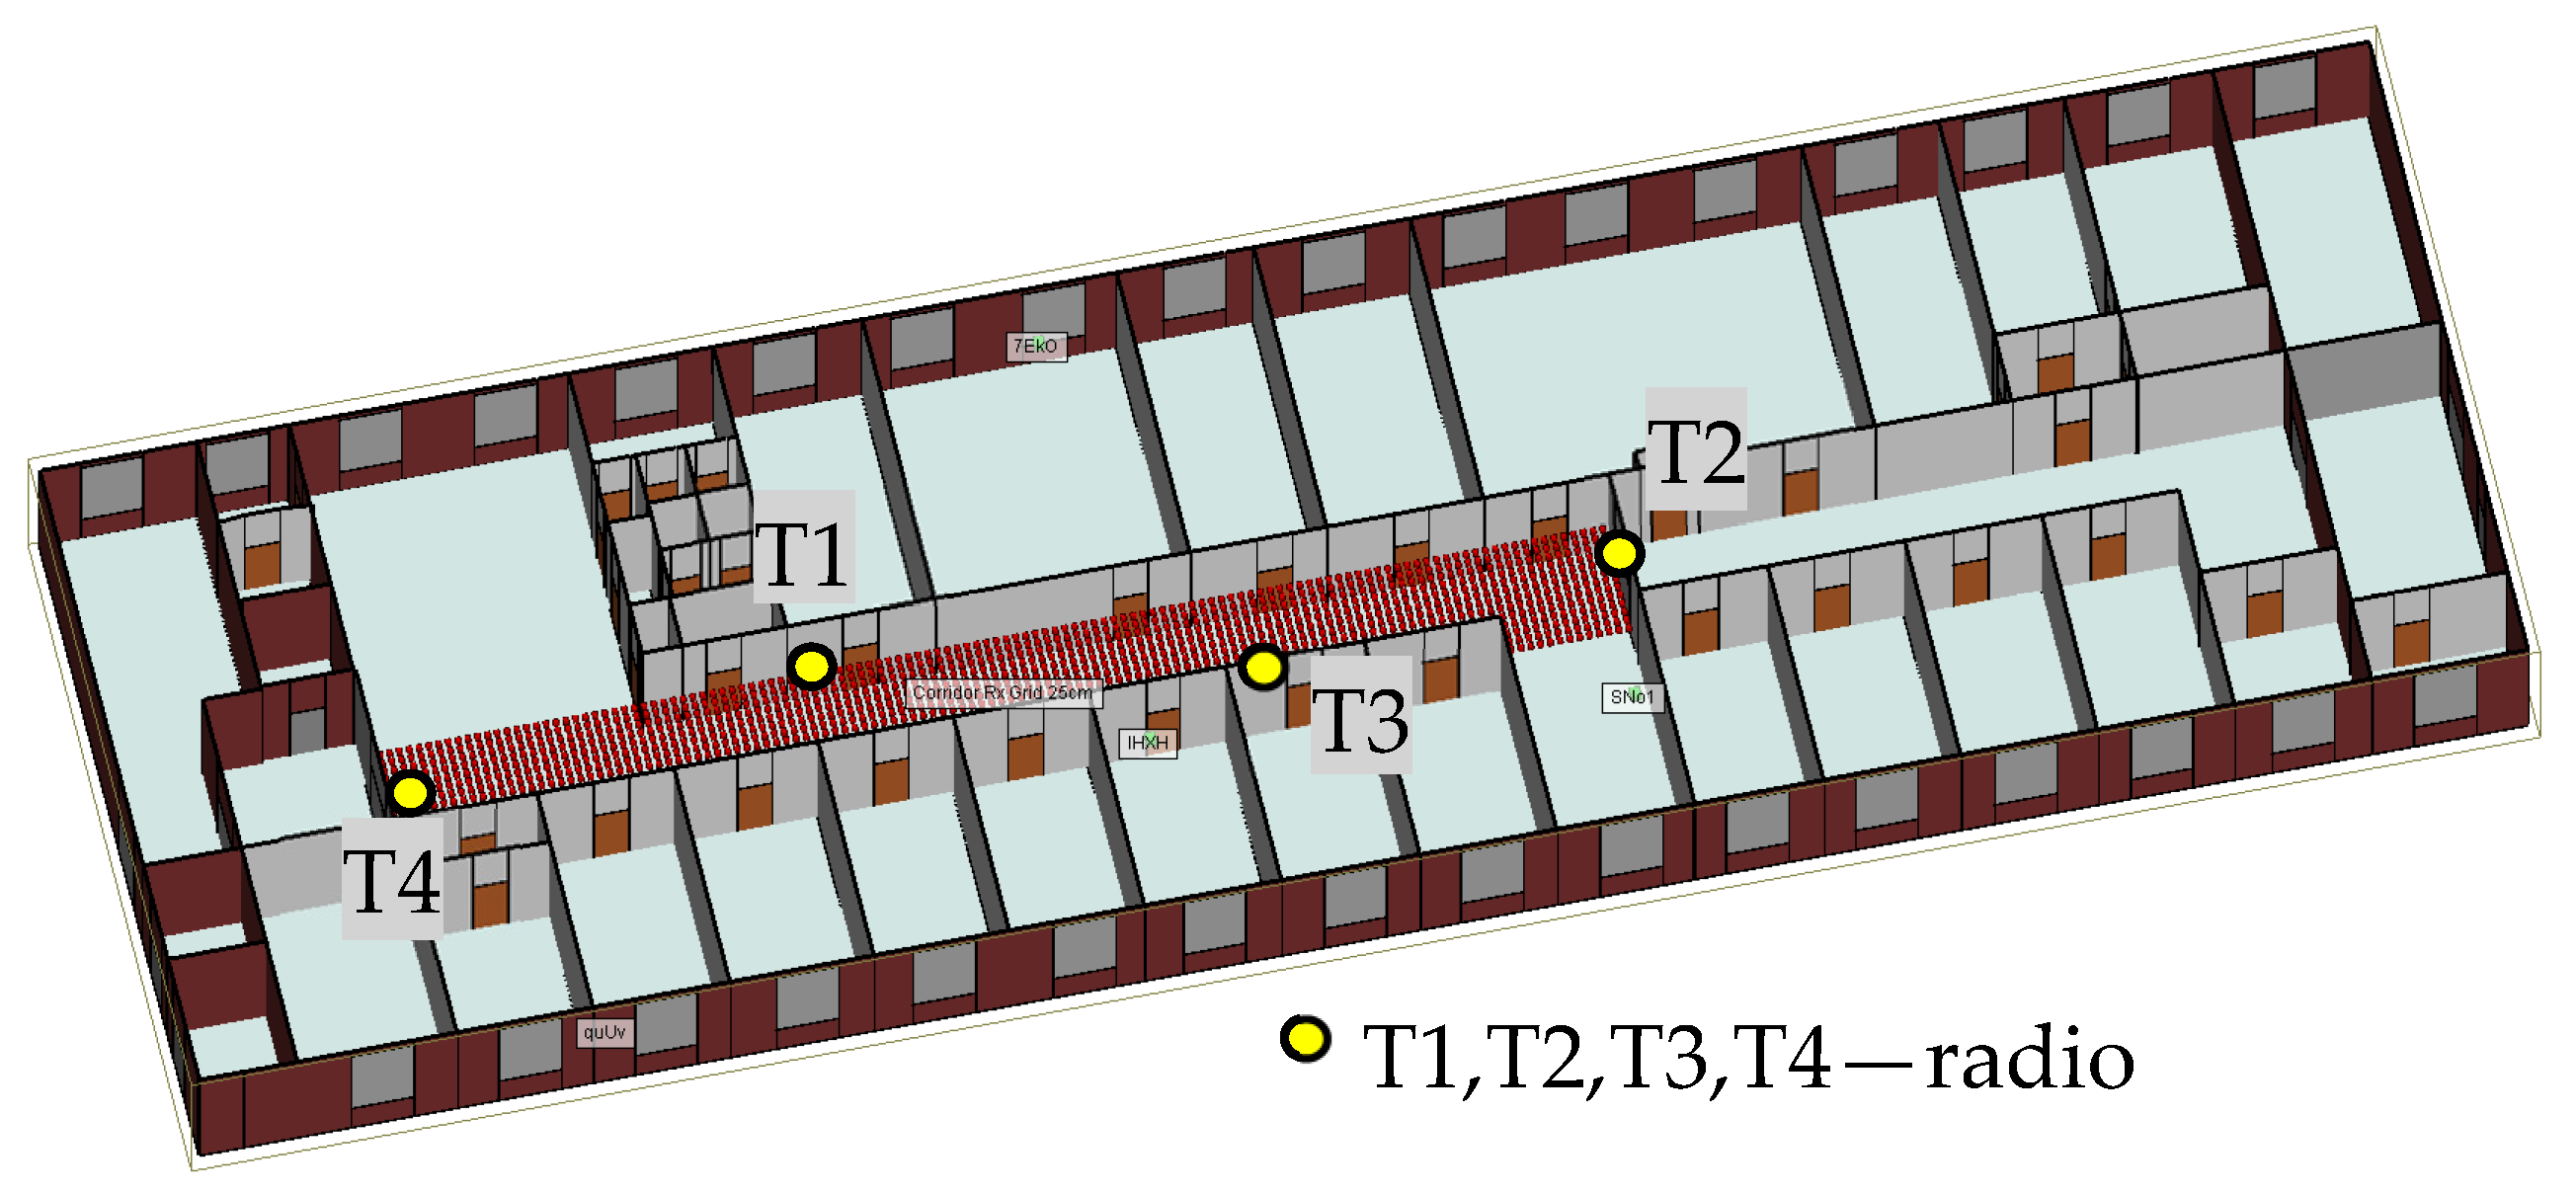
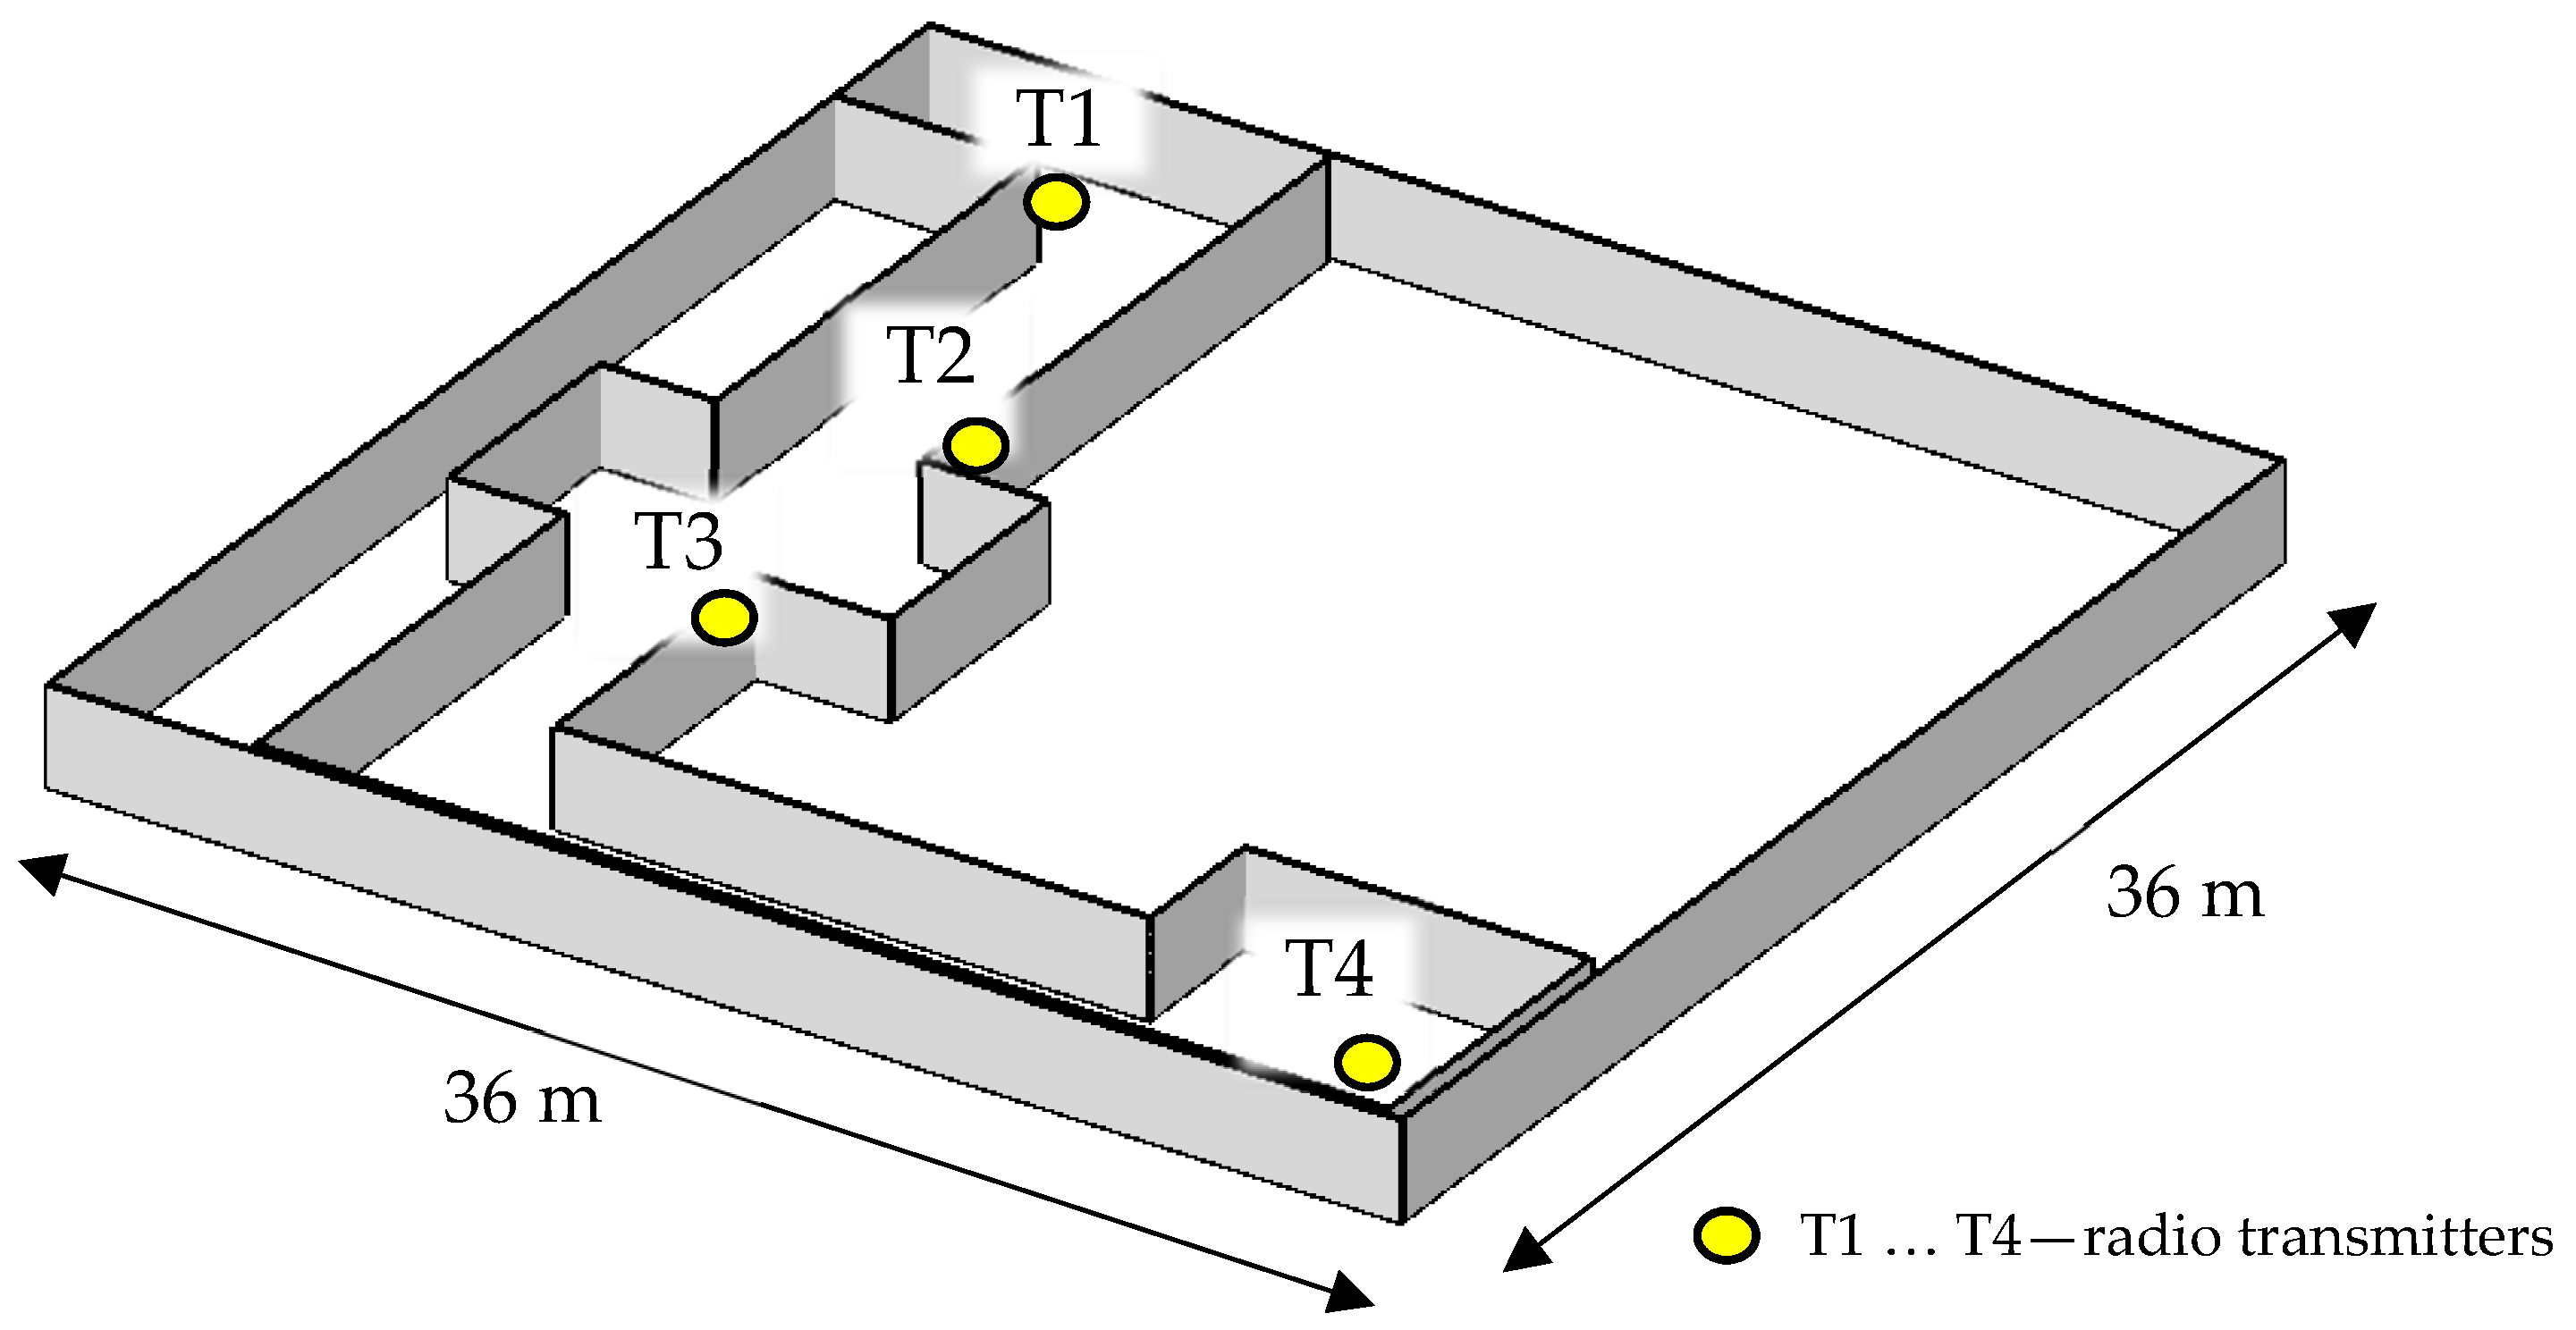
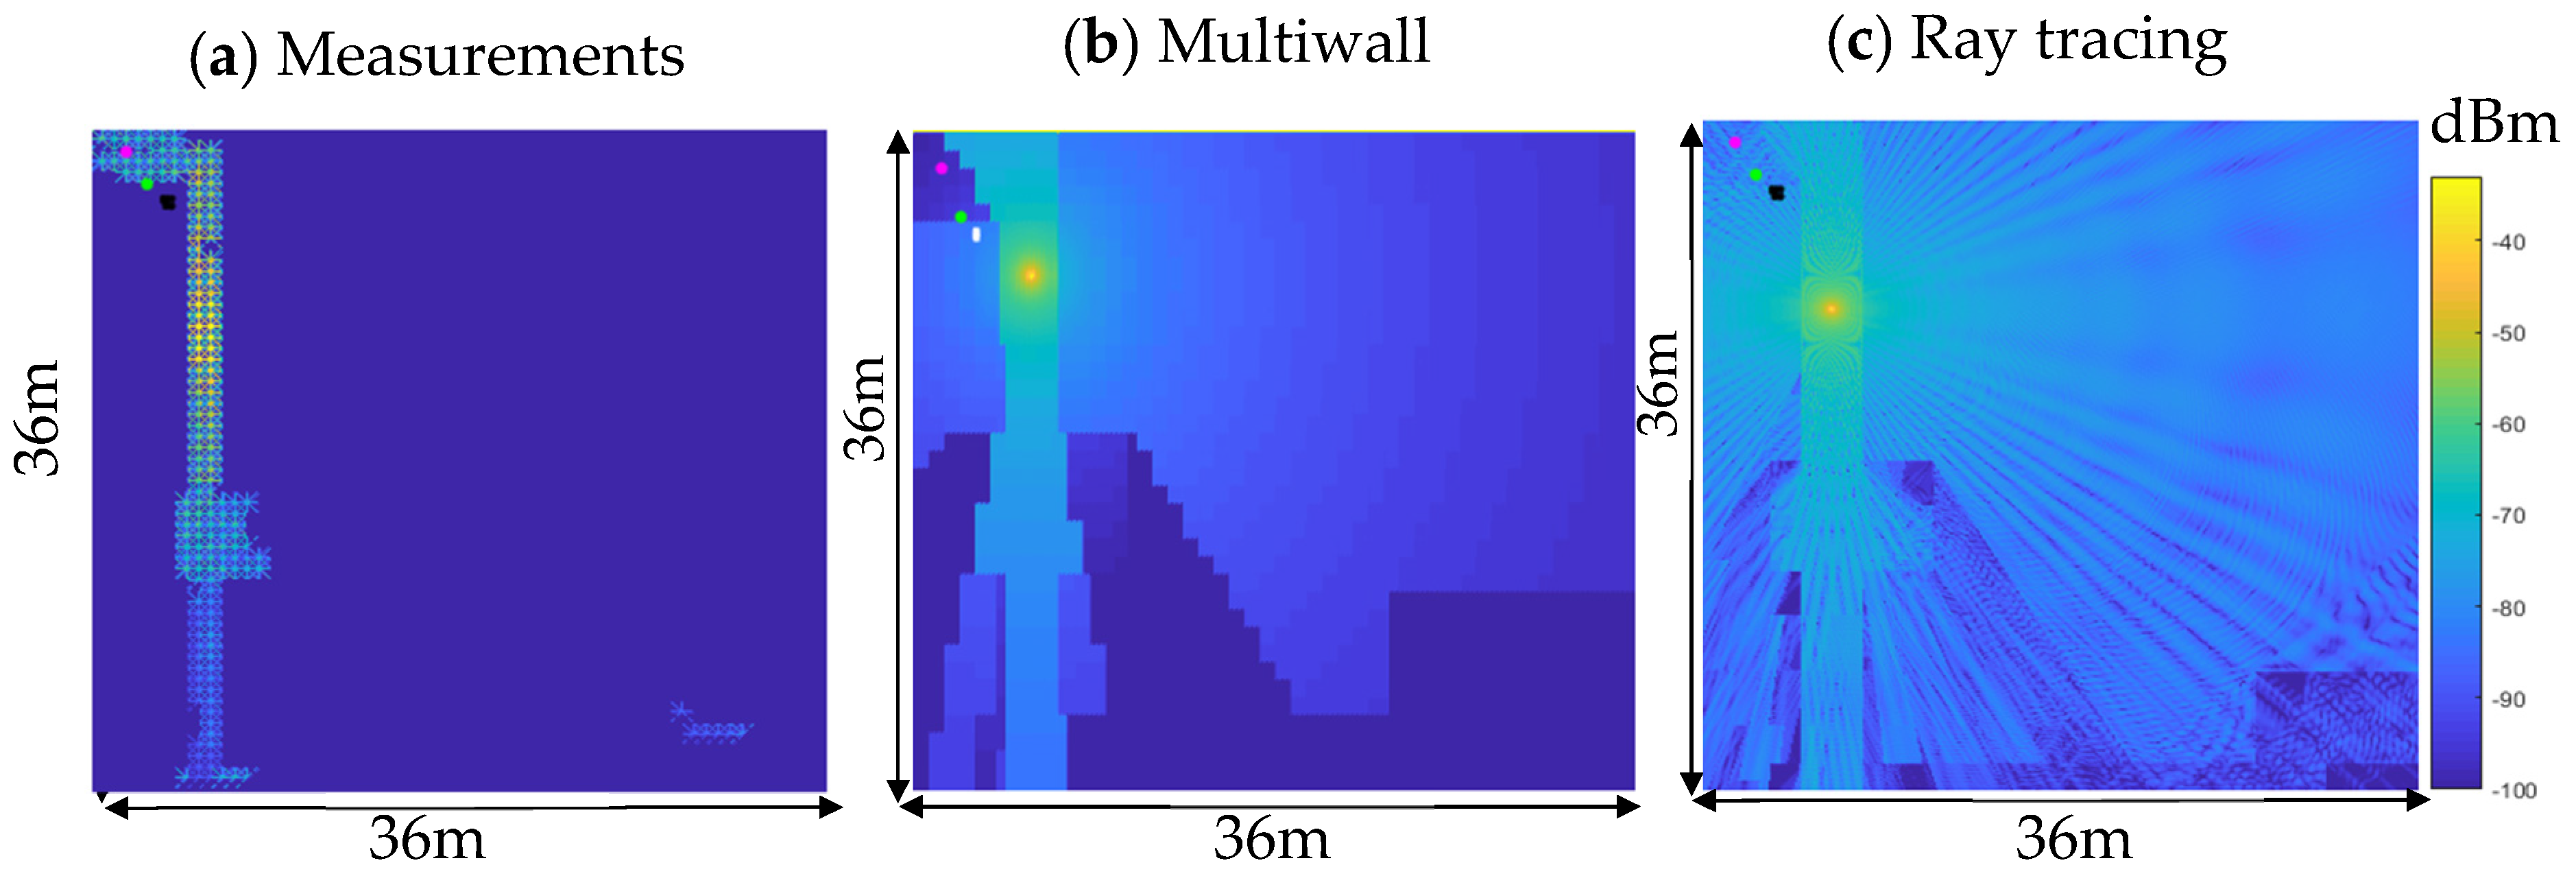
41], so it was possible to model the spatial distribution of the received power using simulation methods. The dimensions of the building were 36 × 36 m. However, the database contains measurements collected only along the two perpendicular sections of the corridor, as illustrated in
Figure 10 and
Figure 11. Simulated reference RSSI distributions were prepared for interior areas corresponding to the distribution of RSSI parameter samples from the real dataset and running the location algorithm. For this purpose, it was necessary to prepare a model of the indoor environment. The model included four radio transmitters located on the main corridor of the environment. A fragment of the building model is presented in
Figure 10.
Reference RSSI distribution datasets were generated using the programs described in
Section 2.4.
Figure 11 shows a graphical representation of the RSSI distribution maps generated by the different methods.
The software implemented as part of this research allows the creation of simulated routes of the mobile terminal movement in the building. At each point in the terminal path, the algorithm collects input data (measured RSSI values for each of the available transmitters). Then, the location algorithm described in the previous chapters assigns the measured RSSI values to the corresponding points on the building map. The generated reference RSSI distributions are the source of data for the location algorithm. They allow the location to be estimated based on the real measured RSSI values for a given location in the building.
2.6.4. Comparison of RSSI Maps
Table 2 summarizes the test scenarios presented in this section. In addition, a short description is given of each scenario to illustrate each indoor environment.
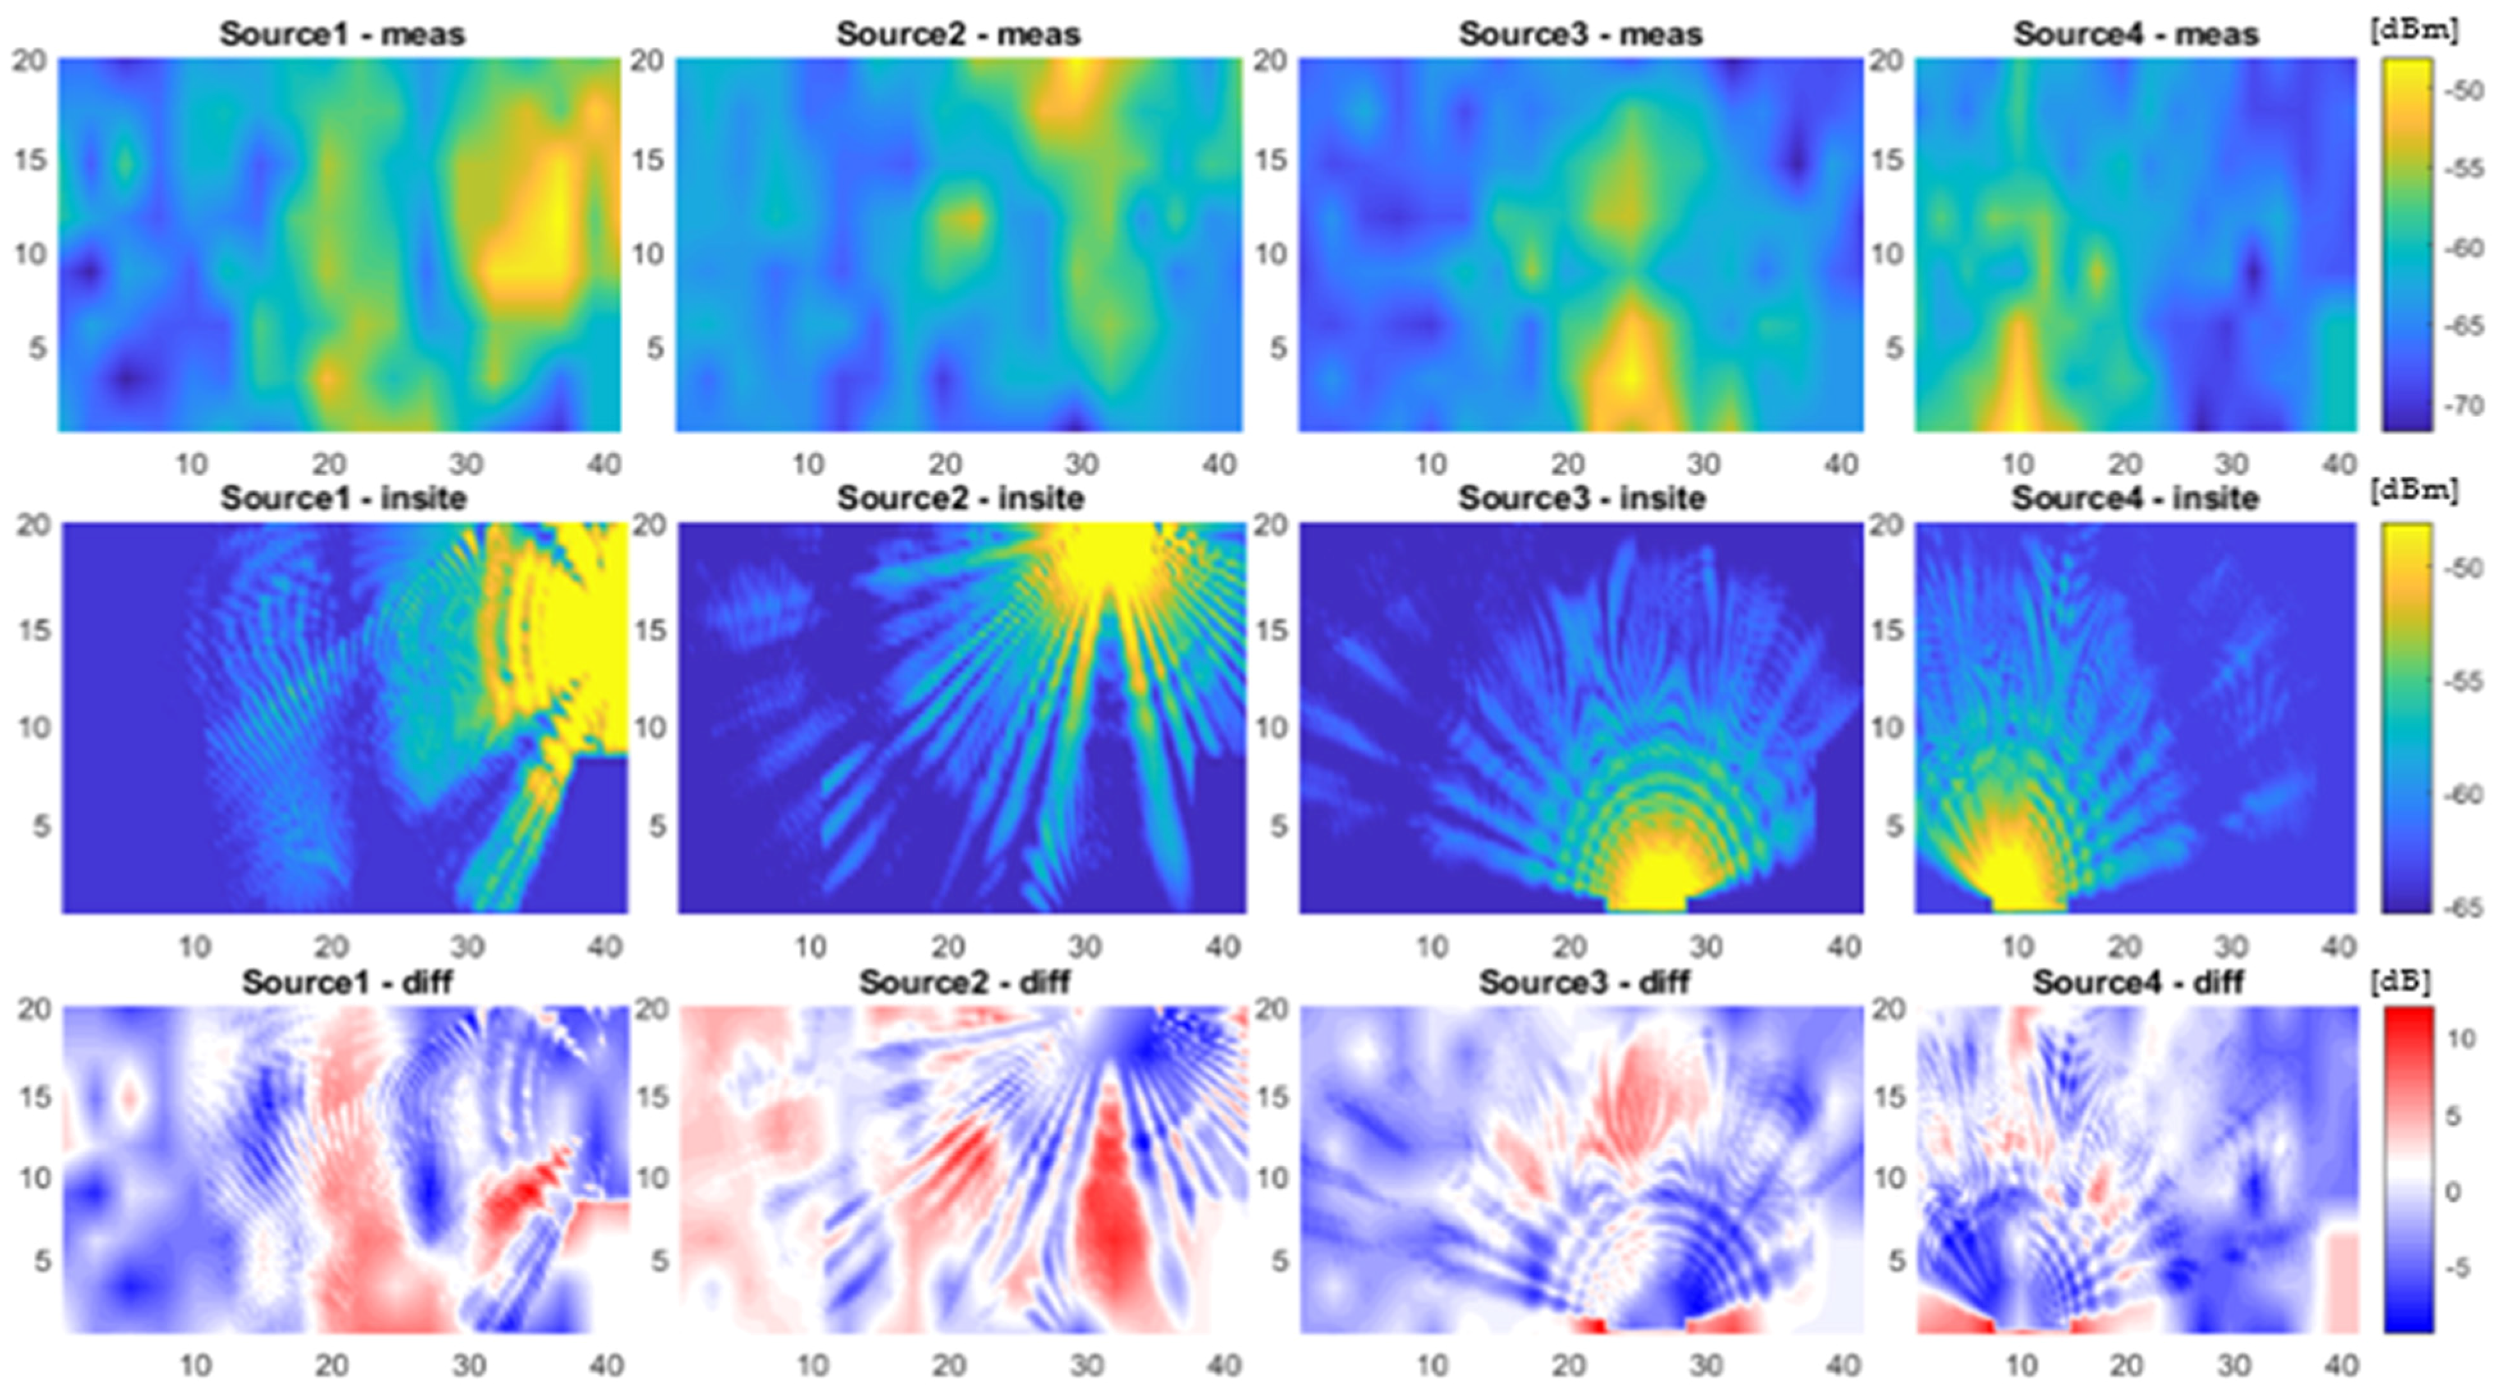
2.7. Comparison of Maps Created by Measurements with Maps Generated by Computer Simulations
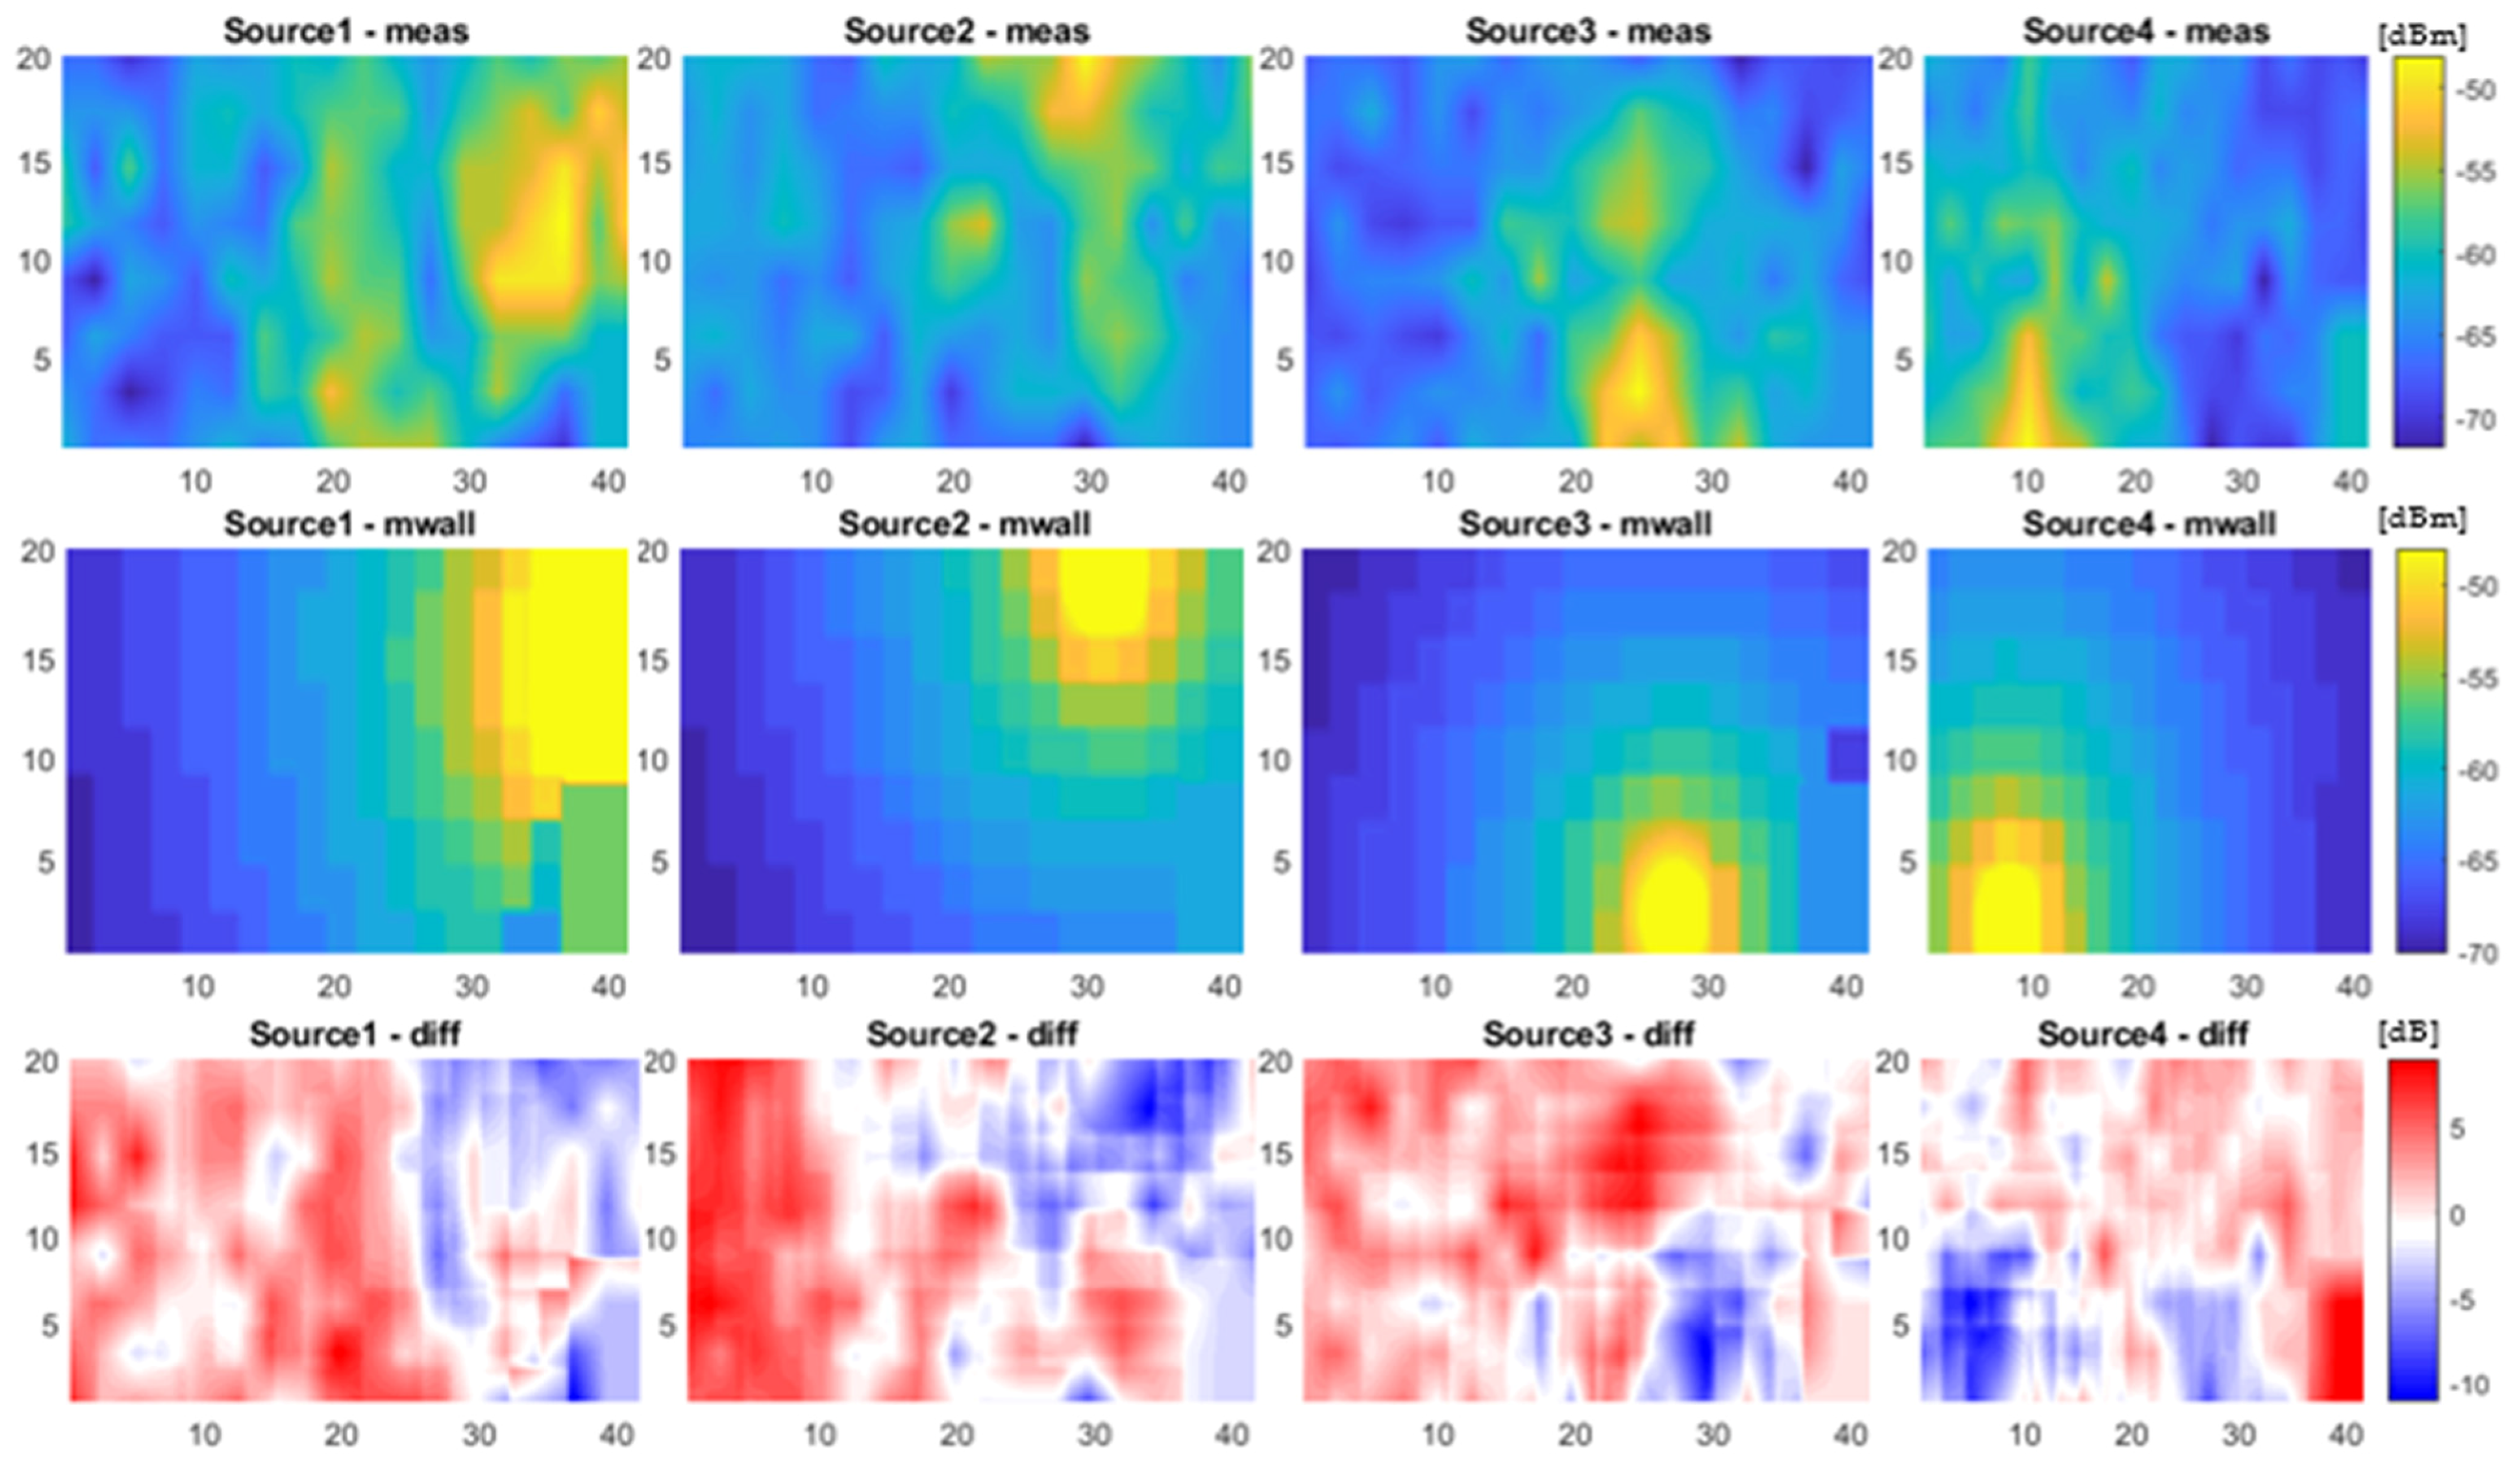
The reference RSSI maps created by measurements were compared to those generated by computer simulations (i.e., using ray tracing and multiwall methods). The difference was calculated between the RSSI readings measured and stored in the matrix and the values read from the simulated maps. For the purposes of comparison, we used the RSSI distributions for S2 (the sports hall in the “Sports Bay”). The results are illustrated in
Figure 12 and
Figure 13. The third row of the graphics shows the differences (subtraction) between the maps made from measurements and those generated using computer simulations. The comparison was made for the two considered simulation methods—i.e., ray tracing (
Figure 12) and multiwall (
Figure 13).
Because the RSSI values obtained using measurements were not produced in such a dense grid as those generated by computer simulations, linear interpolation was used.
Considering the fundamental differences between the ray tracing model, the multiwall model, and the measurements, the standard deviation values shown in
Table 3 (from 3.03 to 5.40 dB) can be considered reasonable for engineering applications. In particular, it should be observed that the multiwall method does not consider fast fading whereas ray tracing does.
3. Results
In this study, we investigated the accuracy of fingerprint-based positioning using RSSI reference maps created from measurement campaign data or from simulations using multiwall and ray tracing models. To simulate the movement of a user across the indoor environment area, subsets of RSSI power measurements corresponding to power measurement readings for predefined user movement scenarios were created.
Figure 14 shows an example route for a terminal in a building. The readings were used as reference data for the selected localization method, to verify the quality of the simulated RSSI maps. The algorithm described in
Section 2.2 estimated the location of the terminal based on the RSSI maps created for a set of transmitters located in the building and the corresponding RSSI reference maps.
To verify subsequent test cases, the movement of the user in the building was simulated along a designated straight path. In the first scenario (S1), a route was planned along a corridor at the Institute of Electronics, Lodz University of Technology. In the second scenario (S2), the path was a straight line through the middle of a sports hall, “Sports Bay” at Lodz University of Technology. The third scenario (S3) was a simulated model, where the path was along a straight part of a corridor where T1, T2, and T3 transmitters were located, as depicted in
Figure 10.
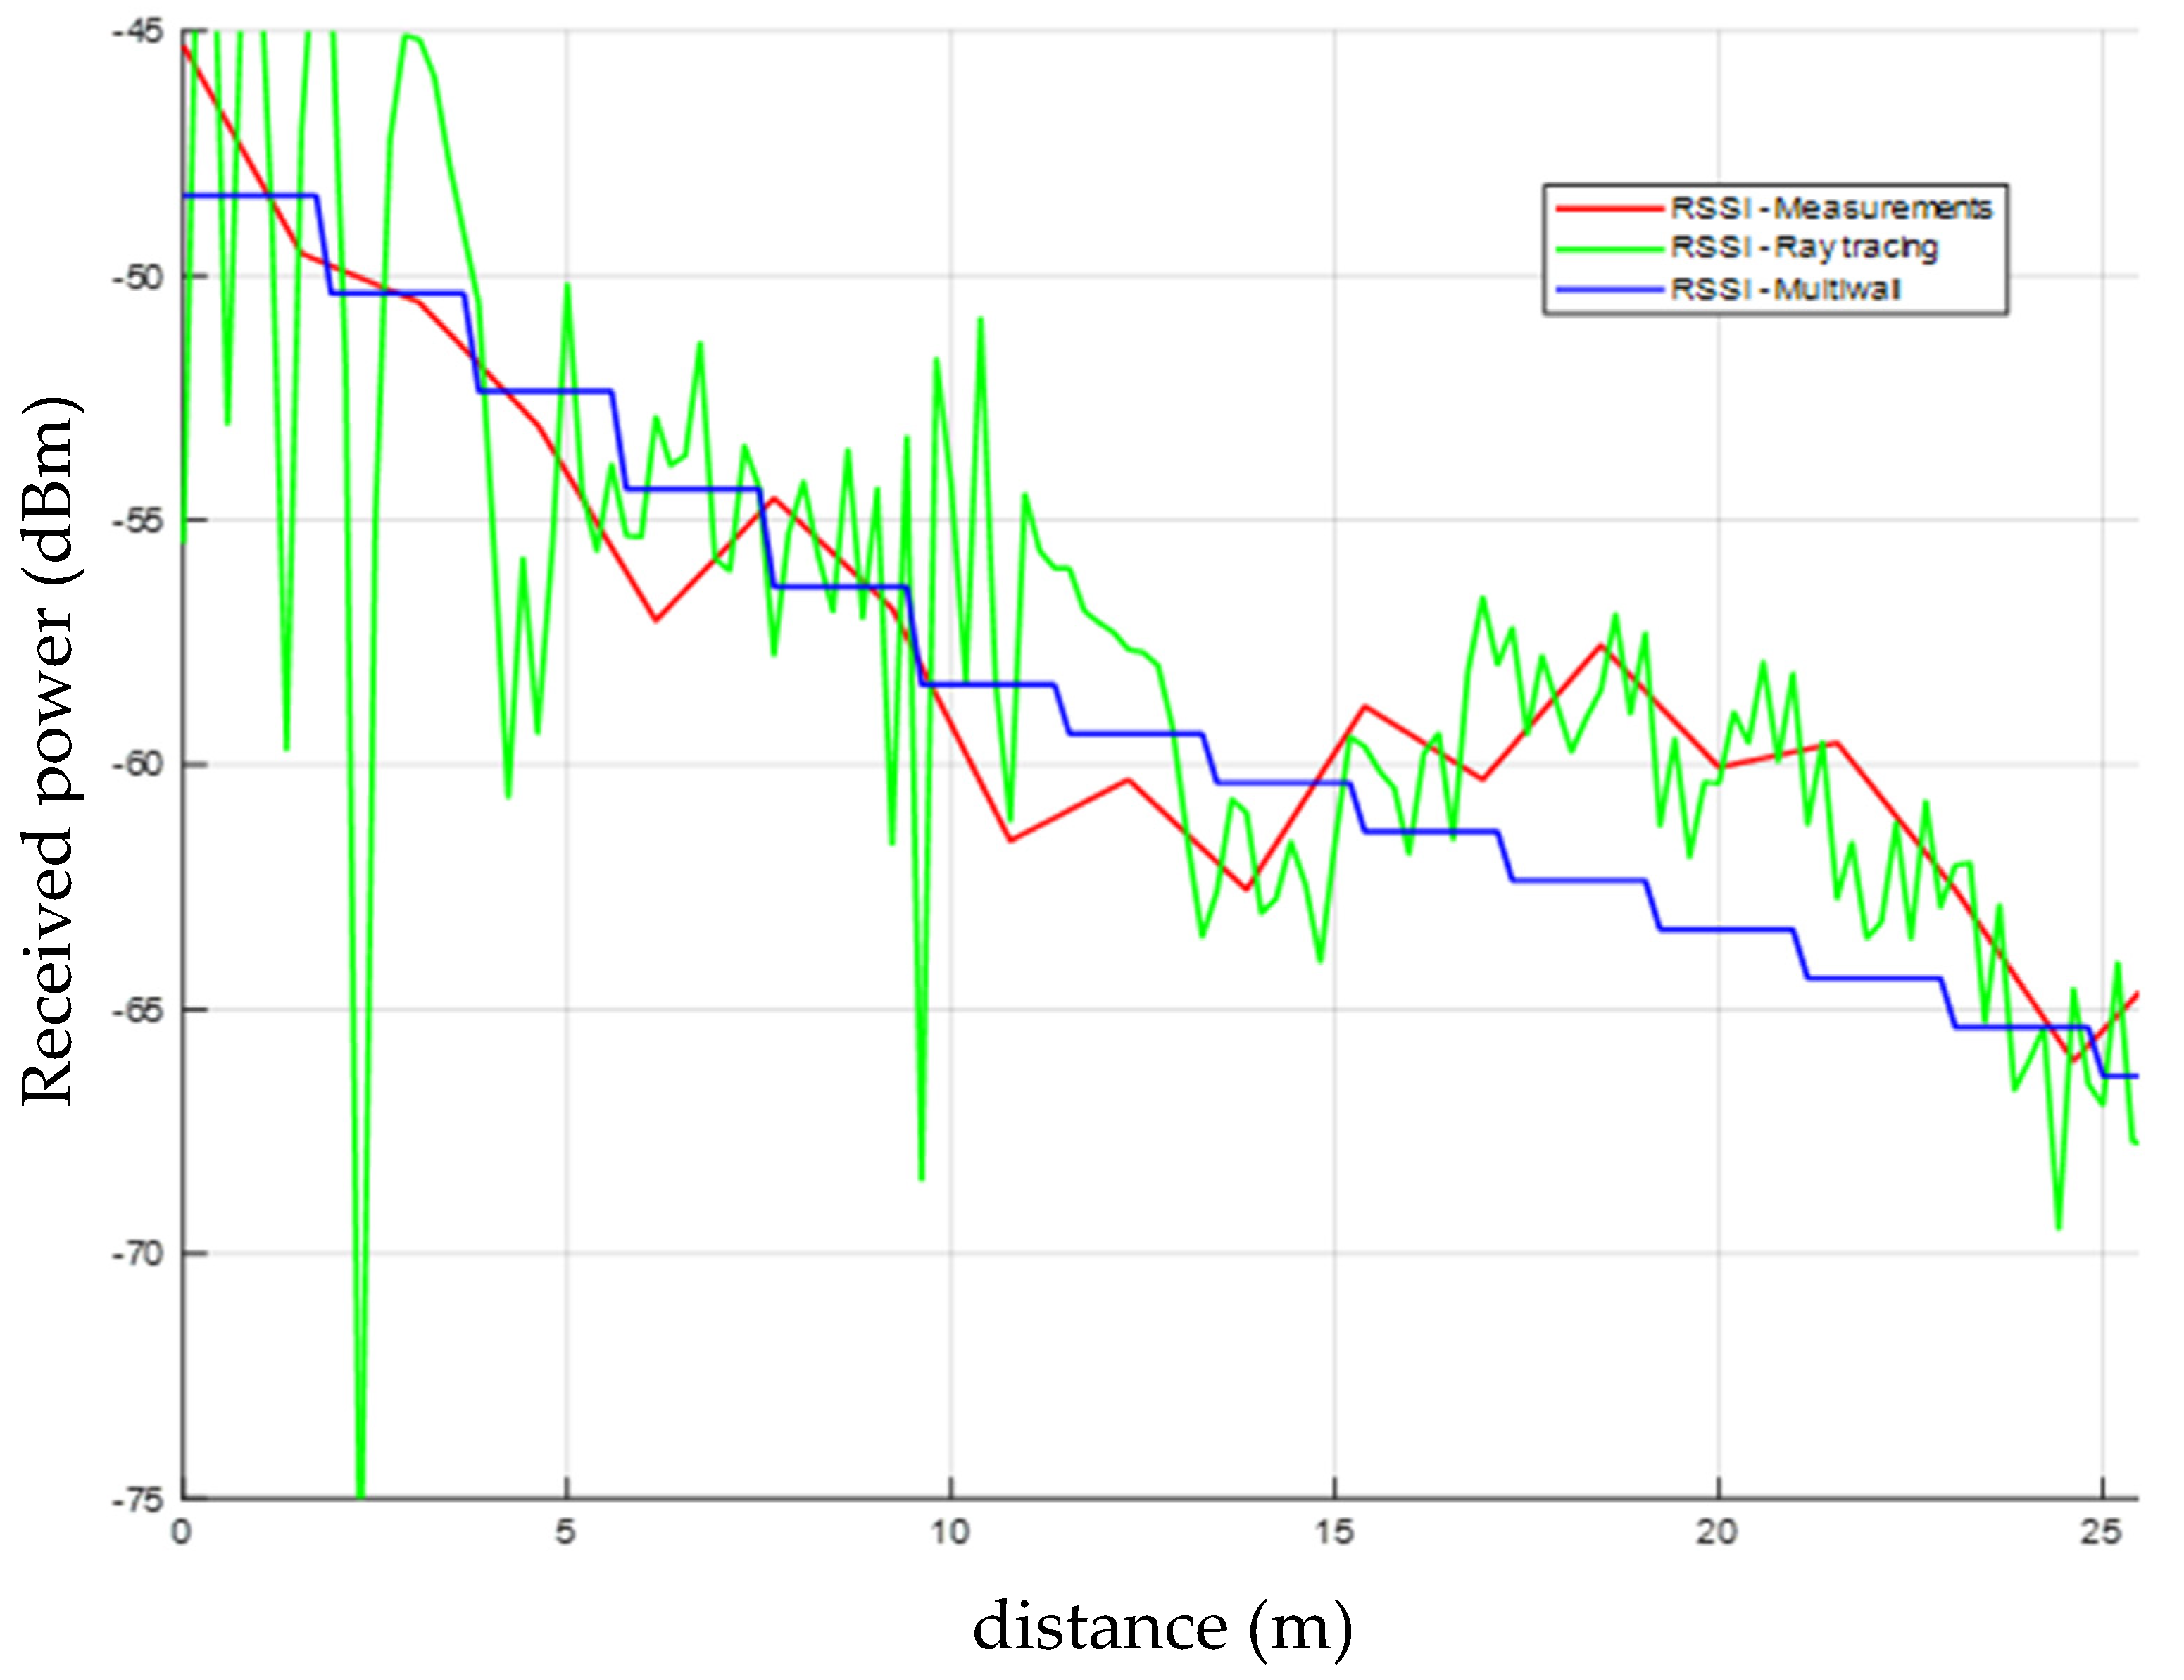
Figure 15 shows example RSSI distributions along the terminal movement path generated for S2. The red line shows the values measured by the mobile terminal as it moved along the designated test route. The other lines show data created by computer simulations (i.e., data retrieved from a database simulated at points corresponding to the user’s path in a real building environment). The green line represents the RSSI distribution simulated using the ray tracing method. The blue curve shows results for the multiwall model. As can be seen, the simulated RSSI values are in good agreement with measurements. This is discussed quantitively in
Section 2.6.4. In the case of the ray tracing model, deep fades can be observed which, due to the hardware limitations of the mobile terminal, are not observed in the measured data. The multiwall model allows only a rough estimation of the signal strength for a given route, without accounting for multipath propagation due to reflections or diffraction. The higher RSSI values for distances between 15 and 23 m can be attributed to multipath propagation (including reflections from the floor, the ceiling, and the surrounding walls), which may result in constructive superposition of waves at some locations.
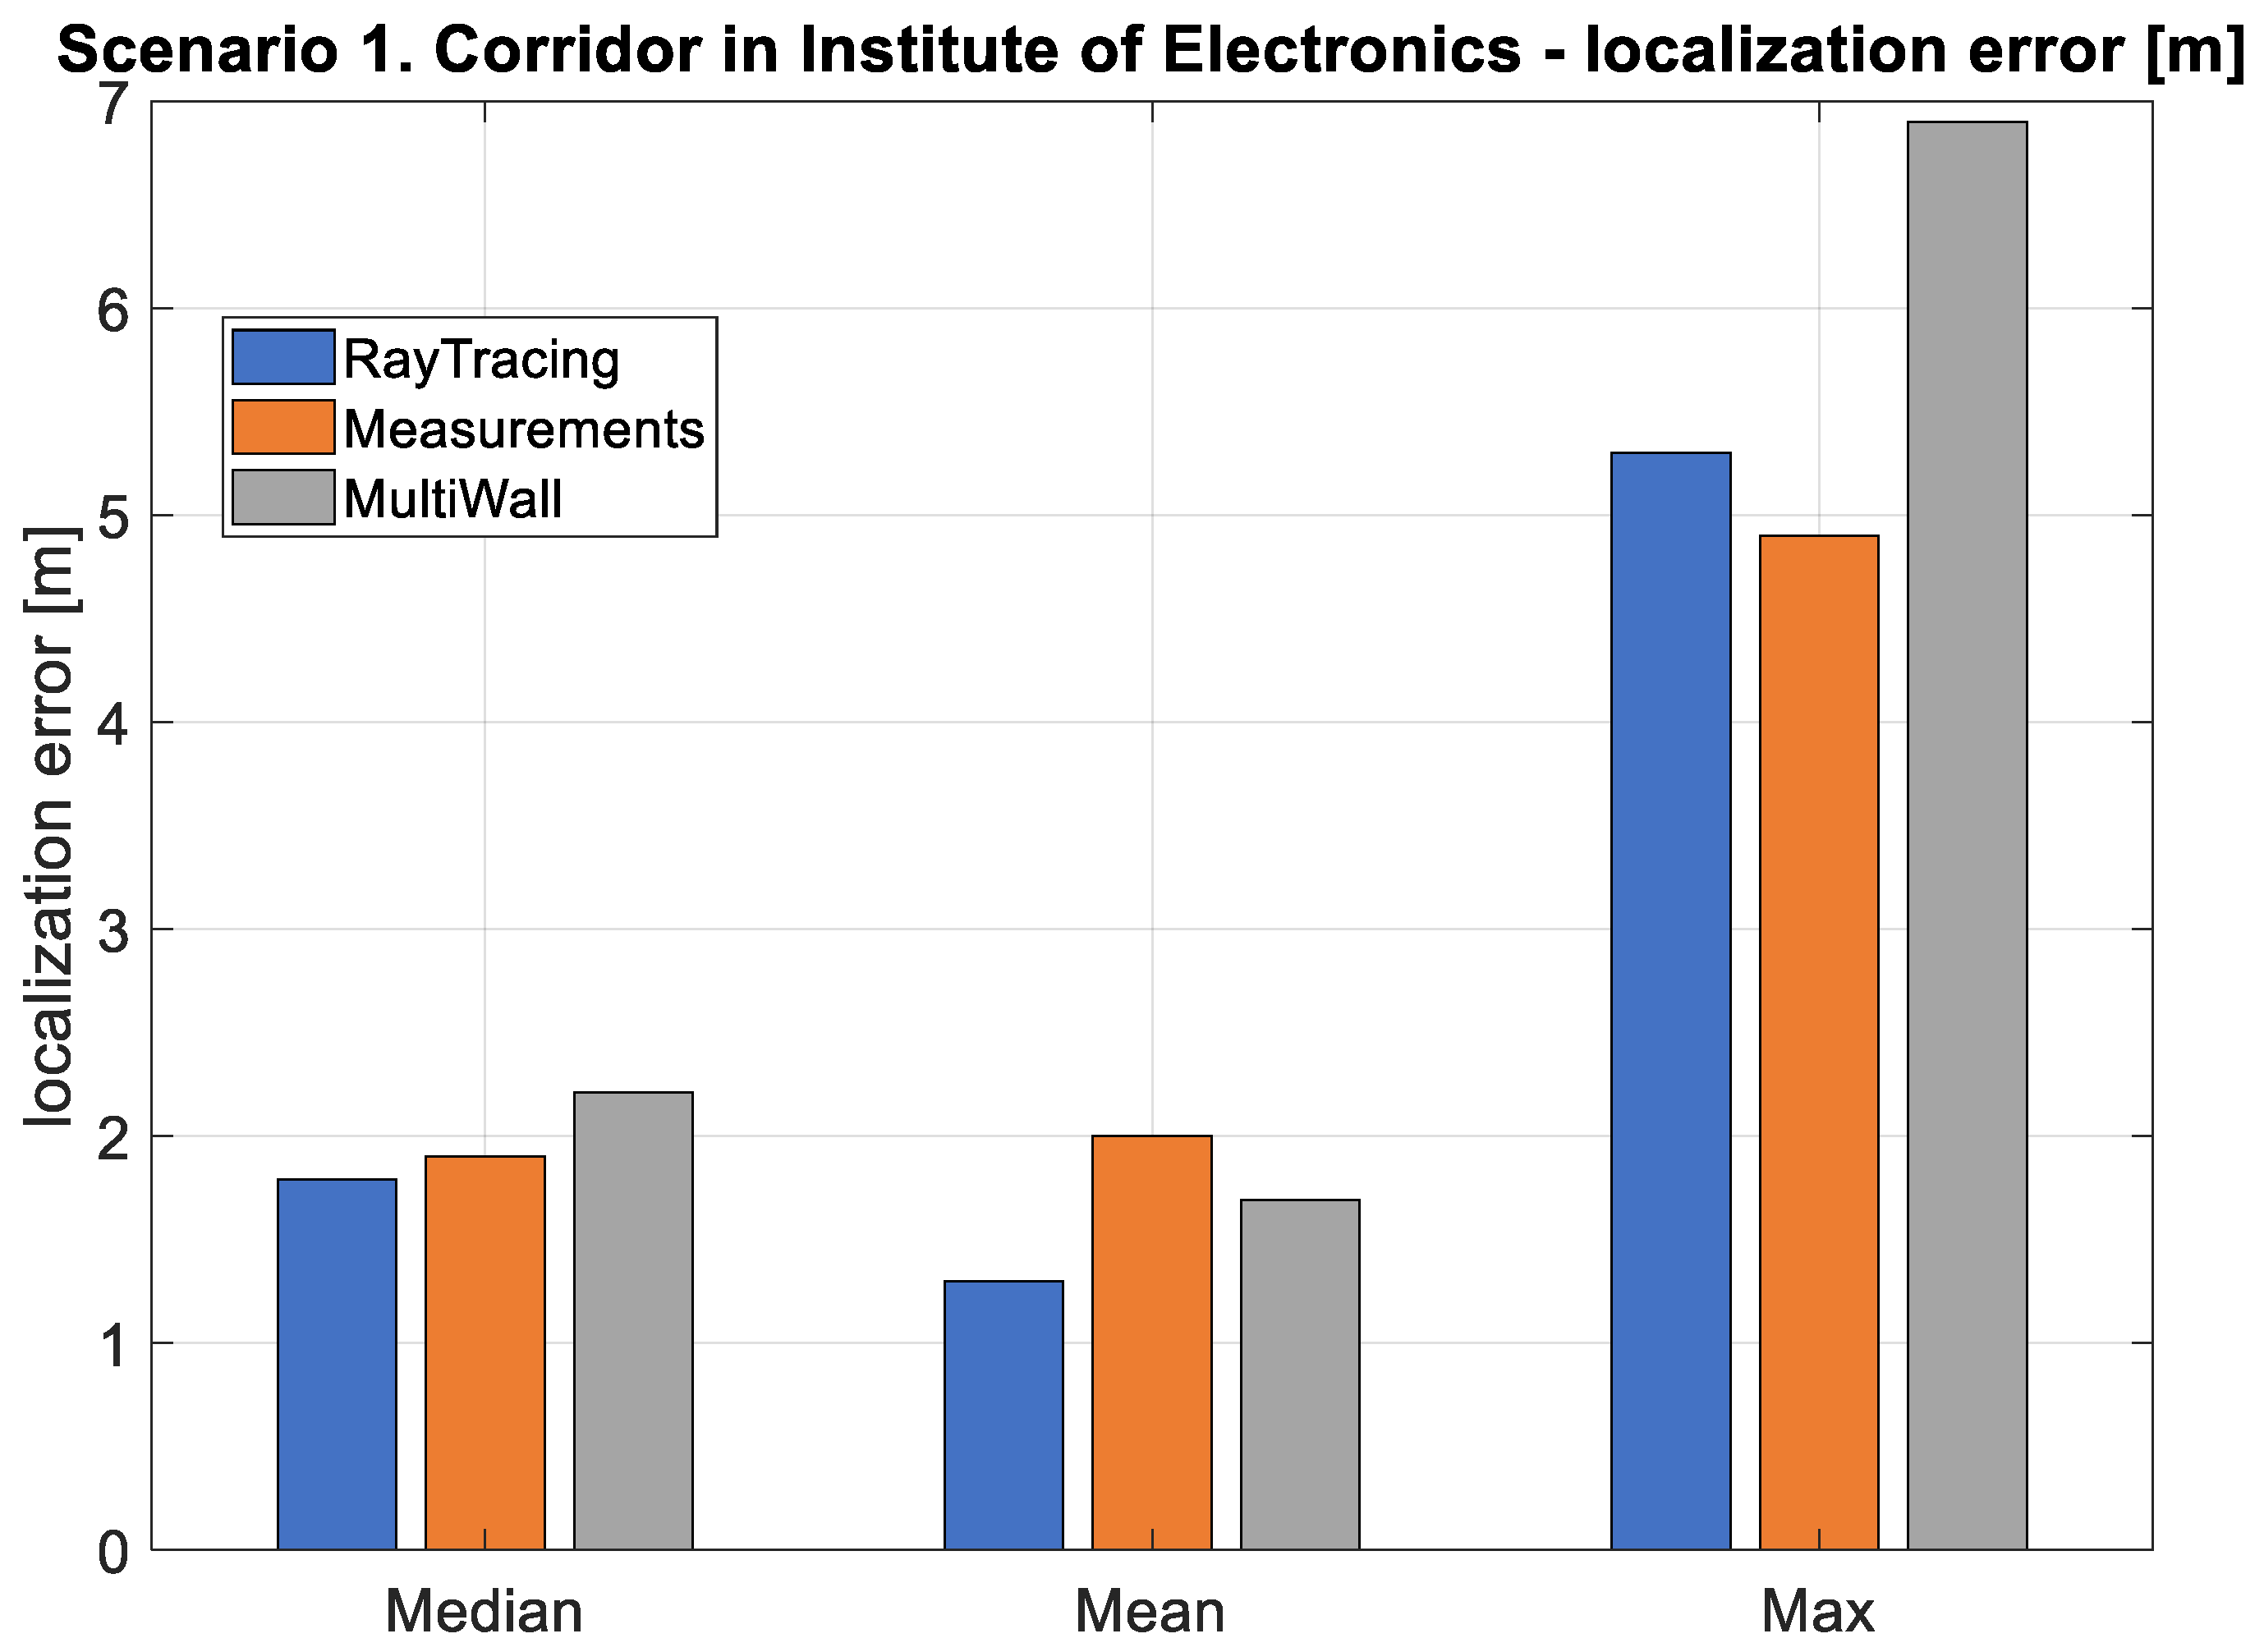
The localization error was verified for the indicated paths. We used a dedicated simulation platform that enabled the reference RSSI databases and location algorithms to assess the positioning error. The aim was to assess how the simulation data influenced the location algorithm, particularly the location error.
In S1, the smallest median error and lowest mean error were observed with the use of reference data generated by the ray tracing method (
Figure 16). The maximum error value for this scenario was noted for the multiwall distribution.
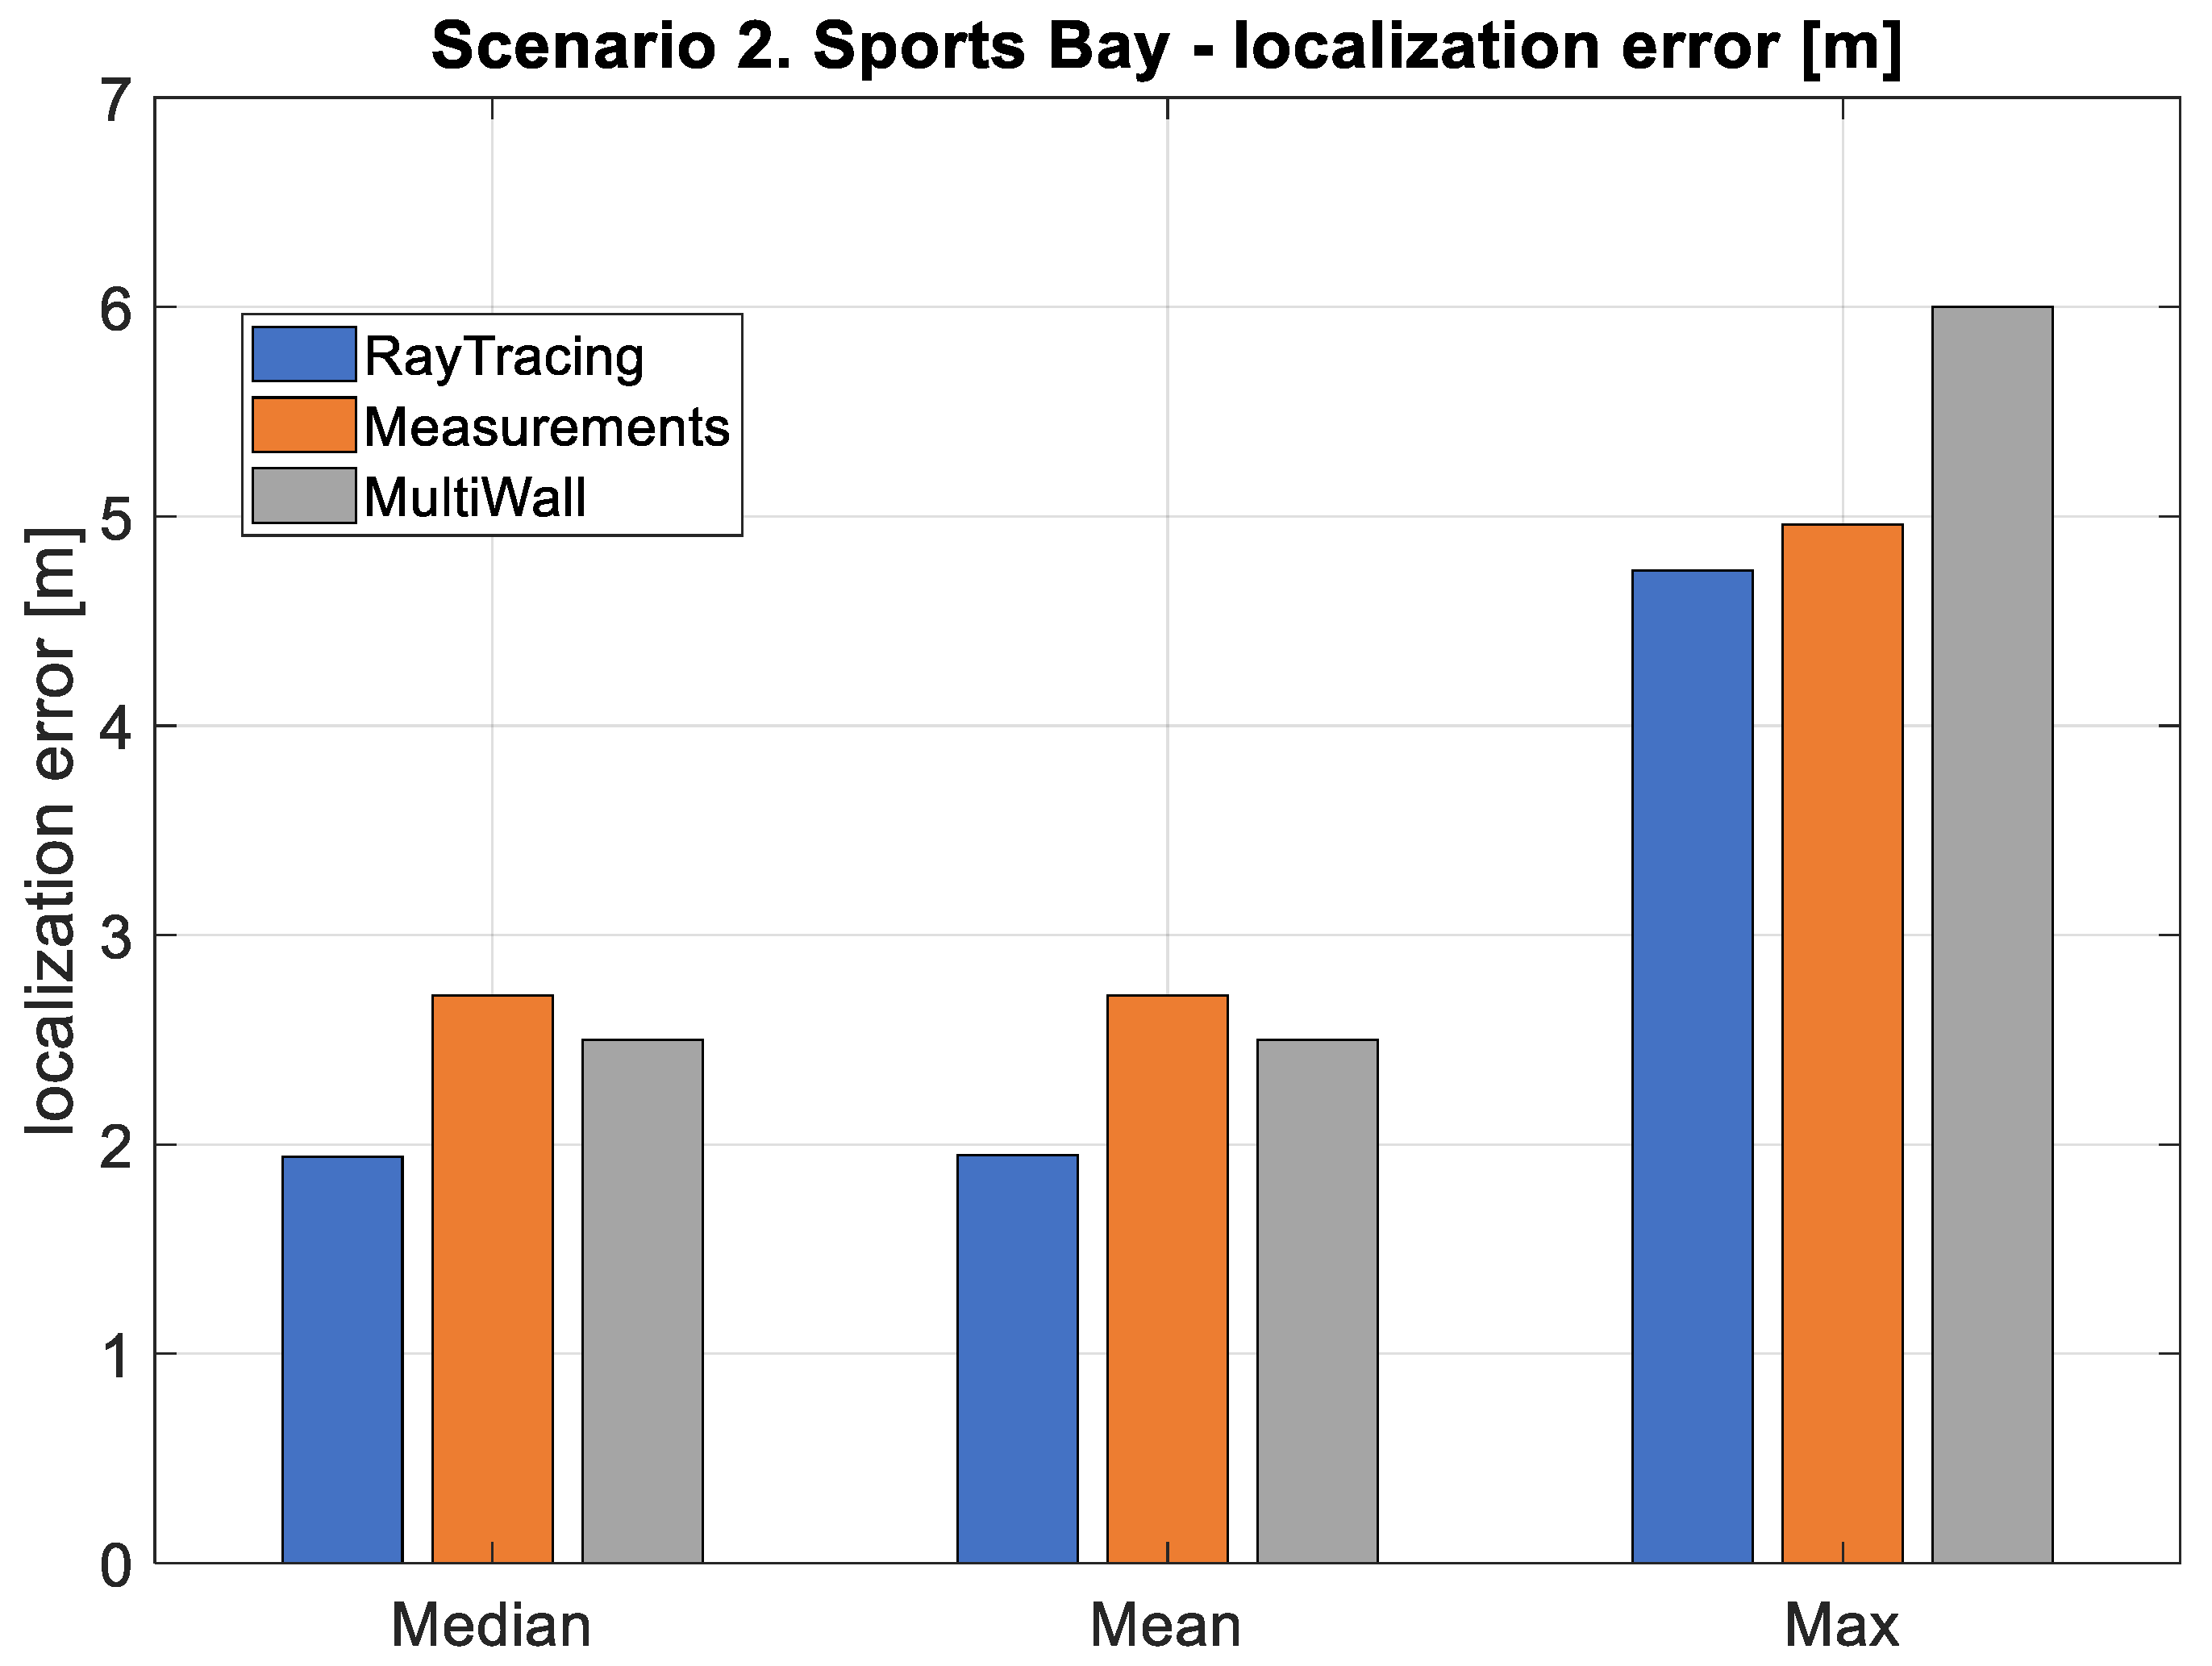
The second scenario (S2) produced similar results. The smallest median error and lowest mean error were measured for the ray tracing method (
Figure 17). In this scenario, the highest maximum error occurred for the multiwall model.
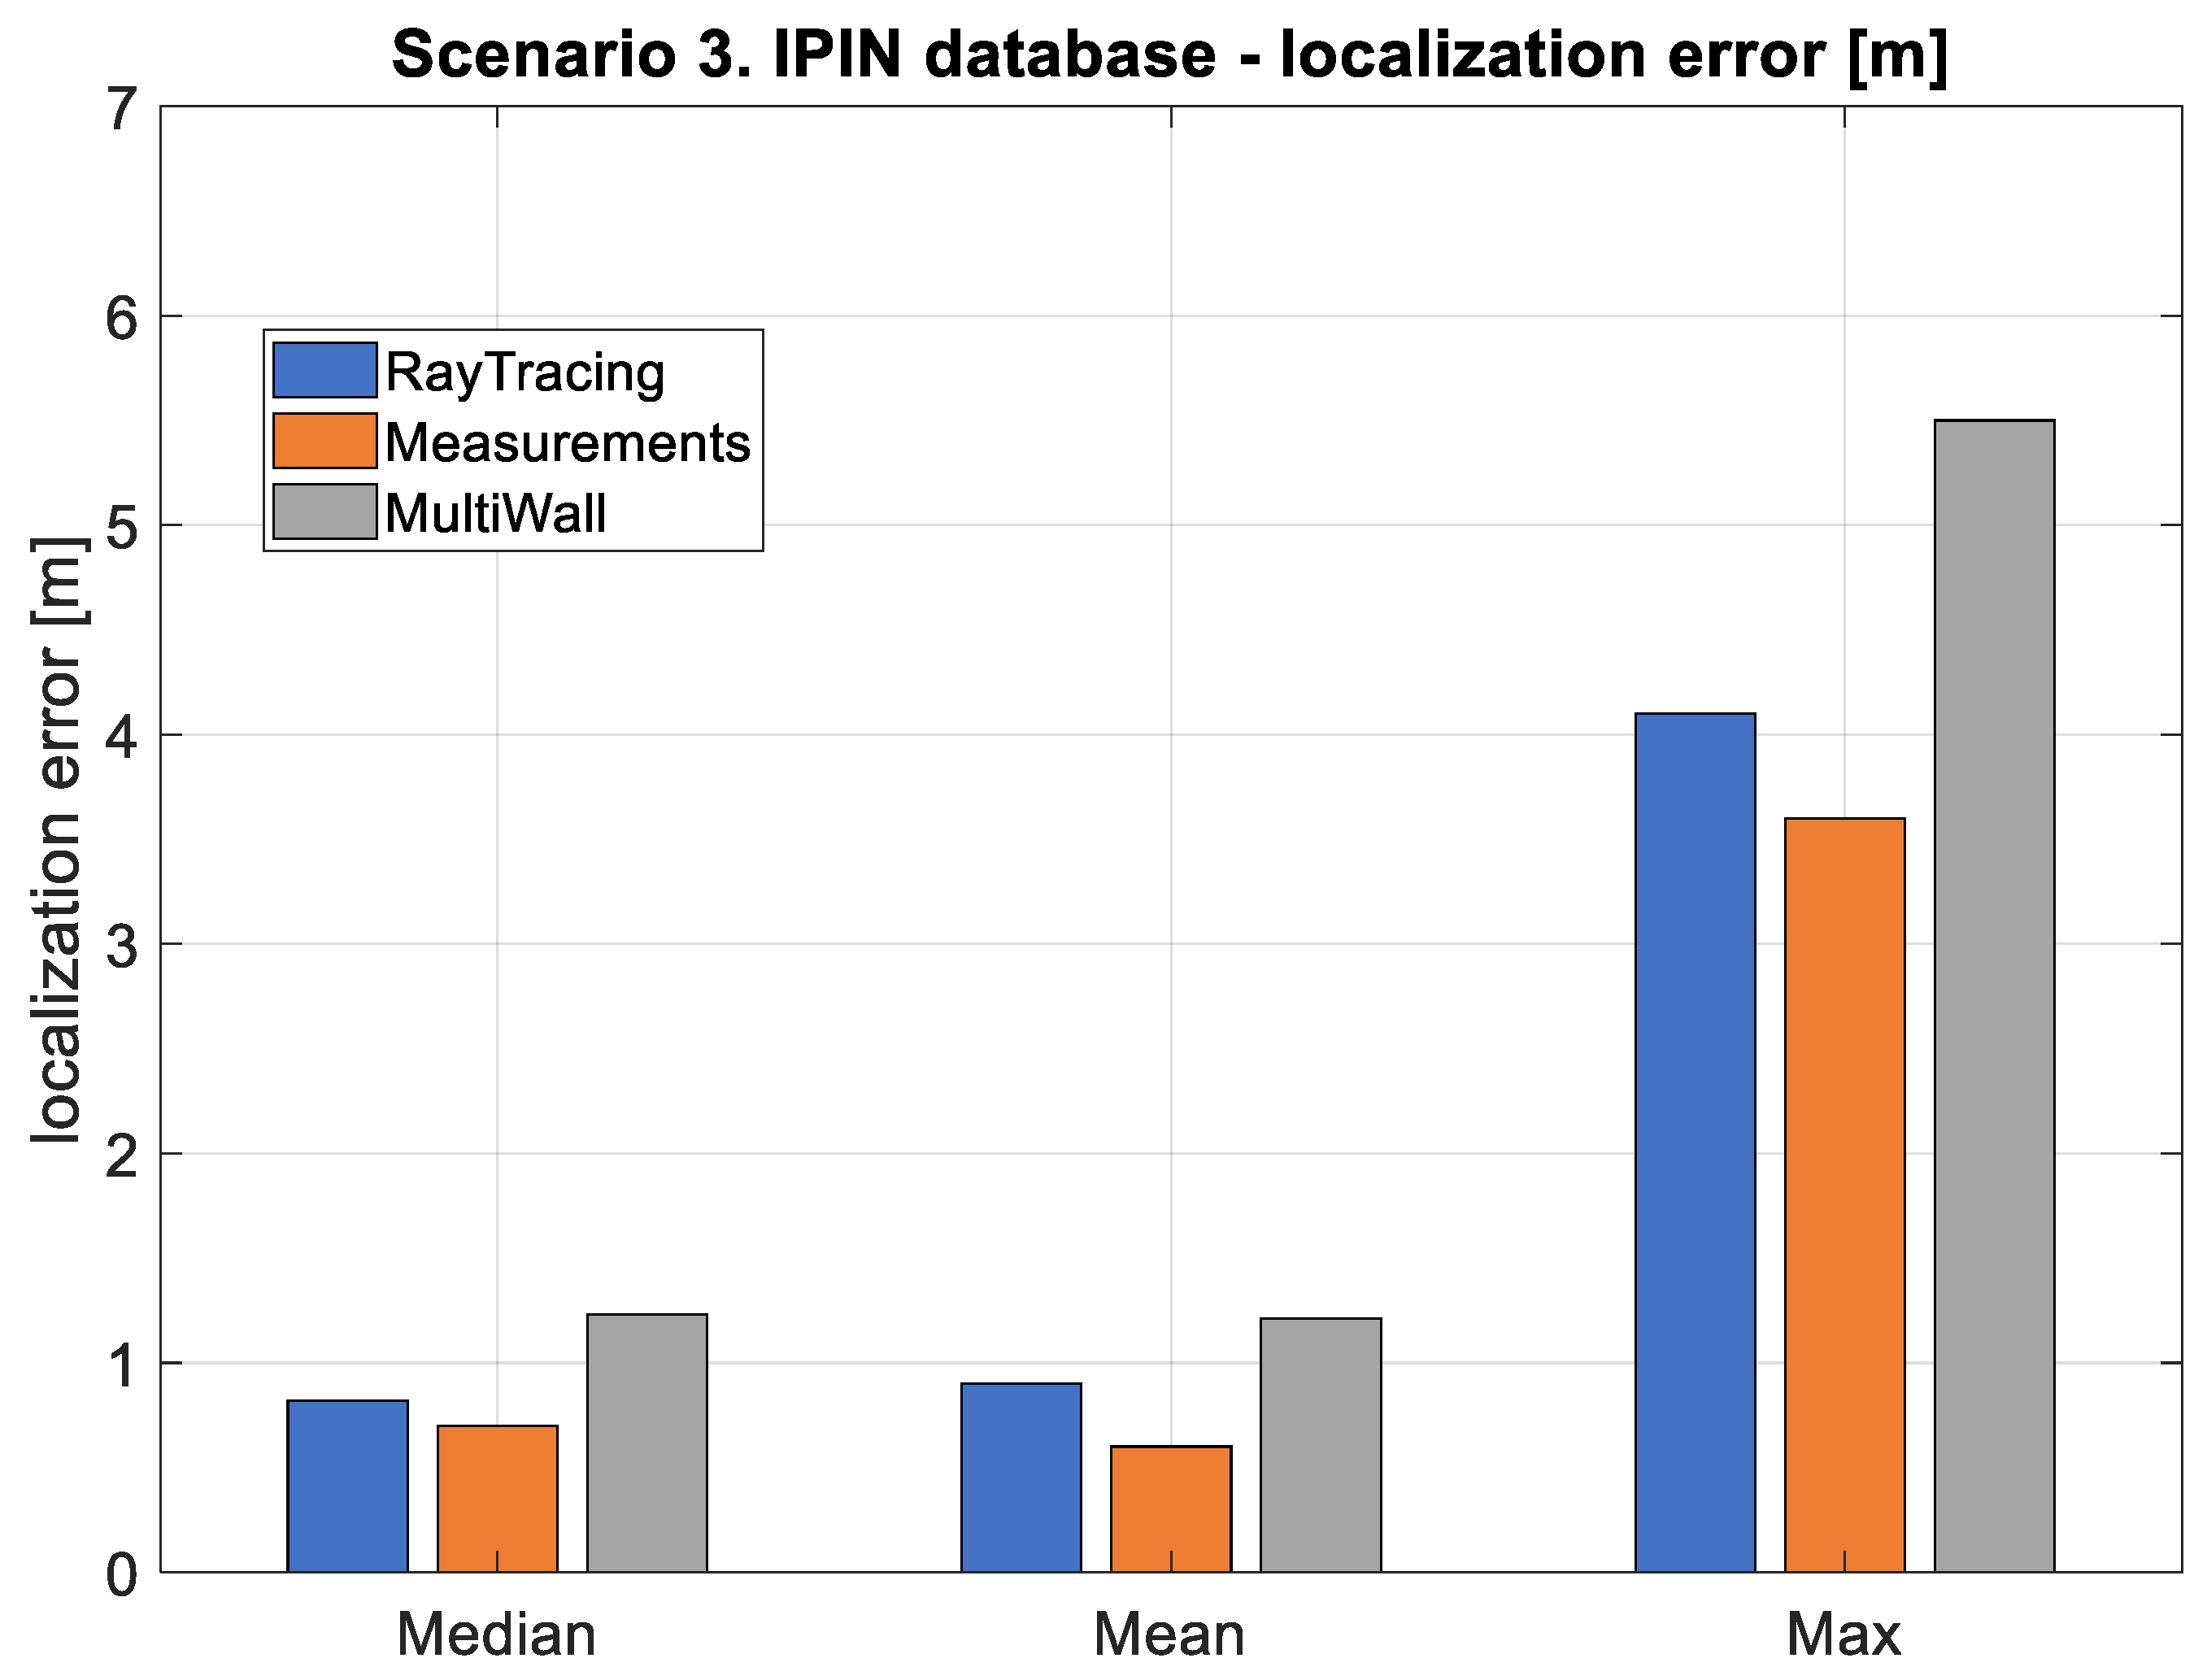
In the third scenario (S3), the smallest error resulted when the calculations were made using interpolated measurement data (
Figure 18). The mean error and the median error were about 1 m. The maximum error was around 3.5–5.5 m. The highest localization error occurred for the multiwall method.
The reference RSSI maps prepared by measurements and computer simulations were tested in three verification scenarios (S1, S2, and S3). Analysis showed that the average error for the simulated RSSI maps was 0.9–1.94 m, the median error was 0.82–1.91 m, and the maximum error was 5.5–6.9 m. The maximum error for the ray tracing method varied between 4.1 and 5.3 m, depending on the scenario. By comparison, the average location error for the measured RSSI maps in the three scenarios was 0.6–2 m, the median error was 0.7–2.71 m, and the maximum error was 3.6–4.96 m. In one of the test scenarios, RSSI measurements from an external, independent IPIN database were utilized, also with satisfactory results. Depending on the test scenario (S1, S2, or S3), the change in the median location error using ray tracing simulated reference maps ranged from 5.8% (0.11 m for S1) to 17.1% (0.12 m for S3), whereas, with the use of the multiwall simulation, the change in median location error ranged from 7.8% (0.21 m for S2) to 75.7% (0.53 m for S3) compared to the results for measured RSSI reference maps. Using the simple and fast multiwall model, the mean and median localization error values were in the range of 1–2 m, which is comparable to the results obtained using the ray tracing method. The positioning accuracy obtained using the simulated maps with our positioning system based on fingerprinting followed by a modified particle filter is comparable to the accuracy achieved by other methods reported in the literature. The application of crowdsourcing and interpolation to construct reference maps reported in [
41] resulted in an average error of 3.44 m (and 2.94 RMSE) for an indoor testbed with an area of 3200 m
2, whereas the average error for the measured RSSI map was 3.31 m (and 2.90 RMSE). The use of the simulated maps compared to the measured maps resulted in median location error changes of between 7.8% (0.21 m for S2) and 75.7% (0.53 m for S3) compared to the measured RSSI reference maps.
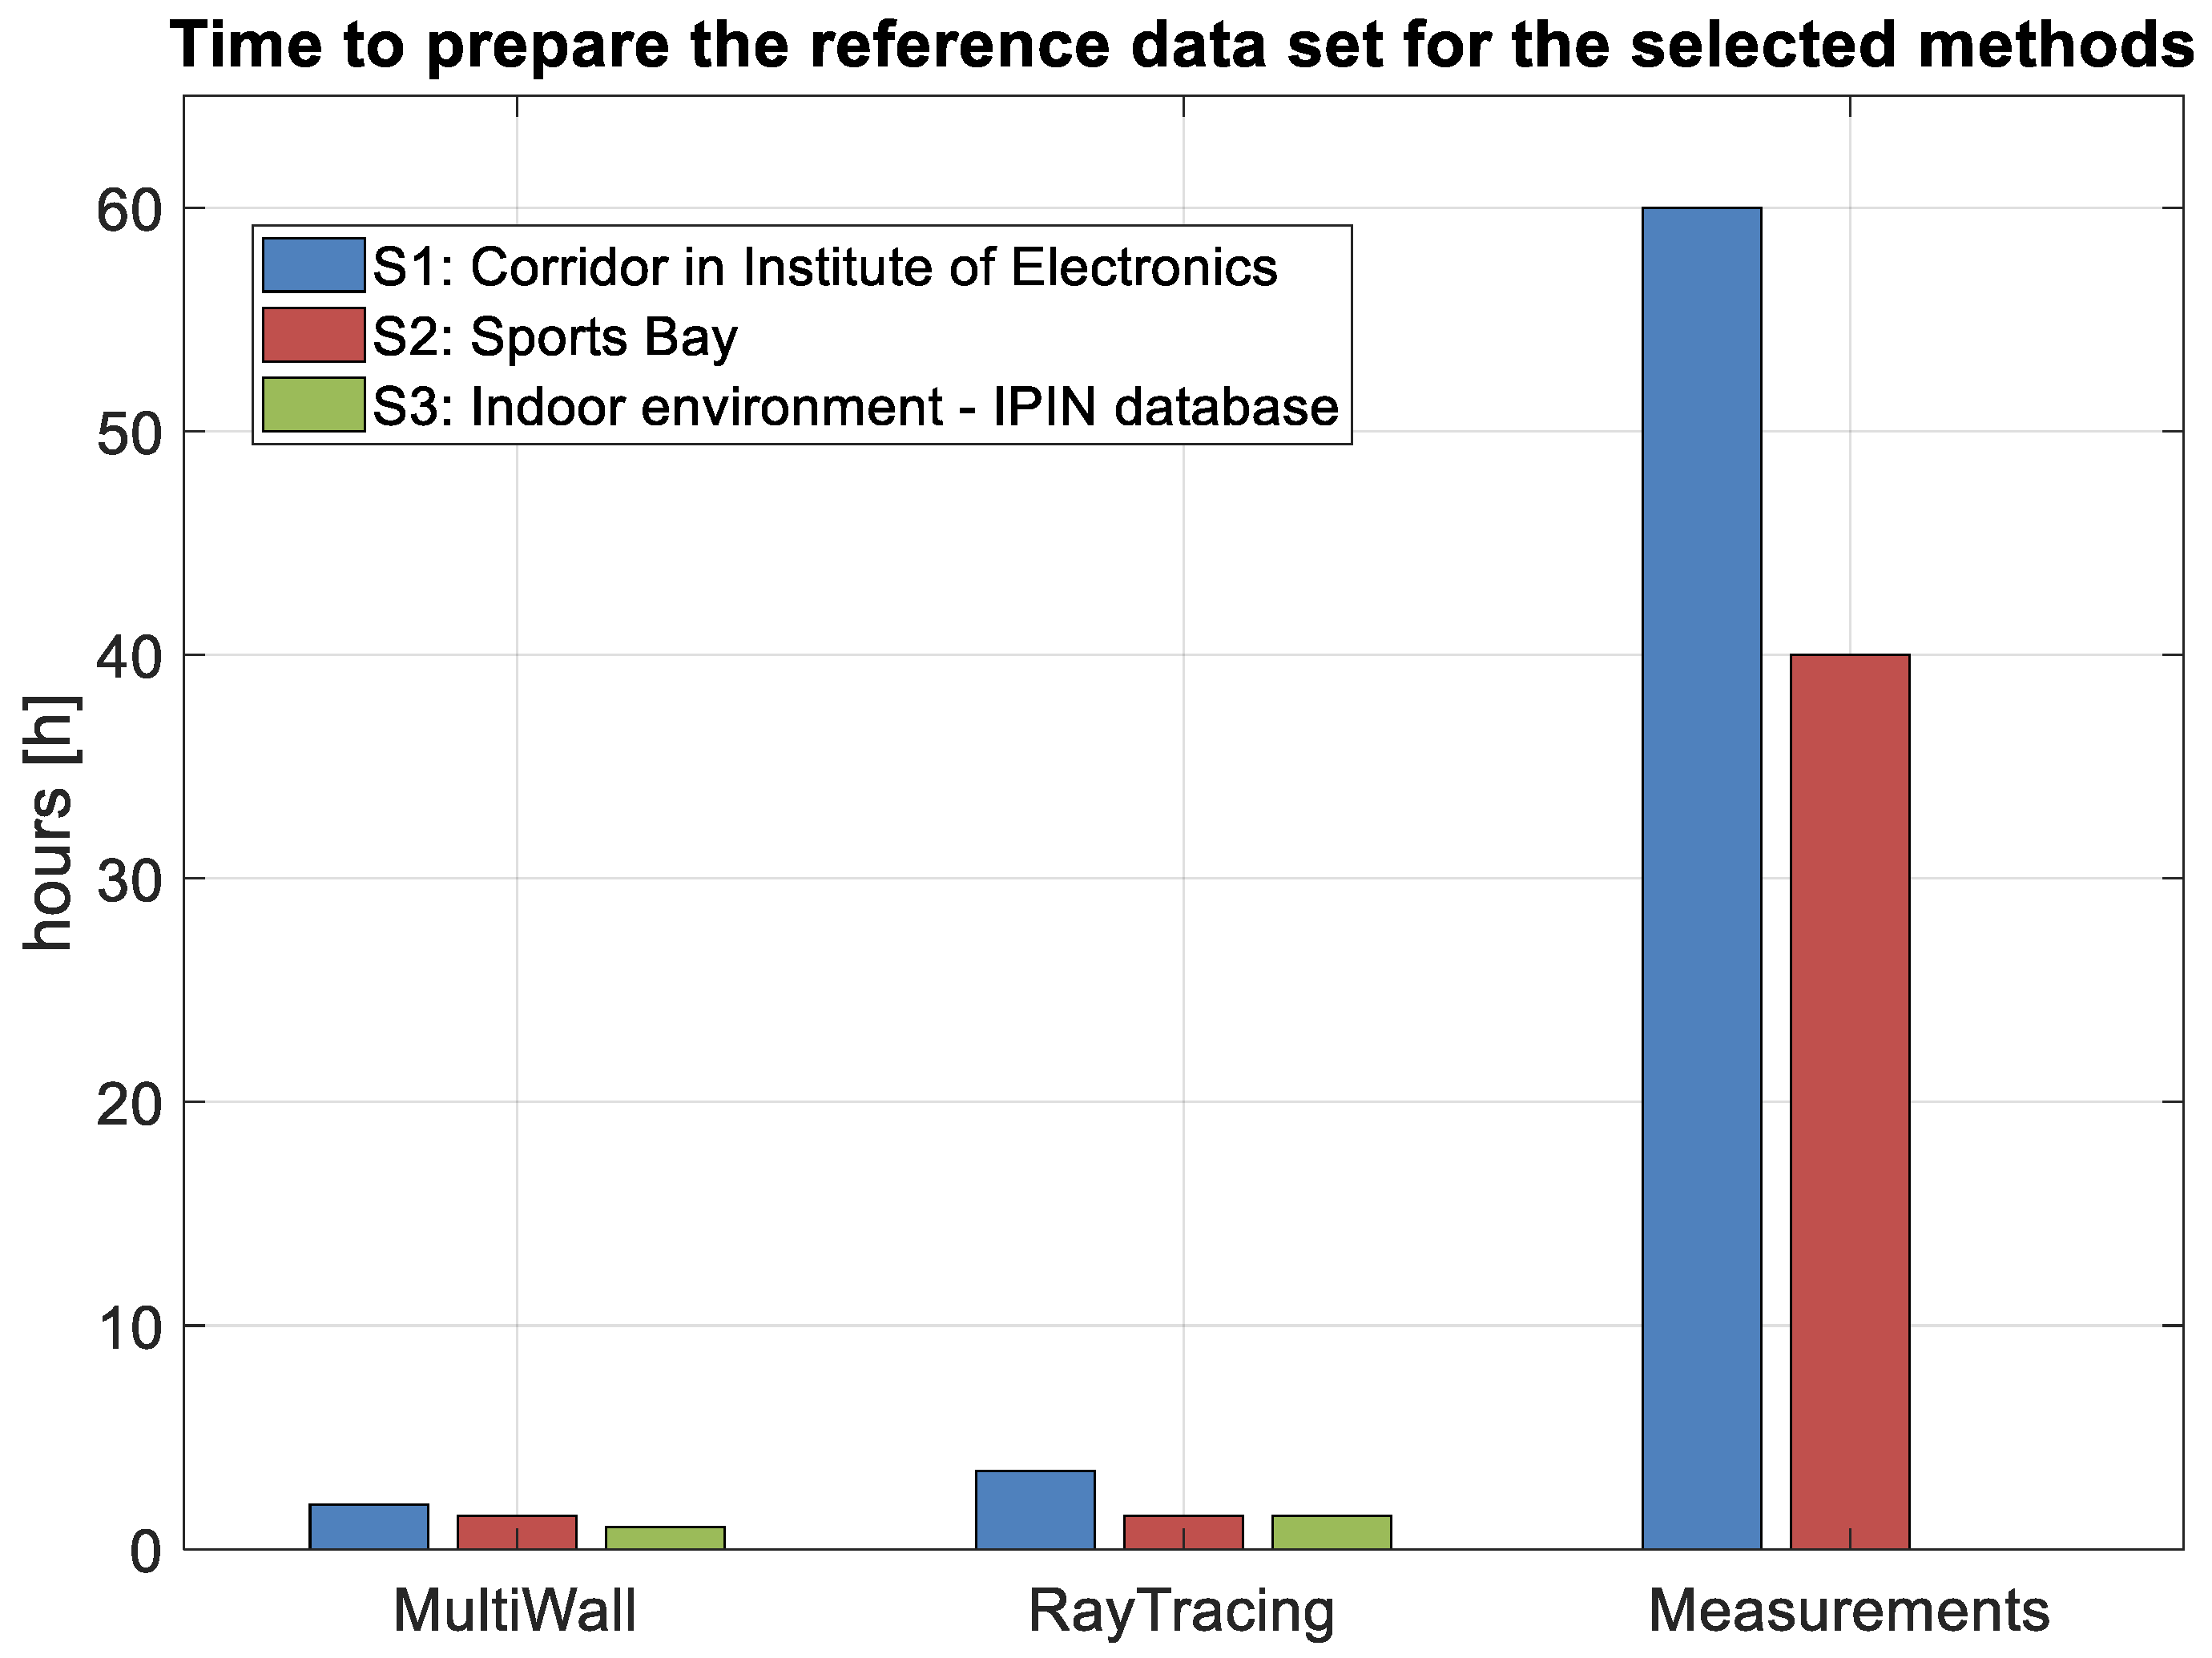
The time needed to prepare measured reference RSSI maps was one or two orders of magnitude greater than the time needed for computer simulations (
Figure 19). The time required to construct reference maps using crowdsourcing with the interpolation approach described in [
29] was 3 h. The use of computer simulations can further decrease the time required to prepare reference maps. In the case of the multiwall model, it required around 1–2 h to prepare the floor plan, set up the simulation environment, and generate the output, whereas, in the case of ray tracing, these tasks took 1.5–3.5 h, depending on the scenario.
4. Conclusions
In this study, we investigated the possibility of using simulated RSSI maps for indoor localization based on fingerprinting. Ray tracing and multiwall methods were used to obtain RSSI maps. These are very popular simulation methods with many freeware and commercial software implementations. A measurement campaign was also conducted to obtain ground truth data. Finally, we tested all the simulated and measured reference RSSI maps with a localization algorithm that uses fingerprinting followed by a modified particle filter. This class of algorithms, suitable for tracking moving terminals, is well represented in the literature. Our results show that it is possible to use simple propagation models to prepare RSSI maps for a localization algorithm and still obtain sufficient positioning accuracy. Even the simple and fast multiwall model enabled mean and median localization error values in the range of 1–2 m, which is comparable to the results obtained using both the ray tracing method and measured data. The results obtained using floor plans representing three different indoor environments (a sports hall, an office building, and a long corridor) prove that the proposed approach can be successfully applied to a wide range of radio wave propagation scenarios. However, the results may be affected by the accuracy of representation of the environment geometry, or the electromagnetic parameters of materials used in building construction. We conclude that it is possible to use simulated RSSI maps for indoor tracking, with satisfactory error values for many practical applications. Our study extends knowledge of the functioning of location systems and is also of practical importance for their implementation. Replacing the labor-intensive and time-consuming process of taking measurements for simulated reference maps significantly increases their ability to be adapted to real indoor environments.
Further work will focus on verifying our approach in other complex environments. Simulated reference RSSI maps will be tested with other location algorithms, including simple fingerprinting (without a particle filter) for stationary objects. We also plan to study and develop calibration methods for simulated reference maps.


