Article

Distinguishing Algal Blooms from Aquatic Vegetation in Chinese Lakes Using Sentinel 2 Image

1
Northeast Institute of Geography and Agroecology, Chinese Academy of Sciences, Changchun 130102, China
2
College of Geographical Sciences, Changchun Normal University, Changchun 130032, China
3
Faculty of Infrastructure Engineering, Dalian University of Technology, Dalian 116024, China
*
Author to whom correspondence should be addressed.
Remote Sens. 2022, 14(9), 1988; https://doi.org/10.3390/rs14091988
Submission received: 9 March 2022 / Revised: 15 April 2022 / Accepted: 18 April 2022 / Published: 21 April 2022
(This article belongs to the Special Issue Remote Sensing for Monitoring Harmful Algal Blooms)

Abstract

:
Algal blooms frequently occur in numerous lakes in China, risking human health and the environment. In contrast, aquatic vegetation contributes to water purification. Due to the similar spectral characteristics shared by algal and aquatic vegetation, both are hardly distinguishable in remote sensing imaging, especially in turbid water bodies. To address this challenge, this study constructed a method to effectively extract algal blooms and aquatic vegetation from the turbid water bodies using Sentinel 2 images with high spatial resolution. Our results showed that the accuracy of the extraction of vegetation information could reach 96.1%. Since this method combined the vegetation extraction results from multiple indices, it effectively tackled the mis-extraction when only the Floating Algae Index (FAI) or the Normalized Difference Vegetation Index (NDVI) is used in water with high turbidity. By combining the image time series information with the natural phenological characteristics of the aquatic vegetation and algal blooms, an improved Vegetation Presence Frequency (VPF) was developed. It effectively distinguished algal blooms and aquatic vegetation without actual measurement data. Based on the above method and process, the information of algal blooms and aquatic vegetation was sufficiently distinguished in five typical lakes in China (Lake Hulun, Lake Hongze, Lake Chaohu, Lake Taihu, and Lake Dianchi), and the spatial distribution was reasonably mapped. The overall identification accuracy of aquatic vegetation and algal blooms using the improved VPF ranged 71.8–84.3%. The spatial transferability test of the method in the independent lakes with the various optical properties indicated the prospects of its application in other turbid water bodies. This study should provide strong methodological and theoretical support for future monitoring of algal blooms in turbid water bodies with vigorous aquatic vegetation, especially in the absence of actual measurement data. This should have practical relevance for water environment management and governance departments.

1. Introduction

Two stable states exist in the lake, one in which phytoplankton dominate (turbid water conditions) and the other in which macrophytes dominate (clear water conditions) the system [1,2]. Whilst lakes in the natural state can experience transition from a clear, nutrient-poor state to a eutrophic state with algal blooms, this natural process is generally slow. Nevertheless, growing human activities in recent years have caused increasing lakes to undergo a rapid increase in eutrophication [3]. The outbreak of algal blooms is an obvious phenomenon when the eutrophication of water bodies reaches its highest stage.
Algal bloom is an outbreak of algae in the water ecosystem. Those that are harmful to humans are known as harmful algal blooms (HAB), which include members of the cyanobacteria, dinoflagellates, raphidophytes, haptophytes, and diatoms [4]. Freshwater blooms of harmful algae have been affecting public health and ecosystem services worldwide [5,6]. It can disrupt the balance of the aquatic ecosystem, produce a foul smell, and pose a serious threat to human health when the toxins produced by some species enter the human body [4,7,8]. Remote sensing has the characteristics of being macroscopic, fast, real-time, high-efficiency, low-cost, long-duration, and highly accurate. Therefore, it is widely used in global algal bloom monitoring [6,9,10]. Nonetheless, the spectral characteristics of algal bloom and aquatic vegetation remote sensing images are very similar and difficult to distinguish. This makes it challenging for remote sensing monitoring to separate algal blooms from aquatic vegetation. Many related studies have been conducted. For example, hyperspectral data have been used to construct normalized spectral indices to distinguish algal blooms, phytoplankton, submerged plants, and water bodies [11]. In another study, the distinction between algal blooms and aquatic vegetation was achieved using an improved Normalized Difference Water Index (NDWI) based on Landsat series images, due to the fact that aquatic vegetation has a reflectance higher than algal blooms at shortwave infrared [12]. Furthermore, the Vegetation Presence Frequency Index (VPF) used FAI to extract vegetation and algal blooms and auxiliary data (e.g., frequency and water depth) to distinguish between algal and aquatic vegetation in Lake Taihu [13]. Moreover, decision trees were used to separate waters covered by cyanobacterial scums from those dominated by aquatic macrophytes [14]. A medium resolution imaging spectrometer (MERIS) was used to capture the unique reflectance spectrum characteristics of algae and cyanobacteria to separate areas covered by algal and aquatic vegetation in Lake Taihu [15]. Although these methods and models can distinguish between algae blooms and aquatic vegetation to a certain extent, they are only applicable to individual lakes. In addition, these approaches also require a huge amount of field-measured hyperspectral remote sensing reflectance data to participate in the modeling.
Remote sensing images are increasingly used for identifying features due to the high cost and time-consuming nature of field surveys. Despite numerous studies on vegetation classification methods (e.g., decision trees [16]; maximum likelihood methods [17]; artificial neural networks [18]; and unsupervised clustering [19]), they cannot be directly applied to distinguish algal from aquatic vegetation because of the similar spectral characteristics of algal blooms and aquatic vegetation. Moreover, it is difficult to separate them using multispectral images. In practice, scholars usually artificially divide the algal bloom and aquatic vegetation area according to the measured data or experience [20,21,22]. However, in the absence of in situ data, it is hard to take away the influence of aquatic vegetation growth on algae extraction directly. In addition to the influence of aquatic vegetation, the highly turbid water bodies with large amounts of sediment can also interfere with algal identification using remote sensing [23].
This paper describes a study to develop a model that can effectively identify and differentiate algal blooms and aquatic vegetation in turbid lakes using remote sensing images (without field measured data). Specific objectives are to: (1) realize the effective extraction of algal blooms and aquatic vegetation from the highly turbid water bodies; (2) establish a method to effectively distinguish algal blooms and aquatic vegetation with the absence of actual measurement data; (3) test the spatial transferability of the method in independent lakes with various optical properties and examine the spatial variations of algal blooms in these lakes. The method of remote sensing monitoring of algal blooms in turbid inland waters is extended, which does not rely on traditional measured data. The model is spatially portable, which can provide strong methodological and theoretical support for the future monitoring of algal blooms in turbid water bodies with vigorous aquatic vegetation.

2. Materials and Methods
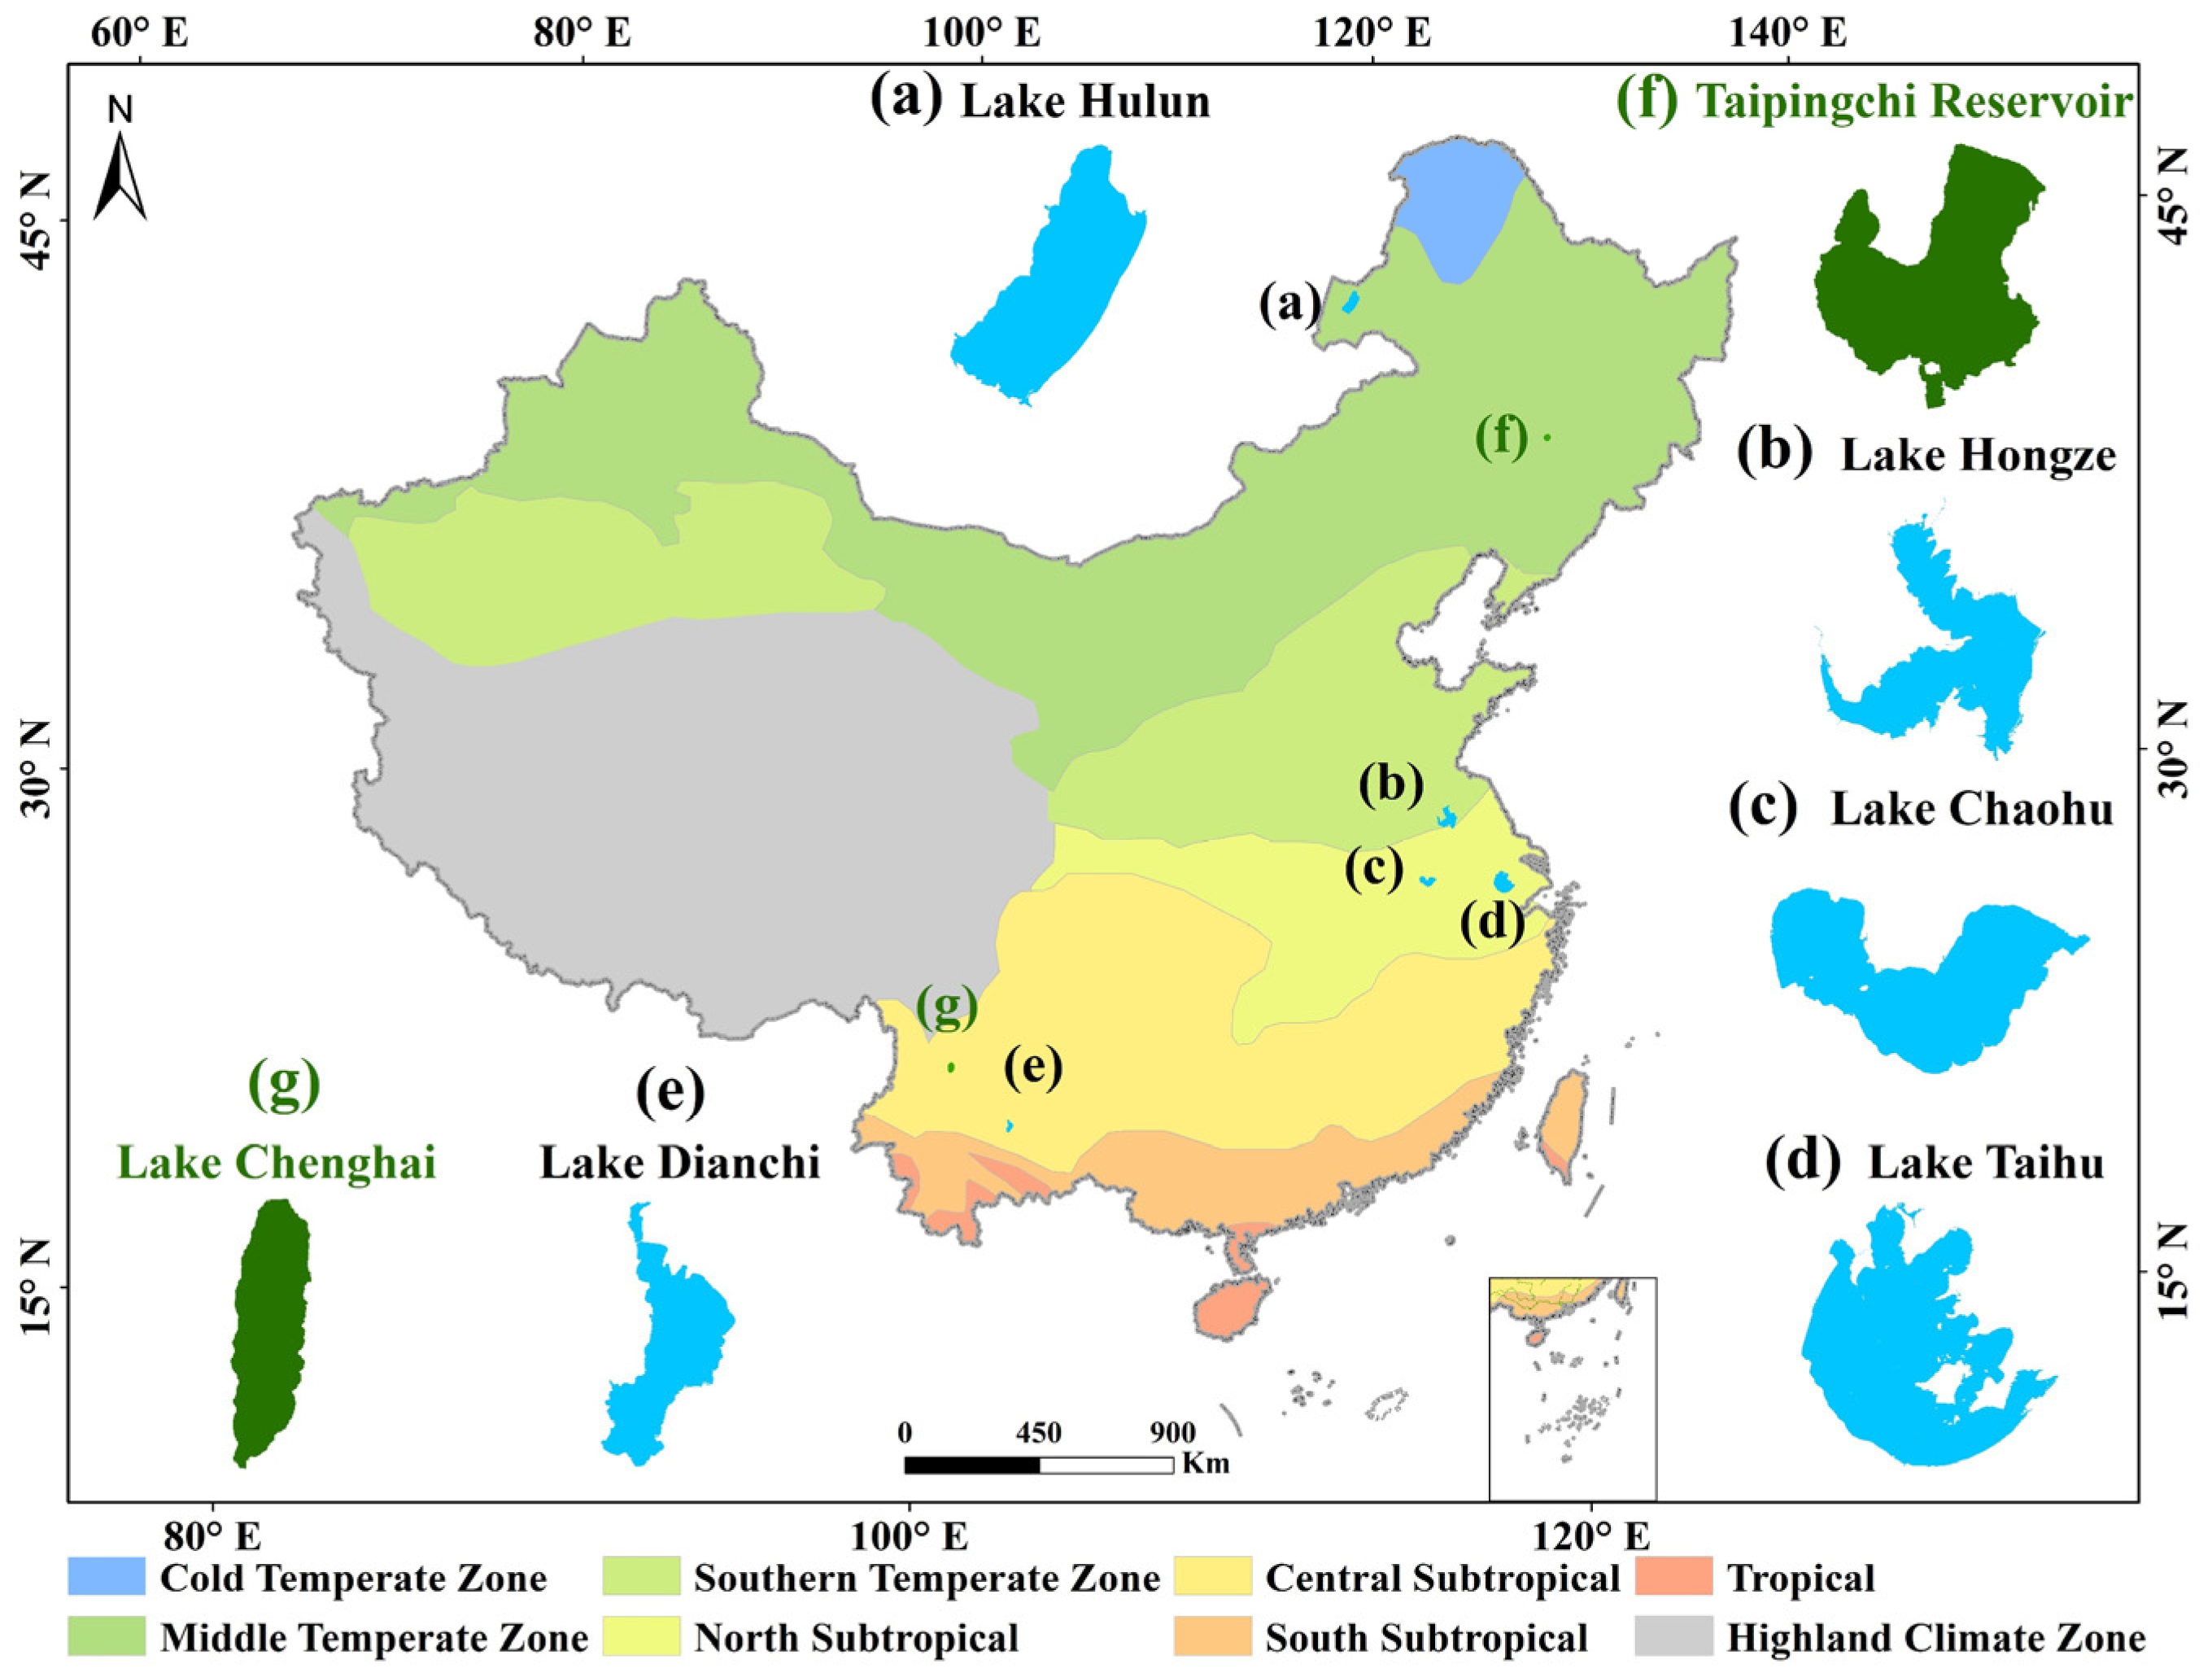
2.1. Study Areas

In this study, five large and representative lakes with frequent algal blooms were selected. Figure 1 displays their locations and morphology. They are Lake Hulun, Lake Hongze, Lake Chaohu, Lake Taihu, and Lake Dianchi. They are located in different climatic zones, and the detailed features of these lakes are described in Table S1.
To verify the spatial transferability of the method, two lakes in different climatic regions were selected: (1) Taipingchi Reservoir in the Northeast Lake Region, and (2) Lake Chenghai in the Lake Region of the Yunnan-Guizhou Plateau. Both lakes have a rich distribution of aquatic vegetation and algal blooms. Taipingchi Reservoir is located in the middle temperate climate zone, while Lake Chenghai is located in the subtropical climate zone.

2.2. Remote Sensing Data

Sentinel 2 is a wide-width, high-resolution, multispectral satellite system that carries the Multispectral Mapping Instrument (MSI) with 13 bands and ground resolutions of 10 m (visible and NIR), 20 m (red-edge and SWIR), and 60 m in the atmospheric band. Sentinel 2 includes two satellites, A and B, with a revisit period of 5 days. The Sentinel 2 images used in this paper are the surface reflectance products provided by the Google Earth engine platform (https://code.earthengine.google.com/, accessed on 25 November 2021). These images had been atmospherically and radiometrically corrected and ready for use. In this paper, 122 high-quality images (detailed in the supporting materials Table S2) with low cloudiness were downloaded for Lake Hulun, Lake Hongze, Lake Chaohu, Lake Taihu, and Lake Dianchi for the years 2020 or 2019. Since there were no significant algal blooms in the images of Lake Hulun and Lake Hongze in 2020, we selected 2019 images; 2020 images were selected for the other lakes.

2.3. Methods

2.3.1. Data Preprocessing

We used the frequency index to distinguish between algal blooms and aquatic vegetation. To address the issue of extracting vegetation information using only the Floating Algae Index (FAI), which is not useful for water bodies with high concentrations of suspended matter [24], we combined multiple indices to extract vegetation information. The indices considered were the Normalized Difference Vegetation Index (NDVI), FAI, and Normalized Difference Water Index (NDWI). The selection of indices and thresholds was assisted by an SPSS decision tree, which first determined the stern values for individual indices and then constructed a decision tree to merge the extraction results of multiple indices. Finally, the algal blooms and aquatic vegetation extracted by the decision tree were entered into the calculation layer Lv of the VPF and assigned a value of 1 for the next step of data processing. Based on the climatic zoning and the growth of the aquatic vegetation, the period with the largest stable area of aquatic vegetation growth was selected as the VPF time range for the calculation. Then, we delineated the VPF threshold based on the distribution of algal blooms and aquatic vegetation, removed low-frequency algal bloom distribution areas, and obtained the aquatic vegetation boundaries. Finally, we clipped the algal blooms and aquatic vegetation areas extracted in the previous step with the extracted aquatic vegetation boundaries. The area falling within the aquatic vegetation boundary is aquatic vegetation; otherwise, it is algal blooms. The specific steps are descripted in detail in Figure S1.

2.3.2. Accuracy Assessment

(1) The precision of the extracted algal bloom and aquatic vegetation areas was verified by selecting validation points through visual interpretation and using a confusion matrix to assess accuracy, with the overall accuracy expressed as P.
(2) The accuracy of the extracted aquatic vegetation areas was verified by creating validation points evenly within the aquatic vegetation area and buffering a certain area outward through the GIS fishing net tool, with about 100–200 points per lake. The points were imported into Google Earth, and the accuracy verification was performed point by point.
The accuracies of aquatic vegetation extraction can be expressed as:
PV/PW = T/(T + F)
Pn = PV × PW
where PV and PW are accuracies within and outside the aquatic vegetation range, respectively. T is the extraction of points within the aquatic vegetation range, where it was verified that aquatic vegetation was growing, or within the buffer zone outside the aquatic vegetation range, where it was verified that no aquatic vegetation was growing. F is the point within the aquatic vegetation range without significant vegetation growth in the area or within the buffer zone outside the aquatic vegetation range, where the occurrence of aquatic vegetation was verified. Pn is the accuracy of aquatic vegetation extraction for lake n.
(3) The overall accuracy was evaluated by multiplying the accuracy of the user of the extracted vegetation information (both aquatic vegetation and algae) with the accuracy of the aquatic vegetation boundaries.
PTn = P × Pn
where PTn is the overall accuracy for lake n, P is the overall accuracy for vegetation (both aquatic vegetation and algae) extraction, and Pn is the aquatic vegetation extraction accuracy for lake n.

3. Results

3.1. Classification Index, Time Scale and Threshold Selection

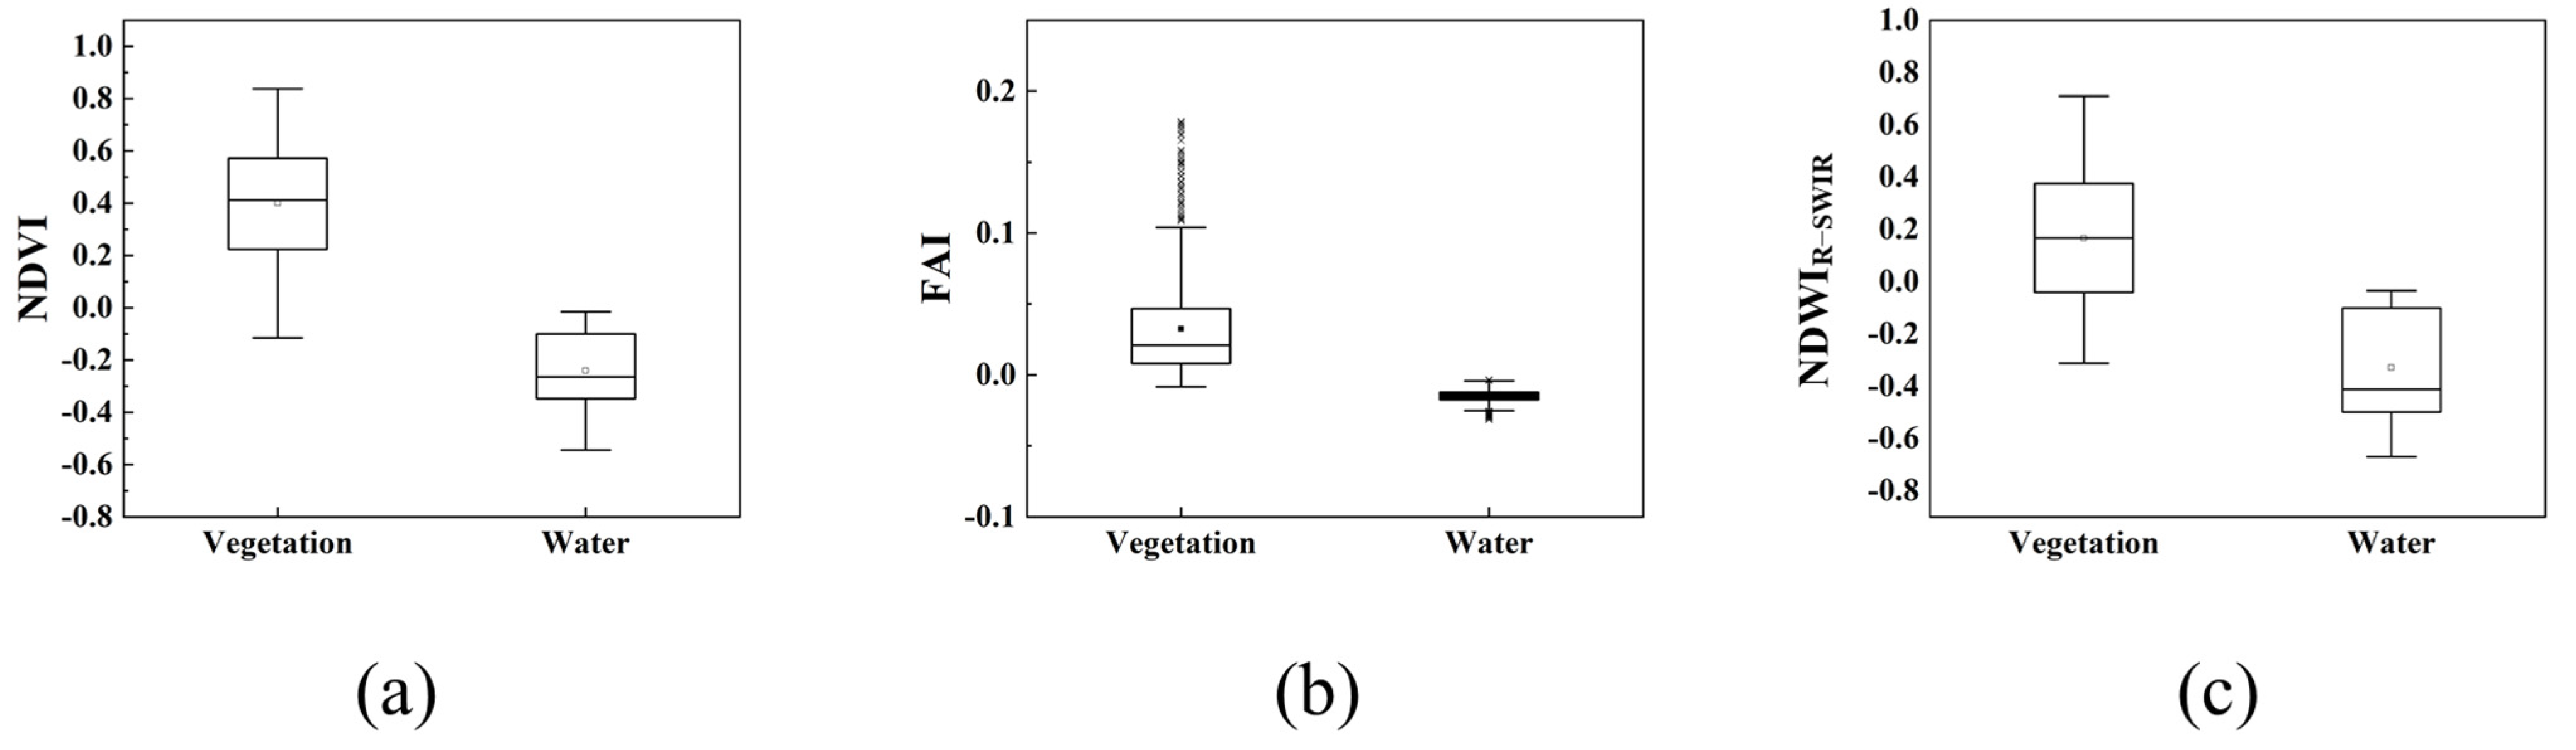
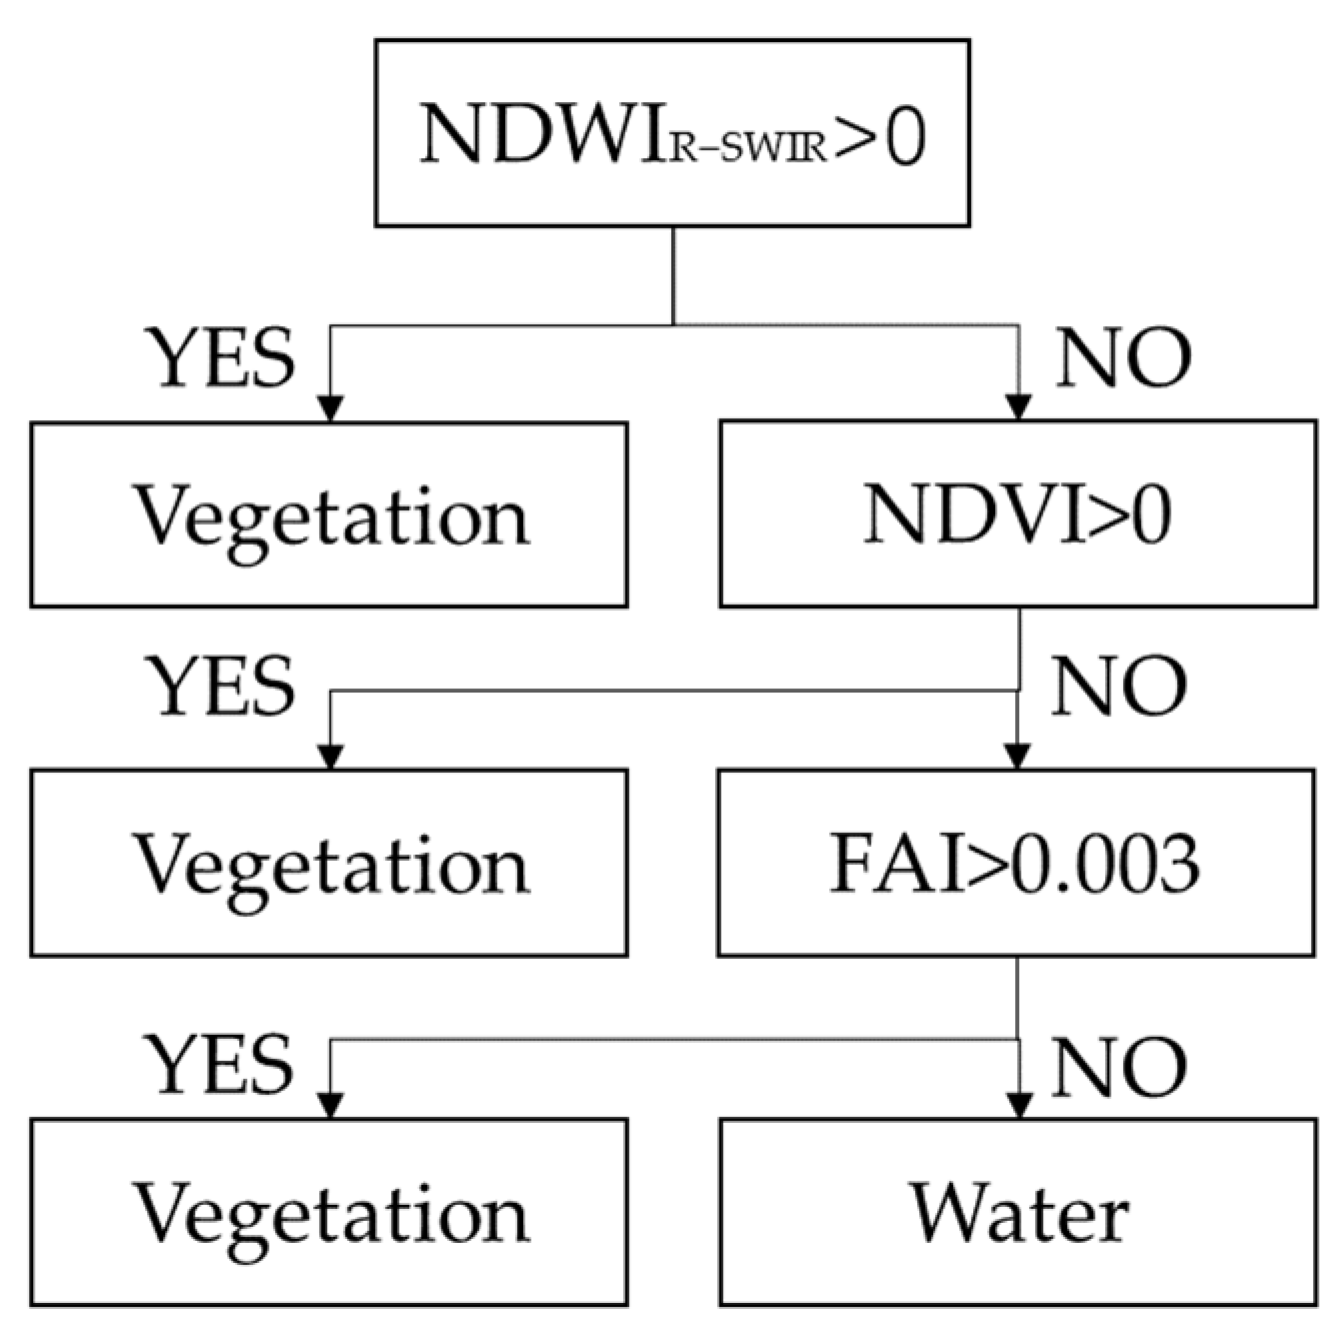
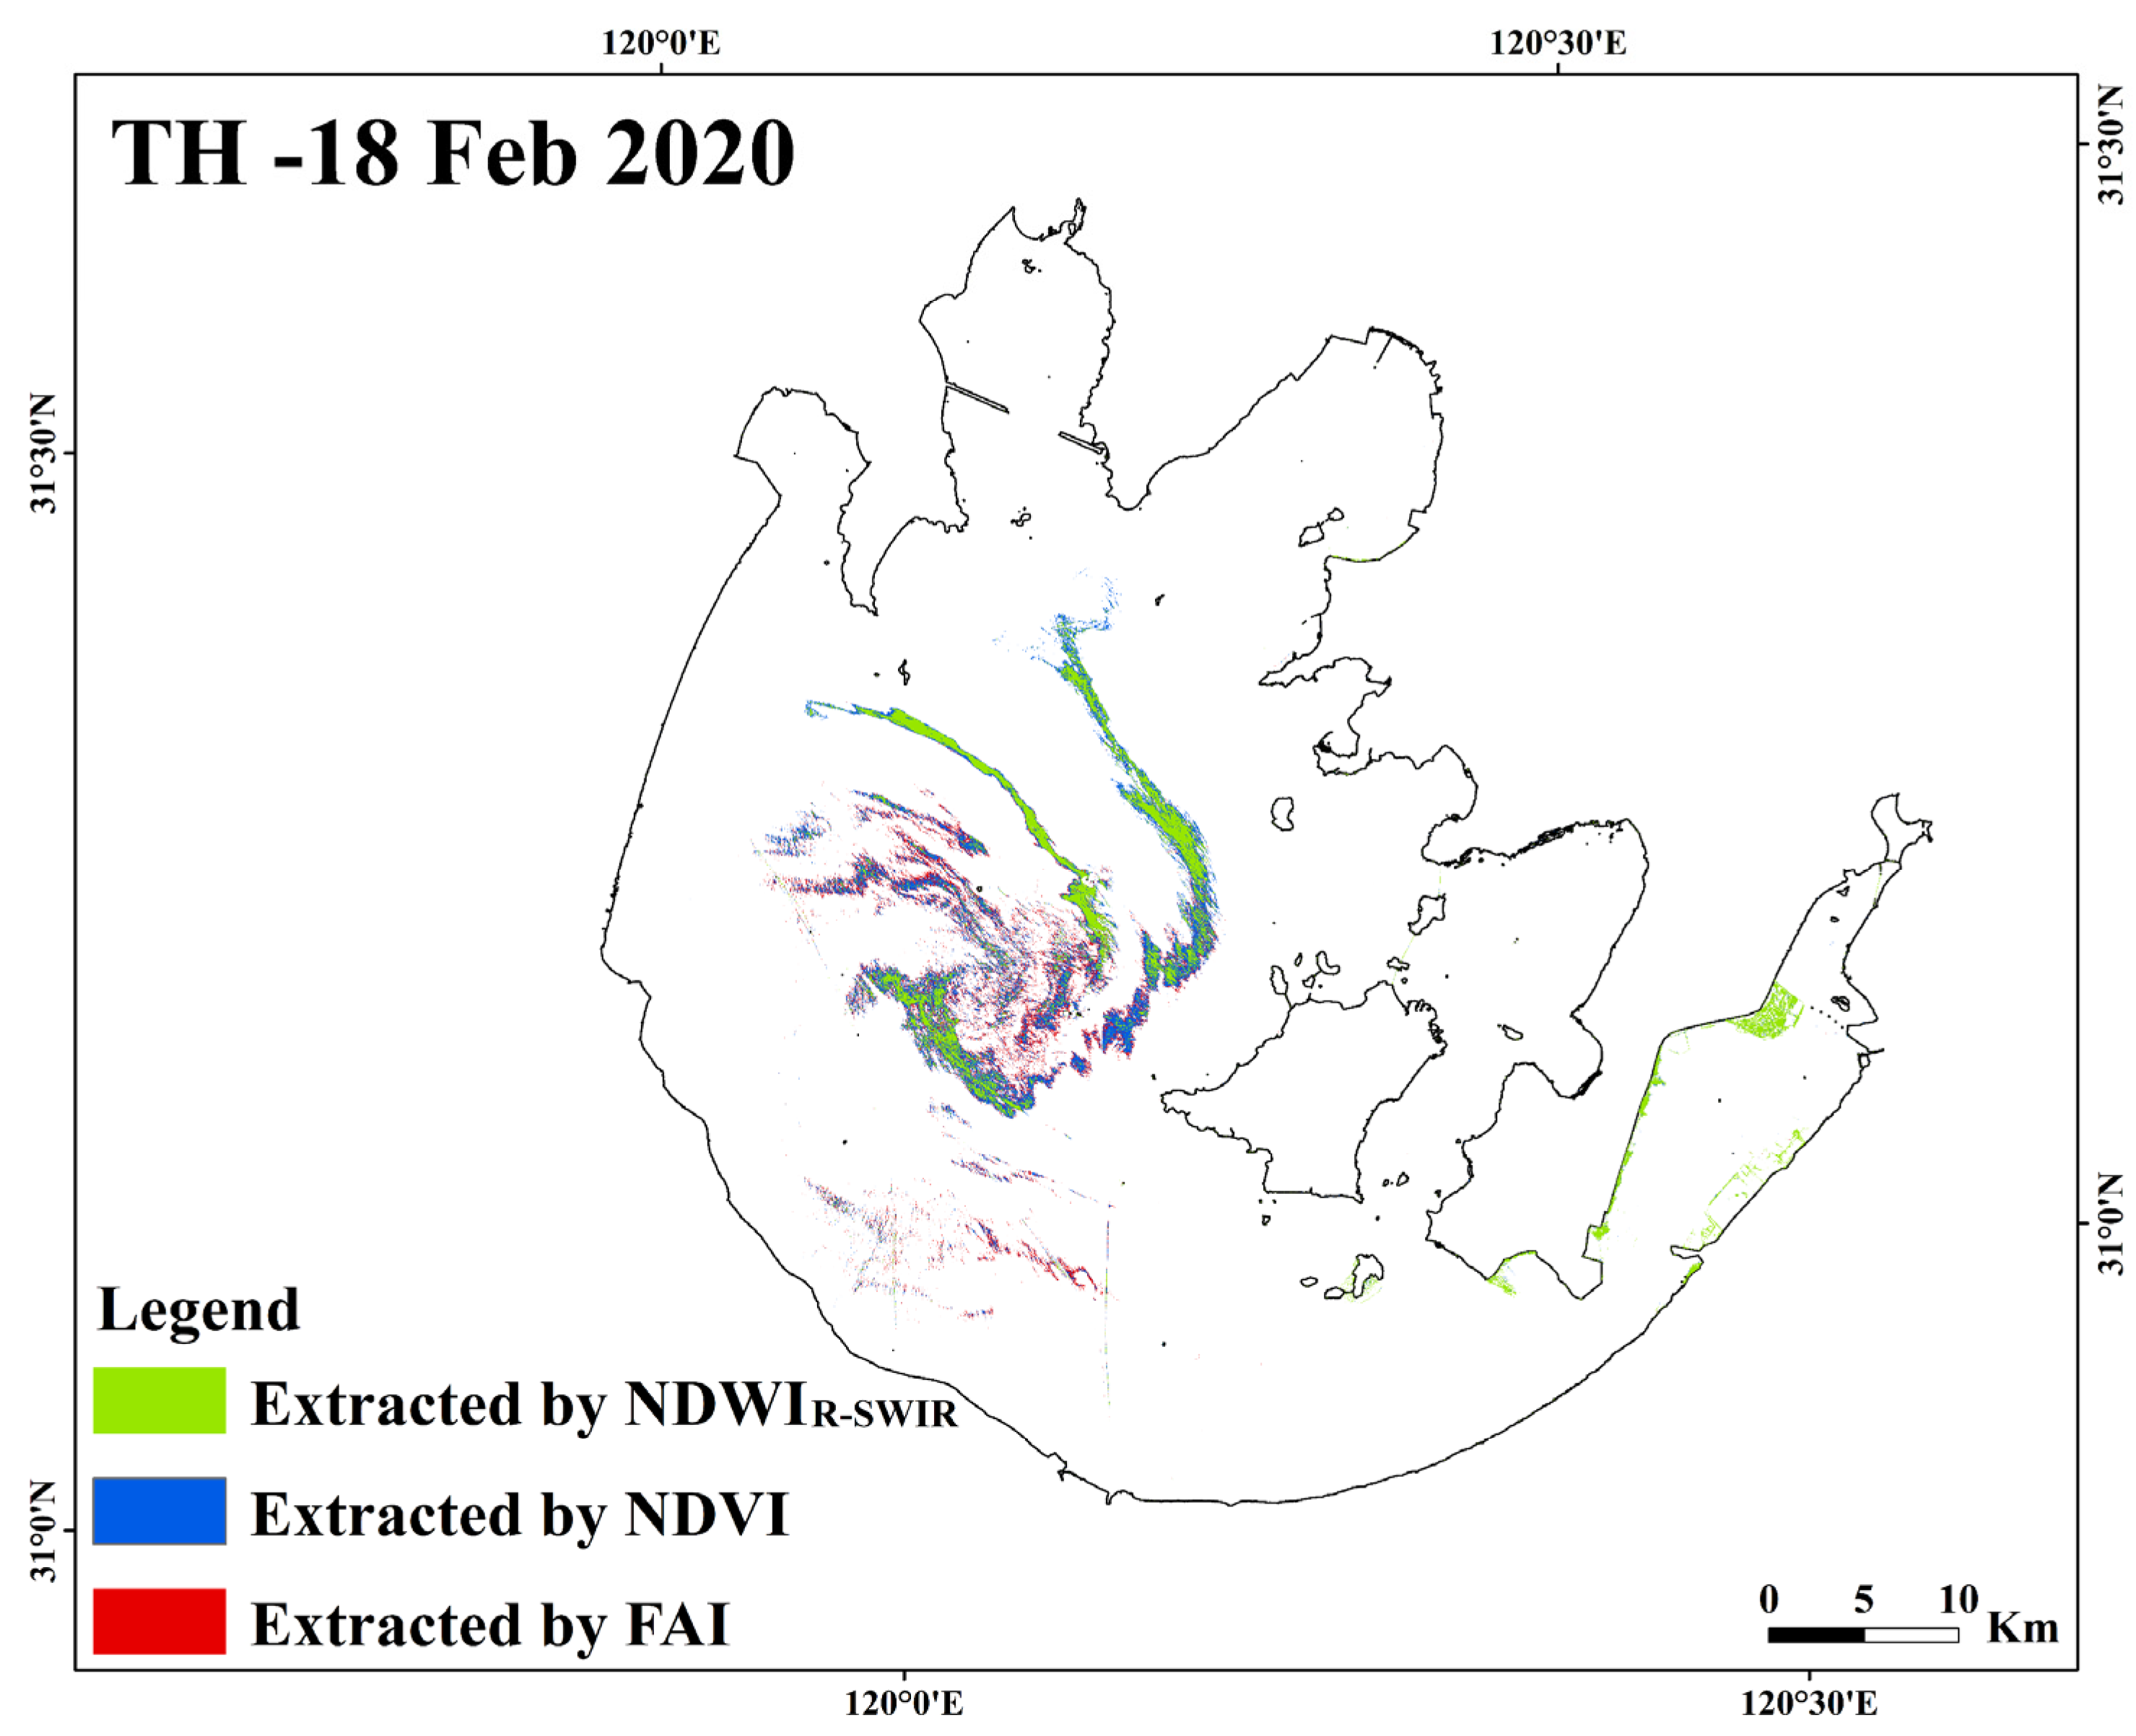
3.1.1. Indices and Thresholds for Extracting Algal Blooms and Aquatic Vegetation

In total, the reflectance of 2000 points was obtained and calculated for the five studied lakes, i.e., 1000 points for water bodies free of vegetation cover, and 1000 for algal blooms and aquatic vegetation. A total of 80% of the points were used for modeling and 20% for validation. The three indices with the highest classification accuracy selected by SPSS decision tree classification are NDVI, FAI, and NDWIR-SWIR. Figure 2 presents the separations between vegetation and water bodies according to three indices.
This section is divided into several subsections. It should provide a concise and precise description of the experimental results, their interpretation, as well as key experimental findings.
A threshold was selected in the interval in which the classification accuracy was greater than 95%. Next, the extraction results of multiple indices were merged. When NDVI > −0.1 or FAI > 0.003 or NDWIR-SWIR > 0, the point was classified as an algal bloom or aquatic vegetation. The extracted algal blooms and aquatic vegetation points entering the VPF calculation layer Lv and were assigned a value of 1. The decision tree for extracting the vegetation signal is illustrated in Figure 3.

3.1.2. Time Range for Calculating VPF

Based on climatic zone characteristics and lake aquatic vegetation phenology changes, the time range for calculating VPF was chosen for each lake. In the temperate climate zone, the growing season of vegetation generally lasts for 3–5 months, and in subtropical climate zones, it lasts for 5–7 months. Lake Hulun, in the northernmost part, belongs to the middle temperate climate zone characterized by cold winters and an ice-free lake surface from May to November. The rest of the year, the lake surface is frozen. The aquatic vegetation starts to grow in mid-May, the vegetated area continues to expand until late June, and it peaks and stabilizes from July to September. The temperature drops in early October, the vegetation withers, and the area shrinks. Lake Hongze, in a warm temperate climate and with the lake surface frozen in winter—the vegetated area increases significantly from May to June, stabilizes from July to September, and decreases rapidly after October. Lake Chaohu and Lake Taihu are close to each other and in the subtropical zone. The vegetated area begins to expand in March, considerably large from May to October, peaks from July to September, and decreases rapidly in November. The southernmost Lake Dianchi has a warm, southern subtropical climate. The vegetated area does not change significantly. The vegetated area increases in March, is relatively stable from April to October, and diminishes from November to February. The vegetated area increases in March, is quite stable from April to October, but small from November to February.
In this paper, the period when the vegetated lake area peaked and stabilized was used to calculate the VPF. Accordingly, the period for calculating VPF was July–September for Lake Hulun and Lake Hongze, May–October for Lake Chaohu and Lake Taihu, due to frequent algal blooms in summer and fewer images in July–September, and April–October for Lake Dianchi. Figure 4 shows the results of the VPF calculations for these periods.
Through visual interpretation, the VPF distribution in Figure 4 indicates that most areas with VPF values greater than 0.8 are areas where aquatic vegetation occurred. However, in some areas where algal blooms frequently occurred, VPF values can reach 0.7. Therefore, for lakes in which algal blooms frequently occurred, threshold values to distinguish vegetation from algal blooms range between 0.7 and 0.8. The appropriate threshold can be selected by repetitive adjustment. If the threshold is too large, the extraction of aquatic vegetation is incomplete. If the threshold is too small, the areas where algal blooms occurred are frequently misrepresented as aquatic vegetation. Depending on the lake, the VPF thresholds are chosen differently. The VPF thresholds of Lake Chaohu, Lake Taihu, Lake Hongze, Lake Hulun, and Lake Dianchi are 0.75, 0.8, 0.5, 0.5, and 0.85, respectively.

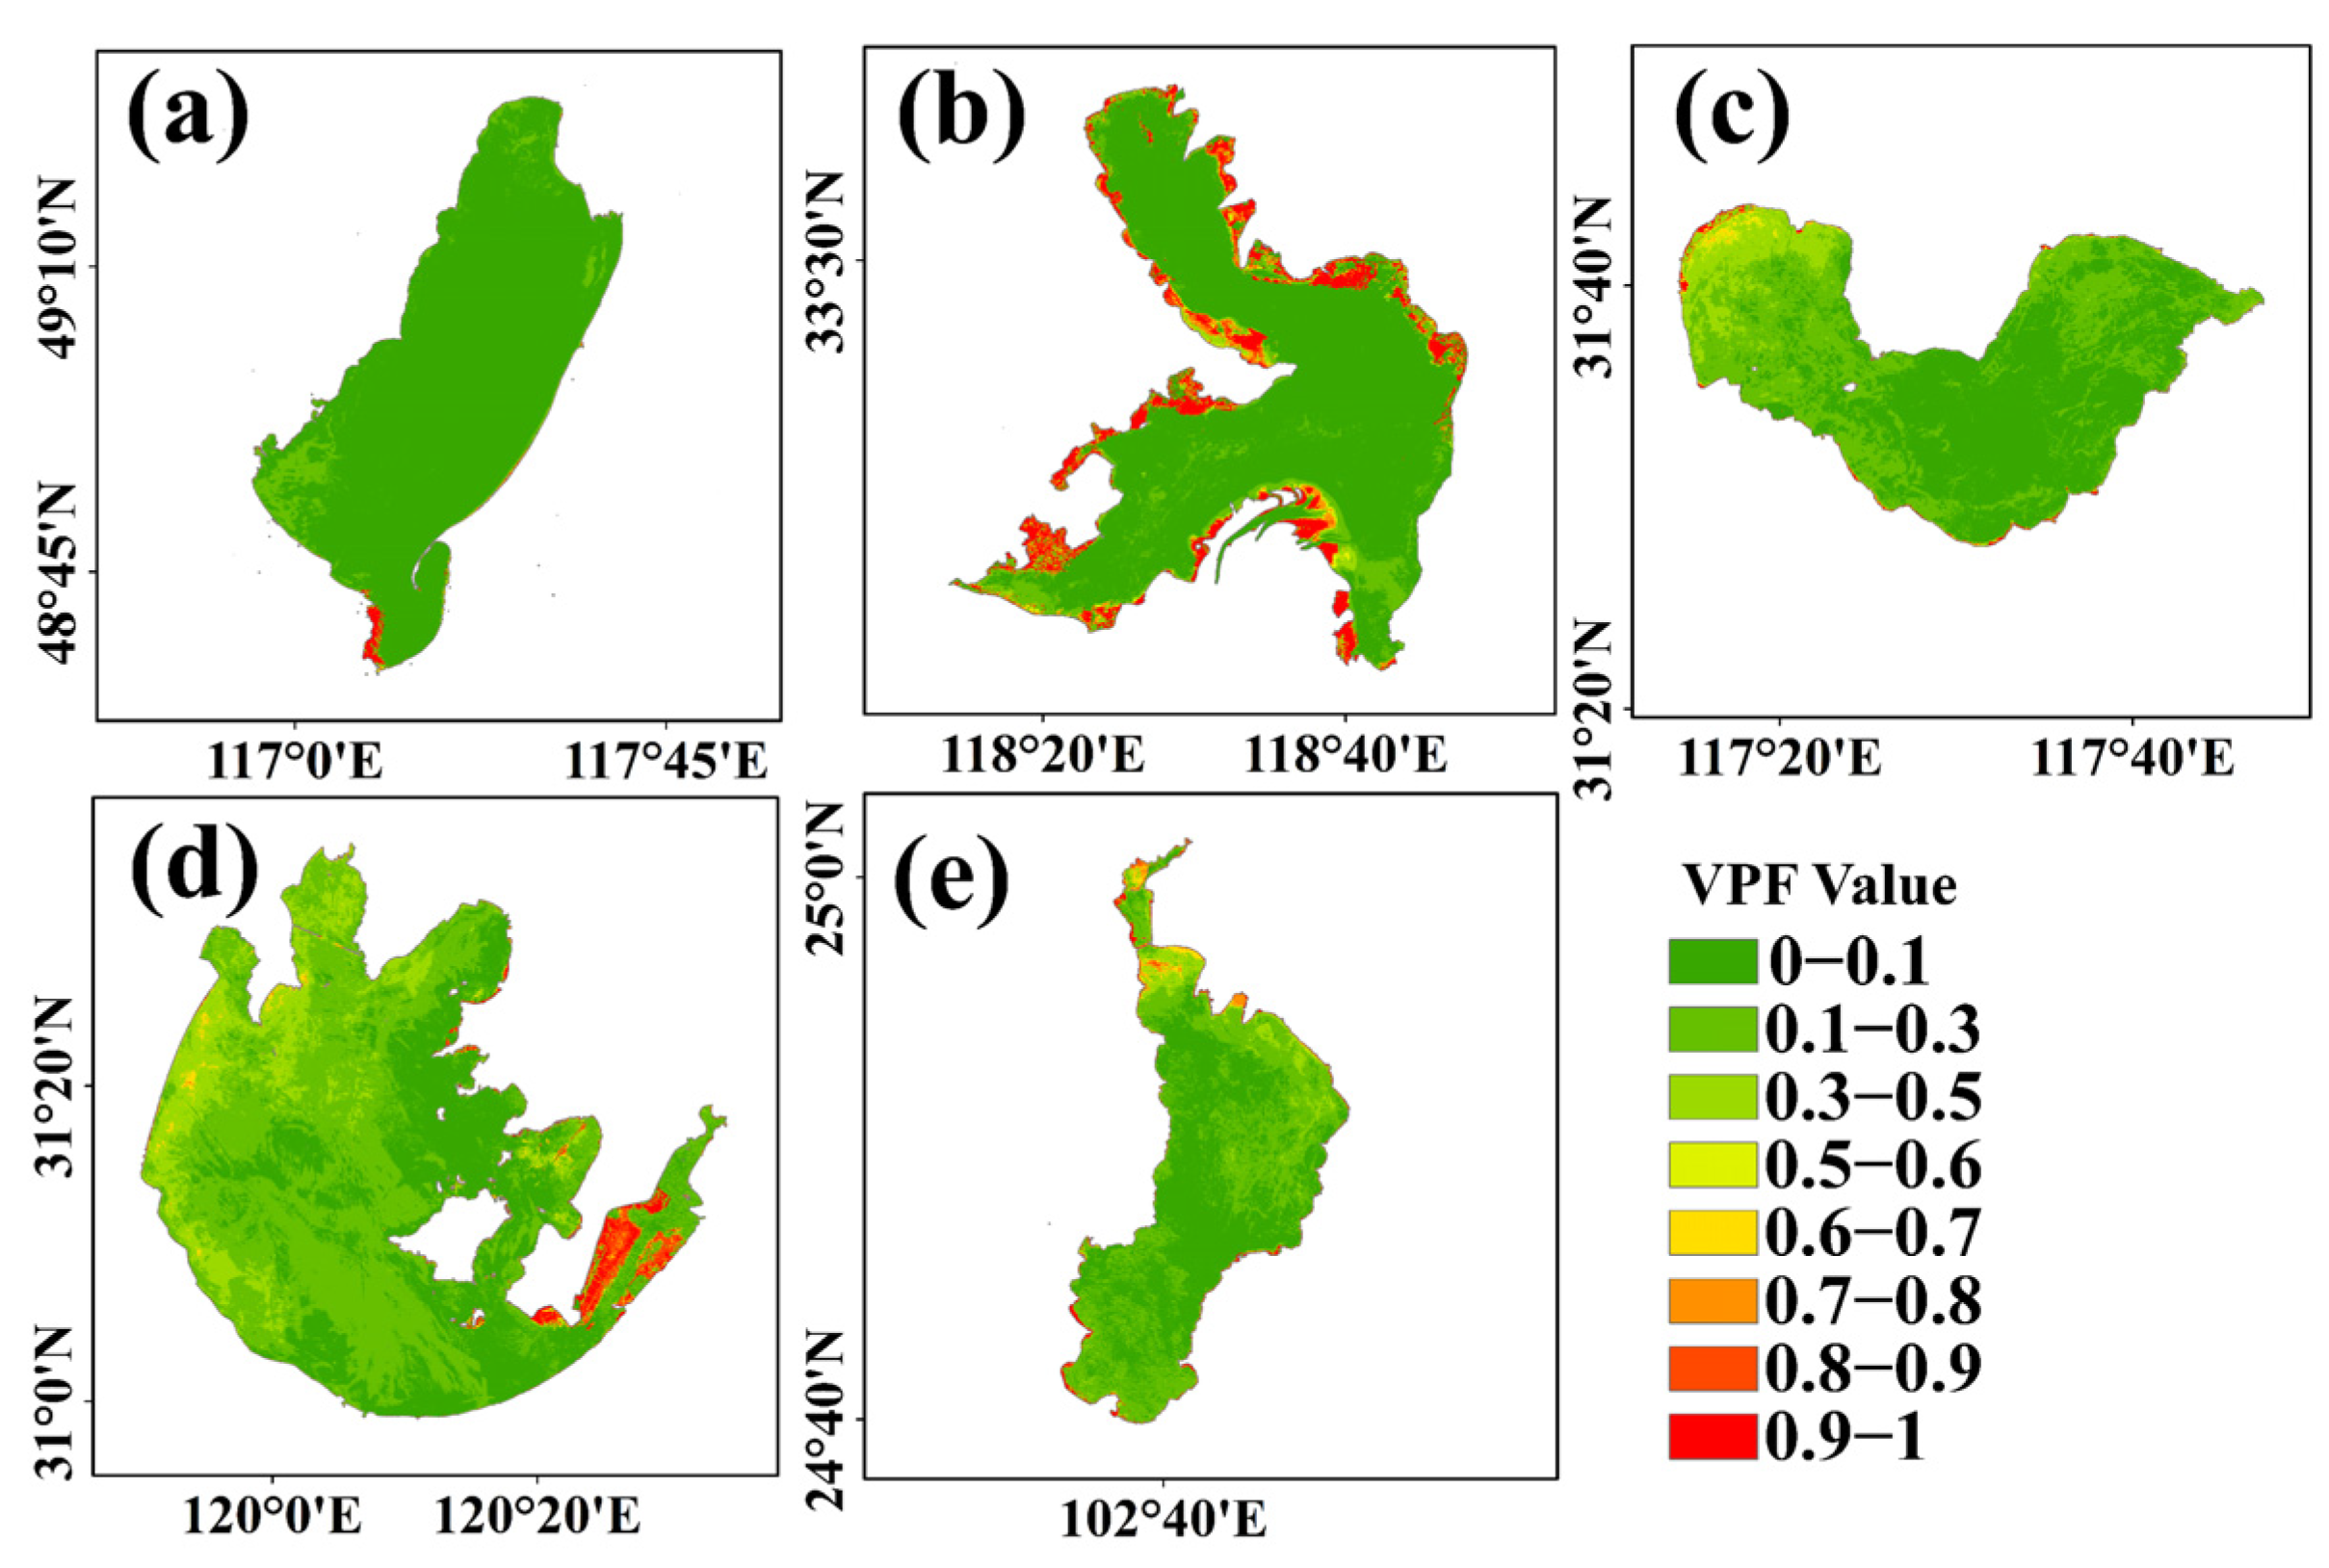
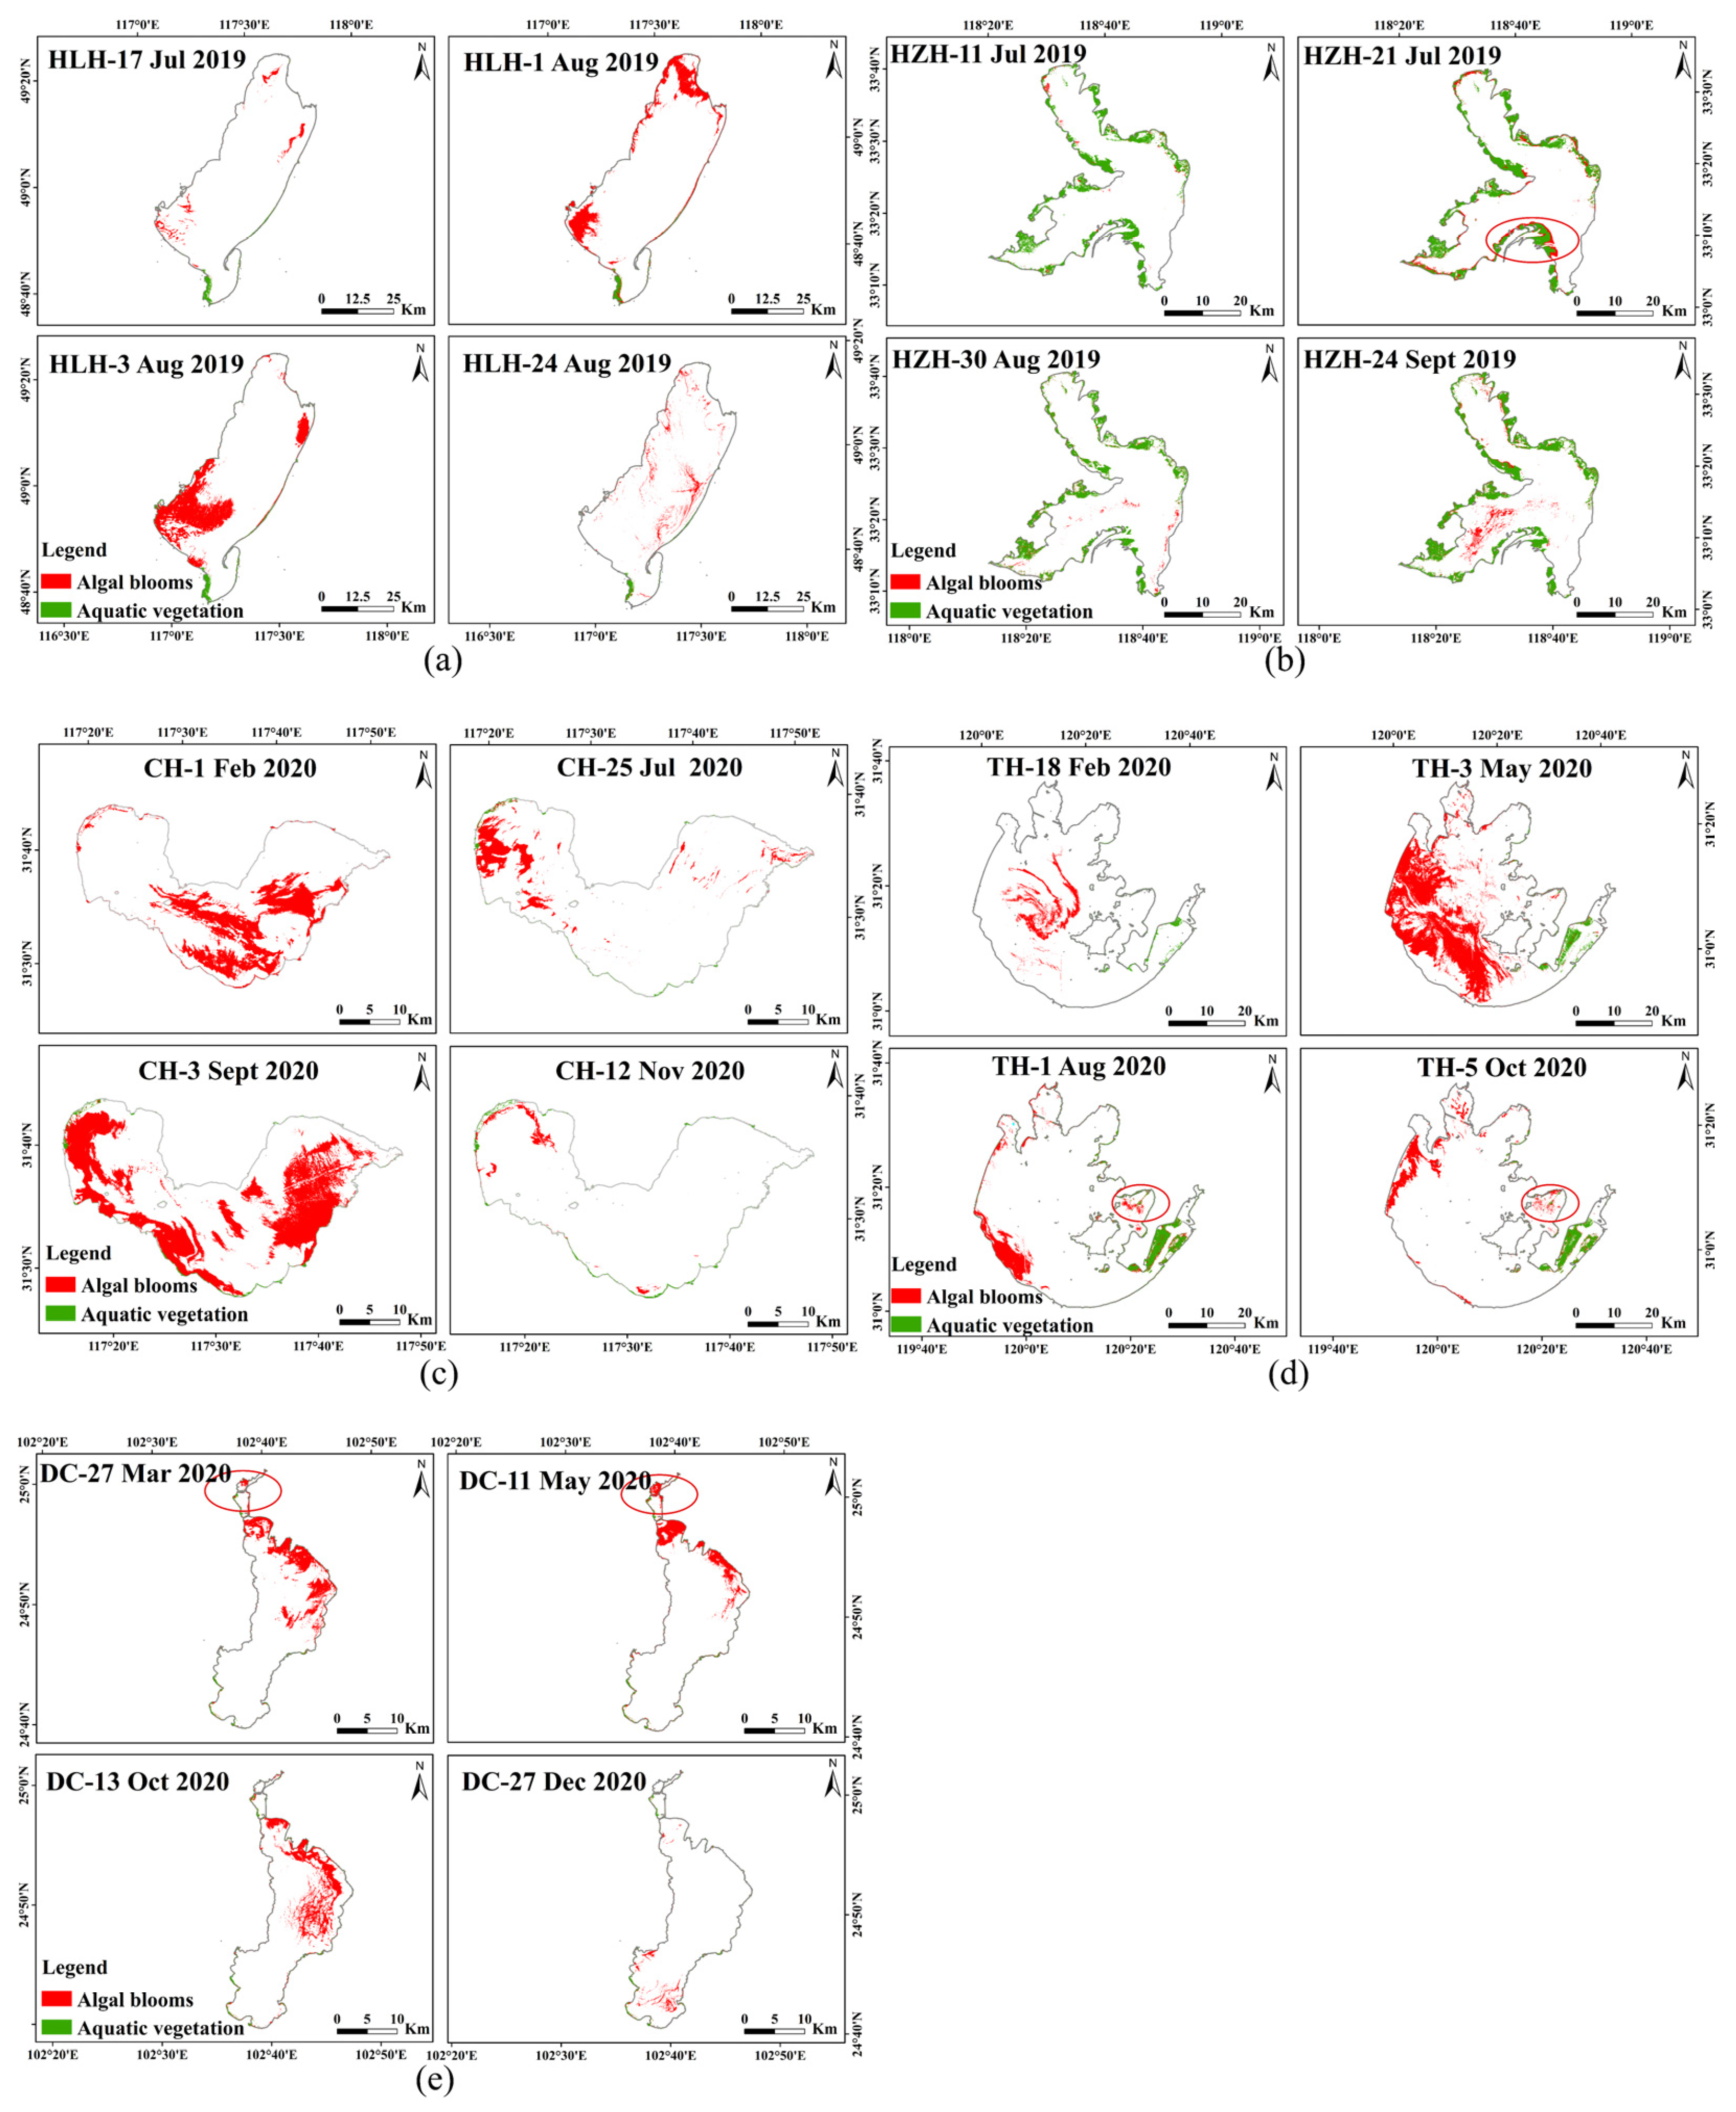
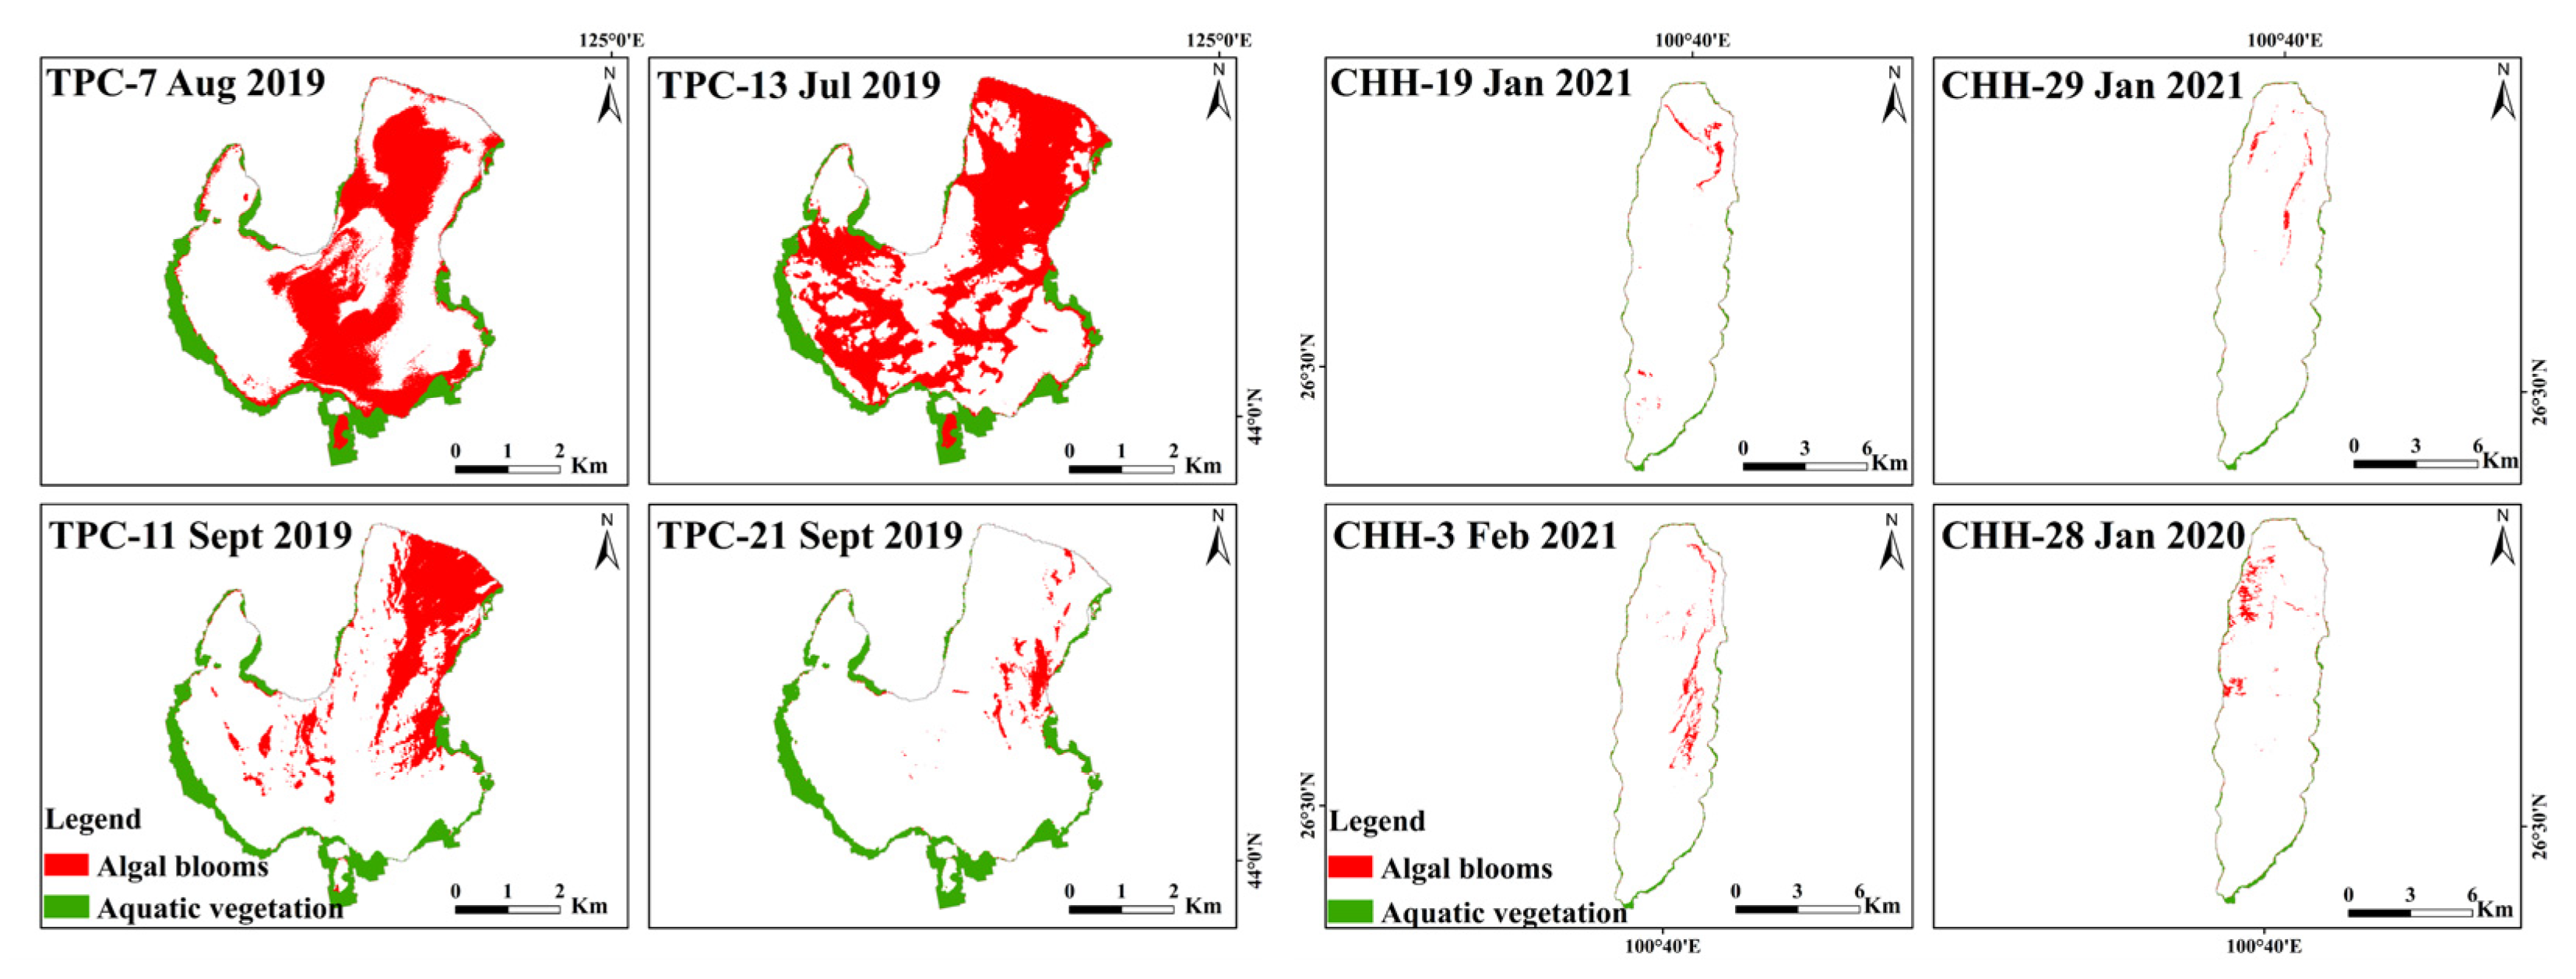
3.2. Results of VPF Differentiation between Algal Blooms and Aquatic Vegetation

The extracted aquatic vegetation range is cropped with the extracted algae and aquatic vegetation boundaries. Those within the aquatic vegetation range are aquatic vegetation, while those falling outside the range are algal blooms. In this way, the algae and aquatic vegetation ranges can be obtained. Some of the extracted results for the lakes are shown in Figure 5. The aquatic vegetation of Lake Hulun is mainly concentrated in the southeastern corner of the lake, with little variation in summer. The aquatic vegetation of Lake Hongze primarily occurred in the northern, western, and southern coastal areas, and mainly grew along the lakeshore, with significant changes in vegetation area in summer. Lake Chaohu had only a small area of aquatic vegetation, mainly in the northwestern corner and along the southern shore, with a few patches along the north-eastern shore, and little seasonal variation. Nonetheless, the vegetated area expanded from July to September. The aquatic vegetation of Lake Taihu mainly concentrated in the eastern area, with significant seasonal variation. The aquatic vegetation of Lake Dianchi mainly concentrated within the Caohai in the north, with a marked expansion of the aquatic vegetation area in summer.

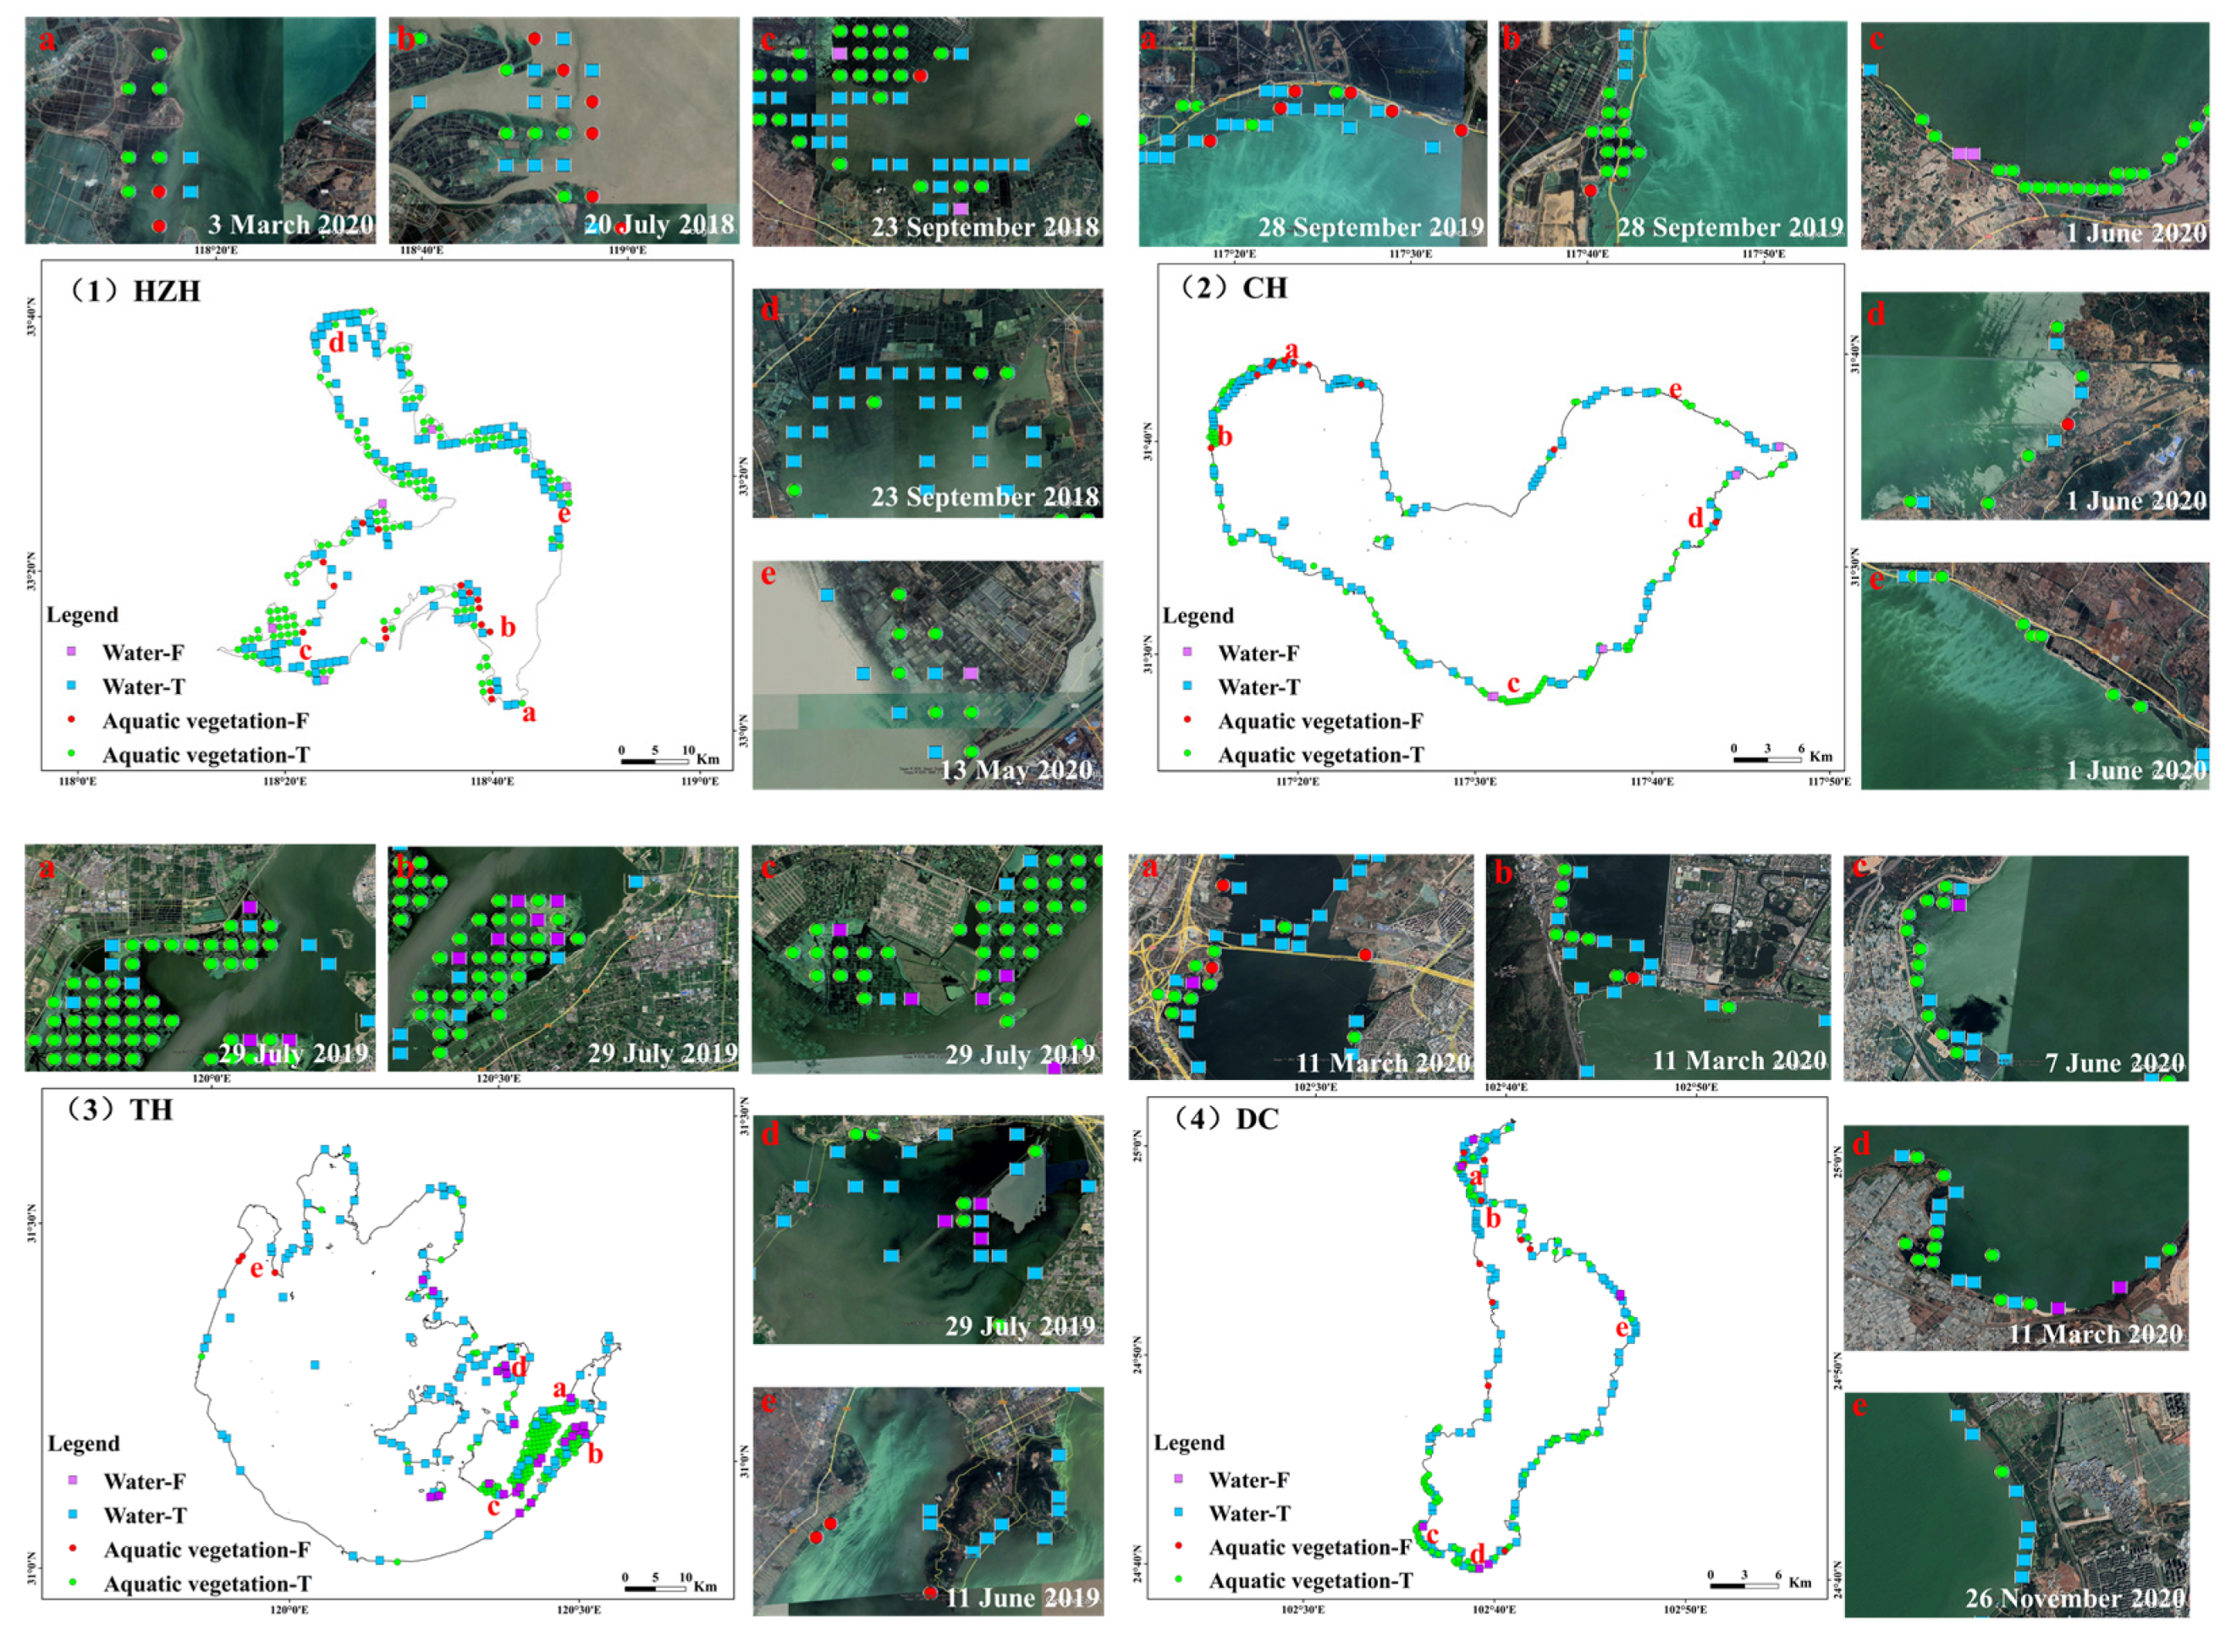
3.3. Precision Validation Results

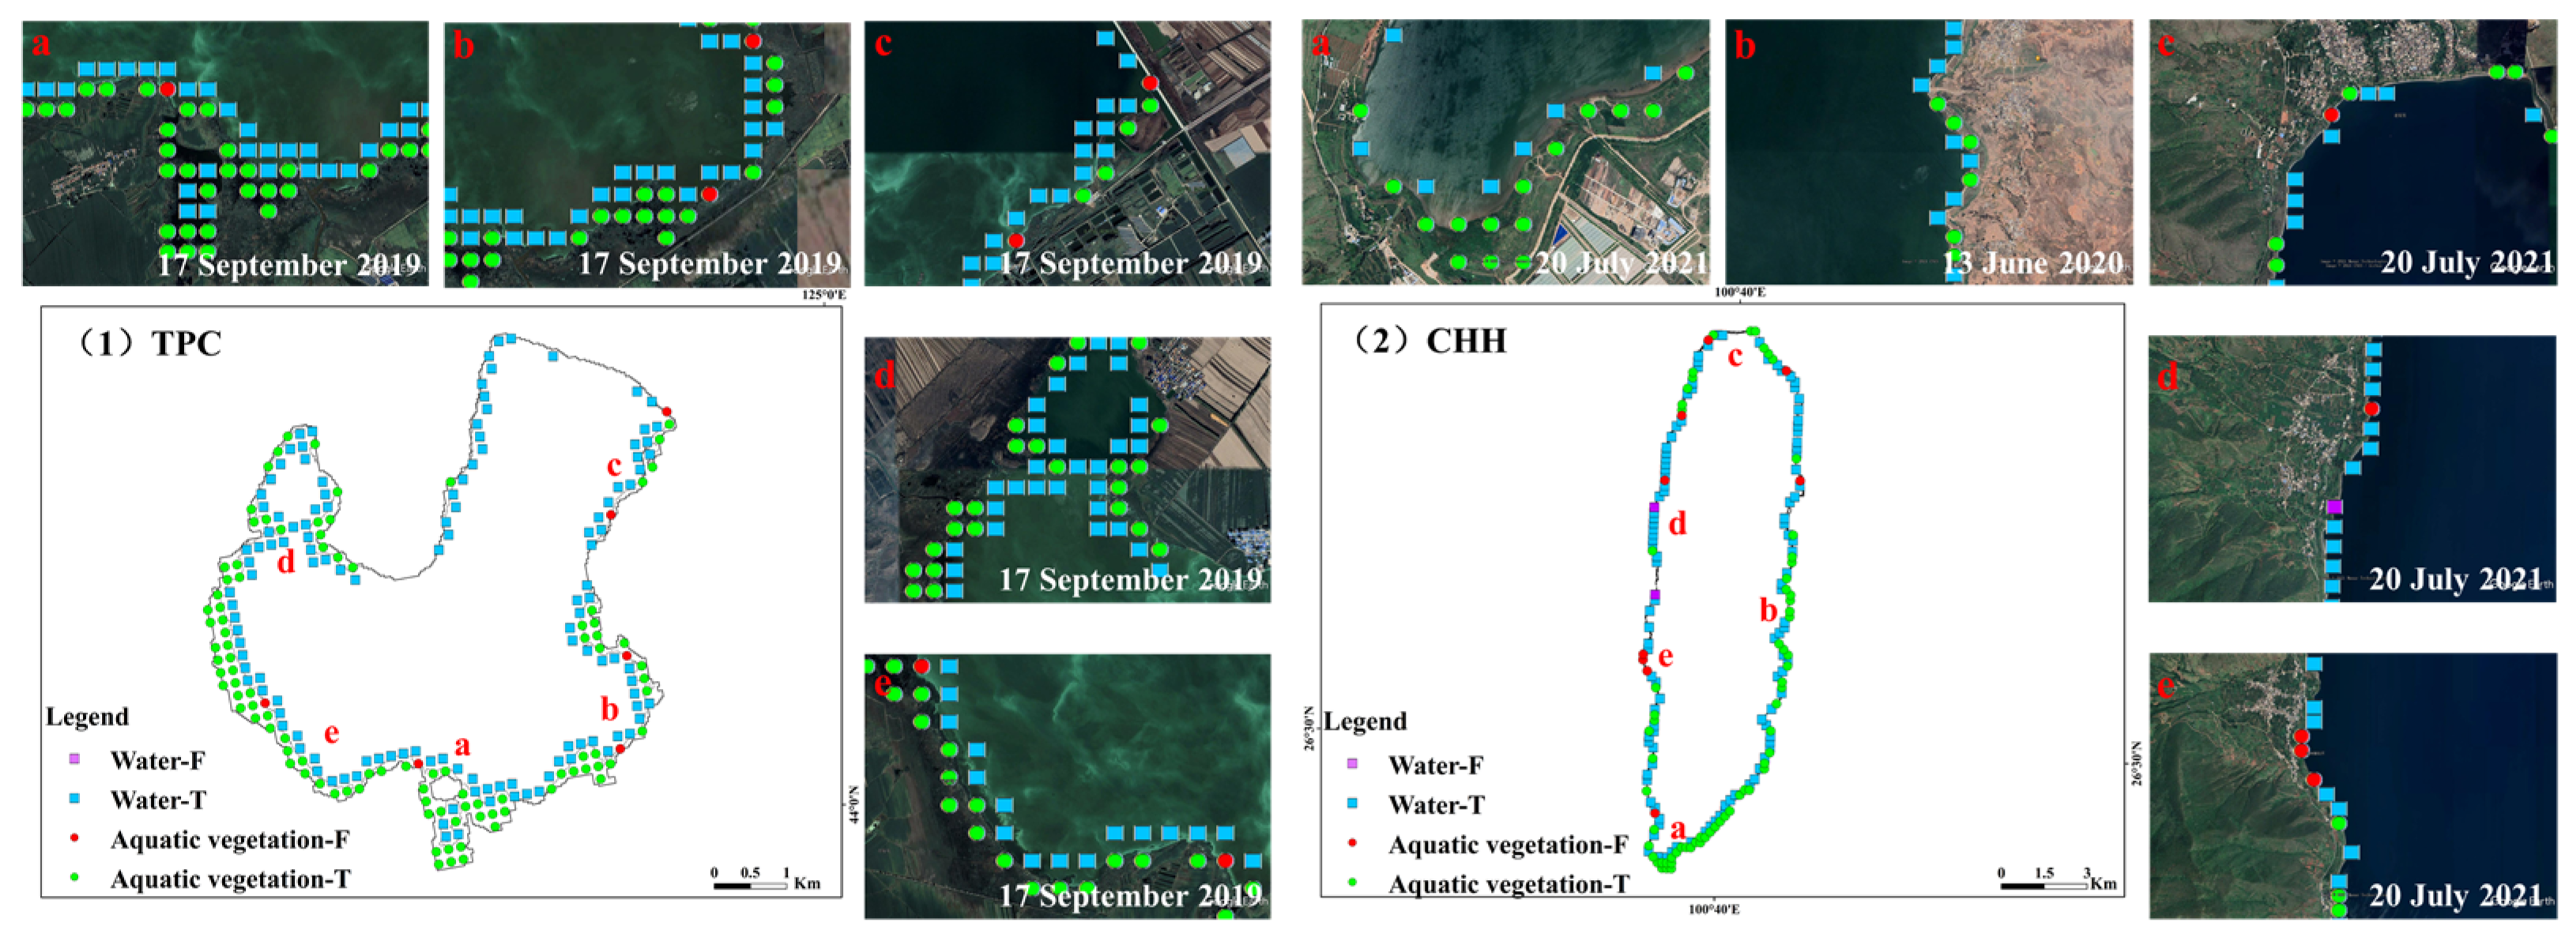
3.3.1. Precision of the Extraction of Algal Blooms and Aquatic Vegetation

We verified the accuracy of the extracted vegetation (algal blooms and aquatic vegetation) information by extracting the reflectance of some of the vegetation and water sample points for each lake. Those sample points were classified using the decision tree to verify its accuracy. The resulting confusion matrix is shown in Table 1.

3.3.2. Precision in Extracting the Extent of Aquatic Vegetation

The verification points were imported into Google Earth, and images with close dates were selected for verification. No recent image of Lake Hulun was available for summer. Therefore, Lake Hulun was excluded from accuracy calculation. The extraction results for Lake Hulun were evaluated by visual interpretation and compared to the original image. The accuracy validation results for the remaining four lakes are shown in Table 2.
The highest Pv value was 98.1% for Lake Taihu, and the lowest was 88.9% for Lake Hongze. The highest Pw value was 96% for Lake Chaohu, and the lowest was 82.8% for Lake Taihu. The Pv and Pw values represented the levels of overextraction and underextraction of the aquatic vegetation range, respectively. Thus, a lower Pv value indicates more overextraction of aquatic vegetation, while a lower Pw value reflects more underextraction of aquatic vegetation. The overall accuracy is the product of Pv and Pw. The precision Pn of the range of aquatic vegetation for Lake Chaohu, Lake Dianchi, Lake Hongze, and Lake Taihu were 87.7%, 85.2%, 85.0%, and 81.3%, respectively. The distribution of the validation points and validation results are shown in Figure 6.

3.3.3. Overall Accuracy of Identification

The extracted accuracy of the vegetation signal (including algal blooms and aquatic vegetation) multiplied by the extracted accuracy of the aquatic vegetation extent is presented as the overall accuracy of identifying algal blooms and aquatic vegetation. The results of the overall accuracy for identifying algal blooms and aquatic vegetation PT in each of the four lakes were:
PTCH = P × PnCH = 84.3%
PTDC = P × PnDC = 81.9%
PTHZH = P × PnHZH = 81.7%
PTTH = P × PnTH = 78.1%

4. Discussion

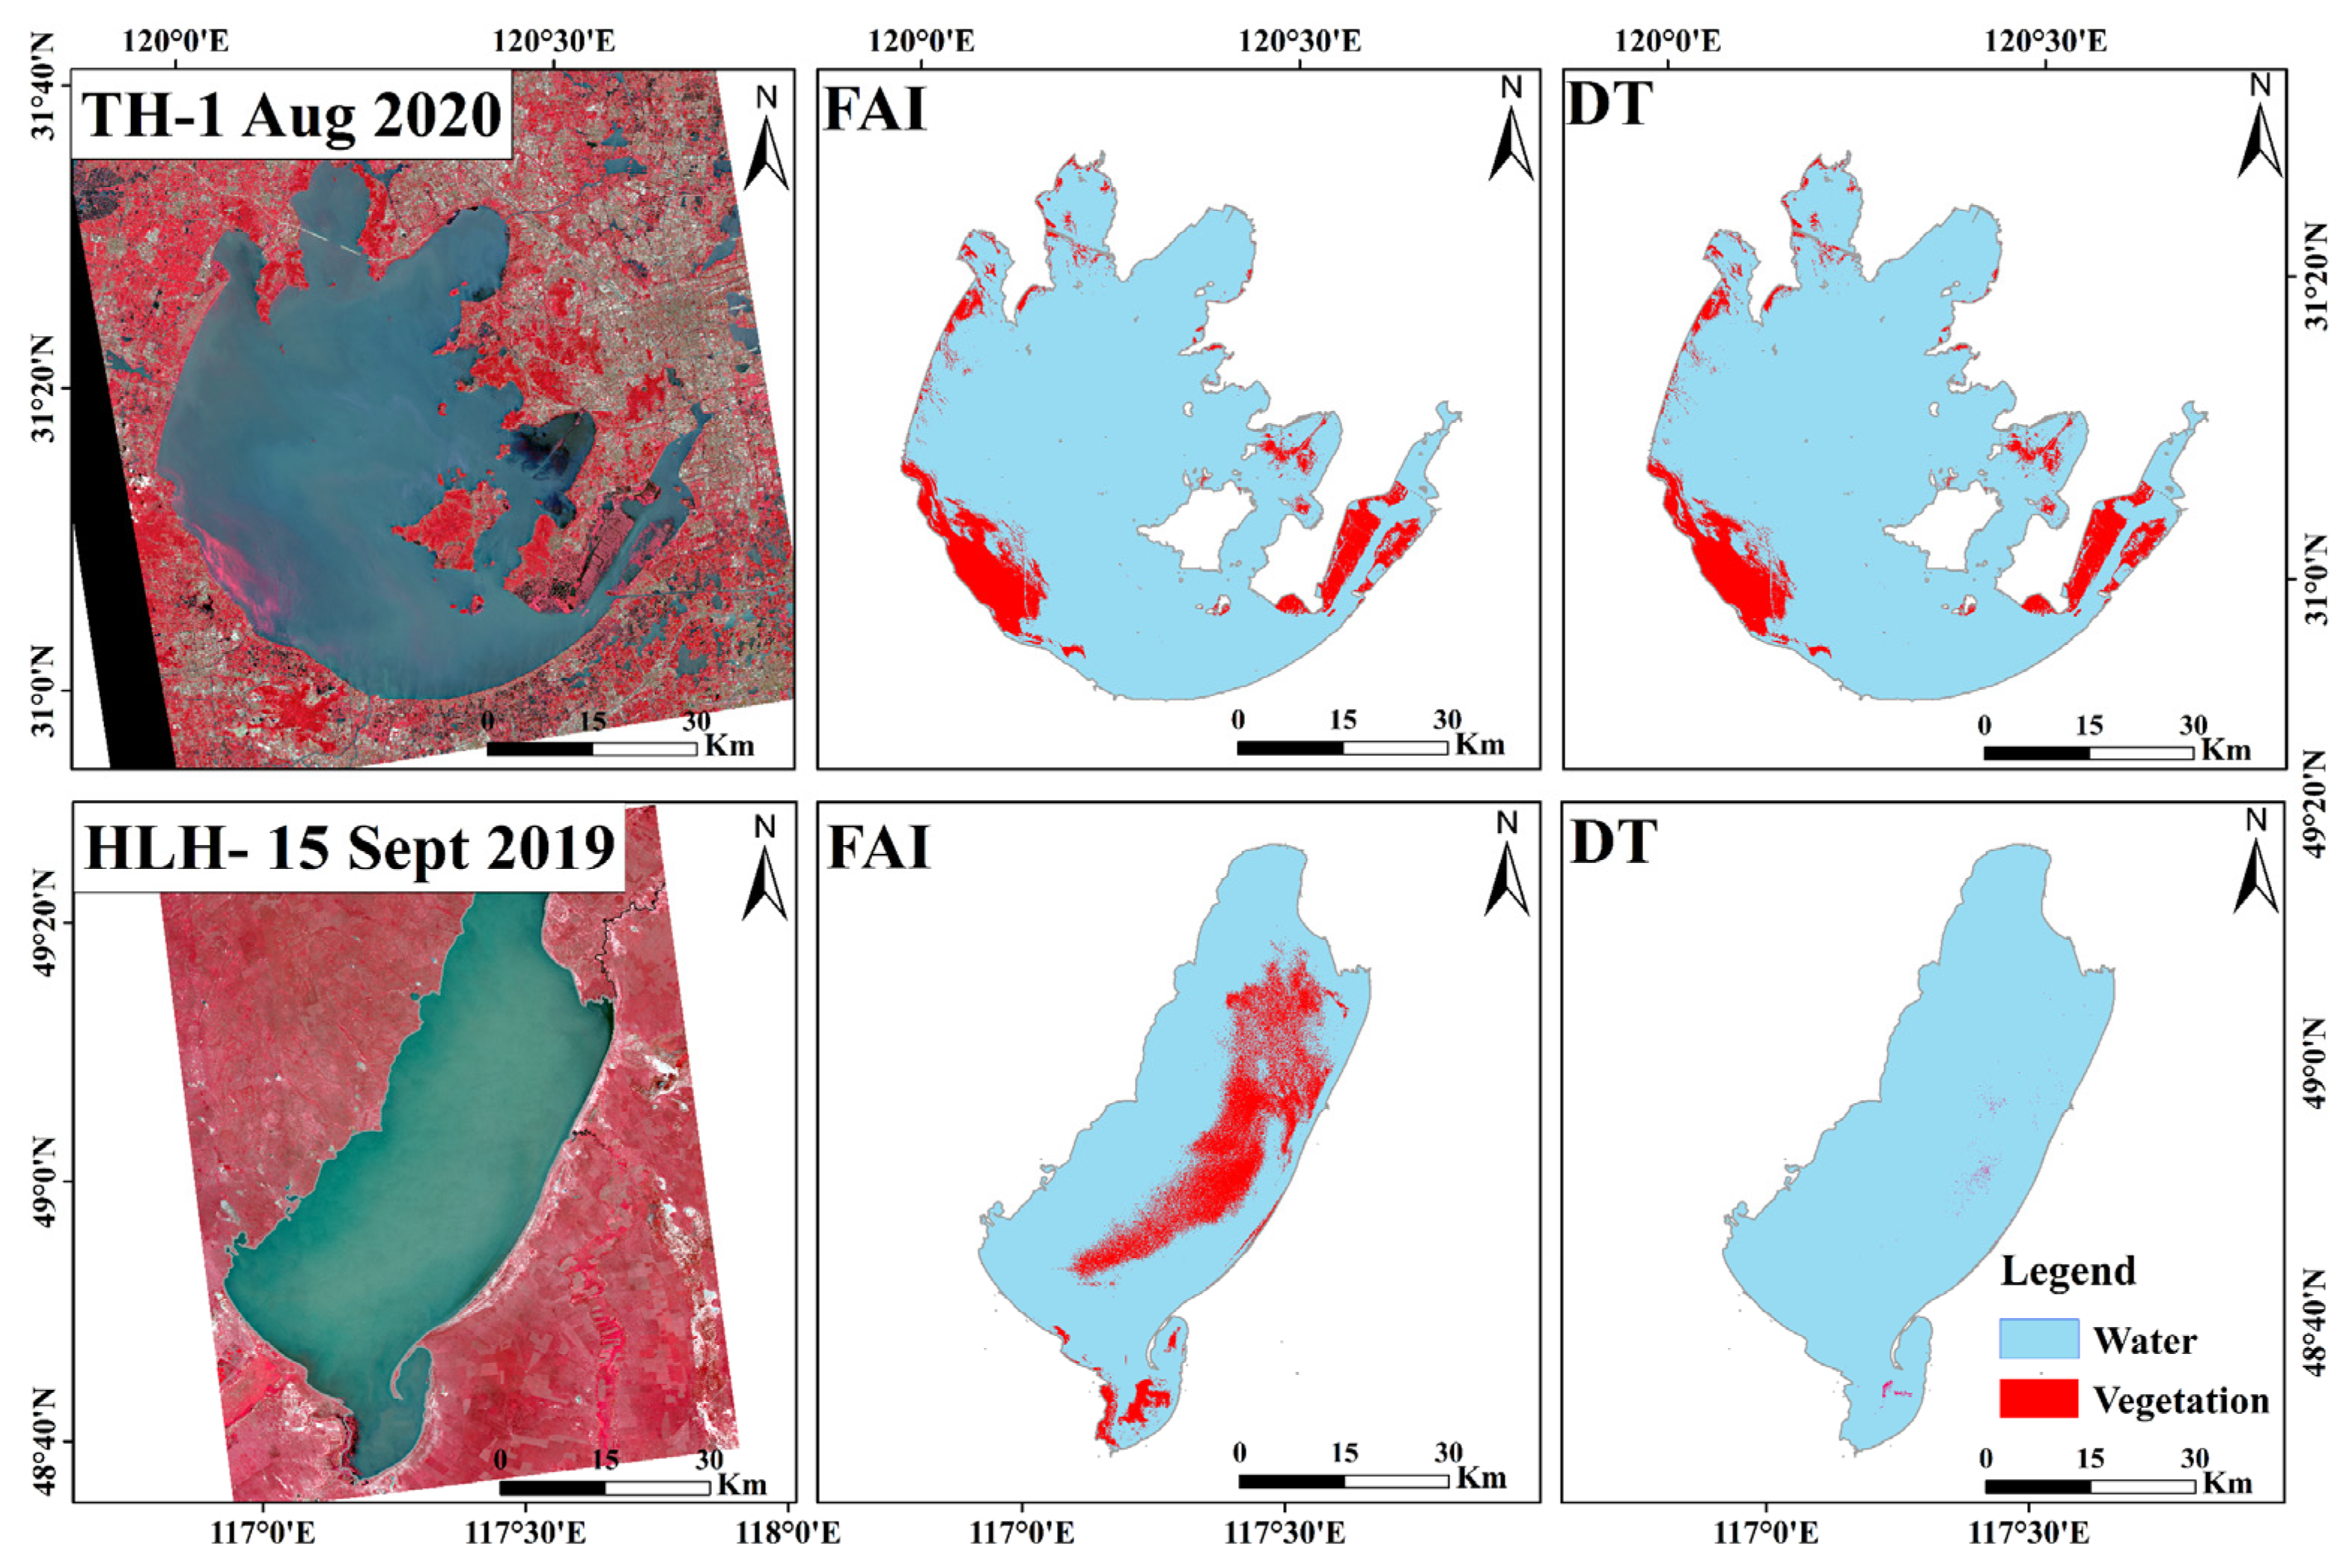
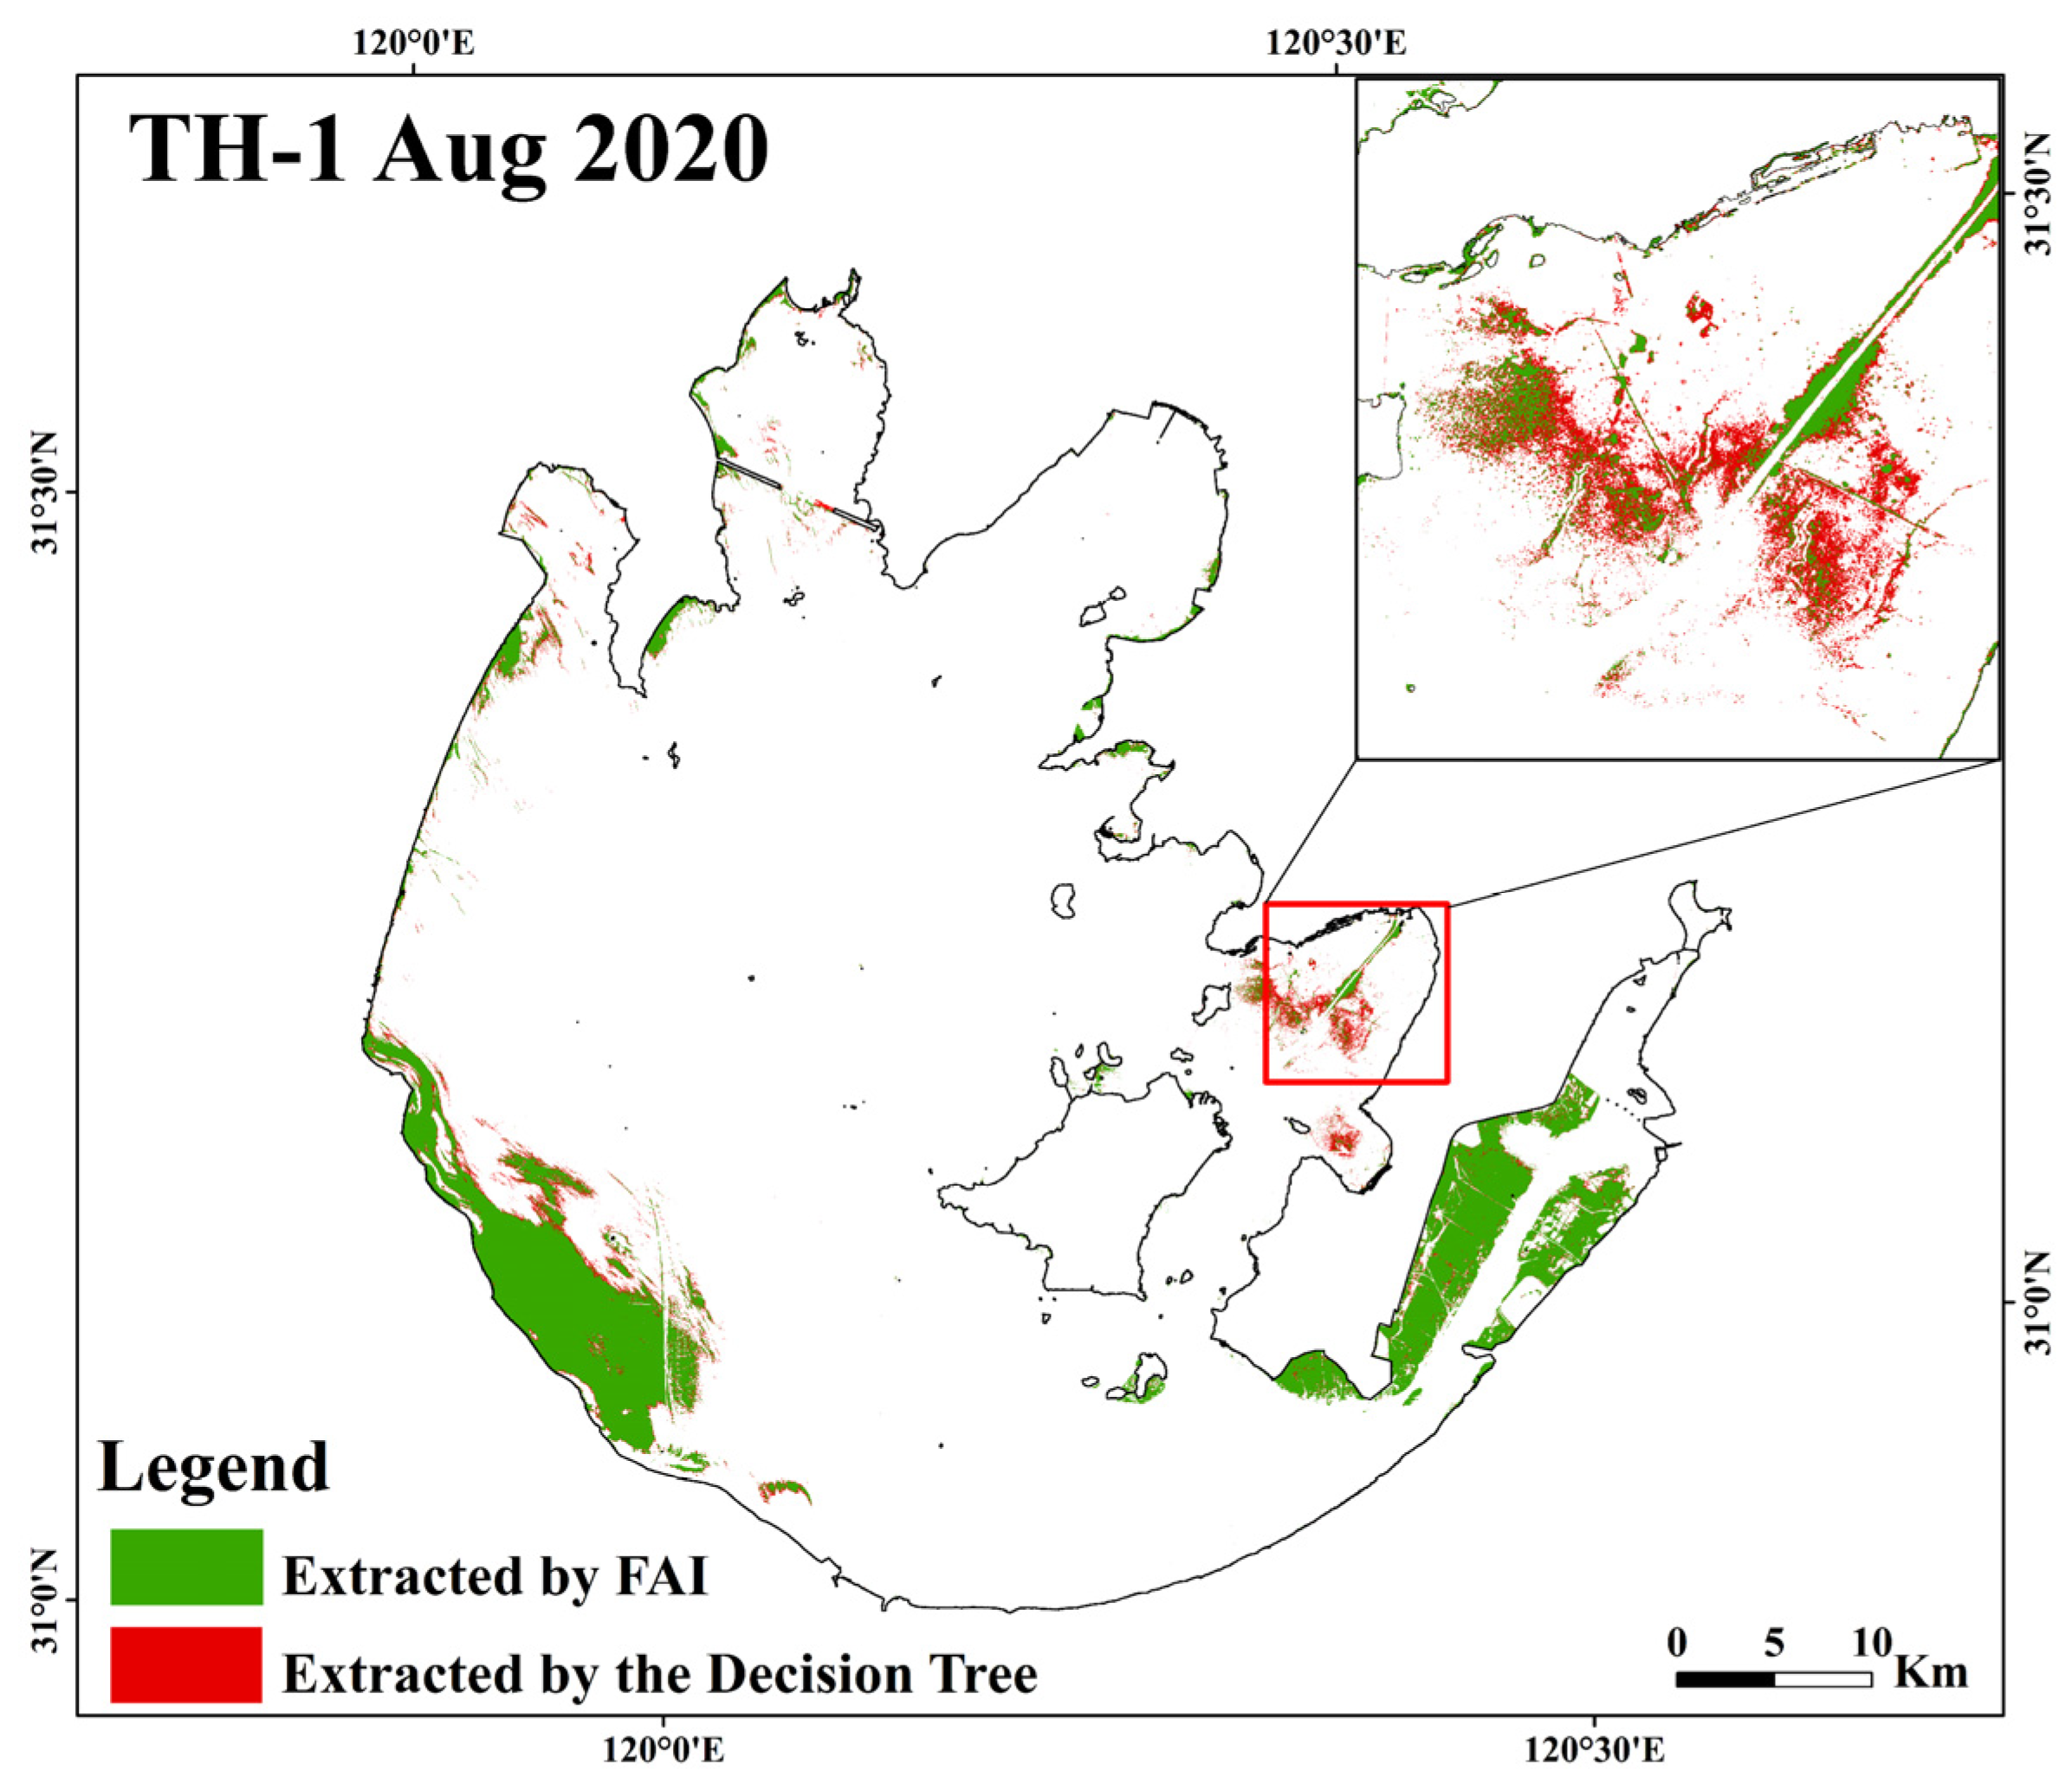
4.1. The Advantages of Model for Extracting Vegetation Information in Turbid Water

Despite the wide application of the FAI index to extract algal blooms and aquatic vegetation [13,24,25,26], it can only effectively extract vegetation information in lakes with low turbidity, e.g., Taihu Lake [27]. However, wind and wave conditions can significantly increase water turbidity near the shore, where the FAI is less applicable [24,28]. Although the mean annual turbidity of Lake Hulun was slightly lower than that of Lake Taihu, the turbidity in Lake Hulun was more variable [29,30]. In this study, we compared the FAI and decision trees in two lakes for the vegetation information extraction with different turbidity (Figure 7). In the standard false-color Sentinel 2 image in the single view image, the water in Lake Hulun was lighter and more yellowish compared to that in Lake Taihu. In the image of Lake Taihu on 1 August 2020, the results of the two extraction methods were very similar. Nevertheless, in Hulun (15 September 2019), there was no algal blooms in the highly turbid water, and a large amount of turbid water was mistaken for algal blooms when only the FAI method was used to extraction algal. Interestingly, this error did not occur with the decision tree, suggesting that a decision tree constructed using multiple indices could identify vegetation signal more accurately than a single index.
To further clarify the difference between decision trees and individual indices for extracting vegetation information, five different areas were selected to analyze their reflectance curves (Figure S2). The reflectance of turbid water bodies contains a large amount of spectral information of sediment, resulting in an elevated reflectance in both the red and infrared bands [23]. The strong elevation in the infrared caused the FAI values of some turbid waters to exceed 0 (Figure S2a). Therefore, when using the FAI to extract vegetation signals, the FAI threshold needs to be set higher to avoid interference from turbid waters. However, a strict FAI value could result in the missing of some vegetation signals with low NIR reflectance. This is particularly true for submerged vegetation where the reflectance spectrum is largely influenced by the absorption spectrum of the water. The high reflectance of vegetation in the NIR is absorbed by the water column, resulting in significantly lower reflectance in the NIR and lower FAI values (Figure S2b) [31,32]. However, its absorption in the red band was obvious, so the vegetation signal was effectively extracted by NDVI. In this study, the decision tree method (which combined NDVI with FAI) was used to analyze the vegetation signal in Lake Taihu (1 August 2020). The result showed that the missing of submerged vegetation extraction in Xukou Bay in Lake Taihu, in the process of applying the strict FAI threshold method, was complemented in the extraction results of the decision tree (Figure 8). NDVI was less interfered by turbid water signal when it was used to extract vegetation information. Furthermore, NDVI also has some advantages for extracting the information of submerged vegetation. However, when the algal blooms and aquatic vegetation all occurred in the water, especially the density of algal blooms was low with a very weak vegetation signal and a negative NDVI value, this part of the vegetation signal could be missed during extraction using NDVI. In this study, the decision tree that integrated NDWIR-SWIR, NDVI, and FAI was used to analyze the vegetation information in Lake Taihu (18 February 2020). Many marginal areas of the algal bloom, which were missed by both NDWIR-SWIR and NDVI, have been complementally extracted by FAI (Figure 9). The two most difficult parts of the vegetation signal extraction are submerged vegetation and marginal areas of algal blooms [28,33]. A broad threshold setting can help us to extract them in a single image. However, when adopted on a larger scale, such broad thresholds could lead to severe recognition errors. One important aspect of this is the misidentification of turbid water. The decision tree in this study kept each threshold setting strict to ensure the purity of the extracted vegetation information and combined the extracted results of the multiple indices. Thus, it can offer a complete distribution information of vegetation in turbid water.

4.2. Validation with the Absence of Actual Measurement Data

There was no actual measurement data involved in the validation. To reconfirm the accuracy of the decision tree, we verified the identification results through literature search and image comparison. Studies related to each lake were searched separately for Hulun Lake [34,35]; Hongze Lake [36,37]; Chaohu Lake [11,38,39]; Taihu Lake [11,22,40]; and Dianchi Lake [41]. In general, the distribution ranges of algal blooms and aquatic vegetation in this study are in agreement with the results of earlier studies. However, we also noted some differences at three sites (marked by red circles in Figure 5). Firstly, Lake Hongze is the fourth largest freshwater lake in China and an important water hub in Jiangsu province. Its water level fluctuates significantly due to human activities (e.g., irrigation and flood control), with significant water level gaps occurring within a month [42]. Therefore, inundation and surfacing of aquatic plants, as well as growth in water and death from lack of water, can happen. Human activities also directly or indirectly contribute to changes in the area of aquatic vegetation in Lake Hongze [36]. This explains the highly unstable extent of aquatic vegetation in Lake Hongze in the satellite images. It was also difficult to obtain the maximum extension of aquatic vegetation in Lake Hongze using the VPF method. For the area in the red circle in Figure 5, the bottom of the lake was exposed due to a significantly lower water level. This area was identified as an algal bloom area because it was not within the range of aquatic vegetation. The second is in Lake Taihu, with some error points located in Xukou Bay within the red circle. This area is dominated by submerged vegetation [20]. The vegetation characteristics of the reflectance spectrum of submerged vegetation are not obvious, and the decision tree could extract only them at the peak growth stage in a short period, hence the low VPF values in the region. The submerged vegetation of Lake Taihu on 1 August and 5 October 2020 (within the red circle areas in Figure 5) was classified as algal blooms due to very low VPF values. Finally, in Lake Dianchi, the Caohai in the northern part of the lake is an important distribution area for aquatic vegetation [41,43]. However, the area of Caohai within the range of aquatic vegetation extracted in this study is very small. The key reason for this is that Dianchi is located in a climatic zone with frequent rainfall in summer and very few images are available. This resulted in the main available images being from the autumn and winter, which led to an underextraction of the summer vegetation extent.
In summary, the VPF method could accurately and stably identify algal blooms and aquatic vegetation for lakes characterized by area with stable aquatic vegetation and less frequent algal blooms (e.g., Lake Hulun). Despite the relatively poor image quality in some cases, the VPF method could still accurately identify algal blooms and aquatic vegetation. However, the VPF method needs to be further optimized for lakes with complex aquatic vegetation types, large changes in the vegetated area in summer, or long periods of algal cover, such as Lake Taihu and Lake Hongze, and lakes with little summer image, such as Lake Dianchi.

4.3. Spatial Transferability of the Model

To verify the wide applicability of the method, we applied the method to the Taipingchi Reservoir and Lake Chenghai. The VPF calculation time range for Taipingchi Reservoir is July–September and the VPF threshold is 0.8. The VPF calculation time range for Lake Chenghai is June–October and the VPF threshold is 0.6. The identification results are shown in Figure 10.
The accuracy of the aquatic vegetation extraction results was verified in Google Maps. The verification results are shown in Table 3. The accuracies of the aquatic vegetation extent extraction for Taipingchi Reservoir were 92.23% and 86.65% for Lake Chenghai, respectively. Figure 11 illustrates the specific distribution of the results. Apparently, the method in this paper can work effectively in both Taipingchi Reservoir (with frequent algal blooms) and Lake Chenghai (with less frequent algal blooms).
The two lakes are located in different lake areas, spanning a large north–south area and with different vegetation types. Both lakes can be effectively identified using the improved VPF method. The good validation results clearly demonstrate the wide applicability of the method. This method could be further validated in other lakes in China in the future.

4.4. Analysis of Advantages and Disadvantages

Liu proposed the VPF index in 2015 and used MODIS images to differentiate between aquatic vegetation and algal bloom areas in Lake Taihu. In Liu’s method, the year was divided into three growth stages based on seasonal changes of algal blooms and aquatic vegetation (i.e., Wintering Aquatic Vegetation period, prolonged coexisting Algal Bloom and Wintering Aquatic Vegetation period, and the peak of coexisting Algal Bloom and Aquatic Vegetation period). Water depth data were added to obtain the growth range of aquatic vegetation based on FAI and VPF [13]. First, it is difficult to make such a detailed division of growth stages in the absence of measured data. Second, depth data for the whole lake are not readily available. Moreover, due to the varieties of climate types and lakes in China, this method could not be widely applied to other lakes.
The original method was therefore adapted for this paper. First, we merely identified a growth period (i.e., when the vegetation is actively growing and stable), allowing the adapted method to be applied by fully relying on remotely sensed image (without any field and water depth of the lake). Secondly, we used Sentinel 2 images with high spatial resolution as the data source, which can greatly enhance identification accuracy. Finally, we utilized a decision tree method instead of extracting vegetation signals using only the FAI, resulting in more accurate vegetation information.
However, the modeling data used in this paper were extracted by visual interpretation. The thresholds were selected based on SPSS automatic classification with artificial segmentation within a certain interval. Thus, the extracted vegetation signals might be somewhat subjective. More scientific classification thresholds could be obtained with more validation against field data in the future.
The advantages and disadvantages of the improved VPF method are as follows:
Advantages: Wide range of applications, simple implementation methods, and no field data required. The distinction between algal blooms and aquatic vegetation is made by the frequency index of the vegetation signal. The results are derived from multiple images. They are stable, exclude environmental factors (e.g., thin clouds), and require lower image quality. The method can effectively distinguish between algal blooms and aquatic vegetation even in the absence of measured data.
Disadvantages: Many images are required from the summer months when the aquatic vegetation is in full growth. With more images, a more stable range of aquatic vegetation can be extracted. However, for subtropical lakes (e.g., Lake Dianchi) with plenty of rain in summer and few high-quality images, it is difficult to extract the maximum extent of aquatic vegetation in summer using the VPF method. Therefore, it is difficult to fully distinguish between algal blooms and aquatic vegetation without adequate satellite image.

5. Conclusions

Based on multiple indices and the modified vegetation presence frequency (VPF), this study accurately extracted and distinguished algal bloom and submerged vegetation using Sentinel 2 images (without considering field measured data). This method effectively addressed the interference of turbid water bodies. The spatial transferability of the method was also verified in the other independent lakes with satisfactory accuracy. This indicates the prospects of its general application to distinguish algal blooms from aquatic vegetation in turbid water bodies under stable water levels and adequate satellite images.
Overall, the method developed here can effectively differentiate algal blooms from aquatic vegetation with good stability and it can avoid interference from thin clouds and other factors. Therefore, it might be feasible for large-scale classification and identification of aquatic vegetation and algal blooms. It might also provide a reference for distinguishing other features with similar spectral characteristics.

Supplementary Materials

The following supporting information can be downloaded at: https://www.mdpi.com/article/10.3390/rs14091988/s1, Figure S1: Flow chart for identifying algal blooms and aquatic vegetation in Sentinel 2 images; Figure S2: Reflectance spectral curves for the five features, figure (a) water group, black curve for normal water, red curve for highly turbid water; figure (b) vegetation group, black curve for normal algal blooms, blue curve for inconspicuous algal blooms (marginal areas of algal blooms) and red curve for submerged vegetation; Table S1: Basic information on seven lakes covered in the article; Table S2: Temporal distribution of downloaded Sentinel 2 images of the five lakes used for modelling. References [13,27,44,45,46,47,48,49] are cited in the supplementary materials.

Author Contributions

Conceptualization, J.P. and K.S.; methodology, J.P. and G.L.; validation, J.P.; formal analysis, J.P.; writing—original draft preparation, J.P.; review and editing, Z.W. and C.F.; visualization, J.P. and J.H.; supervision, Z.W.; funding acquisition, K.S. and Y.L. All authors have read and agreed to the published version of the manuscript.

Funding

This research was jointly supported by the National Key Research and Development Program of China (2019YFA0607101), the Youth Innovation Promotion Association of Chinese Academy of Sciences, China (2020234), the National Natural Science Foundation of China (42171374, 42171385, 41971322, 41730104), the China Postdoctoral Science Foundation (2020M681056), the Research Instrument and Equipment Development Project of Chinese Academy of Sciences (YJKYYQ20190044), and the National Earth System Science Data Center, China. Available online: http://www.geodata.cn (accessed on 25 November 2021).

Data Availability Statement

Not applicable.

Conflicts of Interest

The authors declare no conflict of interest.

References

  1. Jeppesen, E.; Sondergaard, M.; Jensen, J.P.; Kanstrup, E.; Petersen, B. Macrophytes and turbidity in brackish lakes with special emphasis on the role of top-down control. In Proceedings of the Workshop on the Structuring Role of Submerged Macrophytes in Lakes, Freshwater Ctr, Silkeborg, Denmark, 16–20 June 1996. [Google Scholar]
  2. Scheffer, M.; Hosper, S.H.; Meijer, M.L.; Moss, B.; Jeppesen, E. Alternative Equilibria in Shallow Lakes. Trends Ecol. Evol. 1993, 8, 275–279. [Google Scholar] [CrossRef]
  3. Anderson, D.M.; Glibert, P.M.; Burkholder, J.M. Harmful algal blooms and eutrophication: Nutrient sources, composition, and consequences. Estuaries 2002, 25, 704–726. [Google Scholar] [CrossRef]
  4. Wells, M.L.; Trainer, V.L.; Smayda, T.J.; Karlson, B.S.O.; Trick, C.G.; Kudela, R.M.; Ishikawa, A.; Bernard, S.; Wulff, A.; Anderson, D.M.; et al. Harmful algal blooms and climate change: Learning from the past and present to forecast the future. Harmful Algae 2015, 49, 68–93. [Google Scholar] [CrossRef] [Green Version]
  5. Harke, M.J.; Steffen, M.M.; Gobler, C.J.; Otten, T.G.; Wilhelm, S.W.; Wood, S.A.; Paerl, H.W. A review of the global ecology, genomics, and biogeography of the toxic cyanobacterium, Microcystis spp. Harmful Algae 2016, 54, 4–20. [Google Scholar] [CrossRef] [Green Version]
  6. Ho, J.C.; Michalak, A.M.; Pahlevan, N. Widespread global increase in intense lake phytoplankton blooms since the 1980s. Nature 2019, 574, 667–670. [Google Scholar] [CrossRef]
  7. Paerl, H.W.; Otten, T.G. Harmful Cyanobacterial Blooms: Causes, Consequences, and Controls. Microb. Ecol. 2013, 65, 995–1010. [Google Scholar] [CrossRef]
  8. Sellner, K.G.; Doucette, G.J.; Kirkpatrick, G.J. Harmful algal blooms: Causes, impacts and detection. J. Ind. Microbiol. Biotechnol. 2003, 30, 383–406. [Google Scholar] [CrossRef]
  9. Gorelick, N.; Hancher, M.; Dixon, M.; Ilyushchenko, S.; Thau, D.; Moore, R. Google Earth Engine: Planetary-scale geospatial analysis for everyone. Remote Sens. Environ. 2017, 202, 18–27. [Google Scholar] [CrossRef]
  10. Wynne, T.T.; Stumpf, R.P.; Tomlinson, M.C.; Dyble, J. Characterizing a cyanobacterial bloom in western Lake Erie using satellite imagery and meteorological data. Limnol. Oceanogr. 2010, 55, 2025–2036. [Google Scholar] [CrossRef] [Green Version]
  11. Junsheng, L.; Di, W.; Yuanfeng, W.; Haixia, L.; Xi, S.; Hao, Z. Identification of algae-bloom and aquatic macrophytes in Lake Taihu from in-situ measured spectra data. Lake Sci. 2009, 21, 215–222. [Google Scholar] [CrossRef] [Green Version]
  12. Oyama, Y.; Matsushita, B.; Fukushima, T. Distinguishing surface cyanobacterial blooms and aquatic macrophytes using Landsat/TM and ETM plus shortwave infrared bands. Remote Sens. Environ. 2015, 157, 35–47. [Google Scholar] [CrossRef]
  13. Liu, X.; Zhang, Y.; Shi, K.; Zhou, Y.; Tang, X.; Zhu, G.; Qin, B. Mapping Aquatic Vegetation in a Large, Shallow Eutrophic Lake: A Frequency-Based Approach Using Multiple Years of MODIS Data. Remote Sens. 2015, 7, 10295–10320. [Google Scholar] [CrossRef] [Green Version]
  14. Liang, Q.; Zhang, Y.; Ma, R.; Loiselle, S.; Li, J.; Hu, M. A MODIS-Based Novel Method to Distinguish Surface Cyanobacterial Scums and Aquatic Macrophytes in Lake Taihu. Remote Sens. 2017, 9, 133. [Google Scholar] [CrossRef] [Green Version]
  15. Zhu, Q.; Li, J.; Zhang, F.; Shen, Q. Distinguishing Cyanobacterial Bloom from Floating Leaf Vegetation in Lake Taihu Based on Medium-Resolution Imaging Spectrometer (MERIS) Data. IEEE J. Sel. Top. Appl. Earth Obs. Remote Sens. 2018, 11, 34–44. [Google Scholar] [CrossRef]
  16. Jiang, H.; Zhao, D.; Cai, Y.; An, S. A Method for Application of Classification Tree Models to Map Aquatic Vegetation Using Remotely Sensed Images from Different Sensors and Dates. Sensors 2012, 12, 12437–12454. [Google Scholar] [CrossRef] [Green Version]
  17. DomaÇ, A.; Süzen, M.L. Integration of environmental variables with satellite images in regional scale vegetation classification. Int. J. Remote Sens. 2006, 27, 1329–1350. [Google Scholar] [CrossRef]
  18. Filippi, A.M.; Jensen, J.R. Fuzzy learning vector quantization for hyperspectral coastal vegetation classification. Remote Sens. Environ. 2006, 100, 512–530. [Google Scholar] [CrossRef]
  19. Dogan, O.K.; Akyurek, Z.; Beklioglu, M. Identification and mapping of submerged plants in a shallow lake using quickbird satellite data. J. Environ. Manag. 2009, 90, 2138–2143. [Google Scholar] [CrossRef]
  20. Luo, J.; Ma, R.; Duan, H.; Hu, W.; Zhu, J.; Huang, W.; Lin, C. A New Method for Modifying Thresholds in the Classification of Tree Models for Mapping Aquatic Vegetation in Taihu Lake with Satellite Images. Remote Sens. 2014, 6, 7442–7462. [Google Scholar] [CrossRef] [Green Version]
  21. Ma, R.; Duan, H.; Gu, X.; Zhang, S. Detecting aquatic vegetation changes in Taihu Lake, China using multi-temporal satellite imagery. Sensors 2008, 8, 3988–4005. [Google Scholar] [CrossRef] [Green Version]
  22. Shi, K.; Zhang, Y.; Zhou, Y.; Liu, X.; Zhu, G.; Qin, B.; Gao, G. Long-term MODIS observations of cyanobacterial dynamics in Lake Taihu: Responses to nutrient enrichment and meteorological factors. Sci. Rep. 2017, 7, 40326. [Google Scholar] [CrossRef] [PubMed] [Green Version]
  23. Feng, L.; Hou, X.; Liu, J.; Zheng, C. Unrealistic phytoplankton bloom trends in global lakes derived from Landsat measurements. Nature 2020. [Google Scholar] [CrossRef]
  24. Hu, C.; Lee, Z.; Ma, R.; Yu, K.; Li, D.; Shang, S. Moderate Resolution Imaging Spectroradiometer (MODIS) observations of cyanobacteria blooms in Taihu Lake, China. J. Geophys. Res. Ocean. 2010, 115. [Google Scholar] [CrossRef] [Green Version]
  25. Hu, C.; Cannizzaro, J.; Carder, K.L.; Muller-Karger, F.E.; Hardy, R. Remote detection of Trichodesmium blooms in optically complex coastal waters: Examples with MODIS full-spectral data. Remote Sens. Environ. 2010, 114, 2048–2058. [Google Scholar] [CrossRef]
  26. Zhang, C.X.; Pei, H.C.; Jia, Y.F.; Bi, Y.L.; Lei, G.C. Effects of air quality and vegetation on algal bloom early warning systems in large lakes in the middle-lower Yangtze River basin. Environ. Pollut. 2021, 285, 117455. [Google Scholar] [CrossRef]
  27. Hu, C. A novel ocean color index to detect floating algae in the global oceans. Remote Sens. Environ. 2009, 113, 2118–2129. [Google Scholar] [CrossRef]
  28. Bloesch, J. Mechanisms, Measurement and Importance of Sediment Resuspension in Lakes. Mar. Freshw. Res. 1995, 46, 295–304. [Google Scholar] [CrossRef]
  29. Shi, K.; Zhang, Y.; Zhu, G.; Liu, X.; Zhou, Y.; Xu, H.; Qin, B.; Liu, G.; Li, Y. Long-term remote monitoring of total suspended matter concentration in Lake Taihu using 250 m MODIS-Aqua data. Remote Sens. Environ. 2015, 164, 43–56. [Google Scholar] [CrossRef]
  30. Wang, Q.; Song, K.S.; Wen, Z.D.; Shang, Y.X.; Li, S.J.; Fang, C.; Du, J.; Zhao, F.R.; Liu, G. Long-term remote sensing of total suspended matter using Landsat series sensors in Hulun Lake, China. Int. J. Remote Sens. 2021, 42, 1379–1397. [Google Scholar] [CrossRef]
  31. Palmer, K.F.; Williams, D.J.J. Optical properties of water in the near infrared. JOSA 1974, 64, 1107–1110. [Google Scholar] [CrossRef]
  32. Hoffer, R.M. Biological and physical considerations in applying computer-aided analysis techniques to remote sensor data. In Remote Sensing: The Quantitative Approach; McGraw-Hill: New York, NY, USA, 1978; pp. 227–289. [Google Scholar]
  33. Luo, J.; Duan, H.; Ma, R.; Jin, X.; Li, F.; Hu, W.; Shi, K.; Huang, W. Mapping species of submerged aquatic vegetation with multi-seasonal satellite images and considering life history information. Int. J. Appl. Earth Obs. Geoinf. 2017, 57, 154–165. [Google Scholar] [CrossRef] [Green Version]
  34. Wang, N. A Comparative Study of the Ecosystem Structure and Aquatic Evolution of Lakes in the Great Lakes Region of China. Master’s Thesis, Nanjing University, Nanjing, China, 2012. [Google Scholar]
  35. Fang, C.; Song, K.S.; Shang, Y.X.; Ma, J.H.; Wen, Z.D.; Du, J. Remote Sensing of Harmful Algal Blooms Variability for Lake Hulun Using Adjusted FM (AFAI) Algorithm. J. Environ. Inform. 2019, 34, 108–122. [Google Scholar] [CrossRef]
  36. Yu, K.; Hu, C.M. Changes in vegetative coverage of the Hongze Lake national wetland nature reserve: A decade-long assessment using MODIS medium-resolution data. J. Appl. Remote Sens. 2013, 7, 073589. [Google Scholar] [CrossRef] [Green Version]
  37. Ruan, R.Z.; Zhang, L. Changes of Hongze Lake Wetlands in the Past Three Decades. In Proceedings of the 6th International Conference on Wireless Communications, Networking and Mobile Computing (WICOM), Chengdu, China, 23–25 September 2010; IEEE: New York, NY, USA, 2010. [Google Scholar]
  38. Zhang, Y.; Ma, R.; Zhang, M.; Duan, H.; Loiselle, S.; Xu, J. Fourteen-Year Record (2000–2013) of the Spatial and Temporal Dynamics of Floating Algae Blooms in Lake Chaohu, Observed from Time Series of MODIS Images. Remote Sens. 2015, 7, 10523–10542. [Google Scholar] [CrossRef] [Green Version]
  39. Ma, J.Y.; Jin, S.G.; Li, J.; He, Y.; Shang, W. Spatio-Temporal Variations and Driving Forces of Harmful Algal Blooms in Chaohu Lake: A Multi-Source Remote Sensing Approach. Remote Sens. 2021, 13, 427. [Google Scholar] [CrossRef]
  40. Shi, K.; Zhang, Y.; Zhang, Y.; Li, N.; Qin, B.; Zhu, G.; Zhou, Y. Phenology of Phytoplankton Blooms in a Trophic Lake Observed from Long-Term MODIS Data. Environ. Sci. Technol. 2019, 53, 2324–2331. [Google Scholar] [CrossRef]
  41. Zhang, T.; Hu, H.; Ma, X.; Zhang, Y. Long-Term Spatiotemporal Variation and Environmental Driving Forces Analyses of Algal Blooms in Taihu Lake Based on Multi-Source Satellite and Land Observations. Water 2020, 12, 1035. [Google Scholar] [CrossRef] [Green Version]
  42. Cai, Y.; Ke, C.Q.; Shen, X.Y. Variations in water level, area and volume of Hongze Lake, China from 2003 to 2018. J. Great Lakes Res. 2020, 46, 1511–1520. [Google Scholar] [CrossRef]
  43. Jing, Y.; Zhang, Y.; Hu, M.; Chu, Q.; Ma, R. MODIS-Satellite-Based Analysis of Long-Term Temporal-Spatial Dynamics and Drivers of Algal Blooms in a Plateau Lake Dianchi, China. Remote Sens. 2019, 11, 2582. [Google Scholar] [CrossRef] [Green Version]
  44. Song, K.; Fang, C.; Jacinthe, P.A.; Wen, Z.; Liu, G.; Xu, X.; Shang, Y.; Lyu, L. Climatic versus Anthropogenic Controls of Decadal Trends (1983–2017) in Algal Blooms in Lakes and Reservoirs across China. Environ. Sci. Technol. 2021, 55, 2929–2938. [Google Scholar] [CrossRef]
  45. Dong, B.; Qin, B.; Gao, G.; Cai, X. Submerged macrophyte communities and the controlling factors in large, shallow Lake Taihu (China): Sediment distribution and water depth. J. Great Lakes Res. 2014, 40, 646–655. [Google Scholar] [CrossRef]
  46. Huete, A.; Didan, K.; Miura, T.; Rodriguez, E.P.; Gao, X.; Ferreira, L.G. Overview of the radiometric and biophysical performance of the MODIS vegetation indices. Remote Sens. Environ. 2002, 83, 195–213. [Google Scholar] [CrossRef]
  47. Shi, Y.; Jin, N.; Ma, X.; Wu, B.; He, Q.; Yue, C.; Yu, Q. Attribution of climate and human activities to vegetation change in China using machine learning techniques. Agric. For. Meteorol. 2020, 294, 108146. [Google Scholar] [CrossRef]
  48. McFeeters, S.K. The use of the normalized difference water index (NDWI) in the delineation of open water features. Int. J. Remote Sens. 1996, 17, 1425–1432. [Google Scholar] [CrossRef]
  49. Gao, B.C. NDWI—A normalized difference water index for remote sensing of vegetation liquid water from space. Remote Sens. Environ. 1996, 58, 257–266. [Google Scholar] [CrossRef]
Figure 1. Locations and morphology of lakes and corresponding climatic zones. The blue lakes are the five lakes used for modeling and the green ones represent the two lakes used for method validation.
Remotesensing 14 01988 g001
Figure 2. (a) NDVI, (b) FAI, and (c) NDWIR-SWIR values for water bodies compared to vegetation (algal blooms and aquatic vegetation).
Remotesensing 14 01988 g002
Figure 3. Decision trees used to extract vegetation signals; variables used include NDVI, FAI, and NDWIR-SWIR.
Remotesensing 14 01988 g003
Figure 4. VPF values during periods with large areas of stable aquatic vegetation for (a) Lake Hulun, (b) Lake Hongze, (c) Lake Chaohu, (d) Lake Taihu, and (e) Lake Dianchi in Sentinel 2 images. The redder the area in the figure, the more frequently the vegetation signal has been present, the more probable the area is to be aquatic vegetation.
Remotesensing 14 01988 g004
Figure 5. This figure shows the results of the identification of algal blooms and aquatic vegetation in the studied lakes on selected dates of algal outbreaks, using the modified VPF method. The red areas represent algal blooms, and the green areas represent aquatic vegetation; (ae) are the identification results of Lake Hulun, Hongze, Chaohu, Taihu, and Dianchi, respectively. In the image, HLH means Lake Hulun, HZH means Lake Hongze, CH means Lake Chaohu, TH means Lake Taihu, and DC means Lake Dianchi. HLH-17 July 2019 means the image identification result of Lake Hulun on 17 July 2019. The numbers and letters following the abbreviations of the other lakes are the dates of the images.
Remotesensing 14 01988 g005
Figure 6. Distribution of validation points and validation results for Lake (1) Hongze, (2) Chaohu, (3) Taihu, and (4) Dianchi. Five points have been selected in different areas of each lake and their positions in the lake are marked by the letters a–e. The corresponding Google Maps images used for the verification and the results of the verification are shown in the five subimages (ae). The date of the image used for verification can be seen in the bottom right corner of each subimage. Aquatic vegetation-T/F are points within the range of aquatic vegetation. Water-T/F are points within the buffer zone outside the range of aquatic vegetation. T is the point verified as correct. F is points verified as incorrect.
Remotesensing 14 01988 g006
Figure 7. Results of vegetation signal extraction with FAI and decision trees (DT) in standard false-color (NIR, red, and green) images of Lake Taihu and Lake Hulun. “TH-1 Aug 2020” represents an image of Lake Taihu on 1 August 2020. “HLH-15 Sept 2019” represents an image of Lake Hulun on 15 September 2019.
Remotesensing 14 01988 g007
Figure 8. Comparison of the effect of vegetation extraction with strict FAI fetching and with the decision tree in Lake Tai on 1 August 2020.
Remotesensing 14 01988 g008
Figure 9. Extraction results of different indices by the decision tree for Lake Taihu on 18 February 2020. The order of decision tree extraction here is to extract first with NDWIR-SWIR, then with NDVI for the remaining part, and finally with FAI.
Remotesensing 14 01988 g009
Figure 10. Identification results of algal blooms and aquatic vegetation in nonmodeled lakes. TPC is Taipingchi Reservoir and CHH is Lake Chenghai. TPC-7 August 2019 means the image identification result of Taipingchi Reservoir on 7 August 2019, and so on for the letter and number meanings following other lake abbreviations.
Remotesensing 14 01988 g010
Figure 11. Distribution of validation points and validation results in nonmodeled Lakes, (1) TCP—Taipingchi Reservoir, (2) CHH—Lake Chenghai. Five points have been selected in different areas of each lake and their positions in the lake are marked by the letters ae. The corresponding Google Maps images used for the verification and the results of the verification are shown in the five subimages (ae). The date of the image used for verification can be seen in the bottom right corner of each subimages. Aquatic vegetation-T/F are points within the range of aquatic vegetation. Water-T/F are points within the buffer zone outside the range of aquatic vegetation. T is the point verified as correct. F is points verified as incorrect.
Remotesensing 14 01988 g011
Table 1. Confusion matrix for the accuracy validation of decision trees for extracting algal blooms and aquatic vegetation. The overall accuracy P and kappa coefficients were calculated separately in the table.
VegetationWaterUser PrecisionOverall Precision (P)Kappa
Vegetation3693092.5%96.1%92.3%
Water0375100%
Table 2. Validation points number and the calculated accuracy results for the extent of aquatic vegetation and the extent of nonaquatic vegetation buffered outwards for lakes.
LakesLake ChaohuLake DianchiLake HongzeLake Taihu
ResultsTFTFTFTF
Aquatic
vegetation
106108510120151563
Pv91.4%89.5%88. 9%98.1%
Nonaquatic vegetation12051397109511123
Pw96%95.2%95.6%82.8%
Pn87.7%85.2%85.0%81.3%
PV represents the accuracy within the range of aquatic vegetation. PW represents precision within the buffer zone outside the aquatic vegetation range. T represents the point verified as correct, i.e., the extraction of points within the aquatic vegetation range, where it was verified that aquatic vegetation was growing, or within the buffer zone outside the aquatic vegetation range, where it was verified that no aquatic vegetation was growing. F represents points verified as incorrect, i.e., the points within the aquatic vegetation range without significant vegetation growth in the area or within the buffer zone outside the aquatic vegetation range, where the occurrence of aquatic vegetation was verified. Pn represents the accuracy of aquatic vegetation extraction for lake n.
Table 3. The number of validation points and the calculated accuracy results for the extent of aquatic vegetation and the extent of nonaquatic vegetation buffered outwards for Taipingchi Reservoir and Lake Chenghai are shown.
LakesTaipingchiChenghai
ResultsTFTF
Aquatic vegetation986669
Pv94.23%88%
Nonaquatic vegetation12801122
Pw100%98.25%
Pn94.23%86.65%
PV represents the accuracy within the range of aquatic vegetation. PW represents precision within the buffer zone outside the aquatic vegetation range. T represents the point verified as correct, i.e., he extraction of points within the aquatic vegetation range, where it was verified that aquatic vegetation was growing, or within the buffer zone outside the aquatic vegetation range, where it was verified that no aquatic vegetation was growing. F represents points verified as incorrect, i.e., the points within the aquatic vegetation range without significant vegetation growth in the area or within the buffer zone outside the aquatic vegetation range, where the occurrence of aquatic vegetation was verified. Pn represents the accuracy of aquatic vegetation extraction for lake n.
Publisher’s Note: MDPI stays neutral with regard to jurisdictional claims in published maps and institutional affiliations.

