
Interferometric SAR Observation of Permafrost Status in the Northern Qinghai-Tibet Plateau by ALOS, ALOS-2 and Sentinel-1 between 2007 and 2021

 , , and
Abstract
:
1. Introduction
2. Study Area and Dataset
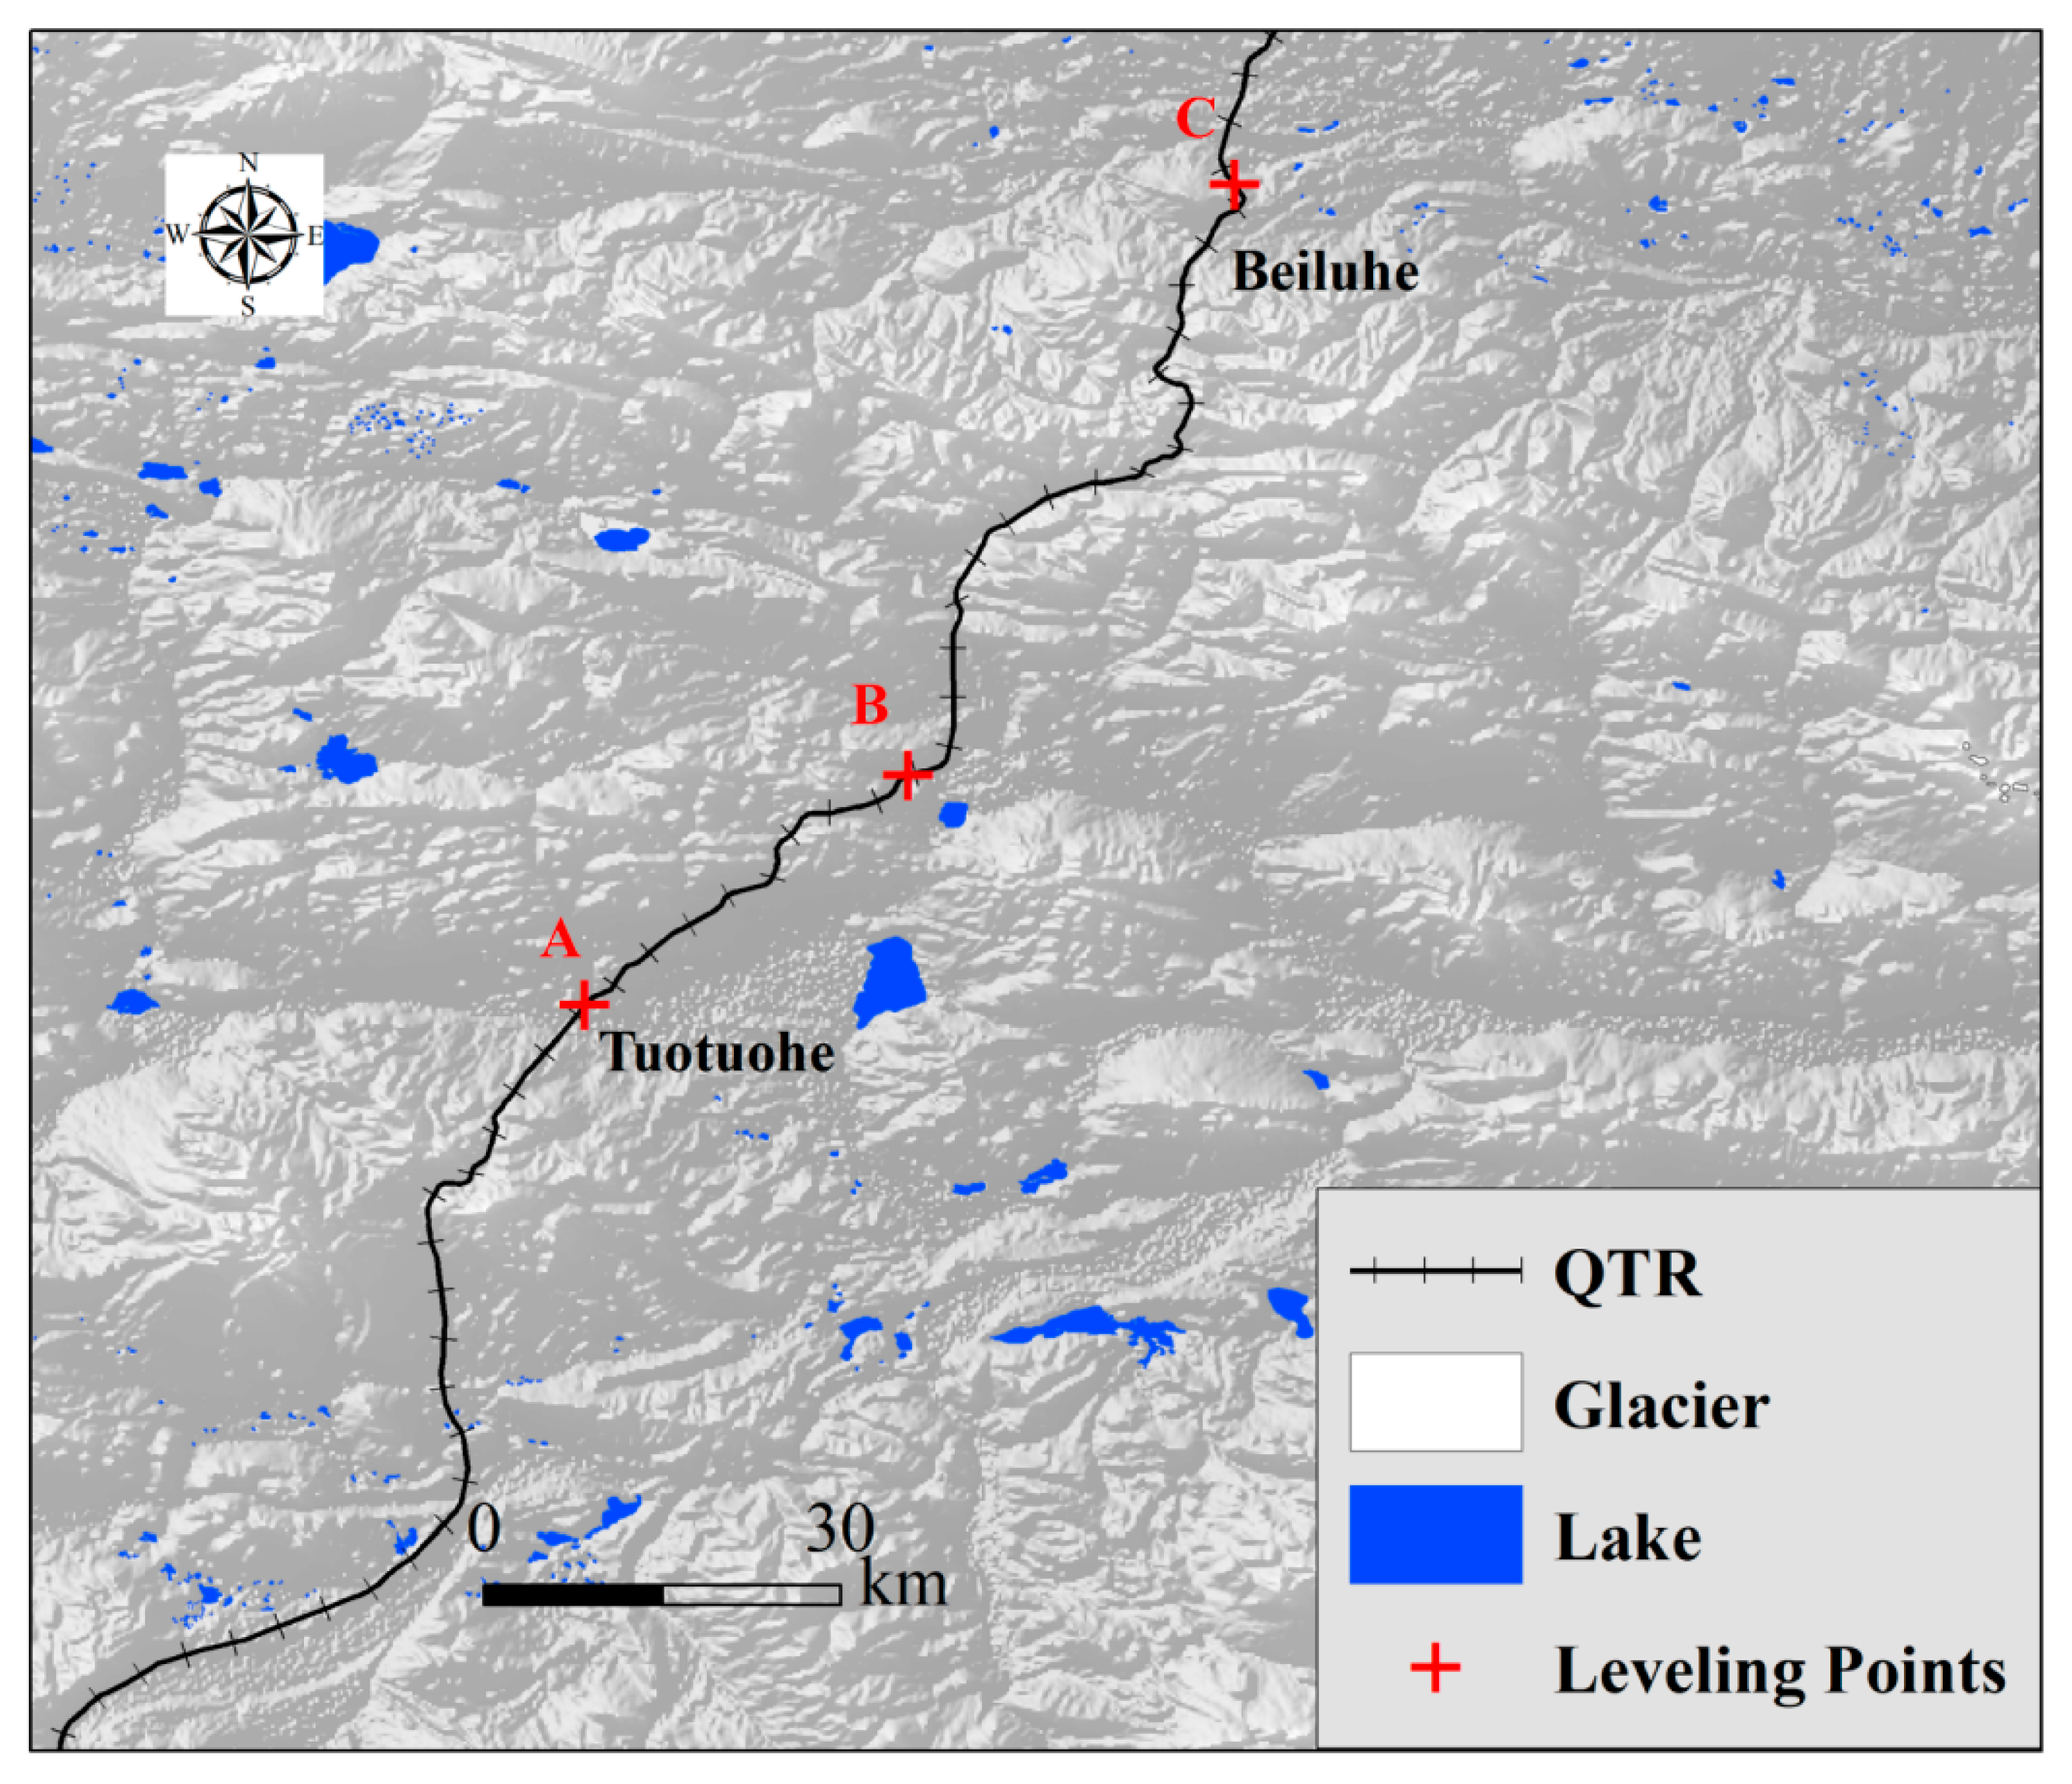
2.1. Study Area
2.2. ALOS and ALOS-2 Data
2.3. Sentinel-1 Data
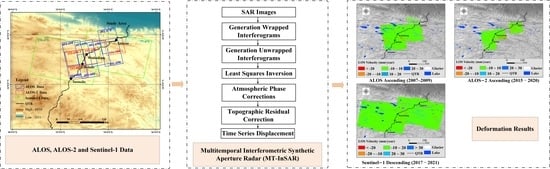
3. Methodology
3.1. Interferogram and Phase Unwrapping
3.2. Time Series Deformation Processing
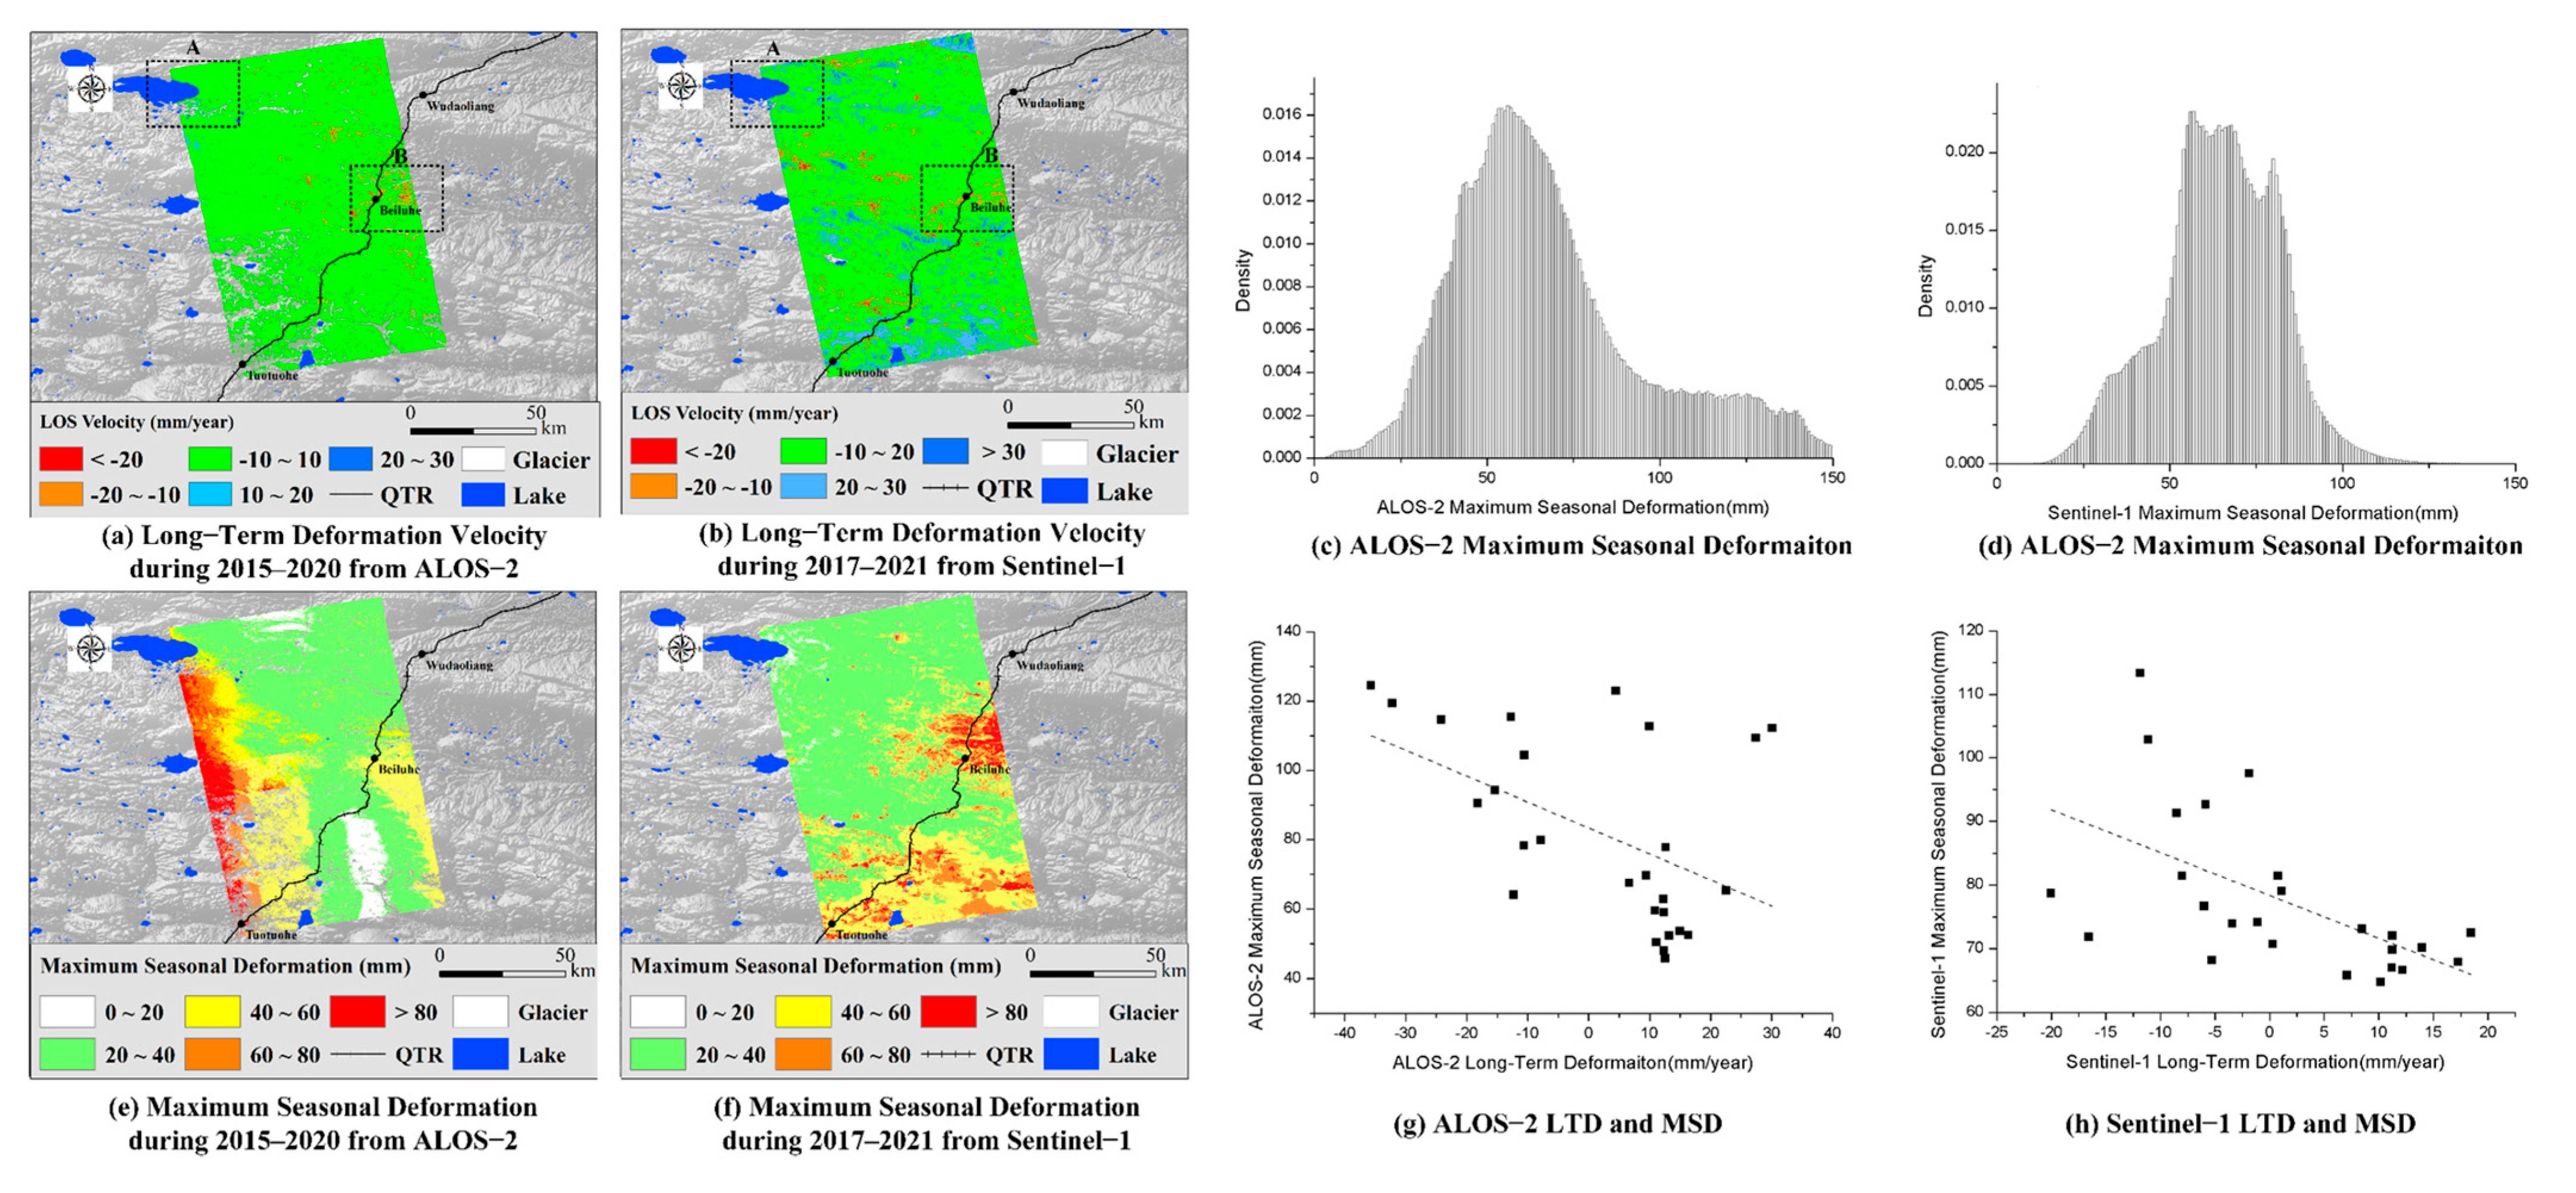
3.3. Long-Term Deformation Velocity and Maximum Seasonal Deformation
4. Results and Analysis
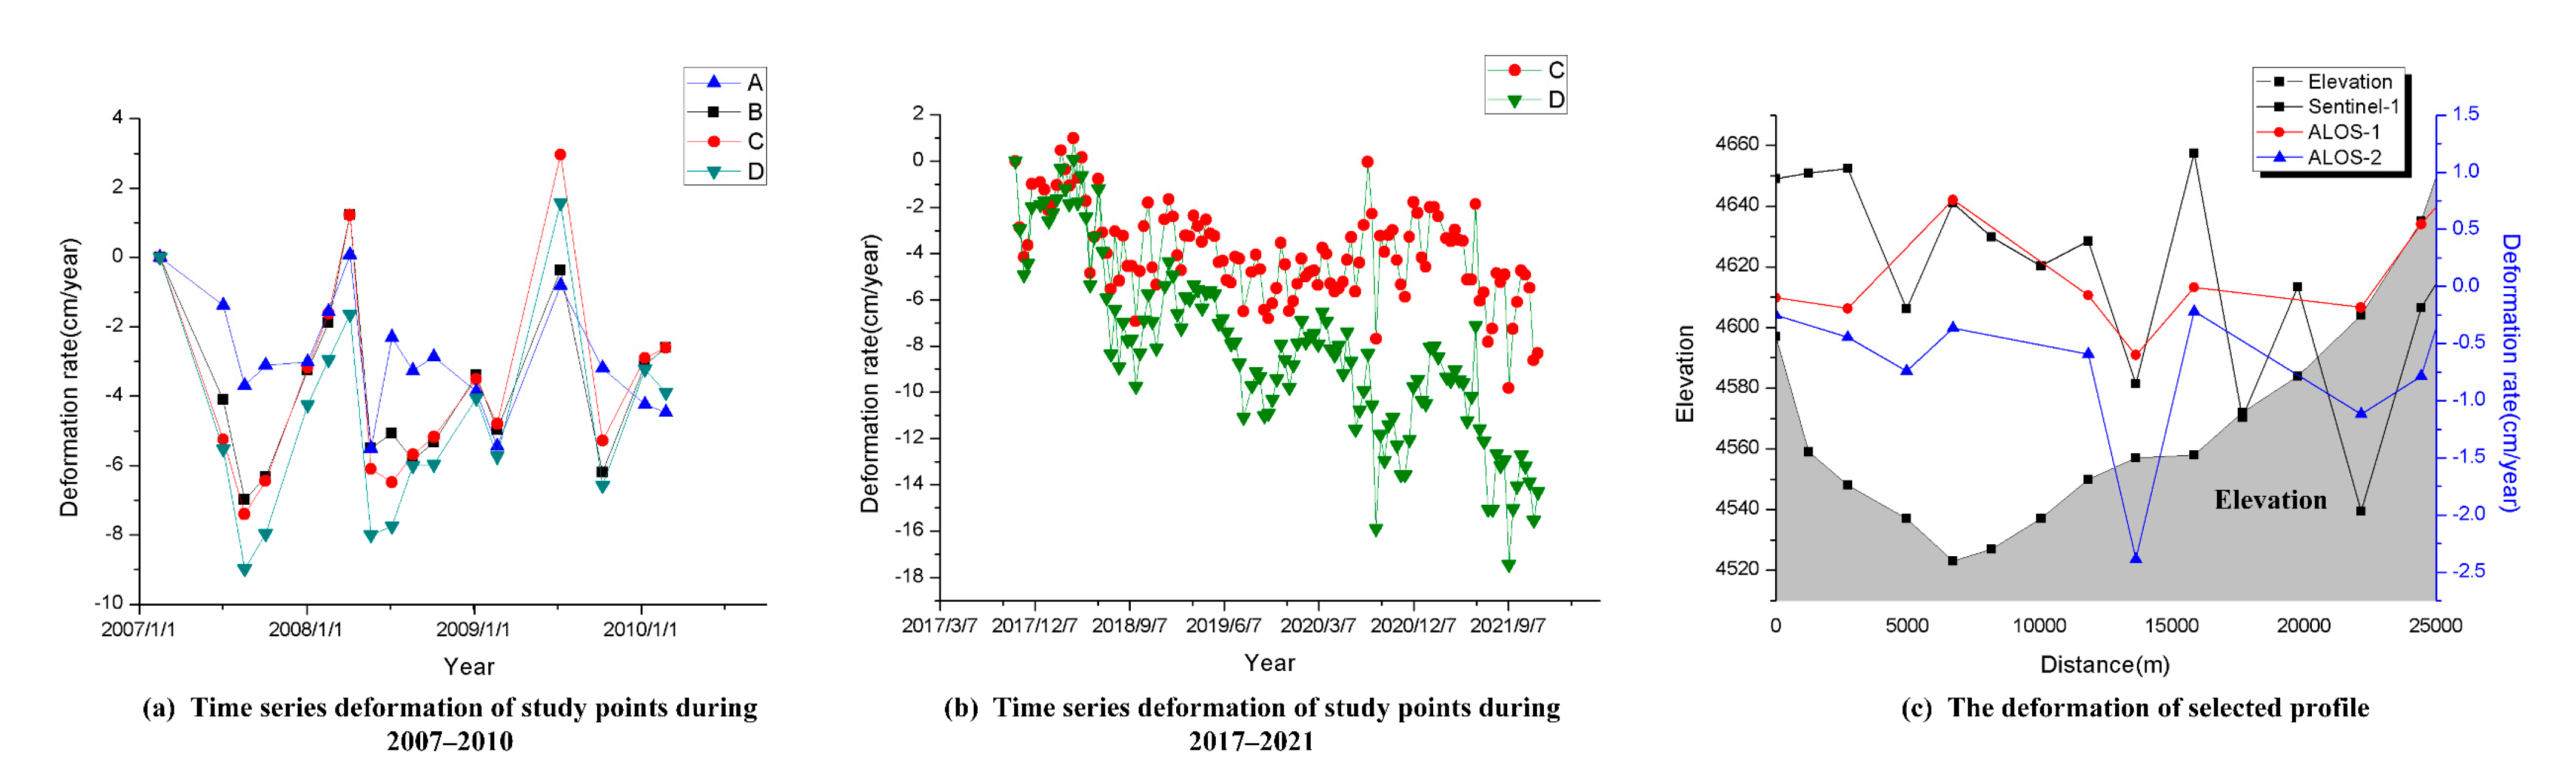
4.1. Long-Term Deformation and Time Series Deformation in the Northern QTP
4.2. Long-Term Deformation Velocity and Maximum Seasonal Deformation in the Northern QTP
5. Discussion
6. Conclusions
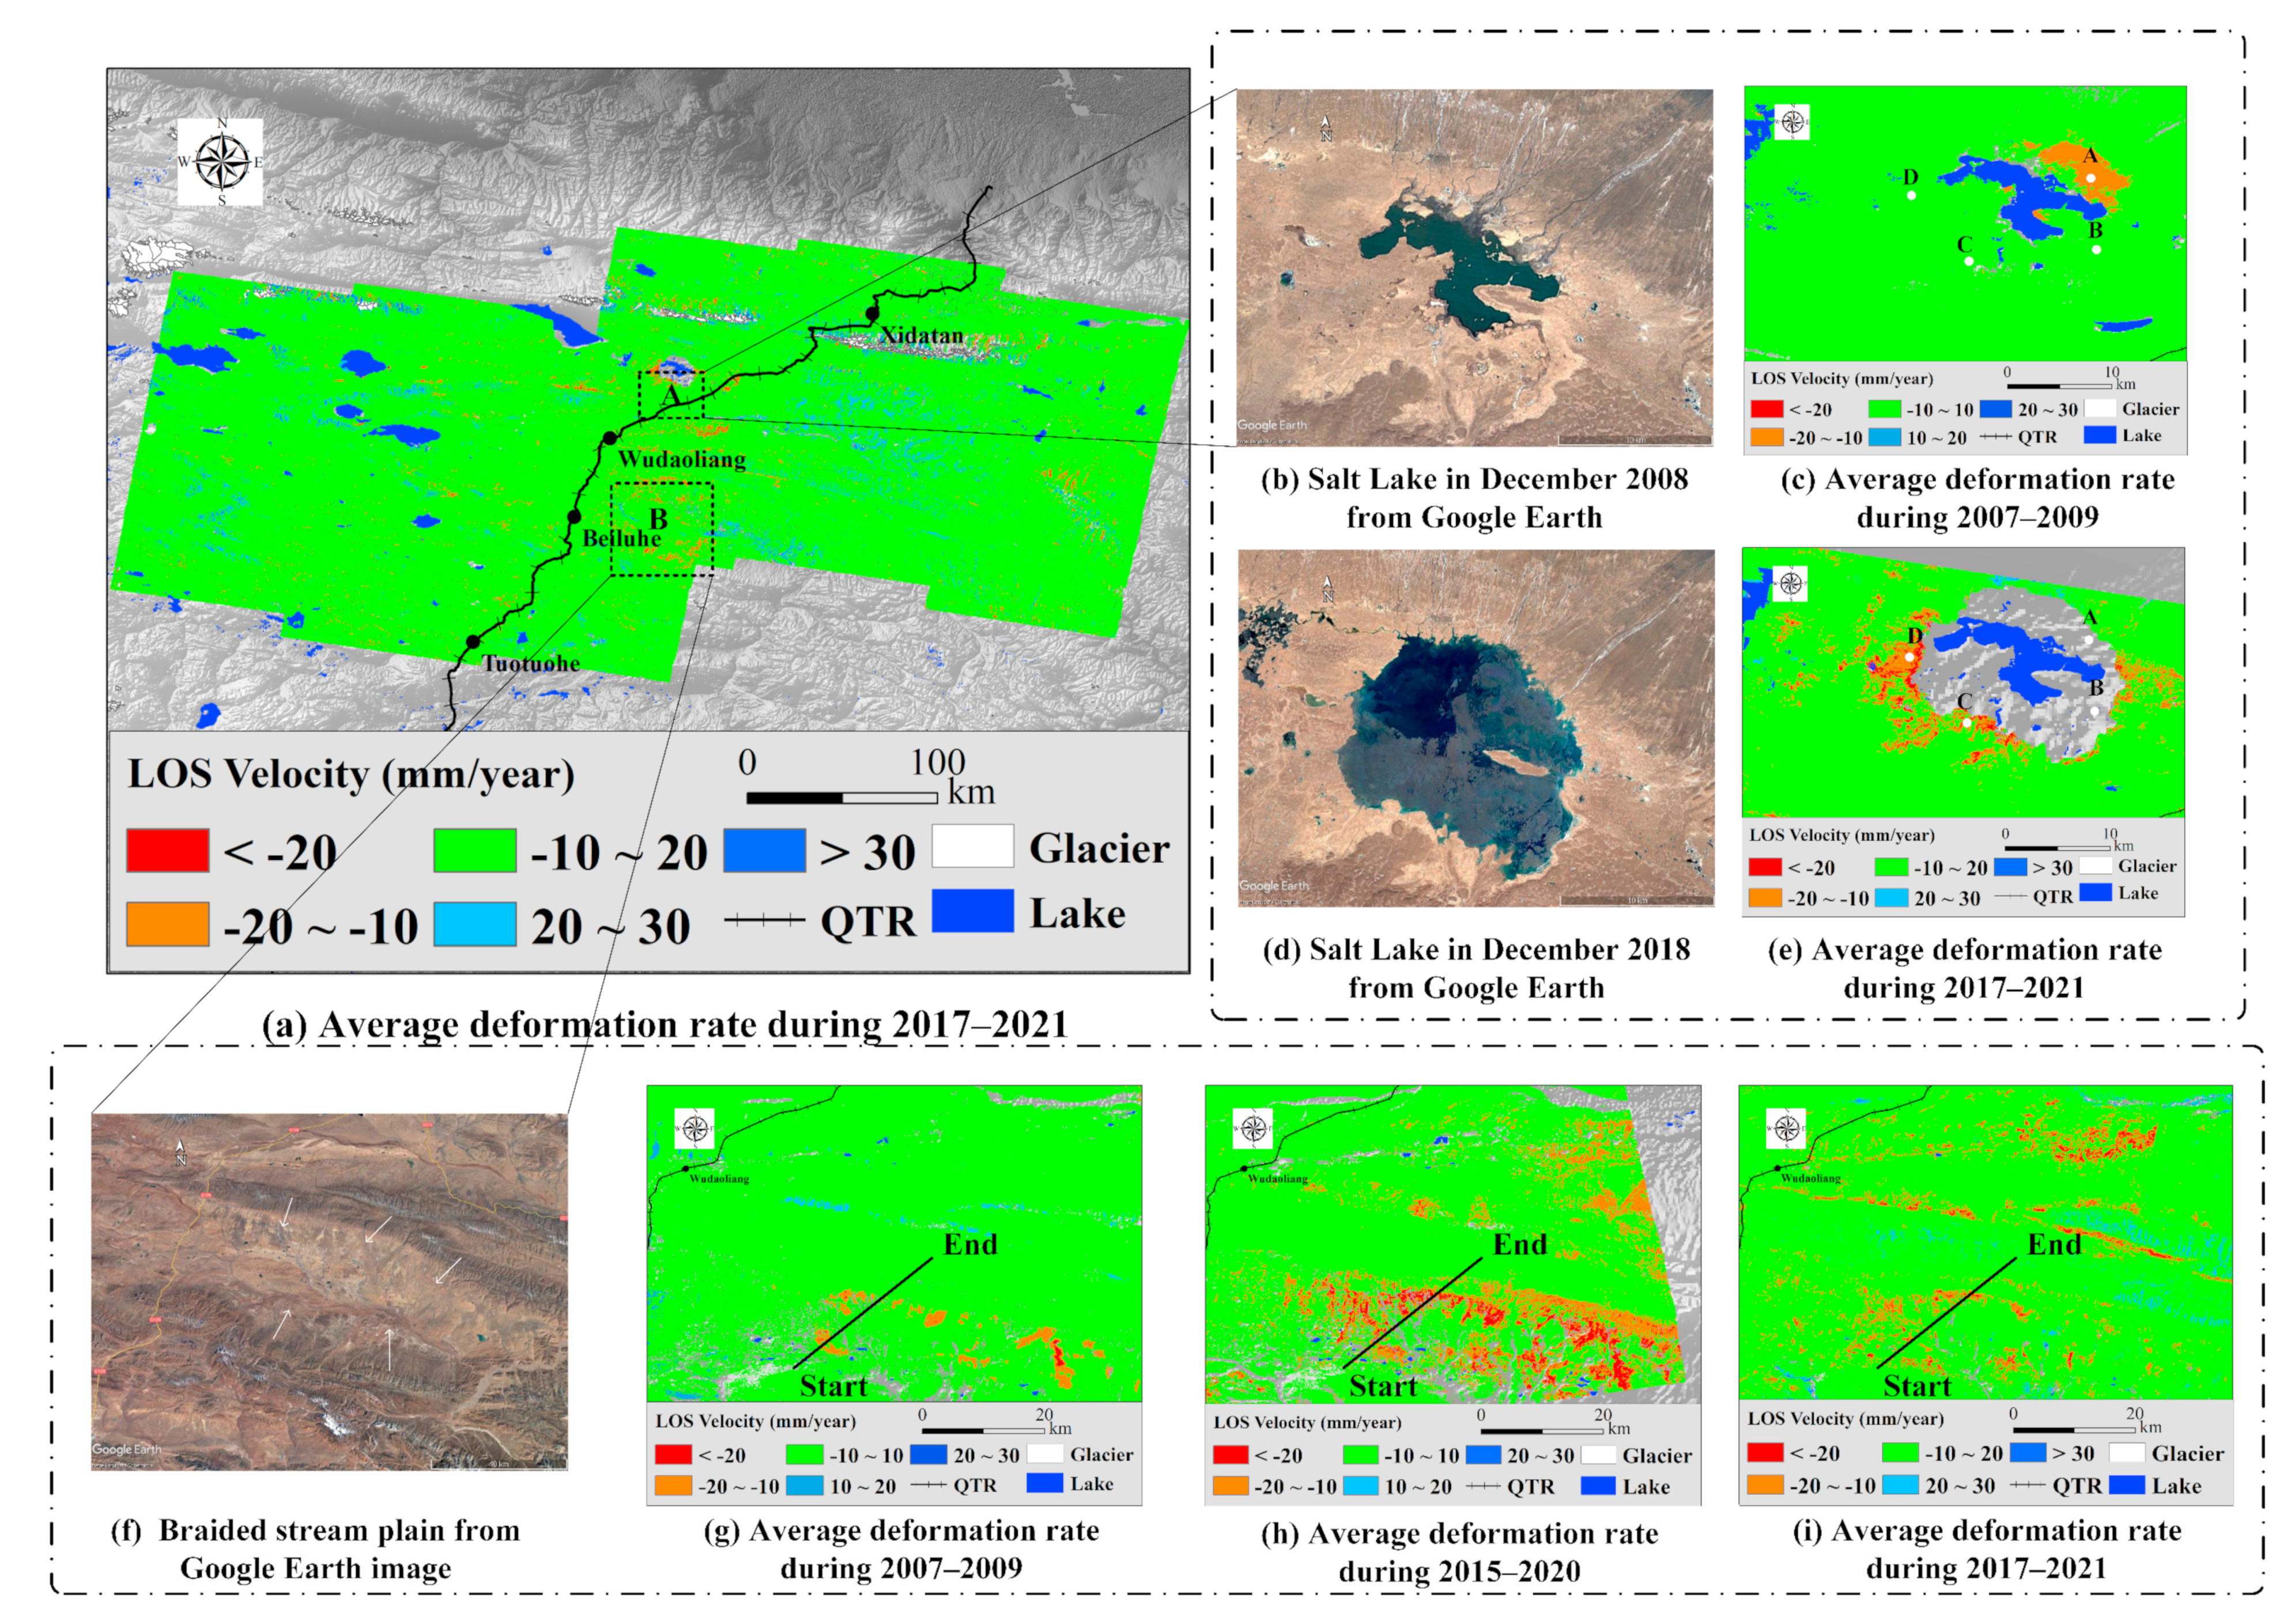
- Analysis of the ALOS results shows that the LTDV ranged from −20 to +20 mm/year during 2007–2009. For the ALOS-2 and Sentinel-1 results, the LTDV ranged from −30 to 30 mm/year during 2015–2021. Over a 15-year observation period, permafrost degradation is accelerating. The expansion areas of permafrost degradation are concentrated on braided stream plains, thermokarst lakes and glacier outwash plains. In addition, the high MSDs are mainly concentrated in glacier outwash plains and braided stream plains, which may be due to glacial erosion and a large amount of ice deposits brought to low-lying areas, affecting the water storage capacity and ice melting capacity of permafrost.
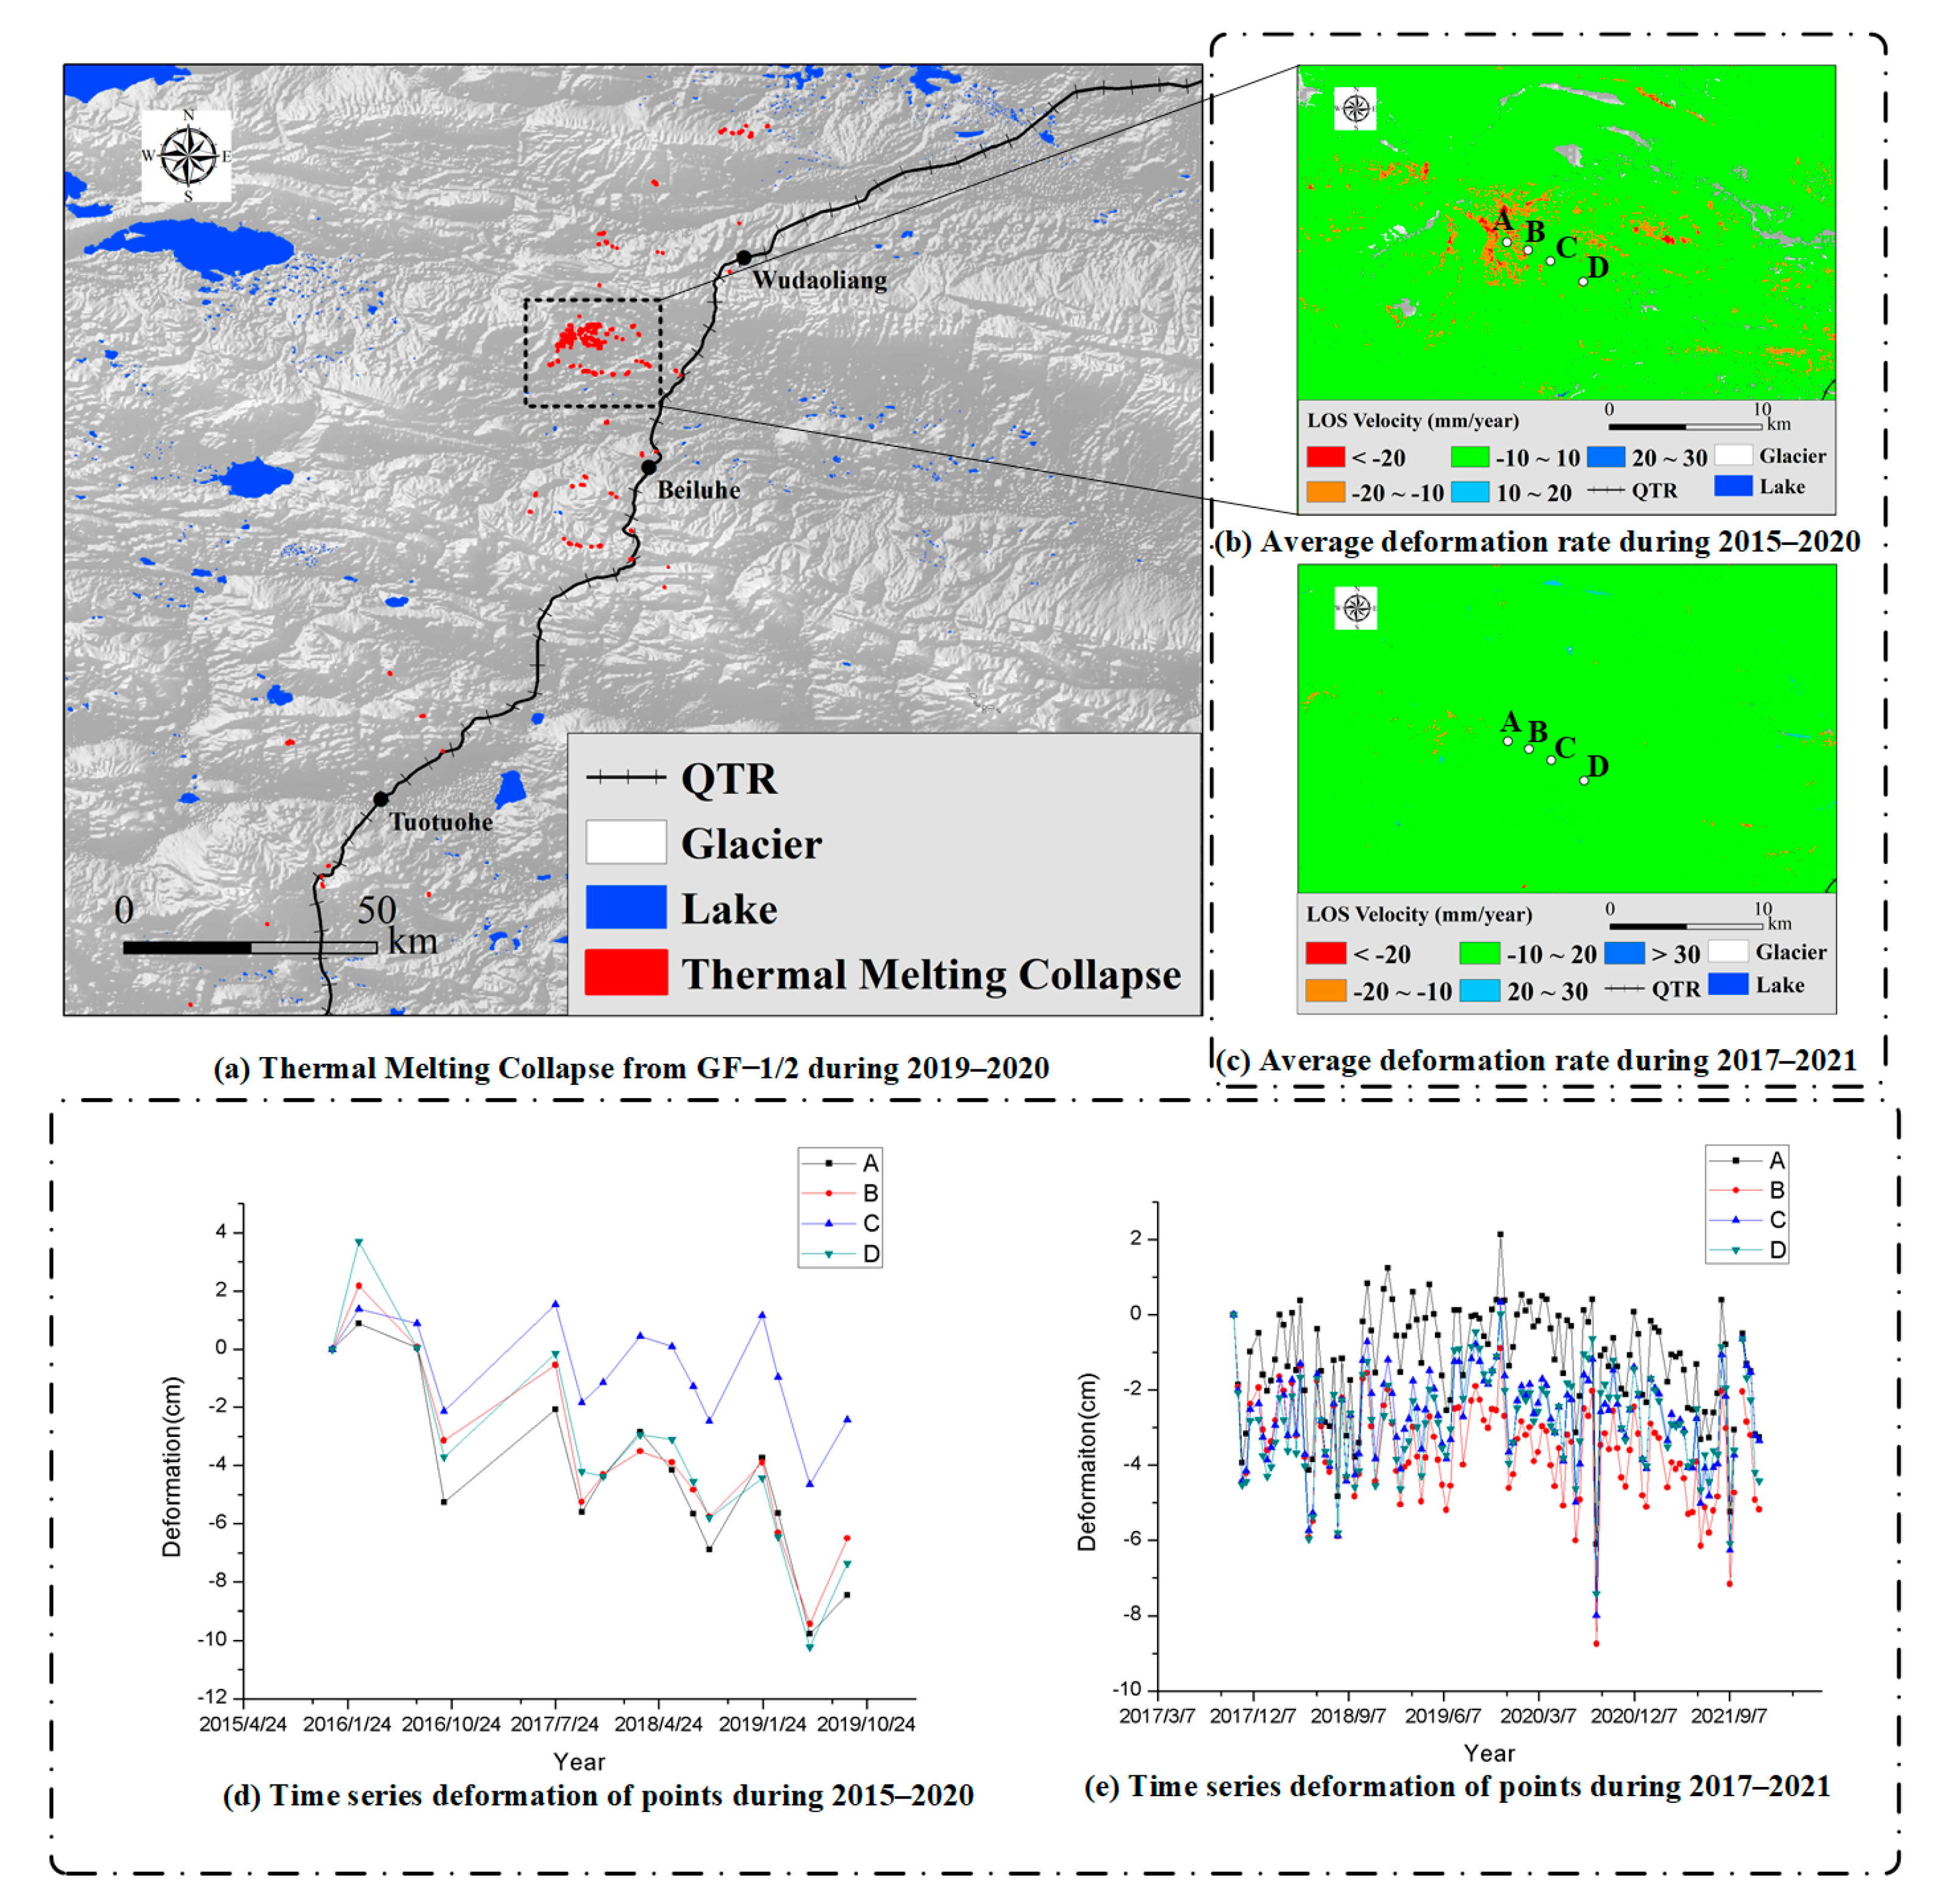
- For the geological disaster of thermal melting collapses, we compared the permafrost monitored by the L-band and the C-band sensors. The results show that the L-band ALOS-2 is more sensitive to the thermal collapses of permafrost than C-band sensor, and the detected collapse areas (LTDV < −10 mm/year) are consistent with the GF-1/2 thermal collapses dataset.
- We extracted the time series deformation directly from the interferograms without a preset deformation model. The long-term deformation velocity (LTDV) and maximum seasonal deformation (MSD) were calculated from time series deformation without any prior knowledge, demonstrating that our methods can be effectively used to extract the deformation features of permafrost.
Author Contributions
Funding
Data Availability Statement
Acknowledgments
Conflicts of Interest
References
- Ma, Y.; Wang, Y.; Wu, R.; Hu, Z.; Yang, K.; Li, M.; Ma, W.; Zhong, L.; Sun, F.; Chen, X. Recent Advances on the Study of Atmosphere-Land Interaction Observations on the Tibetan Plateau. Hydrol. Earth Syst. Sci. 2009, 13, 1103–1111. [Google Scholar] [CrossRef] [Green Version]
- Liu, X.; Sun, H.; Miao, Y.; Dong, B.; Yin, Z.-Y. Impacts of Uplift of Northern Tibetan Plateau and Formation of Asian Inland Deserts on Regional Climate and Environment. Quat. Sci. Rev. 2015, 116, 1–14. [Google Scholar] [CrossRef]
- Hu, G.-R.; Li, X.-Y.; Yang, X.-F. The Impact of Micro-Topography on the Interplay of Critical Zone Architecture and Hydrological Processes at the Hillslope Scale: Integrated Geophysical and Hydrological Experiments on the Qinghai-Tibet Plateau. J. Hydrol. 2020, 583, 124618. [Google Scholar] [CrossRef]
- Zhai, P.; Yu, R.; Guo, Y.; Li, Q.; Ren, X.; Wang, Y.; Xu, W.; Liu, Y.; Ding, Y. The Strong El Niño of 2015/16 and Its Dominant Impacts on Global and China’s Climate. J. Meteorol. Res. 2016, 30, 283–297. [Google Scholar] [CrossRef]
- Șerban, R.-D.; Jin, H.; Șerban, M.; Luo, D.; Wang, Q.; Jin, X.; Ma, Q. Mapping Thermokarst Lakes and Ponds across Permafrost Landscapes in the Headwater Area of Yellow River on Northeastern Qinghai-Tibet Plateau. Int. J. Remote Sens. 2020, 41, 7042–7067. [Google Scholar] [CrossRef]
- Chen, B.; Luo, S.; Lü, S.; Zhang, Y.; Ma, D. Effects of the Soil Freeze-Thaw Process on the Regional Climate of the Qinghai-Tibet Plateau. Clim. Res. 2014, 59, 243–257. [Google Scholar]
- Vonk, J.E.; Tank, S.E.; Bowden, W.B.; Laurion, I.; Vincent, W.F.; Alekseychik, P.; Amyot, M.; Billet, M.F.; Canário, J.; Cory, R.M. Reviews and Syntheses: Effects of Permafrost Thaw on Arctic Aquatic Ecosystems. Biogeosciences 2015, 12, 7129–7167. [Google Scholar] [CrossRef] [Green Version]
- Zhang, Z.; Wang, M.; Wu, Z.; Liu, X. Permafrost Deformation Monitoring Along the Qinghai-Tibet Plateau Engineering Corridor Using InSAR Observations with Multi-Sensor SAR Datasets from 1997–2018. Sensors 2019, 19, 5306. [Google Scholar] [CrossRef] [Green Version]
- Chen, D.; Fu, Y.-S.; Cai, B.; Yuan, Y.-X. Modeling and Algorithms of GPS Data Reduction for the Qinghai–Tibet Railway. IEEE Trans. Intell. Transp. Syst. 2010, 11, 753–758. [Google Scholar] [CrossRef]
- Qin, Y.; Zhang, J.; Li, G.; Qu, G. Settlement Characteristics of Unprotected Embankment along the Qinghai–Tibet Railway. Cold Reg. Sci. Technol. 2010, 60, 84–91. [Google Scholar] [CrossRef]
- Niu, F.; Luo, J.; Lin, Z.; Liu, M.; Yin, G. Thaw-induced slope failures and susceptibility mapping in permafrost regions of the Qinghai–Tibet Engineering Corridor, China. Nat. Hazards 2014, 74, 1667–1682. [Google Scholar] [CrossRef]
- Antonova, S.; Sudhaus, H.; Strozzi, T.; Zwieback, S.; Kääb, A.; Heim, B.; Langer, M.; Bornemann, N.; Boike, J. Thaw Subsidence of a Yedoma Landscape in Northern Siberia, Measured in Situ and Estimated from TerraSAR-X Interferometry. Remote Sens. 2018, 10, 494. [Google Scholar] [CrossRef] [Green Version]
- Short, N.; Brisco, B.; Couture, N.; Pollard, W.; Murnaghan, K.; Budkewitsch, P. A Comparison of TerraSAR-X, RADARSAT-2 and ALOS-PALSAR Interferometry for Monitoring Permafrost Environments, Case Study from Herschel Island, Canada. Remote Sens. Environ. 2011, 115, 3491–3506. [Google Scholar] [CrossRef]
- Chen, J.; Wu, Y.; O’Connor, M.; Cardenas, M.B.; Schaefer, K.; Michaelides, R.; Kling, G. Active Layer Freeze-Thaw and Water Storage Dynamics in Permafrost Environments Inferred from InSAR. Remote Sens. Environ. 2020, 248, 112007. [Google Scholar] [CrossRef]
- Meng, Y.; Lan, H.; Li, L.; Wu, Y.; Li, Q. Characteristics of Surface Deformation Detected by X-Band SAR Interferometry over Sichuan-Tibet Grid Connection Project Area, China. Remote Sens. 2015, 7, 12265–12281. [Google Scholar] [CrossRef] [Green Version]
- Wang, L.; Marzahn, P.; Bernier, M.; Jacome, A.; Poulin, J.; Ludwig, R. Comparison of TerraSAR-X and ALOS PALSAR Differential Interferometry With Multisource DEMs for Monitoring Ground Displacement in a Discontinuous Permafrost Region. IEEE J. Sel. Top. Appl. Earth Obs. Remote Sens. 2017, 10, 4074–4093. [Google Scholar] [CrossRef]
- Zhang, Z.; Wang, M.; Liu, X.; Chen, Q.; Wang, C.; Zhang, H. Deformation Monitoring of Qinghai-Tibet Railway from 1997–2018 Using SAR Interferometry with Multi-Sensors SAR Datasets. In Proceedings of the 2019 SAR in Big Data Era (BIGSARDATA), Beijing, China, 5–6 August 2019; IEEE: New York, NY, USA, 2019; pp. 1–4. [Google Scholar]
- Hu, J.; Wang, Q.; Li, Z.; Zhao, R.; Sun, Q. Investigating the Ground Deformation and Source Model of the Yangbajing Geothermal Field in Tibet, China with the WLS InSAR Technique. Remote Sens. 2016, 8, 191. [Google Scholar] [CrossRef] [Green Version]
- Chen, J.; Wu, T.; Zou, D.; Liu, L.; Wu, X.; Gong, W.; Zhu, X.; Li, R.; Hao, J.; Hu, G.; et al. Magnitudes and Patterns of Large-Scale Permafrost Ground Deformation Revealed by Sentinel-1 InSAR on the Central Qinghai-Tibet Plateau. Remote Sens. Environ. 2022, 268, 112778. [Google Scholar] [CrossRef]
- Zhao, R.; Li, Z.; Feng, G.; Wang, Q.; Hu, J. Monitoring Surface Deformation over Permafrost with an Improved SBAS-InSAR Algorithm: With Emphasis on Climatic Factors Modeling. Remote Sens. Environ. 2016, 184, 276–287. [Google Scholar] [CrossRef]
- Zhang, X.; Tang, Y.; Zhang, H.; Wang, C.; Zhang, B.; Wu, F. Permafrost Subsidence Monitoring of Qinghai-Tibet Plateau Using Sentinel-1 Data. In Proceedings of the 2019 SAR in Big Data Era (BIGSARDATA), Beijing, China, 5–6 August 2019; IEEE: New York, NY, USA, 2019; pp. 1–4. [Google Scholar]
- Short, N.; LeBlanc, A.-M.; Sladen, W.; Oldenborger, G.; Mathon-Dufour, V.; Brisco, B. RADARSAT-2 D-InSAR for Ground Displacement in Permafrost Terrain, Validation from Iqaluit Airport, Baffin Island, Canada. Remote Sens. Environ. 2014, 141, 40–51. [Google Scholar] [CrossRef]
- Rouyet, L.; Lauknes, T.R.; Christiansen, H.H.; Strand, S.M.; Larsen, Y. Seasonal Dynamics of a Permafrost Landscape, Adventdalen, Svalbard, Investigated by InSAR. Remote Sens. Environ. 2019, 231, 111236. [Google Scholar] [CrossRef]
- Rouyet, L.; Liu, L.; Strand, S.M.; Christiansen, H.H.; Lauknes, T.R.; Larsen, Y. Seasonal InSAR Displacements Documenting the Active Layer Freeze and Thaw Progression in Central-Western Spitsbergen, Svalbard. Remote Sens. 2021, 13, 2977. [Google Scholar] [CrossRef]
- Bartsch, A.; Leibman, M.; Strozzi, T.; Khomutov, A.; Widhalm, B.; Babkina, E.; Mullanurov, D.; Ermokhina, K.; Kroisleitner, C.; Bergstedt, H. Seasonal Progression of Ground Displacement Identified with Satellite Radar Interferometry and the Impact of Unusually Warm Conditions on Permafrost at the Yamal Peninsula in 2016. Remote Sens. 2019, 11, 1865. [Google Scholar] [CrossRef] [Green Version]
- Robson, G.; Treitz, P.; Lamoureux, S.F.; Murnaghan, K.; Brisco, B. Seasonal Surface Subsidence and Frost Heave Detected by C-Band DInSAR in a High Arctic Environment, Cape Bounty, Melville Island, Nunavut, Canada. Remote Sens. 2021, 13, 2505. [Google Scholar] [CrossRef]
- Wang, L.; Marzahn, P.; Bernier, M.; Ludwig, R. Sentinel-1 InSAR Measurements of Deformation over Discontinuous Permafrost Terrain, Northern Quebec, Canada. Remote Sens. Environ. 2020, 248, 111965. [Google Scholar] [CrossRef]
- Chen, F.; Lin, H. Tibetan Plateau Permafrost Evolution Monitoring Using C- and L-Band Spaceborne SAR Interferometry. In Proceedings of the 2012 IEEE International Geoscience and Remote Sensing Symposium, Munich, Germany, 22–27 July 2012; IEEE: New York, NY, USA, 2012; pp. 1884–1887. [Google Scholar]
- Zhang, X.; Zhang, H.; Wang, C.; Tang, Y.; Zhang, B.; Wu, F.; Wang, J.; Zhang, Z. Time-Series InSAR Monitoring of Permafrost Freeze-Thaw Seasonal Displacement over Qinghai–Tibetan Plateau Using Sentinel-1 Data. Remote Sens. 2019, 11, 1000. [Google Scholar] [CrossRef] [Green Version]
- Wang, C.; Zhang, H.; Zhang, B.; Tang, Y.; Zhang, Z.; Liu, M.; Zhao, L. New Mode TerraSAR-X Interferometry for Railway Monitoring in the Permafrost Region of the Tibet Plateau. In Proceedings of the 2015 IEEE International Geoscience and Remote Sensing Symposium (IGARSS), Milan, Italy, 26–31 July 2015; IEEE: New York, NY, USA, 2015; pp. 1634–1637. [Google Scholar]
- Wang, C.; Zhang, Z.; Zhang, H.; Zhang, B.; Tang, Y.; Wu, Q. Active Layer Thickness Retrieval of Qinghai–Tibet Permafrost Using the TerraSAR-X InSAR Technique. IEEE J. Sel. Top. Appl. Earth Obs. Remote Sens. 2018, 11, 4403–4413. [Google Scholar] [CrossRef]
- Zhang, Z.; Wang, C.; Zhang, H.; Tang, Y.; Liu, X. Analysis of Permafrost Region Coherence Variation in the Qinghai–Tibet Plateau with a High-Resolution TerraSAR-X Image. Remote Sens. 2018, 10, 298. [Google Scholar] [CrossRef] [Green Version]
- Chen, R.H.; Michaelides, R.J.; Sullivan, T.D.; Parsekian, A.D.; Zebker, H.A.; Moghaddam, M.; Schaefer, K.M. Joint Retrieval of Soil Moisture and Permafrost Active Layer Thickness Using L-Band Insar and P-Band Polsar. In Proceedings of the IGARSS 2020-2020 IEEE International Geoscience and Remote Sensing Symposium, Waikoloa, HI, USA, 26 September–2 October 2020; IEEE: New York, NY, USA, 2020; pp. 4606–4609. [Google Scholar]
- Schaefer, K.; Liu, L.; Parsekian, A.; Jafarov, E.; Chen, A.; Zhang, T.; Gusmeroli, A.; Panda, S.; Zebker, H.; Schaefer, T. Remotely Sensed Active Layer Thickness (ReSALT) at Barrow, Alaska Using Interferometric Synthetic Aperture Radar. Remote Sens. 2015, 7, 3735–3759. [Google Scholar] [CrossRef] [Green Version]
- Chen, F.; Lin, H.; Zhou, W.; Hong, T.; Wang, G. Surface Deformation Detected by ALOS PALSAR Small Baseline SAR Interferometry over Permafrost Environment of Beiluhe Section, Tibet Plateau, China. Remote Sens. Environ. 2013, 138, 10–18. [Google Scholar] [CrossRef]
- Parsekian, A.D.; Chen, R.H.; Michaelides, R.J.; Sullivan, T.D.; Clayton, L.K.; Huang, L.; Zhao, Y.; Wig, E.; Moghaddam, M.; Zebker, H.; et al. Validation of Permafrost Active Layer Estimates from Airborne SAR Observations. Remote Sens. 2021, 13, 2876. [Google Scholar] [CrossRef]
- Rudy, A.C.A.; Lamoureux, S.F.; Treitz, P.; Short, N.; Brisco, B. Seasonal and Multi-Year Surface Displacements Measured by DInSAR in a High Arctic Permafrost Environment. Int. J. Appl. Earth Obs. Geoinf. 2018, 64, 51–61. [Google Scholar] [CrossRef]
- Lu, P.; Han, J.; Li, Z.; Xu, R.; Li, R.; Hao, T.; Qiao, G. Lake Outburst Accelerated Permafrost Degradation on Qinghai-Tibet Plateau. Remote Sens. Environ. 2020, 249, 112011. [Google Scholar] [CrossRef]
- Eshqi Molan, Y.; Kim, J.-W.; Lu, Z.; Wylie, B.; Zhu, Z. Modeling Wildfire-Induced Permafrost Deformation in an Alaskan Boreal Forest Using InSAR Observations. Remote Sens. 2018, 10, 405. [Google Scholar] [CrossRef] [Green Version]
- Li, R.; Li, Z.; Han, J.; Lu, P.; Qiao, G.; Meng, X.; Hao, T.; Zhou, F. Monitoring Surface Deformation of Permafrost in Wudaoliang Region, Qinghai–Tibet Plateau with ENVISAT ASAR Data. Int. J. Appl. Earth Obs. Geoinf. 2021, 104, 102527. [Google Scholar] [CrossRef]
- Daout, S.; Dini, B.; Haeberli, W.; Doin, M.-P.; Parsons, B. Ice Loss in the Northeastern Tibetan Plateau Permafrost as Seen by 16 Yr of ESA SAR Missions. Earth Planet. Sci. Lett. 2020, 545, 116404. [Google Scholar] [CrossRef]
- Ng, A.H.-M.; Chang, H.-C.; Ge, L.; Rizos, C.; Omura, M. Assessment of Radar Interferometry Performance for Ground Subsidence Monitoring Due to Underground Mining. Earth Planets Space 2009, 61, 733–745. [Google Scholar] [CrossRef] [Green Version]
- Fort, F.; van Vliet-Lanoe, B. Permafrost and Periglacial Environment of Western Tibet. Landf. Anal. 2007, 5, 25–29. [Google Scholar]
- Li, Z.; Zhao, R.; Hu, J.; Wen, L.; Feng, G.; Zhang, Z.; Wang, Q. InSAR Analysis of Surface Deformation over Permafrost to Estimate Active Layer Thickness Based on One-Dimensional Heat Transfer Model of Soils. Sci. Rep. 2015, 5, 15542. [Google Scholar] [CrossRef]
- Jia, Y.; Kim, J.-W.; Shum, C.; Lu, Z.; Ding, X.; Zhang, L.; Erkan, K.; Kuo, C.-Y.; Shang, K.; Tseng, K.-H.; et al. Characterization of Active Layer Thickening Rate over the Northern Qinghai-Tibetan Plateau Permafrost Region Using ALOS Interferometric Synthetic Aperture Radar Data, 2007–2009. Remote Sens. 2017, 9, 84. [Google Scholar] [CrossRef] [Green Version]
- Liu, L.; Zhang, T.; Wahr, J. InSAR Measurements of Surface Deformation over Permafrost on the North Slope of Alaska. J. Geophys. Res. Earth Surf. 2010, 115. [Google Scholar] [CrossRef]
- Wang, L.; Zhao, L.; Zhou, H.; Liu, S.; Du, E.; Zou, D.; Liu, G.; Wang, C.; Li, Y. Permafrost Ground Ice Melting and Deformation Time Series Revealed by Sentinel-1 InSAR in the Tanggula Mountain Region on the Tibetan Plateau. Remote Sens. 2022, 14, 811. [Google Scholar] [CrossRef]
- Xia, L.; Yang, Q.; Li, Z.; Wu, Y.; Feng, Z. The Effect of the Qinghai-Tibet Railway on the Migration of Tibetan Antelope Pantholops Hodgsonii in Hoh-Xil National Nature Reserve, China. Oryx 2007, 41, 352–357. [Google Scholar] [CrossRef] [Green Version]
- Zhou, H.; Li, D.; Zhang, Y.; Yang, T.; Liu, Y. ‘Genetic Diversity of Microsatellite DNA Loci of Tibetan Antelope (Chiru, Pantholops Hodgsonii) in Hoh Xil National Nature Reserve, Qinghai, China. J. Genet. Genom. 2007, 34, 600–607. [Google Scholar] [CrossRef]
- Niu, F.; Lin, Z.; Liu, H.; Lu, J. Characteristics of Thermokarst Lakes and Their Influence on Permafrost in Qinghai–Tibet Plateau. Geomorphology 2011, 132, 222–233. [Google Scholar] [CrossRef]
- Zhou, S.; Li, J. The Sequence of Quaternary Glaciation in the Bayan Har Mountains. Quat. Int. 1998, 45, 135–142. [Google Scholar] [CrossRef]
- Ma, Q.; Zhang, K.; Jabro, J.D.; Ren, L.; Liu, H. Freeze–Thaw Cycles Effects on Soil Physical Properties under Different Degraded Conditions in Northeast China. Environ. Earth Sci. 2019, 78, 321. [Google Scholar] [CrossRef]
- Yu, J.; Gao, C.; Cheng, A.; Liu, Y.; Zhang, L.; He, X. Geomorphic, Hydroclimatic and Hydrothermal Controls on the Formation of Lithium Brine Deposits in the Qaidam Basin, Northern Tibetan Plateau, China. Ore Geol. Rev. 2013, 50, 171–183. [Google Scholar] [CrossRef]
- Wang, J.; Wang, C.; Zhang, H.; Tang, Y.; Duan, W.; Dong, L. Freeze-Thaw Deformation Cycles and Temporal-Spatial Distribution of Permafrost along the Qinghai-Tibet Railway Using Multitrack InSAR Processing. Remote Sens. 2021, 13, 4744. [Google Scholar] [CrossRef]
- LaRocque, A.; Phiri, C.; Leblon, B.; Pirotti, F.; Connor, K.; Hanson, A. Wetland Mapping with Landsat 8 OLI, Sentinel-1, ALOS-1 PALSAR, and LiDAR Data in Southern New Brunswick, Canada. Remote Sens. 2020, 12, 2095. [Google Scholar] [CrossRef]
- Adriano, B.; Yokoya, N.; Miura, H.; Matsuoka, M.; Koshimura, S. A Semiautomatic Pixel-Object Method for Detecting Landslides Using Multitemporal ALOS-2 Intensity Images. Remote Sens. 2020, 12, 561. [Google Scholar] [CrossRef] [Green Version]
- Imamoglu, M.; Kahraman, F.; Cakir, Z.; Sanli, F.B. Ground Deformation Analysis of Bolvadin (W. Turkey) by Means of Multi-Temporal InSAR Techniques and Sentinel-1 Data. Remote Sens. 2019, 11, 1069. [Google Scholar] [CrossRef] [Green Version]
- Berardino, P.; Fornaro, G.; Lanari, R.; Sansosti, E. A New Algorithm for Surface Deformation Monitoring Based on Small Baseline Differential SAR Interferograms. IEEE Trans. Geosci. Remote Sens. 2002, 40, 2375–2383. [Google Scholar] [CrossRef] [Green Version]
- Shen, Z.; Liu, Z. Integration of GPS and InSAR Data for Resolving 3-Dimensional Crustal Deformation. Earth Space Sci. 2020, 7, e2019EA001036. [Google Scholar] [CrossRef] [Green Version]
- Wang, Y.; Chang, L.; Feng, W.; Samsonov, S.; Zheng, W. Topography-Correlated Atmospheric Signal Mitigation for InSAR Applications in the Tibetan Plateau Based on Global Atmospheric Models. Int. J. Remote Sens. 2021, 42, 4361–4379. [Google Scholar] [CrossRef]
- Jolivet, R.; Agram, P.S.; Lin, N.Y.; Simons, M.; Doin, M.-P.; Peltzer, G.; Li, Z. Improving InSAR Geodesy Using Global Atmospheric Models. J. Geophys. Res. Solid Earth 2014, 119, 2324–2341. [Google Scholar] [CrossRef]
- Fattahi, H.; Amelung, F. DEM Error Correction in InSAR Time Series. IEEE Trans. Geosci. Remote Sens. 2013, 51, 4249–4259. [Google Scholar] [CrossRef]
- Yunjun, Z.; Fattahi, H.; Amelung, F. Small Baseline InSAR Time Series Analysis: Unwrapping Error Correction and Noise Reduction. Comput. Geosci. 2019, 133, 104331. [Google Scholar] [CrossRef] [Green Version]
- Niu, F.; Luo, J. Distribution Data of Freezing and Thawing Disasters in Qinghai Tibet Project Corridor (2019–2020). National Tibetan Plateau Data Center. 2021. Available online: https://doi.org/10.11888/RemoteSen.tpdc.271883 (accessed on 22 February 2022).
- Li, H.; Kato, T.; Hayashi, M.; Wu, L. Estimation of Forest Aboveground Biomass of Two Major Conifers in Ibaraki Prefecture, Japan, from PALSAR-2 and Sentinel-2 Data. Remote Sens. 2022, 14, 468. [Google Scholar] [CrossRef]
- Xie, C.; Li, Z.; Xu, J.; Li, X. Analysis of Deformation over Permafrost Regions of Qinghai-Tibet Plateau Based on Permanent Scatterers. Int. J. Remote Sens. 2010, 31, 1995–2008. [Google Scholar] [CrossRef]
- Chen, F.; Lin, H.; Li, Z.; Chen, Q.; Zhou, J. Interaction between Permafrost and Infrastructure along the Qinghai–Tibet Railway Detected via Jointly Analysis of C-and L-Band Small Baseline SAR Interferometry. Remote Sens. Environ. 2012, 123, 532–540. [Google Scholar] [CrossRef]
- Wang, C.; Zhang, Z.; Zhang, H.; Wu, Q.; Zhang, B.; Tang, Y. Seasonal Deformation Features on Qinghai-Tibet Railway Observed Using Time-Series InSAR Technique with High-Resolution TerraSAR-X Images. Remote Sens. Lett. 2017, 8, 1–10. [Google Scholar] [CrossRef]
- Li, Y.; Zhang, J.; Li, Z.; Luo, Y.; Jiang, W.; Tian, Y. Measurement of Subsidence in the Yangbajing Geothermal Fields, Tibet, from TerraSAR-X InSAR Time Series Analysis. Int. J. Digit. Earth 2016, 9, 697–709. [Google Scholar] [CrossRef]
- Hong, Z.; Jin, S. Permafrost deformation in Qinghai-Tibet Plateau time-series PS-InSAR. Bull. Surv. Mapp. 2021, 1, 35–40. (In Chinese) [Google Scholar]


| ALOS/PALSAR Path-Frame | Number of SAR Images | Acquisition Time | Resolution (Azimuth) | Ground Coverage |
|---|---|---|---|---|
| 491-690 | 10 | 16 June 2007~12 December 2009 | 10 m | 70 km 100 km |
| 491-700 | 10 | 16 June 2007~12 December 2009 | 10 m | 70 km 100 km |
| 492-690 | 17 | 15 February 2007~23 February 2010 | 10 m | 70 km 100 km |
| 493-680 | 12 | 17 January 2007~09 March 2009 | 10 m | 70 km 100 km |
| 493-690 | 12 | 17 January 2007~09 March 2009 | 10 m | 70 km 100 km |
| 494-680 | 11 | 21 June 2007~08 February 2009 | 10 m | 70 km 100 km |
| 494-690 | 11 | 21 June 2007~08 February 2009 | 10 m | 70 km 100 km |
| ALOS-2/PALSAR-2 Path-Row-Id | Number of SAR Images | Acquisition Time | Resolution (Azimuth) | Ground Coverage |
|---|---|---|---|---|
| 152-680-1 | 20 | 24 February 2015~09 November 2021 | 10 m | 70 km × 70 km |
| 152-690-1 | 15 | 15 December 2015~03 September 2019 | 10 m | 70 km × 70 km |
| 152-690-2 | 17 | 30 June 2015~21 December 2021 | 10 m | 70 km × 70 km |
| 151-700-1 | 20 | 23 July 2015~16 January 2020 | 10 m | 70 km × 70 km |
| Sentinel-1 Path-Frame | Number of SAR Images | Acquisition Time | Resolution (Azimuth) | Ground Coverage |
|---|---|---|---|---|
| 77-475 | 161 | 16 March 2017~12 December 2021 | 20 m | 250 km × 167 km |
| 150-475 | 123 | 11 October 2017~01 December 2021 | 20 m | 250 km × 167 km |
| Point | Position | Long-Term Deformation Velocity during 2007–2009 | Long-Term Deformation Velocity during 2017–2021 |
|---|---|---|---|
| Point A | 93.467E, 35.547N | −12.5 mm/year | - |
| Point B | 93.473E, 35.485N | −4.3 mm/year | - |
| Point C | 93.363E, 35.476N | 8.7 mm/year | −15.6 mm/year |
| Point D | 93.312E, 35.532N | −2.3 mm/year | −20.3 mm/year |
| Point | Position | Long-Term Deformation Velocity during 2015–2020 | Long-Term Deformation Velocity during 2017–2021 |
|---|---|---|---|
| Point A | 92.771 E, 35.059 N | −24.9 mm/year | 3.4mm/year |
| Point B | 92.790 E, 35.051 N | −8.1 mm/year | 9.1 mm/year |
| Point C | 92.803 E, 35.044 N | 7.1 mm/year | 13.0 mm/year |
| Point D | 92.823 E, 35.032 N | −11.1 mm/year | 14.1 mm/year |
| Study Area | InSAR Method | SAR Dataset | Observation Time | Average Ground Deformation Rate | Authors |
|---|---|---|---|---|---|
| Beiluhe | PSI | Envisat | 2003–2007 | −20~3 mm/year | Xie et al. (2010) |
| Beiluhe | IPTA and SBAS | ALOS and Envisat | 2004–2010 | −20~20 mm/year | Chen et al. (2012) |
| Beiluhe | SBAS | ALOS | 2007–2010 | −25~10 mm/year | Chen et al. (2013) |
| Naqu-Lhasa | SBAS | Envisat and TerraSAR-X | 2003–2012 | −20~20 mm/year | Zhang et al. (2018) |
| Yangbaijin | MTInSAR | TerraSAR-X | 2014–2015 | −30–10 mm/year | Li et al. (2017) |
| Wudaoliang-Tuotuohe | MT-InSAR | Sentinel-1, Envisat and ERS-1 | 1997~2018 | −20~10 mm/year | Zhang et al. (2019) |
| Wudaoliang | StaMPS-InSAR | Sentinel-1 and TerraSAR-X | 2017–2018 | −12~7 mm/year | Han et al. (2020) |
| Golmud-Lhasa | NSBAS | Sentinel-1 | 2017~2020 | −20~20 mm/year | Wang et al. (2021) |
| Benchmark | A | B | C |
|---|---|---|---|
| Leveling (unit: mm) | −2.2 | 8.8 | 16.6 |
| InSAR results (unit: mm) | −5.3 | 14.5 | 9.8 |
| Absolute error (unit: mm) | 3.1 | 5.7 | 6.8 |
Publisher’s Note: MDPI stays neutral with regard to jurisdictional claims in published maps and institutional affiliations. |
© 2022 by the authors. Licensee MDPI, Basel, Switzerland. This article is an open access article distributed under the terms and conditions of the Creative Commons Attribution (CC BY) license (https://creativecommons.org/licenses/by/4.0/).
Share and Cite
Zou, L.; Wang, C.; Tang, Y.; Zhang, B.; Zhang, H.; Dong, L. Interferometric SAR Observation of Permafrost Status in the Northern Qinghai-Tibet Plateau by ALOS, ALOS-2 and Sentinel-1 between 2007 and 2021. Remote Sens. 2022, 14, 1870. https://doi.org/10.3390/rs14081870
Zou L, Wang C, Tang Y, Zhang B, Zhang H, Dong L. Interferometric SAR Observation of Permafrost Status in the Northern Qinghai-Tibet Plateau by ALOS, ALOS-2 and Sentinel-1 between 2007 and 2021. Remote Sensing. 2022; 14(8):1870. https://doi.org/10.3390/rs14081870
Chicago/Turabian StyleZou, Lichuan, Chao Wang, Yixian Tang, Bo Zhang, Hong Zhang, and Longkai Dong. 2022. "Interferometric SAR Observation of Permafrost Status in the Northern Qinghai-Tibet Plateau by ALOS, ALOS-2 and Sentinel-1 between 2007 and 2021" Remote Sensing 14, no. 8: 1870. https://doi.org/10.3390/rs14081870
APA StyleZou, L., Wang, C., Tang, Y., Zhang, B., Zhang, H., & Dong, L. (2022). Interferometric SAR Observation of Permafrost Status in the Northern Qinghai-Tibet Plateau by ALOS, ALOS-2 and Sentinel-1 between 2007 and 2021. Remote Sensing, 14(8), 1870. https://doi.org/10.3390/rs14081870