Article

Collaborative Extraction of Paddy Planting Areas with Multi-Source Information Based on Google Earth Engine: A Case Study of Cambodia

1
Second Monitoring and Application Center, China Earthquake Administration, Xi’an 710054, China
2
State Key Laboratory of Resources and Environmental Information System, Institute of Geographic Sciences and Natural Resources Research, Chinese Academy of Sciences, Beijing 100101, China
3
College of Resources and Environment, University of Chinese Academy of Sciences, Beijing 100049, China
4
Jiangsu Center for Collaborative Innovation in Geographical Information Resource Development and Application, Nanjing 210023, China
*
Author to whom correspondence should be addressed.
Remote Sens. 2022, 14(8), 1823; https://doi.org/10.3390/rs14081823
Submission received: 29 March 2022 / Accepted: 6 April 2022 / Published: 10 April 2022

Abstract

:
High-precision spatial mapping of paddy planting areas is very important for food security risk assessment and agricultural monitoring. Previous studies have mainly been based on multi-source satellite imagery, the fusion of Synthetic Aperture Radar (SAR) with optical data, and the combined use of multi-scale and multi-source sensors. However, there have been few studies on paddy spatial mapping using collaborative multi-source remote sensing product information, especially in tropical regions such as Southeast Asia. Therefore, based on the Google Earth Engine (GEE) platform, in this study, Cambodia, which is dominated by agriculture, was taken as the study area, and an extraction scheme for paddy planting areas was developed from collaborative multi-source information, including multi-source remote sensing images (Sentinel-1 and Sentinel-2), multi-source remote sensing land cover products (GFSAD30SEACE, GLC_FCS30-2015, FROM_GLC2015, SERVIR MEKONG, and GUF), paddy phenology information, and topographic features. Evaluation and analysis of the extraction results and the SERVIR MEKONG and ESACCI-LC paddy products revealed that the accuracy of the paddy planting areas extracted using the proposed method is the highest, with an overall accuracy of 89.90%. The results of the proposed method are better than those of the other products in terms of the outline of the paddy planting areas and the description of the road information. The results of this study provide a reference for future high-precision paddy mapping.

Graphical Abstract

1. Introduction

The timely and accurate acquisition of the spatial distribution of paddy planting areas, on which humans depend for survival, is of great significance for agricultural monitoring, paddy yield estimation, and other research [1,2]. Paddy is the most important food security crop in Southeast Asia, but most paddy is planted in the rainy season, and the cloudy weather in the rainy season seriously affects the use of optical remote sensing images, which in turn affects the accurate extraction of paddy planting areas [3]. Synthetic Aperture Radar (SAR) can observe the ground surface in near real-time and can reflect basic information about an area, such as the geometric structure of the land cover and the roughness of the vegetation canopy [4]. However, compared with optical remote sensing images, SAR data are very often used in agricultural mapping and monitoring [5,6]. The Sentinel series of freely available satellite data, which has high temporal and spatial resolutions, provides new opportunities for agricultural monitoring [7], which is extremely important in cloud-prone regions such as Southern and Southeast Asia.
Until now, scholars have used optical, SAR, and a combination of optical and SAR images to map paddy planting areas and planting patterns [8,9,10]. Dong et al. [11] extracted the paddy planting area of China’s Sanjiang Plain from 1986 to 2010 using Landsat time-series images and a phenological algorithm. Chen et al. [12] used time-series Moderate Resolution Imaging Spectroradiometer (MODIS) data to monitor paddy planting activities in the lower Mekong countries. Park et al. [13] carried out paddy mapping research in the United States and South Korea based on Landsat and SAR time-series data. Ding et al. [14] proposed a paddy extraction algorithm that combines Landsat and MODIS images with phenology-based methods. Since the launch of the Sentinel series of satellites in 2014, scholars have started to study the areas and planting patterns of paddy in different regions based on Sentinel data. For example, Singha et al. [15] created a high-resolution (10 m) seasonal paddy map of Bangladesh and northeast India using time-series Sentinel-1 data and the random forest algorithm based on the Google Earth Engine (GEE) platform. Mansaray et al. [16] used Sentinel-1A and Landsat 8 data to extract the paddy areas in the Central Business District of Shanghai and its surrounding areas in southeastern China.
Previous studies have mainly been based on multi-source satellite imagery, the fusion of SAR and optical data, and the combined use of multi-scale and multi-source sensors. However, few studies have been conducted on the spatial mapping of paddy areas using collaborative multi-source remote sensing product information, especially in tropical regions such as Southeast Asia.
Therefore, in this study, the predominantly agricultural country of Cambodia in Southeast Asia was taken as the experimental area, and the paddy planting areas were extracted using a combination of multi-source information, including optical and SAR multi-source remote sensing images, multi-source land cover product data, paddy phenology data, and topographic data (such as the Digital Elevation Model, DEM) and the GEE remote sensing big data cloud computing platform. The results of this study provide a new idea for the application of multi-source remote sensing land cover products and a reference scheme for the high-precision acquisition of paddy planting areas in cloudy and rainy areas.

2. Materials and Methods
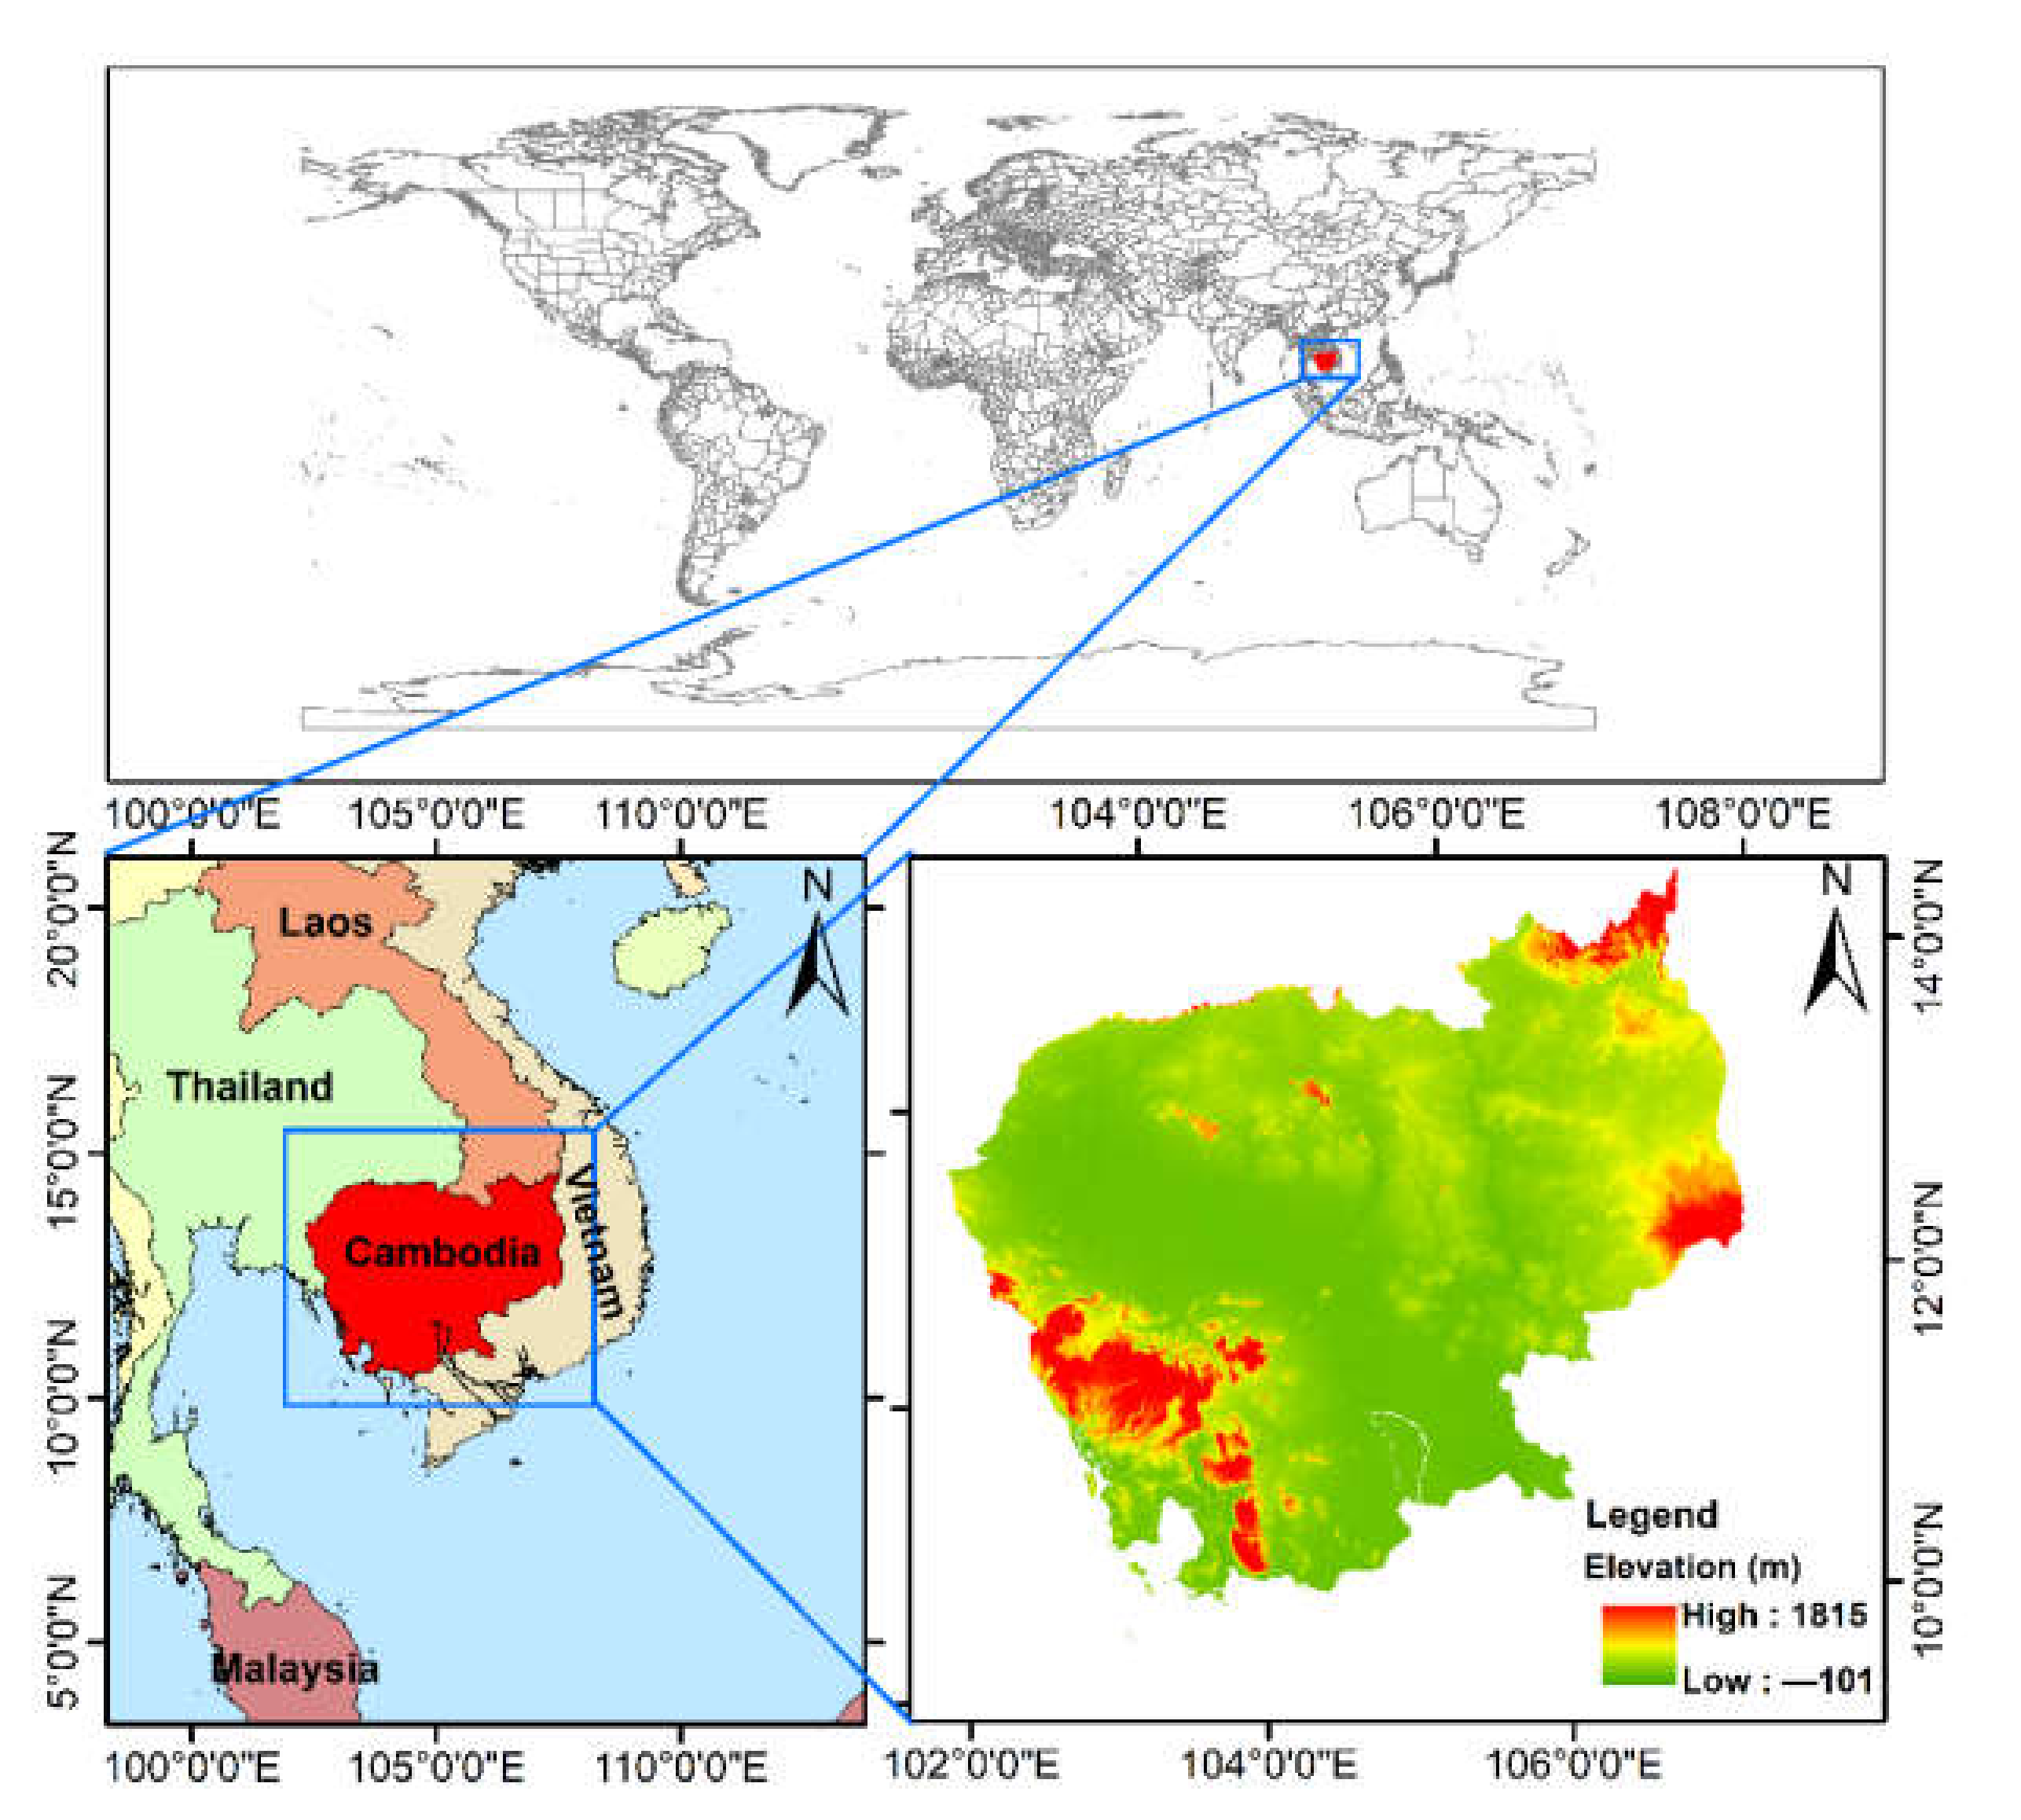
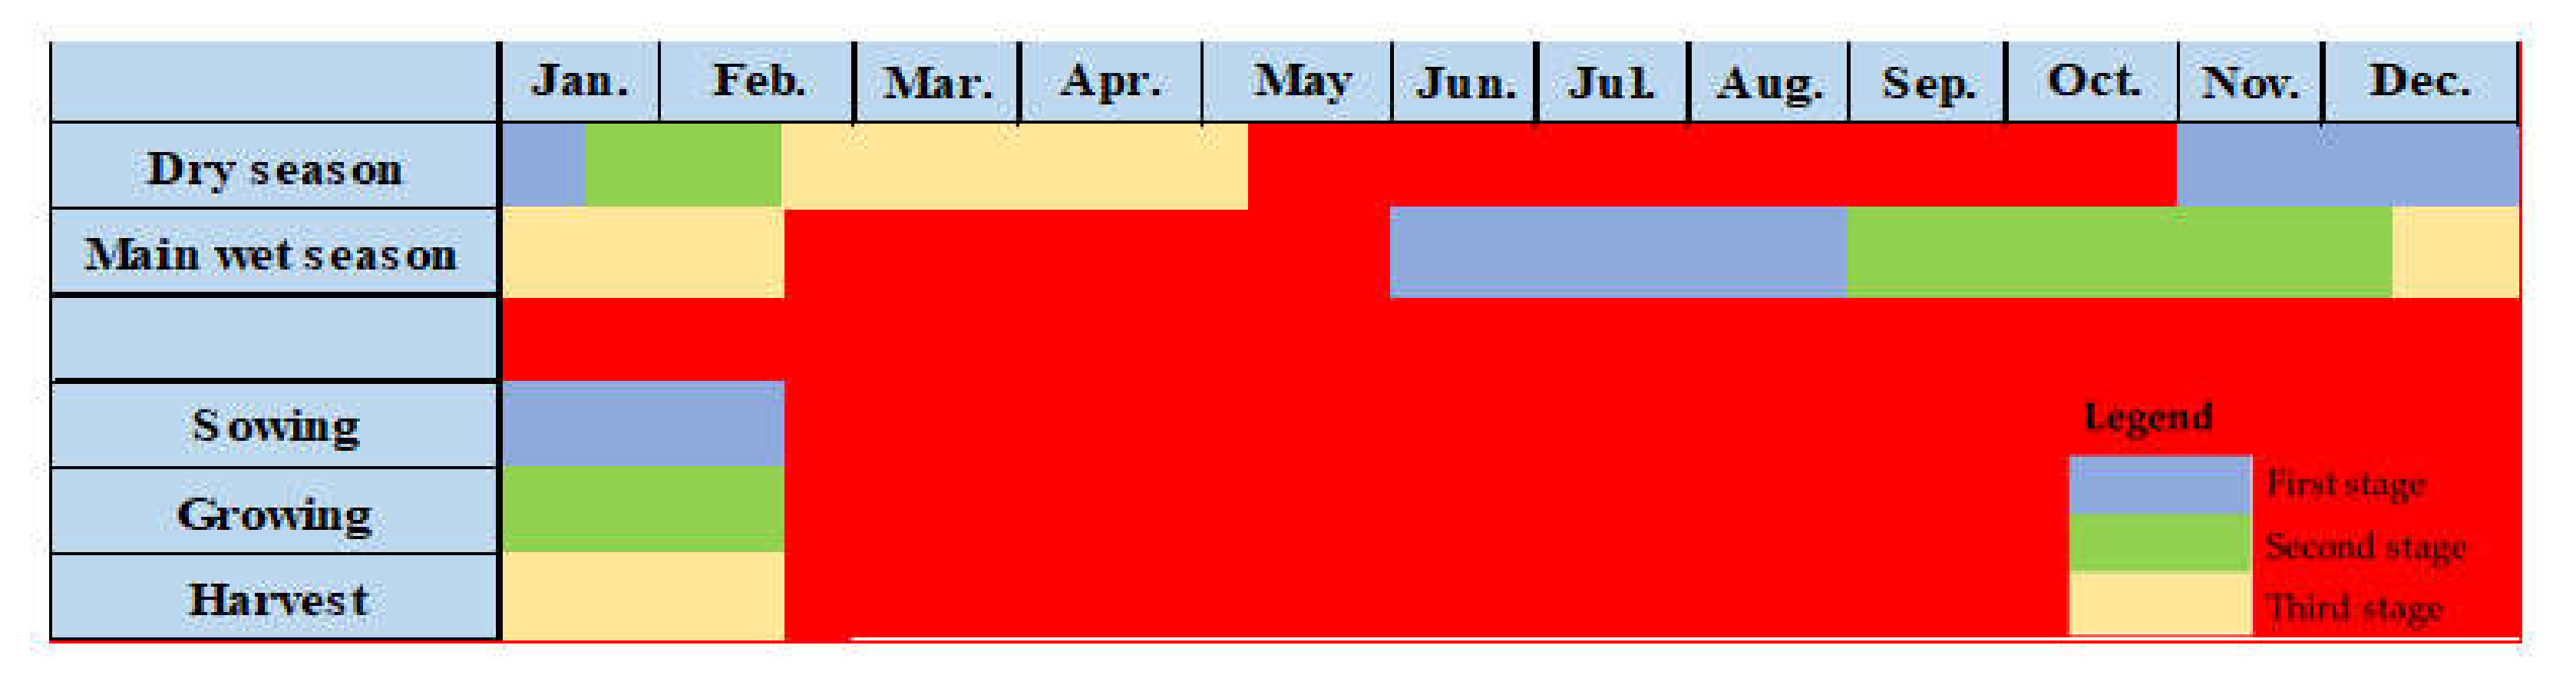
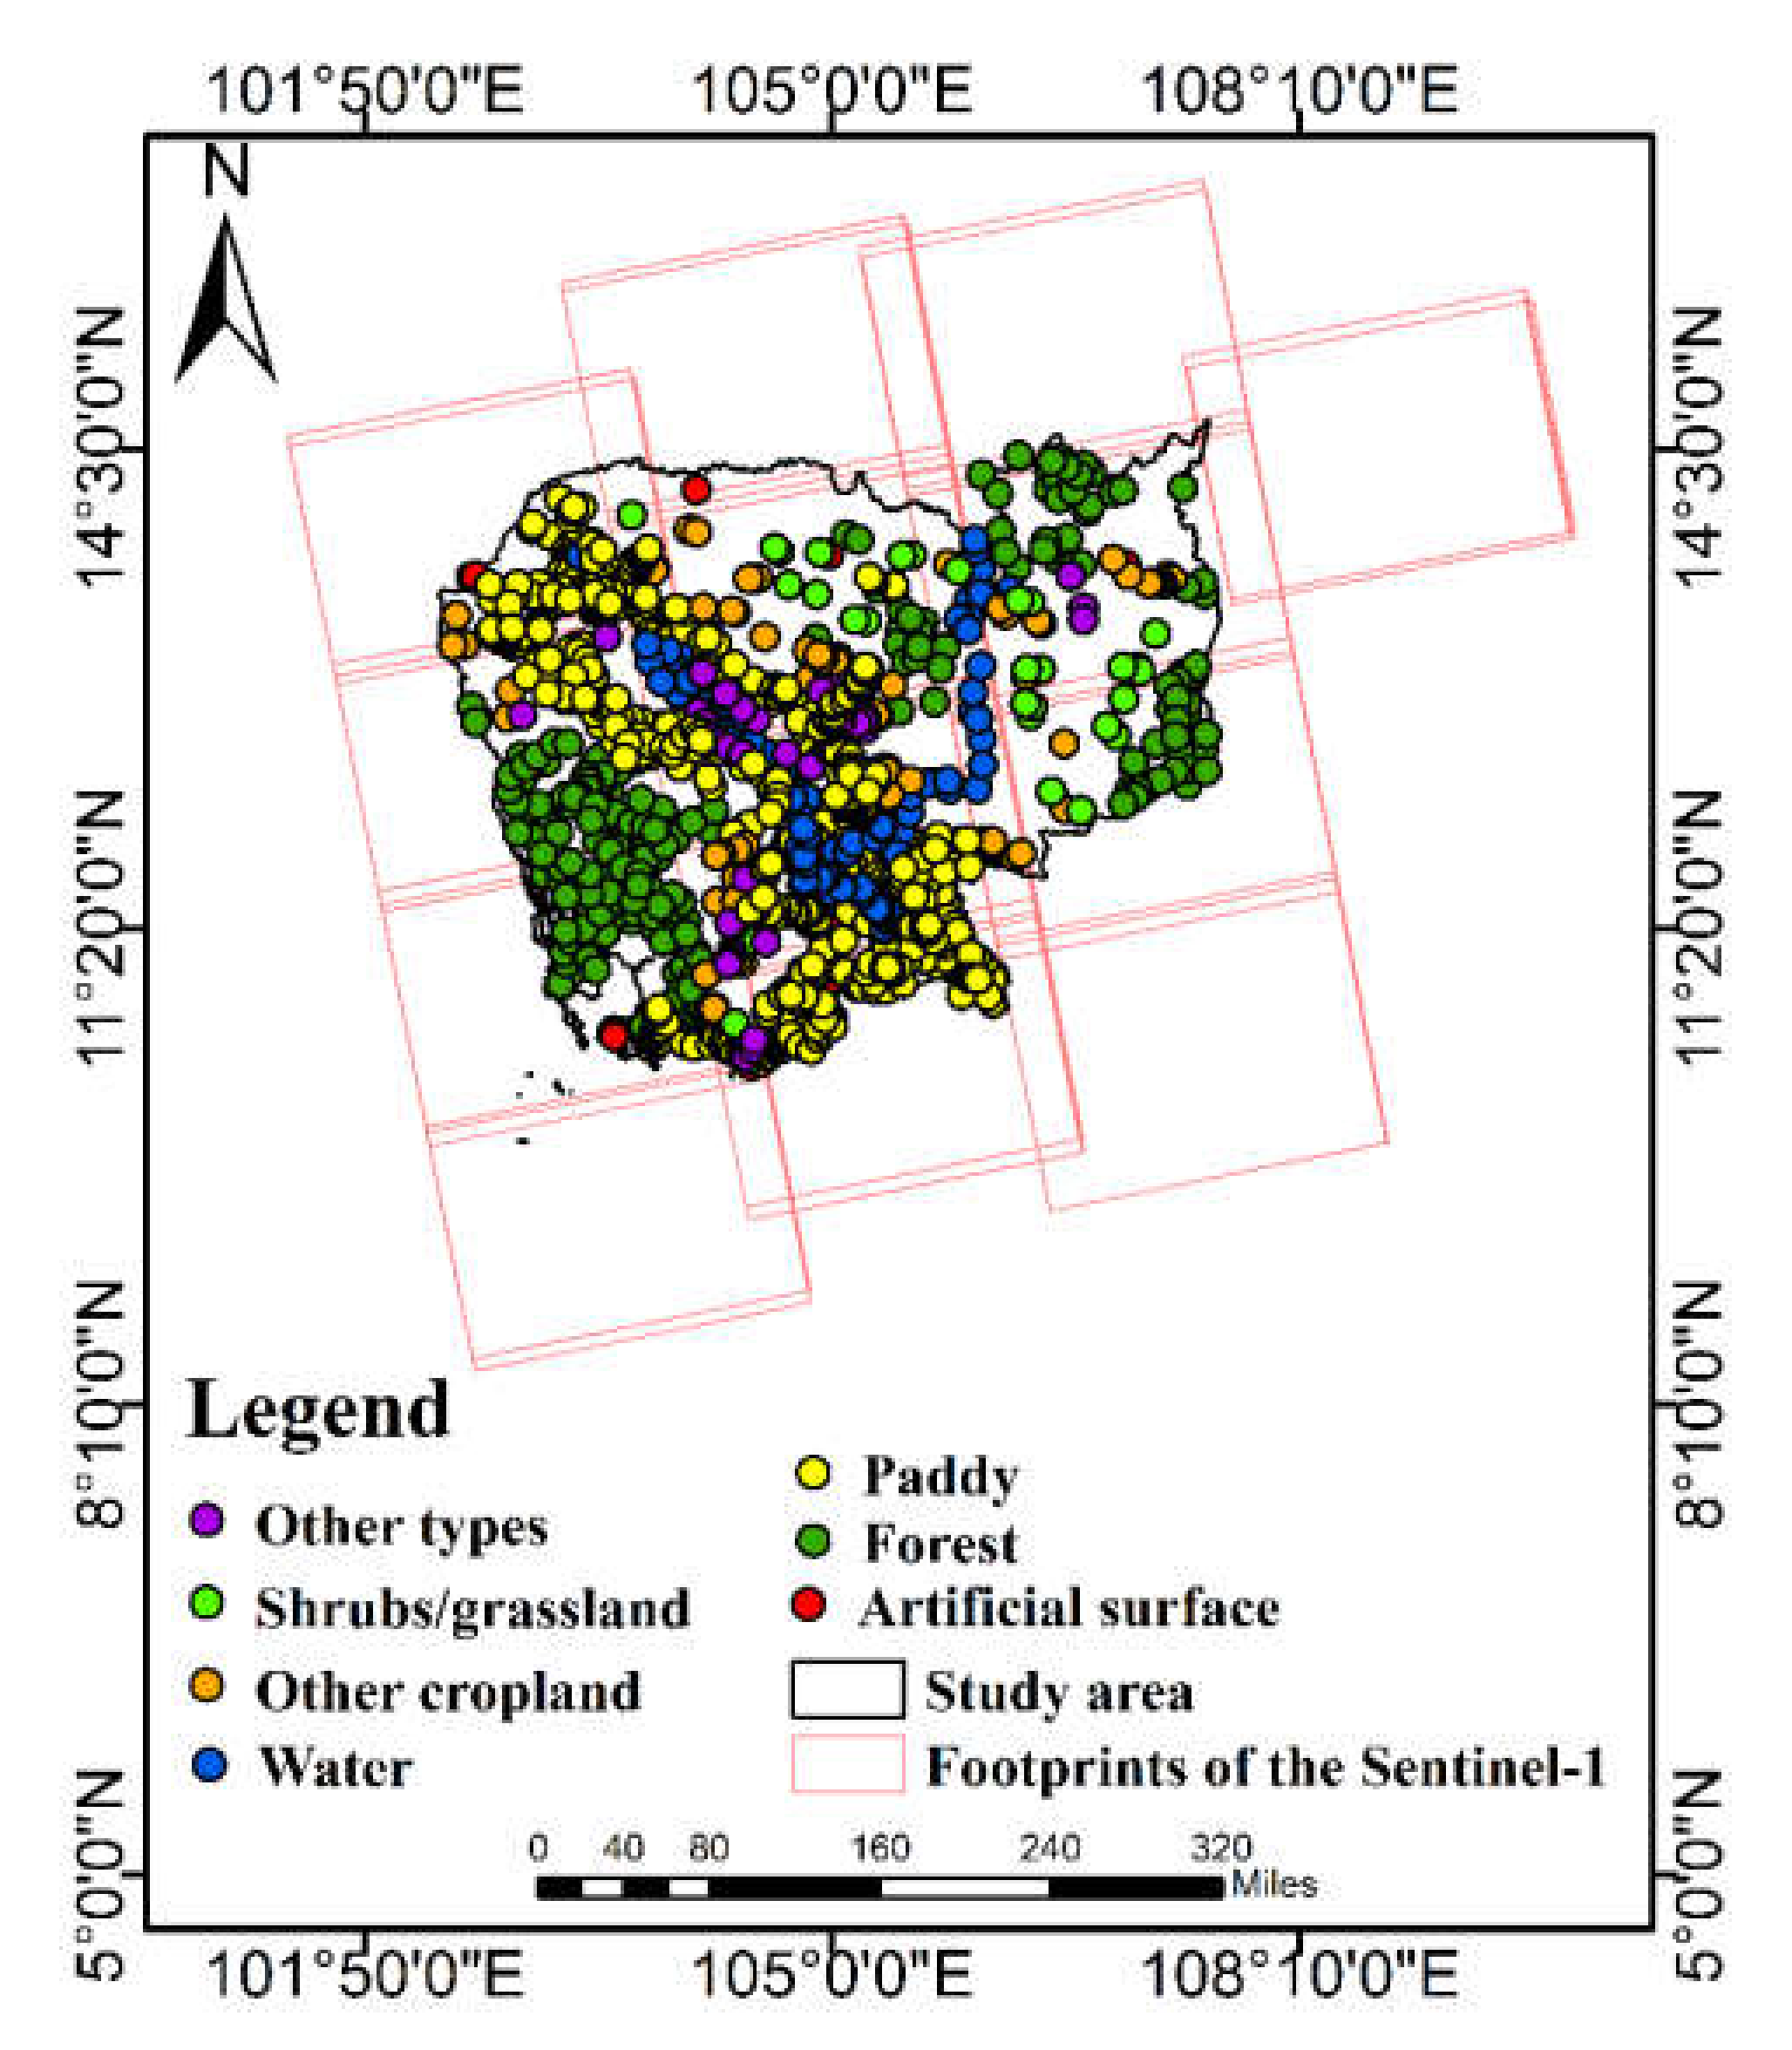
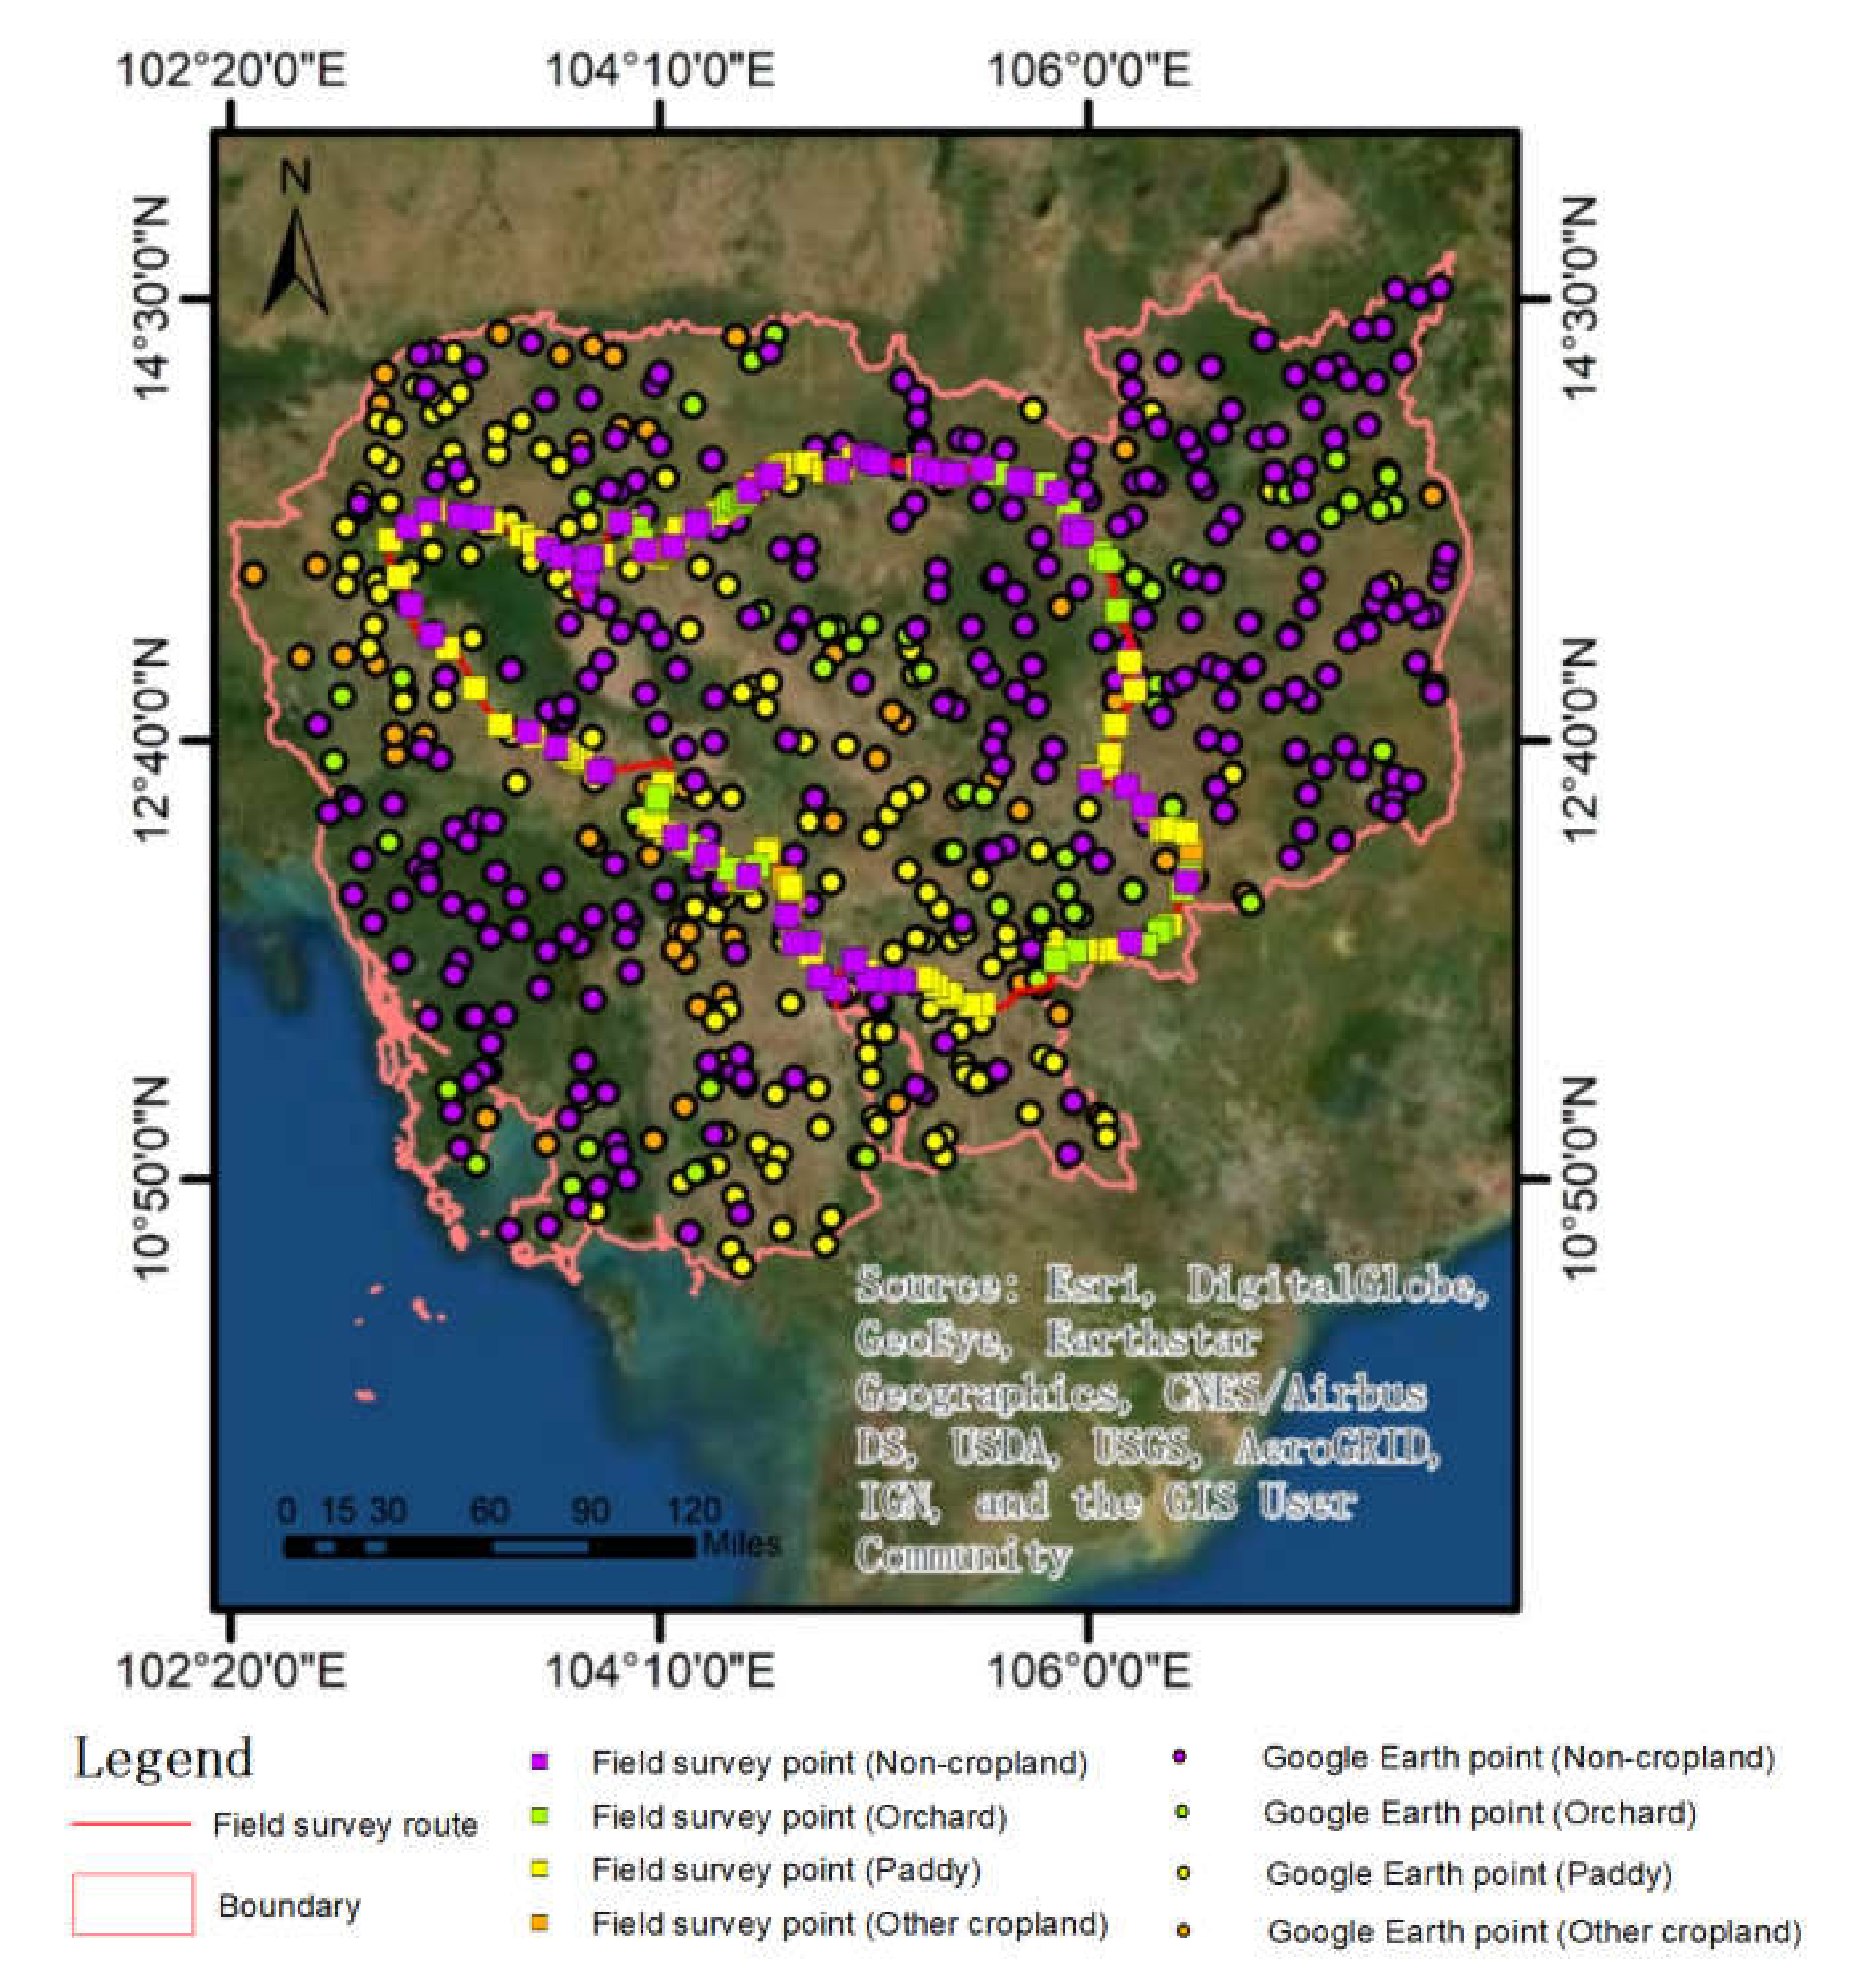
2.1. Study Area

Cambodia, which is located in the southern part of the Indochina Peninsula, borders Thailand, Laos, and Vietnam (Figure 1). The central and southern parts of Cambodia are flat, and there are mountains and plateaus in the east, north, and west. Forestry is the main surface cover type in Cambodia. Cambodia has a tropical monsoon climate. May to October is the rainy season, November to April is the dry season, and there are differences in rainfall throughout the region. The Mekong River and Tonle SAP Lake are Cambodia’s largest river and lake, respectively, and the area around Tonle SAP Lake is an important crop growing area [17].

2.2. Data and Preprocessing

2.2.1. Remote Sensing Image Data

Free Sentinel-1 SAR and Sentinel-2 multispectral data provide the possibility for paddy extraction in Cambodia, which contains a large paddy planting area and is susceptible to cloud cover. Studies have shown that the Vertical Horizontal (VH) polarization backscattering of the Sentinel-1 SAR is more sensitive to paddy growth [16,18]. In addition, the Interferometric Wide swath (IW) mode is the main mode of operation according to Sentinel-1’s mission requirements [19], which supports its application in natural resources such as agriculture and forestry [20]. In order to meet the image quality and scan width requirements, IW mode is implemented as the ScanSAR mode with a progressive azimuth scan. IW mode combines a large mapping zone width (250 km) with a high geometric resolution (5 m × 20 m above ground). Using this technique, the radar beam scans back and forth three times along a strip, allowing the production of a very high quality and uniform SAR image. Sentinel-1 VH polarization and IW level-1 Ground Distance image (GRD) data were used as the remote sensing data sources in this study. The Sentinel-2 data include Level-1C top-of-atmosphere reflectance products and Level-2A bottom-of-atmosphere reflectance data. The image block is a 100 × 100 km2 ortho image projected onto the UTM/WGS84 coordinate system. In this study, the Level-2A products of Sentinel-2 were selected for use in the extraction of the paddy growing areas. Table 1 and Table 2 present the detailed information about Sentinel-1 and Sentinel-2 data used in this study.
The Sentinel-1 data provided by the GEE (Figure 2) have been processed, including orbit correction, GRD boundary noise cancellation, thermal noise cancellation, radiometric calibration, and terrain correction. The unit of the radar backscattering coefficient is decibels (dB). The Sentinel-2 data provided by the GEE have been preprocessed, including atmospheric correction. Based on this, in this study, the preprocessing included Sentinel-2 data cloud removal and region clipping. First, the Sentinel-2 data package contains cloud mask band QA60 with a resolution of 60 m. The dense clouds and cirrus clouds are labeled as binary positions 10 and 11, respectively. Based on this, the QA10 and QA20 bands are resampled to resolutions of 10 m and 20 m, respectively. In the corresponding binary bit, 0 indicates no clouds, and 1 indicates that there are clouds. Therefore, the GEE can be used to facilitate cloud removal using the band logic operation of the image. Finally, the clip function in the GEE was used to obtain Sentinel-2 image data covering the study area.

2.2.2. Multi-Source Land Cover Data

In order to solve the problem of the use of time-consuming and labor-intensive training samples, in this study, the acquisition of the paddy extraction training samples was conducted using a combination of multi-source remote sensing land cover products. The land cover products used included GLC_FCS30-2015 [21], FROM_GLC2015 [22,23], SERVIR MEKONG [24,25], Global Food Security-Support Analysis Data Cropland Extent 2015 Southeast and Northeast Asia 30 m (GFSAD30SEACE) [26], and Global Urban Footprint (GUF) (https://www.dlr.de/eoc/en/desktopdefault.aspx/tabid-11725/20508_read-47944/) (accessed on 6 December 2021) [27,28]. According to the production instructions of each product, the overall accuracies of GLC_FCS30-2015, FROM_GLC2015, GFSAD30SEACE, and GUF products are 81.4%, 77.3%, 88.6%, and 93.96%, respectively, based on the absolute accuracy evaluation of the validation samples. The overall accuracy of the SERVIR MEKONG product is currently unpublished. Among them, the spatial resolution of the GUF product is 12 m, and those of the other products are 30 m. The GUF product was produced in the period 2011–2012, and the other products (GFSAD30SEACE, GLC_FCS30-2015, FROM_GLC2015, and SERVIR MEKONG) were produced in 2015. According to previous studies [29], natural ecosystems often undergo significant changes during periods of 10 years or longer. Therefore, the timeframes of the data selected are adequate for use in this study. After obtaining the land cover products for the study area, the WGS84 data and the Albert equal-area projection coordinate system were used as the spatial reference system for the analysis.

2.2.3. Other Auxiliary Data
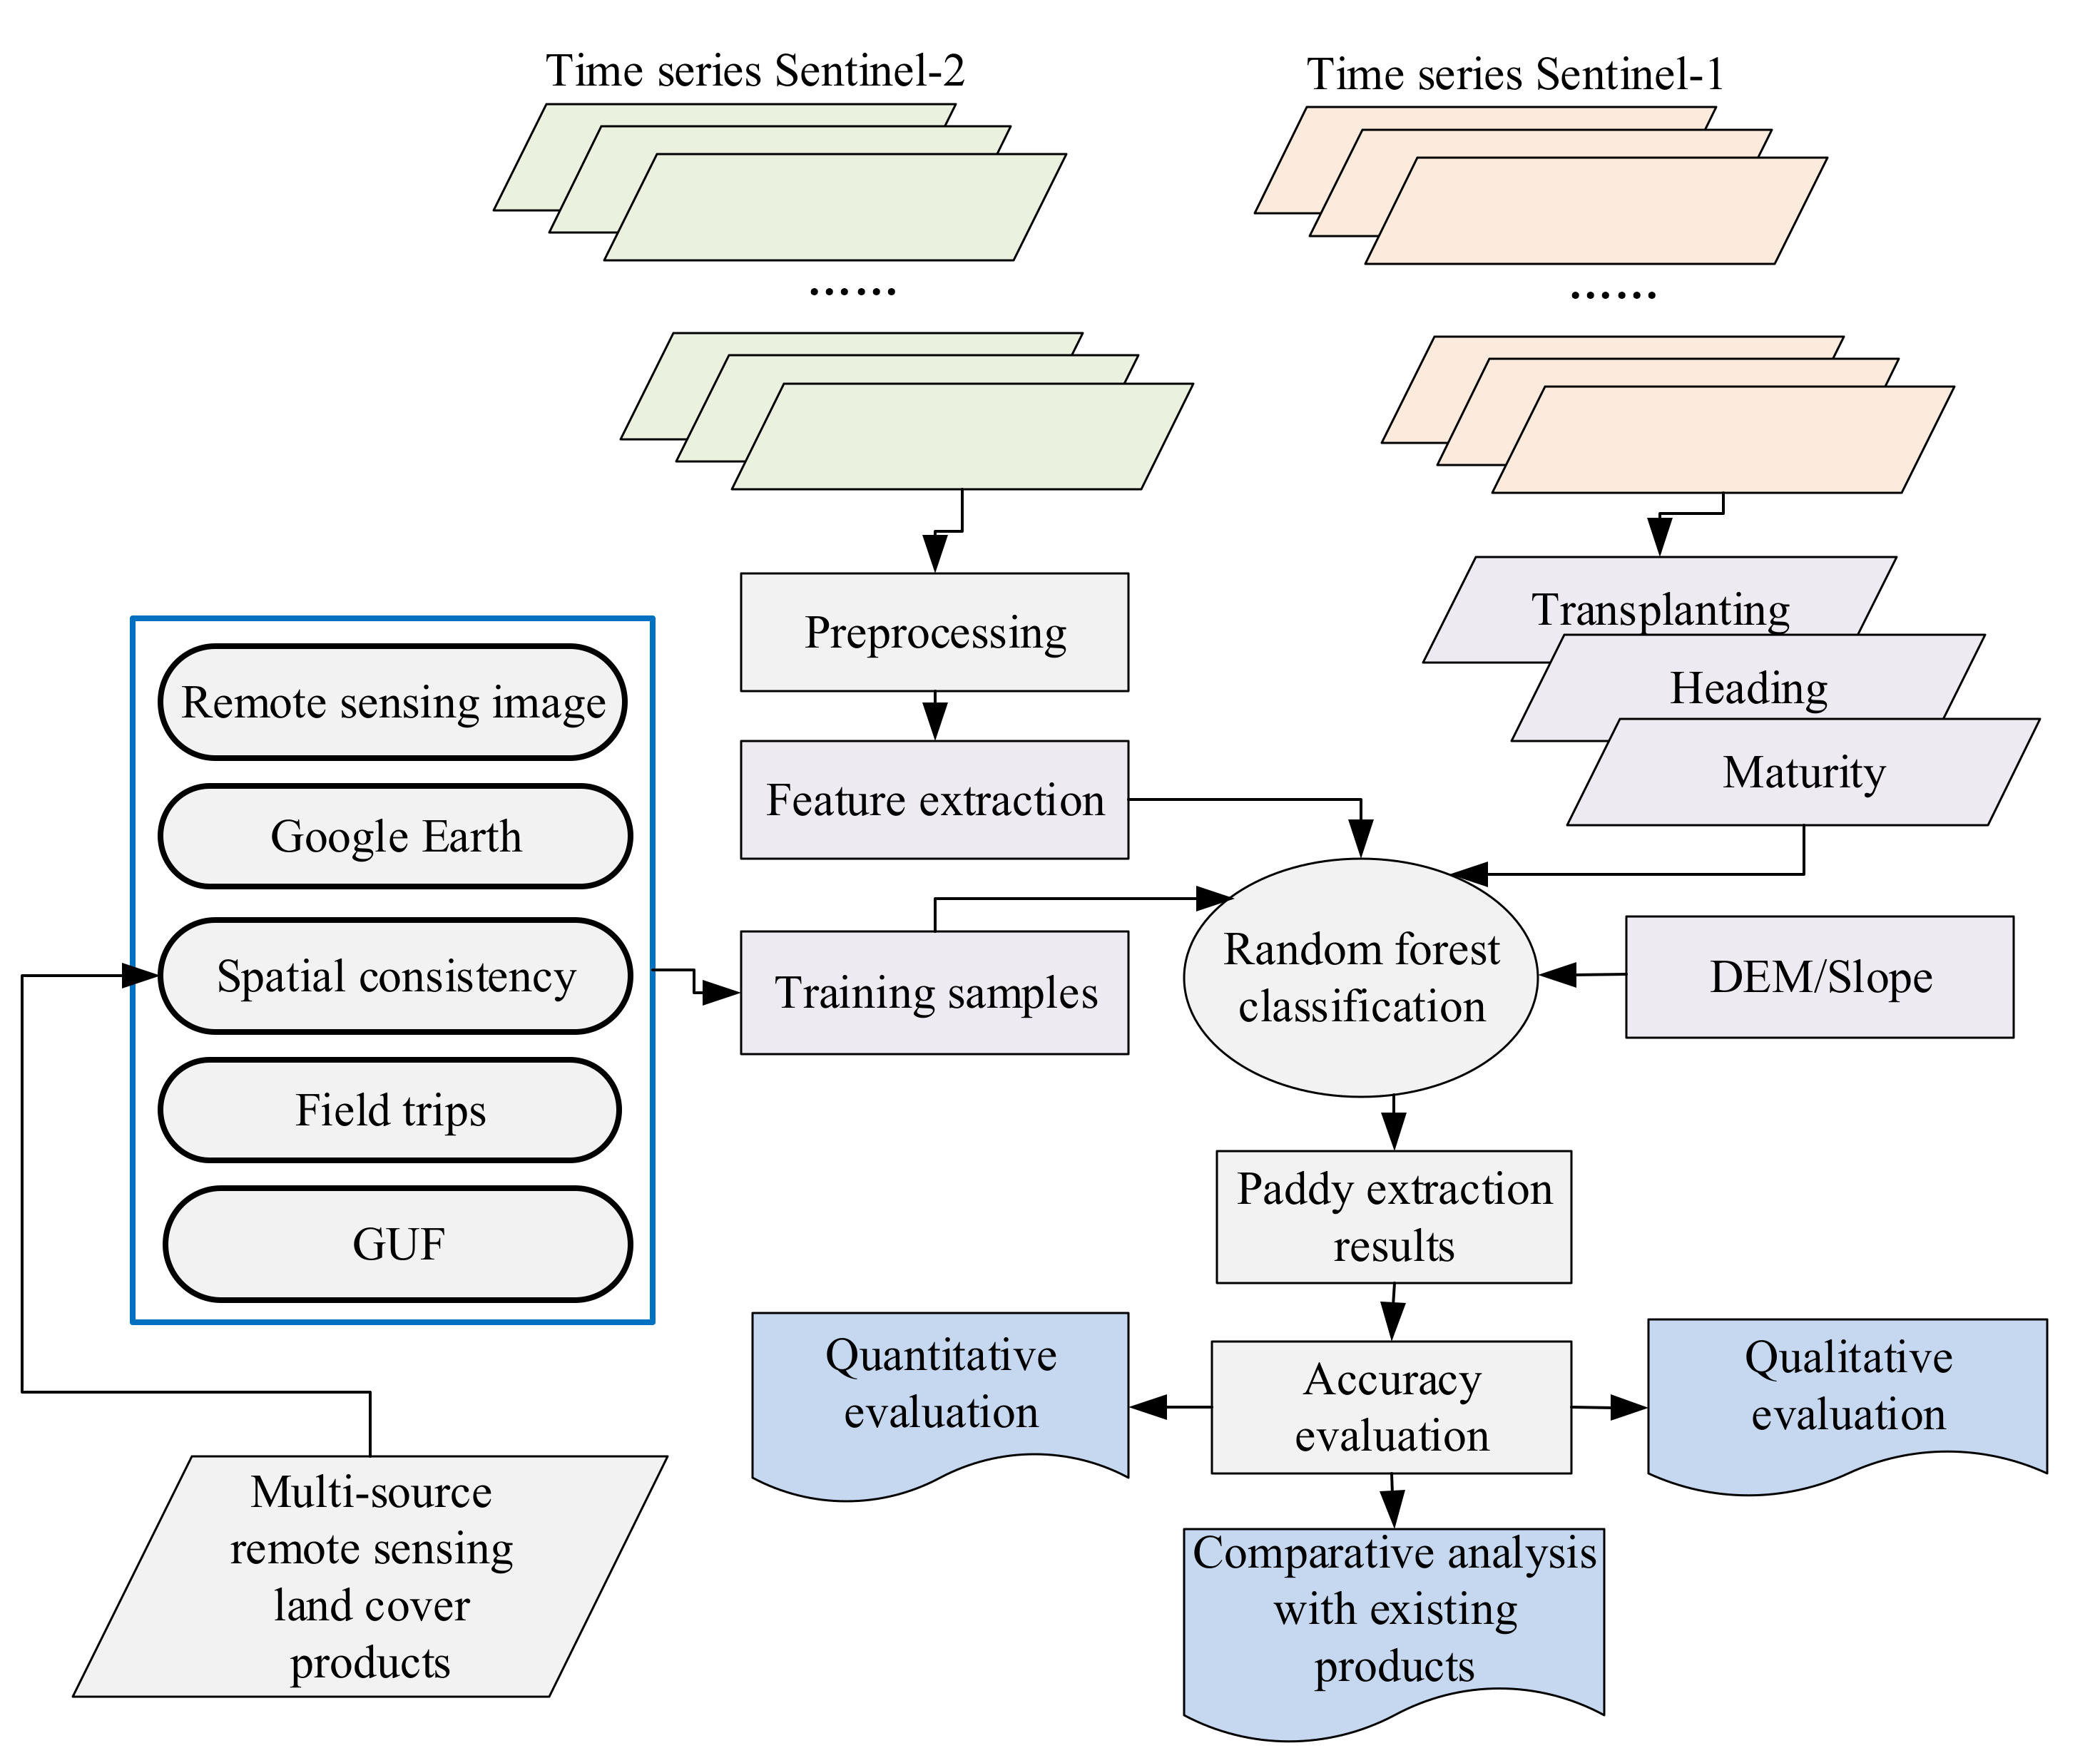
Paddy planting calendar. The paddy planting calendar information from the Food and Agriculture Organization (FAO) Global Information and Early Warning System (GIEWS) information (http://www.fao.org/giews/countrybrief) (accessed on 8 December 2021) and the RiceAtlas (https://doi.org/10.7910/DVN/JE6R2R) (accessed on 15 December 2021), which is a spatial database of the global paddy calendar and yield produced by Laborte et al. [30], were used in this study. For more information about the RiceAtlas data, please refer to Laborte et al. [30]. In addition, in order to ensure the reliability of the paddy planting calendar information, they were compared with the information obtained from the field investigations and consultation with local residents in 2018 and data obtained from the literature. The results revealed that the paddy planting calendar information from the GIEWS and RiceAtlas is consistent with the reference data. Detailed information about the paddy planting calendar for the study area is presented in Figure 3.
DEM data. The DEM data used in this study are National Aeronautics and Space Administration (NASA) Shuttle Radar Topography Mission (SRTM) DEM data, which are global 30-m resolution DEM data released by NASA in February 2020. This dataset combines the advantages of the Advanced Spaceborne Thermal Emission and Reflection Radiometer (ASTER) Global Digital Elevation Model (GDEM), ICESat Geoscience Laser Altimeter System (GLAS), and Portable Remote Imaging Spectrometer (PRISM) data in terms of processing and improving the original SRTM data, filling in missing values, and improving the elevation accuracy [31]. In order to improve the computational efficiency, the DEM data and slope data calculated based on the DEM were obtained directly from the GEE platform.

2.3. Methods

Figure 4 shows the overall extraction process for the paddy planting areas. First, in order to quickly obtain the training samples, multi-source remote sensing land cover products were combined to obtain the training samples. Second, using the GEE platform, Sentinel-1 and Sentinel-2 remote sensing images acquired in the dry and rainy seasons were selected based on the phenological information for the study area. The backscattering coefficients of the three key phenological periods (transplanting, heading, and mature) of paddy were extracted based on the Sentinel-1 images. Then, other classification features were extracted from Sentinel-2 images and were classified using the random forest method. Finally, the accuracy of the paddy extraction was qualitatively and quantitatively verified and was compared with existing paddy data products to verify the advantages and disadvantages of the proposed method.

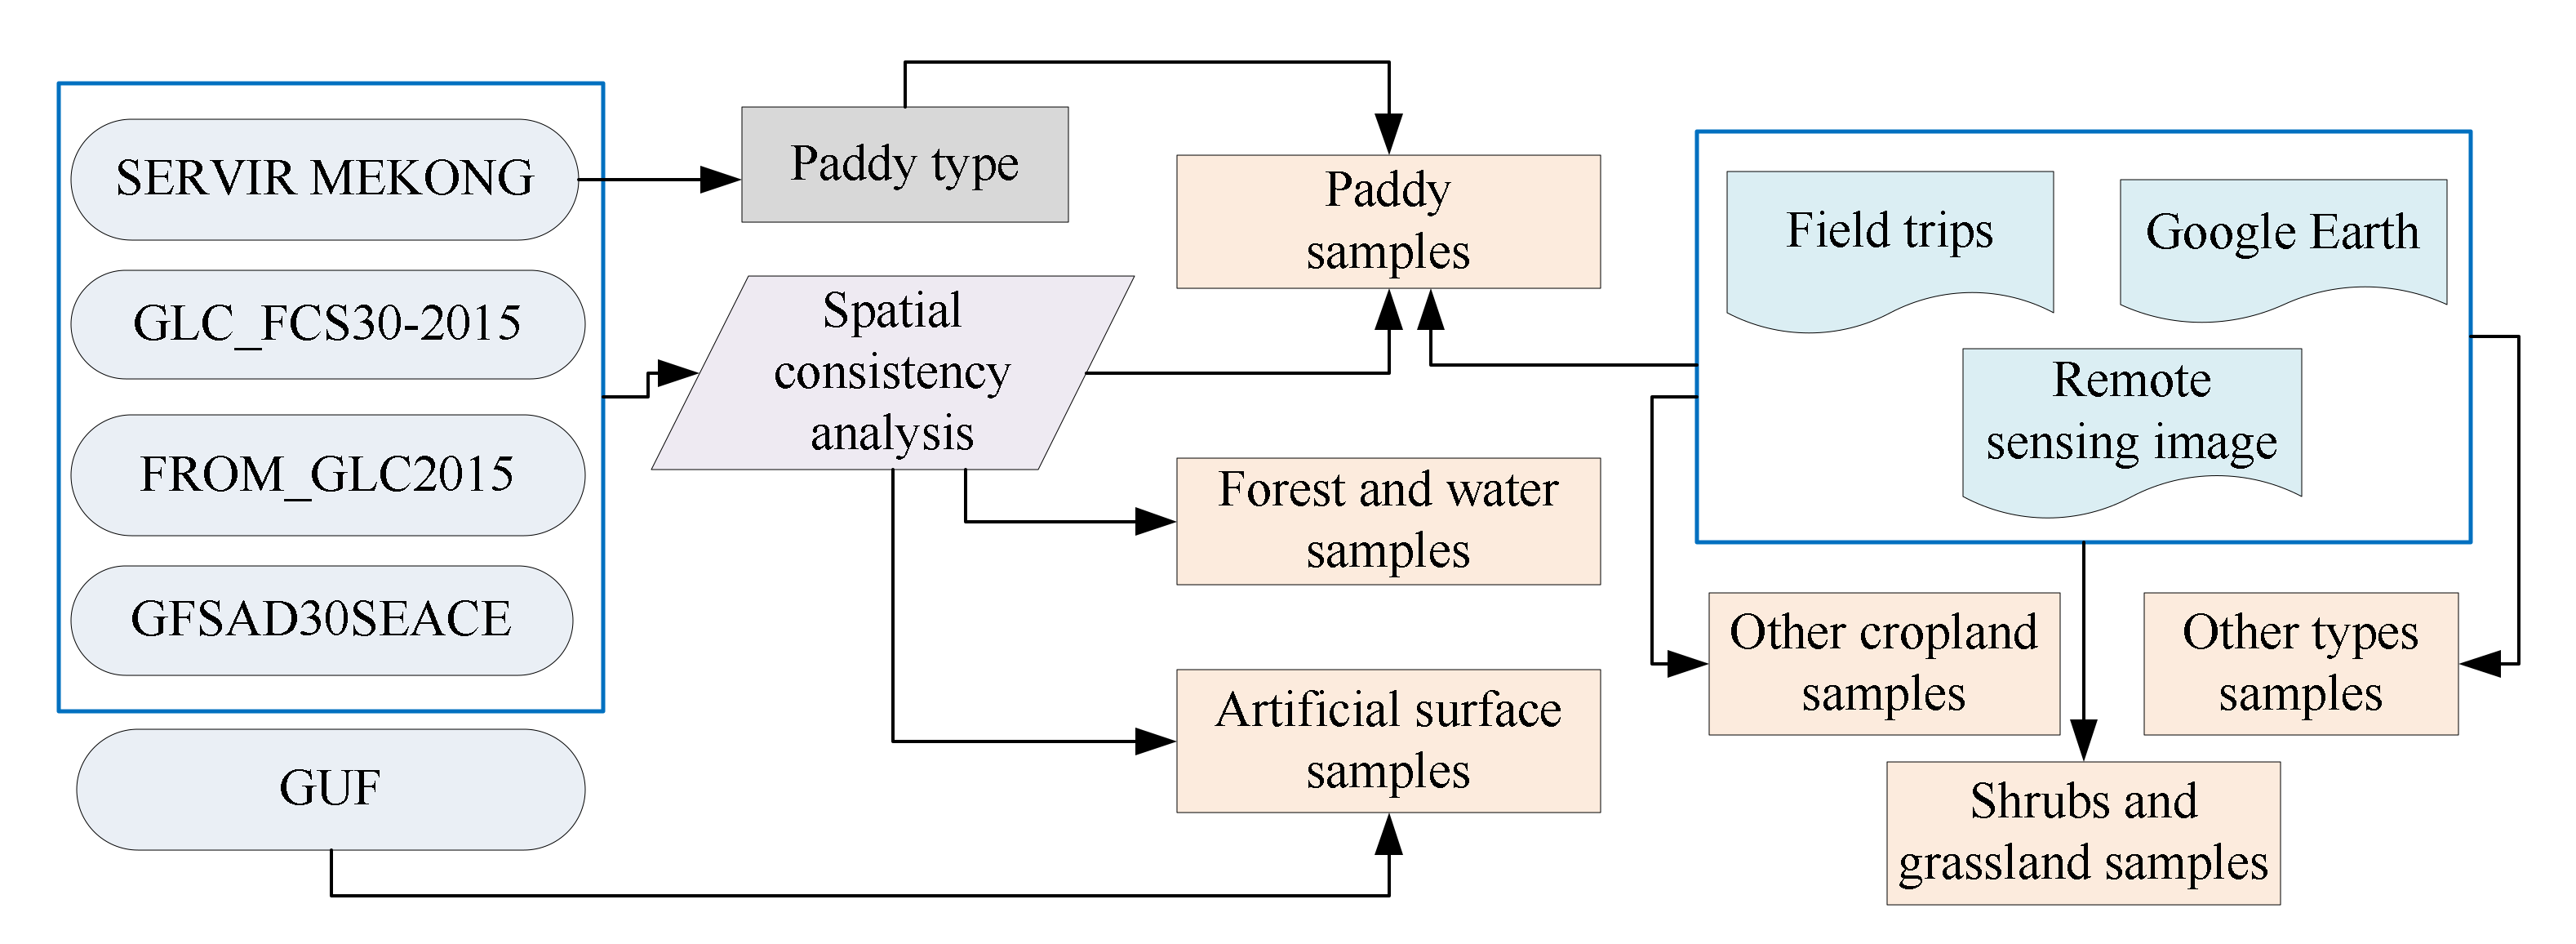
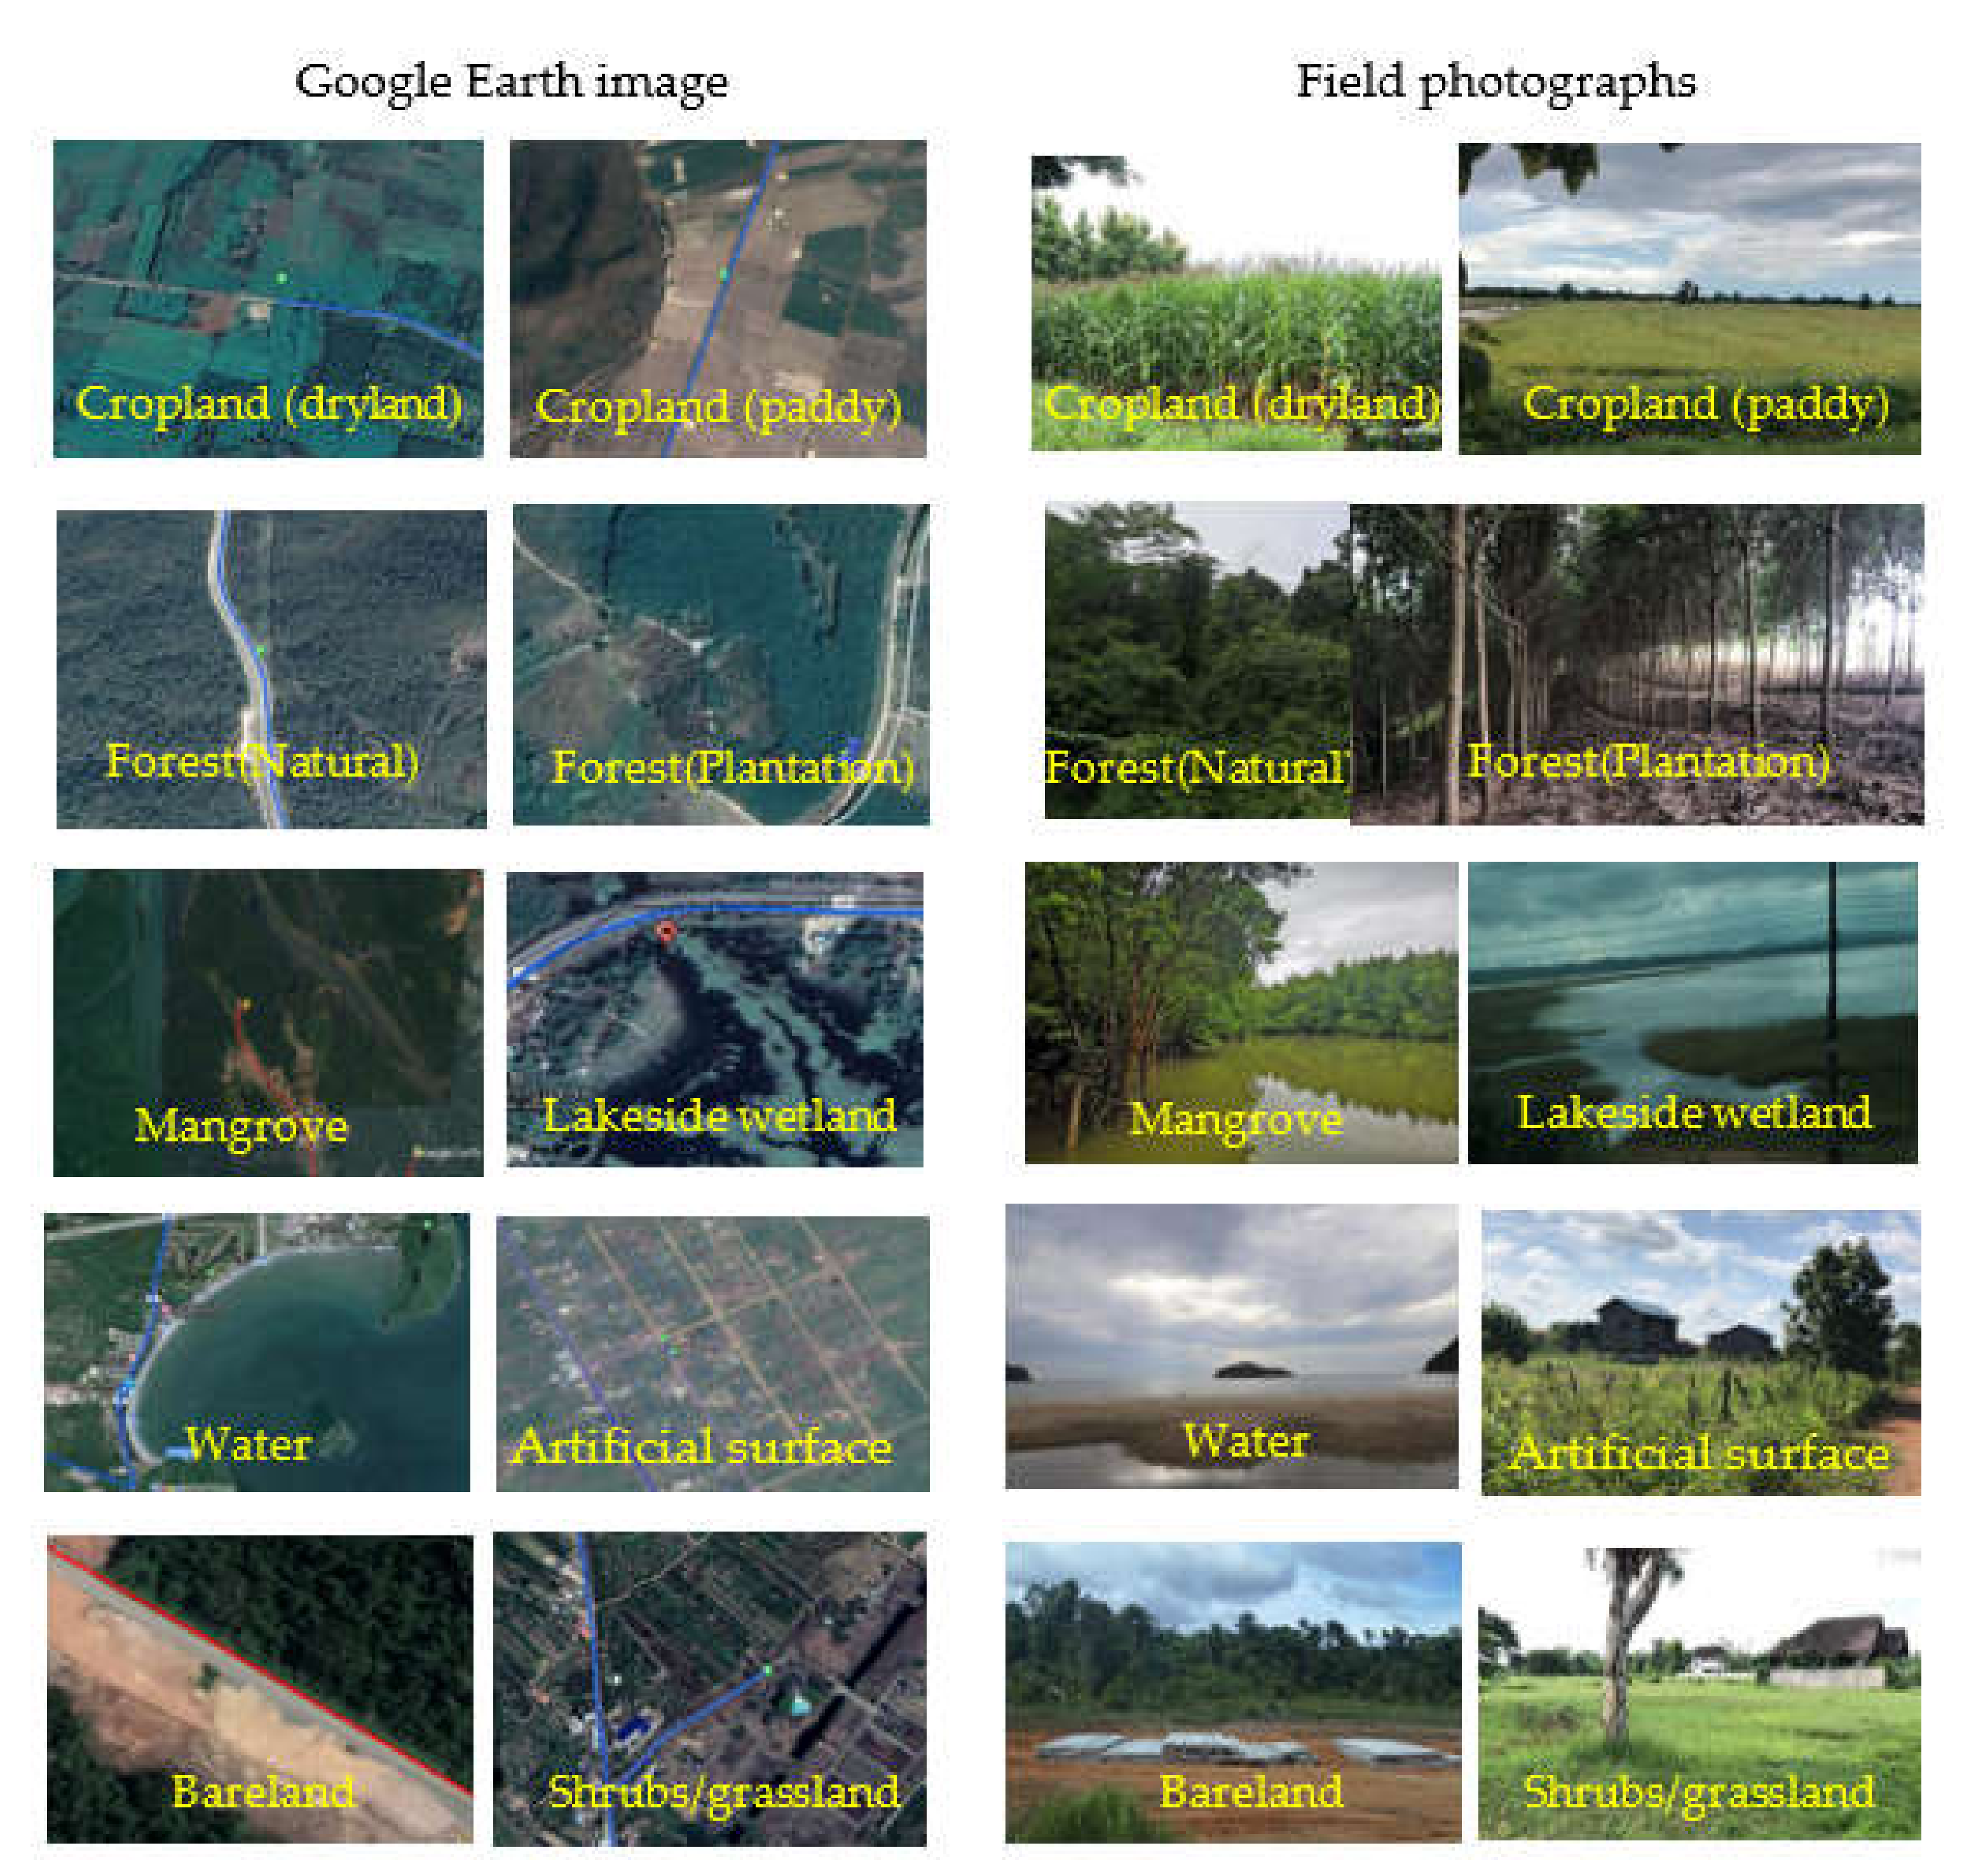
2.3.1. Acquisition of Training Samples

Figure 5 shows the overall process used to quickly acquire training samples from the combination of multi-source remote sensing land cover products.
Acquisition samples of forests, water bodies, and artificial surfaces. In this study, using the ArcGIS software (version 10.3 of Esri USA), the spatial superposition method was used to calculate the consistency of the different land cover data for each grid point pixel by pixel. The same number was defined for each type of pixel-by-pixel statistic, and the consistency was divided into different levels from low to high. In this study, samples were collected from the regions with the highest spatial consistency. The spatially consistent regions of the GLC_FCS30-2015, FROM_GLC2015, and SERVIR MEKONG products were obtained via spatial superposition. The results revealed that the consistencies of the water bodies, forests, and artificial surfaces were high, but the consistencies of the other types (such as shrubland) were low, which did not satisfy the requirements for the automatic acquisition of training samples. Therefore, in order to ensure the quality of the samples, the random sampling method was adopted to obtain the training samples from consistent areas of forest and water bodies. For the artificial surfaces, the GUF products and artificial surface consistency area were spatially superimposed, and the artificial surface samples were randomly sampled in the new consistent area.
Paddy sample acquisition. The consistent areas of the GLC_FCS30-2015, FROM_GLC2015, SERVIR MEKONG, and GFSAD30SEACE were spatially superposed with the paddy extraction areas of the SERVIR MEKONG, then the paddy samples were randomly sampled in the consistent areas. In addition, in order to ensure the number of paddy samples, Sentinel-2 images, high-resolution Google Earth images, and field investigation data were used as auxiliary data for the sample encryption to obtain the final paddy training samples.
Acquisition of other types of samples. Due to the small coverage areas of the shrubland, grassland, other cropland, and other land cover types in the study area, the random sampling of sample points based on the consistent areas could not guarantee the sample quality. Therefore, in order to improve the accuracy of the samples, these types of samples were acquired based on Google Earth images, Sentinel-2 images, and field investigation data. Using the above three steps, 1350 training samples covering the study area were finally obtained (Figure 6 and Table 3).

2.3.2. Feature Extraction

Key phenological characteristics of paddy. The phenological growth characteristics of paddy mainly include the germination stage, seedling stage, and transplanting stage (Figure 7 and Figure 8). During the process of paddy growth and development, the radar backscattering coefficients under different polarization and polarization combinations exhibit different response characteristics [32,33,34]. Therefore, based on the transition of paddy between the different phenological stages, the backscattering coefficient of the VH polarization exhibits different trends, which can be used to obtain the paddy planting areas [35].
The backscattering coefficients of the different land surface types were different in the time series, and the paddy types exhibited obvious phenological characteristics. During the growth and development of paddy, the radar backscattering coefficients under different polarizations and polarization combinations exhibit different response characteristics. Specifically, the VH polarization characteristics of paddy in the transplanting stage are similar to those of water bodies, and the backscattering coefficient is low. With the continuous growth of the paddy, the radar backscattering is mainly from the paddy itself, and the backscattering coefficient increases. When the paddy is in the heading stage and the milk ripening stage, the backscattering coefficient of the paddy reaches its maximum value. However, when the paddy is in the waxy ripening stage to the mature stage, the attenuation effect of the backscattering becomes stronger and the backscattering coefficient begins to decrease. In summary, in the three key phenological stages (transplanting, heading, and mature stages), the backscattering coefficients of paddy are small, large, and small, successively. In this study, the paddy phenology information for Cambodia was used as the time window to enhance the paddy information based on the Sentinel-1 image extraction of the backscattering coefficients in the three different growth stages of paddy in the dry season and rainy season. The detailed steps are as follows. Using the GEE platform, according to the image data for the first growth stage of paddy in the dry season, the minimum backscattering coefficient was extracted pixel by pixel using the image collection function in order to enhance the signal of the paddy transplanting stage. Then, using the image data for the second growth stage during the dry season, the maximum backscattering coefficient was extracted pixel by pixel using the image collection function to enhance the signal of the paddy heading stage. Finally, using the image data for the third growth stage during the dry season, the minimum backscattering coefficient was extracted pixel by pixel using the image collection function to enhance the signal of the mature paddy stage. The method of enhancing the signals of the paddy transplanting stage, heading stage, and mature stage for the rainy season is consistent with that of the dry season. For a single pixel, the backscattering coefficients of the three key phenological stages were extracted using Equations (1)–(3). Through the above steps, the radar backscattering coefficients of six bands were obtained to enhance the extraction of the paddy planting areas.
σ a 0 = m i n σ 1 0 , σ 2 0 , σ 3 0 , , σ k 0 ,
σ b 0 = m a x σ 1 0 , σ 2 0 , σ 3 0 , , σ m 0 ,
σ c 0 = m i n σ 1 0 , σ 2 0 , σ 3 0 , , σ n 0 ,
where σ a 0 , σ b 0 , and σ c 0 are the backscattering coefficients of the transplanting, heading, and mature stages, respectively, and k , m , and n are the numbers of all of the available backscattering coefficients for the transplanting, heading, and ripening stages, respectively.
Other characteristics. The other features used in this study included the thematic index feature, textural feature, and terrain feature. The features of the thematic indexes mainly include the Normalized Difference Vegetation Index (NDVI) [36], Modified Normalized Difference Water Index (MNDWI) [37], and Normalized Difference Building Index (NDBI) [38]. In this study, after resampling the resolution to 10 m, based on previous research results, the annual maximum value of the NDVI was used to highlight the forest information, the annual mean value of the MNDWI was used to highlight the water information, and the annual mean value of the NDBI was used to highlight the building information. Haralick et al. [39] proposed the Gray-Level Co-Occurrence Matrix (GLCM), which is widely used at present and can obtain good classification results, to characterize the textural features of images [40,41]. Previous studies have shown that the four features of contrast, entropy, angle of the second moment, and correlation calculated using the GLCM have good classification effects for remote sensing images and can effectively represent the textural information of the ground objects [42]. Therefore, in this study, the four textural features were calculated based on the B8 band Sentinel-2 data and were introduced into the classification. During the calculation of the above characteristic indices, the data resolution was resampled to 10 m. In addition to the extracted paddy phenology features, thematic index features, and textural features, the DEM and slope (topographic factors) also have an impact on the accuracy of the cropland extraction. Therefore, the DEM and slope were added to the classification to avoid unreasonable classification results.

2.3.3. Classification and Accuracy Evaluation

At present, many remote sensing images classification studies have verified the robustness of the random forest algorithm [43,44,45,46]. Therefore, in this study, the random forest algorithm [47] was used to extract the paddy areas. When building a random forest model using the GEE platform, the number of randomly selected features is the default value of the random forest function, which is the square root of the total number of input features. The number of spanning trees is determined according to the highest classification accuracy obtained through multiple tests. The final value is set to 40, and the default values of the other parameters are used.
The accuracy evaluation was conducted from qualitative and quantitative perspectives. The qualitative evaluation involved comparing the extracted results with high-resolution Google Earth images and Sentinel-2 images to assess the spatial pattern. The quantitative evaluation involved calculating the Overall Accuracy (OA), User Accuracy (UA), Producer Accuracy (PA), and Kappa coefficients using the confusion matrix [48,49]. The validation samples used for the quantitative evaluation were based on the data collected during the field investigation in 2018 and high-resolution Google Earth images. The spatial distribution of the validation samples and photos of typical samples taken in the field are shown in Figure 9 and Figure 10. In addition, the results were compared with the SERVIR MEKONG and European Space Agency Climate Change Initiative Land Cover (ESACCI-LC) [50] products to verify the advantages and disadvantages of the proposed method. More information about the ESACCI-LC products can be found at http://maps.elie.ucl.ac.be/CCI/viewer/index.php (accessed on 10 December 2021).

3. Results and Analysis

3.1. Paddy Extraction Results and Qualitative Evaluation

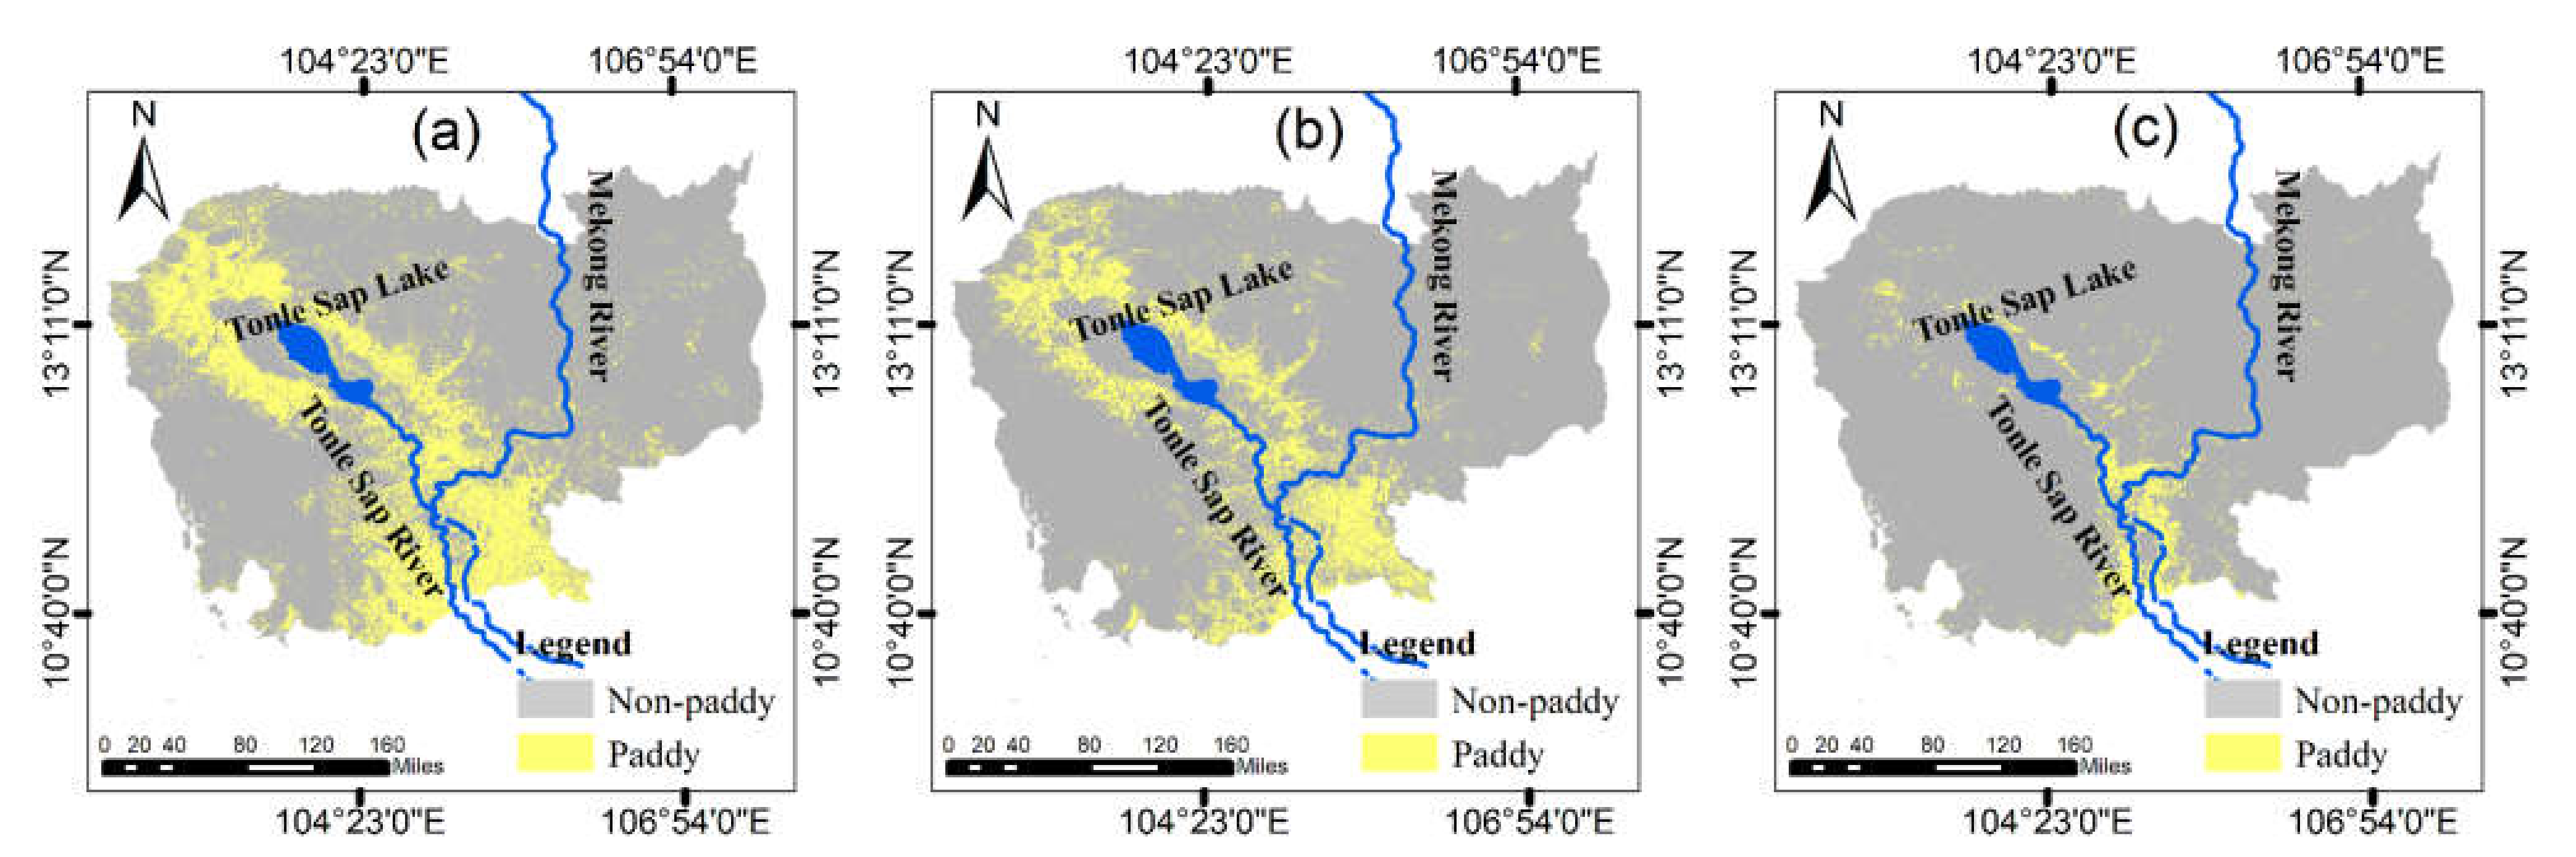
3.1.1. Spatial Distribution of Paddy Extraction Results

Figure 11 shows the spatial distribution of the paddy areas in Cambodia in 2015. The paddy planting areas in Cambodia were mainly distributed in the northwestern, central, and southern regions. In the east and northeast, the paddy planting areas were small and scattered, which is closely related to the topography and water resources in the study area.
By comparing the results of this study with the SERVIR MEKONG and ESACCI-LC products for the same period, it was found that the SERVIR MEKONG product has a good spatial consistency with the extraction results obtained in this study. However, the extraction results obtained in this study differ from the SERVIR MEKONG product in the Tonle Sap Lake (https://hydrosheds.org/downloads) (accessed on 18 December 2021) basin and the southern Mekong River (https://hydrosheds.org/downloads) (accessed on 18 December 2021) basin. This may be due to the fact that the two products use different data sources and classification methods. The consistencies of the spatial patterns of the ESACCI-LC product and the other two products are low. The paddy area extracted from the ESACCI-LC was mainly concentrated in the southern Mekong River basin, and fewer paddy areas were located in the vicinity of the Tonle SAP Lake basin. There was a significant leakage phenomenon in this product. The main reason for this phenomenon is that when the classification system of the ESACCI-LC product was developed, the paddy types only included irrigated paddy fields, not rain-fed paddy fields.

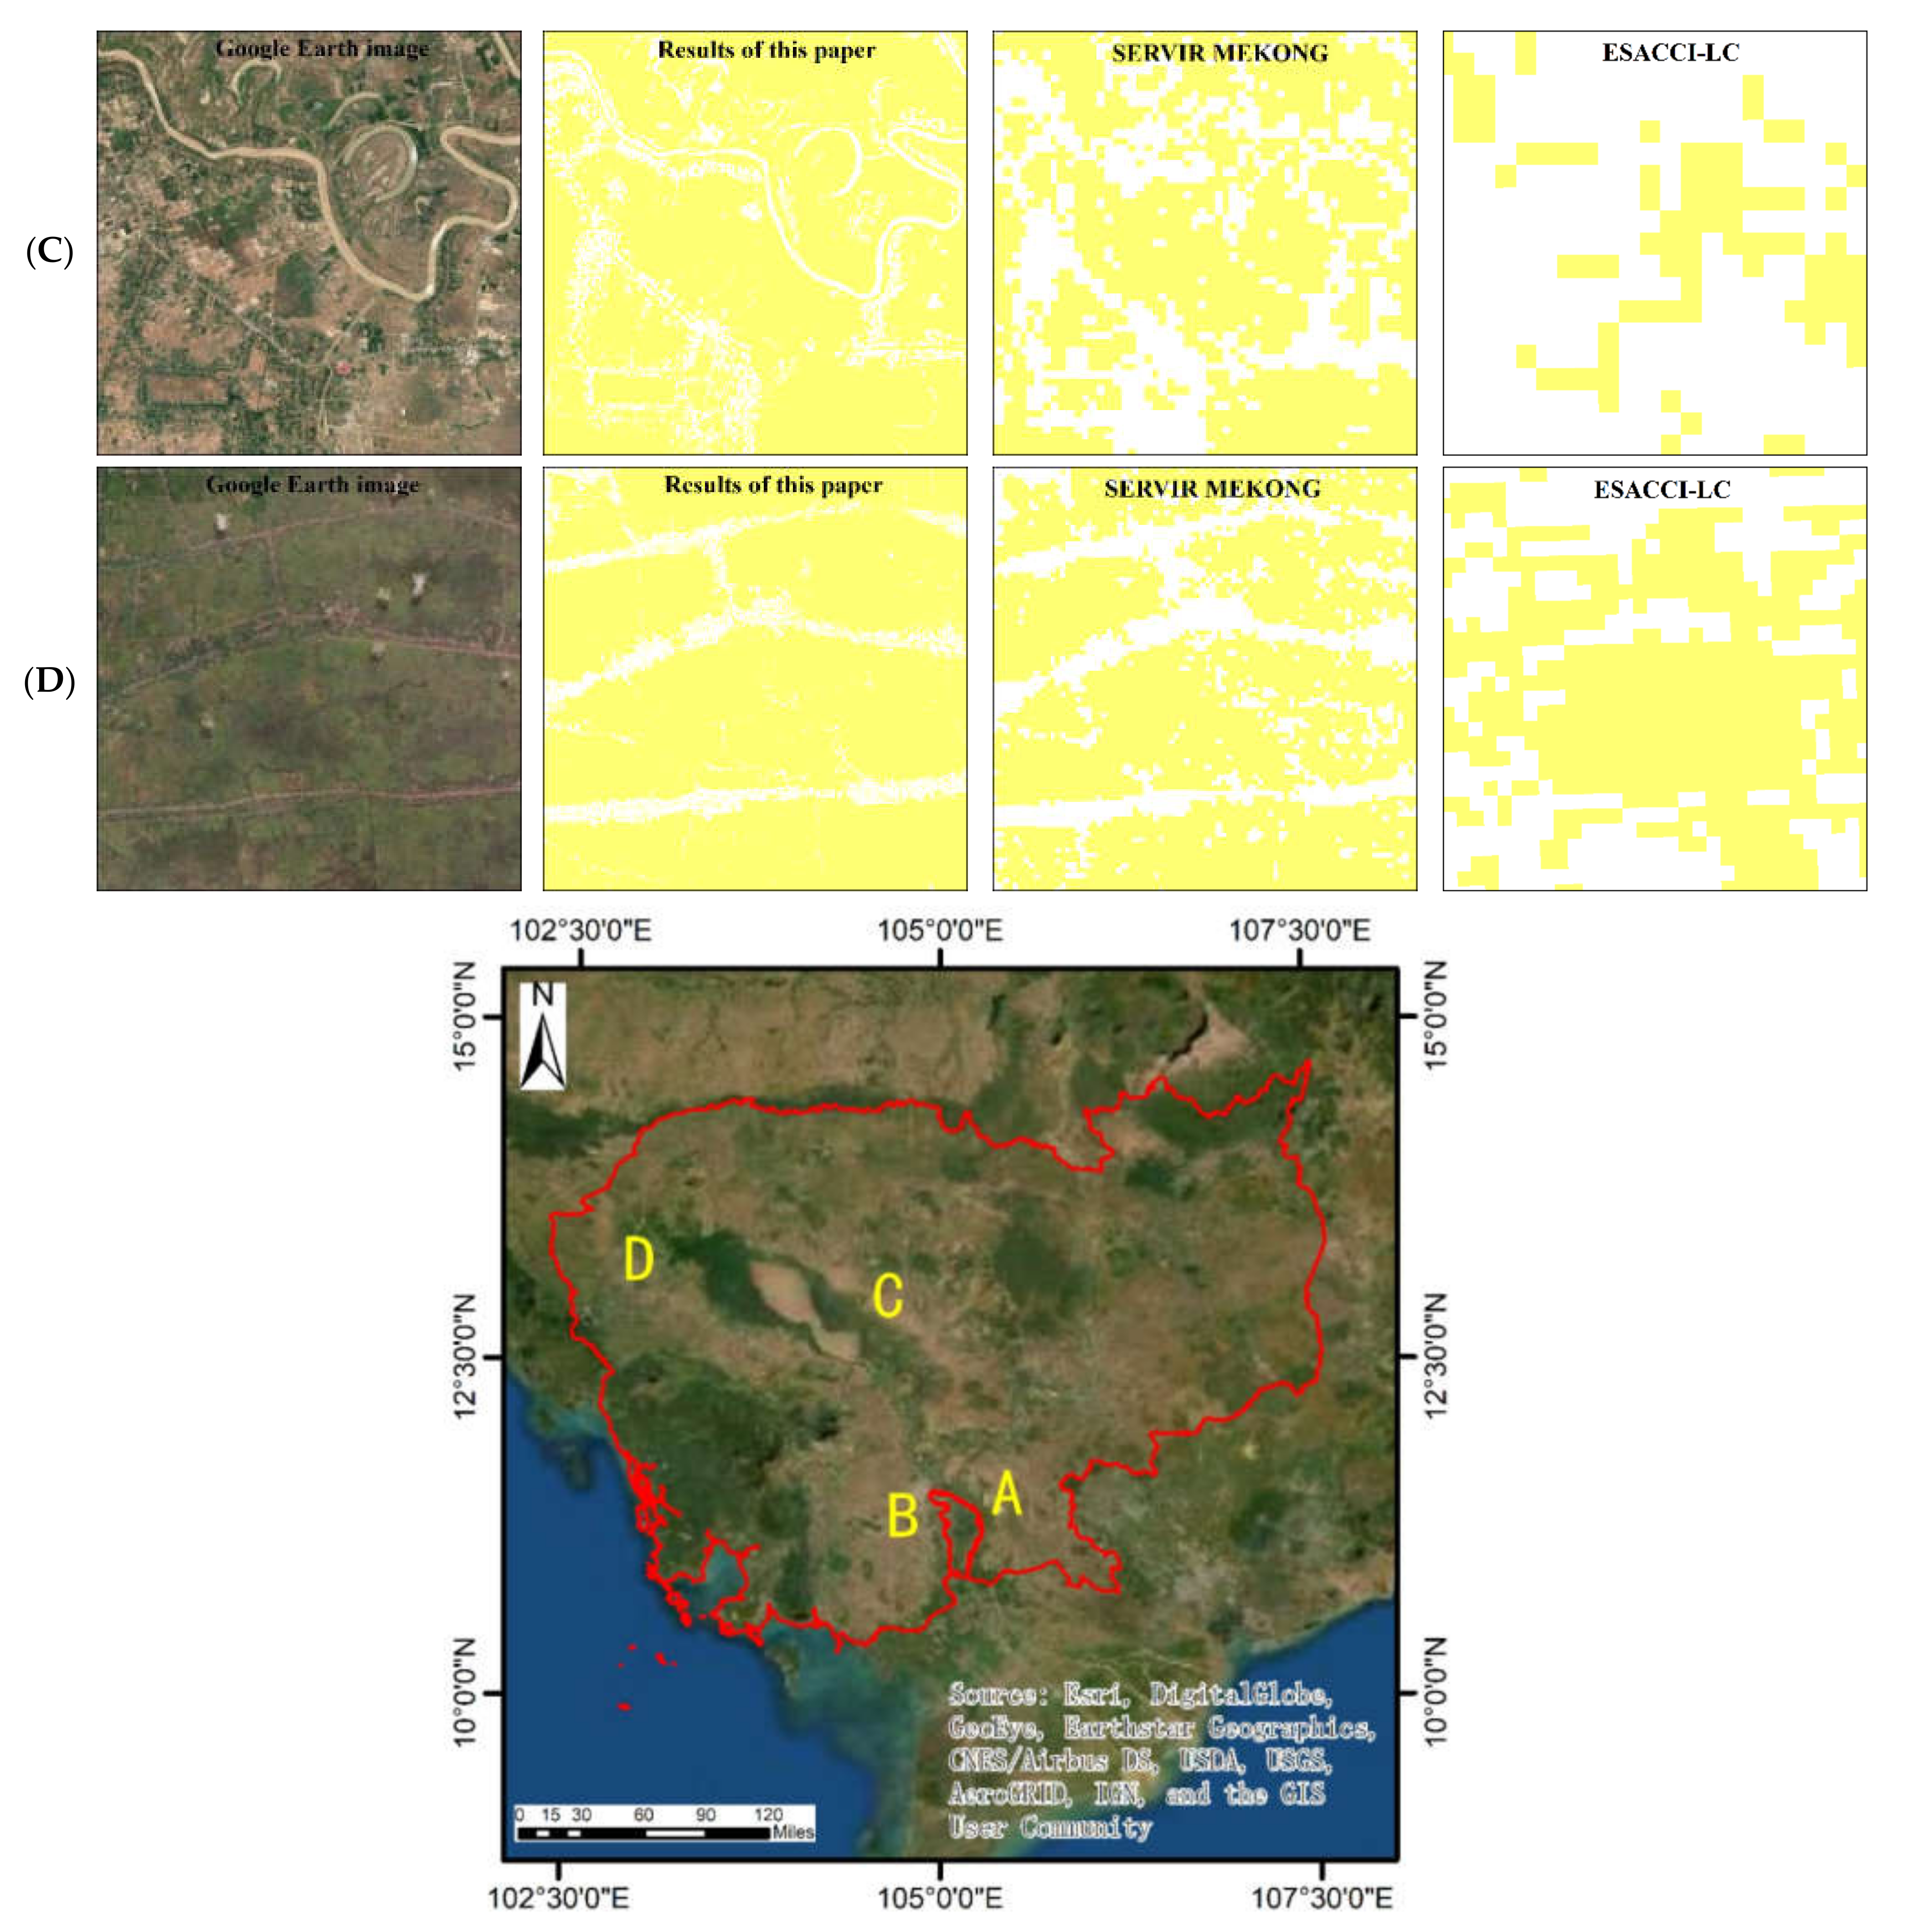
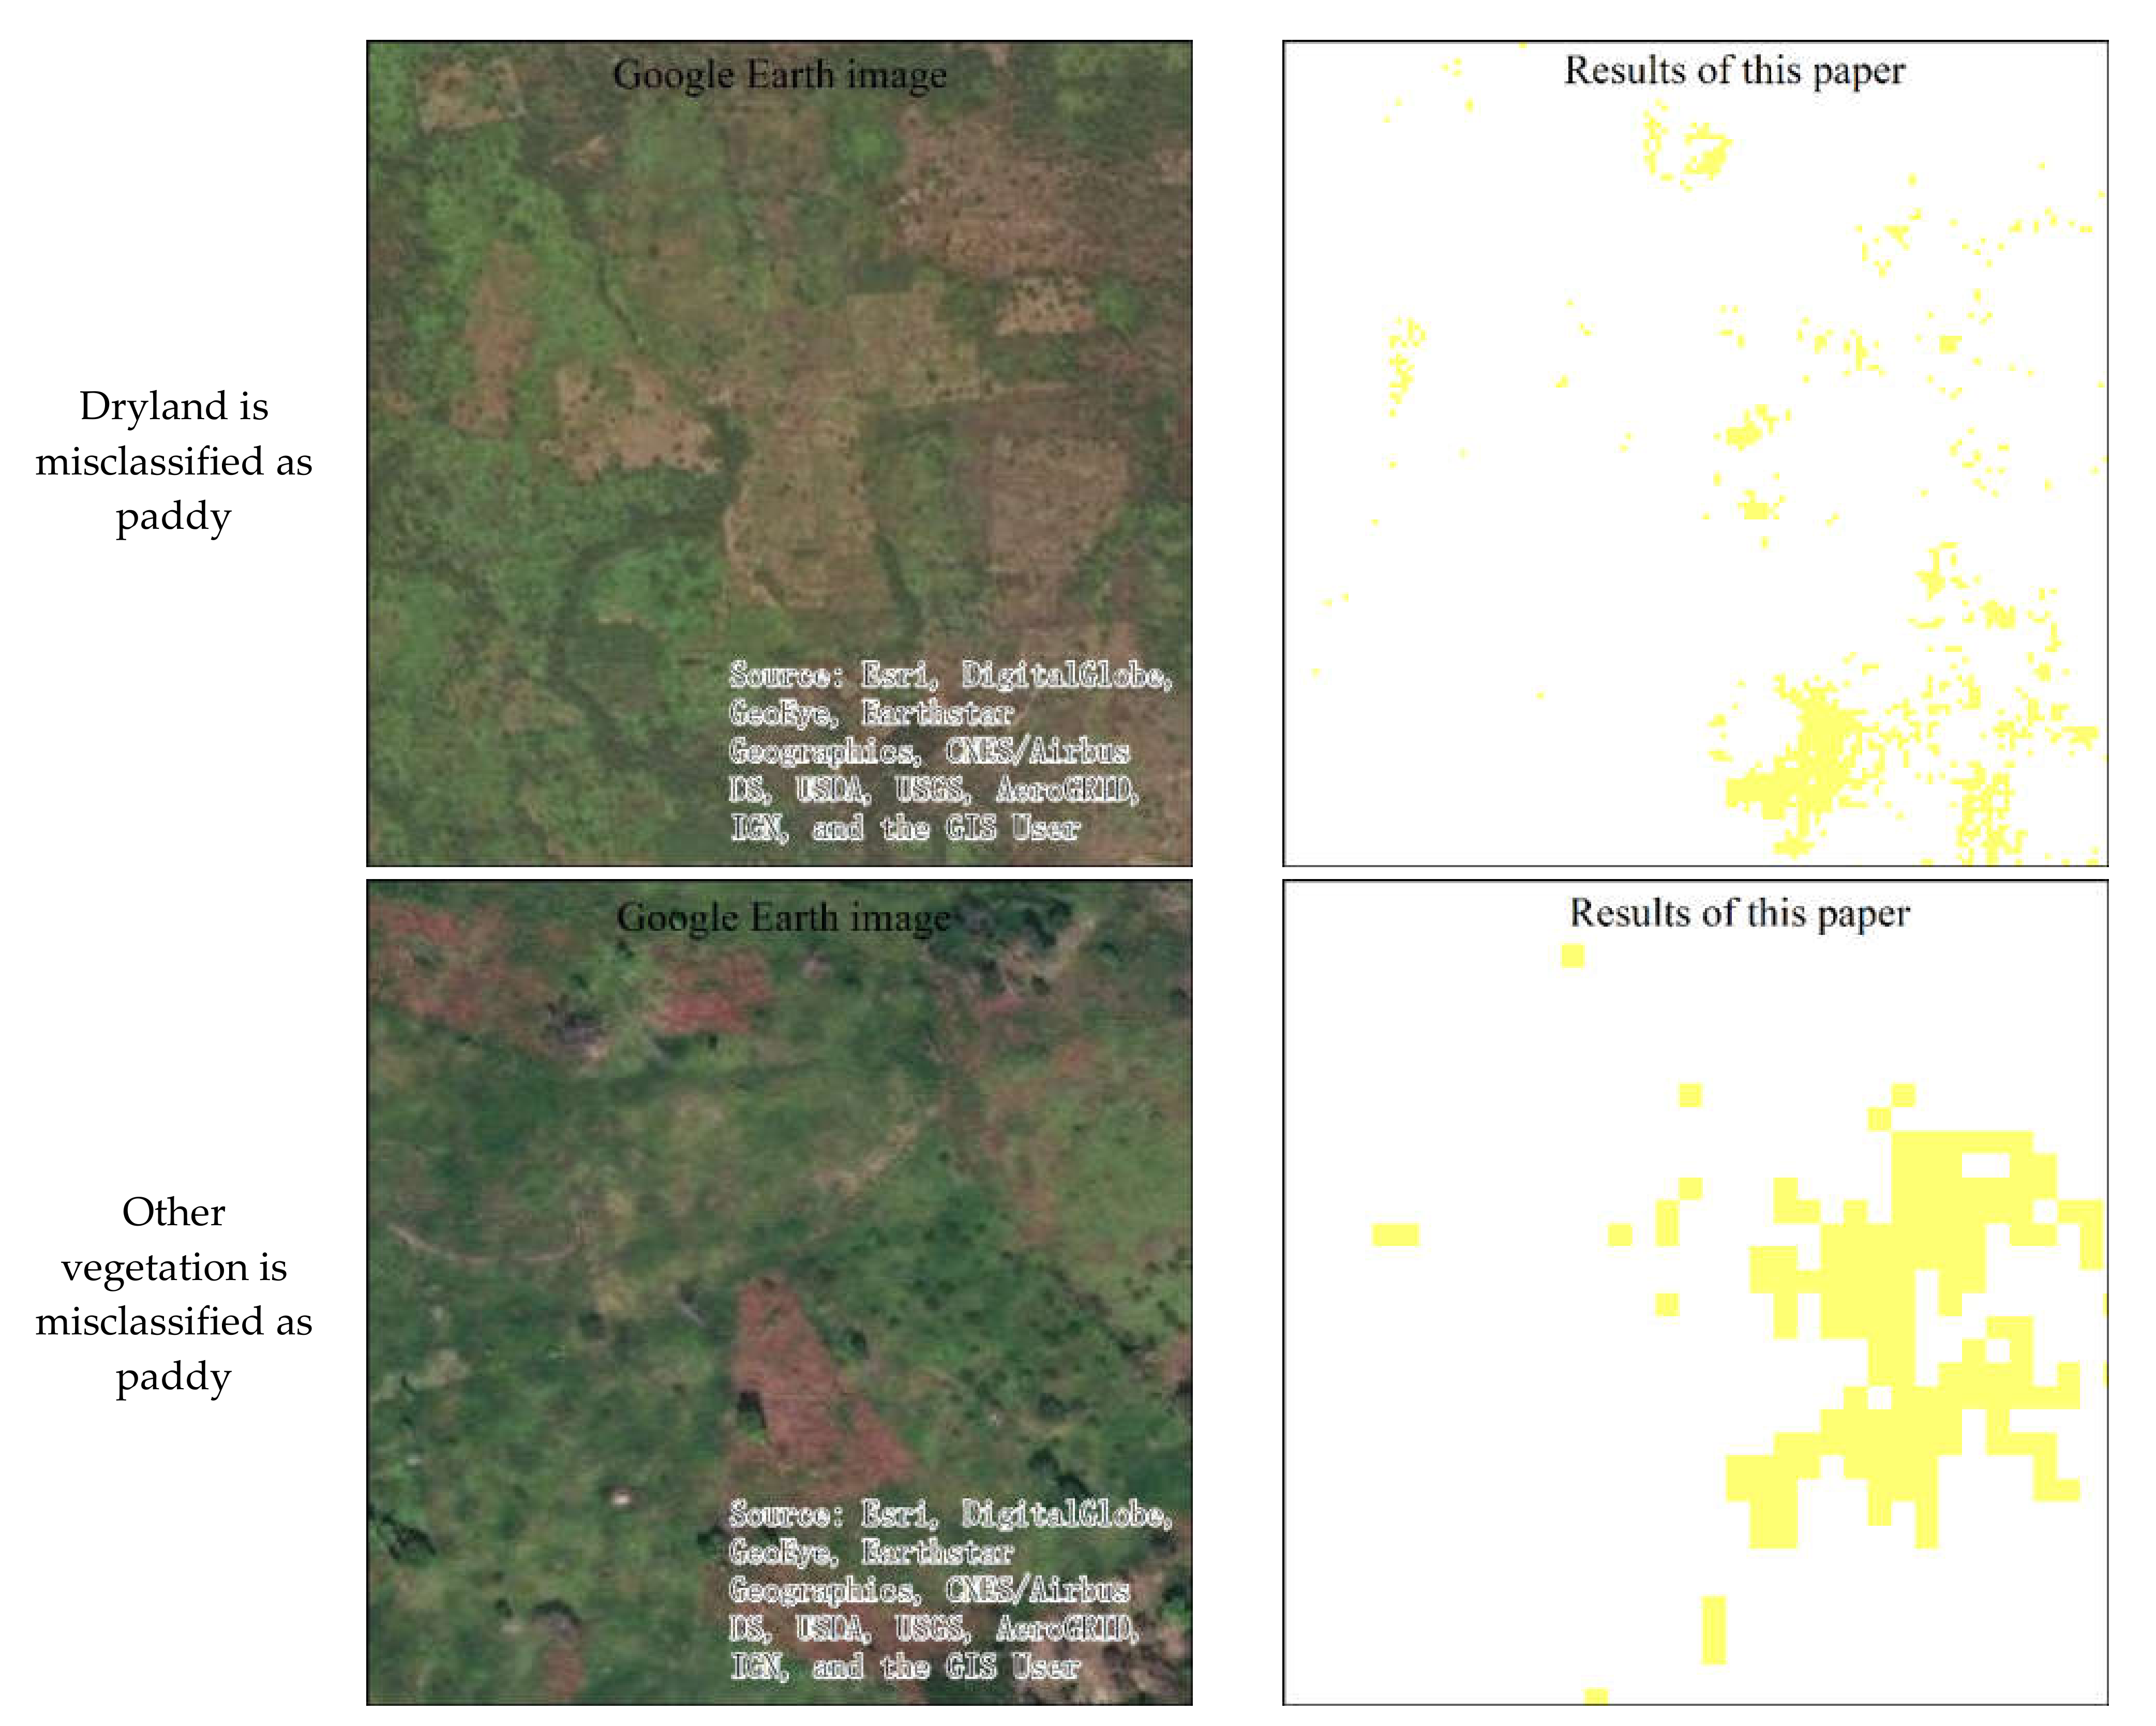
3.1.2. Comparative Analysis with Google Earth Images

The four different land cover types were selected based on high-resolution Google Earth images to compare the extraction results with the existing paddy products. As can be seen from Figure 12, the paddy planting areas extracted in this study are superior to the existing paddy products for all four types of surface cover. In regions A and B, there are obvious omissions in the paddy areas derived from the SERVIR MEKONG product, resulting in low estimates. The paddy extraction results of the ESACCI-LC products not only have serious omissions, but they also failed to distinguish paddy areas from water, with obvious characteristics such as spectrum and texture. In regions C and D, the results obtained using the proposed method are also better than the results of the other two products in terms of depicting linear features such as roads and rivers.

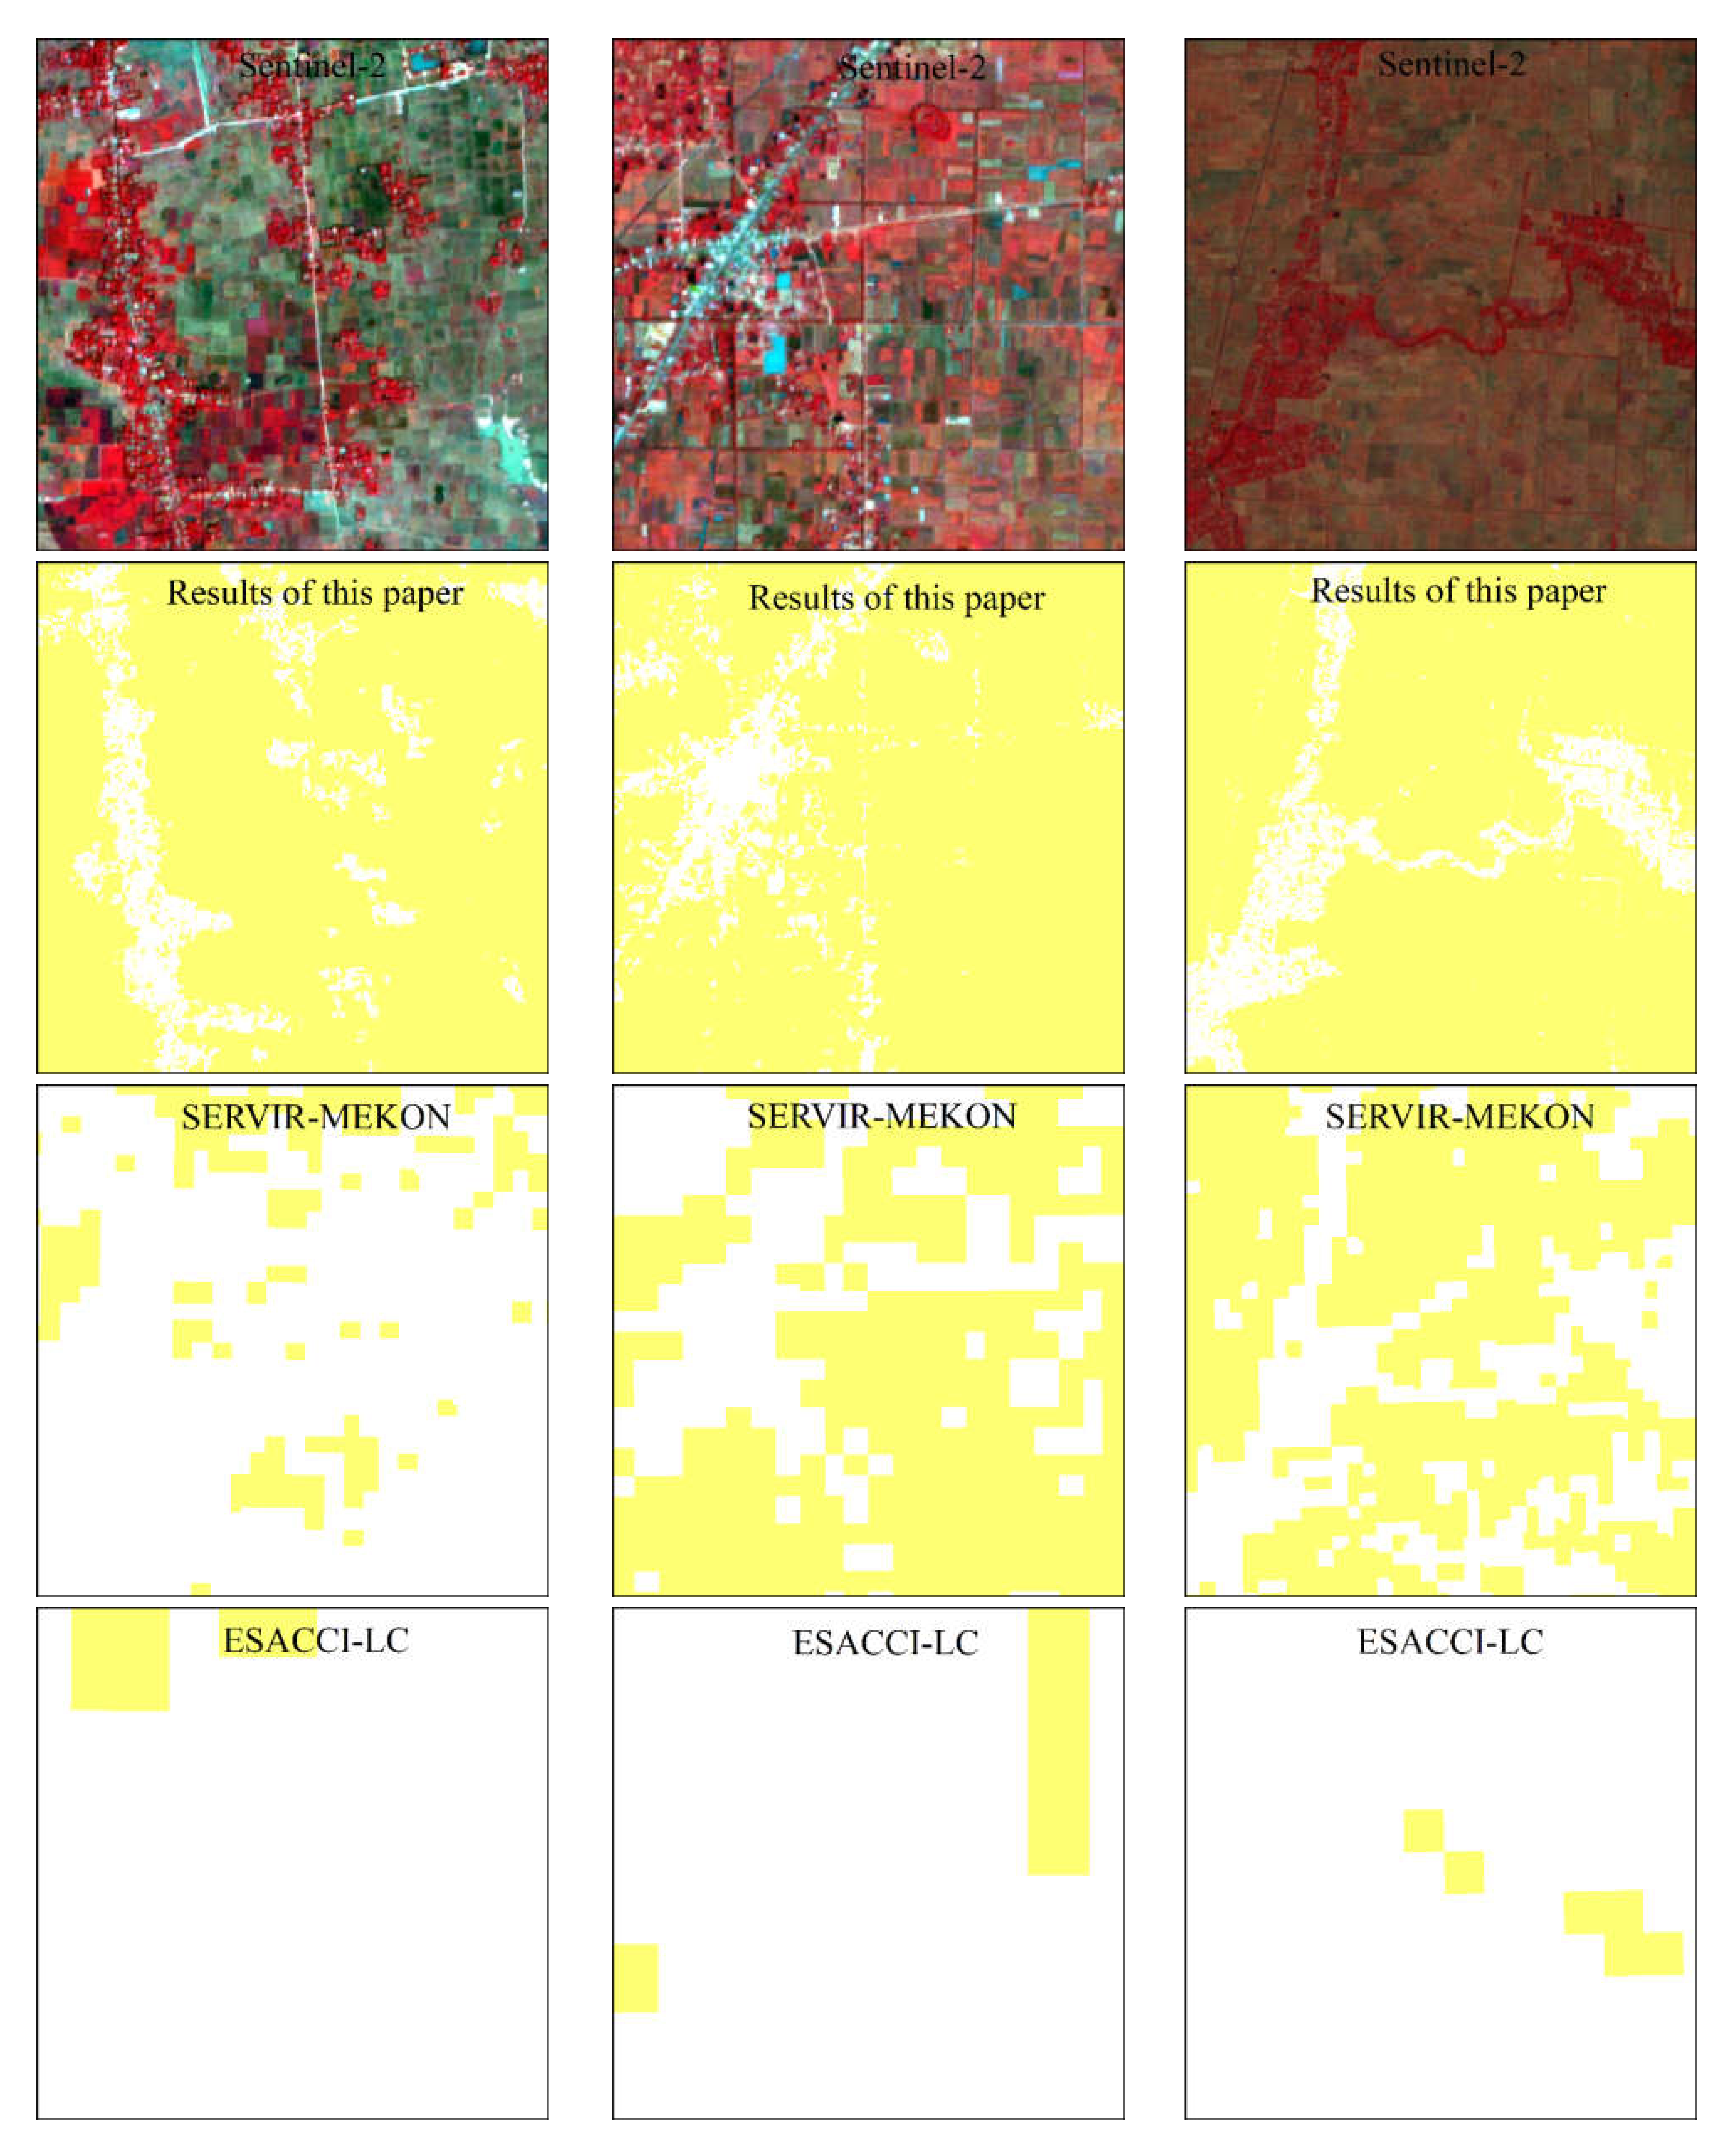
3.1.3. Comparative Analysis with Sentinel-2 Images

Figure 13 shows that the spatial representation of the paddy planting areas extracted in this study is superior to those of the other two products, and its ability to depict linear features such as roads and rivers is also slightly better. The SERVIR MEKONG product depicts the large contours and boundaries of the paddy planting areas, but there is a certain degree of leakage. For the ESACCI-LC product, the spatial comparison results are consistent with the aforementioned high-resolution Google Earth images. For all four types of surface cover, the paddy planting area extracted using this product has a serious omission phenomenon. Therefore, it is necessary to be cautious when using these data for relevant research.

3.2. Quantitative Evaluation

The results of the paddy extraction were evaluated using data for 792 verification points collected in 2015. Table 4 shows that the OA and kappa values of the paddy areas extracted in this study are 89.90% and 0.792, respectively. According to the corresponding relationship between the kappa value and the classification accuracy [51], the method of extracting the paddy planting areas developed in this study is very good and can meet the requirements of paddy correlation analysis. By comparing the evaluation results with the SERVIR MEKONG and ESACCI-LC products acquired in the same period (Figure 14), it was found that the accuracy of the paddy extraction obtained using the proposed method is significantly superior to those of the other two products, especially the ESACCI-LC. The PA of the SERVIR MEKONG product is lower than the UA, indicating that the product has more omissions than misclassifications, and there is a certain degree of underestimation. The UA of the ESACCI-LC product is significantly higher than the PA, indicating that the product has serious omissions and serious underestimation.

4. Discussion

4.1. Potential Sources of Uncertainty

The Sentinel satellites, as data sources with finer temporal and spatial scales, have been used for paddy extraction and land cover monitoring research [16,18]. Previous studies have shown that the combination of optical and SAR data can improve the extraction accuracy of land cover information in areas with strong heterogeneity [52,53]. In this study, it was found that the overall accuracy of the paddy planting area is higher than those of the SERVIR MEKONG and ESACCI-LC products, and the results are better for different paddy landscape patterns. The results demonstrate that the paddy planting area extraction method that uses multi-source information developed in this study can not only reduce the time-consuming and labor-consuming training sample acquisition but can also rapidly obtain high-precision paddy planting area results using the GEE platform, so it has good applicability. Therefore, the proposed paddy planting area extraction method based on Sentinel data provides a new strategy for accurately obtaining high resolution paddy planting information.
The paddy planting areas extracted in this study were overestimated. The Sentinel SAR data have different radar backscattering coefficients for the different surface cover types and are sensitive to the geometric and dielectric properties [54,55]. However, some dryland crops and other vegetation types were misclassified as paddy (Figure 15). The temporal radar backscattering coefficient of paddy is largely a function of the paddy growth stage, and the high temporal frequency of SAR observations can reveal more detailed growth profiles, which improves the ability to identify paddy from other land cover types [56]. However, different planting densities and planting dates for paddy have important effects on the radar backscattering coefficient. In addition, the classification method developed in this study also relies on the three key growth stages of paddy (transplanting stage, heading stage and mature stage), which may increase the error of the extraction results.

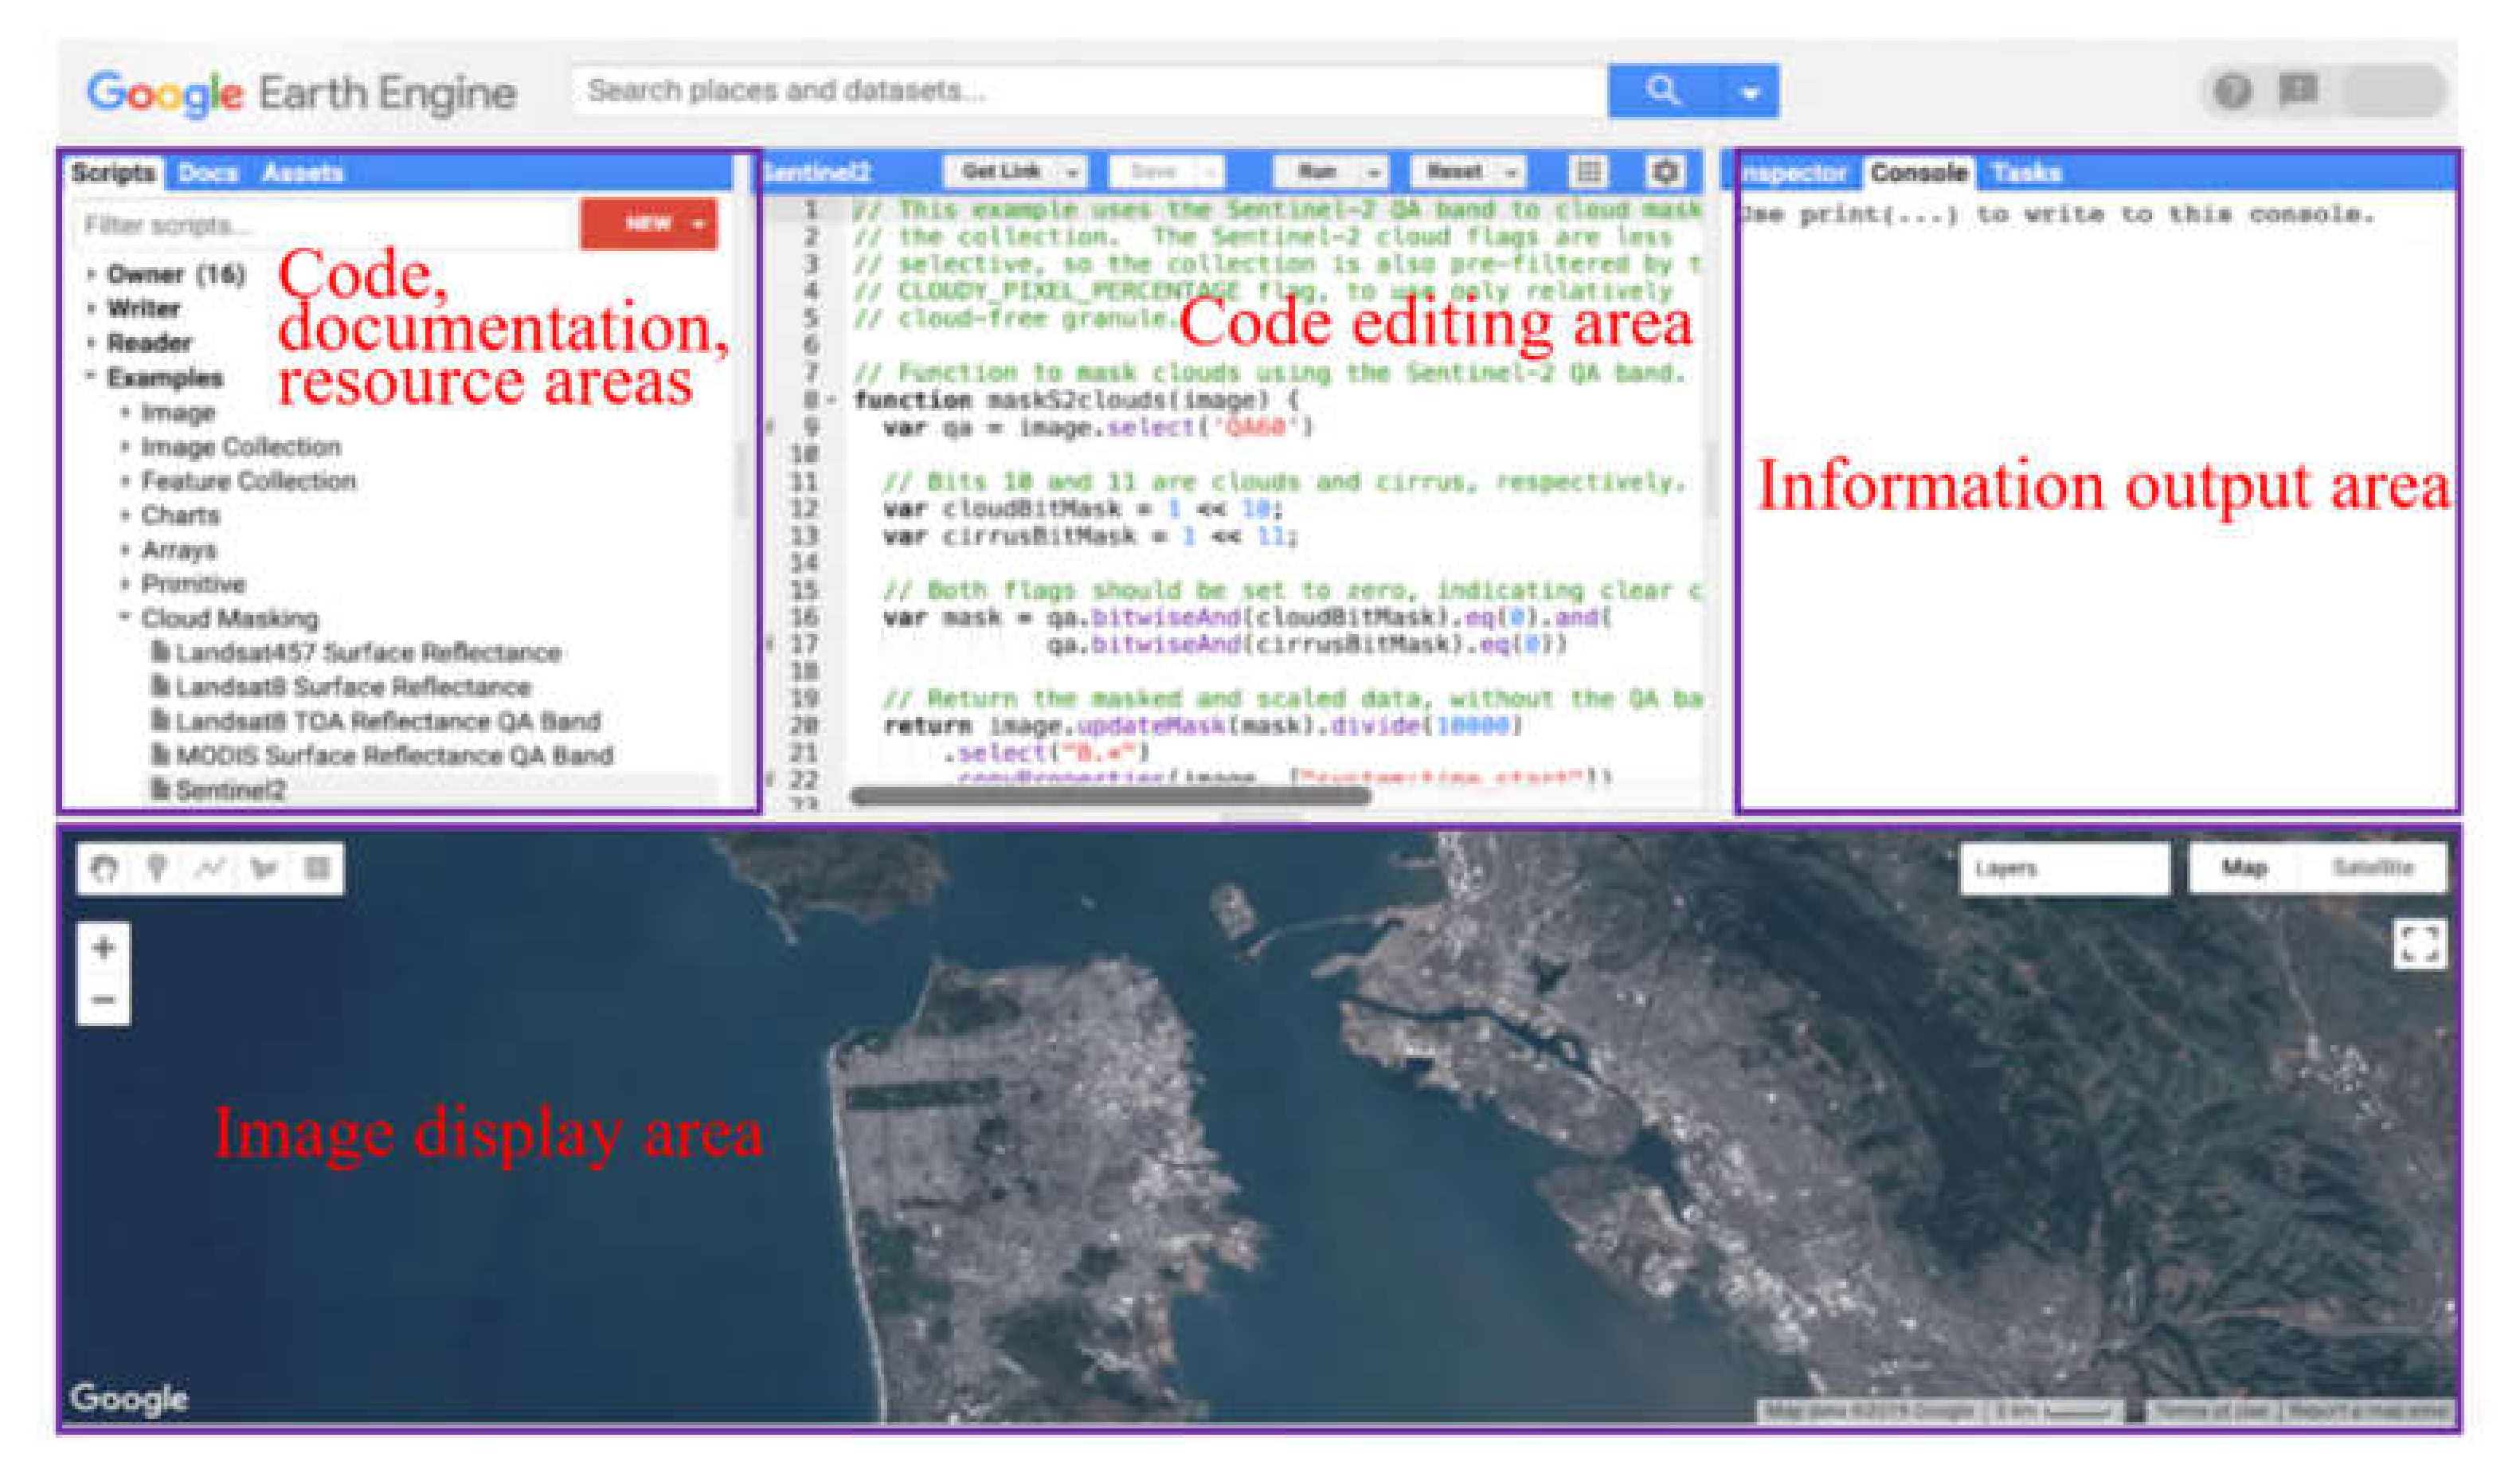
4.2. Advantages of the GEE

The results of this study demonstrate the feasibility and reliability of using the GEE platform and Sentinel image data to obtain high-resolution paddy data products for Cambodia. The GEE platform has a very large database, huge computing power, and many algorithms, and it is helpful in processing a large number of high-resolution images for the creation of crop maps [57] and for the timely acquisition of different levels of processed image products for direct use. This study reveals the incentive effect of land cover mapping on cloud computing technology in emerging platforms such as GEE.

4.3. Suggestions for Future Work on Paddy Mapping

The Sentinel series of satellites provide open data with hyperspectral, high spatial, and temporal resolutions, which is important for tropical and subtropical countries with severe cloud cover. The data fusion techniques and methods are being further developed and applied to land cover mapping [58]. In addition, phenology-based approaches and available Landsat images are increasingly being used to study land cover and land-use changes. For example, Zhong et al. [59] used phenological indicators to map soybean and maize crops. Dong et al. [60] extracted the area of a rubber plantation using Landsat and SAR images and a phenology method. Methods based on phenology have been proven to be effective in mapping paddy using time-series MODIS data [61]. However, this method faces more challenges when applied to tropical areas (such as Southeast Asia) with more clouds [62], because paddy planting in these regions is fragmented and the paddy planting intensity is high [63]. However, the combined application of Landsat and Sentinel-2 data provides an opportunity to produce high-resolution paddy maps based on phenological methods.

5. Conclusions

Based on the GEE platform, this paper utilized multi-source information, including multi-sensor remote sensing images (Sentinel-1 and Sentinel-2), multi-source remote sensing land cover products (GFSAD30SEACE, GLC_FCS30-2015, FROM_GLC2015, SERVIR MEKONG and GUF), paddy phenology information and topographic factors (DEM and slope) to acquire paddy data products in Cambodia. The results show that the overall accuracy of the paddy extraction is 89.90%, and the spatial expression ability for paddy planting areas is good under different landscape patterns, indicating the feasibility of the proposed method. The results of the qualitative and quantitative analysis demonstrate that the paddy extraction results obtained using the proposed method are superior to those of the SERVIR MEKONG and ESACCI-LC products. This shows that the method of using multi-source information for cooperative extraction of paddy planting areas proposed in this paper has great applicability and superiority.

Author Contributions

Conceptualization, Z.W., X.Y. and J.K.; methodology, Z.W. and J.K.; software, J.K. and J.W.; validation, J.K.; formal analysis, J.K. and Z.W.; investigation, Z.W. and J.K.; resources, X.Y.; data curation, J.K.; writing—original draft preparation, J.K.; writing—review and editing, J.K., C.H., Z.W. and X.Y.; visualization, J.K.; supervision, X.Y.; project administration, X.Y.; funding acquisition, X.Y. and Z.W. All authors have read and agreed to the published version of the manuscript.

Funding

This study was supported by the CAS Earth Big Data Science Project, Grant No. XDA19060303; the National Science Foundation of China, Grant No. 41901354, and the Innovation Project of LREIS, Grant No. O88RAA01YA.

Institutional Review Board Statement

Not applicable.

Informed Consent Statement

Not applicable.

Data Availability Statement

All land cover data used in the study are available for free download through (http://data.casearth.cn/sdo/detail/5d904b7a0887164a5c7fbfa0) (accessed on 28 March 2022), (http://data.ess.tsinghua.edu.cn/) (accessed on 28 March 2022), (https://rlcms-servir.adpc.net/en/landcover/) (accessed on 28 March 2022), (https://lpdaac.usgs.gov/products/gfsad30seacev001/) (accessed on 28 March 2022) and (https://www.dlr.de/eoc/en/desktopdefault.aspx/tabid-11725/20508_read-47944/) (accessed on 28 March 2022).

Conflicts of Interest

The authors declare that there are no conflict of interest. The authors also declare that this paper has not been published previously, that it is not under consideration for publication elsewhere, and that its publication has been approved by all of the authors and has been tacitly or explicitly approved by the responsible authorities where the work was carried out.

References

  1. Yao, F.; Xu, Y.; Lin, E.; Yokozawa, M.; Zhang, J. Assessing the impacts of climate change on rice yields in the main rice areas of China. Clim. Chang. 2007, 80, 395–409. [Google Scholar] [CrossRef]
  2. Wang, Z.; Yang, X.; Zhou, C. Geographic knowledge graph for remote sensing big data. J. Geo-Inf. Sci. 2021, 23, 13. [Google Scholar] [CrossRef]
  3. Zhu, Z.; Woodcock, C.E. Object-based cloud and cloud shadow detection in landsat imagery. Remote Sens. Environ. 2012, 118, 83–94. [Google Scholar] [CrossRef]
  4. Huang, X.; Wang, J.; Shang, J.; Liao, C.; Liu, J. Application of polarization signature to land cover scattering mechanism analysis and classification using multi-temporal C-band polarimetric RADARSAT-2 imagery. Remote Sens. Environ. 2017, 193, 11–28. [Google Scholar] [CrossRef]
  5. Jiao, X.; Kovacs, J.M.; Shang, J.; McNairn, H.; Walters, D.; Ma, B.; Geng, X. Object-oriented crop mapping and monitoring using multi-temporal polarimetric RADARSAT-2 data. ISPRS J. Photogramm. Remote Sens. 2014, 96, 38–46. [Google Scholar] [CrossRef]
  6. Wei, S.; Zhang, H.; Wang, C.; Wang, Y.; Xu, L. Multi-temporal SAR data large-scale crop mapping based on U-net model. Remote Sens. 2019, 11, 68. [Google Scholar] [CrossRef] [Green Version]
  7. Carranza, C.; Benninga, H.J.; Velde, R.; Ploeg, M. Monitoring agricultural field trafficability using sentinel-1. Agric. Water Manag. 2019, 224, 105698. [Google Scholar] [CrossRef]
  8. Phan, H.; Toan, T.L.; Bouvet, A.; Nguyen, L.H.; Duy, T.P.; Zribi, M. Mapping of rice varieties and sowing date using X-band SAR data. Sensors 2018, 18, 316. [Google Scholar] [CrossRef] [Green Version]
  9. Mosleh, M.K.; Hassan, Q.K.; Chowdhury, E.H. Application of remote sensors in mapping rice area and forecasting its production: A review. Sensors 2015, 15, 769–791. [Google Scholar] [CrossRef] [Green Version]
  10. Yang, H.; Pan, B.; Wu, W.; Tai, J. Field-based rice classification in Wuhua county through integration of multi-temporal sentinel-1A and landsat-8 OLI data. Int. J. Appl. Earth Obs. Geoinf. 2018, 69, 226–236. [Google Scholar] [CrossRef]
  11. Dong, J.; Xiao, X.; Kou, W.; Qin, Y.; Zhang, G.; Li, L.; Jin, C.; Zhou, Y.; Wang, J.; Biradar, C. Tracking the dynamics of paddy rice planting area in 1986–2010 through time series landsat images and phenology-based algorithms. Remote Sens. Environ. 2015, 160, 99–113. [Google Scholar] [CrossRef]
  12. Chen, C.F.; Chen, C.R.; Son, N.-T.; Chang, L.Y. Delineating rice cropping activities from MODIS data using wavelet transform and artificial neural networks in the Lower Mekong countries. Agric. Ecosyst. Environ. 2012, 162, 127–137. [Google Scholar] [CrossRef]
  13. Park, S.; Im, J.; Park, S.; Yoo, C.; Han, H.; Rhee, J. Classification and mapping of paddy rice by combining landsat and SAR time series data. Remote Sens. 2018, 10, 447. [Google Scholar] [CrossRef] [Green Version]
  14. Ding, M.; Guan, Q.; Li, L.; Zhang, H.; Liu, C.; Zhang, L. Phenology-based rice paddy mapping using multi-source satellite imagery and a fusion algorithm applied to the Poyang Lake plain, southern China. Remote Sens. 2020, 12, 1022. [Google Scholar] [CrossRef] [Green Version]
  15. Singha, M.; Dong, J.; Zhang, G.; Xiao, X. High resolution paddy rice maps in cloud-prone Bangladesh and Northeast India using sentinel-1 data. Sci. Data 2019, 6, 26. [Google Scholar] [CrossRef]
  16. Mansaray, L.R.; Huang, W.; Zhang, D.; Huang, J.; Li, J. Mapping rice fields in urban Shanghai, southeast China, using sentinel-1A and landsat 8 datasets. Remote Sens. 2017, 9, 257. [Google Scholar] [CrossRef] [Green Version]
  17. Lach, S.; Payanun, K.; Intaratat, K.; Sombunsooke, B. Roles of agricultural extension policymakers in agricultural development of Cambodia. Kasetsart J. Soc. Sci. 2002, 23, 167–184. [Google Scholar]
  18. Nguyen, D.B.; Gruber, A.; Wagner, W. Mapping rice extent and cropping scheme in the Mekong Delta using sentinel-1A data. Remote Sens. Lett. 2016, 7, 1209–1218. [Google Scholar] [CrossRef]
  19. Torres, R.; Snoeij, P.; Geudtner, D.; Bibby, D.; Davidson, M.; Attema, E.; Potin, P.; Rommen, B.; Floury, N.; Brown, M. GMES sentinel-1 mission. Remote Sens. Environ. 2012, 120, 9–24. [Google Scholar] [CrossRef]
  20. Onojeghuo, A.O.; Blackburn, G.A.; Wang, Q.; Atkinson, P.M.; Kindred, D.R.; Miao, Y. Mapping paddy rice fields by applying machine learning algorithms to multi-temporal sentinel-1A and landsat data. Int. J. Remote Sens. 2018, 39, 1042–1067. [Google Scholar] [CrossRef] [Green Version]
  21. Zhang, X.; Liu, L.; Chen, X.; Xie, S.; Gao, Y. Fine land-cover mapping in China using landsat datacube and an operational SPECLib-based approach. Remote Sens. 2019, 11, 1056. [Google Scholar] [CrossRef] [Green Version]
  22. Peng, G.; Jie, W.; Le, Y.; Zhao, Y.; Zhao, Y. Finer resolution observation and monitoring of global land cover: First mapping results with landsat TM and ETM+ data. Int. J. Remote Sens. 2013, 34, 2607–2654. [Google Scholar]
  23. Gong, P.; Liu, H.; Zhang, M.; Li, C.; Wang, J.; Huang, H.; Clinton, N.; Ji, L.; Li, W.; Bai, Y. Stable classification with limited sample: Transferring a 30-m resolution sample set collected in 2015 to mapping 10-m resolution global land cover in 2017. Sci. Bull. 2019, 64, 370–373. [Google Scholar] [CrossRef] [Green Version]
  24. Potapov, P.; Tyukavina, A.; Turubanova, S.; Talero, Y.; Hernandez-Serna, A.; Hansen, M.; Saah, D.; Tenneson, K.; Poortinga, A.; Aekakkararungroj, A. Annual continuous fields of woody vegetation structure in the Lower Mekong region from 2000–2017 landsat time-series. Remote Sens. Environ. 2019, 232, 111278. [Google Scholar] [CrossRef]
  25. Saah, D.; Tenneson, K.; Poortinga, A.; Nguyen, Q.; Chishtie, F.; San Aung, K.; Markert, K.N.; Clinton, N.; Anderson, E.R.; Cutter, P. Primitives as building blocks for constructing land cover maps. Int. J. Appl. Earth Obs. Geoinf. 2020, 85, 101979. [Google Scholar] [CrossRef]
  26. Oliphant, A.J.; Thenkabail, P.S.; Teluguntla, P.; Xiong, J.; Yadav, K. Mapping cropland extent of Southeast and Northeast Asia using multi-year time-series landsat 30-m data using a random forest classifier on the Google Earth Engine Cloud. Int. J. Appl. Earth Obs. Geoinf. 2019, 81, 110–124. [Google Scholar] [CrossRef]
  27. Esch, T.; Heldens, W.; Hirner, A.; Keil, M.; Marconcini, M.; Roth, A.; Zeidler, J.; Dech, S.; Strano, E. Breaking new ground in mapping human settlements from space—The global urban footprint. ISPRS J. Photogramm. Remote Sens. 2017, 134, 30–42. [Google Scholar] [CrossRef] [Green Version]
  28. Esch, T.; Schenk, A.; Ullmann, T.; Thiel, M.; Dech, S. Characterization of land cover types in TerraSAR-X images by combined analysis of speckle statistics and intensity information. IEEE Trans. Geosci. Remote Sens. 2011, 49, 1911–1925. [Google Scholar] [CrossRef]
  29. Zhang, J.; Qian, Z.; Xu, W.; Zhang, H.; Wang, Z. Ecosystem pattern variation from 2000 to 2010 in national nature reserves of China. Acta Ecol. Sin. 2017, 37, 8067–8076. [Google Scholar]
  30. Laborte, A.G.; Gutierrez, M.A.; Balanza, J.G.; Saito, K.; Zwart, S.J.; Boschetti, M.; Murty, M.V.R.; Villano, L.; Aunario, J.K.; Reinke, R.; et al. RiceAtlas, a spatial database of global rice calendars and production. Sci. Data 2017, 4, 170074. [Google Scholar] [CrossRef]
  31. Buckley, S.; Agram, P.; Belz, J.; Crippen, E.; Gurrola, E.; Hensley, S.; Kobrick, M.; Lavalle, M.; Martin, J.; Neumann, M.; et al. NASADEM User Guide; NASA JPL: Pasadena, CA, USA, 2020. [Google Scholar]
  32. Yang, Z.; Shao, Y.; Li, K.; Liu, Q.; Liu, L.; Brisco, B. An improved scheme for rice phenology estimation based on time-series multispectral HJ-1A/B and polarimetric RADARSAT-2 data. Remote Sens. Environ. 2017, 195, 184–201. [Google Scholar] [CrossRef]
  33. Lopezsanchez, J.M.; Cloude, S.R.; Ballesterberman, J.D. Rice phenology monitoring by means of SAR polarimetry at X-band. IEEE Trans. Geosci. Remote Sens. 2012, 50, 2695–2709. [Google Scholar] [CrossRef]
  34. Inoue, Y.; Kurosu, T.; Maeno, H.; Uratsuka, S.; Kozu, T.; Dabrowska-Zielinska, K.; Qi, J. Season-long daily measurements of multifrequency (Ka, Ku, X, C, and L) and full-polarization backscatter signatures over paddy rice field and their relationship with biological variables. Remote Sens. Environ. 2002, 81, 194–204. [Google Scholar] [CrossRef]
  35. Wanben, W.U.; Wang, W.; Meadows, M.E.; Yao, X.; Peng, W. Cloud-based typhoon-derived paddy rice flooding and lodging detection using multi-temporal sentinel-1&2. Front. Earth Sci. 2019, 13, 682–694. [Google Scholar]
  36. Huete, A.; Liu, H.Q.; Batchily, K.; van Leeuwen, W.J.D. A comparison of vegetation indices over a global set of TM images for EOS-MODIS. Remote Sens. Environ. 1997, 59, 440–451. [Google Scholar] [CrossRef]
  37. Xu, H. Modification of normalised difference water index (NDWI) to enhance open water features in remotely sensed imagery. Int. J. Remote Sens. 2006, 27, 3025–3033. [Google Scholar] [CrossRef]
  38. Zha, Y.; Gao, J.; Ni, S. Use of normalized difference built-up index in automatically mapping urban areas from TM imagery. Int. J. Remote Sens. 2003, 24, 583–594. [Google Scholar] [CrossRef]
  39. Haralick, R.M.; Shanmugam, K.; Dinstein, I. Textural features for image classification. IEEE Trans. Syst. Man Cybern. 1973, 6, 610–621. [Google Scholar] [CrossRef] [Green Version]
  40. Puissant, A.; Hirsch, J.; Weber, C. The utility of texture analysis to improve per-pixel classification for high to very high spatial resolution imagery. Int. J. Remote Sens. 2005, 26, 733–745. [Google Scholar] [CrossRef]
  41. Regniers, O.; Bombrun, L.; Lafon, V.; Germain, C. Supervised classification of very high resolution optical images using wavelet-based textural features. IEEE Trans. Geosci. Remote Sens. 2016, 54, 3722–3735. [Google Scholar] [CrossRef] [Green Version]
  42. Maillard, P. Comparing texture analysis methods through classification. Photogramm. Eng. Remote Sens. 2003, 69, 357–367. [Google Scholar] [CrossRef] [Green Version]
  43. Hayes, M.M.; Miller, S.N.; Murphy, M.A. High-resolution landcover classification using random forest. Remote Sens. Lett. 2014, 5, 112–121. [Google Scholar] [CrossRef]
  44. Isaac, E.R.H.P.; Easwarakumar, K.S.; Isaac, J. Urban landcover classification from multispectral image data using optimized AdaBoosted random forests. Remote Sens. Lett. 2017, 8, 350–359. [Google Scholar] [CrossRef]
  45. Smith, A. Image segmentation scale parameter optimization and land cover classification using the random forest algorithm. J. Spat. Sci. 2010, 55, 69–79. [Google Scholar] [CrossRef]
  46. Shi, D.; Yang, X. A relative evaluation of random forests for land cover mapping in an urban area. Photogramm. Eng. Remote Sens. 2017, 83, 541–552. [Google Scholar] [CrossRef]
  47. Breiman, L. Random forests. Mach. Learn. 2001, 45, 5–32. [Google Scholar] [CrossRef] [Green Version]
  48. Kang, J.; Sui, L.; Yang, X.; Wang, Z.; Huang, C.; Wang, J. Spatial pattern consistency among different remote-sensing land cover datasets: A case study in northern Laos. Int. J. Geo-Inf. 2019, 8, 201. [Google Scholar] [CrossRef] [Green Version]
  49. Kang, J.; Wang, Z.; Sui, L.; Yang, X.; Ma, Y.; Wang, J. Consistency analysis of remote sensing land cover products in the tropical rainforest climate region: A case study of Indonesia. Remote Sens. 2020, 12, 1410. [Google Scholar] [CrossRef]
  50. Pettinari, M.L.; Chuvieco, E.; Alonso-Canas, I.; Storm, T.; Parellada, M. ESA CCI ECV Fire Disturbance: Product User Guide; Version 2.1; University of Alcala: Alcalá de Henares, Spain, 2016. [Google Scholar]
  51. Zhu, S. Remote Sensing Image Processing and Application; Science Press: Beijing, China, 2006. [Google Scholar]
  52. Veloso, A.; Mermoz, S.; Bouvet, A.; le Toan, T.; Planells, M.; Dejoux, J.-F.; Ceschia, E. Understanding the temporal behavior of crops using sentinel-1 and sentinel-2-like data for agricultural applications. Remote Sens. Environ. 2017, 199, 415–426. [Google Scholar] [CrossRef]
  53. Whyte, A.; Ferentinos, K.P.; Petropoulos, G.P. A new synergistic approach for monitoring wetlands using sentinels-1 and 2 data with object-based machine learning algorithms. Environ. Model. Softw. 2018, 104, 40–54. [Google Scholar] [CrossRef] [Green Version]
  54. Corcione, V.; Nunziata, F.; Mascolo, L.; Migliaccio, M. A study of the use of COSMO-SkyMed SAR PingPong polarimetric mode for rice growth monitoring. Int. J. Remote Sens. 2016, 37, 633–647. [Google Scholar] [CrossRef]
  55. Kuenzer, C.; Knauer, K. Remote sensing of rice crop areas. Int. J. Remote Sens. 2013, 34, 2101–2139. [Google Scholar] [CrossRef]
  56. Qin, Y.; Xiao, X.; Dong, J.; Zhou, Y.; Zhu, Z.; Zhang, G.; Du, G.; Jin, C.; Kou, W.; Wang, J. Mapping paddy rice planting area in cold temperate climate region through analysis of time series landsat 8 (OLI), landsat 7 (ETM+) and MODIS imagery. ISPRS J. Photogramm. Remote Sens. 2015, 105, 220–233. [Google Scholar] [CrossRef] [PubMed] [Green Version]
  57. Dong, J.; Xiao, X.; Menarguez, M.A.; Zhang, G.; Qin, Y.; Thau, D.; Biradar, C.; Moore, B., III. Mapping paddy rice planting area in northeastern Asia with landsat 8 images, phenology-based algorithm and Google Earth Engine. Remote Sens. Environ. 2016, 185, 142–154. [Google Scholar] [CrossRef] [PubMed] [Green Version]
  58. Sun, R.; Chen, S.; Su, H.; Mi, C.; Jin, N. The effect of NDVI time series density derived from spatiotemporal fusion of multisource remote sensing data on crop classification accuracy. ISPRS Int. J. Geo-Inf. 2019, 8, 502. [Google Scholar] [CrossRef] [Green Version]
  59. Zhong, L.; Gong, P.; Biging, G.S. Efficient corn and soybean mapping with temporal extendability: A multi-year experiment using landsat imagery. Remote Sens. Environ. 2014, 140, 1–13. [Google Scholar] [CrossRef]
  60. Dong, J.; Xiao, X.; Chen, B.; Torbick, N.; Jin, C.; Zhang, G.; Biradar, C. Mapping deciduous rubber plantations through integration of PALSAR and multi-temporal landsat imagery. Remote Sens. Environ. 2013, 134, 392–402. [Google Scholar] [CrossRef]
  61. Xiao, X.; Boles, S.; Liu, J.; Zhuang, D.; Frolking, S.; Li, C.; Salas, W.; Moore, B., III. Mapping paddy rice agriculture in southern China using multi-temporal MODIS images. Remote Sens. Environ. 2005, 95, 480–492. [Google Scholar] [CrossRef]
  62. Asner, G.P. Cloud cover in landsat observations of the Brazilian Amazon. Int. J. Remote Sens. 2001, 22, 3855–3862. [Google Scholar] [CrossRef]
  63. Gibbs, H.K.; Ruesch, A.S.; Achard, F.; Clayton, M.K.; Holmgren, P.; Ramankutty, N.; Foley, J.A. Tropical forests were the primary sources of new agricultural land in the 1980s and 1990s. Proc. Natl. Acad. Sci. USA 2010, 107, 16732–16737. [Google Scholar] [CrossRef] [Green Version]
Figure 1. Geographic location of the study area.
Remotesensing 14 01823 g001
Figure 2. GEE cloud computing platform online code editor.
Remotesensing 14 01823 g002
Figure 3. Paddy planting calendar for the study area.
Remotesensing 14 01823 g003
Figure 4. The flowchart of the paddy extraction process.
Remotesensing 14 01823 g004
Figure 5. The flowchart of the process of obtaining the training samples.
Remotesensing 14 01823 g005
Figure 6. Spatial distribution of training samples.
Remotesensing 14 01823 g006
Figure 7. Phenological growth characteristics of paddy.
Remotesensing 14 01823 g007
Figure 8. Typical growth map of the three key phenological stages of paddy.
Remotesensing 14 01823 g008
Figure 9. Spatial distribution of verification samples in the study area.
Remotesensing 14 01823 g009
Figure 10. Field photographs of typical samples in the study area.
Remotesensing 14 01823 g010
Figure 11. Spatial distribution of the paddy products in the study area. (a) Results obtained in this study, (b) SERVIR MEKONG, and (c) ESACCI-LC.
Remotesensing 14 01823 g011
Figure 12. Comparison of the paddy extraction results of each product with Google Earth images. The yellow area represents paddy, and the white area represents non-paddy.
Remotesensing 14 01823 g012aRemotesensing 14 01823 g012b
Figure 13. Comparison of the paddy extraction results of each product with Sentinel-2 images (R: B8; G: B4; and B: B3). The yellow area represents paddy, and the white area represents non-paddy.
Remotesensing 14 01823 g013
Figure 14. Comparison of the accuracies of the extraction results of the proposed method and the existing products.
Remotesensing 14 01823 g014
Figure 15. Examples of paddy misclassification.
Remotesensing 14 01823 g015
Table 1. Sentinel-1 GRD IW image data.
SensorSentinel-1 SAR (C)
Dates1 January 2015–31 December 2015
Scenes193
Pass directionAscending
PolarizationVH
Table 2. Sentinel-2 Multispectral Instrument (MSI) image data.
SensorSentinel-2 (MSI)
Dates1 April 2015–1 October 2015 (Cloud cover < 20%)
1 April 2016–1 October 2016 (Cloud cover < 20%)
1 April 2017–1 October 2017 (Cloud cover < 20%)
Scenes624
Bands usedB3, B4, B8, B11
Table 3. Statistics of the number of training samples.
TypePaddyOther CroplandForestWater BodiesShrubs/GrasslandArtificial
Surfaces
Other Types
Total number of samples722842601003810046
1350
Table 4. Confusion matrix of the extraction results.
Non-PaddyPaddyTotal
Non-paddy42235457
Paddy45290335
Total467325792
PA (%)90.3689.23
UA (%)92.3486.57
OA (%)89.90
Kappa0.792
Publisher’s Note: MDPI stays neutral with regard to jurisdictional claims in published maps and institutional affiliations.

