Article

Satellite Observations of Fire Activity in Relation to Biophysical Forcing Effect of Land Surface Temperature in Mediterranean Climate

by
Julia S. Stoyanova
*,
Christo G. Georgiev
and
Plamen N. Neytchev
National Institute of Meteorology and Hydrology, 1784 Sofia, Bulgaria
*
Author to whom correspondence should be addressed.
Remote Sens. 2022, 14(7), 1747; https://doi.org/10.3390/rs14071747
Submission received: 28 February 2022 / Revised: 30 March 2022 / Accepted: 1 April 2022 / Published: 5 April 2022

Abstract

:
The present work is aimed at gaining more knowledge on the nature of the relation between land surface temperature (LST) as a biophysical parameter, which is related to the coupled effect of the energy and water cycles, and fire activity over Bulgaria, in the Eastern Mediterranean. In the ecosystems of this area, prolonged droughts and heat waves create preconditions in the land surface state that increase the frequency and intensity of landscape fires. The relationships between the spatial–temporal variability of LST and fire activity modulated by land cover types and Soil Moisture Availability (SMA) are quantified. Long-term (2007–2018) datasets derived from geostationary MSG satellite observations are used: LST retrieved by the LSASAF LST product; fire activity assessed by the LSASAF FRP-Pixel product. All fires in the period of July–September occur in days associated with positive LST anomalies. Exponential regression models fit the link between LST monthly means, LST positive anomalies, LST-T2 (as a first proxy of sensible heat exchange with atmosphere), and FRP fire characteristics (number of detections; released energy FRP, MW) at high correlations. The values of biophysical drivers, at which the maximum FRP (MW) might be expected at the corresponding probability level, are identified. Results suggest that the biophysical index LST is sensitive to the changes in the dynamics of vegetation fire occurrence and severity. Dependences are found for forest, shrubs, and cultivated LCs, which indicate that satellite IR retrievals of radiative temperature is a reliable source of information for vegetation dryness and fire activity.

1. Introduction

Fire is a global phenomenon closely linked to climate variability and human practices with critical regional implications [1,2]. It is an important process in the modulation of the Earth system through the links between weather, climate, and vegetation and has the potential to impact on the global climate system by changing the ability of the surface to absorb and emit energy [3,4].
Climatic variability is a major driver of fire in many terrestrial ecosystems, as reflected in Bradstock’s conceptual model of four climatic ”switches” that influence fire regimes by controlling fuel amount, fuel moisture, and fire weather at contrasting temporal scales [1]. Fire regimes are also affected by other controls such as landscape-scale patterns of vegetation, topography, and human activities [5]. Climate is connected to fires at two distinct temporal scales [6]. Short-term climatic anomalies (from months to years) affect fires by modifying vegetation growth and fuel moisture before the fire and by influencing weather during the period of fire spread. In addition, climate has more indirect, long-term (decadal or longer) effects on the distribution of major vegetation types, which in turn constrain the landscape-scale mosaics of fuels and vegetation.
Soil moisture (SM) has been identified as a key variable in understanding and predicting wildfire hazards [7,8,9,10,11]. Soil moisture, defined as the water contained in the unsaturated soil zone [12], not only influences vegetation growth conditions and consequently the accumulation of wildfire fuel, but also determines the vegetation moisture content and hence the flammability of the vegetation [7,9,13].
Land surface temperature (LST) is one of the most important parameters controlling physical processes responsible for the land surface balance of water, energy, and CO2 [14,15]. In the context of wildfire studies, the LST consideration has two main aspects: first, as a pre-fire indicator of land surface state (SM deficit in root zone and vegetation dryness, evapotranspiration, leaf temperature), and second, as a post-fire characteristic of fire-induced environmental changes. The variations in the spatial distribution of LST as a result of fires are usually the focus of research works that characterize fire intensity and burn severity. Higher post-fire LST of burned areas has been reported in remotely-sensed images [3,4,16,17,18], that is accounted mainly due to a decrease in transpiration and an increase in the Bowen ratio (β = sensible heating/latent heating) [19].
Although relationships between drought and fire seem quite interrelated, only a few studies have explored LST as a pre-fire indicator [20,21]. Short-term analyses based on LST daily anomalies have been performed to predict fire occurrence [20].
The vegetation cover partitions the incoming solar radiation into sensible and latent heat fluxes depending on its structure as well as affects the surface roughness, which can in turn alter heat and moisture transport; the type of vegetation and its seasonal dynamics affect the land’s vulnerability to fire ignition and spread. That is why spatial–temporal patterns of LST can contribute to the monitoring of processes that structure ecosystem development and may be associated with fire occurrences to help fire management. Satellite measurements are a source of information for the accurate estimation of LST at the global and regional level, thus helping to evaluate the land surface–atmosphere exchange processes and can serve as a valuable metric of surface state [4,14].
In this study, we consider data for skin surface temperature retrieved by satellite measurements to explore the significance of LST as a biophysical driver, which (in combination with SM, air temperature, and humidity) controlled long-term wildfire activity during the study period of 2007–2018 over the Eastern Mediterranean region, as seen in coherent satellite active fire observations.
Studies have used satellite remote sensing for fire monitoring from the early 1990s. With the rapid development of remote sensing technology, satellites are increasingly used for fire monitoring [22,23,24,25,26] and applied at large scales. In recent years, many studies have been committed to identifying the spatial and temporal characteristics of fires from the global and regional perspectives with the use of satellite data [27,28,29,30,31]. All these studies were performed by using observations by low earth orbit (LEO) satellite sensors with the Very High Resolution Radiometer (AVHRR), Moderate Resolution Imaging Spectroradiometer (MODIS), and Advanced Spaceborne Thermal Emission and Reflection Radiometer (ASTER).
Geostationary (GEO) fire products were first generated over the Americas using the Geostationary Operational Environmental Satellite Visible Infrared Spin Scan Radiometer Atmospheric Sounder (GOES-VAS), e.g., in [32], and this led to the development of the long-standing GOES WildFire Automated Biomass Burning Algorithm (GOES WFABBA) product [33]. Roberts et al. [34] first demonstrated the retrieval of Fire Radiative Power (FRP) from GEO data and developed a full “fire thermal anomaly” active fire detection and FRP retrieval algorithm for GEO systems. This was initially applied to data from Meteosat Second Generation [35], and an operational version is now used to generate a series of geostationary active fire detection and FRP retrieval products that span much of the globe, including Meteosat over Africa and Europe [36,37], GOES-East and West over the Americas [38], and Himawari over Asia [39]. Wooster et al. [40] summarized the history of achievements in the field of active fire remote sensing, reviewed the physical basis of the approaches used, the nature of the active fire detection and characterization techniques deployed, and highlighted some of the key current capabilities and applications.
However, since every observation by the satellite sensors lasts only an instant, what they actually measured was the rate of release of FRE per unit of time or Fire Radiative Power (FRP) in MW [24,41,42]. It was shown that the FRE released by a fire is directly proportional to the biomass consumed as well as the smoke emitted [43]. Measurement of fire radiative energy (FRE) release rates or power (FRP) from space offers opportunities for the characterization of biomass burning and emissions in a quantitative manner. In essence, it has enabled the rating of fires as well as an estimation of regional FRP fluxes, which reflect the relative concentrations of biomass burning activities.
Mediterranean regions are some of the most affected by wildfires, and remote-sensed information about fire activity as provided by the SEVIRI instrument on board Meteosat-8 is especially valuable for forest and civil protection activities [44]. On the other hand, the Mediterranean is one of the most responsive regions to climate change, as evidenced by “pronounced warming” and significant decreases in spring and summer precipitation, which have led to regime shifts toward more arid climates [45,46]. Triggered by large-scale atmospheric forcing, Mediterranean regional heat waves are often amplified by surface preconditioning such as negative soil moisture anomalies and vegetation stress [47].
The research works of Sifakis et al. [48], Amraoui et al. [44], and Di Biase and Laneve [49] were aimed at understanding the spatial and temporal patterns of landscape fires in the Mediterranean, applying different remote sensing data from GEO sensors. Compared to LEO systems, GEO products offer higher temporal resolutions but coarser spatial resolutions, and each sensor only provides data over a specific region of the Earth. The observations from the geostationary meteorological satellite MSG provide a valuable source of information about fire occurrences in the Mediterranean region. Sifakis et al. [48] reported that during the summer period of 2007, MSG-SEVIRI data successfully detected 82% of the fire events in Greek territory, with less than 1% false alarms. Using data from MSG-1 satellite, Amraoui et al. [44] performed an analysis of the spatial distribution of fire events in the months of July and August during the period of 2007–2009. Around half of the fire pixels were detected in croplands, and the remaining half was evenly distributed between forest and shrub. Based on the analysis of the low, mid, and upper atmospheric fields of geopotential, temperature, relative humidity, and wind in two extreme events of fire activity that struck Greece and Italy on 24–25 July and 22–27 August 2007, they suggested a conceptual model for meteorological conditions that favor the occurrence of severe wildfire episodes in Italy and the Balkan Peninsula.
The current study is the first one to use the FRP product retrieved by geostationary satellite observations to investigate fire activity in a recent long-term period for the Eastern Mediterranean.
In Mediterranean ecosystems, prolonged droughts and heat waves have created the preconditions for the increasing frequency and intensity of forest fires [50], the underlying mechanism being the reduction of live and dead fuel moisture content as a response of the soil–plant system to the increased vapor pressure deficit [51]. Vegetation response varies with species as well as with forest structure and soil/terrain characteristics, and it is determined by evapotranspiration. The moisture of dead fuels is affected by weather variations as well, and it is regulated through evaporation [52]. The climate and weather patterns of the Mediterranean region highlight the value of having an improved understanding of the relationships between drought and wildfire; more specifically, an understanding of how drought is related to fire danger outputs. A number of studies have examined the link between drought indicators and wildfire occurrence [53,54,55]. Many drought indices (see [56]) are driven by stand and climate variables of precipitation and/or temperature, but more recent developments include variables that express conditions at the land surface–atmosphere interface such as vegetation health [57], soil moisture deficit [58,59,60,61,62], actual evapotranspiration [63], and evaporative demand [56,64,65]. These last indexes are important because they can reflect the outcome of the coupled physical processes of energy–water cycles on the land surface.
In our previous work [66], long-term LST anomalies retrieved by MSG SIVIRI were used to identify drought-prone areas in the Eastern Mediterranean. Song [21] showed that there is no linear relationship between LST anomaly and fire occurrences, but the time series of LST anomaly before fire events show a significant trend. Resolving LST–fire interactions facilitate fire predictions and the issuance of early warnings.
We use long-term spatially and temporally consistent satellite observations from the SEVIRI sensor of geostationary MSG satellite to assess the biophysical forcing effect of vegetation fires on a climatic basis at a regional scale. The study is focused on two key aspects of wild fire problems that are not systematically studied in the literature: (i) an evaluation of the importance of LST (monthly mean values, anomalies, and difference with air temperature, T2m) as precursor/s of vegetated land surface dryness and the related pre-fire signals of vegetation stress and fire occurrence; (ii) an exploration of the variability of these biophysical drivers of vulnerability in biomass burning across the climatic gradient, delineated into main land cover types, and the quantification of relations with fire activity using long-term records of satellite information from Meteosat, ground observations, and SVAT model data of Soil Moisture Availability (SMA) to the land cover as reference data over the Eastern Mediterranean region (Bulgaria). The specific objectives to be met are the following:
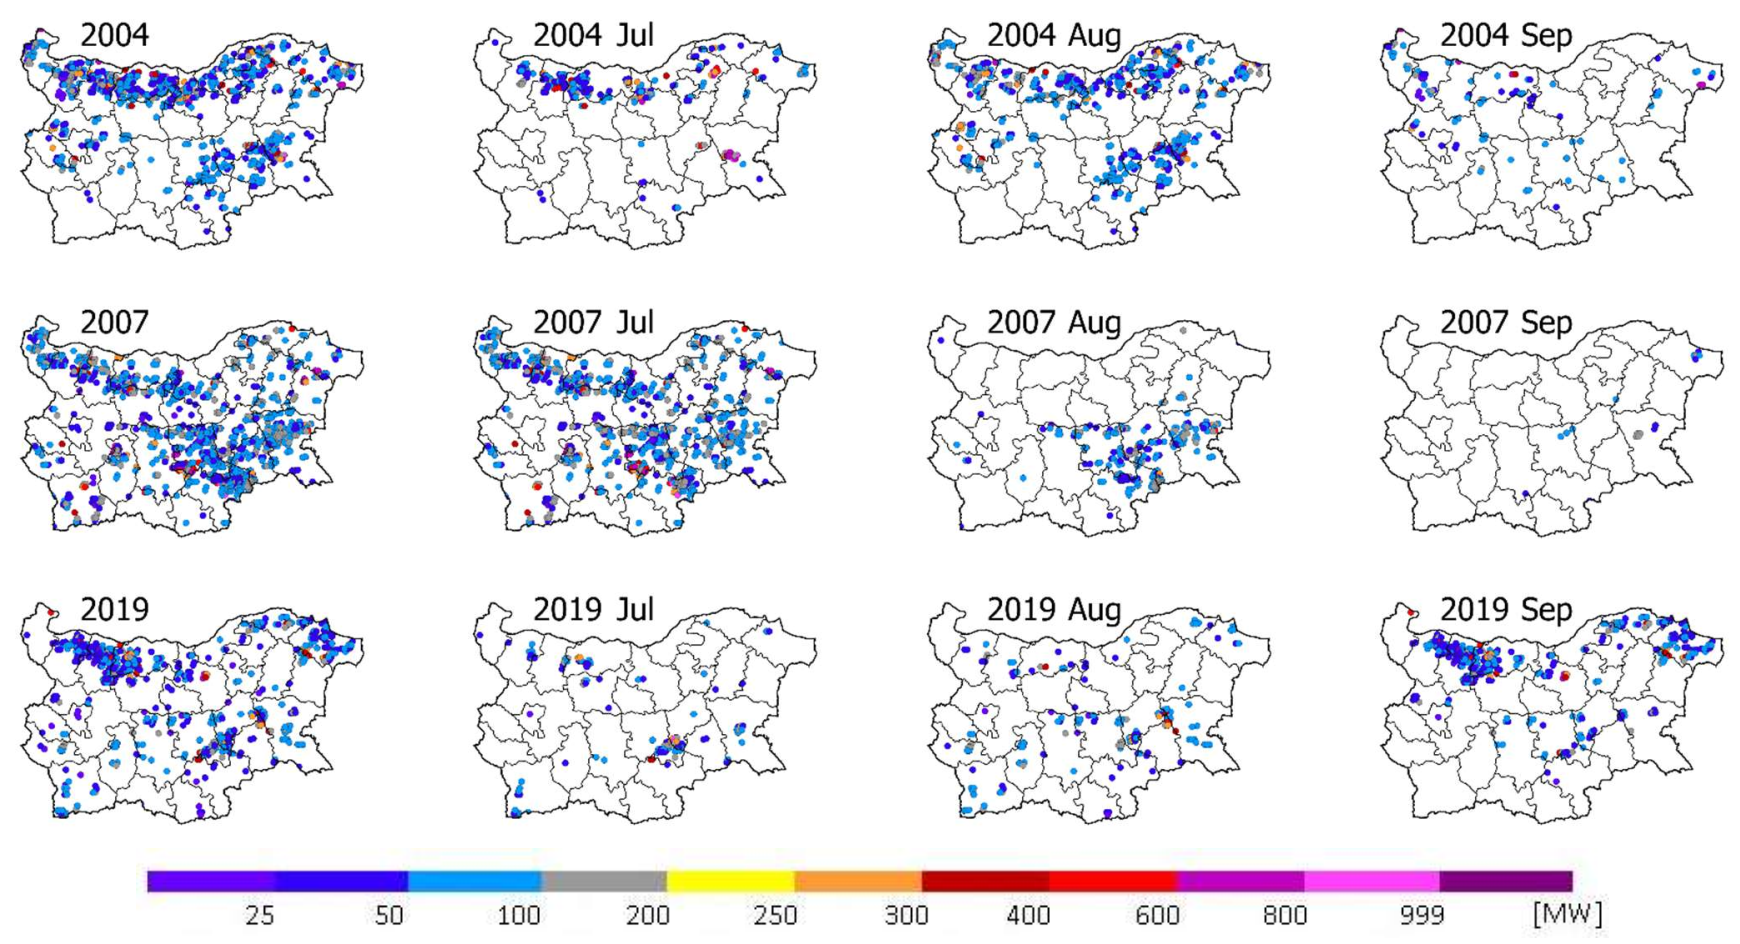
  • To characterize spatial–temporal patterns of fire activity (July–September) using long-term satellite data records from SEVIRI observations (2004–2019) in terms of the number of biomass burning detections and the severity of burning (FRP, MW) according to the LSASAF FRP-Pixel product;
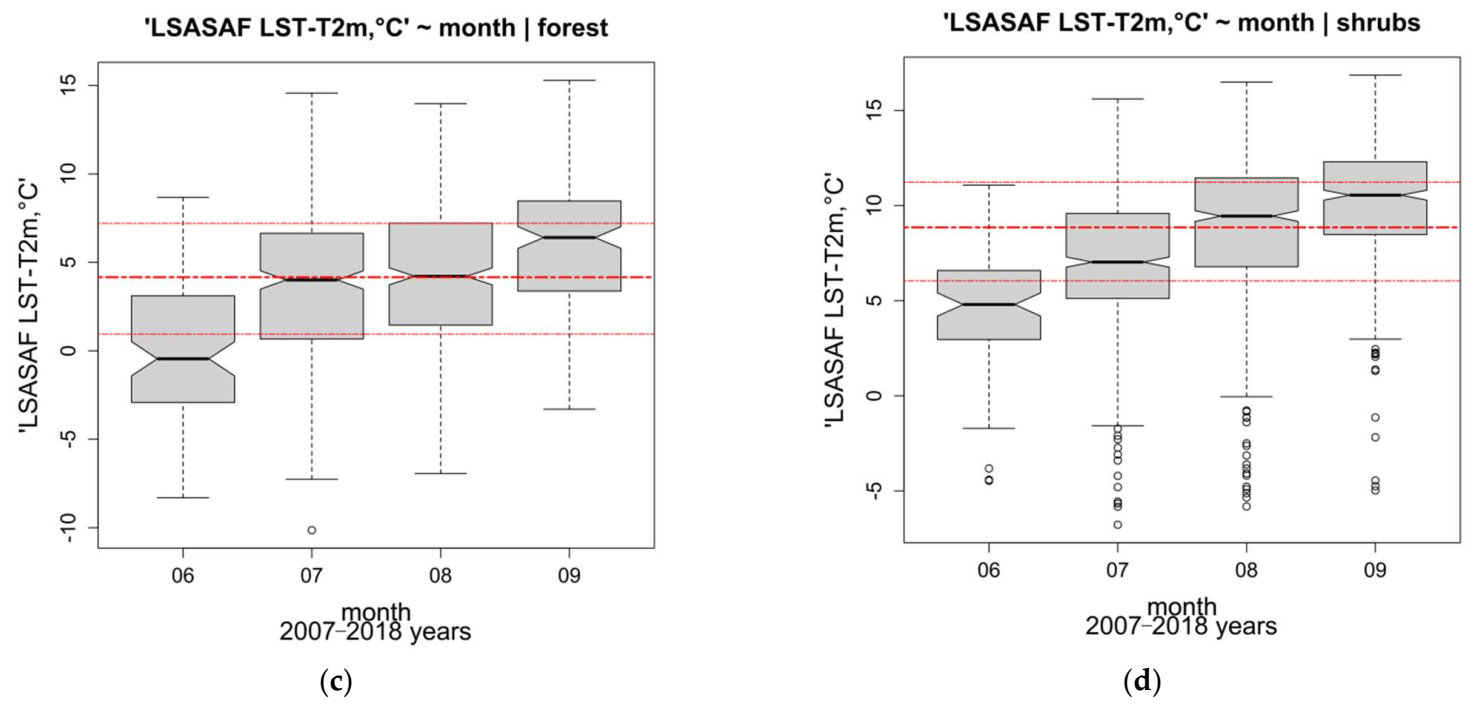
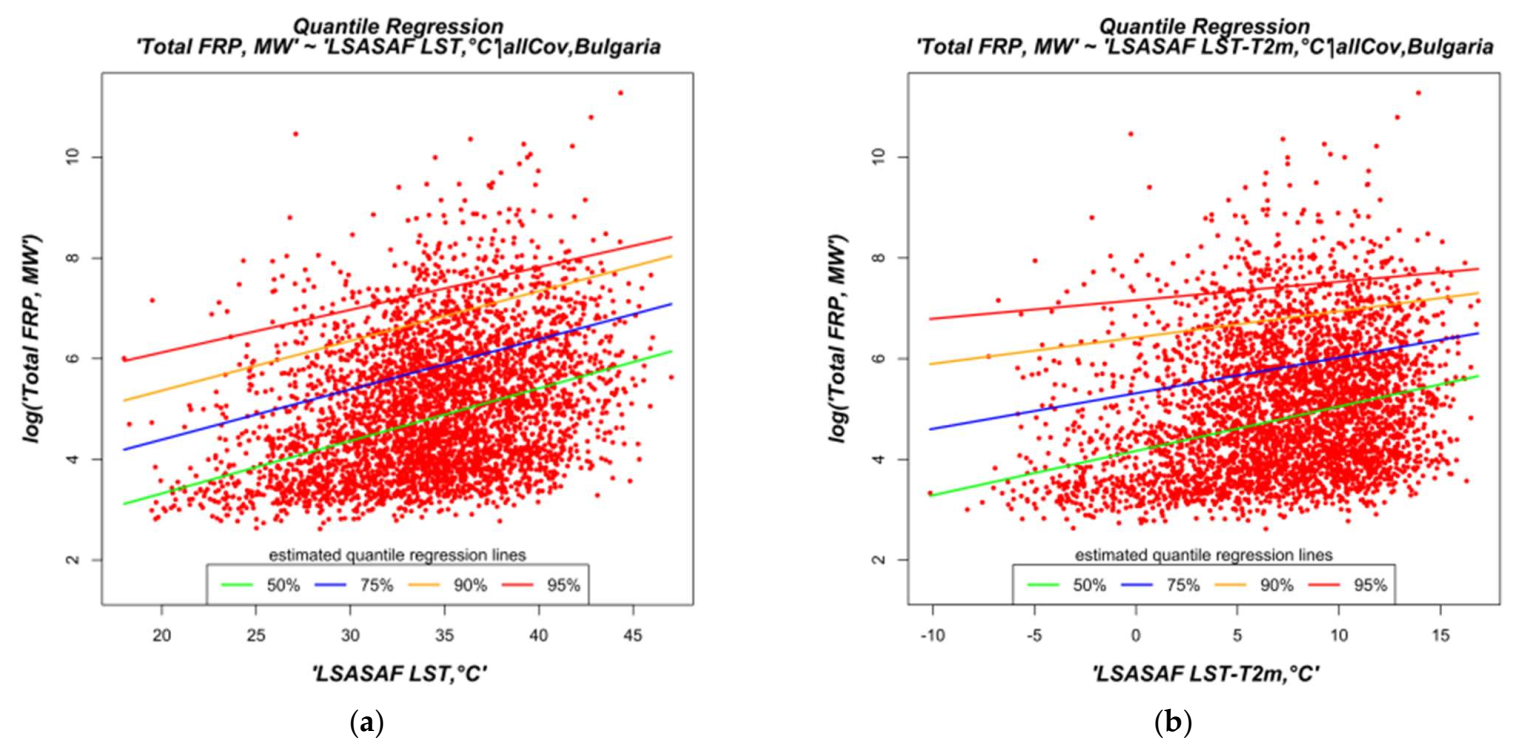
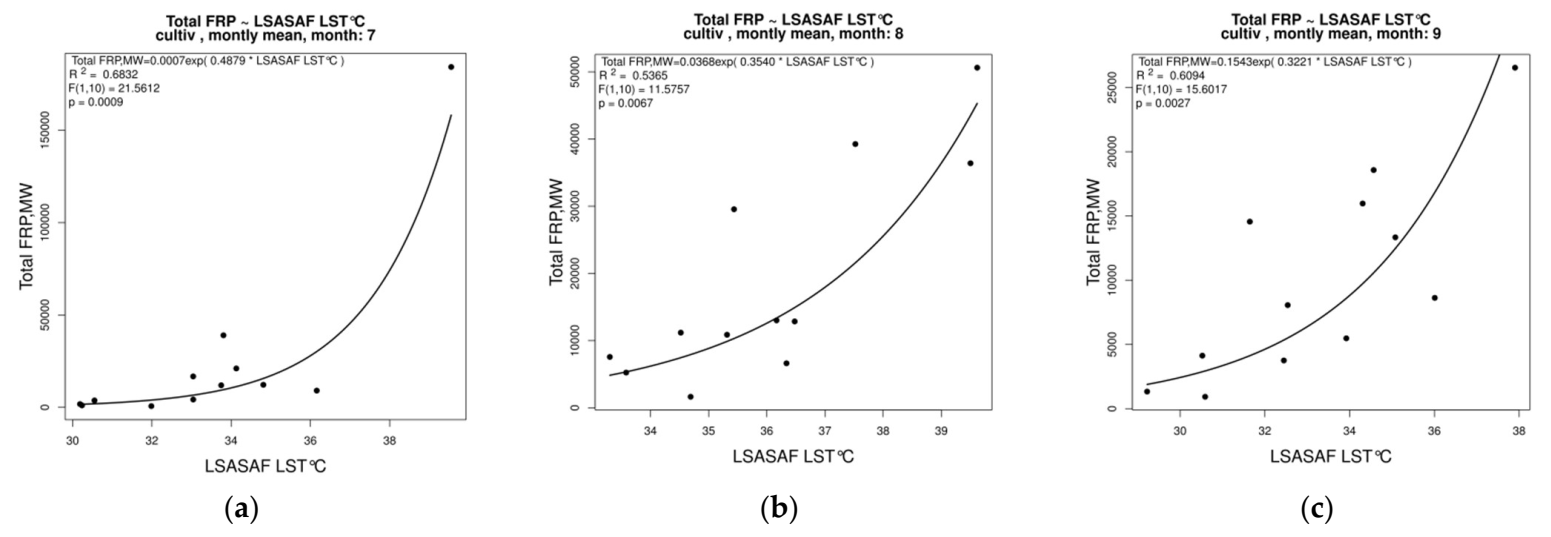
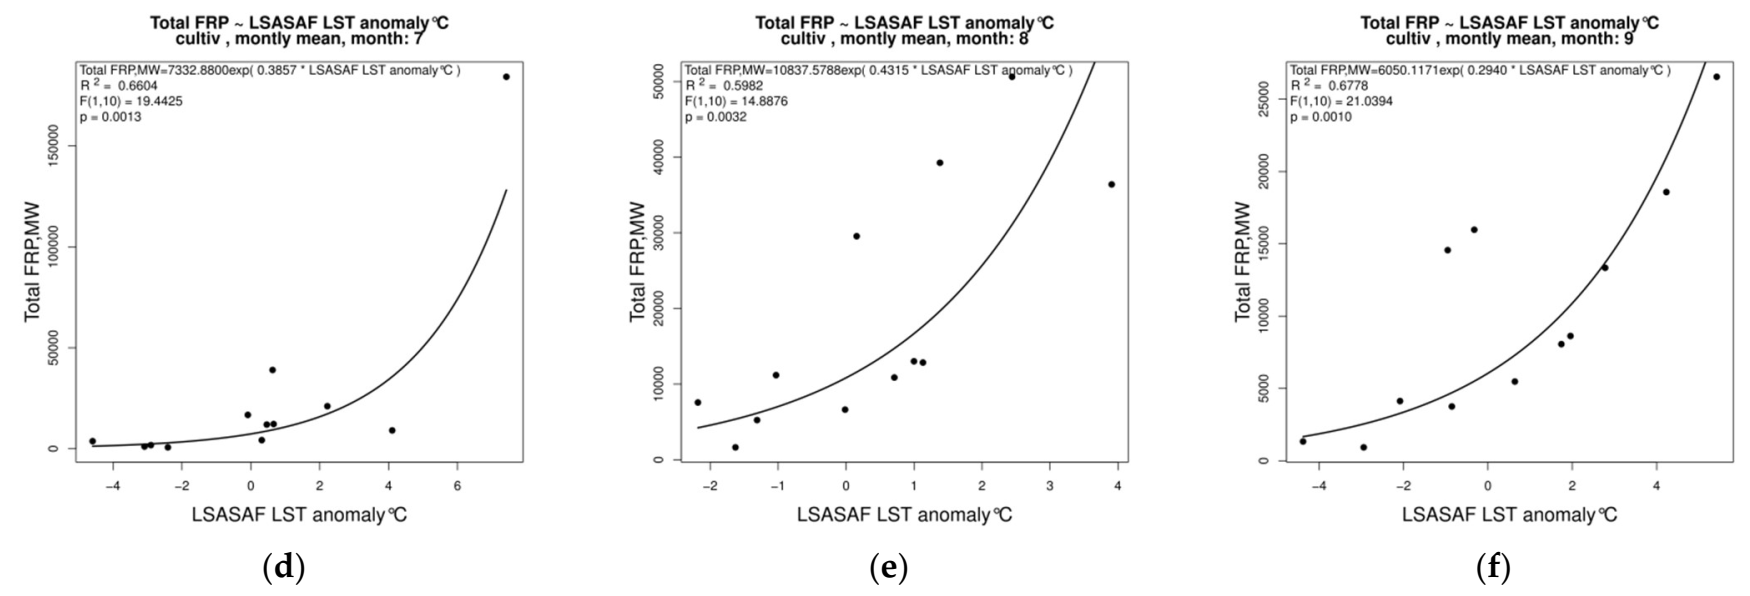
  • To use LSASAF LST product data to statistically investigate and evaluate the relationship of the biophysical parameters of LST, LST anomaly, and the difference between skin and air temperatures (LST-T2m) to the occurrence and severity of wild fires on a short-term climatic basis (2007–2018);
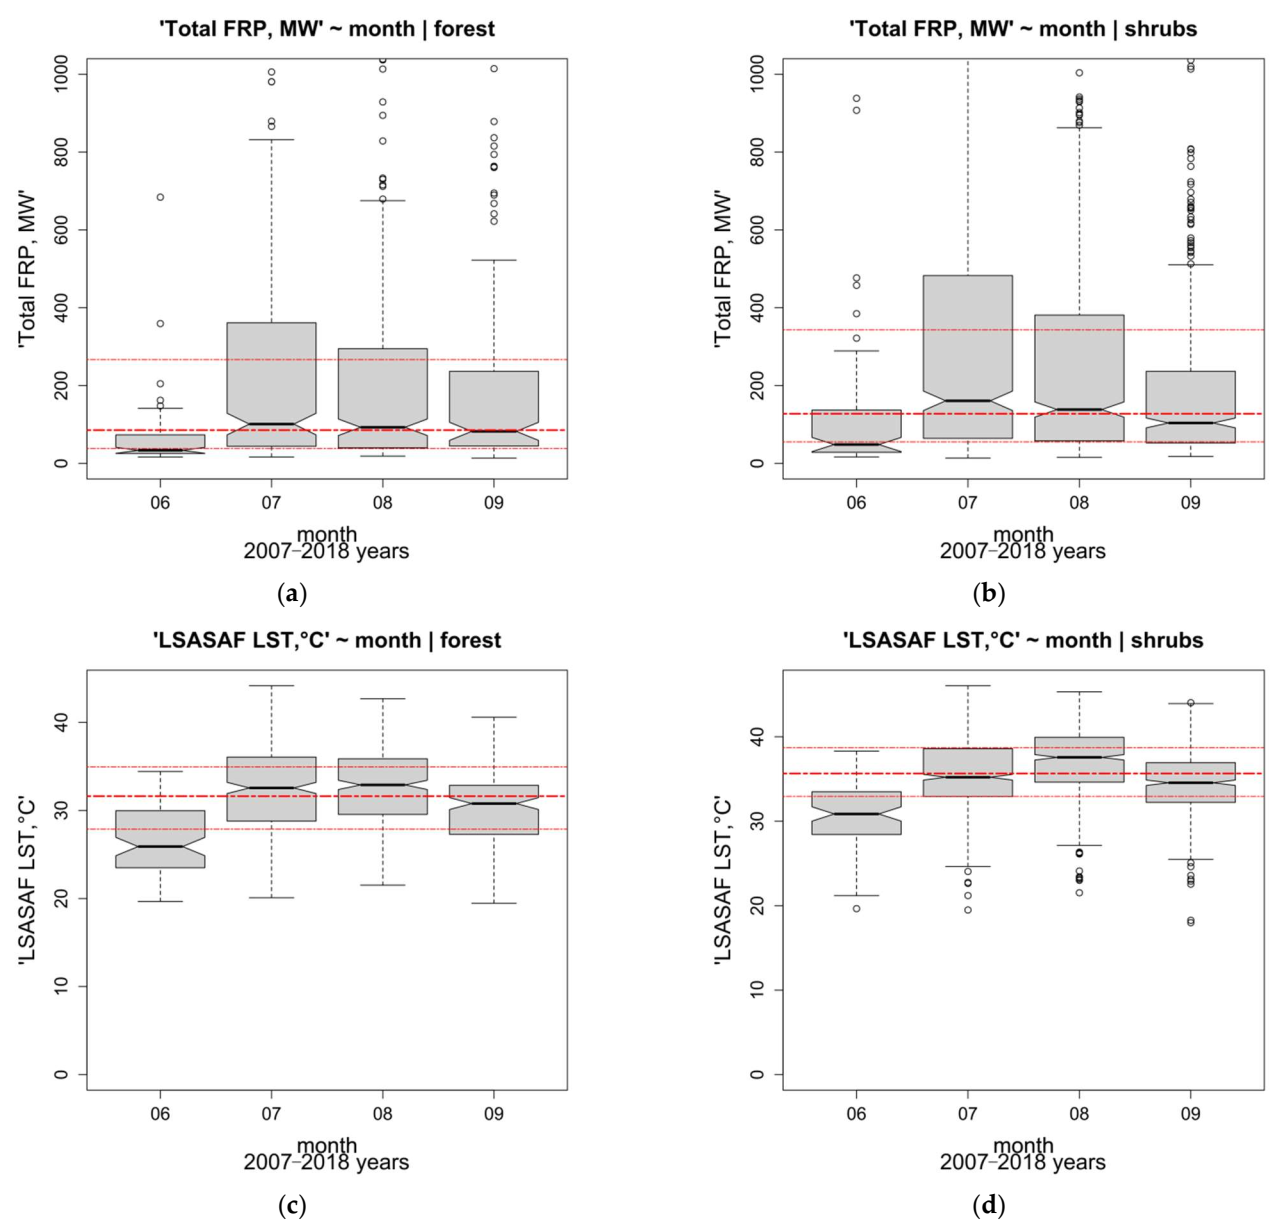
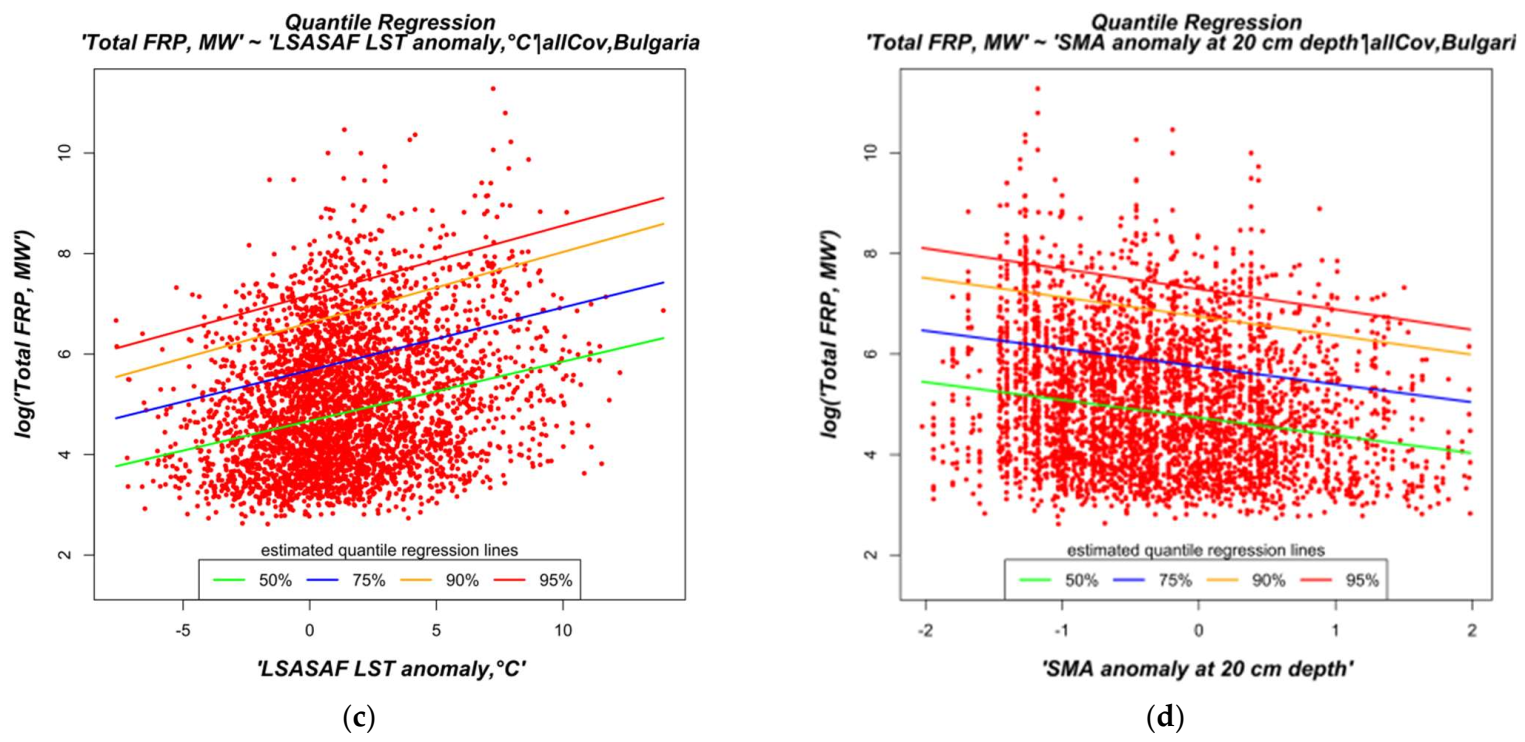
  • To characterize the wild fire vulnerability of the main vegetation types (forest, shrublands, cultivated) in relation to the LST and SMA warm and dry anomalies.

2. Materials and Methods

This work is based on the methodology developed in our work [66], adapted to assess environmental control on fire activity and its spatial–temporal variability by using satellite observations from geostationary Meteosat. As a biophysical index related to the forcing of fire activity, the satellite-derived IR skin temperature from SEVIRI observations with the EUMETSAT LSASAF LST product is proposed. Based on long-term data records, LST mean summer monthly values, and their anomalies and deviation from the air temperature, T2m were applied as indicators of the coupled energy and water cycles. Fire-promoting SM anomaly patterns derived by the SVAT modeling approach were used as a reference for the evaluation of the LST–fire intertwining. The pattern of fire activity over Bulgaria was characterized by the evaluation of SEVIRI-based satellite detections of biomass burning according to the LSASAF FRP-Pixel product. Benefiting from the geostationary satellites’ high temporal resolution, the relationship between LST and fire regimes was studied and the underlying biophysical processes were explored.
Statistical comparative analyses of long-term data records of the LSASAF product, SVAT meteorological model outputs, and ground observations (meteorological parameters and actual fires) were applied following the methodology in [66], which was further extended (in Section 2.5). Overlaid graphical analyses of the summer season (June–September 2007–2018) dynamics of biophysical indexes in relation to fire characteristics (number of detections and severity) were performed to study the sensitivity of the approach. All datasets taken from information sources with different spatial resolutions were placed over the grid of the ECMWF global NWP model, IFS version O1280 (about 9 km spatial resolution). Only values with 1400 points that cover the region of Bulgaria were considered.

2.1. The LSASAF FRP-PIXEL Product

In order to characterize fire activity in this study, radiative energy released by fire events, as provided by the LSA SAF Fire Radiative Power-Pixel (FRP) product [36,67], was used. The LSASAF FRP-PIXEL product provided information on the location, timing, and fire radiative power (FRP, in MW) output of landscape fires (“wildfires”) detected every 15 min across the full Meteosat disk at the native spatial resolution of the SEVIRI sensor. The FRP provided information on the measured radiant heat output of detected fires; the heat output was a direct result of the combustion process whereby carbon-based fuel is oxidized to CO2 with the release of a certain “heat yield” [24]. FRP calculation relies on the Middle Infrared (MIR) method and assumes FRP to be proportional to the difference between the observed fire pixel radiance measured from the MSG SEVIRI radiometer and the “background” radiance that would have been observed at the same location in the absence of fire. The LSASAF algorithm for deriving FRP from SEVIRI radiance measurements is fully described in [37]. The type of fire detection algorithm that is proposed for use with SEVIRI is based on the principles applied to generate active fire detections within the MODIS Fire Products [24].
While this FRP methodology offers many advantages, among the uncertainness reported, two factors are likely to reduce the satellite-measured FRP that is emitted by the fire:
  • The first concerns surface fires in forests, where an unknown amount of radiant energy may be intercepted (scattered and absorbed) by the forest canopy.
  • Second, although atmospheric effects perturb MIR wavelength observation far less than those in shorter wavelengths, allowing FRP retrieval through even dense smoke and plumes, the radiative impact of the absorptive black carbon released during combustion may result in some underestimation of the FRP by the satellite measurement.
The FRP algorithm is subject to other sources of uncertainties, essentially due to the characteristics of SEVIRI, as described in [37]. Among these limitations, one can state that the FRP-derived value is quite sensitive to the fire location within the pixel. A fire located at the center of the instrument’s instantaneous field-of-view will elevate the pixel temperature much more than a fire located far away from its center. Additionally, abnormally low radiances might be observed surrounding a fire pixel due to the negative lobes of the point spread function. As a result, the background temperature might be colder, thereby increasing the estimated FRP value. The rather coarse spatial resolution of SEVIRI may cause the non-detection of smaller/less intense fires that MODIS can detect, for instance, but SEVIRI misses. The non-linearity of the SEVIRI 3.9 channel above 310 K and the saturation of that band above 335 K are responsible for the error in the FRP estimation. As a result, FRP values derived from SEVIRI underestimate those derived from MODIS by about 40% [34].
A significant remote sensing constraint for fires is the presence of cloudiness in fire weather situations, as all satellite methods used for monitoring fires have limitations that tend to cause important biases in the final product. The algorithms cannot detect existing fires due to the elimination of cloudy pixels or the assumption of some detection in partially cloudy pixels as “false” fire detections based on “contextual” tests.

2.2. Biophysical Indexes

In our work [66], the spatial–temporal variability of land surface state dry anomalies was characterized by the land surface temperature with the use of LST retrievals from the MSG satellite measurements and SMA. Using long-term data records, the same biophysical drivers of drought occurrence have been further explored here in terms of their forcing effects on fire activity through the related biophysical processes. In addition to land surface radiometric temperature characterized by its monthly values and calculated anomalies, the blended parameter, which is the difference between skin surface temperature and air temperature at 2 m above the earth’s surface (LST-T2m), is proposed to be used as a first proxy of sensible heat flux exchange. The patterns of these biophysical indexes were defined as the mean monthly values for June, July, August, and September. The SMA anomalies during the summer months were considered in parallel to explore the fire forcing effect of soil moisture deficit.
To quantify the relations, statistical analyses and modeling were applied. Since the considered biophysical parameters and the procedure of their application have been explained in detail in [66], only the main points are marked here, and the new elements are further explained in Section 2.5.

2.2.1. The LSASAF LST Product

For the purposes of the current study, the LSASAF LST product (MLST, LSA-001) has been applied [68]. The LST retrieval was based on clear-sky measurements from the MSG system in the thermal infrared window (MSG/SEVIRI channels IR10.8 and IR12.0), every 15 min within the area covered by the MSG disk. Theoretically, LST values could be determined from MSG 96 times per day, but in practice, fewer observations were available due to cloud cover.
The 12-year time series for the region of Bulgaria for the period of June–September (2007–2018), which included only days/locations with satellite fire detections, was constructed. Datasets for LSASAF LST at 0900 UTC and at 1200 UTC (averaged over 5 measurements within ±30 min of these two time slots to avoid the limitations of cloudy pixels) were inferred at MSG pixel bases. For some climatic assessments, the averaged 3 × 3 pixels LST values around the grid points were also processed. The difference between LST and the air temperature, T2m (observations at the SYNOP network at 0900 UTC and 1200 UTC) was also constructed for the same studied period.

2.2.2. SVAT Model and SMAI

For the identification of fire-promoting SM anomaly patterns, the “SVAT_bg” model developed at the National Institute of Meteorology and Hydrology (NIMH) of Bulgaria was used [61,69,70]. This is a simple 1D site-scale meteorological model that exploits the concept of one layer of vegetated land surface and two levels of moisture availability along the root zone depth. One of the main “SVAT_bg” model output parameters is soil moisture (SM) for different root zone soil depths (20, 50, 100 cm). For assessing land surface state, the SMA concept was adopted to serve as an information source for “warnings” of environmental constraints. Based on the “SVAT_bg” model-derived SM, a quantitative SMA index, SMAI was developed and operationally calculated at a site scale for the region of each NIMH synoptic station. At each point of the used grid, the SMAI values at the nearest synoptic station were considered for the calculation of the anomalous water content in the unsaturated root zone. SMAI was designed as a 6-level threshold scheme to account for moistening conditions [66]. The site-scale assessment of mean monthly SMAI anomalies at synoptic stations was compared with the overlaid FRP Pixel detections from corresponding MSG pixels covering the region of the station applying the statistical analyses.

2.3. Ground Observations of Forest Fires

Ground observations of the number of actual forest fires were considered according to the database of the State Forest Agency of Bulgaria (SFA), the responsible national institution, and were used for comparison with satellite detections.

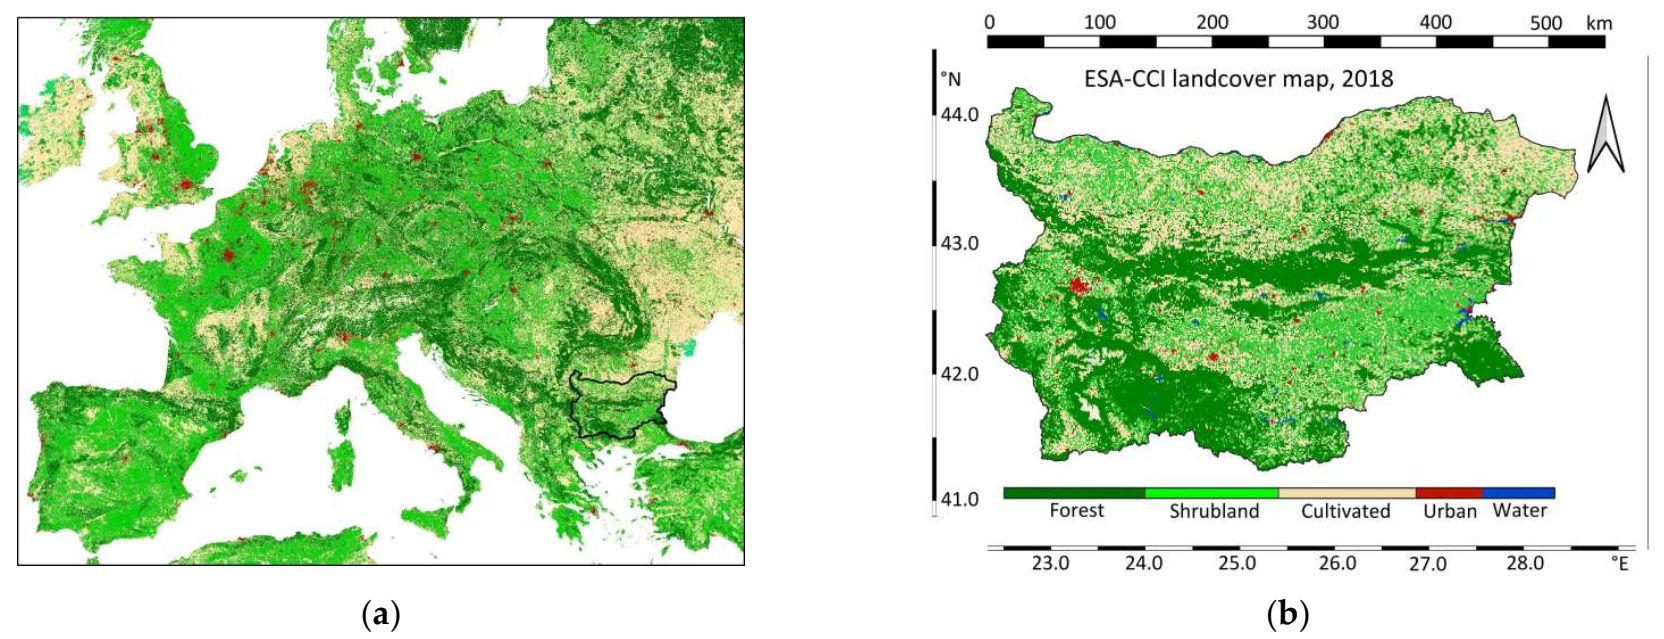
2.4. Target Region and Land Cover

The study area includes the whole territory of Bulgaria, Southeastern Europe, located within latitude circles of 40.25 N and 45.0 N and meridians of 20.5 N and 29.5 E. The region falls under Mediterranean climate influences, characterized by dry summers and mild, wet winters, both with irregular precipitation distribution. Information about land covers (LC) provided by the ESA-CCI Land Cover Map product at a spatial resolution of 300 m [71] was used. Maps were updated on an annual basis. The LC classification system from ESA-CCI includes 24 vegetation types. For the purposes of this study, we reclassified these types into the following three main vegetation groups (Figure 1): forests (classes 50, 60, 61, 62, 71, 72, 80, 81, 82, 90), scrubland (11, 12, 40, 100, 110, 120, 121, 122), and cultivated areas (10, 20, 30, 130). Other land cover types, including permanent snow and ice (220) and barren and water bodies (200, 210), where there are limited fires, were not analyzed in our study. Urban areas (190) were also excluded.

2.5. Numerical Analyses

To characterize the fire distribution pattern, a dataset of FRP detections (location, timing, and energy) for the period of June–September (2004–2019) was constructed [72,73]. All pixels with at least one fire detection were considered. Fire regime was characterized by the frequency of detections and severity according to the released energy from biomass burning (FRP fire radiative energy, MW). Each fire pixel was associated with the coordinates of the nearest point on the grid, where LST, LST anomalies, and (LST-T2m) had been derived. The procedure was performed for monthly (June, July, August, and September) accumulated energy released from fires in the corresponding grid point.
In order to validate the adopted methodology, monthly mean anomalies of LST and SMA that had been inferred in [66] and visualized in color-coded maps were evaluated for consistency with FRP fire pixel spatial distribution over Bulgaria by using qualitative comparative analysis. Examples for July 2007 are presented in Figure 2. Figure 2a shows that the higher positive LST anomalies (in red) correspond to a higher number of FRP-detected fire pixels. The stronger negative SMA anomalies (indicated by reddish colors) are related to a higher number of fire detections (Figure 2b). The consistency of the data allows quantitative studies to be performed further.
Based on long-term records (June–September 2007–2018), stochastic graphical analysis was performed. The consistency in the behavior of the fire activity and the biophysical drivers LST, LST anomalies, (LST-T2m), and SMA anomalies was analyzed in terms of their mean, spatiotemporal variability on a monthly and annual basis, as well as their anomalous distribution and relations. The summer seasonal dynamics of biophysical conditions for different LC vegetation types were studied and their relation to vulnerability of fire ignition/spread was evaluated.
A graphical description of the locality, the spread and skewness groups of numerical data of FRP detections, released energy from biomass burning, LST, LST anomalies, and the (LST-T2m) temperature difference was performed through their boxplot quartiles. Two types of regression analyses were performed; the first one made use of estimates by the method of least squares of the conditional mean of the response variable across values of the predictor variables. The second method used Quantile Regression (QR) estimates of the conditional median of the response variable, which has received increasing attention in recent years and is applied in many areas, including data analysis in the natural sciences.
To identify regions most vulnerable to fires in Bulgaria, the spatial pattern of the accumulated fire numbers detected by the LSASAF FRP-Pixel product for the period of June–September 2004–2019 was considered. A statistical evaluation of the spatial distribution of fire pixels was performed by applying the Mann–Kendall statistic test. To perform all these comparisons, the R language for statistical computing was used [74].
All numerical evaluations were performed for the three main vegetation groups: forest, shrubland, and cultivated, as well as considered all together in a sample “all land cover”. Such a reclassification into three LC categories has been used in other studies of fire activity over the Mediterranean using satellite data, e.g., in [44].
A summary of all data used for comparative analyses in the current study are presented in Table 1.

3. Results

Fire regimes were described through statistical distributions of frequency and severity over the studied area in the summer season during a 16-year time period. Using 12 years of data for LST and related biophysical parameters, the environmental determinants of fire regimes were assessed by exploring how environmental drivers operating over a range of scales affected the spatial and temporal patterns of these fires.

3.1. Active Fire Monitoring from Space

The results from the study of fire activity derived from satellite observations over Bulgaria are presented in maps of accumulated fire detections for each month of the July–September period and each year of the whole 2004–2019 period. Examples for selected years are shown in Figure 3 (see also [72,73]). The fire severity was assessed following the color-indicated released energy of burning biomass FRP (MW). The fire activity exhibited various seasonal distributions from year to year, e.g., maximum activity and severity was observed in July 2007 (also in 2006, 2016, 2017, not presented), in August 2004 (also 2006, 2008), and in September 2019 (2011, 2012). There are repetitions of spots with higher fire activity, suggesting that the spatial distribution varies depending on the evolution of the horizontal patterns of the biophysical drivers (to be further considered in Section 3.2. and Section 3.3).
Results from the validation of the MSG FRP-Pixel product comparing the number of detected fire pixels in forested areas with the course of actual forest fires reported by ground observations of the State Forest Agency (SFA) of Bulgaria are shown in Figure 4. Comparisons are performed for the period of July–September 2007–2018. A good agreement between the two independent sources of information for forest fire dynamics during different months and years is observed: the increase in actual fires corresponds to the increase in satellite fire pixel detections; the highest forest fire activity is in July 2007; for July and August, the two lines are very close, indicating an almost similar number of fire detections; for September, the courses are similar but the number of satellite detections are lower, probably due to the cloudier conditions in September.

3.2. Biophysical Drivers and Fire Activity

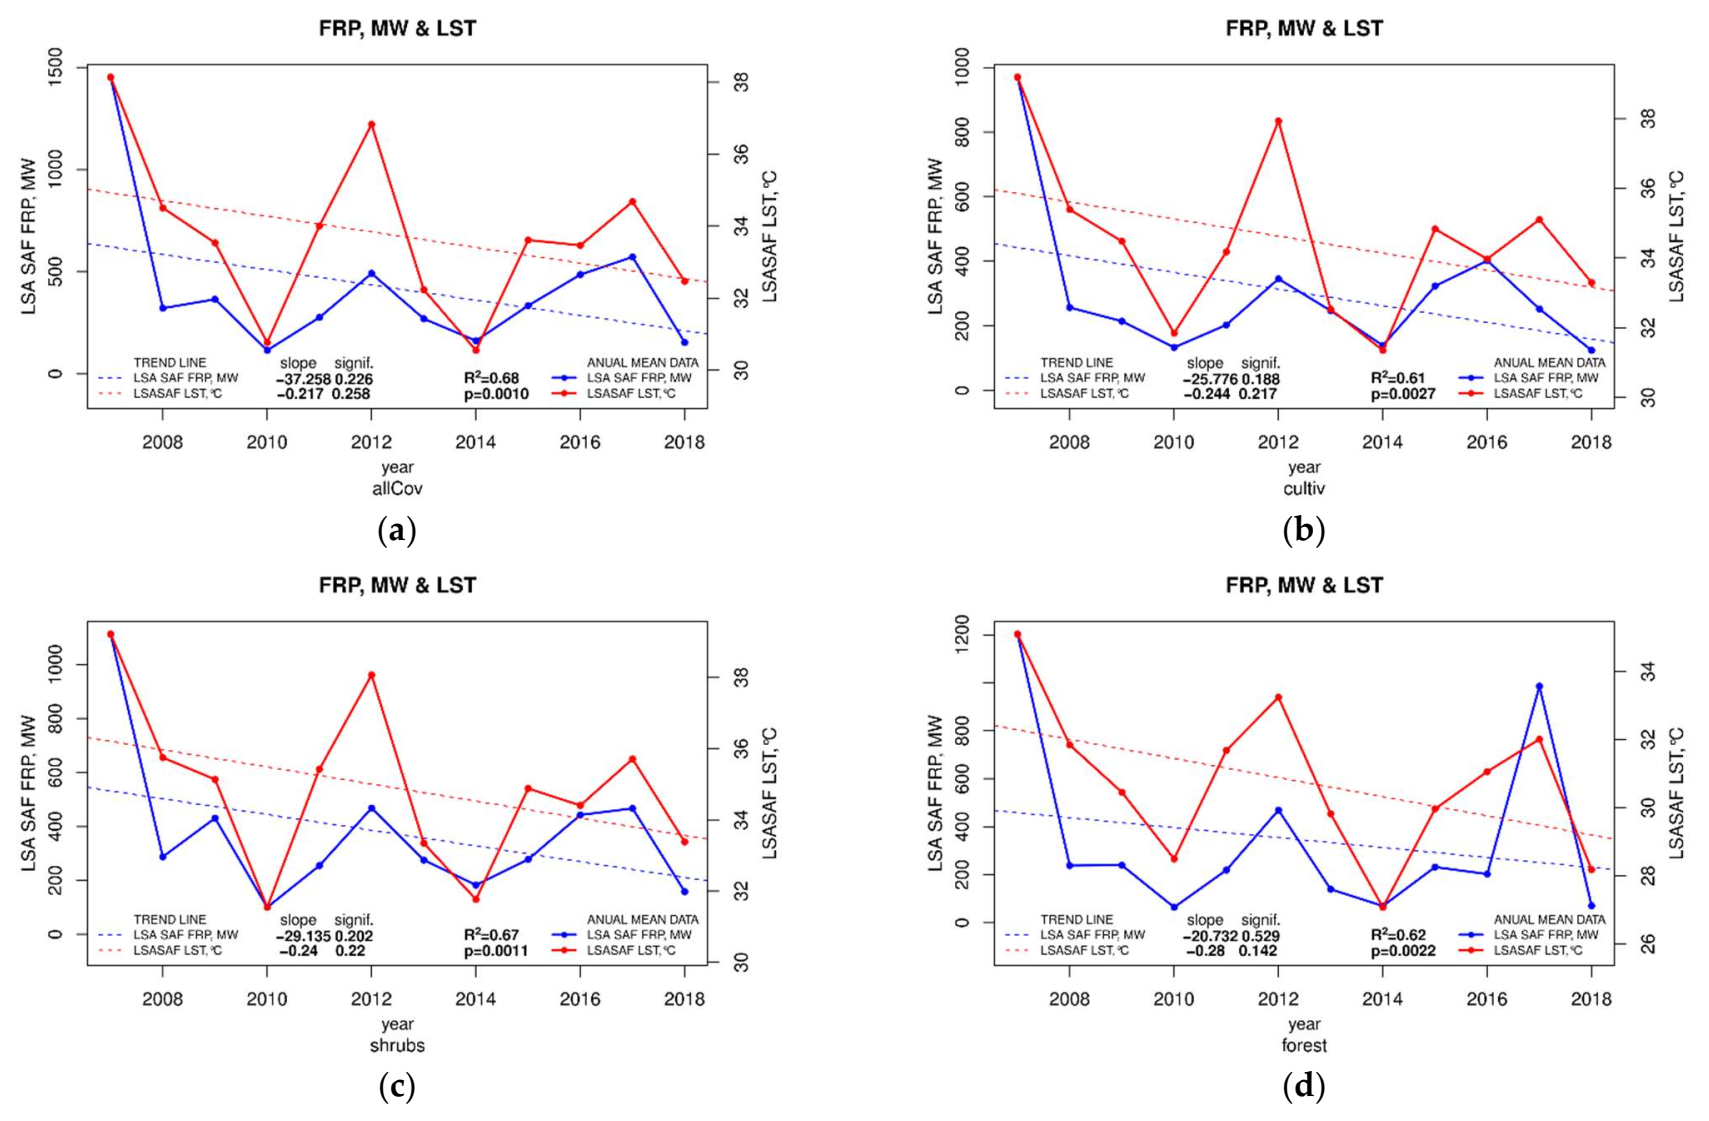
3.2.1. Annual Trends in Fire Activity along with LST

Figure 5 shows a comparison of LST (at 0900 UTC) with the fire energy released according to the FRP-Pixel product (MW). The course of LST over time (red lines) shows behavior synchronized with fire energy (blue lines) for all vegetation types. The sample size allows a regression analysis to be applied, and the results show an existing linear relationship between the parameters: Trend lines of both parameters, LST (red dashed line) and FRP, MW (blue dashed line), for the considered LC types were obtained (Figure 5a–d). The coefficient of determination R2, which is the square of the correlation, shows how much of the observed scatter in the data is due to the hypothetical linear component as opposed to the unexplained random error. Despite the rather complex nature of the curves, the resulting R2 values confirm a significant linear component (values bottom right in the panels).
Figure 5a shows the trend lines for LST and the energy released from biomass burning for a sample of all land cover types without classifying them (“all LC”); the linear regression line fits the relation between the parameters at high R2 values of 0.68. The values of R2 for forest-shrubs-cultivated types vary between 0.61 and 0.68, and the validity of these conclusions passed the significant test from 0.001 up to 0.003 levels (Figure 5b–d). The FRP (blue lines) decreases with the decrease in LST (red lines) within individual diapason for biomes (e.g., 32–29 °C for forest and 36–34 °C for shrubs/cultivated, as seen in Figure 5c,d). A high level of fit between the trends in the number of fire pixels and the LST as a biophysical driver is also experienced (Supplementary Material). In this case R2 varies within 0.67–0.62 for shrubs and forest vegetation types, at high significant levels, indicating a descending trend for the fire accuracy along with the LST decrease.
To clarify the nature of this linear structure, it is examined by linear regression on the individual components in each data pair. Again, the results are similar (values in the bottom left panel in Figure 5), although at the limit of reliability. For at least one group in each pair, a linear model with a similar slope of about −0.25 is obtained, and its significance level is slightly above 0.10. Therefore, for at least one pair, a significant confirmation of the estimated downward trend line was obtained.

3.3. Statistical Analyses

Monthly wildfire activity (2007–2018) characterized by the number of fire pixel according to the LSASAF FRP-Pixel product, and the ratio between the total energy released (MW) and the total number of fire pixels detected for a specific month and LC type are shown in Table 2. The number of fire pixels in forest and shrubs in June represents 6.5–7.6% percent of the fire pixels detected in July. Fires in cultivated LC in June seem lower by about 5% than their amount in July due to the specific vegetation in the managed LC areas still being in the growing phase. For September, the wildfires (forest, shrubs) from the forest fires in August are at 37% and 50% from the shrub fires in the same month. However, in the cultivated LC, the relatively large number of fire pixels are detected in September (75% from their number in August), which is likely due to some controlled agriculture burning activities.
The ratio between the total FRP energy released and the accumulated number of fire pixels at a specific LC type was introduced to serve as a measure of mean Detected Fire Intensity (DFI) observed by the satellite. The DFI from the forest fire pixels is the lowest one, ranging from 35 MW/pixel in June to 96 MW/pixel in August. For shrubs and cultivated LC types, the DFI range is 72–101 MW/pixel and 70–107 MW/pixel, respectively.
The satellite-derived FRP are likely to estimate a specific portion of the actual fire-emitted FRP (see Section 2.1). Data in Table 2 show that shrubs LC is characterized by the largest amount of total energy released by fires for the summer season. In order to assess how the portion of satellite-detected fire energy depends on the vegetation type during the fire season, the DFI values of forest and cultivated LC are divided by the DFI obtained for shrubs in each month (Table 3). It can be seen that the ratio between the DFI parameters of forest and shrubs is 0.48 in June, then increases gradually to 0.95 in August and becomes 0.89 in September. At the same time, the ratio between the DFI values for cultivated–shrubs LC is close to 1.0, ranging from 0.96 in June to 1.06 in August–September. This result comes from the different ability of satellite observations (FRP product) to estimate actual emitted energy from wildfires at different LC types, and this also depends on the biophysical status of the vegetation along the fire season.

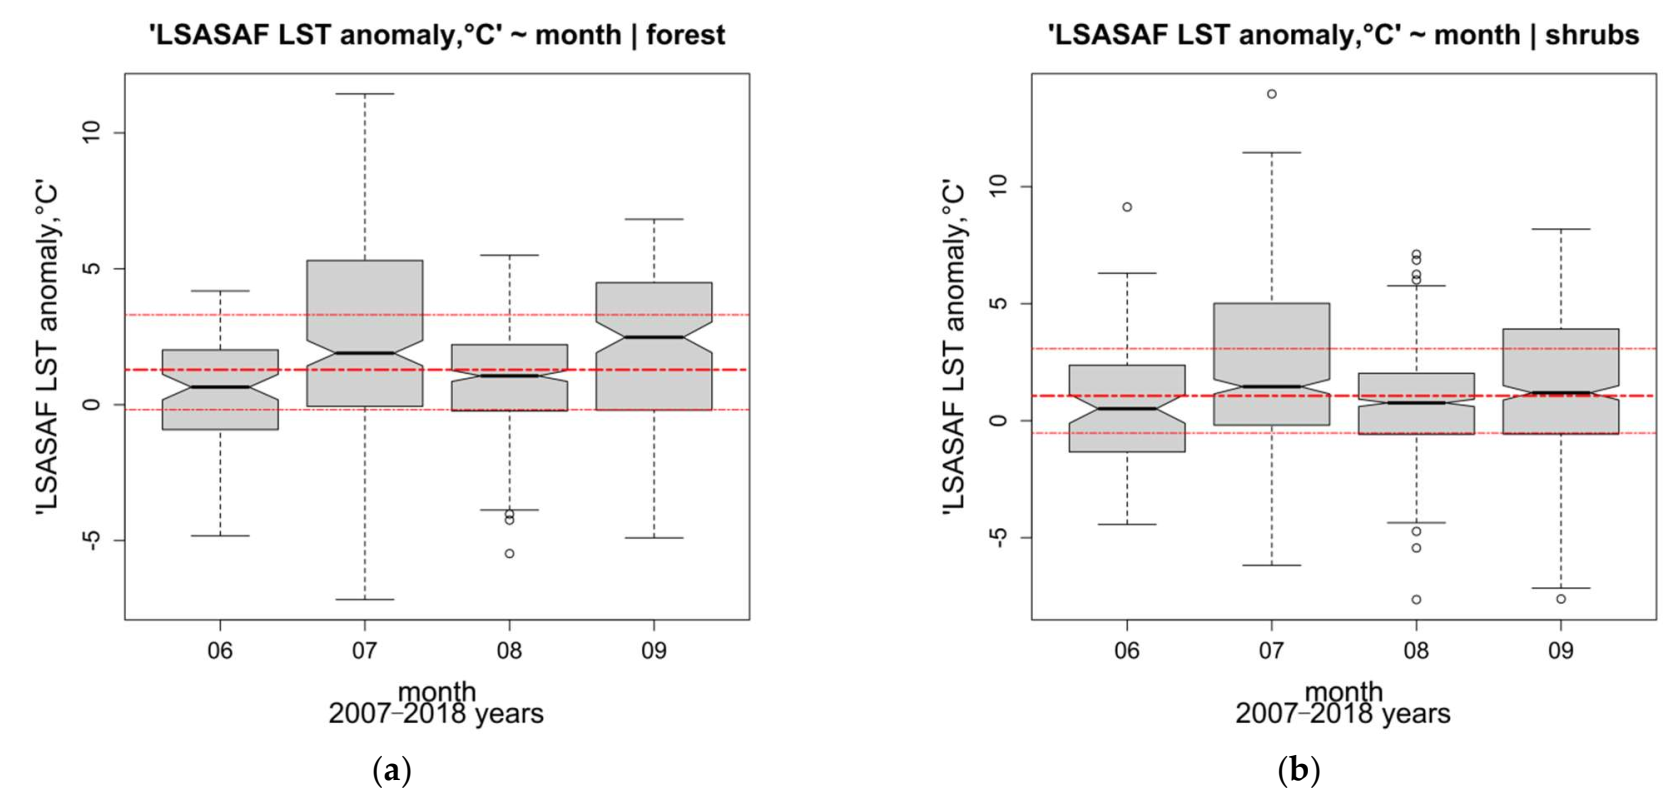
3.3.1. Box Plots Analyses

Boxplots of the distribution of fire radiative energy (MW) according to the FRP-Pixel product and biophysical indexes for forest and shrubs LCs are shown in Figure 6 and Figure 7.
The plots in Figure 6 show different aggregation of data by months. Through a visual comparison of the corresponding notches, it can be seen that there is sufficient reason to accept the statistical hypothesis that the medians are significantly different. The red lines show the median and first and fourth quartile averages of the same statistics for all individual boxplots presented and are used to visually assess the degree of difference depending on the month.
The boxplots in Figure 6a,b demonstrate the variability of the monthly mean values of FRP (MW) for forest and shrubs LC during the summer. The statistical analyses confirm that for July, the ratio between the median of total FRP box plots for shrubs and forest fires is higher than the corresponding ratio for the DFI parameter in Table 3: shrub fires were detected with about 50% higher released FRP (MW), while the DFI parameter was only 35% larger than this for forest fires. This effect seems to be due to higher energy emitted by some forest fires in July.
On the contrary, for June, the medians of total FRP are not much different for these two LC types (Figure 6a,b), but the DFI parameter is twice higher for shrubs than the corresponding DFI value obtained for forest fires (Table 3). This suggests the occurrence of more forest fires under the canopy of dry dead forest fuel with much less energy measured by the satellite and that a certain amount of radiant energy may have been intercepted (scattered and absorbed) by the forest canopy.
The summer course of the FRP median corresponds well to the LST statistical behavior for the forest LC (Figure 6a,c). In June, optimal SMA is present in the deep forest root zone that leads to fully open stomata conductance and unlimited evapotranspiration, leading to decreasing canopy temperature and minimum LST. For shrubs (Figure 6b,d), there is a disagreement: the LST median maximum appears in August, but the maximum of the total FRP median is in July. The reason could be that in shrub lands, the SMA easily reaches the wilting point, in which the stomata conductance strongly decreases in reaction to the increasing water stress conditions through the transpiration regulation mechanism. These lead to an increasing shrub canopy LST in August.
All fires in the period of July–September occur in days associated with positive values of LST anomalies (averaged in the area of 3 × 3 pixels) around the same location (Figure 7a,b). All 25% of the fire detections in the days associated with negative anomalies of LST occur in June in forest and shrubs LCs. This result suggests that in June, some fires may mostly occur in dead fuel where the canopy temperature is below the historical average for today’s day-of-year.
The trend of increasing (LST-T2m) from June to September (Figure 7c,d) corresponds to the gradual decrease of SMA to vegetation cover on the one hand, and to the increasing LST on the other. This is consistent with the result on the disagreement in the behavior of LST versus FRP in August for shrubs LC (Figure 6b,d).

3.3.2. Quantile Regression

Results from the quantile regression analysis of the relationship between log FRP (MW) and biophysical parameters (LST, LST anomalies, (LST-T2m), and SMA anomalies) are presented on Figure 8a–d.
These graphs can quite comprehensively characterize the dependences between each pair of quantities. QR examples of the “all LC” type are here presented. Figure 8a shows at which LST values the maximum FRP (MW) might be expected and the corresponding probability level the FRP might reach the maximum. Accordingly, the QR in Figure 8a shows how the log(FRP, MW) maximum depends on the predictor LST, with a confidence of 5%, 25%, and other levels of significance. The QR lines indicate that the high values of the log(FRP, MW) > 5 can be expected to occur at LST = 35 °C with a 25% probability level; extreme values of log(FRP, MW) > 7 are possible with 5% reliability at LST above 40 °C, and with 10% reliability above 45 °C.
On the plot of Figure 8b, the probability level of FRP maxima at a specific temperature difference (LST-T2m) is illustrated. Very high values of log(FRP, MW) > 6 can be expected to occur at (LST-T2m) = 5 °C with 10% reliability; extreme values of log(FRP, MW) > 7 are possible at a 5% significance level for (LST-T2m) above 12 °C. This illustrates how the log(FRP, MW) maximum depends on the predictor (LST-T2m), with confidence levels of 5%, 10%, and other levels of significance.
The QR between FRP and LST anomalies (Figure 8c) shows that very high values of log(FRP, MW) > 6 can be expected to occur at negative LST anomalies, with a probability of less than 10%. Extreme values of log(FRP, MW) > 7 are not possible even at a 5% significance level, with negative LST anomalies. In parallel, higher FRP energy occurs at negative SMAI anomalies (Figure 8d). The decreasing trend of energy released, along with the decreasing values of negative or low positive anomalies, i.e., decreasing drought (agricultural and ecological), at corresponding probability levels are shown. Extreme values of log(FRP, MW) > 7 are possible at 10% significance with negative SMAI anomalies.
Such QR graphs have been developed for forest, shrubs, and cultivated vegetation types and confirm similar relations for the fire activity over the whole country. The results obtained for some smaller samples over specific regions of Bulgaria show an intersection of the probability lines that is an indication of insufficient data.

3.3.3. Correlation Analyses

The results of the least-squares method applied for the quantitative evaluation of the relation between biogeophysical indexes (LST, LST anomaly, (LST−T2m) temperature difference, including the SMAI anomaly at 20, 50, 100 cm depth) and the severity of wildfire events are presented in Table 4. Monthly means LST at around 0900 UTC, which is 1200 local time (selected as a less cloudy period), are considered. For all land cover types (all biomes included in a sample), exponential regression lines fit the relations at high R2 values and high significance levels (Figure 9).
The SMA index is especially efficient as a measure of fuel dryness, taken at 50 cm or 100 cm soil depth, for all cover types in the period of July–August. With the progressive establishment of dry conditions during August and September, the correlation decreases when the SMA at 20 cm and 50 cm becomes fully exhausted, and the SMAI is equivalent to a constant value of zero.
Exponential regression models better fit the FRP (MW)–LST relations from Table 4. Examples for cultivated LC are shown in Figure 9a–c, indicating high significance levels (p < 0.007) of the dependences for July, August, and September. Similar exponential models for the regression of FRP (MW) versus the LST anomalies, R2 at about 0.6 (p < 0.003), are presented in (Figure 9d–f). Results confirm a statistically significant high correlation between biophysical drivers (LST, LST anomalies) and the wildfire severity.
All these results suggest that the biophysical index LST and the related parameters LST anomalies and (LST-T2m) are sensitive to the dynamics of the occurrence and severity of vegetation fires in all studied LC types.

3.3.4. Spatial Pattern and Trends

To characterize fire activity, plots of monthly sums of FRP detections are considered. Figure 10 shows a color-coded map of accumulated fire pixels in the period of June–September 2004–2019. The fire numbers are categorized into the following classes: 1–30 (low, yellow color), 30–90 (moderate, orange color), 90–150 (high, red color), and >150 (extreme, dark red). Thus, the spatial distribution of the spots with higher fire activity is revealed. The “+” sign on the map indicates that the trend passed the Mann–Kendall significance test at the 5% level; thus, regions with a statistically significant positive trend in fire activity over the studied period are localized.
The long-term trends of fire activity (number of detections) are different when it is delineated into different land cover types (superposition of Figure 1b and Figure 10). These considerations show that there is no positive trend of fire activity in regions with forest land cover types. There are limited hot spots for fires, located in the northern and southeastern parts of Bulgaria, indicating an increasing trend in fire activity that is mostly scattered in the shrublands. Positive trends are also seen in limited areas of cultivated land cover types, but in this case, it is rather a result of human activities than a climate trend.

4. Discussion

The results of our study confirm the driving role of land surface temperature and the related biophysical parameters in the spatial–temporal evolution of fire activity in Eastern Mediterranean as well as in forcing the vulnerability of forest, shrubs, and cultivated land cover types to wildfire. Based on the 2007–2018 summer time series, the trend analyses (Section 3.2.1) show the synchronized behavior of annual LST values with the released FRP energy (MW) from biomass burning (respectively to the number of fire pixels). The analysis of satellite retrievals from geostationary satellite data show a statistically significant declining trend for the wildfire characteristics, consistent with the course of LST for all considered vegetation types (Figure 3).
The box-plot statistics (Figure 6a,c) show that the median of the FRP (MW) energy released from forest fires in the summer course corresponds well to the behavior of the LST median, which confirms the relationship between the biophysical index LST and fire activity. All fires in the period of July–September occurred in days associated with positive values of LST anomalies, while the other 25% of the fire detections in days associated with negative anomalies of LST occurred in June at forest and shrubs LCs (Figure 7a,b).
A high correlation between the monthly mean values of the biophysical indexes (LST, LST anomalies, LST-T2m, and SMA) and FRP-detected fire pixels was obtained. Exponential regression models fit the relations for all LC types at high significance levels (Section 3.3.3). This result is a step forward from the findings of Song [21], who stressed on the spatial–temporal information provided by LST anomalies (2001–2019 time series over Australia) on fire activity, confirming a significant trend before the fire events but not establishing a linear relationship with fires.
The values of LST, LST anomalies, and LST-T2m, for which the maximum FRP (MW) values might be expected at the corresponding probability level, were statistically estimated (Section 3.3.2) as being able to contribute to fire preparedness activities. For example, extreme values of log(FRP, MW) > 7 were possible at a 5% significance level for (LST-T2m) above 12 °C. A previous study reported that forest fires in August over Bulgaria might occur under land surface drought conditions defined by middy (MSG LST-T2m difference) >12 °C prior to the fire [62].
These dependences obtained for the Eastern Mediterranean confirm and extend the reported results in the literature that land surface state can significantly contribute to the enhancement of weather impacting on the fire environment such as drought (long-term and/or short-term), terrain, and fuel conditions [62,75,76]. Plants constitute the main ignition material in the landscape, and their moisture content plays an important role because it may serve to retard ignition or mitigate the propagation of a fire [77,78,79,80]. For this reason, the fuel moisture content is a common component of fire danger and related fire regime assessments; e.g., in [81,82]. Skin temperature is an important disclosure of fuel moisture content, and the results reported confirm the role of LST as a biophysical index of fire activity. The physical mechanism of LST–SMA relations and related fire occurrence covers a range of coupled biophysical processes: as a moist soil surface dries out, more of the incoming solar energy is reflected, and a larger fraction of the absorbed energy is used to heat the air and soil [83]. The heat flow into the soil increases at first, then decreases as the soil becomes very dry [84]. This results in increasing land surface temperatures, which also influences the rate of drying and evapotranspiration. As a result, high LST is a cause and product of dry periods; in other words, drought begets drought and extreme fire activity.
Land surface temperature explains 80% of the variance in air temperature, and vegetation density also plays an important role in explaining the air temperature variance [85]. Since only data from days with detected fires in the summer months were considered, most of the results of the statistical analyses are related to conditions of limited SMA for the vegetation cover. In such conditions, the (LST-T2m) parameter is a measure of the evapotranspiration rate, and relations are specified by atmosphere/land weather and climate conditions as well as by physiological and structural features of the LC [86,87] Hence, the trend of increasing (LST-T2m) from June to September (see Figure 7c,d) is related to gradually decreasing evapotranspiration during the summer months due to the gradual decrease of SMA to vegetation cover on the one hand, and/or the increasing LST on the other.
All these results suggest that the biophysical index LST and the related parameters of LST anomalies and (LST-T2m) are sensitive to the dynamics of vegetation fire occurrence and severity. The dependences are valid for forest, shrubs, and cultivated LCs at high significant levels and indicate that satellite IR retrievals of radiative temperature is a reliable source of information for vegetation dryness and fire occurrence. Some existing mismatches are due to highly inhomogeneous land cover from one side and the complicated nature of their biogeophysical relations. LST is directly linked to precipitation, cloudiness, and solar irradiance, while SMAI is influenced by the cumulative effect of these meteorological parameters and with functional links to vegetation. In the case of when the period of moisture depletion is long, the LST-SMA relation is weak because the LST continues to increase; on the other hand, after full SM depletion, the “SVAT_bg” model does not assess any further SM changes. In terms of the model simulations, full SM depletion denotes an interruption of liquid and water vapor flow because SM has reached its constant minimum value (at specific soil/climate), which is set to be the maximum hygroscopic value [69].
In addition, there are some limitations in the remote sensing approach for assessing the relation of fire activity to the distribution of its biophysical drivers. Such cases may be due to different abilities of the satellite observations and the derived FRP product to estimate actual emitted energy from wildfire in different LC types, and this also depends on the biophysical status of the vegetation during the fire season. This ability of FRP is significantly different as compared to wildfires in the forest and shrubs LCs in June (reported here, Table 2 and Figure 6a,b) due to the specific physical properties of the forest canopy, which leads to larger amounts of radiant energy to be intercepted. This in turn makes some of the low-energy forest fires impossible to be detected by the satellite. In August and September, with the decrease in SMA and the fraction of vegetation cover, the canopy biophysical properties changed so that a larger amount of energy released by forest fires could be evaluated by satellite measurements, and most of the forest fires could be detected as well.
Although landscape fires in Mediterranean countries are mainly caused by human activities related to agricultural practices, this study confirms that fire regime components (occurrence and severity) exhibit characteristic spatial and temporal patterns that reflect differences in the relative importance of various environmental drivers. In this regard, an identification of the regions most vulnerable to biomass burning is of importance for some prevention activities. Different land covers have widely differing flammability, which depends on species composition, stand age and density, microclimate, and soil conditions [31,88]. For this reason, a detailed discrimination of the land cover types is needed in studying short-term weather and land surface state influences on the fire ignition and spread. In our study, the LC typology is simplified to consider three types: forests, scrubland, and cultivated; this is because relationships between monthly mean values of the physical indexes and fire activity are explored over long-term 12-year periods. Moreover, the forest LC is considered to be spatially stable throughout all 12 years while more land cover changes may occur in the category scrubland during the observation period, and more detailed classification would be difficult to apply. Our qualitative comparative analysis of the ESA CCI LC maps for 2006–2015 does not show any significant changes in the land cover over Bulgaria for the test period.
Recent concerns about the potential increases of forest fires under climate change underline the importance of fire–climate feedbacks [89,90,91]. In this context, an important result of our study based on a dataset of satellite FRP detections from the last 16 years is that no positive trend in fire activity for forest land cover type has been observed over Bulgaria. There are significant increasing trends in fire activity for single spots in the low land areas of shrubs LC types in the northern and southeastern part of Bulgaria. A reasonable explanation for these results is that the forests are a more stable environment over a long-term period, which also confirms the validity of our approach for the simplification of the LC variety into three main types for the purposes of the current climate study.

5. Conclusions

This study quantified the relationship between the spatial–temporal variability of land surface temperature (LST) and fire activity on a short-term climatic scale over the Eastern Mediterranean (Bulgaria), accounting for physical properties such as land cover and soil moisture that, combined with LST, provide a valuable metric for surface state. Based on satellite observations from the geostationary Meteosat LSASAF-FRP-Pixel product (summer season 2007–2018), the distribution of fire activity on a monthly/annual basis in relation to the biophysical forcing effect of LST (assessed by IR MSG satellite measurements) was observed in land cover types of different fire vulnerability (forest, shrubland, cultivated).
A synchronized annual behavior between LST and FRP with a declining trend (2007–2018) in wildfire characteristics was seen. Exponential models fit the relationships of LST monthly means, LST anomalies, and LST-T2, as a first proxy of sensible heat exchange with atmosphere, as well as SMA with FRP fire characteristics (MW). All fires in the period of July–September occurred in days associated with positive LST anomalies.
The values of LST, LST anomalies, and LST-T2m, for which the maximum FRP energy (MW) might be expected at corresponding probability levels, were estimated as being capable of contributing to fire preparedness activities. For example, monthly mean extremes of log(FRP, MW) > 7 could be observed with a 5% reliability at an LST monthly mean above 40 °C and (LST-T2m) above 12 °C, and with a 10% reliability above 45 °C. The reported biophysical forcing effects of LST on vegetation fires provided more understanding of the relationships between drought and wildfire; more specifically, of how drought is related to fire danger outputs. Since forest fires have the potential to affect regional climate through changes in the energy budget [91,92,93], this knowledge is especially important for the Mediterranean region, where land–atmosphere coupling has become one of the important aspects of global environmental change.
To advance the added value of this study by using LST as a biophysical index of drought for fire management, further evidence in support of this approach is observed: First, the use of related FRP products from the MODIS sensor to validate the usefulness of this approach for short-term applications; Second, the evaluation and adaptation of the LST applications in the operational mode for the analyses of real fire situations in the scope of early warnings of fire risk assessment, thus contributing as the final step in the fire management practice.

Supplementary Materials

The following supporting information can be downloaded at: https://www.mdpi.com/article/10.3390/rs14071747/s1, Figure S1: (a) FRPdetections & LST.shrubs. (b) FRPdetections & LST.cultiv; Figure S2: (a) July and September 2007–2018 Shrubs LC. (b) August 2007–2018 Shrubs LC; Figure S3: (a) FRP-Pixel_detections.SMA_anomaly_at_50cm_depth.forest.montly.7; (b) FRP-Pixel_detections.SMA_anomaly_at_50cm_depth.forest.montly.8; (c) FRP-Pixel_detections.SMA_anomaly_at_50cm_depth.shrubs.montly.7.

Author Contributions

Conceptualization, J.S.S.; methodology, J.S.S. and C.G.G.; software, C.G.G. and P.N.N.; formal analysis, C.G.G. and P.N.N.; investigation, J.S.S.; writing—original draft preparation, J.S.S.; writing—editing, J.S.S. and C.G.G.; project administration, J.S.S.; funding acquisition, J.S.S. All authors have read and agreed to the published version of the manuscript.

Funding

This research was partially funded by EUMETSAT LSASAF Project, CDOP-3, 2017–2022.

Data Availability Statement

Data is available at EUMETSAT Product Navigator. Available online: https://navigator.eumetsat.int/start (accessed on 24 February 2022).

Acknowledgments

Data processing and preparation of illustration material in Section 2.5 and Section 3.1 were performed by Andrey Kulishev within the frame of the LSASAF project implementation. LSASAF is acknowledged for providing the requested LST and FRP data. Data in Section 2.3 have been kindly provided by the State Forest Agency of Bulgaria. Thanks are due to the anonymous reviewers for the valuable suggestions and comments.

Conflicts of Interest

The authors declare no conflict of interest. The funder had no role in the design of the study; in the analyses, or interpretation of data; in the writing of the manuscript, or in the decision to publish the results.

References

  1. Bradstock, R.A. A biogeographic model of fire regimes in Australia: Current and future implications. Global Ecol. Biogeogr. 2010, 19, 145–158. [Google Scholar] [CrossRef]
  2. Krawchuk, M.A.; Moritz, M.A. Constraints on global fire activity vary across a resource gradient. Ecology 2011, 92, 121–132. [Google Scholar] [CrossRef] [PubMed]
  3. Vlassova, L.; Pérez-Cabello, F.; Mimbrero, M.R.; Llovería, R.M.; García-Martín, A. Analysis of the Relationship between Land Surface Temperature and Wildfire Severity in a Series of Landsat Images. Remote Sens. 2014, 6, 6136–6162. [Google Scholar] [CrossRef] [Green Version]
  4. Liu, Z.; Ballantyne, A.P.; Cooper, L.A. Biophysical feedback of global forest fires on surface temperature. Nat. Commun. 2019, 10, 214. [Google Scholar] [CrossRef] [PubMed] [Green Version]
  5. Bowman, D.M.; Balch, J.; Artaxo, P.; Bond, W.J.; Cochrane, M.A.; D’Antonio, C.M.; DeFries, R.; Johnston, F.H.; Keeley, J.E.; Krawchuk, M.A.; et al. The human dimension of fire regimes on Earth. J. Biogeogr. 2011, 38, 2223–2236. [Google Scholar] [CrossRef] [Green Version]
  6. Hessl, A.E. Pathways for climate change effects on fire: Models, data, and uncertainties. Prog. Phys. Geogr. 2011, 35, 393–407. [Google Scholar] [CrossRef]
  7. Jensen, D.; Reager, J.T.; Zajic, B.; Rousseau, N.; Rodell, M.; Hinkley, E. The sensitivity of US wildfire occurrence to pre-season soil moisture conditions across ecosystems. Environ. Res. Lett. 2018, 13, 014021. [Google Scholar] [CrossRef]
  8. Chuvieco, E.; Aguado, I.; Dimitrakopoulos, A.P. Conversion of fuel moisture content values to ignition potential for integrated fire danger assessment. Can. J. For. Res. 2004, 34, 2284–2293. [Google Scholar] [CrossRef]
  9. Bartsch, A.; Balzter, H.; George, C. The influence of regional surface soil moisture anomalies on forest fires in Siberia observed from satellites. Environ. Res. Lett. 2009, 4, 045021. [Google Scholar] [CrossRef] [Green Version]
  10. Krueger, E.S.; Ochsner, T.E.; Engle, D.M.; Carlson, J.D.; Twidwell, D.L.; Fuhlendorf, S.D. Soil Moisture Affects Growing-Season Wildfire Size in the Southern Great Plains. Soil Sci. Soc. Am. J. 2015, 79, 1567–1576. [Google Scholar] [CrossRef]
  11. Krueger, E.S.; Ochsner, T.E.; Quiring, S.M.; Engle, D.M.; Carlson, J.D.; Twidwell, D.; Fuhlendorf, S.D. Measured soil moisture is a better predictor of large growing-season wildfires than the Keetch-Byram drought index. Soil Sci. Soc. Am. J. 2017, 81, 490–502. [Google Scholar] [CrossRef]
  12. Seneviratne, S.I.; Corti, T.; Davin, E.L.; Hirschi, M.; Jaeger, E.B.; Lehner, I.; Orlowsky, B.; Teuling, A.J. Investigating soil moisture–climate interactions in a changing climate: A review. Earth Sci. Rev. 2010, 99, 125–161. [Google Scholar] [CrossRef]
  13. Burapapol, K.; Nagasawa, R. Mapping soil moisture as an indicator of wildfire risk using landsat 8 images in Sri Lanna National Park, Northern Thailand. J. Agric. Sci. 2016, 8, 107. [Google Scholar] [CrossRef]
  14. Kustas, W.; Anderson, M. Advances in thermal infrared remote sensing for land surface modeling. Agric. For. Meteorol. 2009, 149, 2071–2081. [Google Scholar] [CrossRef]
  15. Monson, R.; Baldocchi, D. Terrestrial Biosphere-Atmosphere Fluxes; Cambridge University Press: Cambridge, MA, USA, 2014; p. 487. [Google Scholar]
  16. Lambin, E.; Goyvaerts, K.; Petit, C. Remotely-sensed indicators of burning efficiency of savannah and forest fires. Int.J. Remote Sens. 2003, 24, 3105–3118. [Google Scholar] [CrossRef]
  17. Veraverbeke, S.; Verstraeten, W.W.; Lhermitte, S.; van de Kerchove, R.; Goossens, R. Assessment of post-fire changes in land surface temperature and surface albedo, and their relation with fire–burn severity using multitemporal MODIS imagery. Int. J. Wildland Fire 2012, 21, 243–256. [Google Scholar] [CrossRef] [Green Version]
  18. Maffei, C.; Alfieri, S.M.; Menenti, M. Relating Spatiotemporal Patterns of Forest Fires Burned Area and Duration to Diurnal Land Surface Temperature Anomalies. Remote Sens. 2018, 10, 1777. [Google Scholar] [CrossRef] [Green Version]
  19. Beringer, J.; Hutley, L.; Tapper, N.; Coutts, A.; Kerley, A.; O’grady, A. Fire impacts on surface heat, moisture and carbon fluxes from a tropical savanna in Northern Australia. Int. J. Wildland Fire 2003, 12, 333–340. [Google Scholar] [CrossRef]
  20. Yang, H. Land Surface Temperature Anomalies and Fire Occurrence. The Relationship between Land Surface Temperature Anomalies and Fire Occurrence in Cariboo Region in 2017. 2021. Available online: https://storymaps.arcgis.com/stories/06a6acff8a544fb187b2cb4ce262e614 (accessed on 23 February 2022).
  21. Song, W. Relating Forest Fire Occurrences to Diurnal Land Surface Temperature Anomalies in Victoria, Australia from 2001 to 2019. 2021. Available online: https://open.library.ubc.ca/collections/researchdata/items/1.0396657 (accessed on 24 February 2022).
  22. Nakayama, M.; Maki, M.; Elvidge, C.D.; Liew, S.C. Contextual algorithm adapted for NOAA-AVHRR fire detection in Indonesia. Int. J. Remote Sens. 1999, 20, 3415–3421. [Google Scholar] [CrossRef]
  23. Justice, C.O.; Giglio, L.; Korontzi, S.; Owens, J.; Morisette, J.T.; Roy, D.; Descloitres, J.; Alleaume, S.; Petitcolin, F.; Kaufman, Y. The MODIS fire products. Remote Sens. Environ. 2002, 83, 244–262. [Google Scholar] [CrossRef]
  24. Giglio, L.; Descloitres, J.; Justice, C.O.; Kaufman, Y.J. An enhanced contextual fire detection algorithm for MODIS. Remote Sens. Environ. 2003, 87, 273–282. [Google Scholar] [CrossRef]
  25. Giglio, L.; Csiszar, I.; Restás, Á.; Morisette, J.T.; Schroeder, W.; Morton, D.; Justice, C.O. Active fire detection and characterization with the advanced spaceborne thermal emission and reflection radiometer (ASTER). Remote Sens. Environ. 2008, 112, 3055–3063. [Google Scholar] [CrossRef]
  26. Schroeder, W.; Oliva, P.; Giglio, L.; Quayle, B.; Lorenz, E.; Morelli, F. Active fire detection using Landsat-8/OLI data. Remote Sens. Environ. 2016, 185, 210–220. [Google Scholar] [CrossRef] [Green Version]
  27. Ardakani, A.S.; Valadan Zoej, M.J.; Mohammadzadeh, A.; Mansourian, A. Spatial and temporal analysis of fires detected by MODIS data in northern Iran from 2001 to 2008. IEEE J. Sel. Top. Appl. Earth Obs. Remote Sens. 2011, 4, 216–225. [Google Scholar] [CrossRef]
  28. Palumbo, I.; Grégoire, J.; Simonetti, D.; Punga, M. Spatio-temporal distribution of fire activity in protected areas of Sub-Saharan Africa derived from MODIS data. Procedia Environ. Sci. 2011, 7, 26–31. [Google Scholar] [CrossRef]
  29. Molinario, G.; Davies, D.K.; Schroeder, W.; Justice, C.O. Characterizing the spatio-temporal fire regime in Ethiopia using the MODIS-active fire product: A replicable methodology for country-level fire reporting. Afr. Geogr. Rev. 2014, 33, 99–123. [Google Scholar] [CrossRef]
  30. Chuvieco, E. Global characterization of fire activity: Toward defining fire regimes from Earth observation data. Glob. Chang. Biol. 2008, 14, 1488–1502. [Google Scholar] [CrossRef]
  31. Wei, X.; Wang, G.; Chen, T.; Fiifi, D.; Hagan, T.; Ullah, W. A Spatio-Temporal Analysis of Active Fires over China during 2003–2016. Remote Sens. 2020, 12, 1787. [Google Scholar] [CrossRef]
  32. Prins, D.M.; Menzel, W.P. Geostationary satellite detection of biomass burning in South America. Int. J. Remote Sens. 1992, 13, 2783–2799. [Google Scholar] [CrossRef]
  33. Prins, E.M.; Feltz, J.M.; Menzel, W.P.; Ward, D.E. An overview of GOES-8 diurnal fire and smoke results for SCAR-B and 1995 fire season in South America. J. Geophys. Res. Atmos. 1998, 103, 31821–31835. [Google Scholar] [CrossRef]
  34. Roberts, G.; Wooster, M.J.; Perry, G.L.W.; Drake, N.; Rebelo, L.-M.; Dipotso, F. Retrieval of biomass combustion rates and totals from fire radiative power observations: Application to southern Africa using geostationary SEVIRI imagery. J. Geophys. Res. 2005, 110, D21111. [Google Scholar] [CrossRef] [Green Version]
  35. Roberts, G.; Wooster, M.J. Fire detection and fire characterization over Africa using Meteosat SEVIRI. IEEE Trans. Geosci. Remote Sens. 2008, 46, 1200–1218. [Google Scholar] [CrossRef] [Green Version]
  36. Wooster, M.J.; Roberts, G.; Freeborn, P.H.; Xu, W.; Govaerts, Y.; Beeby, R.; He, J.; Lattanzio, A.; Mullen, R. Meteosat SEVIRI Fire Radiative Power (FRP) Products from the Land Surface Analysis Satellite Applications Facility (LSA SAF): Part 1-Algorithms, Product Contents & Analysis. Atmos. Chem. Phys. 2015, 15, 15831–15907. [Google Scholar]
  37. Govaerts, Y.; Wooster, M.; Roberts, G.; Freeborn, P.; Xu, W.; He, J.; Lattanzio, A. Algorithm Theoretical Basis Document for MSG SEVIRI Fire Radiative Power (FRP) Characterisation. 2015. Available online: https://nextcloud.lsasvcs.ipma.pt/s/Wc7xRm3soPwjj56 (accessed on 24 February 2022).
  38. Xu, W.; Wooster, M.J.; He, J.; Zhang, T. Improvements in high-temporal resolution active fire detec-tion and FRP retrieval over the Americas using GOES-16 ABI with the geostationary fire thermal anomaly (FTA) algorithm. Sci. Remote Sens. 2021, 3, 100016. [Google Scholar] [CrossRef]
  39. Xu, W.; Wooster, M.J.; Kaneko, T.; He, J.P.; Zhang, T.R.; Fisher, D. Major advances in geosttionary fire radiative power (FRP) retrieval over Asia and Australia stemming from use of Himarawi-8 AHI. Remote Sens. Environ. 2017, 193, 138–149. [Google Scholar] [CrossRef] [Green Version]
  40. Wooster, M.J.; Roberts, G.J.; Giglio, L.; Roy, D.P.; Freeborn, P.H.; Boschetti, L.; Justice, C.; Ichoku, C.; Schroeder, W.; Davies, D.; et al. Satellite remote sensing of active fires: History and current status, applications and future requirements. Remote Sens. Environ. 2021, 267, 112694. [Google Scholar] [CrossRef]
  41. Kaufman, Y.J.; Justice, C.O.; Flynn, L.P.; Kendall, J.D.; Prins, E.M.; Giglio, L.; Ward, D.E.; Menzel, W.P.; Setzer, A.W. Potential global fire monitoring from EOS-MODIS. J. Geophys. Res. 1998, 103, 32215–32238. [Google Scholar] [CrossRef]
  42. Wooster, M.J.; Zhukov, B.; Oertel, D. Fire radiative energy for quantitative study of biomass burning: Derivation from the BIRD experimental satellite and comparison to MODIS fire products. Remote Sens. Environ. 2003, 86, 83–107. [Google Scholar] [CrossRef]
  43. Ichoku, C.; Giglio, L.; Wooster, M.J.; Remer, L.A. Global characterization of biomass-burning patterns using satellite measurements of Fire Radiative Energy. Remote Sens. Environ. 2008, 112, 2950–2962. [Google Scholar] [CrossRef]
  44. Amraoui, M.; Liberato, M.; Calado, T.; Dacamara, C.; Coelho, L.; Trigo, R.; Gouveia, C. Fire activity over Mediterranean Europe based on information from Meteosat-8. For. Ecol. Manag. 2013, 294, 62–75. [Google Scholar] [CrossRef]
  45. Gao, X.; Giorgi, F. Increased aridity in the Mediterranean region under greenhouse gas forcing estimated from high-resolution simulations with a regional climate model. Glob. Planet. Change 2008, 62, 195–209. [Google Scholar] [CrossRef]
  46. Seneviratne, S.I.; Lüthi, D.; Litschi, M.; Schär, C. Land–atmosphere coupling and climate change in Europe. Nature 2006, 443, 205–209. [Google Scholar] [CrossRef] [PubMed]
  47. Stéfanon, M.; Drobinski, P.; D’Andrea, F.; Lebeaupin-Brossier, C.; Bastin, C. Soil moisture-temperature feedbacks at meso-scale during summer heat waves over Western Europe. Clim. Dyn. 2013, 42, 1309–1324. [Google Scholar] [CrossRef]
  48. Sifakis, N.I.; Iossifidis, C.; Kontoes, C.; Keramitsoglou, I. Wildfire Detection and Tracking over Greece Using MSG-SEVIRI Satellite Data. Remote Sens. 2011, 3, 524–538. [Google Scholar] [CrossRef] [Green Version]
  49. Di Biase, V.; Laneve, G. Geostationary Sensor Based Forest Fire Detection and Monitoring: An Improved Version of the SFIDE Algorithm. Remote Sens. 2018, 10, 741. [Google Scholar] [CrossRef] [Green Version]
  50. Gudmundsson, L.; Rego, F.C.; Rocha, M.; Seneviratne, S.I. Predicting above normal wildfire activity in southern Europe as a function of meteorological drought. Environ. Res. Lett. 2014, 9, 084008. [Google Scholar] [CrossRef]
  51. Trenberth, K.E.; Dai, A.; van der Schrier, G.; Jones, P.D.; Barichivich, J.; Briffa, K.R.; Shef-field, J. Global warming and changes in drought. Nat. Clim. Chang. 2014, 4, 17–22. [Google Scholar] [CrossRef]
  52. Aguado, I.; Chuvieco, E.; Borén, R.; Nieto, H. Estimation of dead fuel moisture content from meteorological data in Mediterranean areas. Applications in fire danger assessment. Int. J. Wildland Fire 2007, 16, 390–397. [Google Scholar] [CrossRef]
  53. Westerling, A.L.; Brown, T.J.; Gershunov, A.; Cayan, D.R.; Dettinger, M.D. Climate and wildfire in the western United States. Bull. Am. Meteorol. Soc. 2003, 84, 595–604. [Google Scholar] [CrossRef] [Green Version]
  54. Littell, J.S.; McKenzie, D.; Peterson, D.L.; Westerling, A.L. Climate and wildfire area burned in western US ecoprovinces, 1916–2003. Ecol. Appl. 2009, 19, 1003–1021. [Google Scholar] [CrossRef]
  55. Riley, K.L.; Abatzoglou, J.T.; Grenfell, I.C.; Klene, A.E.; Heinsch, F.A. The relationship of large fire occurrence with drought and fire danger indices in the western USA, 1984–2008: The role of temporal scale. Int. J. Wildland Fire 2013, 22, 894–909. [Google Scholar] [CrossRef]
  56. McEvoy, J.; Hobbins, M.; Brown, T.J.; VanderMolen, K.; Wall, T.; Huntington, J.L.; Svoboda, M. Establishing Relationships between Drought Indices and Wildfire Danger Outputs: A Test Case for the California-Nevada Drought Early Warning System. Climate 2019, 7, 52. [Google Scholar] [CrossRef] [Green Version]
  57. Brown, J.F.; Wardlow, B.D.; Tadesse, T.; Hayes, M.J.; Reed, B.C. The Vegetation Drought Response Index (VegDRI): A new integrated approach for monitoring drought stress in vegetation. GISci. Remote Sens. 2008, 45, 16–46. [Google Scholar] [CrossRef]
  58. Sohrabi, M.M.; Ryu, J.H.; Abatzoglou, J.T.; Tracy, J. Development of soil moisture drought index to characterize droughts. J. Hydrol. Eng. 2015, 20, 04015025. [Google Scholar] [CrossRef]
  59. Carrão, H.; Russo, S.; Sepulcre-Canto, G.; Barbosa, P. An empirical standardized soil moisture index for agricultural drought assessment from remotely sensed data. Int. J. Appl. Earth Obs. 2016, 48, 74–84. [Google Scholar] [CrossRef]
  60. Kotroni, V.; Cartalis, C.; Michaelides, S.; Stoyanova, J.; Tymvios, F.; Bezes, A.; Christoudias, T.; Dafis, S.; Giannakopoulos, C.; Giannaros, T.M.; et al. DISARM Early Warning System for Wildfires in the Eastern Mediterranean. Sustainability 2020, 12, 6670. [Google Scholar] [CrossRef]
  61. Stoyanova, J.S.; Georgiev, C.G. Drought and vegetation fires detection using MSG geostationary satellites. In Proceedings of the 2010 EUMETSAT Meteorological Satellite Conference, Córdoba, Spain, 20–24 September 2010. [Google Scholar]
  62. Stoyanova, J.S.; Georgiev, C.G.; Barroso, C. MSG land surface temperature product as a biogeophysical diagnostic parameter of terrestrial water status. In Proceedings of the 2012 EUMETSAT Meteorological Satellite Conference, Sopot, Poland, 7–10 September 2012. [Google Scholar]
  63. Anderson, M.C.; Norman, J.M.; Mecikalski, J.R.; Otkin, J.A.; Kustas, W.P. A climatological study of evapotranspiration and moisture stress across the continental United States based on thermal remote sensing: 2. Surface moisture climatology. J. Geophys. Res. Atmos. 2007, 112, D10117. [Google Scholar] [CrossRef]
  64. Vicente-Serrano, S.M.; Beguería, S.; López-Moreno, J.I. A multiscalar drought index sensitive to global warming: The standardized precipitation evapotranspiration index. J. Clim. 2010, 23, 1696–1718. [Google Scholar] [CrossRef] [Green Version]
  65. Hobbins, M.T.; Wood, A.W.; McEvoy, D.J.; Huntington, J.L.; Morton, C.; Anderson, M.C.; Hain, C.R. The Evaporative Demand Drought Index: Part I—Linking drought evolution to variations in evaporative demand. J. Hydrometeorol. 2016, 17, 1745–1761. [Google Scholar] [CrossRef]
  66. Stoyanova, J.; Georgiev, C.; Neytchev, P.; Kulishev, A. Spatial-Temporal Variability of Land Surface Dry Anomalies in Climatic Aspect: Biogeophysical Insight by Meteosat Observations and SVAT Modeling. Atmosphere 2019, 10, 636. [Google Scholar] [CrossRef] [Green Version]
  67. Trigo, I.F.; Dacamara, C.C.; Viterbo, P.; Roujean, J.L.; Olesen, F.; Barroso, C.; Camacho-de-Coca, F.; Carrer, D.; Freitas, S.C.; Garcia-Haro, J.; et al. The satellite application facility for land surface analysis. Int. J. Remote Sens. 2011, 32, 2725–2744. [Google Scholar] [CrossRef]
  68. Trigo, I.F.; Peres, L.F.; DaCamara, C.C.; Freitas, S.C. Thermal Land Surface Emissivity retrieved from SEVIRI/Meteosat. IEEE Trans. Geosci. Remote Sens. 2008, 46, 307–315. [Google Scholar] [CrossRef]
  69. Stoyanova, J.S.; Georgiev, C.G. SVAT modelling in support to flood risk assessment in Bulgaria. Atmos. Res. 2013, 123, 384–399. [Google Scholar] [CrossRef] [Green Version]
  70. Stoyanova, J.S.; Georgiev, C.G. Operational drought detection and monitoring over Eastern Mediterranean by using MSG data. In Proceedings of the 2013 EUMETSAT Meteorological Satellite Conference/19th American Meteorological Society AMS Satellite Meteorology, Oceanography, and Climatology Conference, Vienna, Austria, 16–20 September 2013; EUMETSAT: Darmstadt, Germany, 2013. [Google Scholar]
  71. ESA-CCI Land Cover Map product. Available online: https://www.esa-landcover-cci.org/?q=node/164 (accessed on 24 February 2022).
  72. Stoyanova, J.; Plamen, N.; Georgiev, C. Characterizing Fire Activity in Eastern Mediterranean Europe by Surface Temperature and Soil Moisture Variability. In Proceedings of the AGU Fall Meeting Abstracts, Virtual, 1–17 December 2020. [Google Scholar] [CrossRef]
  73. Stoyanova, J.; Georgiev, C.; Neytchev, P.; Kulishev, A. Synoptic and climatic aspects of fire activity and emission effects, Part I. In Proceedings of the 7th SALGEE Virtual Workshop ‘’Drought & Vegetation Monitoring: Energy–Water Cycle’’, Virtual, 24–26 November 2021; Available online: https://training.eumetsat.int/mod/folder/view.php?id=14866 (accessed on 24 February 2022).
  74. R Core Team. R: A Language and Environment for Statistical Computing; R Foundation for Statistical Computing: Vienna, Austria, 2017. [Google Scholar]
  75. Stoyanova, J.S.; Georgiev, C.G.; Neytchev, P.N.; Vladimirov, E.V. Combined assessment of terrestrial drought and atmospheric conditions through a composite index for fire risk forecast. In Proceedings of the 2016 EUMETSAT Meteorological Satellite Conference, Darmstadt, Germany, 26–30 September 2016. [Google Scholar]
  76. COMET® Program. Critical Fire Weather Patterns. University Corporation for Atmospheric Research, Boulder, CO 80307-3000. 2019. Available online: https://www.meted.ucar.edu/training_module.php?id=1599#.Xa29R2ZS9aQ (accessed on 23 February 2022).
  77. Dimitrakopoulos, A.P.; Mitsopoulos, I.D.; Gatoulas, K. Assessing ignition probability and moisture of extinction in a Mediterranean grass fuel. Int. J. Wildland Fire 2010, 19, 29–34. [Google Scholar] [CrossRef]
  78. Viegas, D.; Piñol, J.; Viegas, M.; Ogaya, R. Estimating live fine fuels moisture content using meteorologically-based indices. Int. J. Wildland Fire 2001, 10, 223–240. [Google Scholar] [CrossRef]
  79. Xiao, J.; Zhuang, Q. Drought effects on large fire activity in Canadian and Alaskan forests. Environ. Res. Lett. 2007, 2, 044003. [Google Scholar] [CrossRef]
  80. Chuvieco, E.; González, I.; Verdú, F.; Aguado, I.; Yebra, M. Prediction of fire occurrence from live fuel moisture content measurements in a Mediterranean ecosystem. Int. J. Wildland Fire 2009, 18, 430–441. [Google Scholar] [CrossRef]
  81. Pausas, J.G.; Fernández-Muño, S. Fire regime changes in the Western Mediterranean Basin: From fuel-limited to drought-driven fire regime. Clim. Change 2012, 110, 215–226. [Google Scholar] [CrossRef] [Green Version]
  82. Chandler, C.; Cheney, P.; Thomas, P.; Trabaud, L.; Williams, D. Fire in Forestry. In Forest Fire Behavior and Effects; John Wiley and Sons: New York, NY, USA, 1983; Volume 1, p. 450. [Google Scholar]
  83. Miller, D.H. Energy at the Surface of the Earth: An Introduction to the Energetics of Ecosystems; Chapter VII Radiant Energy Absorbed by Ecosystems; Academic Press: New York, NY, USA, 1981; pp. 114–135. ISBN 0-12-497152-0. [Google Scholar]
  84. Rose, C.W. Agricultural Physics; Pergamon Press: Oxford, UK, 1966; p. 230. [Google Scholar]
  85. Park, S.; Feddema, J.J.; Egbert, S.L. MODIS land surface temperature composite data and their relationships with climatic water budget factors in the central Great Plains. Int. J. Remote Sens. 2005, 26, 1127–1144. [Google Scholar] [CrossRef]
  86. Prigent, C.; Aires, F.; Rossow, W.B. Land surface skin temperatures from a combined analysis of microwave and infrared satellite observations for an all-weather evaluation of the differences between air and skin temperatures. J. Geophys. Res. 2003, 108, 4310. [Google Scholar] [CrossRef]
  87. Guangmeng, G.; Mei, Z. Using MODIS Land Surface Temperature to evaluate forest fire risk of Northeast China. IEEE Geoscince Remote Sens. Lett. 2004, 1, 98–100. [Google Scholar] [CrossRef]
  88. Lavorel, S.; Flanningan, M.D.; Lambin, E.F. Vulnerability of land systems to fire: Interactions among humans, climate, the atmosphere, and ecosystems. Mitig. Adapt Strat. Glob. Change 2007, 12, 33–53. [Google Scholar] [CrossRef]
  89. Bonan, G.B. Forests and climate change: Forcings, feedbacks, and the climate benefits of forests. Science 2008, 320, 1444–1449. [Google Scholar] [CrossRef] [PubMed] [Green Version]
  90. Seidl, R.; Thom, D.; Kautz, M.; Martin-Benito, D.; Peltoniemi, M.; Vacchiano, G.; Wild, J.; Ascoli, D.; Petr, M.; Honkaniemi, J. Forest disturbances under climate change. Nat. Clim. Change 2017, 7, 395–402. [Google Scholar] [CrossRef] [Green Version]
  91. Randerson, J.T.; Liu, H.; Flanner, M.G.; Chambers, S.D.; Jin, Y.; Hess, P.G.; Pfister, G.; Mack, M.C.; Treseder, K.K.; Welp, L.R. The impact of boreal forest fire on climate warming. Science 2006, 314, 1130–1132. [Google Scholar] [CrossRef] [PubMed] [Green Version]
  92. Dintwe, K.; Okin, G.S.; Xue, Y. Fire-induced albedo change and surface radiative forcing in sub-Saharan Africa savanna ecosystems: Implications for the energy balance. J. Geophys. Res. Atmos. 2017, 122, 6186–6201. [Google Scholar] [CrossRef] [Green Version]
  93. O’Halloran, T.L.; Law, B.E.; Goulden, M.L.; Wang, Z.; Barr, J.G.; Schaaf, C.; Brown, M.; Fuentes, J.D.; Göckede, M.; Black, A. Radiative forcing of natural forest disturbances. Glob. Change Biol. 2012, 18, 555–565. [Google Scholar] [CrossRef] [Green Version]
Figure 1. Geographical distribution of the vegetation cover types according to the ESA-CCI Land Cover database 2018 over (a) Europe; (b) Bulgaria, SE Europe, reclassified for the purposes of the study into three categories: forest, shrubland, grassland.
Remotesensing 14 01747 g001
Figure 2. Spatial distribution of LSASAF FRP fire pixel detections superimposed over: (a) LSASAF LST 0900 UTC anomalies and (b) monthly mean SMA anomalies (50 cm soil depth). Examples for July 2007, Bulgaria: The LST and SMA anomalies were calculated for the 2007–2018 period [66].
Remotesensing 14 01747 g002
Figure 3. Maps of the spatial–temporal (monthly/annual) distribution of fire activity over Bulgaria. Color-coded severity of biomass burning according LSASAF FRP-Pixel (MW) is indicated. Examples for July, August, September and annually for 2004, 2007, and 2019 are presented.
Remotesensing 14 01747 g003
Figure 4. Inter-annual dynamics of forest fires over Bulgaria according the LSASAF FRP-Pixel product detections (blue line) and ground observations of actual forest fires by the national SFA (green line) for (a) July, (b) August, (c) September 2007–2018.
Remotesensing 14 01747 g004
Figure 5. Time series of fire activity characterized by the total energy released from biomass burning per year FRP, MW (blue line) along with LST (red line) (June–September, 2007–2018) for: (a) All LC samples; (b) Cultivated LC; (c) Shrubs LC; (d) Forest LC. Each time series is fitted with a trend line using the linear regression technique (least squares method).
Remotesensing 14 01747 g005
Figure 6. Boxplots of monthly mean values (2007–2018) for the region of Bulgaria during the summer season (June–September): from the LSASAF FRP-Pixel (MW) for (a) forest and (b) shrubs; from the LSASAF LST 0900 UTC °C for (c) forest and (d) shrubs. The boxes represent the interquartile range (from the 25th to 75th percentile, first and third red line), whiskers cover 99.3% of the data, and the middle (red) lines represent the mean values.
Remotesensing 14 01747 g006
Figure 7. Boxplots of monthly mean values (2007–2018) for the region of Bulgaria during the summer season (June–September) from the LSASAF LST anomaly for (a) forest and (b) shrubs, and the (LST-T2m) difference for (c) forest and (d) shrubs. The boxes represent the interquartile range (from 25th to 75th percentile, first and third red line), whiskers cover 99.3% of the data, and the middle (red) lines represent the mean values.
Remotesensing 14 01747 g007aRemotesensing 14 01747 g007b
Figure 8. Quantile regression of the total energy released by biomass burning (all land cover types) in Bulgaria (June–September 2007–2018): log (Total FRP-Pixel, MW) vs. (a) LSASAF LST 0900 UTC; (b) (LSASAF LST-T2m) temperature difference; (c) LSASAF LST anomaly (2007–2018); (d) SMAI anomaly at 20 cm soil depth. Regression lines for 50%, 75%, 90%, and 95% quantile are shown.
Remotesensing 14 01747 g008aRemotesensing 14 01747 g008b
Figure 9. Regression models of the total energy released by biomass burning in Bulgaria according to the FRP-Pixel product, MW vs. LSASAF LST 0900 UTC for: (a) July; (b) August; (c) September, and vs. LSASAF LST anomaly (2007–2018) for: (d) July; (e) August; (f) September. Examples for cultivated land cover are presented.
Remotesensing 14 01747 g009aRemotesensing 14 01747 g009b
Figure 10. Map of “hot spots” of fire activity over Bulgaria, SE Europe based on long-term satellite observations (June–September, 2004–2019) using the LSASAF FRP-Pixel product. The fire numbers are the sum of the fire pixels (4 × 5 km MSG resolution over Bulgaria) detected and resampled in a 10 × 10 km plot. The “+” sign indicates locations where the trend passed the Mann–Kendall significance test at the 5% level.
Remotesensing 14 01747 g010
Table 1. Summary of data used and their characteristics.
DataTemporal ResolutionSpatial Resolution
Fire Radiative Power-Pixel product15 minSEVIRI, about 5 km over Bulgaria
Land Surface Temperature (LST)15 minSEVIRI, about 5 km over Bulgaria
Temperature difference between LST and air temperature at 2 m (LST-T2m)0900 and 1200 UTCNIMH synoptic station network
Soil Moisture Availability Index (SMAI)Daily, 0600 UTCNIMH synoptic station network
Table 2. Monthly accumulated FRP-Pixel detections for the period of 2007–2018 and the total FRP energy released per pixel (MW), DFI. Examples for shrubs, forest, and cultivated LCs for June, July, August, and September are presented.
Monthly Accumulated (2007–2018)
Fire Characteristics
JuneJulyAugustSeptember
Shrubs LC, FirePixelDetections232357228191429
DFI (MW/pixel)72.6399.78101.2885.66
Forest LC, FirePixelDetections13717951306486
DFI (MW/pixel)35.0672.9796.0576.29
Cultivated LC Detections130253319281441
DFI (MW/pixel)69.8298.10107.1883.42
Table 3. Ratios of the monthly accumulated DFI of forest and cultivated LC fires to the DFI of shrubs fires for the period of 2007–2018.
Ratio between DFI for Different LC TypesJuneJulyAugustSeptember
DFI Forest/DFI Shrubs 0.480.730.950.89
DFI Cultivated/DFI Shrubs0.960.981.061.06
Table 4. Coefficients of determination R2 of the regression between the energy of biomass burning, FRP (MW), and the monthly mean values of biophysical indexes (July–August, 2007–2018). Only days with fire detections are considered.
Fire Characteristics vs. Biophysical IndexesMonthForestShrubsCultivatedAll LC Types
Total FRP (MW) vs. LST 0900 UTCJuly0.7720.5930.6830.773
August0.4070.4810.5640.540
September0.4360.4320.6090.671
Total FRP (MW) vs. LST anomaly 0900 UTCJuly0.7790.5540.6600.668
August0.7390.5010.5980.627
September0.6110.5840.6780.682
Total FRP(MW) vs. SMA 100 soil depthJuly0.8740.5690.6690.695
August0.4570.4940.5990.569
Total FRP (MW) vs. SMA 50 soil depthJuly0.8840.5230.7130.690
August0.5120.4440.5240.546
Total FRP (MW) vs. SMA 20 soil depthJuly0.7150.4230.6650.607
Publisher’s Note: MDPI stays neutral with regard to jurisdictional claims in published maps and institutional affiliations.

