Article

New Normalized Difference Reflectance Indices for Estimation of Soil Drought Influence on Pea and Wheat

Department of Biophysics, N.I. Lobachevsky State University of Nizhny Novgorod, Nizhny Novgorod 603950, Russia
*
Author to whom correspondence should be addressed.
Remote Sens. 2022, 14(7), 1731; https://doi.org/10.3390/rs14071731
Submission received: 10 March 2022 / Revised: 24 March 2022 / Accepted: 1 April 2022 / Published: 4 April 2022
(This article belongs to the Section Remote Sensing in Agriculture and Vegetation)

Abstract

:
Soil drought is an important problem in plant cultivation. Remote sensing using reflectance indices (RIs) can detect early changes in plants caused by soil drought. The development of new RIs which are sensitive to these changes is an important applied task. Previously, we revealed 46 normalized difference RIs based on a spectral region of visible light which were sensitive to the action of a short-term water shortage on pea plants under controlled conditions (Remote Sens. 2021, 13, 962). In the current work, we tested the efficiency of these RIs for revealing changes in pea and wheat plants induced by the soil drought under the conditions of both a vegetation room and open ground. RI (613, 605) and RI (670, 432) based on 613 and 605 nm wavelengths and on 670 and 432 nm wavelengths, respectively, were effective for revealing the action of the soil drought on investigated objects. Particularly, RI (613, 605) and RI (670, 432) which were measured in plant canopy, were significantly increased by the strong soil drought. The correlations between these indices and relative water content in plants were strong. Revealed effects were observed in both pea and wheat plants, at the plant cultivation under controlled and open-ground conditions, and using different angles of measurement. Thus, RI (613, 605) and RI (670, 432) seem to be effective tools for the remote sensing of plant changes under soil drought.

1. Introduction

Agriculture is a very important field of human activity, is the basis of food security. However, environmental stressors (e.g., soil drought) can strongly decrease plant productivity [1]. There are several reasons for the increasing frequency of drought events. Global climate change causes frequent hot summers and droughts [2,3]. The decrease in forest surface area caused by human activity leads to additional stimulation for soil drought development [4]. Additionally, the high temperature and pollution of the environment leads to a reduction in the availability of water in the ground [2,5].
The water deficit causes the closing of stomates and a decrease in photosynthetic CO2 assimilation [1,6]. Prolonged drought decreases growth processes, total plant biomass, and crops [1], and induces oxidative stress which can additionally modify quality of fruits and vegetables [7] including decreases in weight, changes in the accumulation of sugars, pH, and proteins, and other factors.
Early detection of a drought’s action on plants using remote sensing methods can be important for finding solutions for this problem. These methods are actively developed and permit the estimation of parameters of plant growth and productivity [8,9,10], reveal specific signs of damage [11,12], and have other helpful qualities. Efficiency, availability and environmental friendliness are necessary properties of methods of remote sensing of plants. The optical methods correspond to these requirements [13,14]. Particularly, the analysis of the spectral parameters of reflected light on the basis of reflectance indices (RIs) are widely used for remote sensing [15,16].
The spectra of reflected light, including the visible region, which is related to changes in light absorption by photosynthetic pigments, can be very informative. Chlorophylls are the main photosynthetic pigments [17]; their content is sensitive to the action of stressors. Particularly, the actions of many stressors increase the concentration ratio of chlorophyll a to chlorophyll b [18,19] and decrease the concentration ratio of chlorophylls to carotenoids [18,20,21]. Transitions in xanthophyll cycle which are strongly related to photosynthetic processes (through changes in a luminal pH in chloroplasts [22]) are another detector of early photosynthetic stress changes in plants [23]. Another important pigment is an anthocyanin. Its increased content shows an adaptation of a plant to illumination with high intensity, as anthocyanin eliminates reactive oxygen species (ROS) [21,24].
Thus, plant photosynthetic pigments are sensitive to environmental factors and can be reliable indicators of stress changes in plants. The changes in the content of pigments are widely used for revealing plant damage or plant adaptation to variable environment conditions [9,25]. It is interesting that pigment reflectance indices related to concentrations of photosynthetic pigments can be also informative for the estimation of plant senescence [20], luminal pH changes [26,27], xanthophyll cycle activity [28], photosynthetic CO2 assimilation [29,30], light use efficiency [9,31,32], and other processes. Meta-analyses show that pigment reflectance indices are effective tools for the remote sensing of plants [25,33,34,35].
However, the search for new effective reflectance indices is an important problem in the development of plant remote sensing. The complex analysis of spectra of reflected light can show spectral regions which are the most sensitive to the actions of stressors [12,36]. Some combinations of different investigated wavelengths, which are used for the calculation of RIs, can be potentially related to specific processes in investigated plants. For example, heatmaps of correlation or regression coefficients between RIs and photosynthetic parameters can show new reflectance indices which are most sensitive to action of stressors [12,36]. The complex investigation of significances and directions of differences between RIs in control and stressed plants, as well as the elaboration of heatmaps based on these parameters, can also be effective tools for the analysis of reflectance spectra [37,38]. Potentially, revealed indices can be used for the estimation of plant physiological processes and their tolerance under actions of stressors.
There are several RIs which are considered to be sensitive to the action of drought on plants. It is known [39,40,41,42,43,44,45,46] that water deficit can influence water indices (e.g., Water Index (WI), Normalized Difference Water Index (NDWI), Moisture Stress Index (MSI), or Normalized Multi-Band Drought Index (NMDI)), pigment indices (e.g., Photochemical Reflectance Index (PRI)), and vegetation indices (e.g., Normalized Difference Vegetation Index (NDVI)). It should be noted that some indices (e.g., WI [40]) can be used for the direct estimation of the water content in plants. However, the development of new drought-sensitive RIs remains the important task which can be solved on basis of the complex analysis with using heatmaps of changes in all possible reflectance indices.
Previously, in a complex manner, we analysed the sensitivity of normalized difference reflectance indices in the visible spectral region to the action of a short-term water shortage (a simple model of soil drought) on pea seedlings [38]. We preliminarily revealed 46 RIs which may be potentially sensitive to drought. The aim of the current work is to further analyze the efficiency of using these revealed RIs in detection of action of the soil drought on plants. Two plant species (pea and wheat) were investigated. Both pea and wheat were investigated under the laboratory conditions; hyperspectral measurements were performed at 45° and 90° angles to the ground plane. Only wheat was investigated under the open-ground conditions with measurements at a 45° angle to the ground plane.

2. Materials and Methods

2.1. Plant Cultivation and Induction of Soil Drought

For the experiments, 2–4-week-old pea (Pisum sativum L., variety “Albumen”) and wheat (Triticum aestivum L., variety “Zlata”) plants were used. These plants were used as model plants for revealing new effective RIs in our investigation because both pea and, especially, wheat are important agricultural plants typically cultivated under open-ground conditions and strongly affected by drought. Additionally, a preliminary complex analysis of reflectance indices under the action of the short-term water shortage [38], which showed a list of 46 reflectance indices analyzed in the current work, was based on the investigation of pea plants.
There were two variants of plant cultivation. First, pea and wheat plants were cultivated under controlled conditions in the vegetation room under a 16/8 h (light/dark) photoperiod at 24 °C; luminescent lamps FSL YZ18RR (Foshan Electrical And Lighting Co., Ltd., Foshan, China) were used for illumination. Second, wheat plants were cultivated under open-ground conditions in July 2021 (duration of light in the day was about 18 h, averaged day and night temperature were 27 and 18 °C, respectively).
Pea and wheat plants were cultivated in pots with a standard soil (universal soil “Dobrii pomoshnik”, Morris Green). Each group included 45 pots with plants under control conditions and 45 pots with plants under drought conditions; the pots each contained 9 plants. Three pallets were used in each experiment (Figure S1); 30 pots (15 pots under control conditions and 15 pots under the soil drought) were placed in each pallet.
Plants were irrigated every 2 days before the initiation of the experiment; uncontrolled irrigation of plants under open-ground conditions was excluded. The soil drought was induced by termination of irrigation; control plants were irrigated every 2 days.

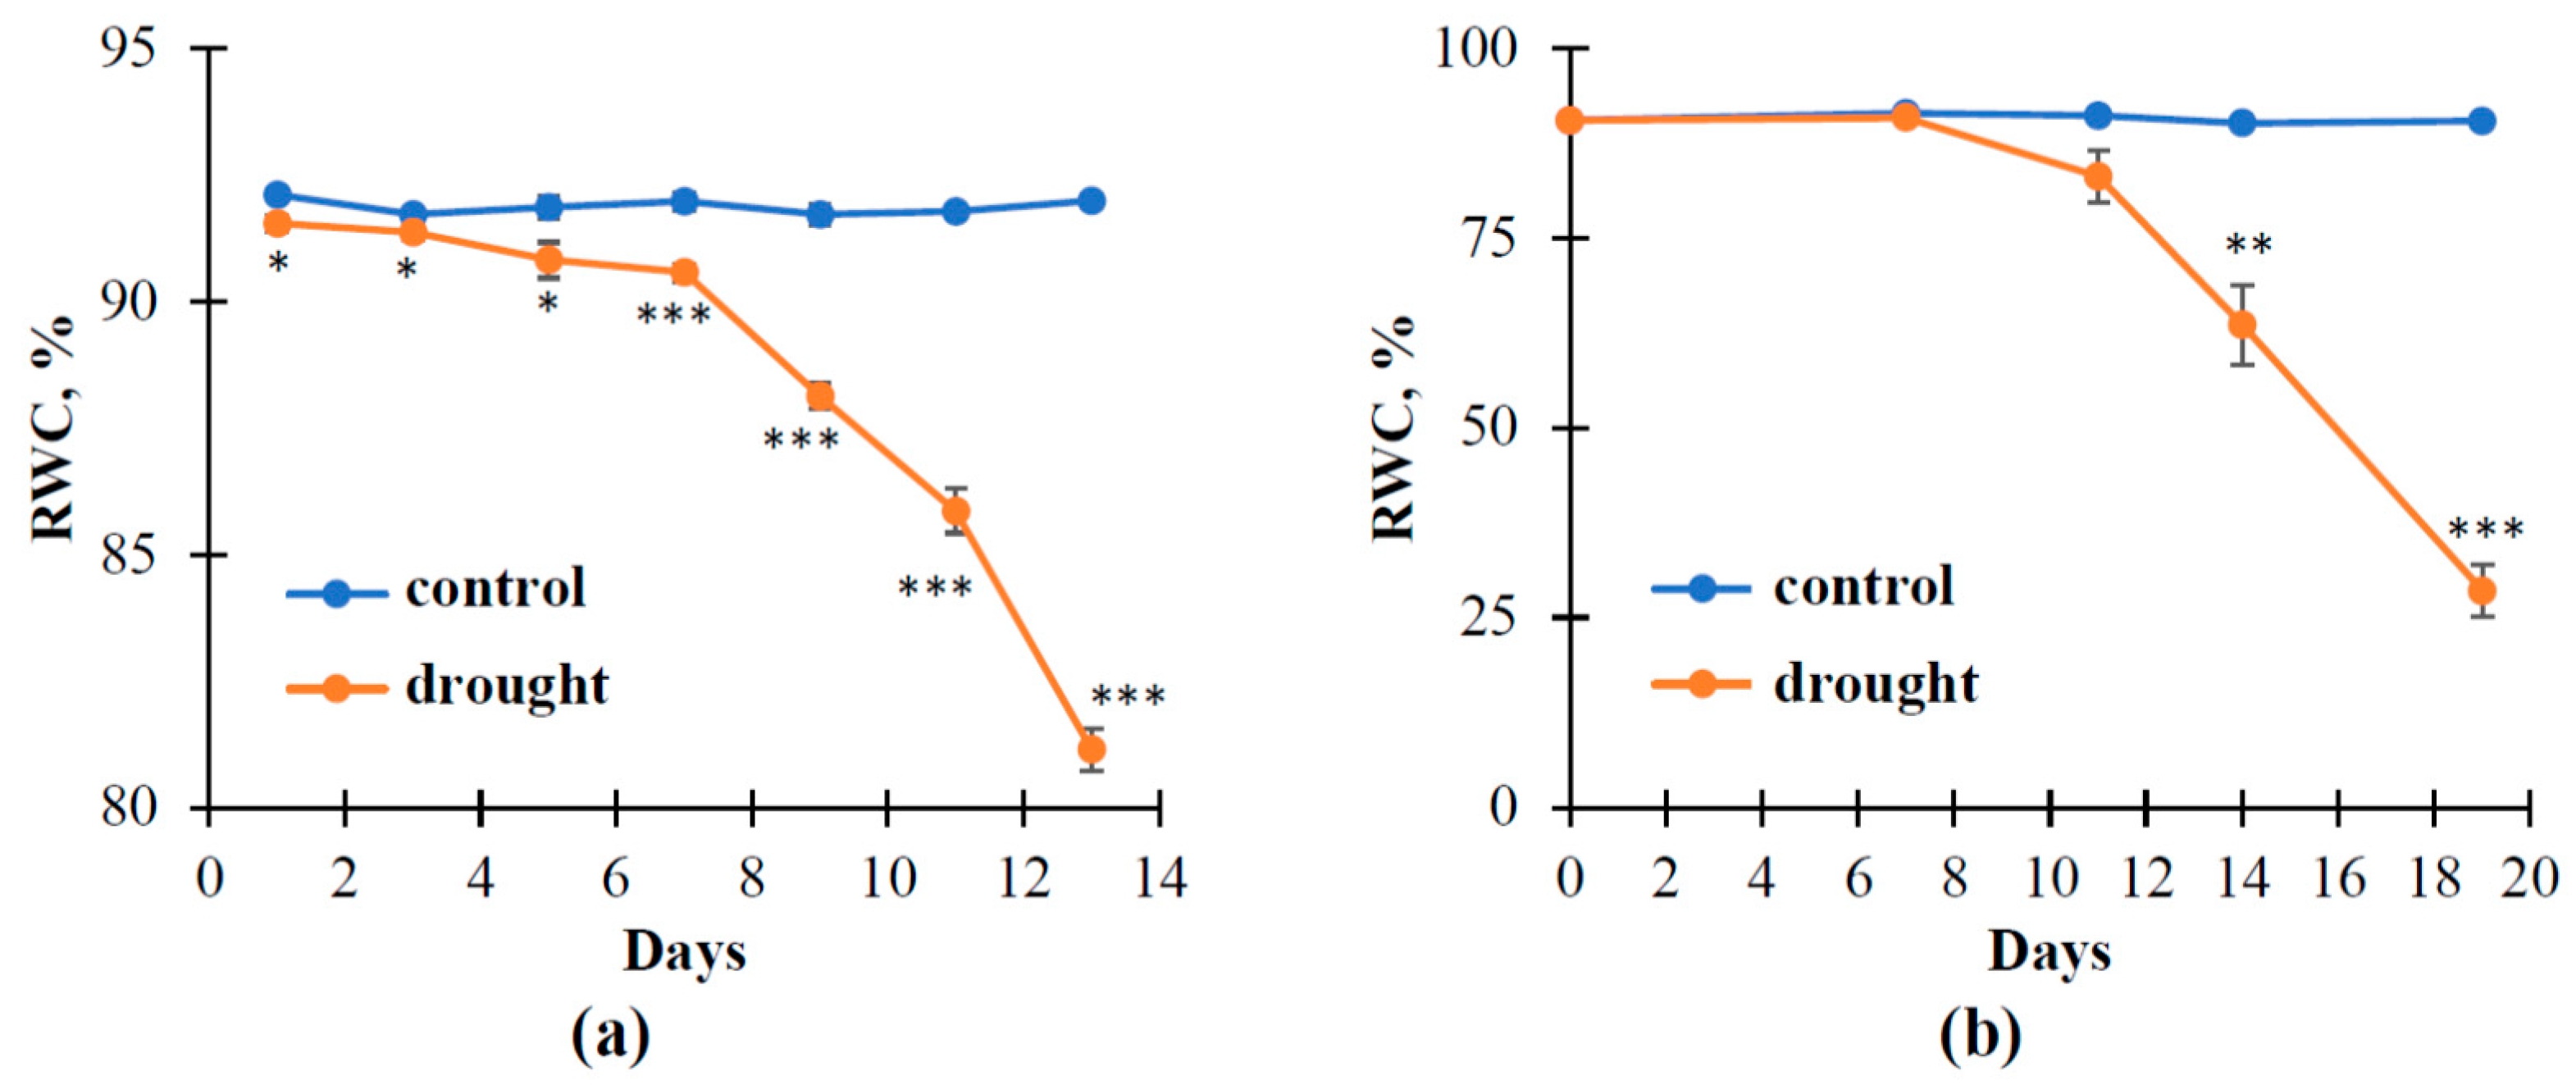
2.2. Relative Water Content Estimation

Relative water content (RWC) was estimated in control and experimental plants after the soil drought initiation. Fresh (FW) and dry (DW) weights of plants were measured for all plants of each pot. DW was measured after 2 h of high-temperature action in a TV-20-PZ-K thermostat (Kasimov Instrument Plant, Kasimov, Russia) (about 100 °C). The relative water content was calculated by Equation (1):
RWC = FW DW FW 100   %
Equation (1) was also used for estimation of the RWC in the soil (under conditions of vegetation room and open-ground conditions) with irrigation (control) or without irrigation (drought). It was shown (Figure S2) that termination of the irrigation induced a strong decrease in the soil RWC after 1 and 2 weeks of the drought.

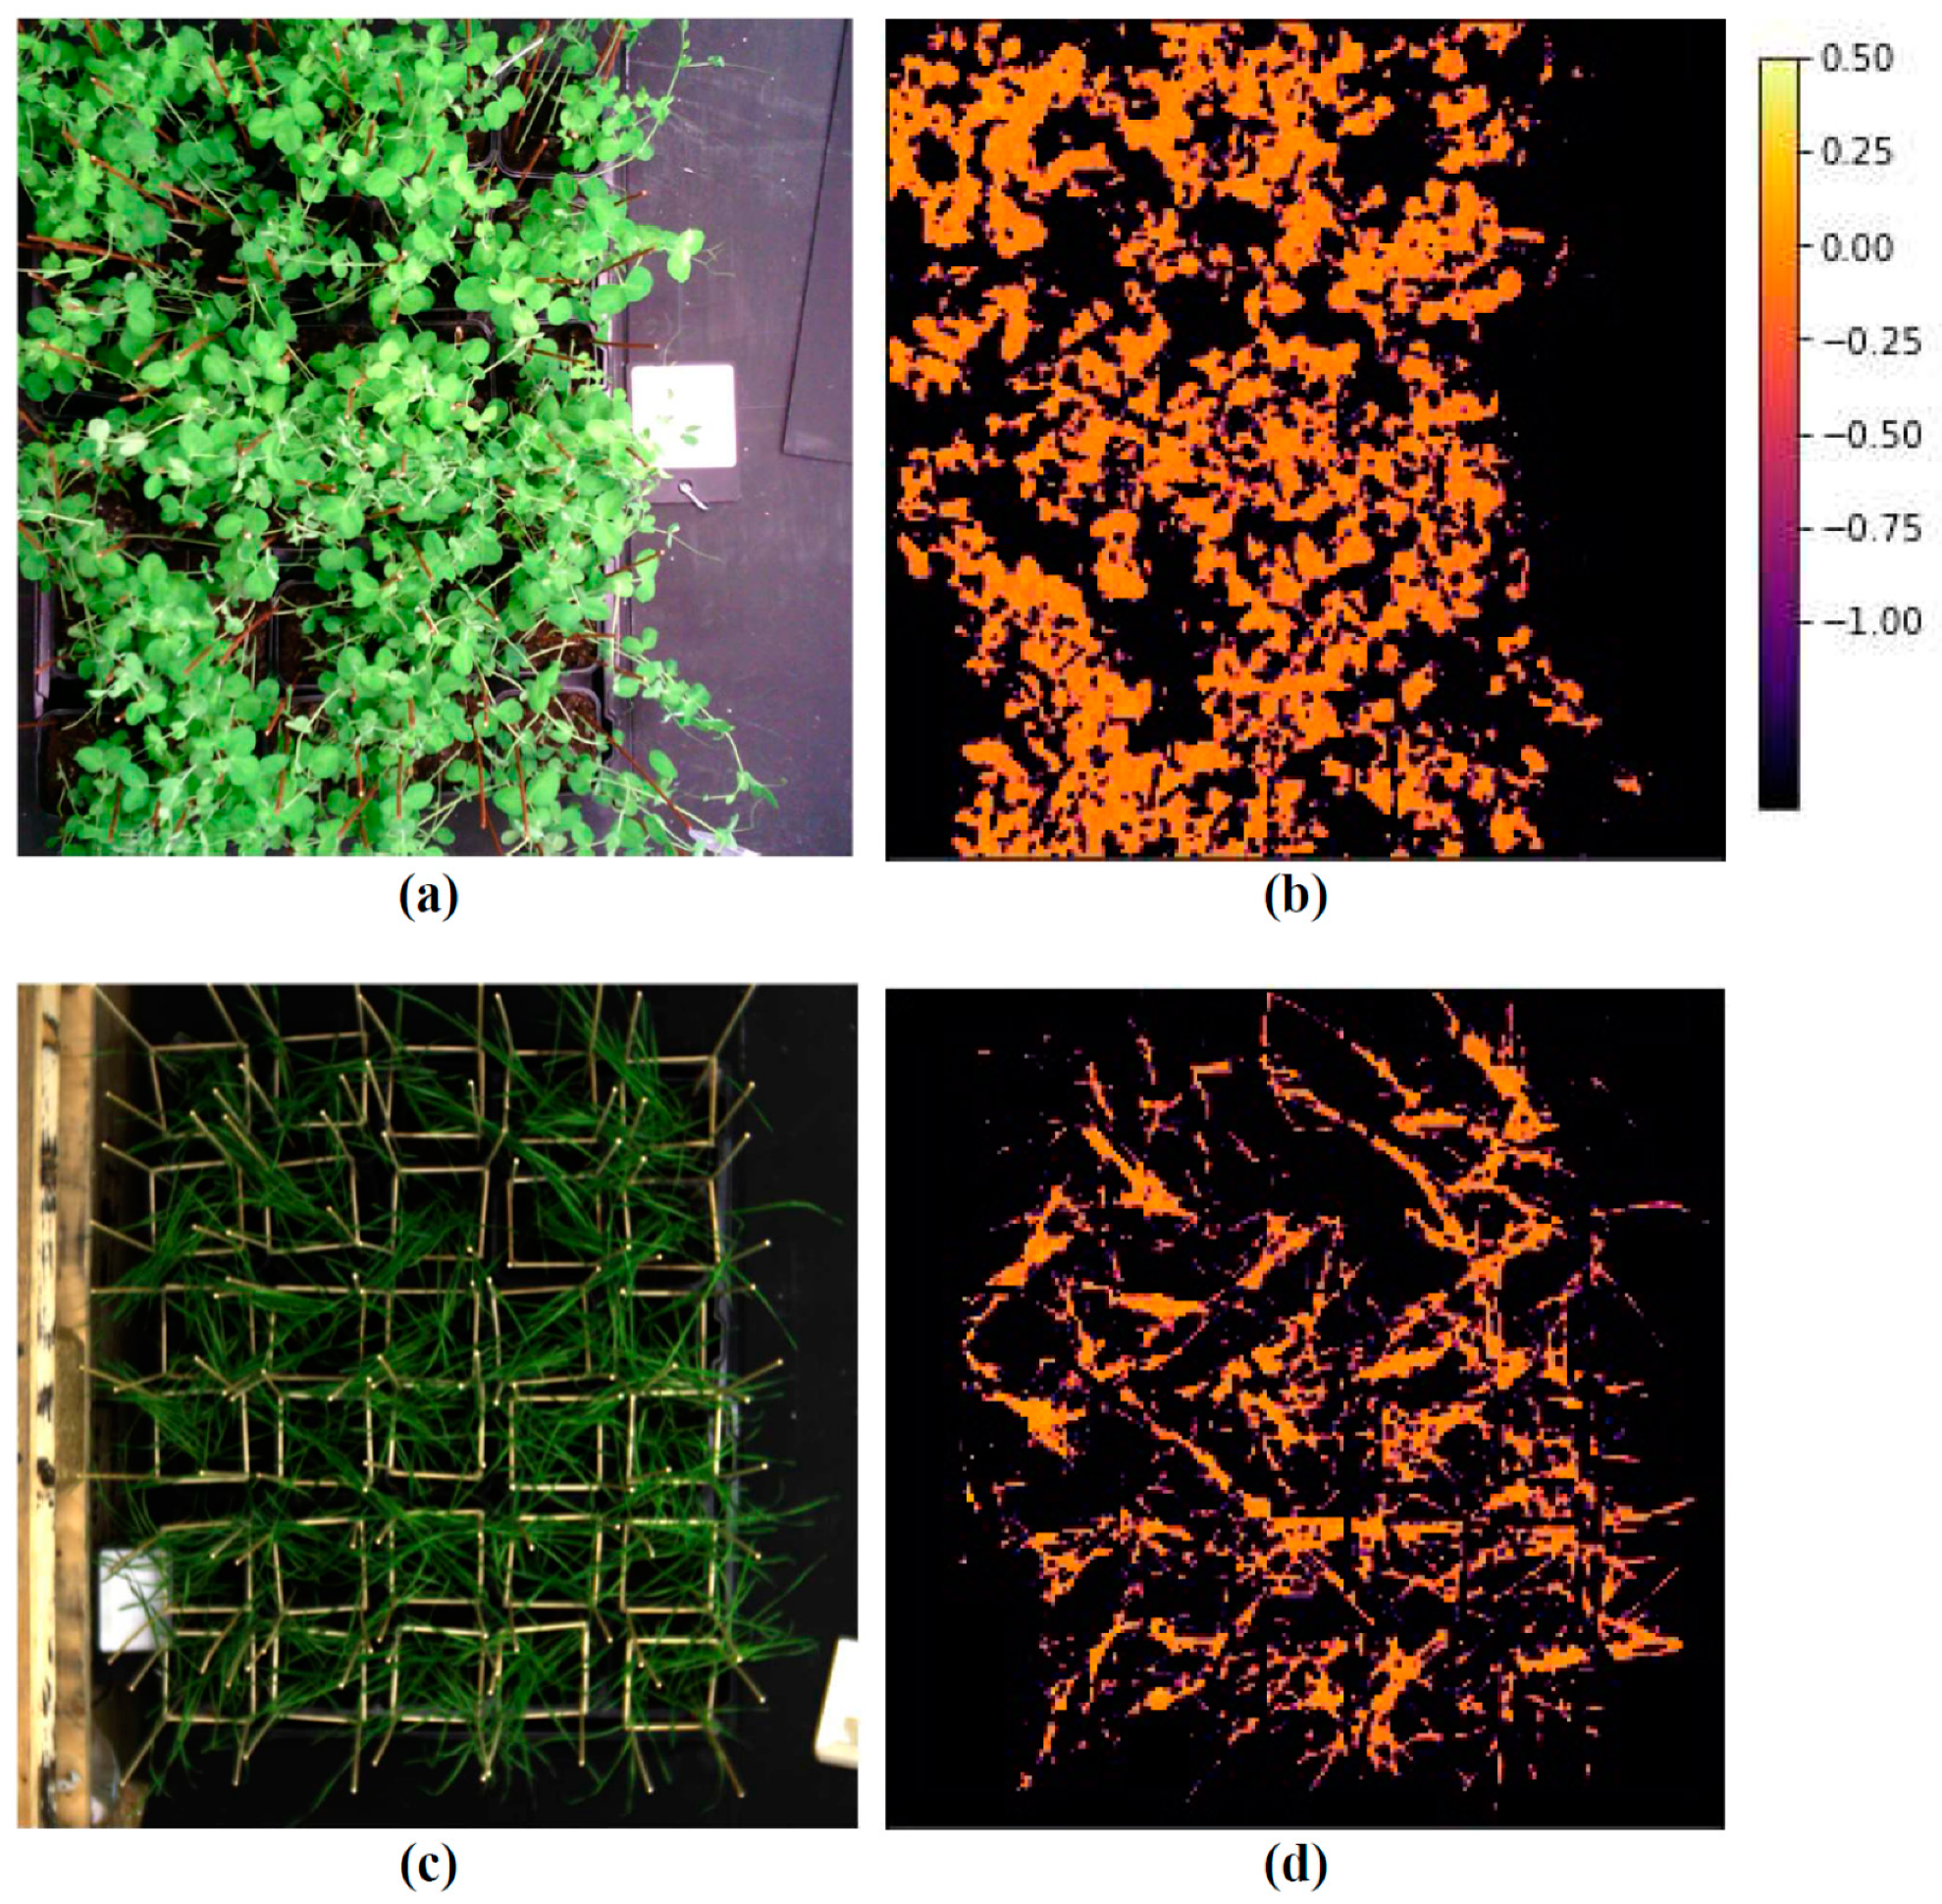
2.3. Hyperspectral Measurements and Analysis of Images

Hyperspectral images were obtained in control and experimental plants every 2 days after the soil drought initiation. Pallets containing 30 pots with plants were used in hyperspectral measurements as model of the plant canopy. Measurements were performed under luminescence illumination (plants cultivated in the vegetation room) or sunlight (plants cultivated under open-ground conditions). The white reference panel for a hyperspectral camera Specim IQ (Specim, Spectral Imaging Ltd., Oulu, Finland) was used as reflectance standard in each measurement.
The hyperspectral camera Specim IQ (400–1000 nm spectral range, 204 spectral bands, 3 nm sampling interval, 0.2 megapixel matrix) was used for hyperspectral measurements. Reflectance of plants cultivated in the vegetation room (pea and wheat) was measured at 45° (“side view”) and 90° (“view from above”) angles to the ground plane; the distance between the plants and the camera was about 1 m. Reflectance of plants cultivated under open-ground conditions (wheat) was measured at a 45° angle to the ground plane; the distance between the canopy and the camera was about 1.5 m.
Hypercubes containing results of hyperspectral measurements were analyzed using a program which was specially developed for this task using Python coding language (libraries Spectral and Numpy). Each slice of the hypercube represented image of plants on the specific wavelength of the reflected light. Values of reflectance at two specific wavelengths (Rx and Ry where x and y were values of these wavelengths) were written from arrays, and a specific normalized reflectance index (RI) was calculated by Equation (2):
RI ( x ,   y ) = R x R y R x + R y
We previously showed [38] that there were 46 RIs which were sensitive to the action of the short-term water shortage (the simple model of the soil drought) in pea plants with spatially fixed leaves. In current analysis, we used 46 pairs of values of reflectance (Rx and Ry); the pairs corresponded to these 46 RIs which were potentially sensitive to drought.
The investigation of pallets with pots (imitation of plant canopy) required the automatic exclusion of the background from images. For a solution for this task, we used masks excluding background RIs which were not related to plants. The reflectance at 543 nm (high leaf reflectance and a low light absorption) and 661 nm (low leaf reflectance and high light absorption by chlorophylls), which were optimal for the separation of photosynthetic plants from the background, were used for these masks. RIs corresponding to the background with low reflectance at 543 nm (e.g., the soil) and/or high reflectance at 661 nm (e.g., the white reference panel) were not analyzed.
Figure 1 shows examples of using masks for excluding the background in investigation (for RI (670, 432), which was one of the investigated RIs): RGB images and pseudocolor RI (670, 432) images in pea (upper panels) and wheat (lower panels) plants were shown. Only measurements at a 90° angle to the ground plane (“View from above”) were shown in this figure. It was shown that the used procedure eliminated background. Small part of green plants was also excluded from images; however, the most of green plants were observed after the background exclusion. Thus, this background exclusion was used for further analysis in our work. Figure S3 shows examples of using masks for excluding the background of images at hyperspectral measurements at 45° angle to the ground plane (“side view”).

2.4. Statisitics

Separate pots were considered as repetitions in the current investigation. The number of investigated pots was 45 for all variants of hyperspectral measurements and 4–6 for measurements of RWC. Figures show mean values, standard errors (SEs), scatter plots, linear regression equations and determination coefficients [47]. Significance of differences was estimated by a Student’s t-test.

3. Results

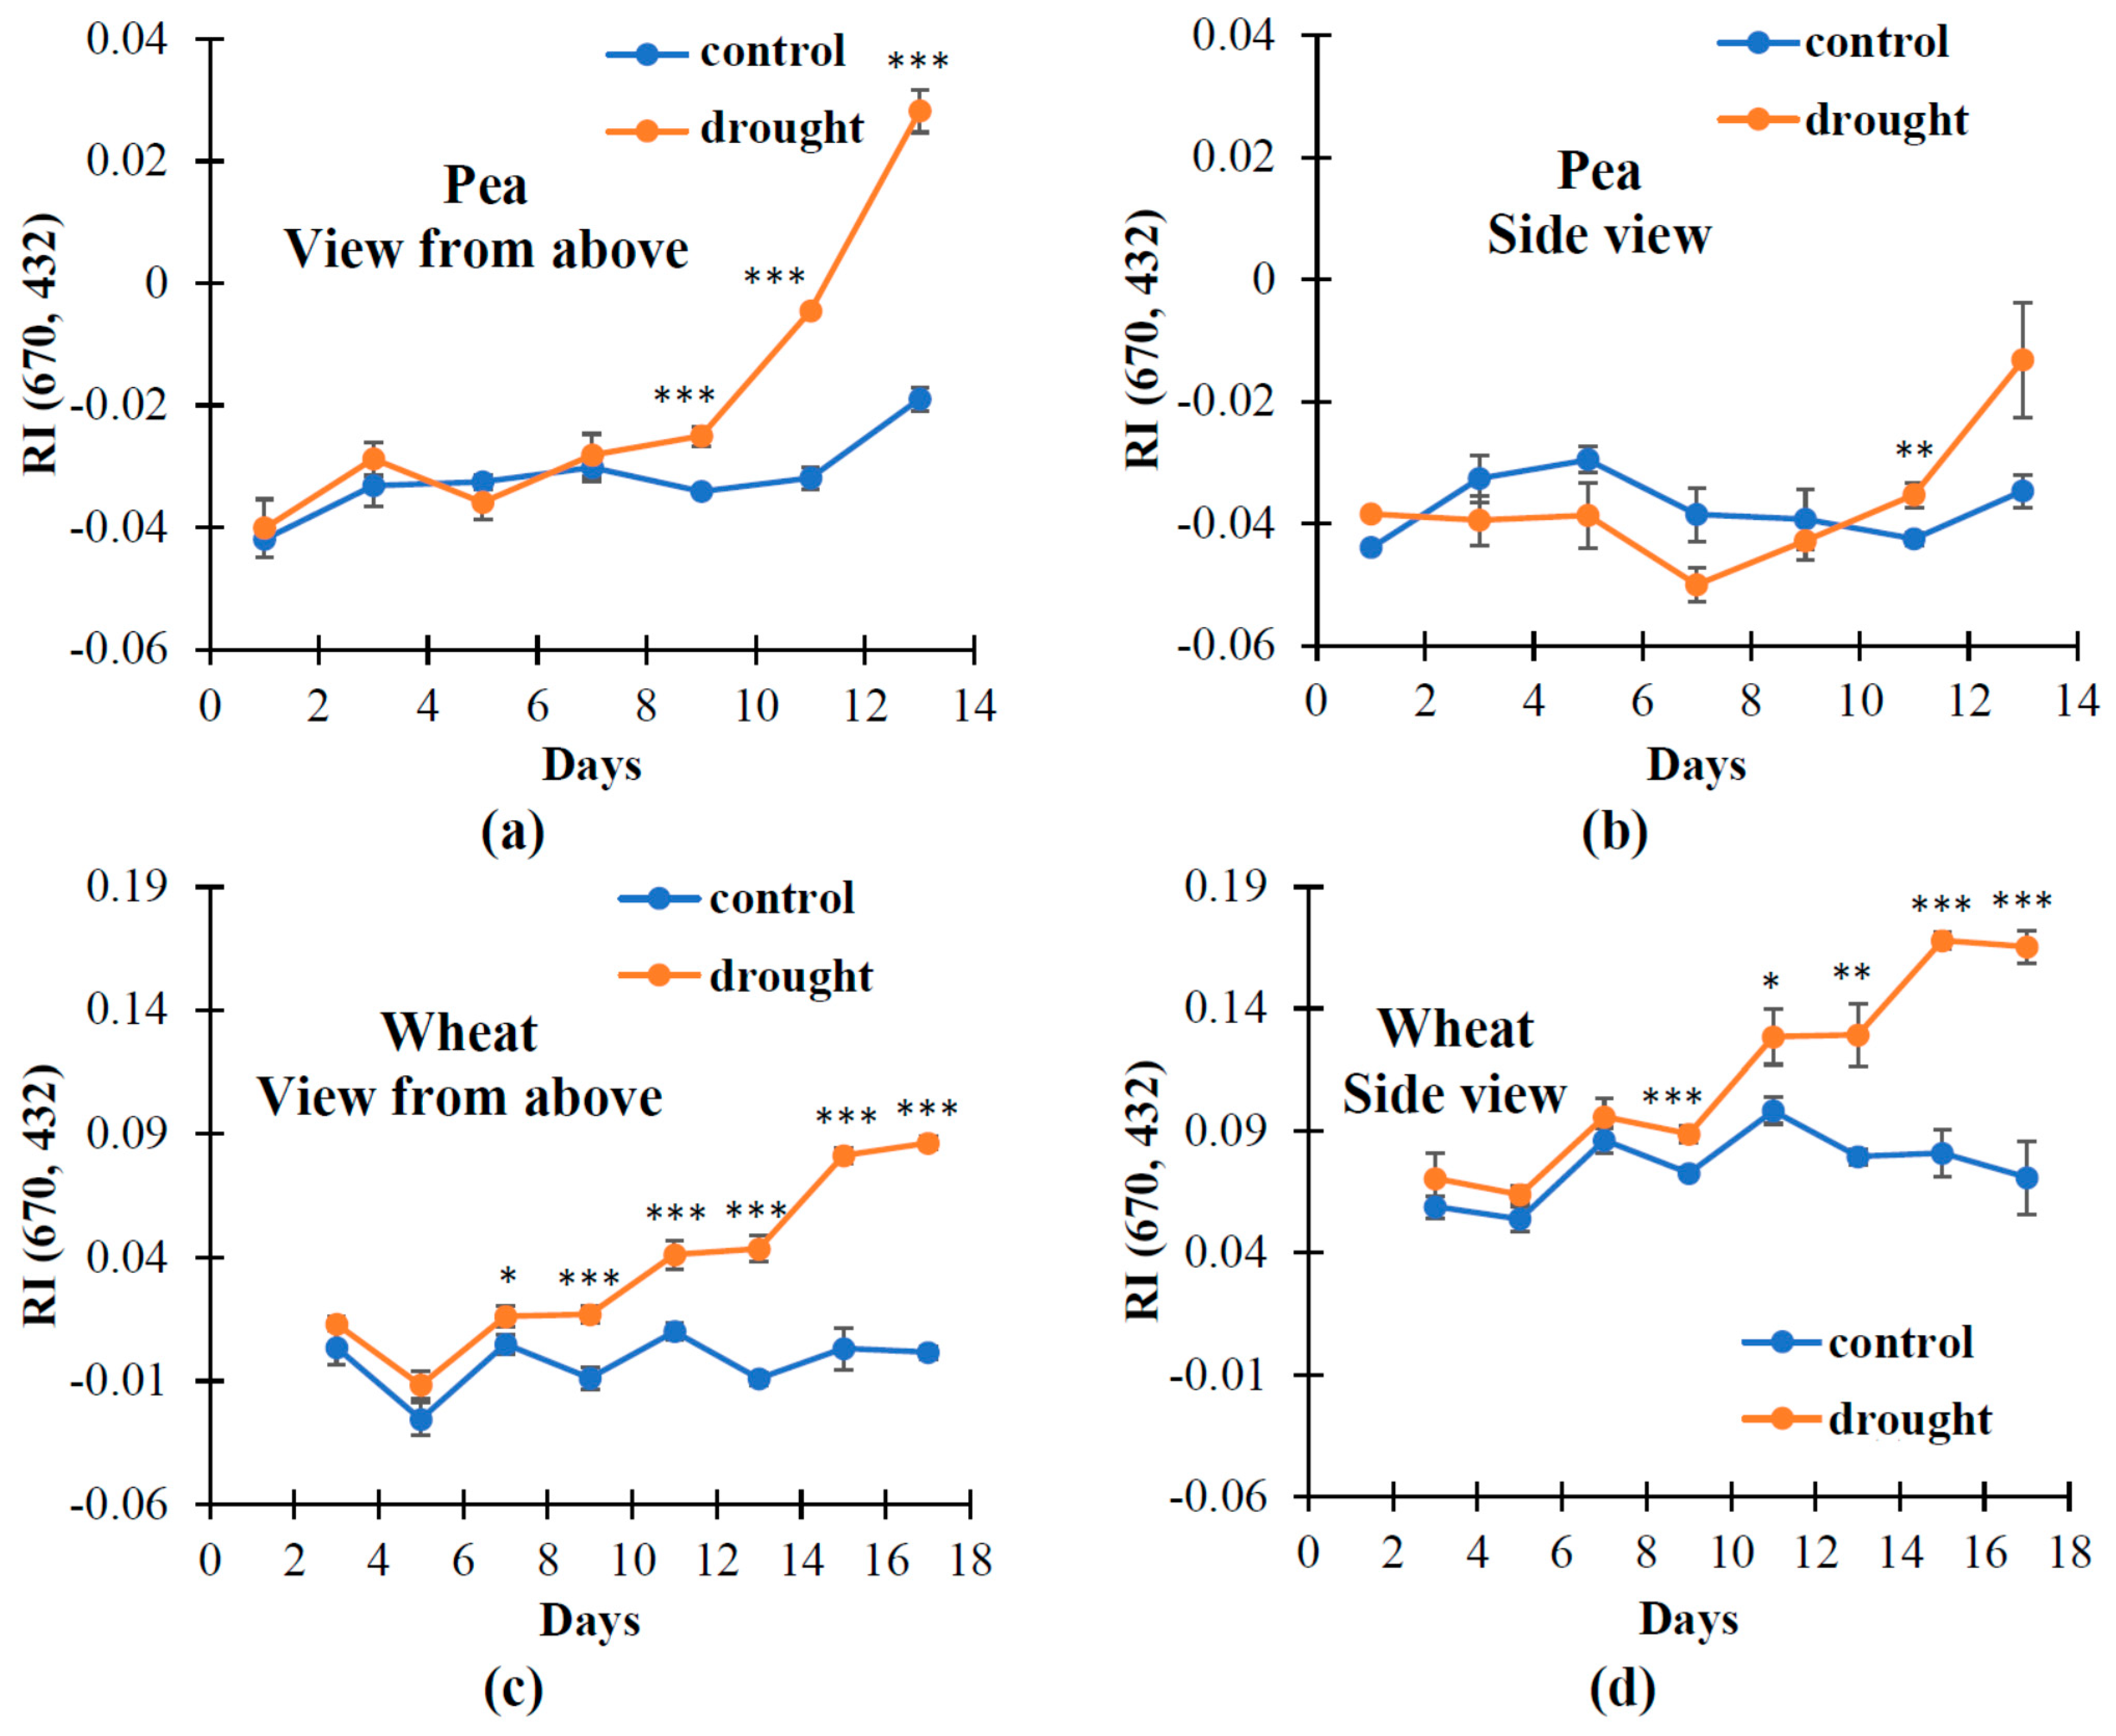
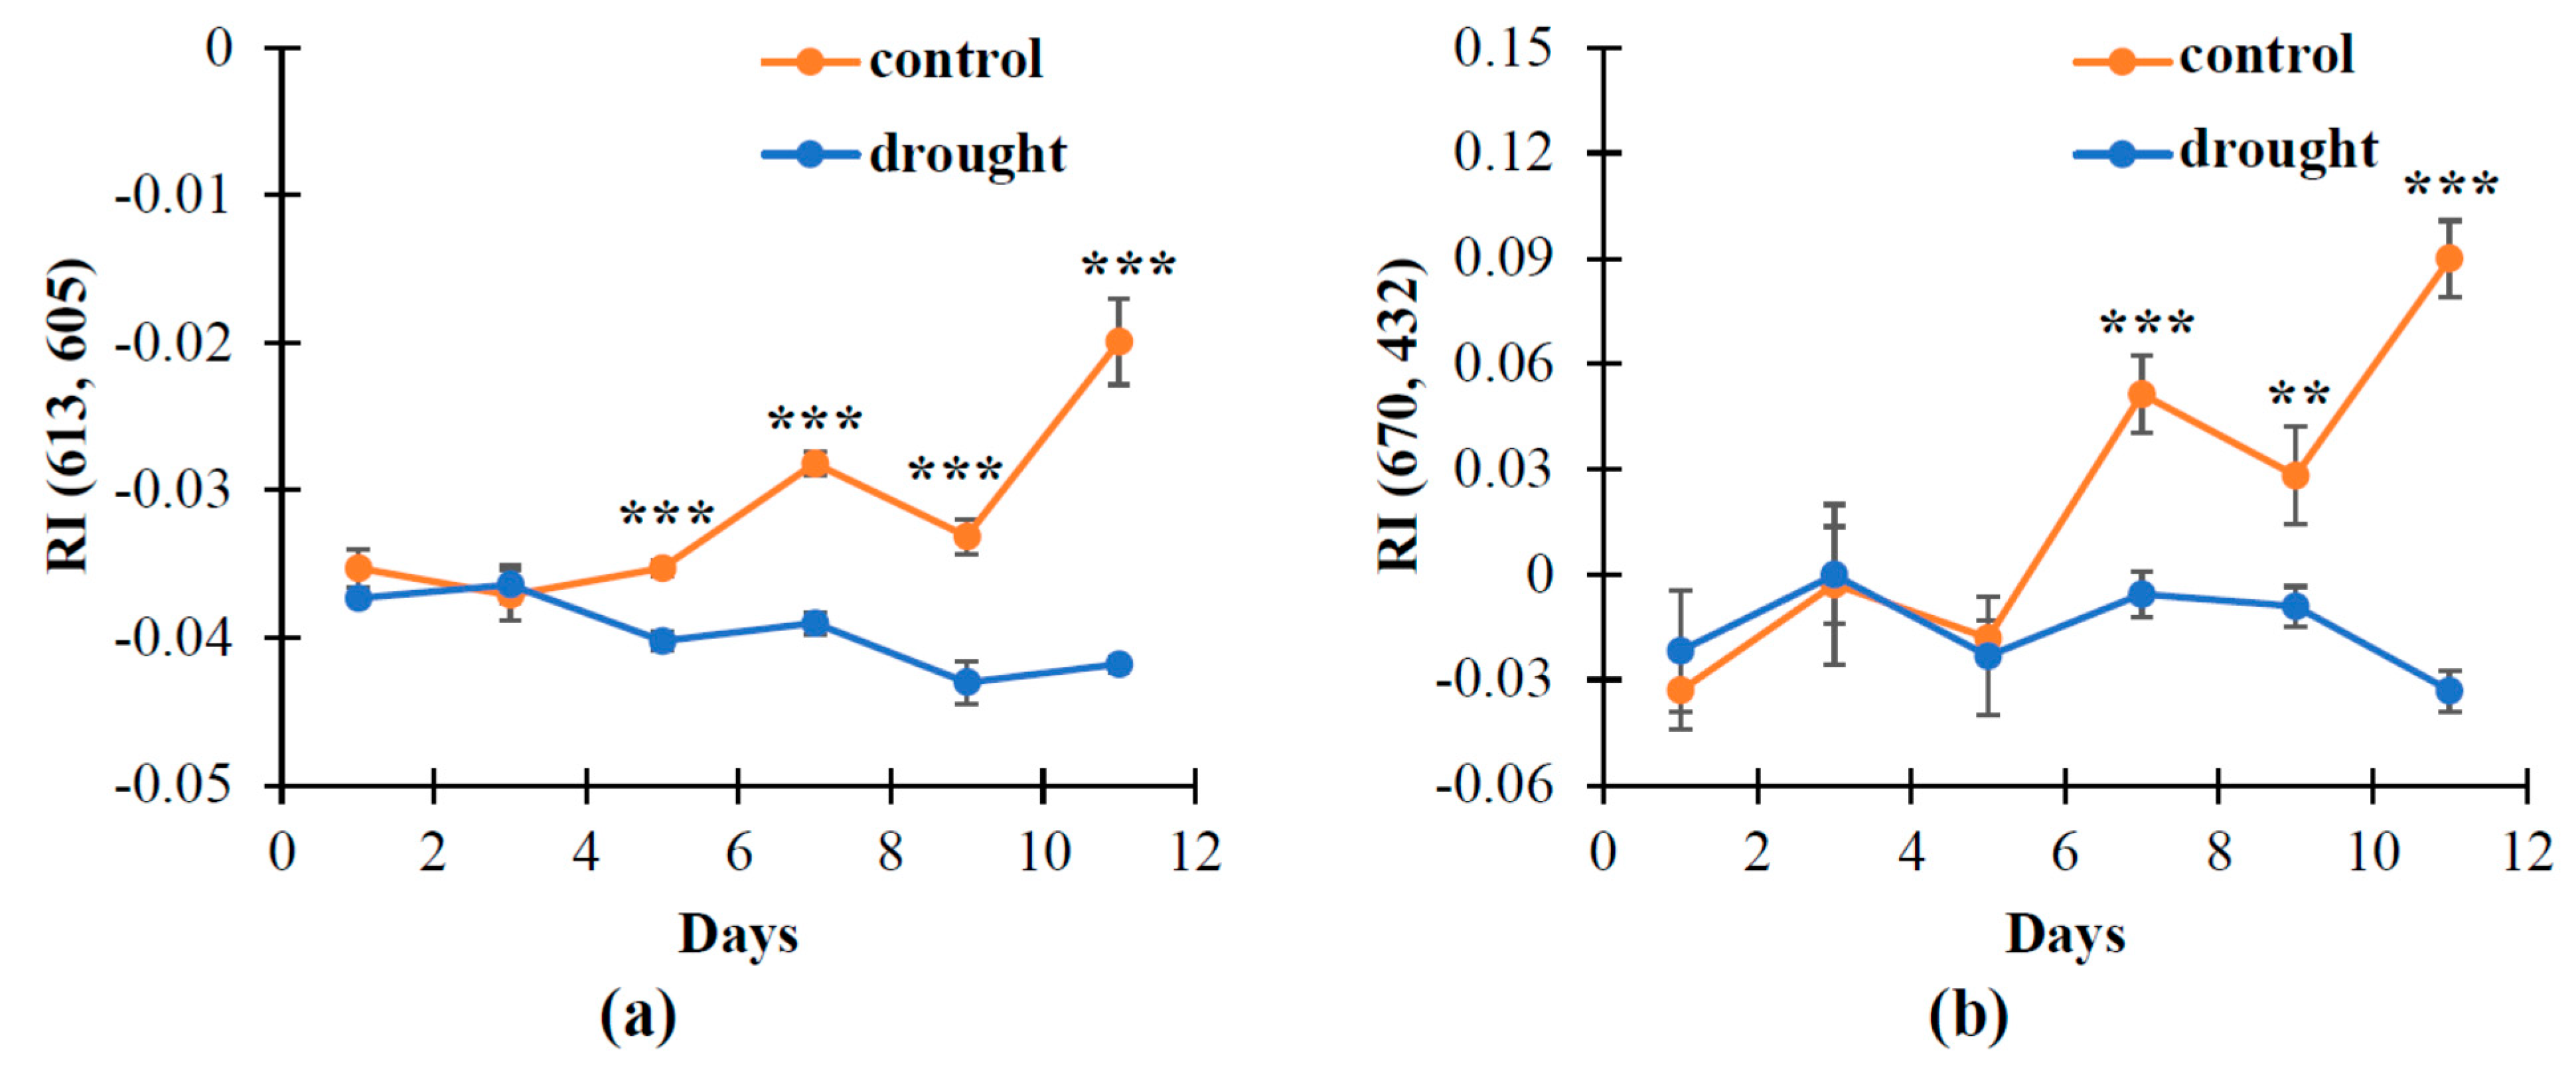
3.1. The Changes in Investigated Normalized Reflectance Indices

Earlier [38], we analyzed the influence of a short-term water shortage, a simple experimental model of soil drought, on reflectance in pea seedlings. The complex analysis of reflected light was performed using heatmaps of significance and directions of differences between RIs in control and stressed plants. We preliminarily revealed 46 RIs which were sensitive to action of the soil water shortage; correlation analysis showed strong relations between these 46 RIs and water content in plants. Further analysis of efficiency of these indices was the task of the current investigation.
Table 1 shows the directions of drought-induced changes in these 46 RIs (decrease or increase) in comparison to control values of the same RIs (in plants with irrigation) which were observed in the current work. Only significant differences between RIs in plants under drought conditions and control plants were analyzed. It should be noted that the magnitudes of these changes increased with the increase of the duration of the soil drought. The duration of the soil drought, which was necessary for the initiation of these changes, was not analyzed at this stage of the investigation.
It was shown that the most of investigated RIs in pea plants under soil drought were significantly changed in comparison to the values of these RIs in irrigated plants. There were different directions of these changes in different plants, under different conditions of plant cultivation, or at different angles of measurement. The result was contradictory to our previous work [38], which showed an increase in all investigated RIs under the short-term water shortage.
It was also shown that some RIs were significantly changed in wheat plants under soil drought (Table 1). Some of these RIs were decreased, while other RIs were increased under the soil drought. It was important to note that directions of changes in RIs often differed in pea and wheat plants.
On basis of Table 1, we revealed RIs which were significantly changed in both wheat and pea plants at all investigated conditions (marked by color). There were two RIs, RI (613, 605) and RI (670, 432) (Table 1, marked by blue), which were significantly increased in comparison to control in all experimental variants. This result was in a good accordance with our previous results [38], which showed an increase in the number of RIs under short-term water shortage. RI (688, 432) was also significantly changed under soil drought; however, the directions of these changes differed in pea and wheat plants—this index was decreased in pea plants and was increased in wheat plants (Table 1, marked by grey).
These results showed that two indices from 46 preliminarily revealed RIs (RI (613, 605) and RI (670, 432)) were sensitive to drought-induced changes in plants at different experimental conditions, including the induction of short-term water shortage or prolonged soil drought, measurements of single leaves or canopy, using different plant species, the application of controlled or uncontrolled growth conditions, and using different angles for the spectral measurements. Further, we analyzed these indices in more detail.

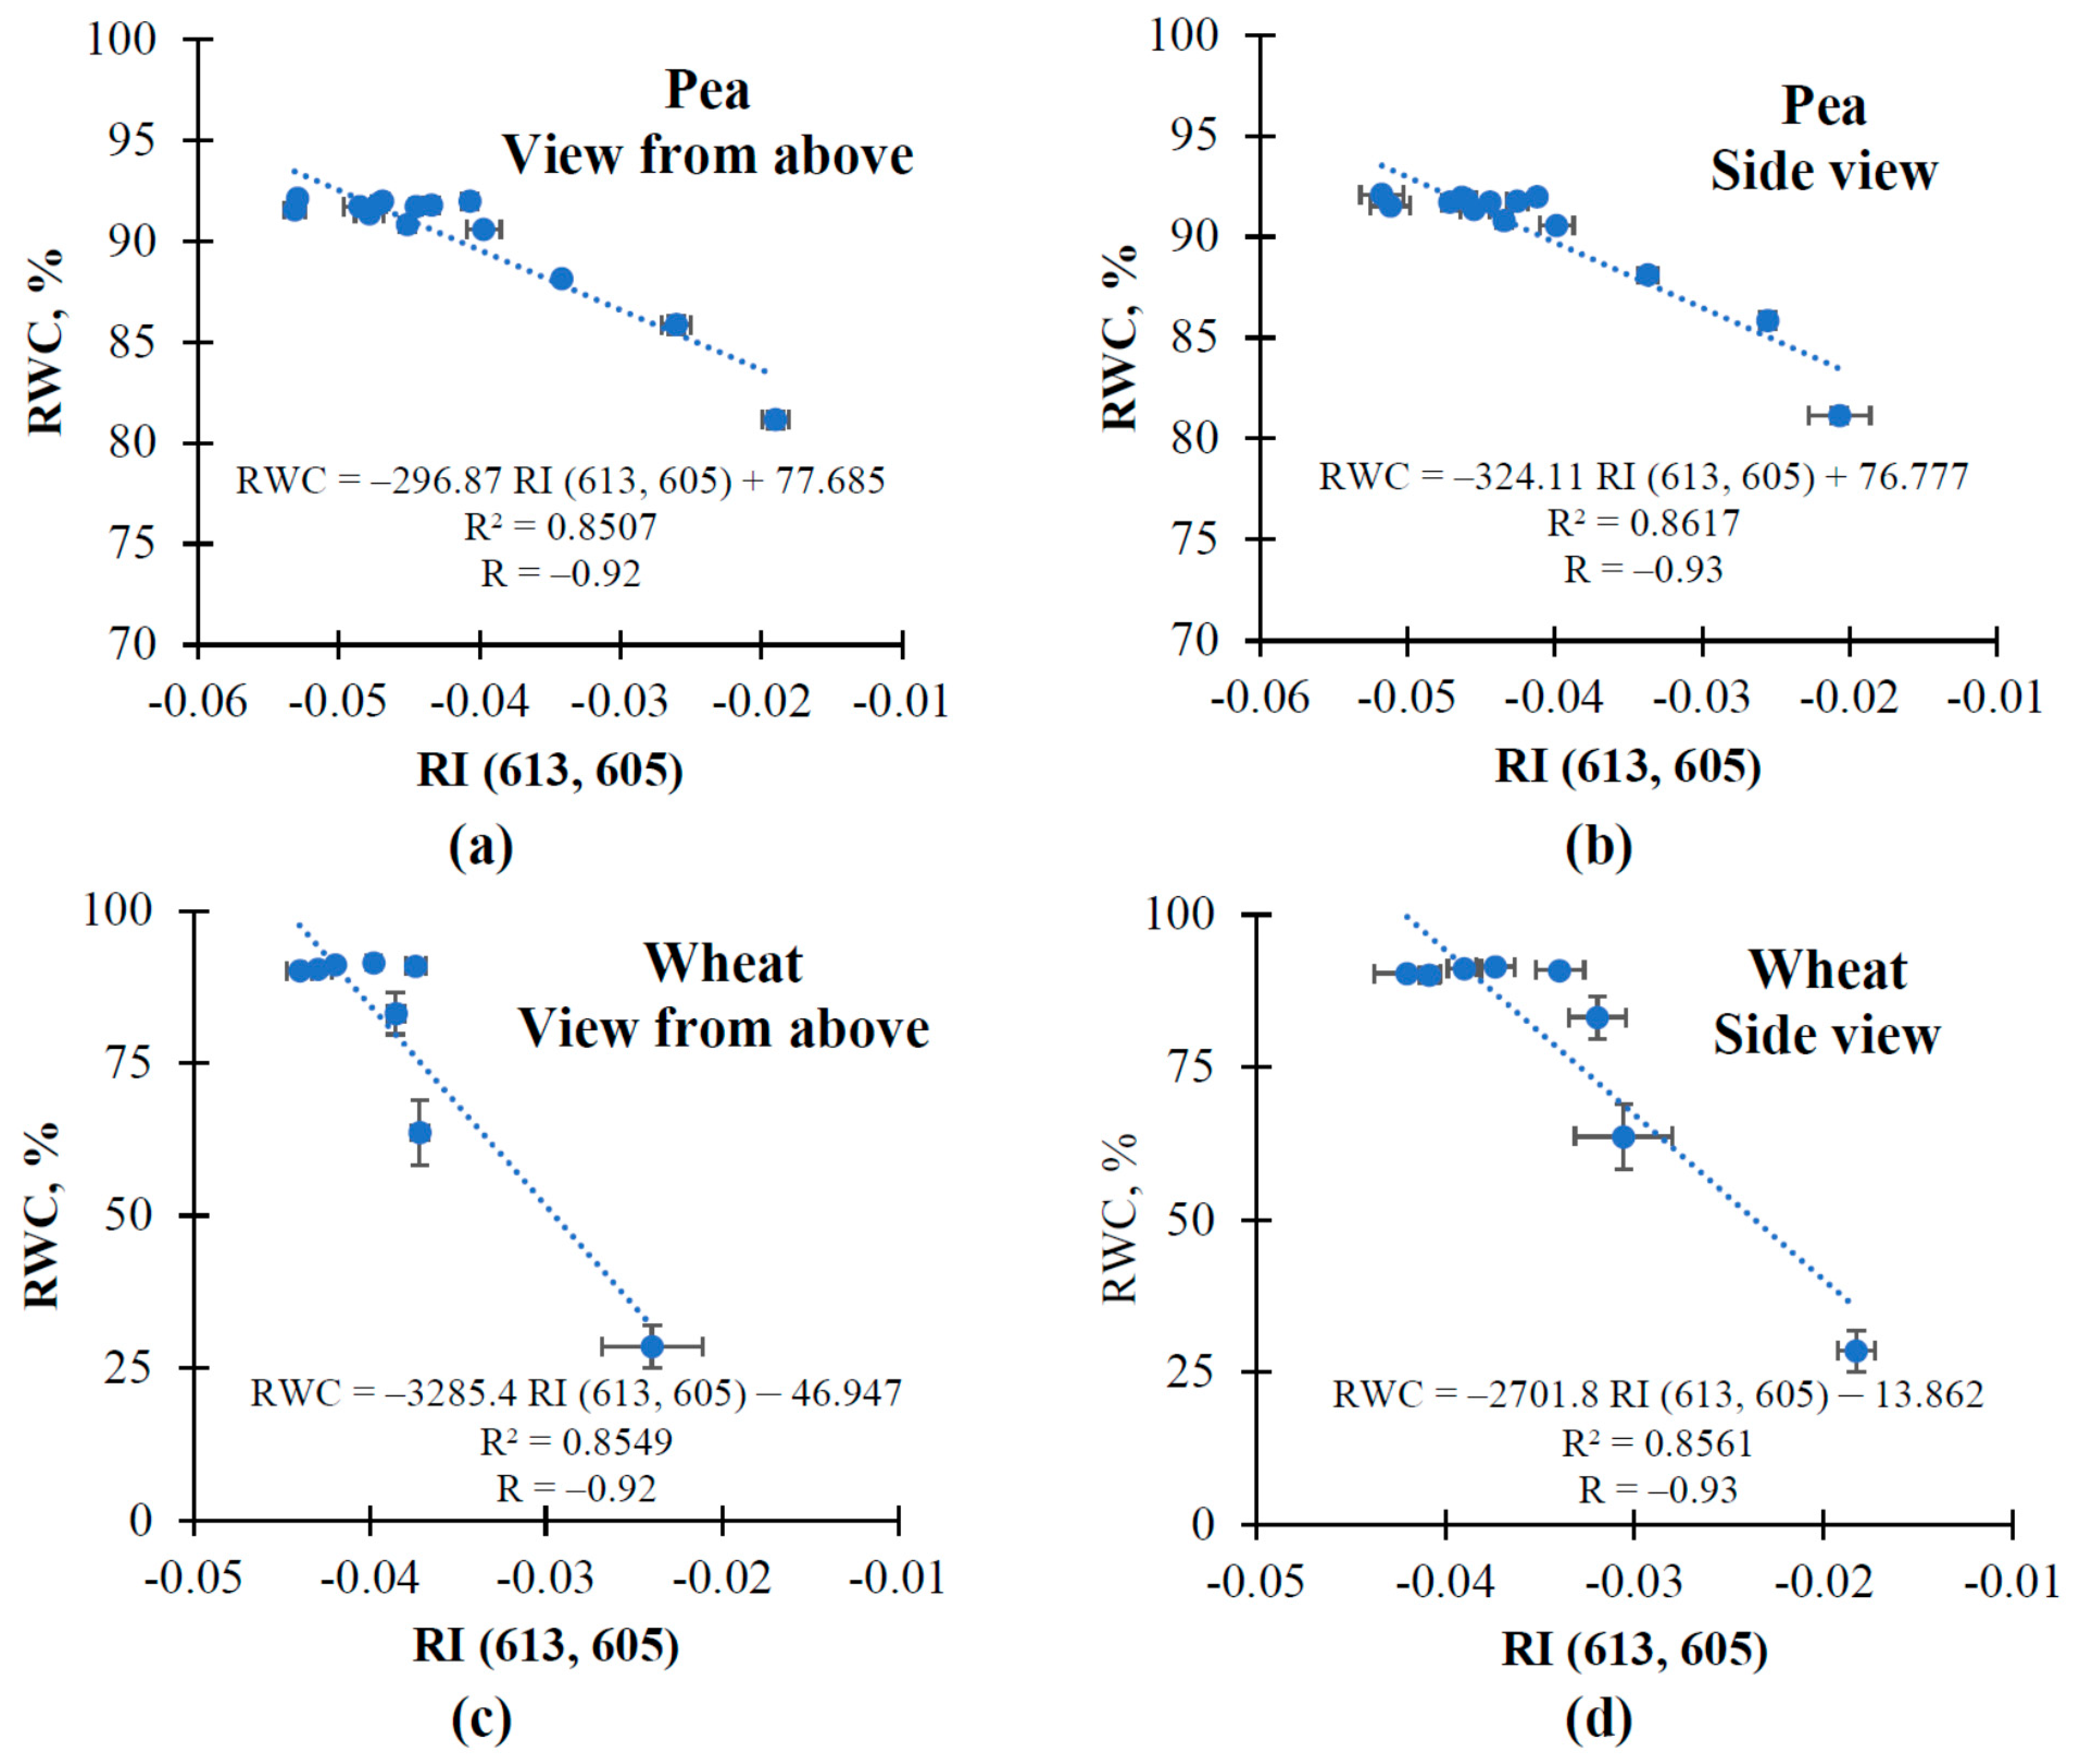
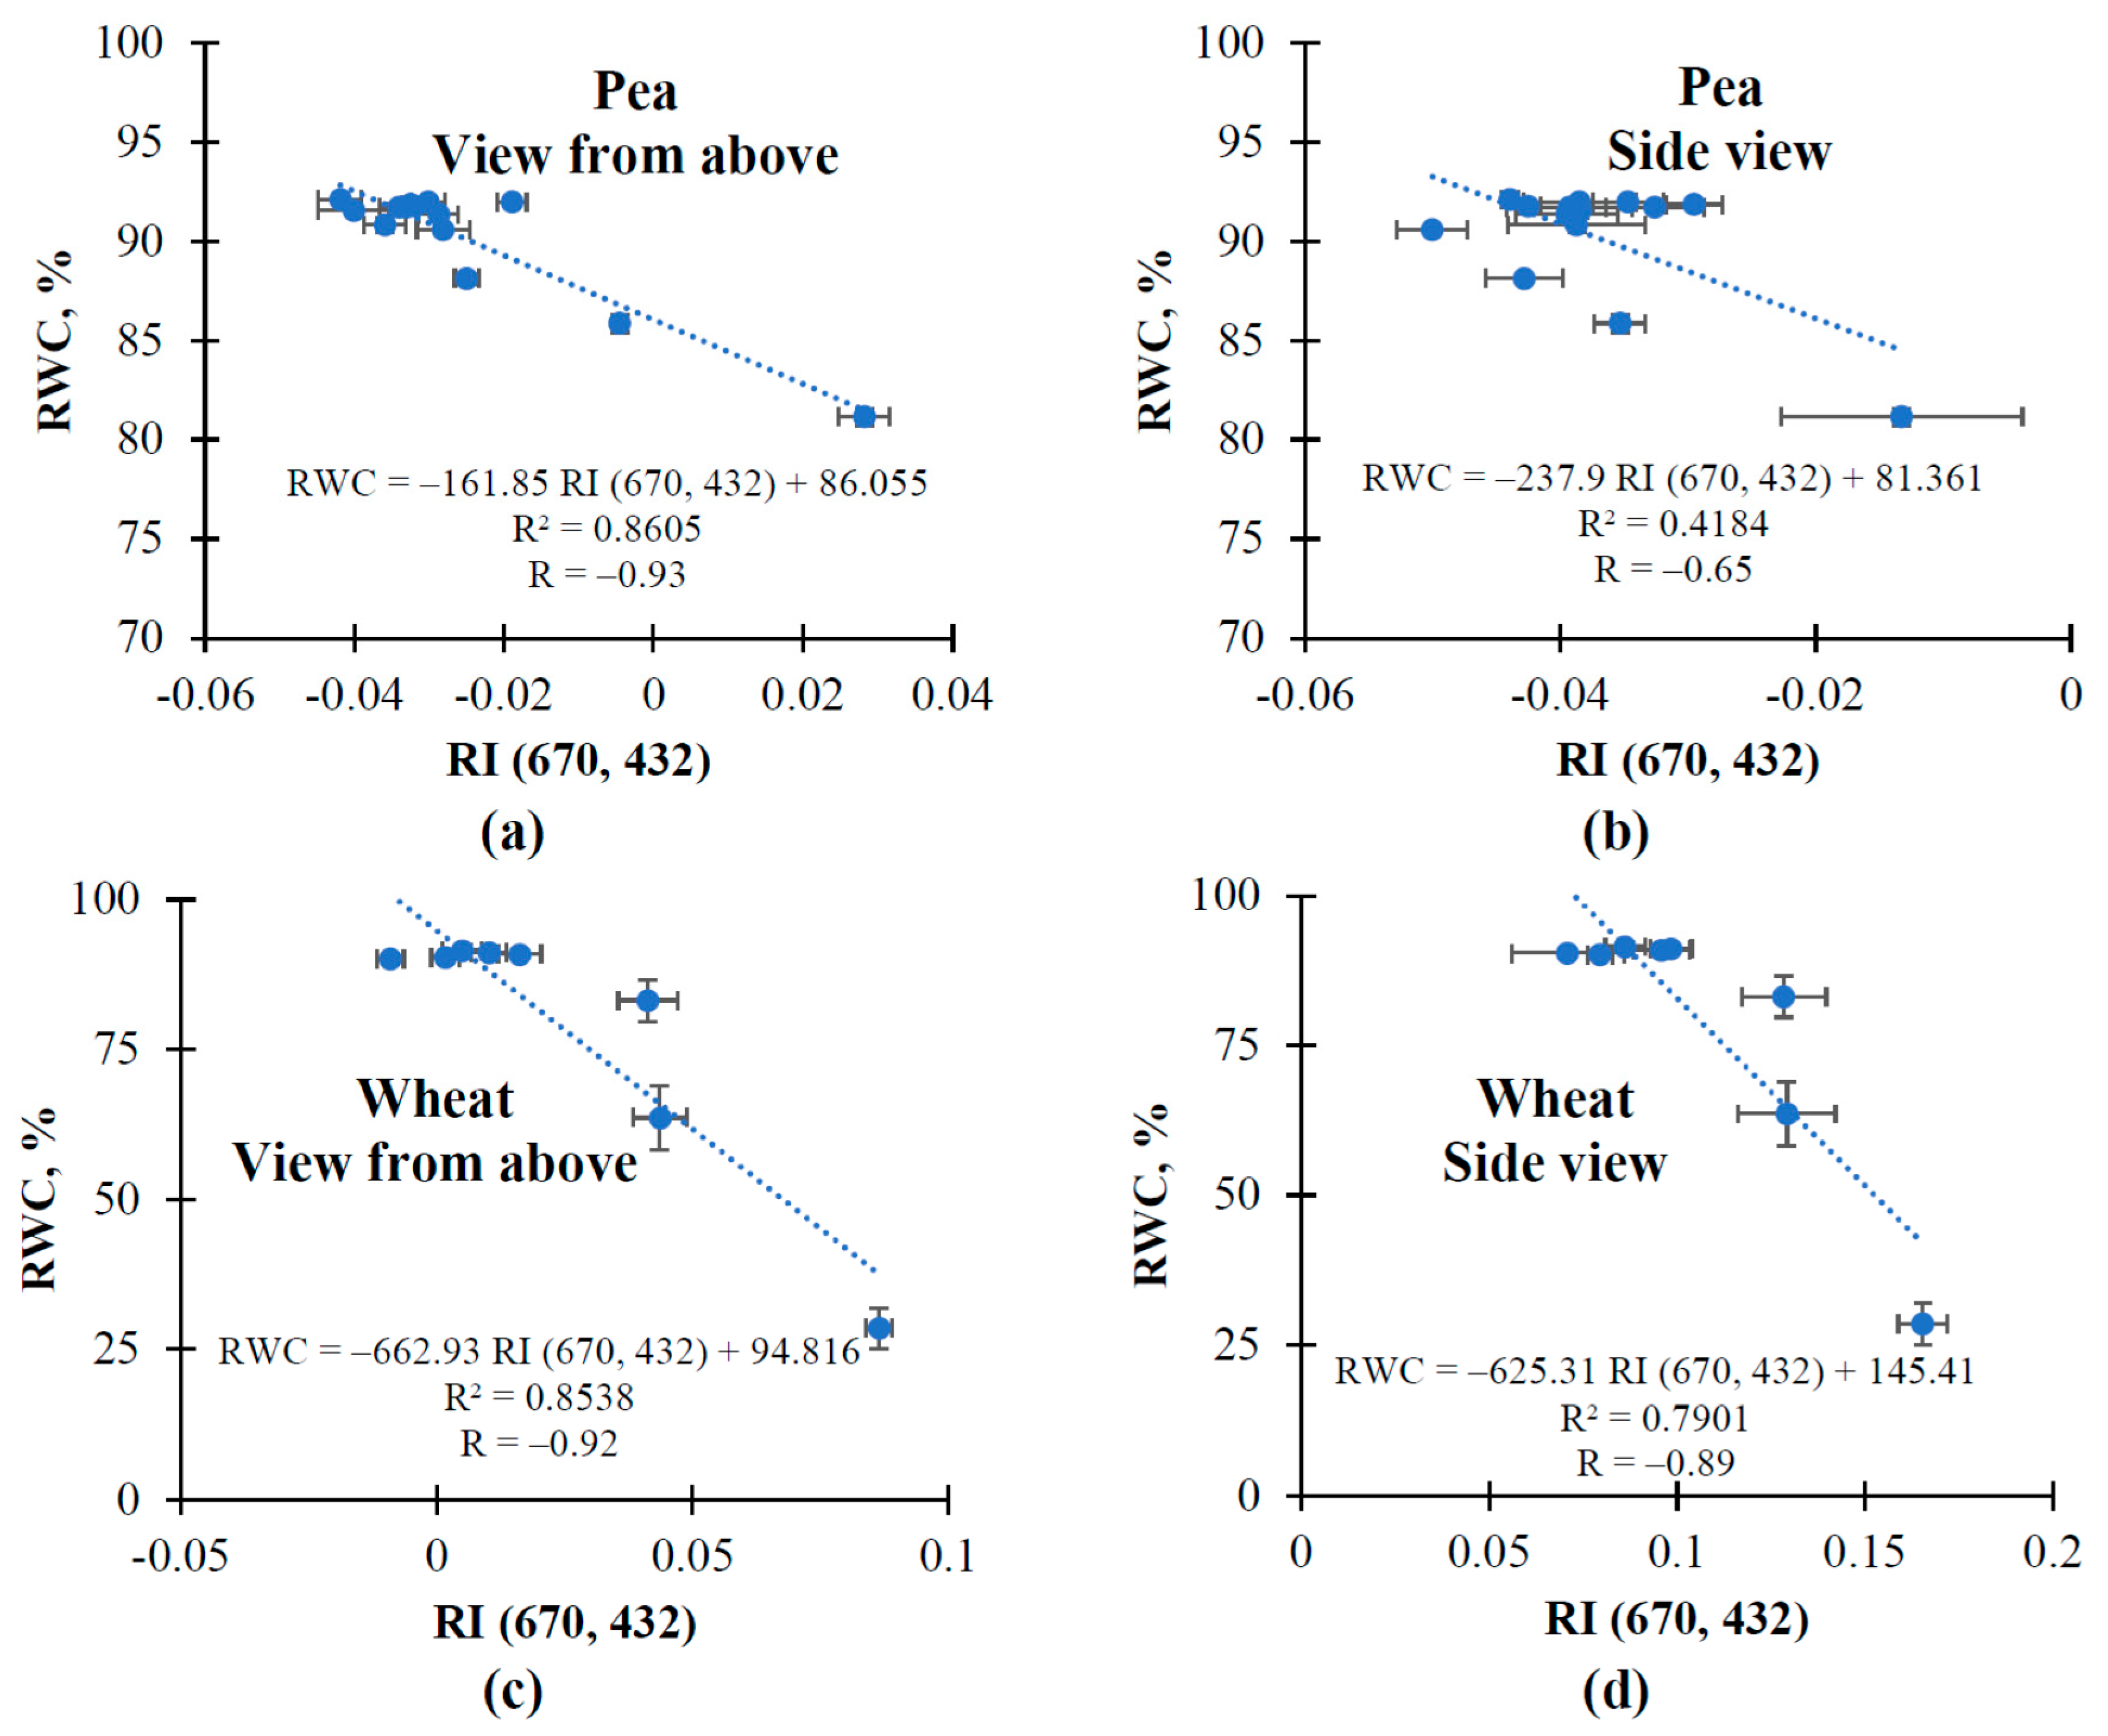
3.2. The Influence of Soil Drought on Reflectance Indices and RWC in Pea and Wheat under Controlled Conditions

We induced soil drought by the termination of plant irrigation. The soil drought continued for about 2 weeks for pea and 2.5 weeks for wheat plants; this drought was initiated in 2-old-week plants. The drought caused a significant decrease of RWC with maximal magnitude equaling to about 10% in pea and about 61% in wheat (Figure 2). Plants looked withered at the end of the drought. The significant differences between control and droughted pea plants were observed for all days of the drought; however, these differences were small at 1–5 days and large at 7–13 days (Figure 2a). The significant differences between the control and experimental wheat plants were observed after 14 days of soil drought (Figure 2b).
After this, we analyzed the changes in RI (613, 605) and RI (670, 432) in pea and wheat caused by soil drought. These indices were measured at the view from above (90°) and side view (45°). It was shown that RI (613, 605) and RI (670, 432) were the most effective indices for revealing soil drought’s action on pea and wheat plants among 46 other reflectance indices (Table 1), which were shown in [38]. Figure 3 shows the dynamics of changes in RI (613, 605).
For reflectance measurements from the view from above, significant differences between RI (613, 605) in control and experimental plants were initiated from the 5th day of soil drought in pea and from the 7th day in wheat (Figure 3a,c). It was shown that the dynamics of changes in RI (613, 605) were not modified at the measurement of reflectance from the side view. It should be additionally noted that measurements with different angles to the ground plane did not influence the values of RI (613, 605) and the magnitudes of its changes.
The correlation analysis showed strong negative linear relations between values of RI (613, 605) and RWC under development of the soil drought (Figure 4). Absolute values of these correlation coefficients were more than 0.9, and values of determination coefficients for linear regression were more than 0.85 (Figure 4). However, the magnitudes of changes in RI (613, 605) were relatively small.
RI (670, 432) was significantly changed from the 9th day of the soil drought in pea and from the 7–9 day in wheat (Figure 5). It was shown that RI (670, 432) was more sensitive to the angle of the camera at the reflectance measurements than RI (613, 605). Particularly, an increase in RI (670, 432) in pea was only observed during the final days of the soil drought at hyperspectral measurements from the side view (Figure 5b). In contrast, the increase of this index was observed from the 9th day of the soil drought from the view from above (Figure 5a). The changes in RI (670, 432) in wheat observed from measurements from the side view quantitatively differed from these changes measured from the view from above (Figure 5c,d).
The correlation analysis showed strong negative relations between RI (670, 432) and RWC from the measurement from the view from above (Figure 6). Absolute values of these correlation coefficients were more than 0.9 and determination coefficients for the linear regressions were more than 0.85. A significant relation was also observed in wheat plants from the reflectance measurements from the side view (R < −0.9, R2 > 0.85) (Figure 6d). However, the linear correlation between RI (670, 432) and RWC in pea from measurements from the side view was moderate (Figure 6b).

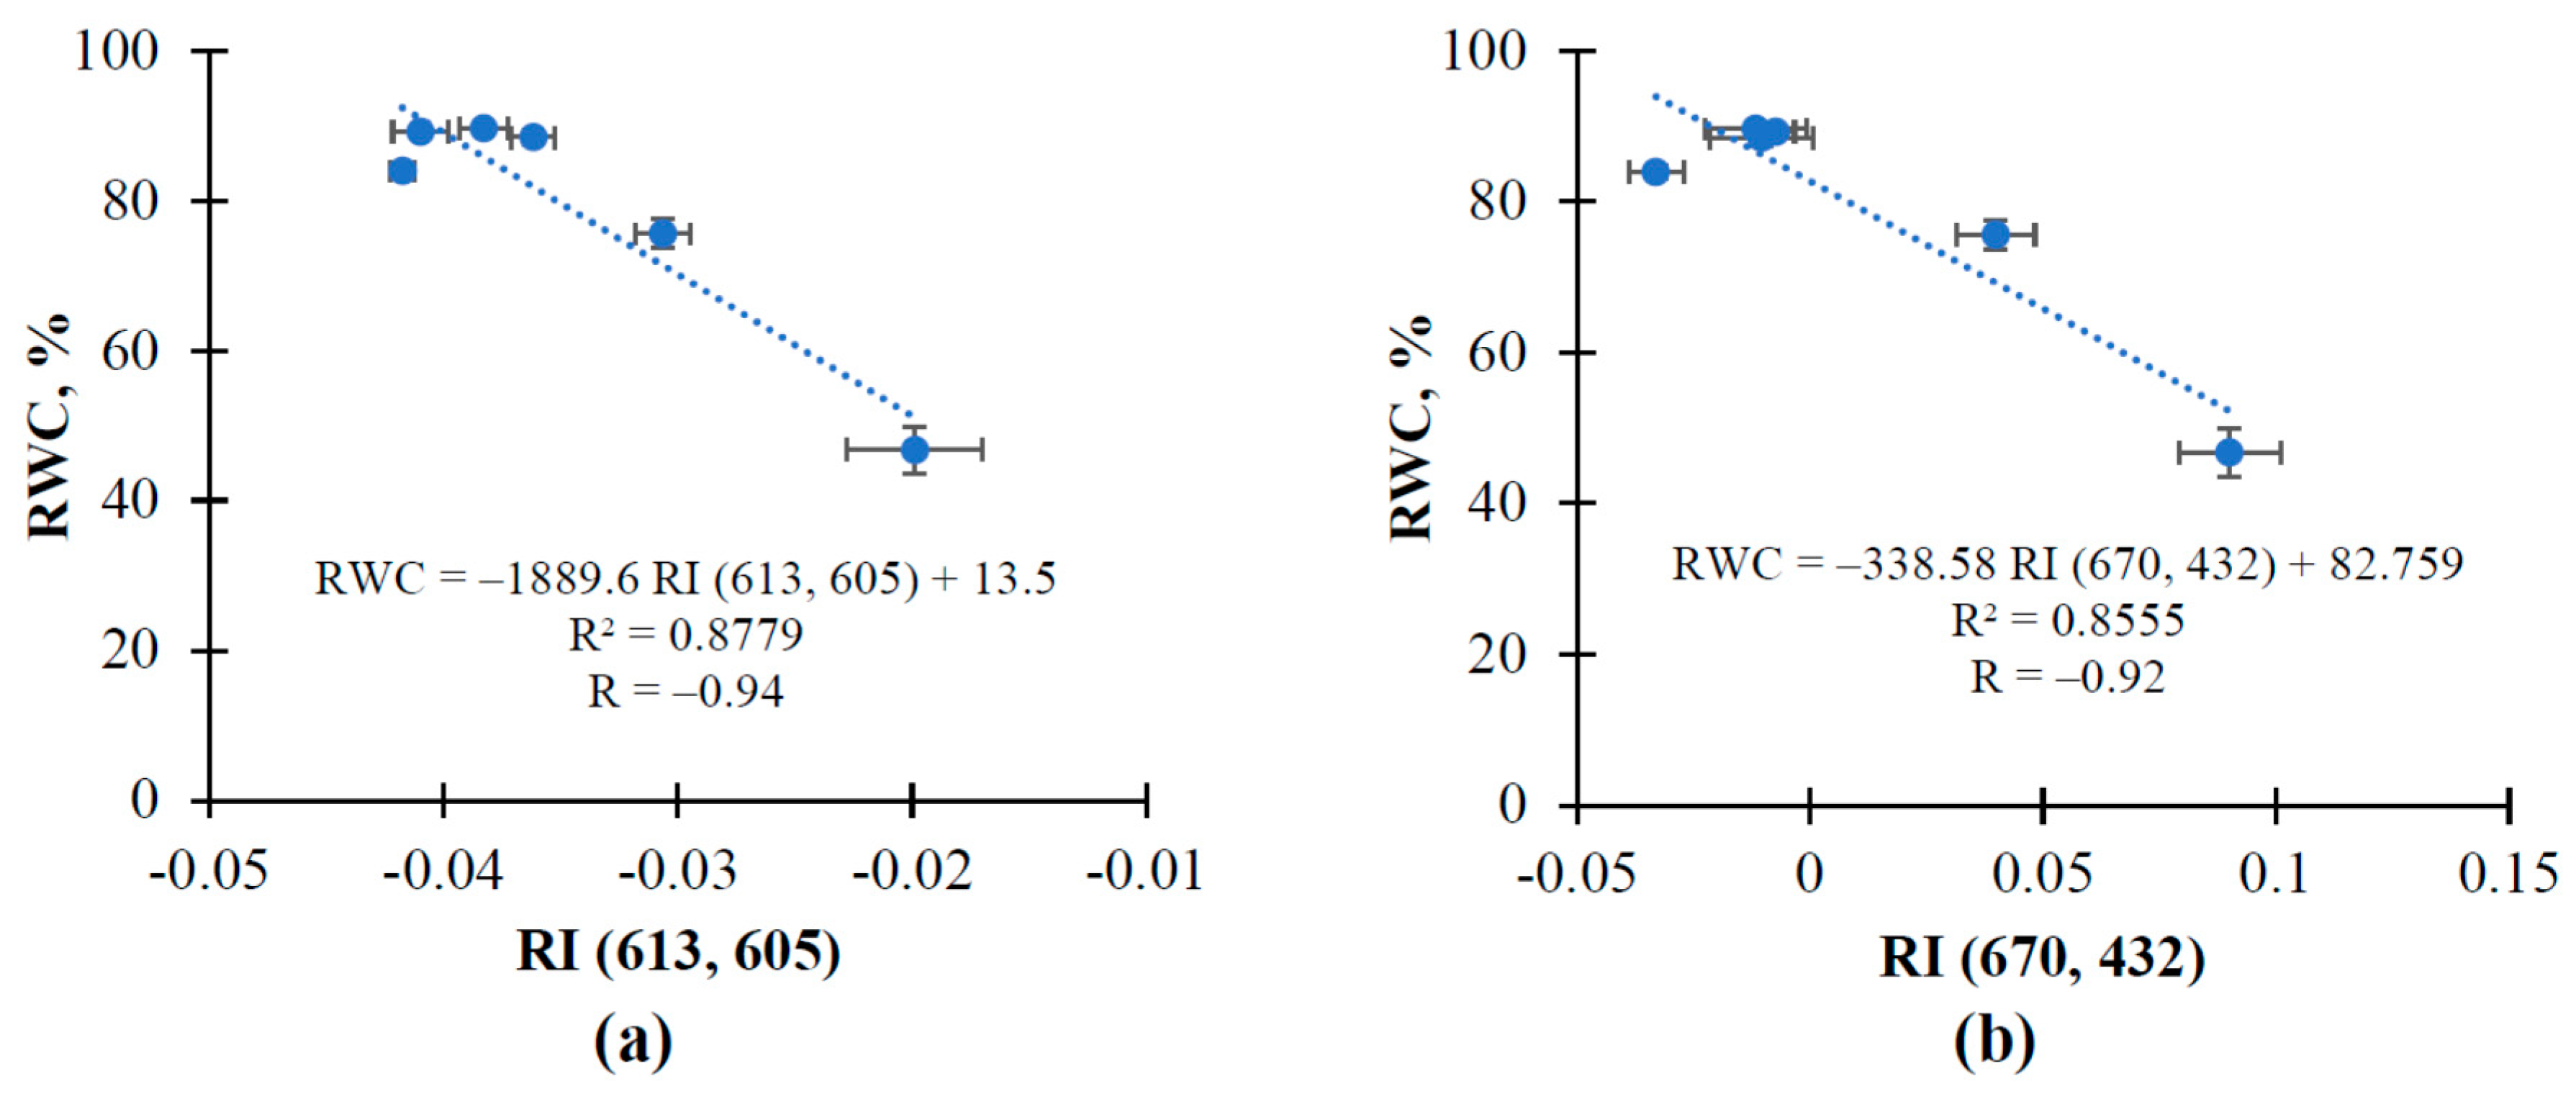
3.3. The Influence of Soil Drought on Reflectance Indices and RWC in Wheat under Open-Ground Conditions

In the next stage of the investigation, we analyzed the efficiency of RI (613, 605) and RI (670, 432) for revealing the action of soil drought on wheat plants which were cultivated under open-ground conditions. The hyperspectral measurements were only performed from the side view. It was shown that RWC was significantly decreased from the 8th day of the soil drought (Figure 7). The water loss was about 42% before the termination of the soil drought; plants were withered by this time.
Significant increases of reflectance indices were observed from the 5th day of the soil drought for RI (613, 605) (Figure 8a) and from the 7th day for RI (670, 432) (Figure 8b). The relations of these two indices to RWC were also strong: correlation coefficients were more negative than −0.9 and determination coefficients were more than 0.85 (Figure 9). This result showed that RI (613, 605) and RI (670, 432) were also effective for the estimation of the action of the soil drought on investigated plants under the open-ground conditions.

4. Discussion

Soil drought is an important environmental factor which can strongly decrease the productivity of agricultural plants [1,2]. Early revealing actions of soil drought on plants (including, maybe, spatially differentiated revealing) is a basis for further plant protection. Remote sensing of plant stress changes based on measurements of reflectance at specific spectral bands or measurements of whole reflectance spectra is the perspective tool for the revealing of the actions of drought on plants [38,45]. These measurements are used for the calculation of reflectance indices. There are the indices which are sensitive to the plant stress changes including drought (e.g., the water indices [39,40,41,42], pigment indices [43,44,45], or vegetation indices [44,46]). However, the development of new drought-sensitive RIs remains the important task.
Using complex analysis of all possible RIs, which were based on the spectral range of visible light, and the construction of heatmaps of significances and direction of difference between these RIs in control and experimental plants [38], we preliminarily revealed 46 RIs which were effective for the estimation of the short-term water shortage which was induced in pea plants by the termination of the irrigation of the sand growth substrate for 5 days. These RIs were strongly related to relative water content and maximal quantum yield of photosystem II in used experimental conditions (plant cultivation under controlled conditions and measurements in spatially fixed leaves by spectrometer); however, the efficiency of these indices required further checking. In this current work, we analyze the efficiencies of these RIs for revealing the influence of the prolonged soil drought on plants using two plant species (pea and wheat), the application of two variants of measurements (“view from above” with a 90° angle to the ground plane and “side view” with a 45° angle to the ground plane), measuring the canopy of investigated plants by hyperspectral camera, and the analysis of plants cultivated under conditions of the vegetation room and open-ground conditions.
We show (Table 1) that changes in reflectance indices in plants under action of the soil drought vary in a wide range for different RIs. Some of these indices are effective for soil drought for pea plants and some RIs can be used only for wheat plants. However, RI (670, 432) and RI (613, 605) are universally effective for indicating soil drought because the increase of these indices is observed in both pea and wheat plants; this result is in good accordance with the increase in these indices under short-term water shortage [38]. Conditions of measurement (view from above or side view, laboratory or open-ground conditions) do not strongly influence this efficiency. In contrast, RI (688, 432), which is also changed in all investigated variants (Table 1), is ambiguous, because it can increase (wheat) or decrease (pea) during soil drought.
These differences between current results and the results of our previous work [38] can be attributed to the following reasons. (i) Short-term water shortage can induce changes in RIs which are not observed in prolonged drought. The short-term water shortage in the sand growth substrate develops very quickly; the water loss is 13% for 5 days in pea plants [38]. In contrast, the water loss is 10% for 13 days in pea plants during soil drought (Figure 2a). Potentially, these differences in dynamic of the water loss under the short-term water shortage and prolonged soil drought can induce different plant stress responses. (ii) Different plant species can have specific characteristics of spectra of light absorption and reflectance [48,49]. A shift in these spectra can be caused by the formation of specific pigment–protein complexes [17], variations in pigment ratios [50,51], different leaf structures [16,49], and others. Some authors note individual optical signs of plants which can be related to their physiological state [48,52,53], i.e., plants of different species with different characteristics in their stress responses can have different changes in light absorption and reflectance spectra under the action of stressors. These points can explain differences in the responses of RIs in pea and wheat.
However, our past work [38] and the current investigation show that RI (613, 605) and RI (670, 432) are effective in different plant species, for both short-term water shortage and prolonged soil drought, for cultivation under the conditions of a vegetation room and open-ground conditions, and at different angles of measurements. Thus, RI (613, 605) and RI (670, 432) seem to be very interesting for practical application, and our current work is focused on these indices. Nevertheless, it should be noted that optical filters for the measurement of RI (613, 605) should have a very narrow spectral band that can restrict application of this index
RI (613, 605) has high sensitivity to the influence of soil drought on plants (Figure 3 and Figure 8) and strong relationships to the relative water content (Figure 4 and Figure 9a); soil drought increases RI (613, 605) in pea and wheat plants. It is known that the light absorption at about 613 and 605 nm wavelengths is related to concentrations of chlorophyll a (Chl a) and chlorophyll b (Chl b) [17,53]; contributions of these chlorophylls in light absorption is differed for 613 and 605 nm. Thus, we propose that RI (613, 605) can be related to the ratio of these chlorophylls (Chl a/Chl b). It is known that the degradation of chlorophylls has a response on the drought action. Most authors show that Chl a/Chl b is an important parameter for the estimation of plant stress development including drought stress [18,19]. The degradation of chlorophylls occurs at different rates: Chl a can be degraded slower than Chl b (and Chl a/Chl b increase) [18,54,55]; potentially, it can influence light reflectance at 613 and 605 nm and induce changes RI (613, 605).
RI (670, 432) is also increased under soil drought in all investigated variants (Table 1, Figure 5 and Figure 8). The spectra of light absorption by pigments show that 432 and 670 nm approximately correspond to peaks of Chl a; the light absorption at 432 nm wavelength is additionally related to carotenoids which absorb light in the blue spectral region (about 360–520 nm) [17,53]. It is known that the degradation rate of carotenoids under stress conditions is lower than that of chlorophylls [18,20,21]. This difference in the pigments’ degradation rates causes a decrease in light absorption in the red spectral range (related to absorption by Chl a) in comparison to this absorption in the blue spectral region (related to the light absorption by both Chl a and carotenoids); as a result, the difference (R670—R432) can be increased under drought because the decrease in light absorption increases reflectance. This mechanism is in a good accordance with the results of our previous investigation of broadband indices [56], which show that a drought-induced increase of reflectance in the red spectral range is more than the increase of reflectance in the blue spectral region.
Additionally, RI (688, 432), which has different directions of drought-induced changes in peas (significant decrease) and wheat (significant increase) (Table 1), can also be interesting for analysis. The absorption of light by Chl a and b at 688 nm wavelength is low [17]; i.e., changes in light absorption are not a probable reason for changes in R688. The hyperspectral camera can also measure chlorophyll fluorescence which has a spectral maximum at 683 nm [57]. This means that this emission of fluorescence caused by the redistribution of energy in photosynthetic apparatus can also increase apparent reflectance, and the difference (R688—R432) and RI (688, 432) can be increased in comparison with these parameters without fluorescence. It is known that the influence of stressors on fluorescence can be intricate: the overreduction of the photosynthetic electron transport chain should increase the chlorophyll fluorescence [58,59]; in contrast, stress-induced forming of the non-photochemical quenching of the chlorophyll fluorescence should decrease its intensity [23,60,61]. This means that stressors can increase or decrease RI (688, 432) at different ratios of processes stimulation and suppression of fluorescence (e.g., in different plant species) which is in good accordance with our results.
Further, we show that the angle of the camera for the reflectance measurements (45 or 90°) weakly influence values of RI (613, 605) (Figure 3) and the relationships between RI (613, 605) and RWC (Figure 4); however, the slope of linear regressions have some variations. RI (670, 432) is more sensitive to the angle of the camera for the reflectance measurements (Figure 5) because values of changes in this index can be dependent on this angle; slopes of linear regressions for RI (670, 432) also show some variations (Figure 6). Potentially, this result can be caused by different light absorption by leaves for blue and red light [62,63]; it means that reflectance at blue and red light can be dependent on the angle of measurement in different manners and indices based on the reflectance of both blue and red light can be more affected by the angle of measurement.
Finally, we show that RI (613, 605) and RI (670, 432) are also sensitive to the action of the soil drought (Figure 8) and are strongly related to RWC (Figure 9) under the open-ground condition. This result additionally supports that these indices can be used for the remote sensing of soil drought’s action on plants.
Thus, we show that RI (613, 605) and RI (670, 432) are effective for the estimation of the influence of soil drought on plants under controlled and open-ground conditions. It is important that these indices can be used for pea and wheat plants, which differ significantly in leaf optical properties. This means that we can expect that these indices will be also effective for other plant species. Analysis of the efficiency of RI (613, 605) and RI (670, 432) in the revealing action of other types of stressors in other plant species is an important task for future investigation.

5. Conclusions

In this current work, we analyzed the efficiency of 46 new reflectance indices based on the 400–700 nm spectral region for the estimation of plant changes induced by soil drought; these RIs were preliminarily revealed in our previous work [38]. We revealed two RIs (RI (613, 605) and RI (670, 432)), which were increased under the action of soil drought on plants. The correlations between these indices and relative water content in plants were strong. Revealed effects were observed in both pea and wheat plants, for plant cultivation under both controlled and open-ground conditions, and using different angles of measurements. It was probable that RI (613, 605) could be related to changes in the ratio between chlorophyll a and chlorophyll b, and RI (670, 432) could be related to the decrease of the ratio between chlorophylls and carotenoids.
Thus, RI (613, 605) and RI (670, 432) seem to be an effective tool for the remote sensing of plant changes under soil drought. It is probable that these indices can be an effective tool for the remote sensing of plants under the action of other stressors; however, this problem requires further investigation.

Supplementary Materials

The following supporting information can be downloaded at: https://www.mdpi.com/article/10.3390/rs14071731/s1, Figure S1: Schema of pots arrangement at the cultivation of plant in vegetation room and under open-ground conditions, Figure S2: Changes in relative water content (RWC) in the soil at drought in vegetation room and under open-ground conditions (n = 6), Figure S3: Examples of RGB image and pseudocolor RI image after excluding background.

Author Contributions

Conceptualization, E.S. and V.S.; methodology, D.K., A.K. and L.Y.; software, E.S.; formal analysis, E.S. and D.K.; investigation, D.K., A.K., L.Y., Y.Z. and E.G.; writing—original draft preparation, E.S.; writing—review and editing, V.S.; supervision, V.S.; project administration, V.S.; funding acquisition, E.S. and V.S. All authors have read and agreed to the published version of the manuscript.

Funding

The analysis of efficiency of new normalized difference reflectance indices, which were investigated in laboratory conditions from the 90° angle of measurement and in open-ground conditions, for revealing the soil drought was funded by the Russian Foundation for Basic Research, project number 20-016-00234 A. The analysis of the efficiency of the new normalized difference reflectance indices, which were investigated in laboratory conditions at the 45° angle of measurement, for revealing the soil drought were funded by the Russian Science Foundation, project number 17-76-20032.

Institutional Review Board Statement

Not applicable.

Informed Consent Statement

Not applicable.

Data Availability Statement

The data presented in this study are available upon request from the corresponding author.

Conflicts of Interest

The authors declare no conflict of interest. The funders had no role in the design of the study; in the collection, analyses, or interpretation of data; in the writing of the manuscript, or in the decision to publish the results.

References

  1. Fahad, S.; Bajwa, A.A.; Nazir, U.; Anjum, S.A.; Farooq, A.; Zohaib, A.; Sadia, S.; Nasim, W.; Adkins, S.; Saud, S.; et al. Crop production under drought and heat stress: Plant responses and management options. Front Plant Sci. 2017, 8, 1147. [Google Scholar] [CrossRef] [PubMed] [Green Version]
  2. Hatfield, J.L.; Boote, K.J.; Kimball, B.A.; Ziska, L.H.; Izaurralde, R.C.; Ort, D.; Thomson, A.M.; Wolfe, D. Climate impacts on agriculture: Implications for crop production. Agron. J. 2011, 103, 351. [Google Scholar] [CrossRef] [Green Version]
  3. Hatfield, J.L. Climate change: Challenges for future crop adjustments. In Climate Change and Plant Abiotic Stress Tolerance; Tuteja, N., Gill, S.S., Eds.; Wiley-VCH: Hoboken, NJ, USA, 2013; pp. 1–26. [Google Scholar]
  4. Zhang, T.; Su, X.; Zhang, G.; Wu, H.; Wang, G.; Chu, J. Evaluation of the impacts of human activities on propagation from meteorological drought to hydrological drought in the Weihe River Basin, China. Sci. Tot. Environ. 2022, 819, 153030. [Google Scholar] [CrossRef]
  5. Akhtar, N.; Ishak, M.I.S.; Bhawani, S.A.; Umar, K. Various natural and anthropogenic factors responsible for water quality degradation: A review. Water 2021, 13, 2660. [Google Scholar] [CrossRef]
  6. Osakabe, Y.; Osakabe, K.; Shinozaki, K. Plant environmental stress responses for survival and biomass enhancement. In Climate Change and Plant Abiotic Stress Tolerance; Tuteja, N., Gill, S.S., Eds.; Wiley-VCH: Hoboken, NJ, USA, 2013; pp. 79–108. [Google Scholar]
  7. Ripoll, J.; Urban, L.; Staudt, M.; Lopez-Lauri, F.; Bidel, L.P.R.; Bertin, N. Water shortage and quality of fleshy fruits—making the most of the unavoidable. J. Exp. Bot. 2014, 65, 4097–4117. [Google Scholar] [CrossRef] [PubMed] [Green Version]
  8. Rossini, M.; Meroni, M.; Migliavacca, M.; Manca, G.; Cogliati, S.; Busetto, L.; Picchi, V.; Cescatti, A.; Seufert, G.; Colombo, R. High resolution field spectroscopy measurements for estimating gross ecosystem production in a rice field. Agric. For. Meteorol. 2010, 150, 1283–1296. [Google Scholar] [CrossRef]
  9. Porcar-Castell, A.; Garcia-Plazaola, J.I.; Nichol, C.J.; Kolari, P.; Olascoaga, B.; Kuusinen, N.; Fernández-Marín, B.; Pulkkinen, M.; Juurola, E.; Nikinmaa, E. Physiology of the seasonal relationship between the photochemical reflectance index and photsynthetic light use efficiency. Oecologia 2012, 170, 313–323. [Google Scholar] [CrossRef] [PubMed]
  10. Xing, N.; Huang, W.; Xie, Q.; Shi, Y.; Ye, H.; Dong, Y.; Wu, M.; Sun, G.; Jiao, Q.A. Transformed triangular vegetation index for estimating winter wheat leaf area index. Remote Sens. 2020, 12, 16. [Google Scholar] [CrossRef] [Green Version]
  11. Mahlein, A.-K.; Rumpf, T.; Welke, P.; Dehne, H.-W.; Plümer, L.; Steiner, U.; Oerke, E.-C. Development of spectral indices for detecting and identifying plant diseases. Remote Sens. Environ. 2013, 128, 21–30. [Google Scholar] [CrossRef]
  12. El-Hendawy, S.; Al-Suhaibani, N.; Dewir, Y.H.; Elsayed, S.; Alotaibi, M.; Hassan, W.; Refay, Y.; Tahir, M.U. Ability of modifiedspectral reflectance indices for estimating growth and photosynthetic efficiency of wheat under saline field conditions. Agronomy 2019, 9, 35. [Google Scholar] [CrossRef] [Green Version]
  13. Jang, G.; Kim, J.; Yu, J.-K.; Kim, H.-J.; Kim, Y.; Kim, D.-W.; Kim, K.-H.; Lee, C.W.; Chung, Y.S. Review: Cost-effective unmanned aerial vehicle (UAV) platform for field plant breeding application. Remote Sens. 2020, 12, 998. [Google Scholar] [CrossRef] [Green Version]
  14. Paulus, S.; Mahlein, A.-K. Technical workflows for hyperspectral plant image assessment and processing on the greenhouse and laboratory scale. GigaScience 2020, 9, 1–10. [Google Scholar] [CrossRef] [PubMed]
  15. Xue, J.; Su, B. Significant remote sensing vegetation indices: A review of developments and applications. J. Sens. 2017, 2017, 2–17. [Google Scholar] [CrossRef] [Green Version]
  16. Kior, A.; Sukhov, V.; Sukhova, E. Application of reflectance indices for remote sensing of plants and revealing actions of stressors. Photonics 2021, 8, 582. [Google Scholar] [CrossRef]
  17. Kume, A.; Akitsu, T.; Nasahara, K.N. Why is chlorophyll b only used in light-harvesting systems? J. Plant Res. 2018, 131, 961–972. [Google Scholar] [CrossRef] [PubMed] [Green Version]
  18. Liu, C.; Liu, Y.; Guo, K.; Fan, D.; Li, G.; Zheng, Y.; Yu, L.; Yang, R. Effect of drought on pigments, osmotic adjustment and antioxidant enzymes in six woody plant species in karst habitats of southwestern China. Environ. Exp. Bot. 2011, 71, 174–183. [Google Scholar] [CrossRef]
  19. Maina, J.N.; Wang, Q. Seasonal response of chlorophyll a/b ratio to stress in a typical desert species: Haloxylon ammodendron. Arid Land Res. Manag. 2015, 29, 321–334. [Google Scholar] [CrossRef]
  20. Merzlyak, M.N.; Gitelson, A.A.; Chivkunova, O.B.; Rakitin, V.Y. Non-destructive optical detection of pigment changes during leaf senescence and fruit ripening. Physiol. Plant. 1999, 106, 135–141. [Google Scholar] [CrossRef] [Green Version]
  21. Sims, D.A.; Gamon, J.A. Relationships between leaf pigment content and spectral reflectance across a wide range of species, leaf structures and developmental stages. Remote Sens. Environ. 2002, 81, 337–354. [Google Scholar] [CrossRef]
  22. Demmig-Adams, B. Carotenoids and photoprotection in plants: A role for the xanthophyll zeaxanthin. Biochim. Biophys. Acta 1990, 1020, 1–24. [Google Scholar] [CrossRef]
  23. Ruban, A.V. Nonphotochemical chlorophyll fluorescence quenching: Mechanism and effectiveness in protecting plants from photodamage. Plant Physiol. 2016, 170, 1903–1916. [Google Scholar] [CrossRef] [PubMed] [Green Version]
  24. Gould, K.S. Nature’s Swiss army knife: The diverse protective roles of anthocyanins in leaves. J. Biomed. Biotech. 2004, 2004, 314–320. [Google Scholar] [CrossRef] [PubMed] [Green Version]
  25. Zhang, C.; Filella, I.; Garbulsky, M.F.; Peñuelas, J. Affecting factors and recent improvements of the photochemical reflectance index (PRI) for remotely sensing foliar, canopy and ecosystemic radiation-use efficiencies. Remote Sens. 2016, 8, 677. [Google Scholar] [CrossRef] [Green Version]
  26. Gamon, J.A.; Serrano, L.; Surfus, J.S. The photochemical reflectance index: An optical indicator of photosynthetic radiation use efficiency across species, functional types, and nutrient levels. Oecologia 1997, 112, 492–501. [Google Scholar] [CrossRef] [PubMed]
  27. Sukhova, E.M.; Yudina, L.M.; Vodeneev, V.A.; Sukhov, V.S. Analysis of changes in photochemical reflectance index (PRI) in relation to the acidification of the lumen of the chloroplasts of pea and geranium leaves under a short-term illumination. Bichem. Suppl. Ser. A 2019, 13, 243–252. [Google Scholar] [CrossRef]
  28. Filella, I.; Porcar-Castell, A.; Munné-Bosch, S.; Bäck, J.; Garbulsky, M.F.; Peñuelas, J. PRI assessment of long-term changes in carotenoids/chlorophyll ratio and short-term changes in de-epoxidation state of the xanthophyll cycle. Int. J. Remote Sens. 2009, 30, 4443–4455. [Google Scholar] [CrossRef]
  29. Filella, I.; Peñuelas, J.; Llorens, L.; Estiarte, M. Reflectance assessment of seasonal and annual changes in biomass and CO2 uptake of a Mediterranean shrubland submitted to experimental warming and drought. Remote Sens. Environ. 2004, 90, 308–318. [Google Scholar] [CrossRef]
  30. Sun, P.; Wahbi, S.; Tsonev, T.; Haworth, M.; Liu, S.; Centritto, M. On the use of leaf spectral indices to assess water status and photosynthetic limitations in Olea europaea L. during water-stress and recovery. PLoS ONE 2014, 9, e105165. [Google Scholar] [CrossRef] [Green Version]
  31. Garbulsky, M.F.; Peñuelas, J.; Ogaya, R.; Filella, I. Leaf and stand-level carbon uptake of a Mediterranean forest estimated using the satellite-derived reflectance indices EVI and PRI. Int. J. Remote Sens. 2013, 34, 1282–1296. [Google Scholar] [CrossRef]
  32. Soudani, K.; Hmimina, G.; Dufrêne, E.; Berveiller, D.; Delpierre, N.; Ourcival, J.M.; Rambal, S.; Joffre, R. Relationships between photochemical reflectance index and light-use efficiency in deciduous and evergreen broadleaf forests. Remote Sens. Environ. 2014, 144, 73–84. [Google Scholar] [CrossRef]
  33. Garbulsky, M.F.; Peñuelas, J.; Gamon, J.; Inoue, Y.; Filella, I. The photochemical reflectance index (PRI) and the remote sensing of leaf, canopy and ecosystem radiation use efficiencies. A review and meta-analysis. Remote Sens. Environ. 2011, 115, 281–297. [Google Scholar] [CrossRef]
  34. Huang, J.; Wei, C.; Zhang, Y.; Blackburn, G.A.; Wang, X.; Wei, C.; Wang, J. Meta-analysis of the detection of plant pigment concentrations using hyperspectral remotely sensed data. PLoS ONE 2015, 10, e0137029. [Google Scholar] [CrossRef] [PubMed] [Green Version]
  35. Sukhova, E.; Sukhov, V. Connection of the Photochemical Reflectance Index (PRI) with the photosystem II quantum yield and nonphotochemical quenching can be dependent on variations of photosynthetic parameters among investigated plants: A meta-analysis. Remote Sens. 2018, 10, 771. [Google Scholar] [CrossRef] [Green Version]
  36. Balzarolo, M.; Peñuelas, J.; Filella, I.; Portillo-Estrada, M.; Ceulemans, R. Assessing ecosystem isoprene emissions by hyperspectral remote sensing. Remote Sens. 2018, 10, 1086. [Google Scholar] [CrossRef] [Green Version]
  37. Sukhova, E.; Yudina, L.; Gromova, E.; Ryabkova, A.; Vodeneev, V.; Sukhov, V. Influence of local burning on difference reflectance indices based on 400–700 nm wavelengths in leaves of pea seedlings. Plants 2021, 10, 878. [Google Scholar] [CrossRef]
  38. Sukhova, E.; Yudina, L.; Gromova, E.; Ryabkova, A.; Kior, D.; Sukhov, V. Complex analysis of the efficiency of difference reflectance indices on the basis of 400–700 nm wavelengths for revealing the influences of water shortage and heating on plant seedlings. Remote Sens. 2021, 13, 962. [Google Scholar] [CrossRef]
  39. Gao, B. NDWI—A normalized difference water index for remote sensing of vegetation liquid water from space. Remote Sens. Environ. 1996, 58, 257–266. [Google Scholar] [CrossRef]
  40. Penuelas, J.; Pinol, J.; Ogaya, R.; Filella, I. Estimation of plant water concentration by the reflectance Water Index WI (R900/R970). Int. J. Remote Sens. 1997, 18, 2869–2875. [Google Scholar] [CrossRef]
  41. Ceccato, P.; Flasse, S.; Tarantola, S.; Jacquemoud, S.; Grégoire, J.-M. Detecting vegetation leaf water content using reflectance in the optical domain. Remote Sens. Environ. 2001, 77, 22–33. [Google Scholar] [CrossRef]
  42. Wang, L.; Qu, J. NMDI: A normalized multi-band drought index for monitoring soil and vegetation moisture with satellite remote sensing. Geophys. Res. Lett. 2007, 34, L20405. [Google Scholar] [CrossRef]
  43. Peguero-Pina, J.J.; Morales, F.; Flexas, J.; Gil-Pelegrín, E.; Moya, I. Photochemistry, remotely sensed physiological reflectance index and de-epoxidation state of the xanthophyll cycle in Quercus coccifera under intense drought. Oecologia 2008, 156, 1–11. [Google Scholar] [CrossRef]
  44. Mänd, P.; Hallik, L.; Peñuelas, J.; Nilson, T.; Duce, P.; Emmett, B.A.; Beier, C.; Estiarte, M.; Garadnai, J.; Kalapos, T.; et al. Responses of the reflectance indices PRI and NDVI to experimental warming and drought in European shrublands along a north-south climatic gradient. Remote Sens. Environ. 2010, 114, 626–636. [Google Scholar] [CrossRef]
  45. Guarini, R.; Nichol, C.; Clement, R.; Loizzo, R.; Grace, J.; Borghetti, M. The utility of MODIS-sPRI for investigating the photosynthetic light-use efficiency in a Mediterranean deciduous forest. Int. J. Remote Sens. 2014, 35, 6157–6172. [Google Scholar] [CrossRef]
  46. Sruthi, S.; Aslam, M.A.M. Agricultural drought analysis using the NDVI and land surface temperature data; a case study of Raichur district. Aquat. Procedia 2015, 4, 1258–1264. [Google Scholar] [CrossRef]
  47. Glantz, S.A. Primer of Biostatistics, 4th ed.; McGraw-Hill: New York, NY, USA, 1997; 473p. [Google Scholar]
  48. Ustin, S.L.; Gamon, J.A. Remote sensing of plant functional types. New Phytol. 2010, 186, 795–816. [Google Scholar] [CrossRef] [PubMed]
  49. Ollinger, S.V. Sources of variability in canopy reflectance and the convergent properties of plants. New Phytol. 2011, 189, 375–394. [Google Scholar] [CrossRef] [PubMed]
  50. Esteban, R.; Barrutia, O.; Artetxe, U.; Fernández-Marín, B.; Hernández, A.; García-Plazaola, J.I. Internal and external factors affecting photosynthetic pigment composition in plants: A meta-analytical approach. New Phytol. 2015, 206, 268–280. [Google Scholar] [CrossRef] [PubMed]
  51. Ma, X.; Migliavacca, M.; Wirth, C.; Bohn, F.J.; Huth, A.; Richter, R.; Mahecha, M.D. Monitoring plant functional diversity using the reflectance and echo from space. Remote Sens. 2020, 12, 1248. [Google Scholar] [CrossRef] [Green Version]
  52. Mahlein, A.-K. Plant disease detection by imaging sensors—Parallels and specific demands for precision agriculture and plant phenotyping. Plant Dis. 2016, 100, 241–251. [Google Scholar] [CrossRef] [Green Version]
  53. Schwieterman, E.W. Surface and Temporal Biosignatures. In Handbook of Exoplanet; Deeg, H., Belmonte, J., Eds.; Springer: Cham, Switzerland, 2018; pp. 2–26. [Google Scholar]
  54. Batra, N.G.; Sharma, V.; Kumari, N. Drought-induced changes in chlorophyll fluorescence, photosynthetic pigments, and thylakoid membrane proteins of Vigna radiata. J. Plant Interact. 2014, 9, 712–721. [Google Scholar] [CrossRef] [Green Version]
  55. Guo, Y.Y.; Yu, H.Y.; Kong, D.S.; Yan, F.; Zhang, Y.-J. Effects of drought stress on growth and chlorophyll fluorescence of Lycium ruthenicum Murr. seedlings. Photosynthetica 2016, 54, 524–531. [Google Scholar] [CrossRef]
  56. Sukhova, E.; Yudina, L.; Gromova, E.; Nerush, V.; Vodeneev, V.; Sukhov, V. Burning-induced electrical signals influence broadband reflectance indices and water index in pea leaves. Plant Signal. Behav. 2020, 15, 1737786. [Google Scholar] [CrossRef] [PubMed]
  57. Pedrós, R.; Moya, I.; Goulas, Y.; Jacquemoud, S. Chlorophyll fluorescence emission spectrum inside a leaf. Photochem. Photobiol. Sci. 2008, 7, 498–502. [Google Scholar] [CrossRef] [PubMed] [Green Version]
  58. Kalaji, H.M.; Schansker, G.; Ladle, R.J.; Goltsev, V.; Bosa, K.; Allakhverdiev, S.I.; Brestic, M.; Bussotti, F.; Calatayud, A.; Dabrowski, P.; et al. Frequently asked questions about in vivo chlorophyll fluorescence: Practical issues. Photosynth. Res. 2014, 122, 121–158. [Google Scholar] [CrossRef] [Green Version]
  59. Kalaji, H.M.; Schansker, G.; Brestic, M.; Bussotti, F.; Calatayud, A.; Ferroni, L.; Goltsev, V.; Guidi, L.; Jajoo, A.; Li, P.; et al. Frequently asked questions about chlorophyll fluorescence, the sequel. Photosynth. Res. 2017, 132, 13–66. [Google Scholar] [CrossRef] [PubMed] [Green Version]
  60. Müller, P.; Li, X.P.; Niyogi, K.K. Non-photochemical quenching. A response to excess light energy. Plant Physiol. 2001, 125, 1558–1566. [Google Scholar] [CrossRef] [PubMed] [Green Version]
  61. Porcar-Castell, A.; Tyystjärvi, E.; Atherton, J.; van der Tol, C.; Flexas, J.; Pfündel, E.E.; Moreno, J.; Frankenberg, C.; Berry, J.A. Linking chlorophyll a fluorescence to photosynthesis for remote sensing applications: Mechanisms and challenges. J. Exp. Bot. 2014, 65, 4065–4095. [Google Scholar] [CrossRef] [PubMed]
  62. Oguchi, R.; Douwstra, P.; Fujita, T.; Chow, W.S.; Terashima, I. Intra-leaf gradients of photoinhibition induced by different color lights: Implications for the dual mechanisms of photoinhibition and for the application of conventional chlorophyll fluorometers. New Phytol. 2011, 191, 146–159. [Google Scholar] [CrossRef] [Green Version]
  63. Smith, H.L.; McAusland, L.; Murchie, E.H. Don’t ignore the green light: Exploring diverse roles in plant processes. J. Exp. Bot. 2017, 68, 2099–2110. [Google Scholar] [CrossRef]
Figure 1. Examples of RGB image and pseudocolor RI image after excluding background. (a) RGB image of pea plants; (b) pseudocolor image of RI (670, 432) of pea plants; (c) RGB image of wheat plants; (d) pseudocolor image of RI (670, 432) of wheat plants. Plants cultivated in the vegetation room and measured at 90° angle to the ground plane (“View from above”) are shown.
Remotesensing 14 01731 g001
Figure 2. The influence of soil drought on relative water content (RWC) in pea (a) and wheat (b) under controlled conditions of laboratory. * p < 0.05; ** p < 0.01; *** p < 0.001.
Remotesensing 14 01731 g002
Figure 3. The influence of the soil drought on RI (613, 605) in pea and wheat plants cultivated under controlled conditions. (a) The measurement of RI (613, 605) in pea at the view from above; (b) the measurement of RI (613, 605) in pea at the side view; (c) the measurement of RI (613, 605) in wheat at the view from above; (d) the measurement of RI (613, 605) in wheat at the side view. * p < 0.05; ** p < 0.01; *** p < 0.001.
Remotesensing 14 01731 g003
Figure 4. Scatter plots between RWC and RI (613, 605) which were measured in pea plants from the view from above (n = 14) (a), in pea plants from the side view (n = 14) (b), in wheat from the view from above (n = 8) (c), and in wheat from the side view (n = 8) (d). Corresponding averaged values from Figure 2 and Figure 3 were used for the scatter plots. R and R2 are correlation and determination coefficients. Correlation coefficients were significant for all considered causes.
Remotesensing 14 01731 g004
Figure 5. The influence of the soil drought on RI (670, 432) in pea and wheat cultivated under controlled conditions. (a) The measurement of RI (670, 432) in pea from the view from above; (b) the measurement of RI (670, 432) in pea from the side view; (c) the measurement of RI (670, 432) in wheat from the view from above; (d) the measurement of RI (670, 432) in wheat from the side view. * p < 0.05; ** p < 0.01; *** p < 0.001.
Remotesensing 14 01731 g005
Figure 6. Scatter plots between RWC and RI (670, 432) which were measured in pea from the view from above (n = 14) (a), in pea from the side view (n = 14) (b), in wheat from the view from above (n = 8) (c), and in wheat from the side view (n = 8) (d). Corresponding averaged values from Figure 2 and Figure 5 were used for the scatter plots. R and R2 are correlation and determination coefficients, respectively. Correlation coefficients were significant for all considered causes.
Remotesensing 14 01731 g006
Figure 7. The influence of soil drought on relative water content (RWC) in wheat plants under open-ground conditions. * p < 0.05; ** p < 0.01; *** p < 0.001.
Remotesensing 14 01731 g007
Figure 8. The influence of soil drought on RI (613, 605) (a) and RI (670, 432) (b) in wheat under open-ground conditions. Only the side view was used for hyperspectral measurements. * p < 0.05; ** p < 0.01; *** p < 0.001.
Remotesensing 14 01731 g008
Figure 9. Scatter plots between RWC and RI (613, 605) (a) and between RWC and RI (670, 432) (b) which were measured in wheat cultivated under open-ground conditions (n = 6). Only the side view was used for hyperspectral measurements. Corresponding averaged values from Figure 7 and Figure 8 were used for the scatter plots. R and R2 are correlation and determination coefficients. Correlation coefficients were significant for all variants.
Remotesensing 14 01731 g009
Table 1. The directions of drought-induced changes in 46 normalized reflectance indices. These RIs were revealed in our previous work [38]. ↑—RI in plants under soil drought was significantly increased (p < 0.05) in comparison to control plants with irrigation; ↓—RI in plants under soil drought was significantly decreased in comparison to control plants; 0—significant changes in RI in plants under soil drought in comparison to control plants was not observed. Terms “view from above” and “side view” showed results of hyperspectral measurements at 90° and 45° angles to the ground plane, respectively. RIs which were significantly increased under the soil drought in all variants of experiments are marked by blue, while RIs which were significantly changed (with different direction of these changes) under the soil drought in all variants of experiments are marked by grey.
Reflectance IndexPea, LaboratoryWheat, LaboratoryWheat, Open Ground
View from AboveSide ViewView from AboveSide ViewSide View
RI (476, 449)00
RI (487, 420)000
RI (487, 458)000
RI (490, 420)000
RI (496, 420)000
RI (496, 478)00000
RI (496, 484)00000
RI (499, 420)000
RI (499, 449)0
RI (499, 470)00000
RI (499, 478)00000
RI (499, 484)0000
RI (505, 420)000
RI (505, 449)000
RI (505, 470)0
RI (505, 478)0
RI (508, 420)000
RI (513, 420)00000
RI (613, 605)
RI (622, 441)00
RI (628, 420)00000
RI (628, 441)00
RI (634, 420)00000
RI (634, 441)00
RI (637, 420)00000
RI (637, 441)00
RI (655, 420)00
RI (655, 441)00
RI (658, 420)00
RI (658, 441)00
RI (661, 420)00
RI (661, 441)00
RI (667, 420)00
RI (667, 441)00
RI (670, 420)00
RI (670, 432)
RI (676, 420)00
RI (679, 420)00
RI (682, 420)00
RI (688, 420)000
RI (688, 432)
RI (691, 420)00000
RI (691, 441)00
RI (697, 420)000
RI (697, 441)000
RI (700, 441)000
Publisher’s Note: MDPI stays neutral with regard to jurisdictional claims in published maps and institutional affiliations.

